novem z - psa.gov.ph
TRANSCRIPT

NOVEM

MONTHLY STATISTICAL INDICATORS NOVEM 2019
Republic of the philippines
PPHHILIPPINE STATISTICS AUTHORITY
CLAIRE DENNIS S. MAPA, Ph.D. Undersecretary
National Statistician and Civil Registrar General
PHILIPPINE STATISTICS AUTHORITY
PRESIDENT RODRIGO ROA DUTERTE
HIS EXCELLENCY
REPUBLIC OF THE PHILIPPINES
The PSA reserves its exclusive right to reproduce all its publications in whatever form. Any part of this publication should not be reproduced, recopied, lent or repackaged for other parties for any commercial purposes without written permission from the PSA. Any part of this publication may only be reproduced for internal use of the recipient/customer company. Should any portion of the data in this publication be included in a report/article, the title of the publication and the PSA as publisher should be cited as the source of the data. Any information derived from the processing of data contained in this publication will not be the responsibility of PSA.
ii

iii
FOREWORD
The Monthly Statistical Indicators (MSI) is published by the Philippine Statistics Authority (PSA). MSI provides data users with the latest available monthly statistical indicators on the country’s major economic variables. It covers two-year data series for comparison.
A special feature titled “Philippine GDP grows by 6.2 percent in Q3 2019” is presented in this issue.
Most of the statistics shown here were taken from surveys conducted by PSA and from various government agencies. Commendation, therefore, is conferred to all data sources for without their cooperation and support, the consolidation of statistics and dissemination of this publication would not have been possible.
CLAIRE DENNIS S. MAPA, Ph.D. Undersecretary
National Statistician and Civil Registrar General
Quezon City, Philippines November 2019
�

Page
Foreword iii
Table of Contents v
Special Feature: Philippine GDP grows by 6.2 percent in Q3 2019 ............................................................................................... ix
Chapter I - Prices, Inflation Rate, and Purchasing Power of the PesoTable 1.1 3Table 1.2 32Table 1.3 33Table 1.4 33Table 1.5 36Table 1.6 38Table 1.7 40
Chapter II - TradeTable 2.1 43Table 2.2 44Table 2.3 45
Chapter III - Industrial ProductionTable 3.1 51Table 3.2 55Table 3.3 57
Chapter IV - Money and BankingTable 4.1 61Table 4.2 61Table 4.3 62
TABLE OF CONTENTS
Total Value of Trade by Selected Country: 2018 and 2019 ….........................................................................Total Value of Merchandise Imports by Commodity: 2018 and 2019 ………………………………………………Total Value of Merchandise Exports by Commodity: 2018 and 2019 ………………………………………………
Consumer Price Index by Commodity and Region: 2018 and 2019 …..........................................................General Retail Price Index in NCR by Commodity: 2018 and 2019 …...........................................................
General Wholesale Price Index by Commodity and Major Group Island: 2018 and 2019 ………………………Wholesale Price Index for Construction Materials in NCR: 2018 and 2019 ………………………………………Producers Price Index for Manufacturing: Philippines, 2018 and 2019 ……………………………………………Inflation Rate and Purchasing Power of the Peso by Area: 2018 and 2019 ………………………………………
Retail Price Index for Construction Materials in NCR: 2018 and 2019 …………………………………….………
Value of Production Index of Key Manufacturing Enterprises by Industry: 2018 and 2019 ………………………Volume of Production Index of Key Manufacturing Enterprises by Industry: 2018 and 2019 ……………………Local Production of Forest and Mineral Products: 2018 and 2019…………………………………………………
Resources of the Financial System: 2018 and 2019 …………………………………………………………………Gross International Reserves of the Bangko Sentral ng Pilipinas: 2018 and 2019 ………………………………Net International Reserves: 2018 and 2019 …………………………………………………………………………
v

Table 4.4 62Table 4.5 63Table 4.6 63Table 4.7 63Table 4.8 63Table 4.9 64Table 4.10 65Table 4.11 68Table 4.12 69Table 4.13 70Table 4.14 70
Chapter V - InvestmentsTable 5.1 73Table 5.2 73Table 5.3 74
Chapter VI - Government FinanceTable 6.1 77Table 6.2 77Table 6.3 78
Chapter VII- LaborTable 7.1 83Table 7.2 85
Chapter VIII - Tourism and TransportationTable 8.1 89Table 8.2 90Table 8.3 Domestic Air Transport by Region: 2017 and 2018 …...................................................................................... 91Table 8.4 94
Guiding Rate Average: 2018 and 2019 …………………………………………………………………………………
Bank Interest Rates: 2018 and 2019 …………………………………………………………………………………Bank Lending Rates: 2018 and 2019 …………………………………………………………………………………Interbank Call Loan Rates: 2018 and 2019 …………………………………………………………………………Exchange Rates: 2018 and 2019 ………………………………………………………………………………………
Effective Exchange Rate Indices of the Peso: 2018 and 2019 ………………………………………………………
Shares and Stocks: 2018 and 2019 ……………………………………………………………………………………Volume Traded: 2018 and 2019 …..................................................................................................................Value of Shares Traded: 2018 and 2019 ………………………………………………………………………………
Light Rail Transit: Philippines, 2018 and 2019 …............................................................................................
Reserve Money: 2018 and 2019 ………………………………………………………………………………………Peso Cross Rates by Country: 2018 and 2019 ………………………………………………………………………Balance of Payment: 2018 and 2019 …………………………………………………………………………………Loans by Type of Commercial Banks: 2018 and 2019 ………………………………………………………………Broad Money Liabilities: 2018 and 2019 ………………………………………………………………………………
Sales of Motor Vehicles: 2017 and 2018 ...................................................................................................
National Government Outstanding Debt: 2018 and 2019 ……………………………………………………………National Government Debt Service: 2018 and 2019 …………………………………………………………………National Government Cash Operations: 2018 and 2019 ……………………………………………………………
Remittances of Overseas Filipino Workers by Country of Origin and Type of Worker : 2018 and 2019 …........Strike Notices and Actual Strikes: 2018 and 2019 …......................................................................................
Visitor Arrivals by Country of Residence: 2018 and 2019 …............................................................................
vi

… Data not available0 Zero- Nilp Preliminaryr RevisedN.E.C Not elsewhere classifieds SuppressedDMT Dry metric tonKg KilogramM MillionMT Metric tonPhP Philippine PesoPB Billion pesoPM Million pesoNCR National Capital RegionCAR Cordillera Administrative RegionARMM Autonomous Region in Muslim MindanaoCALABARZON Cavite, Laguna, Batangas, Rizal, QuezonMIMAROPA Occidental Mindoro, Oriental Mindoro, Marinduque, Romblon, PalawanSOCCSKSARGEN South Cotabato, Cotabato, Cotabato City, Sultan Kudarat, Sarangani, General Santos City
Standard symbols, units of measure, and acronyms used in this publication
vii

SPECIAL FEATURE
Philippine GDP grows by 6.2 percent in Q3 2019
The Gross Domestic Product (GDP) grew year-on-year by 6.2 percent in the third quarter of 2019.
Trade and Repair of Motor Vehicles, Motorcycles, Personal and Household Goods; Construction; and Financial Intermediation were the main drivers of growth for the quarter.
Among the major economic sectors, Services posted the fastest growth with 6.9 percent. Industry grew by 5.6 percent. Agriculture, Hunting, Forestry and Fishing registered a growth of 3.1 percent.
Net Primary Income from the rest of the world and Gross National Income (GNI) had corresponding growths of 2.9 percent and 5.6 percent.
With the country’s projected population reaching 108.3 million in the third quarter of 2019, per capita GDP grew by 4.5 percent. Meanwhile, per capita GNI and per capita Household Final Consumption Expenditure posted a growth of 4.0 percent and 4.3 percent, respectively.
ix

CHAPTER I Prices, Inflation Rate, and
Purchasing Power of the Peso

Prices, Inflation Rate, and Purchasing Power of the Peso
Indicator Year Average January February March April May June July August September October November December
Philippines
All items 2019 120.0 119.1 119.3 119.3 119.6 119.8 119.9 120.2 120.4 120.6 120.8 121.12018 117.3 114.1 115.0 115.5 116.1 116.1 116.8 117.4 118.4 119.5 119.8 119.6 118.9
Food and non-alcoholic beverages 2019 126.0 126.5 126.1 125.1 125.2 125.5 125.6 125.8 126.1 126.4 126.6 126.8 2018 123.6 119.8 120.4 121.0 121.5 121.4 122.3 123.4 125.4 127.6 127.7 126.8 126.0
Food 2019 126.1 126.8 126.3 125.3 125.4 125.6 125.8 125.9 126.2 126.5 126.6 126.92018 124.1 120.7 121.2 121.5 121.8 121.7 122.6 123.8 125.8 128.2 128.3 127.2 126.4
Bread and Cereals 2019 118.5 120.8 120.3 119.8 119.2 118.9 118.5 118.1 117.9 117.3 116.7 116.02018 120.2 115.7 116.9 117.7 118.4 118.6 119.2 119.9 121.8 124.8 125.0 122.9 121.4
Meat 2019 125.2 123.5 123.5 123.8 122.6 124.2 125.1 126.5 126.6 126.8 127.3 127.62018 121.3 117.6 118.6 118.9 119.1 120.1 121.1 122.2 123.5 123.8 123.9 123.6 123.6
Fish 2019 136.8 140.2 140.0 136.1 135.4 134.8 135.0 135.2 136.1 136.6 136.5 139.22018 132.1 130.1 129.9 129.9 131.1 129.4 130.1 130.2 132.4 134.7 135.4 135.8 136.0
Milk, cheese, and eggs 2019 118.5 117.0 117.3 117.5 117.7 117.8 118.0 118.3 119.1 119.7 120.1 120.52018 115.4 114.0 114.4 114.6 114.7 114.7 115.0 115.5 116.0 116.1 116.5 116.8 116.9
Oils and fats 2019 115.8 115.7 115.7 115.8 115.8 115.5 115.6 115.9 115.9 115.9 116.0 116.12018 113.1 110.7 111.1 111.6 112.0 112.1 112.3 113.1 113.8 114.5 115.1 115.4 115.6
Fruit 2019 146.3 142.0 141.8 142.9 143.9 144.5 142.9 144.5 148.4 151.1 154.0 152.92018 144.2 138.9 139.3 140.5 140.5 138.1 136.1 135.6 138.2 140.0 140.5 141.0 201.2
Vegetables 2019 150.4 149.9 145.9 141.7 145.2 150.7 151.5 151.1 151.2 154.4 157.1 156.02018 145.7 142.0 139.0 136.2 134.9 133.9 138.4 146.1 153.3 162.0 158.4 154.5 149.4
Sugar, jam, honey, chocolate, 2019 118.1 119.7 119.2 118.7 118.3 118.1 118.1 117.6 117.4 117.2 117.2 117.1 and confectionery 2018 116.5 110.3 110.4 110.8 111.4 112.1 115.6 119.3 120.9 122.2 122.5 121.7 120.8
Food products N.E.C. 2019 121.0 118.0 117.3 117.9 120.0 122.1 122.7 122.5 122.6 122.4 122.4 123.4 2018 114.7 111.5 113.2 113.9 114.0 114.3 114.4 114.8 115.0 115.1 115.4 116.9 117.7
Non-alcoholic beverages 2019 124.0 122.4 122.8 123.1 123.3 123.5 124.0 124.5 124.8 125.0 125.3 125.52018 117.6 109.4 110.9 114.4 116.9 117.5 118.3 119.1 119.8 120.4 121.1 121.7 122.1
Alcoholic beverages and tobacco 2019 210.1 198.0 201.6 203.7 204.7 205.6 206.5 207.7 210.9 219.8 224.8 228.22018 187.9 170.5 179.6 183.9 186.3 187.8 188.9 190.9 191.6 192.3 193.0 194.0 195.5
Clothing and footwear 2019 120.0 118.7 118.9 119.2 119.4 119.6 119.8 120.4 120.8 121.0 121.2 121.42018 117.2 115.8 116.1 116.3 116.6 116.8 117.0 117.4 117.5 117.8 117.9 118.3 118.5
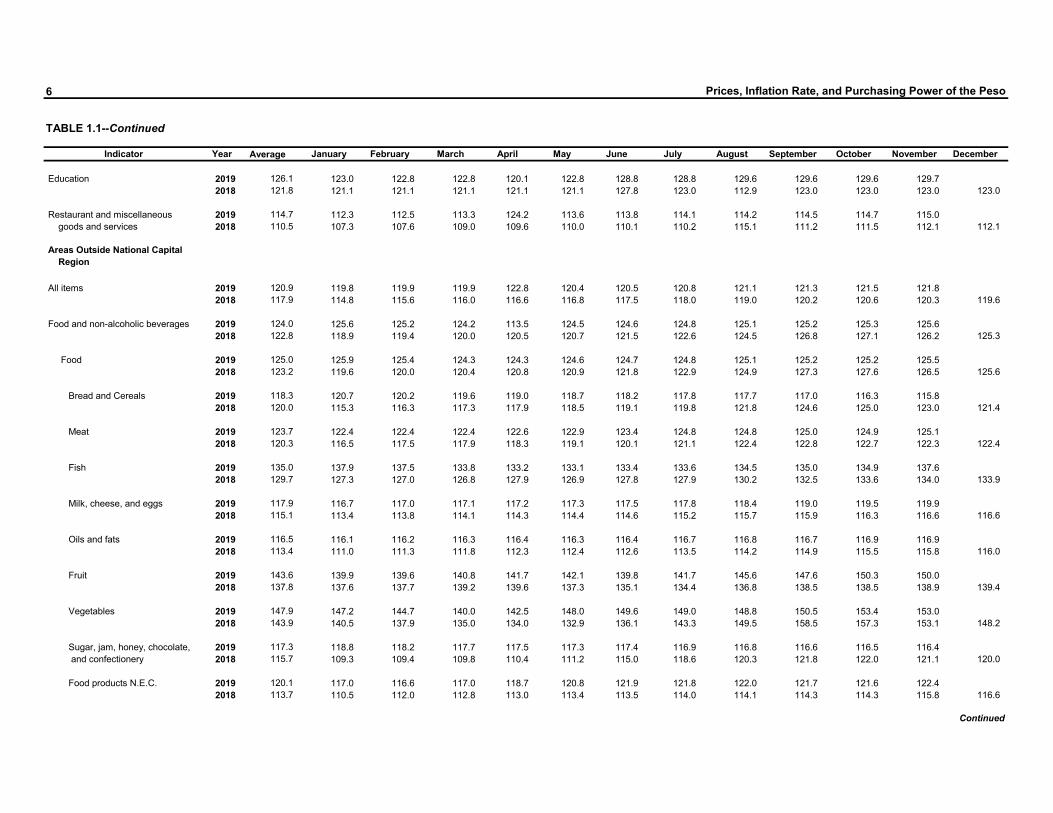
TABLE 1.1 Consumer Price Index by Commodity and Region: 2018 and 2019
3
Continued
(2012=100)

4
TABLE 1.1--Continued
Indicator Year Average January February March April May June July August September October November December
Housing, water, electricity, gas, 2019 113.2 111.9 112.7 113.3 113.7 113.6 113.5 113.7 113.4 112.8 113.0 113.5 and other fuels 2018 110.6 107.6 108.7 109.6 110.2 110.0 110.2 111.2 111.4 111.9 112.3 112.2 111.9
Furnishing, household equipment, 2019 119.8 118.5 118.8 119.1 119.2 119.4 119.5 120.0 120.3 120.6 120.7 121.2 and routine maintenance of the 2018 116.3 114.0 114.5 115.2 115.5 115.7 115.9 116.6 116.9 117.3 117.5 117.9 118.0 house
Health 2019 120.0 118.8 119.0 119.2 119.4 119.3 119.7 120.5 120.7 120.9 121.1 121.62018 116.1 113.9 114.2 114.7 115.1 115.2 115.4 116.8 117.1 117.3 117.7 118.0 118.3
Transport 2019 106.0 103.9 104.0 105.9 107.2 108.0 106.4 106.1 106.0 106.2 106.4 106.22018 104.9 101.4 102.8 102.5 103.3 104.3 104.7 105.4 106.2 107.2 108.1 108.8 104.6
Communication 2019 101.4 101.3 101.3 101.3 101.4 101.4 101.4 101.5 101.5 101.5 101.5 101.62018 101.1 100.9 100.9 101.0 101.0 101.0 101.1 101.2 101.2 101.3 101.3 101.3 101.3
Recreation and culture 2019 115.3 114.6 114.7 114.7 114.8 115.0 115.3 115.6 115.8 115.8 115.9 116.02018 112.6 111.1 111.2 111.3 111.4 111.5 111.7 112.0 113.7 114.2 114.3 114.4 114.5
` Education 2019 118.1 115.5 115.4 115.4 115.4 115.4 118.9 120.2 120.7 120.7 120.7 120.8
2018 118.1 120.0 120.5 120.0 120.0 120.0 124.5 115.3 115.4 115.4 115.4 115.5 115.5
Restaurant and miscellaneous 2019 116.9 115.6 115.8 116.1 116.3 116.5 116.8 117.3 117.5 117.7 117.8 118.2 goods and services 2018 113.2 110.8 111.3 112.0 112.4 112.8 113.1 113.5 113.9 114.3 114.5 115.1 115.2
National Capital Region
All items 2019 117.8 116.8 117.2 117.4 117.8 117.8 117.9 118.0 117.9 118.0 118.5 118.82018 115.0 111.7 112.9 113.8 114.3 113.9 114.5 115.3 116.3 117.0 117.0 117.1 116.5
Food and non-alcoholic beverages 2019 131.1 130.8 130.3 129.6 130.1 130.2 130.6 130.7 131.2 132.2 133.1 132.92018 127.7 124.4 125.6 125.7 126.2 125.0 126.0 127.5 129.6 131.6 130.8 130.0 129.6
Food 2019 131.8 131.6 131.0 130.3 130.8 130.9 131.3 131.4 131.9 133.1 134.0 133.82018 131.9 126.1 127.3 126.9 127.1 125.7 126.8 128.4 130.6 132.8 131.7 130.8 169.1
Bread and Cereals 2019 120.0 121.2 121.1 120.8 120.8 120.6 120.6 120.0 119.4 119.2 119.1 117.72018 121.4 118.2 121.3 120.4 121.7 119.1 119.5 120.4 121.9 125.9 125.2 122.2 121.2
Meat 2019 131.5 127.4 127.8 129.0 128.4 128.9 131.6 132.8 133.3 133.4 136.3 137.12018 125.4 121.8 122.9 122.7 122.1 123.7 124.7 126.3 127.7 127.6 128.2 128.3 128.2
Fish 2019 147.1 152.8 153.9 148.6 147.3 144.3 144.0 144.0 145.0 145.6 145.1 148.02018 145.3 145.2 146.0 146.8 148.5 142.9 142.4 142.5 144.1 146.4 145.5 145.6 147.4
Prices, Inflation Rate, and Purchasing Power of the Peso
Continued

Prices, Inflation Rate, and Purchasing Power of the Peso
TABLE 1.1--Continued
Indicator Year Average January February March April May June July August September October November December
Milk, cheese, and eggs 2019 120.4 118.2 118.5 119.2 119.4 119.5 119.9 120.2 121.7 122.3 122.5 122.72018 116.6 114.0 116.5 116.4 116.2 116.0 116.4 116.7 117.0 117.1 117.5 117.7 118.0
Oils and fats 2019 112.6 113.7 113.6 113.6 112.9 112.0 112.0 112.0 112.0 112.0 112.1 112.22018 111.6 109.5 110.0 110.6 110.8 110.9 111.0 111.2 111.8 112.5 113.3 113.5 113.7
Fruit 2019 157.9 151.2 151.2 151.8 153.4 155.0 156.0 156.3 160.3 165.9 169.7 165.62018 145.4 144.7 146.1 146.0 144.6 141.4 140.4 140.6 144.3 146.7 149.0 149.8 150.6
Vegetables 2019 163.4 163.8 152.1 150.3 158.8 164.3 161.3 161.8 163.6 174.1 175.7 171.52018 154.8 149.4 144.7 142.1 139.3 138.8 149.9 160.3 172.5 179.8 164.1 161.9 155.3
Sugar, jam, honey, chocolate, 2019 122.2 124.5 124.5 123.9 122.9 122.4 122.0 121.2 120.5 120.7 120.8 120.7 and confectionery 2018 120.6 115.7 116.0 116.2 116.5 117.0 118.9 122.9 124.0 124.6 125.0 125.1 124.9
Food products N.E.C. 2019 125.1 122.6 120.8 122.2 126.0 128.0 126.5 125.6 125.2 125.5 125.9 128.2 2018 119.4 116.2 119.1 119.0 118.7 118.7 118.6 118.6 119.4 119.1 120.4 122.3 122.8
Non-alcoholic beverages 2019 124.1 123.5 123.5 123.7 123.8 124.0 124.2 124.4 124.5 124.5 124.6 124.82018 118.4 109.3 110.4 114.7 117.8 118.7 119.2 119.8 120.8 121.1 122.2 122.9 123.3
Alcoholic beverages and tobacco 2019 189.5 182.7 184.5 185.3 185.4 186.0 186.4 186.6 188.9 194.4 200.2 203.62018 179.0 164.9 173.7 177.5 179.6 180.5 180.8 181.2 181.4 181.6 182.0 182.1 182.2
Clothing and footwear 2019 120.6 120.2 120.3 120.3 120.3 120.4 120.4 120.7 120.8 120.8 121.0 121.02018 118.5 117.3 117.3 117.6 118.3 118.4 118.5 118.8 118.8 118.8 118.9 119.7 120.0
Housing, water, electricity, gas, 2019 107.7 106.5 108.0 108.5 109.0 108.7 108.2 108.1 107.3 106.3 106.5 107.5 and other fuels 2018 105.7 101.7 103.8 105.8 106.3 105.4 105.5 106.3 106.5 106.3 106.7 106.8 106.8
Furnishing, household equipment 2019 117.5 117.0 117.1 117.2 117.3 117.3 117.4 117.6 117.7 117.7 117.7 118.1 and routine maintenance of the 2018 115.5 113.2 113.5 114.7 115.3 115.5 115.8 116.0 116.2 116.2 116.2 116.8 116.9 house
Health 2019 121.7 121.1 121.1 121.2 121.2 121.2 121.3 122.1 122.2 122.2 122.3 122.32018 117.8 115.1 115.2 115.7 115.8 115.9 116.1 119.7 119.7 119.7 119.9 120.2 120.3
Transport 2019 106.9 105.6 106.1 107.7 108.3 108.6 106.9 106.6 106.3 106.4 106.5 106.52018 105.1 100.9 101.7 101.3 102.0 103.0 103.1 105.2 107.8 108.8 109.6 111.4 106.2
Communication 2019 101.5 101.4 101.4 101.4 101.4 101.4 101.5 101.6 101.6 101.6 101.6 101.52018 101.2 100.8 100.9 101.0 101.1 101.1 101.2 101.3 101.3 101.4 101.4 101.4 101.4
Recreation and culture 2019 113.5 112.3 113.2 113.4 113.5 113.6 113.5 113.7 113.8 113.7 113.8 113.92018 111.7 110.3 110.4 110.6 111.0 111.0 111.1 111.2 112.6 112.8 112.9 113.0 113.0
5
Continued
6
TABLE 1.1--Continued
Indicator Year Average January February March April May June July August September October November December
Education 2019 126.1 123.0 122.8 122.8 120.1 122.8 128.8 128.8 129.6 129.6 129.6 129.72018 121.8 121.1 121.1 121.1 121.1 121.1 127.8 123.0 112.9 123.0 123.0 123.0 123.0
Restaurant and miscellaneous 2019 114.7 112.3 112.5 113.3 124.2 113.6 113.8 114.1 114.2 114.5 114.7 115.0 goods and services 2018 110.5 107.3 107.6 109.0 109.6 110.0 110.1 110.2 115.1 111.2 111.5 112.1 112.1
Areas Outside National Capital Region
All items 2019 120.9 119.8 119.9 119.9 122.8 120.4 120.5 120.8 121.1 121.3 121.5 121.82018 117.9 114.8 115.6 116.0 116.6 116.8 117.5 118.0 119.0 120.2 120.6 120.3 119.6
Food and non-alcoholic beverages 2019 124.0 125.6 125.2 124.2 113.5 124.5 124.6 124.8 125.1 125.2 125.3 125.62018 122.8 118.9 119.4 120.0 120.5 120.7 121.5 122.6 124.5 126.8 127.1 126.2 125.3
Food 2019 125.0 125.9 125.4 124.3 124.3 124.6 124.7 124.8 125.1 125.2 125.2 125.52018 123.2 119.6 120.0 120.4 120.8 120.9 121.8 122.9 124.9 127.3 127.6 126.5 125.6
Bread and Cereals 2019 118.3 120.7 120.2 119.6 119.0 118.7 118.2 117.8 117.7 117.0 116.3 115.82018 120.0 115.3 116.3 117.3 117.9 118.5 119.1 119.8 121.8 124.6 125.0 123.0 121.4
Meat 2019 123.7 122.4 122.4 122.4 122.6 122.9 123.4 124.8 124.8 125.0 124.9 125.12018 120.3 116.5 117.5 117.9 118.3 119.1 120.1 121.1 122.4 122.8 122.7 122.3 122.4
Fish 2019 135.0 137.9 137.5 133.8 133.2 133.1 133.4 133.6 134.5 135.0 134.9 137.62018 129.7 127.3 127.0 126.8 127.9 126.9 127.8 127.9 130.2 132.5 133.6 134.0 133.9
Milk, cheese, and eggs 2019 117.9 116.7 117.0 117.1 117.2 117.3 117.5 117.8 118.4 119.0 119.5 119.92018 115.1 113.4 113.8 114.1 114.3 114.4 114.6 115.2 115.7 115.9 116.3 116.6 116.6
Oils and fats 2019 116.5 116.1 116.2 116.3 116.4 116.3 116.4 116.7 116.8 116.7 116.9 116.92018 113.4 111.0 111.3 111.8 112.3 112.4 112.6 113.5 114.2 114.9 115.5 115.8 116.0
Fruit 2019 143.6 139.9 139.6 140.8 141.7 142.1 139.8 141.7 145.6 147.6 150.3 150.02018 137.8 137.6 137.7 139.2 139.6 137.3 135.1 134.4 136.8 138.5 138.5 138.9 139.4
Vegetables 2019 147.9 147.2 144.7 140.0 142.5 148.0 149.6 149.0 148.8 150.5 153.4 153.02018 143.9 140.5 137.9 135.0 134.0 132.9 136.1 143.3 149.5 158.5 157.3 153.1 148.2
Sugar, jam, honey, chocolate, 2019 117.3 118.8 118.2 117.7 117.5 117.3 117.4 116.9 116.8 116.6 116.5 116.4 and confectionery 2018 115.7 109.3 109.4 109.8 110.4 111.2 115.0 118.6 120.3 121.8 122.0 121.1 120.0
Food products N.E.C. 2019 120.1 117.0 116.6 117.0 118.7 120.8 121.9 121.8 122.0 121.7 121.6 122.4 2018 113.7 110.5 112.0 112.8 113.0 113.4 113.5 114.0 114.1 114.3 114.3 115.8 116.6
Prices, Inflation Rate, and Purchasing Power of the Peso
Continued

Prices, Inflation Rate, and Purchasing Power of the Peso
TABLE 1.1--Continued
Indicator Year Average January February March April May June July August September October November December
Non-alcoholic beverages 2019 124.0 122.1 122.6 122.9 123.2 123.4 123.9 124.5 124.9 125.1 125.5 125.72018 117.4 109.4 111.1 114.3 116.6 117.2 118.0 118.9 119.5 120.2 120.8 121.4 121.7
Alcoholic beverages and tobacco 2019 214.4 201.1 205.1 207.5 208.6 209.6 210.6 212.0 215.4 225.0 229.9 233.22018 189.7 171.6 180.8 185.2 187.7 189.3 190.6 192.9 193.7 194.5 195.2 196.5 198.2
Clothing and footwear 2019 119.9 118.3 118.6 118.9 119.2 119.4 119.7 120.3 120.8 121.1 121.3 121.52018 116.8 115.4 115.8 116.0 116.2 116.4 116.6 117.0 117.2 117.6 117.7 117.9 118.1
Housing, water, electricity, gas, 2019 115.5 114.1 114.7 115.3 115.6 115.7 115.7 116.1 116.0 115.5 115.7 116.0 and other fuels 2018 112.6 110.0 110.7 111.2 111.8 111.9 112.2 113.2 113.5 114.2 114.6 114.4 114.0
Furnishing, household equipment, 2019 120.5 119.0 119.3 119.7 119.8 120.0 120.2 120.8 121.1 121.5 121.7 122.2 and routine maintenance of the 2018 116.5 114.2 114.8 115.4 115.6 115.8 115.9 116.8 117.1 117.6 117.9 118.3 118.4 house
Health 2019 119.6 118.3 118.5 118.8 119.0 118.9 119.3 120.1 120.4 120.6 120.8 121.42018 115.8 113.6 114.0 114.5 114.9 115.1 115.3 116.2 116.5 116.8 117.2 117.5 117.9
Transport 2019 105.8 103.4 103.4 105.3 106.9 107.8 106.3 106.0 105.9 106.2 106.4 106.12018 104.9 101.6 103.1 102.8 103.7 104.7 105.2 105.4 105.7 106.7 107.7 108.0 104.1
Communication 2019 101.4 101.3 101.3 101.3 101.4 101.4 101.4 101.5 101.5 101.5 101.5 101.62018 101.1 100.9 100.9 101.0 101.0 101.0 101.0 101.1 101.2 101.2 101.3 101.3 101.3
Recreation and culture 2019 115.8 115.0 115.1 115.1 115.2 115.4 115.8 116.2 116.4 116.5 116.6 116.72018 112.9 111.3 111.4 111.5 111.5 111.6 111.9 112.2 114.1 114.6 114.7 114.8 114.9
Education 2019 115.4 113.0 113.0 113.0 113.0 113.0 115.6 117.3 117.8 117.8 117.8 117.82018 116.7 119.7 120.3 119.7 119.7 119.7 123.4 112.8 112.9 112.9 112.9 113.0 113.0
Restaurant and miscellaneous 2019 118.1 116.9 117.1 117.2 117.4 117.6 117.9 118.5 118.8 118.9 119.0 119.4 goods and services 2018 114.5 112.1 112.8 113.2 113.5 113.9 114.3 114.8 115.1 115.5 115.7 116.2 116.4
Cordillera Administrative Region
All items 2019 118.4 117.2 117.2 117.4 117.7 117.9 117.8 118.5 119.0 119.4 119.9 120.02018 116.0 113.7 114.3 114.5 114.7 115.2 115.8 116.1 116.7 117.9 118.5 118.0 117.1
Food and non-alcoholic beverages 2019 118.0 117.6 117.1 117.3 117.4 117.8 118.0 117.8 118.0 118.5 119.4 119.52018 117.4 114.8 115.5 115.7 115.9 116.6 117.1 117.2 118.0 120.3 120.9 119.4 117.9
Food 2019 118.1 117.7 117.2 117.3 117.4 117.9 118.0 117.8 118.0 118.6 119.5 119.62018 117.5 114.8 115.5 115.8 115.9 116.6 117.0 117.2 118.1 120.6 121.2 119.6 118.0
Bread and Cereals 2019 113.0 114.7 114.4 114.3 113.4 113.3 113.3 112.9 112.2 111.7 111.4 111.32018 116.6 113.8 115.4 116.2 117.0 117.8 117.6 116.5 116.1 118.2 118.7 115.9 115.4
Continued
7

8
TABLE 1.1--Continued
Indicator Year Average January February March April May June July August September October November December
Meat 2019 121.0 119.1 117.8 119.0 119.6 120.9 121.7 122.2 122.9 121.9 122.2 123.42018 117.4 114.7 114.8 114.6 114.8 119.1 117.3 117.6 118.6 118.4 119.7 119.8 119.0
Fish 2019 125.3 122.2 123.8 124.4 124.4 125.0 125.7 125.4 125.3 125.7 128.0 128.62018 116.7 114.9 114.7 115.3 112.7 113.5 113.6 115.9 117.5 119.2 119.8 121.0 121.7
Milk, cheese, and eggs 2019 117.0 116.2 116.4 116.5 116.4 116.7 116.7 116.6 116.8 117.3 118.5 118.92018 114.6 112.2 112.9 113.1 114.2 114.1 114.3 115.1 114.9 115.4 115.7 116.5 116.3
Oils and fats 2019 117.8 115.5 115.9 116.1 116.4 117.1 117.9 118.2 119.2 119.5 119.8 119.82018 112.8 111.2 111.9 111.6 111.7 111.9 112.2 113.0 113.1 113.1 114.0 114.8 115.3
Fruit 2019 135.0 133.2 133.9 134.4 135.6 134.7 127.9 132.2 136.2 138.1 138.1 141.12018 132.9 130.7 132.9 134.0 135.0 133.3 132.5 130.0 131.4 133.1 134.7 135.1 132.2
Vegetables 2019 121.1 119.7 116.1 114.6 116.9 118.3 120.1 117.9 118.8 126.7 133.3 130.02018 124.5 119.3 117.9 116.7 115.5 116.7 119.1 121.7 127.7 142.4 141.9 133.8 121.4
Sugar, jam, honey, chocolate, 2019 111.6 112.7 111.3 111.5 112.3 112.3 112.0 111.8 111.4 111.3 110.8 110.7 and confectionery 2018 110.3 107.1 107.6 107.4 107.9 107.8 110.7 111.0 112.4 112.1 112.4 113.7 113.0
Food products N.E.C. 2019 110.7 109.1 109.0 109.4 110.5 111.2 111.5 111.2 111.2 111.3 111.8 111.92018 108.0 106.6 107.7 108.6 108.5 108.6 108.5 107.8 107.4 107.9 107.6 108.2 108.6
Non-alcoholic beverages 2019 117.3 116.9 117.0 117.0 117.0 117.0 117.2 117.5 117.5 117.7 117.7 117.82018 116.3 114.5 115.5 115.2 116.3 116.8 117.2 117.3 116.8 115.8 116.5 116.7 116.8
Alcoholic beverages and tobacco 2019 219.3 211.3 214.2 215.0 216.9 217.8 219.5 220.9 221.6 223.6 225.4 226.42018 195.9 175.4 183.0 184.5 185.4 190.0 194.5 200.4 204.3 207.3 207.8 209.0 209.6
Clothing and footwear 2019 123.2 121.2 121.4 121.8 122.1 122.3 122.8 123.6 124.2 124.7 125.4 126.02018 118.5 116.5 116.8 117.4 117.5 117.7 117.8 118.8 118.9 119.3 119.6 120.7 120.7
Housing, water, electricity, gas, 2019 117.4 115.5 116.0 116.1 116.9 116.5 115.6 118.5 118.7 119.2 119.4 119.4 and other fuels 2018 114.2 112.9 112.8 113.1 113.3 113.4 113.7 114.4 115.0 115.4 116.1 115.6 115.1
Furnishing, household equipment, 2019 113.5 113.0 113.1 113.1 113.1 113.1 113.2 113.7 113.9 114.0 114.0 114.0 and routine maintenance of the 2018 112.0 110.8 111.2 111.2 111.4 112.2 112.4 112.2 112.1 112.1 112.3 112.7 112.9 house
Health 2019 120.7 120.0 120.3 120.1 120.3 120.2 120.4 120.7 121.0 121.2 121.7 122.32018 114.1 110.0 110.2 110.8 111.6 111.6 112.0 115.5 115.5 116.3 117.4 118.9 119.2
Transport 2019 106.1 104.6 105.5 106.7 106.9 107.6 106.1 106.1 105.8 105.8 106.0 105.52018 105.1 102.2 103.5 103.5 103.9 104.8 105.5 105.2 105.7 106.3 107.5 107.7 105.1
Communication 2019 101.4 101.4 101.4 101.4 101.4 101.4 101.5 101.3 101.3 101.3 101.3 101.42018 101.3 101.1 101.3 101.3 101.3 101.3 101.3 101.3 101.3 101.3 101.3 101.4 101.4
Prices, Inflation Rate, and Purchasing Power of the Peso
Continued

Prices, Inflation Rate, and Purchasing Power of the Peso
TABLE 1.1--Continued
Indicator Year Average January February March April May June July August September October November December
Recreation and culture 2019 108.6 107.6 107.7 107.9 108.0 108.1 108.6 108.9 109.0 109.3 109.4 109.82018 104.7 103.2 103.3 103.3 103.3 103.3 103.7 104.1 105.5 105.6 106.2 106.9 107.4
Education 2019 124.1 121.8 121.8 121.8 121.8 121.8 122.1 122.4 128.0 128.0 128.0 128.02018 122.9 123.4 123.4 123.4 123.4 123.4 127.5 121.8 121.8 121.8 121.8 121.8 121.8
Restaurant and miscellaneous 2019 117.5 115.9 116.1 116.3 116.4 116.8 117.7 118.0 118.3 118.7 118.8 120.0 goods and services 2018 113.7 112.1 112.5 112.6 112.7 112.8 112.9 113.8 114.1 114.6 114.9 115.4 115.6
I - Ilocos Region
All items 2019 118.9 118.1 118.3 118.2 118.2 118.7 118.7 119.0 119.3 119.5 119.7 119.92018 116.1 112.5 113.1 113.7 114.1 114.5 115.7 115.8 117.2 119.7 119.9 119.3 118.2
Food and non-alcoholic beverages 2019 125.9 126.1 125.7 124.9 124.6 125.1 125.2 125.6 126.3 126.5 126.7 127.92018 122.5 116.6 116.8 117.4 118.0 118.5 120.1 121.4 124.6 129.9 130.0 129.1 127.5
Food 2019 126.5 126.8 126.4 125.5 125.1 125.7 125.7 126.1 126.9 127.1 127.2 128.52018 123.1 117.3 117.3 117.8 118.4 119.0 120.5 121.9 125.2 130.8 130.9 129.9 128.3
Bread and Cereals 2019 123.3 125.8 124.8 124.4 123.8 123.3 123.4 123.0 122.8 121.8 121.4 121.42018 122.9 115.4 117.6 118.6 119.2 119.7 120.4 121.6 124.6 130.0 130.7 129.0 127.7
Meat 2019 120.6 118.7 118.7 119.5 119.5 120.7 120.3 121.2 122.0 121.6 121.5 123.02018 117.5 114.3 114.2 114.4 114.4 115.1 117.3 118.2 121.3 120.6 120.2 120.6 119.7
Fish 2019 134.6 130.0 132.2 132.8 133.4 134.0 132.8 134.1 135.3 137.3 136.9 141.72018 131.6 124.1 121.7 122.0 123.0 123.2 126.0 126.3 128.6 130.1 131.2 132.8 190.4
Milk, cheese, and eggs 2019 116.1 115.2 115.5 115.4 115.8 116.0 116.0 116.3 116.5 116.5 116.7 117.32018 114.7 113.5 114.1 114.3 114.4 114.5 114.6 115.0 115.4 115.2 115.2 115.2 115.2
Oils and fats 2019 100.3 99.6 99.6 100.0 100.1 100.1 100.1 100.3 100.9 100.9 100.9 100.92018 98.9 97.3 98.2 98.4 98.9 98.9 98.6 99.0 99.6 99.6 99.6 99.6 99.6
Fruit 2019 154.2 149.4 150.2 151.1 151.9 152.4 147.7 153.5 155.6 161.6 162.5 160.52018 145.2 140.2 136.9 141.7 144.6 143.7 144.1 142.5 145.7 150.1 153.6 151.1 148.7
Vegetables 2019 153.8 162.0 157.7 145.0 141.3 146.1 151.0 150.6 154.9 156.8 161.2 164.82018 145.4 129.4 122.8 120.4 121.6 122.9 127.6 136.6 149.1 187.4 183.2 176.9 166.6
Sugar, jam, honey, chocolate, 2019 115.7 115.4 115.3 115.3 115.3 115.5 115.5 115.8 115.9 115.9 116.1 116.2 and confectionery 2018 106.8 98.7 98.9 98.9 100.5 103.4 104.7 105.8 108.9 115.4 115.7 115.4 115.4
Food products N.E.C. 2019 113.0 112.5 111.9 112.0 112.1 112.2 112.5 112.7 113.8 113.8 114.6 114.62018 111.6 109.0 110.3 111.1 111.0 112.0 112.6 111.2 111.6 112.3 112.5 112.5 112.5
Non-alcoholic beverages 2019 118.3 117.6 117.6 117.9 117.9 118.5 118.5 118.5 118.8 118.8 118.8 118.92018 114.2 107.4 110.5 111.7 112.3 112.5 114.8 114.8 116.2 117.4 117.6 117.6 117.6
9
Continued

10
TABLE 1.1--Continued
Indicator Year Average January February March April May June July August September October November December
Alcoholic beverages and tobacco 2019 184.2 181.3 181.6 182.6 182.6 183.2 183.5 184.2 186.2 186.3 186.8 187.92018 175.3 156.9 170.1 170.7 171.0 171.1 178.3 179.7 180.5 181.2 181.3 181.3 181.3
Clothing and footwear 2019 113.8 111.8 112.8 113.1 113.1 114.0 114.0 114.3 114.7 114.8 114.8 114.82018 110.9 109.7 109.9 110.2 110.2 110.4 110.9 111.1 111.6 111.8 111.8 111.8 111.8
Housing, water, electricity, gas, 2019 112.3 110.7 111.3 111.7 112.2 112.8 113.2 112.7 112.8 112.9 113.2 112.1 and other fuels 2018 108.9 106.0 106.6 107.9 108.7 109.2 110.2 109.6 109.3 109.9 110.2 110.1 109.6
Furnishing, household equipment, 2019 123.2 122.8 122.8 122.9 122.9 123.3 123.3 123.3 123.5 123.5 123.5 123.5 and routine maintenance of the 2018 121.9 121.3 121.5 121.5 121.6 121.6 122.0 122.0 122.2 122.6 122.3 122.3 122.3 house
Health 2019 120.5 120.4 120.4 120.4 120.4 120.5 120.5 120.6 120.6 120.6 120.6 120.62018 118.4 117.9 118.0 118.0 118.1 118.1 118.3 118.5 118.7 118.7 118.7 118.7 118.7
Transport 2019 101.2 97.8 99.8 101.5 102.4 103.0 100.6 101.6 101.1 101.8 102.2 101.52018 101.5 98.3 100.2 99.9 100.5 101.5 102.1 102.0 103.3 104.3 105.4 102.5 98.4
Communication 2019 101.6 101.6 101.6 101.6 101.6 101.6 101.6 101.6 101.6 101.6 101.6 101.62018 101.5 101.4 101.4 101.4 101.4 101.5 101.5 101.6 101.6 101.6 101.6 101.6 101.6
Recreation and culture 2019 111.1 111.2 111.2 111.2 111.2 111.2 111.1 111.1 111.1 111.1 111.1 111.12018 110.1 109.1 109.2 109.2 109.2 109.2 109.5 109.6 111.2 111.2 111.2 111.2 111.2
Education 2019 106.5 103.0 103.0 103.0 103.0 103.0 107.3 109.8 109.8 109.8 109.8 109.82018 109.3 116.1 116.1 116.1 116.1 116.1 117.5 102.0 102.0 102.0 102.0 103.0 103.0
Restaurant and miscellaneous 2019 114.5 114.3 114.3 114.3 114.3 114.3 114.3 114.7 114.7 114.7 114.8 114.8 goods and services 2018 111.9 110.9 111.4 111.5 111.6 111.6 111.9 111.9 112.0 112.4 112.4 112.4 112.4
II - Cagayan Valley
All items 2019 120.9 121.2 120.2 119.5 120.2 121.0 120.8 121.2 121.1 121.7 121.6 121.82018 118.6 115.0 116.0 116.1 116.4 116.8 117.6 118.6 120.3 121.6 122.2 121.9 120.9
Food and non-alcoholic beverages 2019 122.7 125.4 122.9 120.8 121.3 122.6 122.5 123.2 122.4 123.2 122.9 122.92018 121.3 116.3 117.2 117.1 117.3 117.8 119.1 120.9 123.7 126.2 127.4 127.1 125.2
Food 2019 123.1 126.1 123.4 121.1 121.6 123.0 122.9 123.5 122.6 123.4 123.1 123.22018 122.1 117.2 118.1 118.0 118.0 118.6 120.0 121.6 124.5 127.1 128.4 128.0 125.9
Bread and Cereals 2019 117.6 124.1 121.7 119.9 118.4 117.9 117.0 116.3 115.5 114.9 113.6 114.02018 121.3 116.8 118.3 118.7 118.9 119.0 120.2 119.3 121.6 124.7 126.9 126.6 124.2
Prices, Inflation Rate, and Purchasing Power of the Peso
Continued

Prices, Inflation Rate, and Purchasing Power of the Peso
TABLE 1.1--Continued
Indicator Year Average January February March April May June July August September October November December
Meat 2019 120.8 119.9 119.7 119.5 119.6 120.5 120.7 122.2 121.7 121.6 121.0 122.82018 118.8 115.7 115.7 116.2 116.4 118.5 118.8 119.6 120.9 121.5 121.6 120.2 120.3
Fish 2019 124.7 124.8 124.1 123.5 123.7 123.3 123.9 125.2 125.7 125.7 124.9 127.42018 119.0 114.8 116.1 116.2 117.1 117.5 118.3 119.4 120.2 122.3 121.6 121.7 122.6
Milk, cheese, and eggs 2019 117.8 116.6 116.7 116.7 116.7 116.8 116.7 117.2 118.0 119.3 120.8 120.72018 114.9 111.9 113.2 113.6 114.2 114.3 114.5 116.1 116.6 115.9 116.4 116.2 116.4
Oils and fats 2019 129.0 130.1 130.1 130.5 130.6 129.1 128.8 128.8 128.7 127.5 127.6 127.62018 126.2 123.1 123.3 123.3 123.3 123.3 123.6 124.9 127.9 130.4 130.5 130.1 130.3
Fruit 2019 132.5 129.1 128.5 129.1 129.7 131.7 130.4 135.1 137.0 137.2 135.4 134.82018 115.6 111.7 114.3 114.7 114.8 113.5 110.0 111.1 113.9 115.8 116.6 123.1 127.4
Vegetables 2019 149.1 159.3 144.4 127.7 137.8 150.7 152.7 154.1 146.5 156.6 159.9 150.92018 148.4 135.7 134.3 130.1 127.3 127.6 133.8 146.8 161.4 171.2 176.7 175.5 160.8
Sugar, jam, honey, chocolate, 2019 114.4 116.7 114.9 114.3 114.3 114.1 113.5 113.9 114.1 114.3 114.2 114.4 and confectionery 2018 115.2 106.9 107.0 107.4 109.2 110.1 118.7 120.7 122.1 122.0 121.1 119.4 117.7
Food products N.E.C. 2019 120.7 117.0 116.1 116.2 117.3 121.4 121.8 122.4 122.8 122.9 124.2 125.32018 114.1 110.3 112.0 112.2 112.1 112.0 112.7 115.3 116.4 116.7 116.3 116.9 116.2
Non-alcoholic beverages 2019 117.8 115.7 116.1 116.6 117.2 117.3 117.3 118.6 119.1 119.3 119.4 118.82018 109.4 103.3 104.2 104.2 105.5 106.1 106.7 111.9 113.1 113.9 114.1 114.6 115.7
Alcoholic beverages and tobacco 2019 237.1 230.7 231.0 231.1 231.0 231.2 231.1 233.7 234.1 251.0 251.7 251.22018 214.2 189.8 205.1 209.0 211.3 211.4 212.0 219.9 220.9 221.0 221.0 221.3 227.1
Clothing and footwear 2019 123.5 121.5 122.0 122.0 122.7 122.9 123.5 124.0 124.4 124.7 125.1 125.32018 119.1 116.1 116.9 117.3 117.4 117.5 117.8 119.9 120.9 121.1 121.2 121.2 121.5
Housing, water, electricity, gas, 2019 118.3 117.5 117.7 118.6 119.4 119.4 119.0 118.2 118.1 117.5 117.4 118.0 and other fuels 2018 115.9 113.8 114.2 114.2 114.5 115.2 115.3 116.3 117.5 118.2 117.7 117.1 117.0
Furnishing, household equipment 2019 127.1 125.9 126.0 126.0 126.2 126.2 126.4 127.7 128.1 128.3 128.3 128.7 and routine maintenance of the 2018 122.1 118.3 119.1 119.1 119.4 119.7 120.0 123.1 124.5 124.7 125.7 125.8 125.8 house
Health 2019 116.2 114.5 114.7 115.1 115.2 115.4 115.4 116.8 117.3 117.8 118.1 118.32018 111.0 108.9 109.8 109.9 110.0 110.1 110.4 111.3 111.6 111.9 112.2 112.5 112.9
Transport 2019 102.6 100.4 101.2 102.9 104.1 105.0 102.9 102.4 102.5 102.6 102.6 102.12018 103.3 101.1 102.4 102.1 103.2 104.2 104.6 104.1 103.8 104.6 105.4 103.7 100.6
Communication 2019 99.4 99.4 99.4 99.4 99.4 99.4 99.4 99.4 99.4 99.4 99.4 99.62018 99.1 98.8 98.8 98.8 98.8 98.8 98.8 99.3 99.4 99.4 99.4 99.4 99.4
11
Continued

12
TABLE 1.1--Continued
Indicator Year Average January February March April May June July August September October November December
Recreation and culture 2019 123.1 121.7 121.8 121.9 122.3 122.3 123.1 123.8 123.9 123.9 124.3 124.72018 118.3 115.6 115.6 115.7 115.7 115.8 116.5 117.9 121.4 121.4 121.4 121.4 121.5
Education 2019 90.5 87.2 87.2 87.2 87.2 87.2 88.4 91.0 95.1 95.1 95.1 95.12018 103.7 111.7 111.7 111.7 111.7 111.7 111.9 85.6 85.6 85.6 85.6 87.2 144.6
Restaurant and miscellaneous 2019 117.9 115.7 115.8 115.8 116.8 117.7 118.2 118.7 119.2 119.2 119.2 120.5 goods and services 2018 103.1 111.7 111.7 111.7 111.7 111.7 111.9 85.6 85.6 85.6 85.6 87.2 137.0
III - Central Luzon
All items 2019 118.6 117.6 117.7 117.7 117.8 118.1 118.3 118.6 119.3 119.5 119.9 120.22018 115.4 113.4 113.8 113.9 114.1 114.4 115.0 114.9 116.0 117.0 117.2 117.6 117.3
Food and non-alcoholic beverages 2019 124.2 124.1 123.9 123.0 122.9 123.4 123.9 124.2 124.6 124.9 125.7 126.12018 121.2 117.9 118.0 118.3 118.5 119.0 119.6 120.5 123.0 125.2 125.1 125.1 124.6
Food 2019 124.3 124.3 124.1 123.1 123.0 123.5 124.0 124.3 124.5 124.9 125.8 126.12018 125.2 118.4 118.4 118.5 118.5 119.0 119.6 120.6 123.4 125.7 125.6 125.5 168.9
Bread and Cereals 2019 121.6 123.0 123.4 122.4 122.0 121.9 121.6 121.0 121.2 120.6 120.1 120.02018 121.2 117.1 117.4 118.0 118.4 119.7 119.8 120.6 123.1 125.4 125.9 124.9 124.4
Meat 2019 124.7 121.5 122.2 122.7 122.8 123.3 124.3 126.8 126.3 126.5 127.7 127.62018 120.4 118.0 119.7 118.5 118.5 119.5 120.3 120.6 122.3 122.5 121.7 121.4 122.3
Fish 2019 129.9 131.1 132.1 130.3 128.0 128.1 128.3 128.6 128.6 129.3 130.6 134.42018 122.2 119.6 118.7 119.3 119.9 120.1 119.8 119.8 122.3 124.9 126.1 127.7 128.4
Milk, cheese, and eggs 2019 115.1 113.3 113.6 113.9 113.8 113.8 114.0 114.3 116.1 117.0 118.2 118.62018 112.2 111.5 111.5 111.7 111.8 111.6 111.8 112.2 112.4 112.7 112.9 113.2 113.2
Oils and fats 2019 118.3 117.8 117.8 118.0 118.2 118.2 118.3 118.4 118.6 118.6 118.8 118.82018 116.5 115.7 115.8 116.0 116.0 116.1 116.2 116.2 116.6 116.7 116.9 117.8 117.9
Fruit 2019 145.7 141.4 142.1 143.2 142.7 142.0 141.7 144.0 150.3 152.0 152.0 151.72018 135.9 134.2 133.6 134.1 135.5 133.9 132.1 130.0 135.0 137.8 138.5 142.0 143.7
Vegetables 2019 137.2 141.5 133.8 126.5 129.4 134.9 139.7 137.5 135.2 139.8 146.9 144.12018 141.7 135.6 130.1 130.0 126.7 124.7 129.8 138.7 152.2 165.4 160.6 158.2 147.9
Sugar, jam, honey, chocolate, 2019 116.5 117.2 117.3 116.6 117.0 116.5 116.0 116.2 116.9 116.3 116.1 115.7 and confectionery 2018 114.2 110.5 110.6 110.5 110.7 111.0 113.9 116.3 116.4 117.1 118.0 118.2 117.7
Food products N.E.C. 2019 113.3 111.8 109.6 109.0 112.4 115.2 115.5 114.4 114.4 114.1 114.1 115.62018 108.7 106.4 108.5 109.7 109.1 109.1 108.5 108.9 107.8 107.6 107.6 110.1 111.4
Non-alcoholic beverages 2019 123.4 121.6 121.9 122.3 122.5 122.6 122.8 123.4 124.8 125.0 125.3 125.42018 117.5 111.2 112.2 115.2 118.1 118.7 119.5 118.2 118.3 118.6 118.9 120.0 120.6
Prices, Inflation Rate, and Purchasing Power of the Peso
Continued

Prices, Inflation Rate, and Purchasing Power of the Peso
TABLE 1.1--Continued
Indicator Year Average January February March April May June July August September October November December
Alcoholic beverages and tobacco 2019 207.9 193.6 194.9 198.1 199.1 200.0 200.6 201.1 214.3 224.4 224.8 236.42018 176.4 167.7 170.3 171.2 175.2 176.6 177.2 177.2 177.2 177.5 178.1 181.5 186.5
Clothing and footwear 2019 125.9 124.4 124.4 124.5 125.1 125.2 125.3 126.1 127.1 127.5 127.6 127.72018 123.1 122.8 122.8 122.9 122.9 123.0 123.1 123.1 123.1 123.1 123.3 123.6 123.8
Housing, water, electricity, gas, 2019 110.1 109.0 109.2 109.9 109.9 110.2 110.0 110.2 111.0 110.5 110.6 110.4 and other fuels 2018 106.5 105.4 105.4 105.8 105.7 105.8 106.1 106.5 106.6 107.0 107.4 107.9 107.9
Furnishing, household equipment, 2019 113.3 112.4 112.4 112.5 112.6 112.7 112.8 113.5 114.3 114.4 114.5 114.7 and routine maintenance of the 2018 110.7 110.1 110.2 110.4 110.4 110.6 110.6 110.6 110.6 110.6 110.8 111.5 111.9 house
Health 2019 119.8 119.0 119.1 119.2 119.2 119.2 119.3 119.9 120.6 120.7 120.7 120.72018 116.4 115.4 115.4 115.5 115.6 115.7 115.7 116.8 116.8 117.0 117.1 117.6 118.1
Transport 2019 106.3 104.2 104.9 106.7 107.6 108.5 106.5 106.3 106.2 106.3 106.4 106.02018 104.8 101.8 103.5 102.9 103.9 104.8 105.1 104.5 104.7 106.1 107.0 108.9 104.1
Communication 2019 101.2 101.2 101.2 101.2 101.2 101.2 101.2 101.2 101.2 101.2 101.3 101.32018 101.1 101.0 101.0 101.0 101.1 101.1 101.1 101.3 101.1 101.1 101.2 101.1 101.2
Recreation and culture 2019 121.3 120.8 120.8 120.8 120.8 120.8 121.3 121.7 121.9 121.9 121.9 122.02018 118.6 117.5 117.5 117.5 117.6 117.6 117.7 117.9 117.9 120.3 120.3 120.4 120.7
Education 2019 119.9 117.4 117.4 117.4 117.4 117.4 120.8 122.2 122.2 122.2 122.2 122.22018 122.0 125.0 128.8 125.0 125.0 125.0 130.9 117.4 117.4 117.4 117.4 117.4 117.4
Restaurant and miscellaneous 2019 114.3 113.7 113.7 113.8 113.9 113.9 114.0 114.3 114.8 115.0 115.0 115.1 goods and services 2018 111.9 111.4 111.7 111.9 111.7 111.8 111.8 111.8 111.9 111.9 112.0 112.5 112.7
IV - A CALABARZON
All items 2019 118.1 116.8 117.4 117.4 117.7 117.8 117.6 118.6 118.5 118.6 119.2 119.42018 115.3 112.0 113.1 113.7 114.2 114.2 114.7 116.0 116.5 117.4 117.6 117.7 116.8
Food and non-alcoholic beverages 2019 123.0 123.1 123.0 122.0 122.2 122.5 122.2 123.0 123.1 123.5 124.4 124.12018 120.5 116.8 117.4 117.9 118.4 118.2 118.8 121.0 122.2 124.2 124.3 123.7 122.7
Food 2019 123.0 123.3 123.1 122.0 122.2 122.5 122.2 123.0 123.0 123.5 124.4 124.12018 120.7 117.7 118.0 118.1 118.5 118.2 118.9 121.1 122.4 124.6 124.6 123.9 122.9
Bread and Cereals 2019 118.2 119.5 119.0 118.7 118.5 118.4 118.1 118.1 118.0 117.8 117.3 116.62018 118.3 115.1 115.8 116.3 116.6 117.1 117.6 118.2 119.1 121.3 122.2 120.7 119.6
Meat 2019 121.4 119.9 120.0 119.8 120.2 120.2 120.6 123.3 123.1 123.7 122.6 122.22018 118.1 115.4 115.9 116.0 116.2 116.7 117.9 119.0 120.1 120.4 120.3 119.7 119.4
13
Continued

14
TABLE 1.1--Continued
Indicator Year Average January February March April May June July August September October November December
Fish 2019 131.2 133.3 136.2 131.9 131.2 130.0 129.3 129.6 128.5 128.9 131.4 133.22018 126.3 123.6 124.6 124.2 124.9 123.6 123.7 124.9 125.2 129.1 129.3 131.9 130.5
Milk, cheese, and eggs 2019 117.1 115.7 115.8 116.0 116.3 116.4 116.6 117.4 117.7 118.3 118.6 119.02018 114.1 112.5 112.9 113.0 113.1 113.4 113.4 114.2 115.0 115.0 115.6 115.8 115.8
Oils and fats 2019 113.3 113.8 113.5 113.4 112.9 112.9 113.0 113.3 113.3 113.0 113.4 113.52018 111.0 107.5 107.9 108.6 109.5 109.5 109.6 111.6 112.8 113.3 113.7 113.7 113.9
Fruit 2019 143.6 140.9 137.8 140.7 140.8 140.2 135.9 140.6 147.4 149.8 153.6 152.22018 137.2 136.1 135.9 137.0 137.1 133.5 131.2 134.5 137.4 139.7 142.3 140.9 141.0
Vegetables 2019 143.0 144.3 138.5 132.6 135.6 143.6 142.4 141.6 140.9 145.2 156.5 151.62018 142.1 135.6 131.6 129.4 130.5 126.3 129.9 148.4 154.7 164.0 158.7 151.0 144.7
Sugar, jam, honey, chocolate, 2019 117.0 118.1 118.2 117.8 118.4 117.8 117.5 116.2 116.1 115.7 115.7 116.0 and confectionery 2018 115.6 108.4 108.7 108.9 109.5 110.6 114.4 119.4 121.8 122.4 122.2 121.6 119.8
Food products N.E.C. 2019 115.1 113.0 112.9 112.4 114.3 115.9 115.6 115.8 116.4 116.1 116.8 117.32018 110.2 107.6 110.0 110.2 110.1 109.8 109.7 109.7 110.1 110.2 109.6 112.1 113.3
Non-alcoholic beverages 2019 122.8 121.2 121.9 121.9 122.2 122.5 122.6 123.4 123.5 123.6 123.9 124.12018 117.3 106.5 109.6 115.3 117.4 118.3 118.6 119.7 119.7 120.4 120.6 120.9 120.8
Alcoholic beverages and tobacco 2019 250.8 226.5 238.8 243.2 244.8 245.3 245.7 248.4 248.5 265.4 275.6 276.52018 216.1 193.0 207.2 211.9 215.1 216.7 217.9 221.5 221.5 221.9 222.0 222.0 222.1
Clothing and footwear 2018 121.8 119.7 120.0 120.4 120.8 121.1 121.3 122.4 122.8 123.3 123.6 123.92018 118.8 117.1 117.8 118.3 118.3 118.7 118.9 119.1 119.1 119.3 119.4 119.5 119.6
Housing, water, electricity, gas, 2019 107.3 105.8 107.0 107.6 107.8 107.6 107.0 108.6 107.7 106.5 106.9 107.5 and other fuels 2018 105.7 102.5 103.9 105.2 105.9 105.0 105.1 106.7 106.6 106.7 107.0 106.8 106.4
Furnishing, household equipment, 2019 117.0 115.2 115.8 116.8 116.9 116.9 117.1 117.3 117.4 117.5 118.1 118.4 and routine maintenance of the 2018 113.6 111.8 112.1 112.3 112.4 112.6 112.7 114.4 114.6 114.8 115.0 115.3 115.1 house
Health 2019 117.8 116.0 116.4 117.2 117.2 116.8 117.0 118.7 118.9 119.0 119.1 119.82018 114.4 112.5 112.8 113.5 113.8 114.1 114.3 114.6 114.7 115.2 115.3 115.9 116.0
Transport 2019 104.5 102.8 104.0 105.3 105.6 105.8 104.3 104.5 104.4 104.4 104.7 104.12018 104.4 100.4 101.9 101.4 102.2 103.0 103.4 106.1 106.3 107.2 107.9 109.8 103.4
Communication 2019 100.2 100.1 100.1 100.1 100.1 100.1 100.1 100.3 100.3 100.3 100.3 100.62018 100.0 99.9 99.9 100.0 100.0 100.0 100.0 100.0 100.0 100.0 100.0 100.1 100.1
Recreation and culture 2019 117.7 116.9 117.0 117.1 117.2 117.4 117.7 118.1 118.3 118.4 118.5 118.62018 114.9 113.5 113.7 113.6 113.5 113.6 113.8 114.2 116.3 116.4 116.5 116.7 116.8
Prices, Inflation Rate, and Purchasing Power of the Peso
Continued

Prices, Inflation Rate, and Purchasing Power of the Peso
TABLE 1.1--Continued
Indicator Year Average January February March April May June July August September October November December
Education 2019 116.7 114.7 114.7 114.7 114.7 114.7 116.0 118.8 118.8 118.8 118.8 118.82018 115.7 116.2 116.2 116.2 116.2 116.2 118.7 114.6 114.7 114.7 114.7 114.7 114.7
Restaurant and miscellaneous 2019 122.3 121.0 121.1 121.3 121.4 121.9 122.0 123.0 123.3 123.3 123.4 123.9 goods and services 2018 118.3 114.6 116.0 116.4 117.1 118.1 118.6 118.8 119.0 119.6 119.7 120.6 120.8
MIMAROPA Region
All items 2019 122.0 121.3 121.4 121.1 121.1 121.0 121.6 121.8 122.5 123.2 123.6 123.72018 117.6 114.9 115.2 115.6 115.8 115.6 115.6 116.1 117.1 120.5 122.3 121.5 121.0
Food and non-alcoholic beverages 2019 128.8 131.2 130.5 129.6 128.4 128.1 128.3 127.7 128.0 128.4 128.7 128.42018 126.5 122.7 123.1 123.7 124.1 123.4 123.3 124.4 126.1 131.4 133.8 131.9 130.5
Food 2019 128.3 131.0 130.3 129.2 127.9 127.5 127.7 127.0 127.4 127.8 128.0 127.72018 126.6 123.2 123.7 124.1 124.3 123.5 123.3 124.4 126.0 131.4 133.8 131.8 130.2
Bread and Cereals 2019 120.7 124.3 122.7 122.7 120.6 120.5 120.3 119.8 119.7 119.5 119.4 118.12018 121.7 116.9 117.6 117.5 119.1 119.0 118.9 118.7 119.9 127.8 131.0 128.6 125.1
Meat 2019 121.7 121.3 121.6 121.9 121.4 121.6 121.4 121.6 121.9 122.0 121.7 122.22018 119.1 115.2 117.4 117.0 117.4 118.6 118.4 119.9 120.6 121.8 120.7 121.2 120.5
Fish 2019 139.2 146.7 146.7 140.9 139.0 133.8 135.0 134.3 138.3 139.2 138.3 139.52018 138.6 139.8 140.0 141.9 137.7 133.5 133.5 133.8 136.8 138.2 143.3 142.7 141.6
Milk, cheese, and eggs 2019 117.7 116.9 117.4 117.6 116.3 116.5 116.6 116.6 117.0 119.5 120.1 120.12018 114.8 113.2 114.0 114.3 113.6 113.5 113.7 113.9 115.1 116.0 116.6 116.9 116.9
Oils and fats 2019 106.9 106.9 107.3 106.9 106.8 106.4 106.8 107.0 106.8 107.0 107.7 106.72018 105.6 103.2 104.0 104.1 104.5 104.6 104.9 104.9 106.3 107.2 107.6 108.0 107.4
Fruit 2019 167.6 162.4 163.6 165.0 170.7 170.7 168.7 165.3 166.5 167.9 172.1 170.72018 145.2 139.4 141.7 144.8 142.4 143.5 139.1 144.2 144.9 146.7 148.6 148.3 159.0
Vegetables 2019 159.0 159.6 156.4 154.0 154.7 162.0 164.1 160.4 156.0 158.7 161.0 162.62018 155.2 151.8 147.2 147.2 149.4 146.1 146.6 151.8 154.1 171.8 173.7 162.7 159.6
Sugar, jam, honey, chocolate, 2019 119.2 122.3 123.9 124.0 118.8 118.7 118.7 117.9 115.8 116.9 116.9 117.1 and confectionery 2018 118.9 109.9 110.5 110.4 111.9 112.7 114.2 121.5 125.8 128.6 130.5 125.5 125.0
Food products N.E.C. 2019 124.7 123.9 124.4 124.9 123.8 125.1 125.9 125.9 126.5 124.2 123.6 123.62018 117.2 112.9 114.0 114.4 115.8 117.3 117.3 117.6 117.9 118.8 118.6 120.0 121.2
Non-alcoholic beverages 2019 137.5 134.7 135.4 136.6 136.6 137.3 137.8 139.0 138.0 138.3 139.3 139.22018 124.6 113.1 114.2 117.5 120.7 121.3 122.4 126.0 128.3 130.9 133.0 133.9 134.2
Alcoholic beverages and tobacco 2019 197.0 175.2 184.1 184.7 190.9 193.7 197.2 199.4 200.5 210.4 216.3 214.72018 153.8 136.5 142.6 147.3 148.4 149.4 151.1 154.7 156.4 161.2 163.7 165.3 169.1
15
Continued

16
TABLE 1.1--Continued
Indicator Year Average January February March April May June July August September October November December
Clothing and footwear 2019 115.7 115.3 115.3 115.3 115.3 115.3 115.5 115.4 116.3 116.3 116.4 116.42018 112.0 110.2 110.3 110.3 110.3 110.3 110.3 111.0 111.5 114.1 114.8 115.2 115.3
Housing, water, electricity, gas, 2019 114.0 111.2 111.8 112.0 112.3 112.4 112.6 114.4 115.9 116.8 117.0 117.3 and other fuels 2018 108.3 107.1 107.1 106.8 106.6 106.8 106.7 107.4 107.7 109.6 111.4 111.6 111.3
Furnishing, household equipment, 2019 114.9 113.4 113.7 113.9 114.1 114.0 114.5 114.7 115.2 115.7 117.0 117.3 and routine maintenance of the 2018 109.2 107.6 107.6 107.6 107.6 107.6 107.6 107.9 108.1 111.0 112.4 112.8 112.9 house
2019 110.9 108.5 108.3 108.0 107.6 108.1 111.4 113.2 113.3 113.3 113.6 115.1 Health 2018 107.1 106.2 106.3 106.4 106.4 106.4 106.4 106.5 106.8 107.9 108.5 108.9 108.7
Transport 2019 108.2 103.5 103.6 104.6 108.8 108.2 109.8 109.0 109.8 110.4 111.2 111.72018 103.3 101.2 101.1 101.9 102.1 103.1 103.3 103.1 103.5 104.6 105.6 105.1 105.2
Communication 2018 102.4 102.4 102.4 102.4 102.4 102.4 102.4 102.4 102.4 102.4 102.6 102.62018 101.8 101.5 101.5 101.5 101.5 101.5 101.5 101.5 102.2 102.3 102.3 102.4 102.4
Recreation and culture 2019 113.1 111.4 111.4 111.4 112.0 112.9 113.3 113.5 113.9 114.4 114.7 115.22018 108.6 107.3 107.1 107.0 107.0 106.9 107.0 107.0 109.4 110.6 110.9 111.3 111.3
Education 2019 114.5 111.7 111.7 111.7 111.7 111.7 113.3 115.3 118.0 118.0 118.0 118.02018 116.4 121.1 120.4 121.1 121.1 121.1 121.1 111.9 111.7 111.7 111.7 111.7 111.7
Restaurant and miscellaneous 2019 116.6 114.4 115.4 115.7 115.5 115.6 116.2 116.7 117.0 118.5 118.8 118.8 goods and services 2018 109.9 108.5 108.5 108.6 108.6 108.6 108.6 108.8 108.9 111.1 112.0 112.3 114.3
V - Bicol Region
All items 2019 121.1 120.3 120.6 120.3 120.6 120.9 120.9 121.0 121.2 121.4 122.1 122.62018 118.0 114.1 114.8 115.8 116.6 117.0 117.4 117.7 119.5 121.1 121.2 120.8 119.9
Food and non-alcoholic beverages 2019 125.8 127.4 127.6 125.7 125.5 125.5 125.2 125.2 125.1 125.2 125.5 126.22018 125.0 119.9 120.5 122.0 123.0 123.1 123.8 125.0 127.3 130.2 130.0 128.7 126.9
Food 2019 125.6 127.4 127.6 125.5 125.3 125.4 125.0 125.0 124.9 124.9 125.2 125.92018 125.5 120.6 121.1 122.6 123.5 123.6 124.3 125.4 127.7 130.7 130.4 128.8 126.9
Bread and Cereals 2019 118.8 121.6 121.5 121.5 119.4 118.9 118.6 118.1 117.6 117.0 116.6 116.12018 122.1 115.5 117.2 119.9 121.2 121.4 121.8 122.6 124.0 127.7 127.3 124.7 121.9
Meat 2019 122.5 123.1 121.7 121.6 121.8 122.0 122.4 122.8 123.1 123.0 123.2 122.82018 119.7 112.9 113.9 116.3 117.2 118.8 119.8 122.3 122.9 123.5 123.6 122.9 122.7
Fish 2019 131.5 134.8 137.9 131.2 131.5 130.3 129.7 130.9 129.8 128.5 128.9 132.52018 127.8 125.0 124.0 124.3 126.5 126.2 127.1 126.2 129.5 130.8 131.2 131.7 130.9
Continued
Prices, Inflation Rate, and Purchasing Power of the Peso

Prices, Inflation Rate, and Purchasing Power of the Peso
TABLE 1.1--Continued
Indicator Year Average January February March April May June July Aug September October November December
Milk, cheese, and eggs 2019 116.7 116.8 116.9 116.0 116.6 116.6 116.3 116.4 116.5 116.8 117.0 117.3 2018 114.6 112.6 113.1 114.0 114.0 113.9 114.3 114.5 114.7 115.1 115.6 116.3 116.5
Oils and fats 2019 125.2 126.4 126.7 126.5 127.0 126.3 126.0 124.5 124.3 123.5 123.5 122.5 2018 119.8 114.6 114.8 115.9 118.0 118.1 118.3 119.3 120.1 122.6 124.8 125.0 125.8
Fruit 2019 125.4 123.1 124.1 122.3 125.6 124.5 120.4 122.9 126.4 127.9 130.6 131.4 2018 125.2 124.8 123.8 125.4 125.5 124.1 122.8 124.5 128.2 129.6 125.1 124.7 123.3
Vegetables 2019 167.4 166.2 164.5 155.7 161.1 166.8 167.0 165.0 166.3 173.1 176.0 179.7 2018 165.5 161.6 160.0 157.2 156.3 153.6 157.1 161.6 171.4 184.4 181.6 174.9 166.8
Sugar, jam, honey, chocolate, 2019 119.1 127.1 124.6 121.2 119.3 117.5 117.1 117.2 117.0 116.4 116.3 116.2 and confectionery 2018 123.3 120.9 120.0 118.1 116.6 117.7 119.0 122.8 127.4 129.3 130.4 129.5 128.1
Food products N.E.C. 2019 132.4 128.5 128.2 129.3 130.5 133.6 135.9 135.2 134.6 133.0 133.6 134.4 2018 123.0 119.0 119.8 121.7 121.8 122.0 121.8 122.7 124.4 124.2 124.7 126.3 127.5
Non-alcoholic beverages 2019 129.0 126.7 127.4 128.0 127.9 129.1 129.3 129.5 129.6 130.2 130.5 130.7 2018 117.1 107.6 107.9 111.2 112.8 114.1 115.5 118.1 120.7 121.9 123.9 125.6 126.4
Alcoholic beverages and tobacco 2019 212.4 189.2 197.0 198.2 201.5 203.5 204.7 206.2 206.4 225.5 248.7 255.9 2018 171.6 157.5 161.0 166.2 169.2 170.4 171.0 171.7 173.1 173.7 176.5 183.2 185.4
Clothing and footwear 2019 122.2 119.7 120.3 120.9 121.3 122.0 122.3 122.7 123.0 123.4 124.1 124.6 2018 116.0 113.1 113.9 114.4 114.7 115.2 115.4 116.0 116.6 117.2 117.9 118.6 119.3
Housing, water, electricity, gas, 2019 112.0 109.3 109.5 111.4 111.5 112.2 112.9 113.2 113.3 112.5 112.9 113.2 and other fuels 2018 107.1 104.0 104.2 104.6 105.4 106.5 105.9 106.9 109.1 109.6 109.6 109.5 109.5
Furnishing, household equipment, 2019 129.7 127.9 128.1 128.4 128.7 129.2 129.4 130.5 130.7 130.9 131.2 131.5 and routine maintenance of the 2018 123.0 117.2 120.9 121.4 121.6 121.7 121.8 123.2 123.6 124.3 125.6 127.4 127.6 house
Health 2019 130.9 129.8 129.1 129.7 132.2 130.1 130.7 131.1 131.2 131.8 132.0 132.2 2018 125.1 119.9 121.5 122.4 123.2 123.8 124.4 125.3 126.3 126.9 128.3 129.2 129.5
Transport 2019 103.9 101.0 101.8 103.2 105.3 106.4 104.9 102.8 104.3 104.4 104.2 104.5 2018 101.9 98.9 100.6 100.0 100.7 101.5 103.1 102.4 102.6 103.5 104.4 103.4 101.1
Communication 2019 103.3 103.0 103.1 103.3 103.3 103.3 103.3 103.3 103.3 103.3 103.3 103.5 2018 102.8 102.0 102.8 102.8 102.8 102.9 102.6 102.9 102.9 102.9 103.0 103.0 103.0
Recreation and culture 2019 110.4 109.4 109.5 109.8 109.9 109.9 110.2 110.6 110.9 111.1 111.6 111.7 2018 107.6 106.0 106.4 106.6 106.7 106.9 107.1 107.5 108.2 108.3 108.8 109.0 109.4
17
Continued

18
TABLE 1.1--Continued
Indicator Year Average January February March April May June July August September October November December
Education 2019 88.4 85.0 85.0 85.0 85.0 85.0 87.5 90.7 92.2 92.2 92.2 92.2 2018 97.1 109.0 108.9 109.0 109.0 109.0 110.2 84.6 85.0 85.0 85.0 85.0 85.0
Restaurant and miscellaneous 2019 120.8 118.5 119.3 119.6 120.2 121.1 121.1 121.3 121.5 121.7 122.0 122.4 goods and services 2018 115.0 111.8 112.1 112.9 113.1 114.1 114.2 115.4 116.6 116.8 117.2 117.7 118.0
VI - Western Visayas
All items 2019 121.6 120.5 120.5 120.5 120.7 121.1 121.4 121.8 122.4 122.7 122.8 122.7 2018 118.8 115.8 116.6 116.8 117.5 117.6 118.4 118.6 120.2 121.0 121.5 121.0 120.6
Food and non-alcoholic beverages 2019 127.5 127.9 127.6 126.4 126.3 126.9 126.9 127.5 128.0 128.4 128.3 128.1 2018 124.5 120.8 121.4 121.5 122.2 121.7 122.6 123.6 127.1 128.6 129.2 128.2 127.6
Food 2019 127.8 128.5 128.1 126.7 126.7 127.3 127.1 127.7 128.2 128.6 128.3 128.1 2018 125.2 121.6 122.1 122.1 122.7 122.1 122.9 124.0 127.8 129.4 130.0 128.9 128.2
Bread and Cereals 2019 119.6 121.9 121.2 120.7 120.4 119.9 118.5 119.3 119.0 118.9 118.2 117.5 2018 119.1 112.6 113.8 115.4 116.0 116.6 117.6 118.2 123.9 125.2 125.1 123.1 121.9
Meat 2019 126.9 126.8 126.5 126.8 126.8 127.0 127.0 127.1 127.3 127.2 126.8 126.5 2018 124.8 118.6 120.8 123.4 124.2 124.4 125.2 126.2 126.9 127.1 127.2 126.8 126.8
Fish 2019 138.0 143.3 143.2 137.6 137.2 137.5 135.7 135.2 136.2 136.8 137.3 138.1 2018 136.9 136.3 136.1 133.6 135.8 131.9 133.0 133.3 137.7 140.6 141.2 141.8 141.8
Milk, cheese, and eggs 2019 117.4 115.2 115.8 116.5 116.5 116.9 117.3 117.5 118.1 118.9 119.1 119.3 2018 113.6 111.8 112.1 112.5 112.8 113.0 113.1 113.9 114.3 114.6 115.0 115.0 115.0
Oils and fats 2019 114.2 113.8 113.8 113.9 113.9 113.9 114.0 114.1 114.3 114.6 114.7 115.3 2018 112.5 111.1 111.7 111.9 111.9 111.9 112.5 112.9 113.0 113.2 113.4 113.5 113.5
Fruit 2019 156.2 151.5 151.8 151.6 152.6 155.1 153.6 156.1 158.1 160.8 163.2 164.1 2018 149.4 152.5 153.0 151.3 151.0 147.7 144.8 145.3 146.1 149.0 150.3 150.9 150.7
Vegetables 2019 157.7 148.0 146.3 143.7 144.7 152.8 161.6 164.3 167.7 169.9 168.9 167.3 2018 143.3 147.6 143.2 137.5 134.2 133.4 134.9 140.6 146.6 149.6 154.8 150.1 147.6
Sugar, jam, honey, chocolate, 2019 110.7 112.8 112.2 111.8 111.0 110.4 110.5 110.8 109.6 109.5 109.7 109.9 and confectionery 2018 109.7 103.0 103.2 103.4 103.9 104.3 108.2 112.5 115.0 116.3 116.8 115.8 114.1
Food products N.E.C. 2019 117.6 111.4 111.8 113.7 114.6 116.8 120.0 120.9 121.9 121.1 120.1 121.3 2018 108.3 105.4 106.9 106.8 106.6 107.6 108.9 109.8 109.3 108.8 109.2 109.8 110.9
Non-alcoholic beverages 2019 124.3 120.6 121.2 121.8 121.9 122.0 124.4 125.4 126.4 126.5 128.2 128.4 2018 117.2 112.3 113.5 114.6 116.6 117.3 117.7 118.0 118.0 118.6 119.4 120.0 120.4
Prices, Inflation Rate, and Purchasing Power of the Peso
Continued

Prices, Inflation Rate, and Purchasing Power of the Peso
TABLE 1.1--Continued
Indicator Year Average January February March April May June July August September October November December
Alcoholic beverages and tobacco 2019 221.7 206.6 208.4 214.1 214.2 216.1 218.3 220.5 226.0 235.3 238.5 240.2 2018 199.2 175.9 187.7 194.7 198.0 201.5 202.0 204.1 204.2 204.4 205.5 206.1 206.4
Clothing and footwear 2019 110.8 109.1 109.2 109.8 109.9 110.1 110.7 111.5 111.9 112.2 112.1 112.3 2018 108.8 108.1 108.3 108.4 108.7 108.7 108.9 109.0 109.0 109.0 109.0 109.1 109.1
Housing, water, electricity, gas, 2019 117.4 115.4 116.0 116.5 116.5 116.8 118.3 118.3 118.9 118.1 118.2 117.9 and other fuels 2018 114.9 112.8 113.2 113.3 114.1 114.8 114.6 115.5 115.7 116.5 116.4 115.9 116.0
Furnishing, household equipment, 2019 123.2 120.8 120.9 121.7 121.8 122.0 122.9 124.0 124.5 125.4 125.6 125.5 and routine maintenance of the 2018 120.0 118.0 118.9 119.5 120.0 120.1 120.3 120.4 120.4 120.4 120.5 120.6 120.6 house
Health 2019 110.0 108.4 108.6 109.0 109.0 109.2 109.5 110.5 110.9 111.4 111.7 111.8 2018 107.7 107.0 107.1 107.2 107.5 107.7 107.8 107.9 107.9 107.9 108.0 108.0 108.3
Transport 2019 106.7 104.3 102.9 106.1 109.0 109.6 107.6 106.6 106.7 107.1 107.6 106.5 2018 106.4 103.4 105.2 105.0 106.3 107.0 107.0 106.3 106.6 107.3 108.7 108.0 105.9
Communication 2019 100.6 100.5 100.5 100.5 100.5 100.6 100.7 100.7 100.7 100.7 100.8 100.8 2018 100.1 100.0 100.0 100.0 100.1 100.1 100.1 100.1 100.1 100.1 100.1 100.1 100.5
Recreation and culture 2019 110.9 110.0 110.0 110.0 110.1 110.3 111.0 111.5 111.7 111.8 111.9 112.0 2018 108.2 106.8 107.0 107.1 107.2 107.2 107.4 107.4 109.6 109.6 109.6 109.6 109.9
Education 2019 116.3 114.9 114.9 114.9 114.9 114.9 117.4 117.5 117.5 117.5 117.5 117.5 2018 116.4 115.6 115.6 115.6 115.6 115.6 129.9 114.9 114.9 114.9 114.9 114.9 114.9
Restaurant and miscellaneous 2019 111.5 110.5 111.0 111.0 111.0 111.0 111.3 111.7 111.9 112.1 112.3 112.2 goods and services 2018 109.4 107.7 108.4 108.5 109.1 109.2 109.3 109.7 109.7 109.8 110.5 110.5 110.5
VII - Central Visayas
All items 2019 123.5 122.9 122.8 122.6 122.9 123.4 123.5 123.9 124.0 124.0 123.8 124.4 2018 121.7 117.7 118.7 120.0 121.3 121.6 122.1 122.6 122.8 123.8 123.9 123.1 122.5
Food and non-alcoholic beverages 2019 129.7 130.2 130.1 129.1 128.7 129.1 129.3 129.8 130.1 130.3 129.6 130.2 2018 127.6 122.1 123.2 125.2 126.8 127.0 127.9 129.1 129.3 130.7 130.9 129.3 129.5
Food 2019 129.8 130.4 130.3 129.3 128.9 129.3 129.4 129.9 130.3 130.5 129.7 130.3 2018 128.0 123.1 124.3 125.7 127.2 127.2 128.1 129.4 129.5 131.0 131.2 129.5 129.7
Bread and Cereals 2019 115.3 117.7 117.4 117.3 116.7 115.9 115.0 114.3 114.4 114.1 113.2 112.8 2018 117.3 113.0 113.5 115.3 116.4 116.7 117.5 118.4 118.5 120.3 120.8 119.2 118.0
Meat 2019 132.6 131.6 131.7 131.4 131.7 133.1 133.1 132.8 133.2 133.1 133.0 134.3 2018 128.4 121.2 123.4 124.7 126.2 127.4 128.9 130.5 131.3 132.7 132.0 131.1 131.8
19
Continued

20
TABLE 1.1--Continued
Indicator Year Average January February March April May June July August September 175.9 November December
Fish 2019 152.9 153.8 153.1 149.1 149.6 150.1 151.6 153.5 154.4 156.4 154.3 156.0 2018 145.8 139.1 140.6 142.7 146.5 145.9 147.0 147.5 148.4 148.3 149.2 145.8 148.7
Milk, cheese, and eggs 2019 122.9 121.5 122.1 122.2 122.4 122.7 122.8 122.9 123.4 123.4 123.7 124.8 2018 119.6 117.6 117.9 118.9 118.8 119.1 119.2 119.7 120.0 120.9 120.9 121.3 121.4
Oils and fats 2019 122.1 121.0 121.0 121.0 120.8 121.0 121.0 123.4 123.4 123.4 123.7 123.7 2018 118.9 116.1 116.3 117.7 118.1 118.5 118.5 119.0 119.3 120.9 120.9 120.9 121.0
Fruit 2019 157.3 153.4 156.0 157.8 156.6 155.6 157.1 155.6 156.1 158.2 160.7 163.5 2018 155.6 152.0 155.4 165.1 168.6 161.8 152.6 153.8 153.2 149.2 150.9 151.7 152.7
Vegetables 2019 154.9 155.4 155.2 149.2 145.0 150.8 152.6 159.6 160.7 159.6 157.0 158.3 2018 154.3 153.3 155.8 148.9 147.4 146.1 152.5 157.5 155.1 162.6 160.6 155.9 156.3
Sugar, jam, honey, chocolate, 2019 118.0 115.4 114.5 116.1 116.9 118.0 118.9 119.3 119.8 120.0 120.0 119.2 and confectionery 2018 112.3 102.6 103.2 106.2 108.0 109.2 113.5 116.2 116.8 119.6 119.0 117.4 116.0
Food products N.E.C. 2019 117.4 114.9 115.3 115.8 116.5 117.5 118.8 119.5 119.2 119.1 116.7 118.5 2018 115.9 109.3 109.7 110.2 111.1 111.3 112.2 113.4 112.5 114.6 114.8 114.4 156.9
Non-alcoholic beverages 2019 127.6 127.0 127.0 127.3 127.3 127.4 127.5 127.8 127.8 127.9 127.9 128.2 2018 122.6 109.1 110.3 118.1 123.0 125.0 125.6 126.5 126.5 126.6 126.6 126.6 127.0
Alcoholic beverages and tobacco 2019 189.2 186.2 186.5 186.7 186.9 187.2 188.4 188.7 189.1 190.1 195.3 195.8 2018 180.6 159.9 167.4 178.8 180.8 183.1 183.1 184.9 184.9 185.7 186.1 186.1 186.1
Clothing and footwear 2019 121.2 121.0 121.0 121.0 121.0 121.1 121.1 121.2 121.4 121.4 121.5 121.6 2018 120.6 119.6 120.1 120.3 120.4 120.6 120.7 120.9 120.9 120.9 120.9 120.9 121.0
Housing, water, electricity, gas, 2019 124.2 123.0 123.8 124.2 124.3 124.8 124.6 124.9 124.6 123.8 124.0 124.1 and other fuels 2018 122.9 119.7 120.2 120.3 122.7 122.8 123.2 123.6 123.8 125.5 125.2 125.0 123.0
Furnishing, household equipment, 2018 128.9 127.7 127.9 127.9 127.9 128.3 128.5 128.7 128.8 129.7 129.8 132.4 and routine maintenance of the 2018 122.6 116.3 117.4 122.7 122.8 122.8 122.9 124.0 124.0 124.5 124.6 124.6 124.7 house
Health 2019 112.6 111.2 111.3 111.5 111.5 112.0 112.1 112.6 112.6 113.0 113.2 117.6 2018 109.5 107.1 107.9 108.1 108.4 108.5 109.3 110.7 110.7 110.8 110.8 110.9 111.1
Transport 2019 110.8 107.3 104.1 106.4 110.2 112.3 113.0 112.7 112.8 113.4 112.9 113.2 2018 109.9 107.0 108.7 109.1 109.8 111.5 111.5 109.7 109.8 110.5 112.1 111.2 108.0
Communication 2019 101.8 101.7 101.7 101.7 101.7 101.8 101.8 101.8 101.8 101.8 101.9 101.9 2018 101.7 101.6 101.6 101.6 101.6 101.6 101.6 101.7 101.7 101.7 101.7 101.7 101.7
Recreation and culture 2019 106.7 106.6 106.6 106.6 106.6 106.6 106.6 106.6 106.8 106.8 106.8 106.8 2018 105.0 103.2 103.2 103.7 103.9 104.2 104.2 104.3 106.6 106.6 106.6 106.6 106.6
Prices, Inflation Rate, and Purchasing Power of the Peso
Continued

Prices, Inflation Rate, and Purchasing Power of the Peso
TABLE 1.1--Continued
Indicator Year Average January February March April May June July August September October November December
Education 2019 128.9 126.8 126.8 126.8 126.8 126.8 129.5 130.8 130.8 130.8 130.8 130.8 2018 128.3 129.7 129.7 129.7 129.7 129.7 130.0 126.8 126.8 126.8 126.8 126.8 126.8
Restaurant and miscellaneous 2019 108.0 107.8 107.9 107.9 107.9 107.9 108.0 108.1 108.1 108.1 108.1 108.1 goods and services 2018 107.3 105.7 105.7 107.2 107.4 107.4 107.4 107.7 107.7 107.8 107.8 107.8 107.8
VIII - Eastern Visayas
All items 2019 124.8 124.7 124.7 124.5 124.9 124.9 125.4 124.7 124.4 124.8 124.5 125.3 2018 123.1 119.9 120.9 121.9 122.5 122.9 123.5 122.9 123.7 124.9 125.4 124.5 123.9
Food and non-alcoholic beverages 2019 126.9 128.1 127.8 127.4 127.3 127.5 127.4 126.5 126.1 125.7 125.9 126.7 2018 125.6 121.7 122.9 123.7 124.2 124.6 125.5 125.6 126.5 128.5 129.2 128.0 126.8
Food 2019 127.0 128.4 128.0 127.4 127.4 127.6 127.4 126.5 126.0 125.6 125.8 126.6 2018 126.0 122.3 123.5 124.2 124.6 125.0 125.9 126.1 126.9 128.9 129.6 128.3 127.0
Bread and Cereals 2019 122.1 124.3 124.8 124.2 123.4 122.6 122.1 121.5 121.1 120.0 119.5 119.4 2018 124.2 119.2 121.0 122.1 122.5 123.1 123.6 124.1 125.3 128.2 129.2 127.4 124.8
Meat 2019 124.4 124.7 124.2 123.4 124.3 123.7 124.3 125.0 125.3 124.5 124.1 124.8 2018 120.5 116.7 117.7 118.7 119.7 119.5 120.1 120.0 120.4 122.8 123.4 123.3 124.0
Fish 2019 139.2 141.6 139.3 137.0 137.5 141.5 140.9 137.6 136.3 138.3 139.3 142.2 2018 135.1 131.0 131.8 131.7 132.7 134.0 137.2 136.8 136.9 138.9 139.6 136.2 134.9
Milk, cheese, and eggs 2019 120.5 119.9 120.1 120.0 120.1 120.4 120.2 120.2 120.5 120.9 121.3 121.8 2018 118.4 117.6 118.0 118.2 117.8 117.8 117.8 118.1 118.5 118.2 119.3 119.4 119.6
Oils and fats 2019 113.2 112.0 112.2 112.6 113.6 113.7 113.6 113.4 113.4 113.4 113.6 114.2 2018 109.4 108.1 108.7 108.7 109.0 108.8 109.1 109.0 109.1 109.8 110.4 111.0 111.5
Fruit 2019 135.9 139.0 134.4 136.7 138.2 135.1 132.0 132.4 134.3 132.8 139.2 140.4 2018 141.2 140.9 142.1 143.4 145.6 143.3 141.2 139.4 141.8 140.1 137.9 138.6 139.6
Vegetables 2019 142.3 142.3 143.5 143.8 144.2 144.2 145.9 143.2 139.6 137.9 138.9 141.6 2018 135.7 136.5 136.2 136.1 134.7 134.0 134.4 134.5 135.5 135.6 136.8 137.3 136.9
Sugar, jam, honey, chocolate, 2019 123.1 120.4 121.3 121.3 122.6 123.9 124.0 123.6 124.1 124.0 123.8 124.7 and confectionery 2018 118.2 114.1 114.9 115.2 115.4 115.4 117.6 119.3 120.3 121.2 121.7 121.8 121.8
Food products N.E.C. 2019 127.2 124.0 124.0 124.3 125.0 126.4 128.0 129.3 129.6 129.9 129.1 129.6 2018 120.9 117.6 117.9 118.2 119.4 120.8 121.9 121.7 121.8 122.2 123.0 123.3 123.2
Non-alcoholic beverages 2019 126.2 123.9 124.9 125.4 126.3 126.4 126.9 127.0 126.9 127.0 127.0 127.0 2018 119.2 112.8 113.5 116.8 117.3 118.7 119.0 119.1 120.7 122.3 123.1 123.1 123.7
Alcoholic beverages and tobacco 2019 231.9 226.2 227.8 227.7 229.4 230.0 231.0 233.1 233.7 234.6 235.7 241.3 2018 219.3 192.6 208.7 220.2 220.4 221.6 222.0 222.1 223.8 224.7 225.2 225.3 225.1
Clothing and footwear 2019 116.8 115.2 115.9 116.0 116.1 116.1 116.9 117.2 117.3 117.7 117.9 118.4 2018 113.6 112.6 112.7 112.8 112.8 113.2 113.3 113.3 113.8 114.3 114.4 114.5 114.9
21
Continued

22
TABLE 1.1--Continued
Indicator Year Average January February March April May June July August September October November December
Housing, water, electricity, gas, 2019 124.1 125.0 125.6 124.9 124.5 123.1 125.6 122.9 122.4 124.9 122.6 123.6 and other fuels 2018 124.0 120.3 121.2 122.7 124.2 124.5 124.2 124.5 124.9 126.0 126.2 124.6 124.4
Furnishing, household equipment, 2019 123.8 120.8 121.7 122.1 122.9 123.0 123.6 124.5 124.9 125.5 125.8 126.9 and routine maintenance of the 2018 117.2 115.6 115.6 116.1 116.1 116.3 116.5 116.7 117.9 118.1 118.1 119.4 120.1 house
Health 2019 128.8 127.9 128.2 128.2 128.3 128.6 128.6 128.8 129.2 129.4 129.6 129.6 2018 124.7 123.1 123.5 123.7 124.0 124.1 124.3 124.4 125.1 125.4 125.5 126.0 127.6
Transport 2019 113.8 110.0 108.8 111.2 116.0 117.9 115.8 114.7 113.9 114.5 114.6 114.3 2018 111.0 107.4 108.4 109.0 110.0 111.3 111.7 111.0 111.5 113.2 114.6 113.2 110.8
Communication 2019 100.6 100.1 100.1 100.1 100.1 100.1 100.7 101.1 101.2 101.2 101.2 101.2 2018 99.9 99.7 99.7 99.7 99.7 99.8 99.8 99.8 100.1 100.1 100.1 100.1 100.1
Recreation and culture 2019 118.8 118.0 118.0 118.1 118.2 118.3 119.0 119.5 119.5 119.7 119.4 119.5 2018 115.6 113.8 114.0 114.1 114.2 114.2 114.4 114.3 118.0 117.1 117.3 117.9 117.9
Education 2019 109.7 106.8 106.8 106.8 106.8 106.8 110.3 112.5 112.5 112.5 112.5 112.5 2018 117.6 127.8 127.7 127.8 127.8 127.8 131.9 106.8 106.8 106.8 106.8 106.8 106.8
Restaurant and miscellaneous 2019 114.4 111.8 112.2 112.4 112.9 113.2 114.6 115.6 115.8 116.0 116.4 117.2 goods and services 2018 111.0 110.0 110.1 110.2 110.4 110.7 111.0 111.2 111.4 111.6 111.7 111.7 111.7
IX - Zamboanga Peninsula
All items 2019 123.9 124.1 124.0 123.8 123.8 123.7 123.7 123.7 124.0 123.6 124.0 124.6 2018 122.9 119.8 121.0 121.4 121.8 121.9 122.9 122.0 123.4 125.2 125.6 125.2 124.6
Food and non-alcoholic beverages 2019 123.0 123.9 123.8 123.0 122.8 122.4 122.6 122.2 123.2 122.5 122.7 123.7 2018 121.9 117.8 118.8 119.0 119.3 119.4 120.6 120.6 123.0 126.3 126.8 125.7 125.0
Food 2019 123.2 124.3 124.1 123.3 123.1 122.6 122.8 122.5 123.4 122.6 122.9 123.9 2018 122.2 118.3 119.2 119.3 118.9 119.6 120.8 120.8 123.4 126.9 127.4 126.2 125.5
Bread and Cereals 2019 119.7 122.3 121.5 121.0 120.8 120.1 119.6 119.2 119.1 118.2 117.5 117.3 2018 119.9 113.8 115.9 116.6 116.3 116.9 117.7 117.5 120.8 126.7 128.2 124.2 123.8
Meat 2019 120.0 120.5 120.1 119.8 119.3 119.4 119.5 120.3 120.3 120.3 120.4 120.5 2018 118.3 114.2 117.6 118.9 118.6 118.4 118.6 117.8 118.1 118.1 118.9 119.6 120.5
Fish 2019 125.2 126.7 127.6 123.4 122.7 120.9 122.7 120.8 124.3 126.3 128.7 132.8 2018 124.6 123.0 120.3 120.6 119.3 119.9 123.0 124.0 127.4 129.3 128.4 131.7 128.8
Milk, cheese, and eggs 2019 122.3 121.4 121.4 121.7 121.8 122.3 122.3 122.6 122.7 123.0 123.0 123.1 2018 119.8 116.5 116.8 116.8 119.5 120.0 120.3 120.6 121.1 121.4 121.4 121.4 121.4
Oils and fats 2019 101.3 101.1 101.1 101.1 101.3 101.3 101.3 101.3 101.3 101.5 101.6 101.8 2018 100.7 99.9 99.9 99.9 100.1 100.9 101.0 101.1 101.3 101.4 101.1 101.1 101.1
Prices, Inflation Rate, and Purchasing Power of the Peso
Continued

Prices, Inflation Rate, and Purchasing Power of the Peso
TABLE 1.1--Continued
Indicator Year Average January February March April May June July August September October November December
Fruit 2019 132.0 130.2 132.1 132.9 132.7 132.3 122.7 120.8 128.3 132.0 142.3 145.4 2018 132.3 135.9 139.1 141.3 135.9 134.8 131.8 124.6 126.6 130.6 129.7 129.2 128.4
Vegetables 2019 149.2 145.5 146.1 147.4 148.5 150.5 155.0 156.8 157.3 145.9 143.2 145.4 2018 144.0 143.8 143.1 137.0 135.4 138.6 142.6 144.3 147.1 150.6 149.1 148.6 148.0
Sugar, jam, honey, chocolate, 2019 114.9 114.1 113.9 114.8 114.9 115.0 115.0 115.0 115.1 115.1 115.1 115.4 and confectionery 2018 111.6 109.0 109.1 109.1 109.5 110.1 110.7 111.6 113.7 114.1 114.1 113.8 114.1
Food products N.E.C. 2019 124.0 122.3 122.5 122.9 122.4 123.3 123.9 124.4 125.5 125.6 125.6 125.5 2018 117.5 112.7 112.6 112.6 114.7 117.1 117.6 118.9 119.4 119.9 119.9 122.2 122.2
Non-alcoholic beverages 2019 119.1 117.5 117.9 118.3 118.5 118.8 118.9 118.9 119.8 120.1 120.5 120.8 2018 116.5 110.7 112.9 112.8 125.8 116.1 116.4 116.7 116.8 117.5 117.5 117.5 117.5
Alcoholic beverages and tobacco 2019 223.6 218.8 219.3 219.8 221.1 221.4 221.6 224.3 227.9 227.9 227.9 229.8 2018 211.9 183.9 208.0 208.6 210.8 210.9 214.0 214.5 216.4 218.7 218.8 218.8 218.8
Clothing and footwear 2019 115.9 114.3 115.2 115.4 115.5 115.7 115.7 115.9 116.9 116.9 116.9 116.9 2018 113.7 112.9 113.1 113.2 113.3 113.4 113.8 113.8 114.0 114.3 114.3 114.3 114.3
Housing, water, electricity, gas, 2019 136.0 136.7 136.1 136.2 136.2 136.2 136.1 136.5 135.3 134.4 135.8 136.6 and other fuels 2018 135.8 135.3 135.9 135.7 135.5 135.6 136.1 134.9 135.1 135.6 136.0 137.3 136.8
Furnishing, household equipment, 2019 131.4 130.9 130.9 131.0 131.0 131.1 131.1 131.2 131.2 132.2 132.2 132.4 and routine maintenance of the 2018 128.1 126.7 126.9 126.9 127.8 127.9 128.5 128.6 128.6 128.8 128.8 128.8 128.8 house
Health 2019 135.3 134.9 134.9 135.1 135.1 135.3 135.3 135.4 135.5 135.5 135.5 135.6 2018 132.3 122.2 122.3 132.7 134.3 134.3 134.3 134.5 134.5 134.6 134.6 134.6 134.6
Transport 2019 101.8 99.7 99.5 101.6 102.7 103.6 102.3 102.2 101.4 102.3 102.5 102.2 2018 101.9 98.8 100.4 100.1 100.9 102.0 103.0 102.5 102.7 103.3 103.9 103.4 101.2
Communication 2019 102.0 102.0 102.0 102.0 102.0 102.0 102.0 102.0 102.0 102.0 102.0 102.0 2018 101.3 100.9 100.9 100.9 100.9 100.9 100.9 100.9 101.9 101.9 102.0 102.0 102.0
Recreation and culture 2019 120.6 120.3 120.5 120.5 120.5 120.7 120.7 120.7 120.8 120.8 120.8 120.8 2018 118.0 116.0 116.1 116.2 116.4 116.3 116.6 116.6 120.2 121.2 120.3 120.3 120.3
Education 2019 93.1 92.6 92.6 92.6 92.6 92.6 93.0 93.6 93.6 93.6 93.6 93.6 2018 106.3 119.3 119.1 119.3 119.3 119.3 123.6 92.6 92.6 92.6 92.6 92.6 92.6
Restaurant and miscellaneous 2019 117.5 117.2 117.2 117.3 117.3 117.4 117.4 117.5 117.9 117.9 117.9 117.9 goods and services 2018 115.8 114.4 115.0 115.1 115.5 115.5 115.9 116.1 116.3 116.4 116.4 116.4 116.4
23
Continued

24
TABLE 1.1--Continued
Indicator Year Average January February March April May June July August September October November December
X - Northern Mindanao
All items 2019 125.0 124.0 124.1 124.3 124.8 125.6 125.2 125.1 125.3 125.3 125.4 125.9 2018 121.6 118.5 119.1 119.4 119.6 120.2 120.7 121.4 122.5 124.1 125.1 124.5 124.0
Food and non-alcoholic beverages 2019 121.6 121.7 122.0 121.4 121.3 122.3 121.9 121.5 121.7 121.4 121.3 121.2 2018 119.5 116.5 117.0 117.5 117.6 118.0 118.1 118.9 120.6 122.4 123.6 122.4 121.7
Food 2019 121.9 122.1 122.4 121.7 121.7 122.7 122.3 121.8 121.9 121.6 121.5 121.4 2018 120.1 117.2 117.8 118.2 118.3 118.6 118.8 119.3 121.1 122.9 124.2 122.9 122.2
Bread and Cereals 2019 113.4 114.9 114.5 114.3 114.4 114.3 113.9 113.4 113.2 112.3 111.9 110.8 2018 116.2 113.1 113.3 113.9 114.1 114.8 115.2 116.0 117.8 120.5 121.3 118.1 116.2
Meat 2019 125.0 124.6 124.7 124.6 124.6 124.8 124.5 124.8 125.2 125.2 125.5 126.0 2018 119.6 114.1 114.9 116.8 117.0 117.0 118.4 121.1 121.8 122.4 123.5 124.0 124.1
Fish 2019 130.8 133.9 134.0 130.2 129.2 130.3 129.1 129.1 129.9 130.7 130.4 131.7 2018 126.6 123.5 124.4 124.4 124.7 124.1 124.1 125.0 126.9 128.1 131.6 131.9 130.9
Milk, cheese, and eggs 2019 118.9 117.6 118.1 118.2 118.3 118.4 118.7 118.8 119.3 119.7 120.2 120.9 2018 114.9 112.8 113.1 113.5 113.6 114.0 114.1 114.2 115.4 116.1 116.9 117.2 117.4
Oils and fats 2019 107.9 107.6 107.7 107.7 107.7 107.7 107.8 108.0 108.1 108.1 108.2 108.4 2018 104.5 102.3 102.4 102.5 102.6 103.1 104.3 105.0 105.6 105.8 106.8 106.7 107.4
Fruit 2019 134.7 131.0 130.8 132.0 131.4 135.4 134.7 132.4 134.1 138.8 140.3 140.7 2018 126.0 126.5 128.8 130.0 130.0 127.3 124.3 116.7 119.8 123.8 126.3 128.5 130.4
Vegetables 2019 150.0 142.6 147.6 147.0 147.6 157.6 156.6 152.4 151.7 148.9 149.0 149.4 2018 140.4 144.9 145.9 141.8 140.9 142.3 137.7 133.7 138.7 139.2 139.0 139.2 141.6
Sugar, jam, honey, chocolate, 2019 119.3 123.2 121.1 119.6 119.6 118.7 118.6 118.5 118.2 118.6 118.3 117.9 and confectionery 2018 120.0 109.8 109.9 111.5 111.8 112.1 119.3 127.2 127.6 128.2 129.3 127.4 125.5
Food products N.E.C. 2019 130.7 125.7 126.6 128.3 129.0 130.7 132.2 132.9 133.1 132.9 132.7 133.3 2018 120.8 117.2 117.3 117.3 117.5 118.8 118.7 120.7 122.3 124.1 124.5 125.3 125.6
Non-alcoholic beverages 2019 117.4 116.2 116.8 116.7 117.0 117.0 117.1 117.9 118.0 118.0 118.1 118.3 2018 111.5 106.1 106.5 108.1 108.1 109.5 110.1 113.1 113.9 114.8 115.3 116.0 116.1
Alcoholic beverages and tobacco 2019 197.4 191.5 192.4 192.8 193.5 195.1 195.6 196.8 199.7 201.7 204.3 207.6 2018 181.5 169.7 172.4 173.3 174.4 178.7 180.0 184.7 186.1 187.3 189.0 191.0 191.0
Clothing and footwear 2019 116.3 115.8 116.1 116.2 116.3 116.3 116.2 116.3 116.3 116.5 116.5 116.6 2018 113.8 111.8 111.9 112.3 112.4 112.9 113.1 114.0 114.5 115.4 115.4 115.7 115.7
.
Prices, Inflation Rate, and Purchasing Power of the Peso
Continued

Prices, Inflation Rate, and Purchasing Power of the Peso
TABLE 1.1--Continued
Indicator Year Average January February March April May June July August September October November December
Housing, water, electricity, gas, 2019 140.1 137.2 138.5 138.7 139.9 140.7 140.2 140.4 140.3 141.1 141.2 143.3 and other fuels 2018 132.6 128.2 128.5 128.6 129.0 130.1 130.7 133.1 134.3 136.9 138.3 136.8 136.8
Furnishing, household equipment, 2019 128.1 127.7 127.9 127.9 128.0 128.0 128.0 128.1 128.1 128.2 128.2 129.2 and routine maintenance of the 2018 125.7 123.6 123.8 124.4 124.6 124.7 124.8 125.7 126.3 127.2 127.4 127.6 127.7 house
Health 2019 129.4 127.8 128.1 129.1 129.1 129.3 129.6 129.7 129.7 129.7 129.9 131.1 2018 124.5 122.2 122.3 122.5 122.6 122.9 123.4 125.4 125.6 125.8 126.9 127.1 127.4
Transport 2019 106.6 105.0 101.9 105.1 108.7 110.1 107.2 106.8 106.9 107.1 107.2 107.0 2018 106.3 102.6 104.3 104.3 105.2 106.4 107.3 106.5 106.6 108.2 109.4 108.7 106.1
Communication 2019 105.9 105.8 105.8 105.8 105.9 106.0 106.0 106.0 106.0 106.0 106.0 106.0 2018 105.8 105.8 105.8 105.8 105.8 105.8 105.8 105.8 105.8 105.8 105.8 105.8 105.8
Recreation and culture 2019 114.0 113.7 113.7 113.8 113.8 113.8 113.8 114.1 114.2 114.2 114.2 114.4 2018 111.7 109.9 110.0 110.1 110.1 110.1 110.9 111.5 113.1 113.3 113.6 113.7 113.7
Education 2019 116.8 115.0 115.0 115.0 115.0 115.0 118.1 118.3 118.3 118.3 118.3 118.3 2018 121.8 128.1 128.1 128.1 128.1 128.1 131.2 115.1 115.0 115.0 115.0 115.0 115.0
Restaurant and miscellaneous 2019 126.1 124.9 124.9 125.1 125.1 125.8 126.5 126.7 126.8 126.8 126.8 127.9 goods and services 2018 119.4 115.4 115.7 116.0 116.1 116.3 116.9 120.7 121.5 122.8 123.0 123.9 124.9
XI - Davao Region
All items 2019 120.9 120.5 120.4 120.2 120.7 120.9 121.1 120.9 121.6 121.6 120.8 121.5 2018 118.1 115.1 115.2 115.3 116.2 116.6 117.4 118.4 119.8 121.2 121.7 120.6 119.9
Food and non-alcoholic beverages 2019 121.4 122.9 122.1 120.8 121.5 121.5 121.5 120.9 122.5 121.5 119.6 120.8 2018 120.1 117.4 117.3 117.5 118.5 118.7 118.9 119.8 122.2 123.6 123.6 121.8 121.3
Food 2019 120.9 122.8 121.9 120.3 121.1 121.0 121.0 120.3 122.0 120.9 118.9 120.1 2018 120.1 117.7 117.5 117.6 118.6 118.9 119.0 119.8 122.3 123.7 123.6 121.6 120.9
Bread and Cereals 2019 111.8 115.6 114.6 112.8 112.5 112.5 111.9 111.2 111.8 110.1 108.8 108.1 2018 117.5 113.9 114.3 115.2 116.2 116.8 117.6 118.1 120.2 122.9 121.0 117.9 116.4
Meat 2019 124.3 123.5 123.1 122.3 122.6 122.6 124.4 125.1 125.7 125.9 125.8 125.9 2018 120.5 115.5 115.8 117.1 117.9 118.4 120.1 120.6 123.5 124.8 124.5 123.7 123.8
Fish 2019 129.8 137.5 131.5 126.2 125.8 125.1 129.2 128.5 134.4 132.0 125.3 131.9 2018 121.6 122.0 119.6 117.9 121.0 119.7 115.7 117.0 122.9 123.4 127.9 125.8 126.0
Milk, cheese, and eggs 2019 124.3 123.1 123.5 123.7 123.9 123.7 124.1 124.4 125.0 125.3 125.4 125.6 2018 121.4 119.1 119.4 120.3 120.3 121.2 122.1 122.0 121.2 122.0 122.9 123.2 123.1
25
Continued

26
TABLE 1.1--Continued
Indicator Year Average January February March April May June July August September October November December
Oils and fats 2019 122.7 121.4 121.6 121.7 122.0 121.8 123.1 123.5 123.4 123.7 123.7 123.7 2018 119.3 116.9 117.1 117.5 118.4 118.8 119.1 119.4 119.9 120.4 121.1 121.4 121.4
Fruit 2019 130.4 121.7 123.7 125.8 130.3 133.5 128.7 127.7 133.6 135.2 138.8 135.5 2018 126.4 135.4 130.9 129.1 127.7 127.5 126.5 124.4 124.4 130.4 121.4 119.0 119.8
Vegetables 2019 129.3 122.5 131.6 134.0 142.9 140.9 128.1 124.2 126.3 125.3 120.4 125.8 2018 122.5 124.4 125.0 121.3 119.6 119.8 119.7 122.7 125.9 121.7 125.7 123.0 121.2
Sugar, jam, honey, chocolate, 2019 124.8 128.4 124.5 124.4 123.4 124.6 128.4 126.1 125.1 124.0 121.8 121.7 and confectionery 2018 124.3 113.1 113.0 114.0 115.7 117.5 128.8 134.4 133.1 133.0 131.5 129.3 128.6
Food products N.E.C. 2019 134.2 126.8 125.9 128.4 132.4 135.0 140.7 139.1 137.4 137.6 136.4 136.6 2018 125.6 120.3 122.5 126.5 127.2 128.7 125.6 126.4 125.3 124.8 124.7 127.9 127.8
Non-alcoholic beverages 2019 128.1 125.2 125.8 126.5 127.2 127.4 128.4 128.9 129.3 129.9 129.9 130.3 2018 119.3 113.4 114.6 115.3 116.2 116.7 118.3 119.9 120.9 122.8 123.5 124.6 125.1
Alcoholic beverages and tobacco 2019 170.4 163.5 164.4 164.6 164.7 164.8 166.8 168.2 168.9 182.2 182.5 183.8 2018 158.9 147.2 151.4 155.8 158.1 159.1 160.3 161.0 161.9 162.7 162.9 163.1 163.4
Clothing and footwear 2019 125.6 124.1 124.3 124.5 124.7 124.9 125.7 125.9 126.4 126.6 126.9 127.7 2018 121.8 118.9 119.2 119.3 120.6 121.1 121.8 122.4 122.6 123.5 123.8 124.0 124.1
Housing, water, electricity, gas, 2019 121.3 119.5 120.8 121.5 121.8 122.3 121.9 121.7 120.7 121.2 121.2 121.6 and other fuels 2018 116.7 113.2 113.1 112.4 112.7 113.4 115.1 117.7 118.3 120.6 122.2 121.4 120.6
Furnishing, household equipment, 2019 120.9 119.0 119.3 119.5 119.6 119.7 120.7 121.9 122.1 122.5 122.7 122.9 and routine maintenance of the 2018 115.6 112.9 113.1 113.3 113.5 113.9 114.7 116.1 116.3 118.1 118.5 118.5 118.8 house
Health 2019 123.0 120.5 120.6 121.1 121.4 121.6 123.6 124.1 124.6 125.0 125.1 125.4 2018 116.8 112.7 113.3 113.4 115.7 115.9 116.0 117.4 118.5 119.2 119.6 119.9 120.2
Transport 2019 105.2 103.0 103.1 105.2 106.2 106.7 105.1 105.5 105.3 105.6 105.8 105.7 2018 104.6 101.0 102.1 101.8 102.8 103.9 104.8 105.4 105.7 107.7 109.2 107.3 103.6
Communication 2019 102.8 102.9 102.8 102.8 102.8 102.8 102.8 102.8 102.8 102.8 102.8 102.8 2018 102.1 101.7 101.7 101.7 101.6 101.7 101.6 101.8 102.2 102.9 102.9 102.9 102.9
Recreation and culture 2019 120.7 119.0 119.1 119.2 119.2 120.1 121.4 121.6 121.8 122.0 122.2 122.4 2018 115.8 113.3 113.3 113.4 113.5 113.8 114.6 115.5 117.1 118.7 118.7 118.9 118.9
Education 2019 120.5 118.5 118.5 118.5 118.5 118.5 122.2 122.2 122.2 122.2 122.2 122.2 2018 119.6 120.2 120.2 120.2 120.2 120.2 122.8 118.5 118.5 118.5 118.5 118.5 118.5
Prices, Inflation Rate, and Purchasing Power of the Peso
Continued

Prices, Inflation Rate, and Purchasing Power of the Peso
TABLE 1.1--Continued
Indicator Year Average January February March April May June July August September October November December
Restaurant and miscellaneous 2019 125.1 123.0 123.3 123.6 124.0 124.2 125.4 125.7 126.1 126.7 126.8 127.1 goods and services 2018 120.1 116.7 116.9 117.5 118.3 118.5 120.3 121.4 121.5 121.9 122.5 122.6 122.8
XII - SOCCSKSARGEN
All items 2019 123.9 123.5 123.0 122.9 123.4 123.6 124.2 124.5 124.8 124.4 124.2 124.6 2018 120.6 117.4 118.0 118.2 118.6 119.1 120.2 120.8 123.0 123.4 123.4 122.9 122.4
Food and non-alcoholic beverages 2019 124.4 126.1 124.6 123.6 123.8 124.0 124.8 125.0 125.7 124.4 122.9 123.6 2018 123.4 121.0 120.5 120.8 121.2 121.5 123.3 123.6 126.4 127.2 126.7 124.9 124.0
Food 2019 124.2 126.1 124.6 123.4 123.6 123.8 124.6 124.8 125.4 124.1 122.5 123.2 2018 123.7 121.7 121.1 121.0 121.4 121.7 123.6 123.9 126.8 127.7 126.9 125.0 123.9
Bread and Cereals 2019 113.8 117.1 116.1 115.8 115.1 114.4 113.8 113.6 113.8 111.8 110.4 109.4 2018 120.2 115.2 115.9 117.6 118.2 118.9 119.7 121.9 126.0 126.4 123.7 120.4 118.0
Meat 2019 122.4 121.8 121.8 121.0 121.8 121.2 122.2 122.5 122.7 123.5 123.9 124.1 2018 120.1 118.0 118.3 118.8 119.2 120.0 120.3 120.1 120.1 120.9 121.3 121.9 121.9
Fish 2019 140.5 148.2 141.5 135.2 134.0 135.3 139.5 141.0 143.5 143.9 138.9 144.0 2018 132.6 135.5 132.0 129.6 129.6 127.6 132.9 129.0 133.1 135.3 137.3 135.1 134.7
Milk, cheese, and eggs 2019 116.5 116.7 116.4 116.4 116.7 116.3 116.0 116.3 116.5 116.8 116.8 117.1 2018 114.0 112.4 112.4 112.7 112.8 113.0 113.1 113.9 115.1 115.6 115.6 115.7 116.1
Oils and fats 2019 106.2 108.7 108.6 108.5 106.6 105.8 105.5 105.7 105.6 104.5 104.0 104.3 2018 107.2 106.5 106.8 107.0 106.8 106.4 106.5 106.8 107.1 107.2 107.9 108.5 108.8
Fruit 2019 137.8 131.3 129.5 131.6 133.5 134.9 138.1 140.6 142.3 143.9 147.1 143.3 2018 129.2 133.6 131.9 130.7 129.7 128.6 128.5 124.5 128.4 127.3 127.8 129.2 130.2
Vegetables 2019 155.6 148.2 150.8 151.3 158.3 161.5 162.2 161.4 161.3 152.8 149.8 154.1 2018 144.2 146.7 142.7 137.5 138.2 140.3 145.8 145.4 147.2 148.2 148.3 145.3 145.3
Sugar, jam, honey, chocolate, 2019 114.9 115.8 115.4 114.9 115.5 115.2 115.3 114.2 114.6 114.4 114.4 114.1 and confectionery 2018 114.4 107.3 107.7 106.6 107.3 109.7 113.7 118.3 118.5 122.1 121.6 121.1 119.0
Food products N.E.C. 2019 129.6 125.2 124.5 125.1 128.0 130.9 134.4 132.3 131.9 131.2 130.3 131.6 2018 118.8 115.4 115.6 116.2 117.0 119.2 119.1 118.9 119.2 119.1 119.4 122.3 124.7
Non-alcoholic beverages 2019 127.4 125.4 125.8 126.1 126.6 127.0 127.2 127.9 128.3 128.3 129.1 129.3 2018 119.6 111.3 113.1 117.3 118.4 118.8 119.3 120.5 121.3 121.4 124.2 124.3 125.2
Alcoholic beverages and tobacco 2019 229.3 216.4 218.8 222.8 223.7 227.5 228.1 228.3 228.3 236.0 246.0 246.7 2018 201.8 184.6 194.3 198.6 198.8 199.5 199.6 201.9 206.2 206.7 207.3 210.8 213.7
27
Continued

28
TABLE 1.1--Continued
Indicator Year Average January February March April May June July August September October November December
Clothing and footwear 2019 115.8 113.9 114.1 114.3 114.7 115.2 115.8 116.6 116.8 117.0 117.3 117.6 2018 110.5 109.2 109.3 109.4 109.4 109.4 109.5 110.2 111.1 111.3 111.9 112.4 112.6
Housing, water, electricity, gas, 2019 124.9 123.6 123.6 124.0 125.7 125.7 125.9 125.7 124.9 124.5 125.1 125.2 and other fuels 2018 121.5 117.4 119.6 119.0 119.2 120.6 121.2 122.5 124.1 123.4 123.1 124.1 123.9
Furnishing, household equipment, 2019 119.9 117.8 118.1 118.8 118.9 119.0 119.1 120.8 121.1 121.4 121.8 121.8 and routine maintenance of the 2018 112.6 109.6 109.8 109.8 109.9 109.9 110.0 111.7 114.1 115.2 116.7 117.1 117.3 house
Health 2019 127.0 126.5 126.5 126.4 126.6 126.6 126.7 126.8 127.1 127.6 128.3 128.3 2018 119.6 115.4 115.7 115.8 116.0 116.4 116.4 119.5 122.1 122.3 124.7 124.9 126.0
Transport 2019 103.5 101.1 101.5 103.1 104.1 104.7 103.5 103.7 103.5 103.8 104.7 104.5 2018 101.1 97.7 98.8 98.8 99.9 100.7 101.1 100.8 102.3 103.0 104.4 103.9 102.1
Communication 2019 102.2 101.8 101.9 101.9 102.0 102.3 102.3 102.3 102.3 102.3 102.4 102.4 2018 100.7 99.7 99.7 100.0 100.0 100.0 100.0 100.9 101.5 101.7 101.7 101.7 101.8
Recreation and culture 2019 119.8 118.8 118.9 119.1 119.1 119.1 119.8 120.3 120.4 120.6 120.6 120.7 2018 115.5 113.1 113.1 113.1 113.2 113.4 113.7 114.1 118.2 118.4 118.5 118.6 118.7
Education 2019 117.7 113.2 113.2 113.2 113.2 113.2 121.2 121.5 121.5 121.5 121.5 121.5 2018 116.1 118.7 118.7 118.7 118.7 118.7 120.3 113.2 113.2 113.2 113.2 113.2 113.2
Restaurant and miscellaneous 2019 123.3 121.3 122.2 122.3 122.5 122.5 122.6 123.5 124.3 124.3 124.9 125.4 goods and services 2018 117.2 112.7 114.3 115.1 115.1 115.8 116.8 117.6 118.9 119.3 119.6 120.5 120.6
XIII - Caraga
All items 2019 119.5 119.0 119.1 119.1 119.5 119.6 119.4 119.3 119.4 119.4 119.7 120.5 2018 117.5 114.7 115.3 115.7 116.5 116.6 117.1 117.3 118.1 119.8 120.2 119.7 118.6
Food and non-alcoholic beverages 2018 123.5 124.4 124.7 123.9 123.8 123.6 123.6 123.2 123.3 122.6 122.7 122.7 2018 122.7 119.0 119.7 120.1 121.3 121.2 121.8 122.6 123.1 126.6 127.3 125.9 123.7
Food 2019 123.0 124.2 124.5 123.6 123.5 123.2 123.1 122.7 122.7 122.0 122.0 122.0 2018 122.8 119.4 120.1 120.4 121.6 121.5 121.9 122.5 123.2 126.7 127.4 125.8 123.5
Bread and Cereals 2019 115.5 119.1 119.0 118.3 117.2 116.3 116.1 114.5 113.6 112.6 112.4 111.1 2018 121.9 117.3 117.5 119.9 120.3 120.8 121.1 122.1 122.2 126.7 128.5 125.9 120.7
Meat 2019 119.5 119.6 119.4 119.5 119.5 118.9 119.0 119.1 119.1 119.9 120.4 120.5 2018 116.7 112.8 113.9 113.9 114.8 115.1 116.5 117.5 118.3 119.0 119.3 119.3 119.5
Fish 2019 133.6 137.2 136.8 131.9 132.6 131.8 132.1 133.9 133.5 132.6 132.6 134.9 2018 127.0 123.6 125.4 122.4 126.6 124.5 125.7 125.4 126.7 132.3 131.8 130.3 129.6
Prices, Inflation Rate, and Purchasing Power of the Peso
Continued

Prices, Inflation Rate, and Purchasing Power of the Peso
TABLE 1.1--Continued
Indicator Year Average January February March April May June July August September October November December
Milk, cheese, and eggs 2019 114.7 117.3 113.5 113.8 113.9 114.2 114.4 114.6 114.7 114.8 114.9 115.1 2018 111.0 109.6 109.7 110.0 110.1 110.1 110.3 111.0 111.2 111.7 112.5 112.6 112.8
Oils and fats 2019 140.8 136.3 137.8 138.7 140.4 141.0 141.4 142.7 142.7 142.7 142.8 142.2 2018 130.0 125.7 125.8 126.6 126.8 127.0 127.3 129.9 131.4 133.0 134.1 136.4 135.6
Fruit 2019 141.4 132.0 129.6 133.7 138.0 140.7 139.0 140.8 149.0 149.9 155.0 147.4 2018 133.3 132.8 132.8 136.7 138.3 136.7 133.6 132.7 133.1 132.9 130.3 131.5 128.0
Vegetables 2019 147.9 141.5 147.6 148.5 149.6 150.2 149.2 149.2 150.8 147.3 144.2 149.2 2018 139.7 142.7 144.2 137.4 138.6 137.5 136.8 136.6 138.0 141.4 141.6 138.7 142.4
Sugar, jam, honey, chocolate, 2019 109.6 115.7 112.9 111.6 108.4 108.3 108.1 107.4 107.8 108.3 108.4 108.6 and confectionery 2018 113.1 105.9 106.3 106.6 107.9 109.0 109.4 117.3 119.3 119.8 119.8 118.8 116.8
Food products N.E.C. 2019 134.0 123.5 124.9 126.8 131.3 136.7 138.7 137.5 137.7 138.5 138.5 139.6 2018 118.6 115.3 114.9 116.1 117.5 118.8 119.1 118.6 118.8 120.5 120.9 121.0 121.7
Non-alcoholic beverages 2019 129.8 127.1 127.6 127.7 128.1 129.6 129.8 130.6 130.8 130.8 132.3 133.4 2018 120.6 113.3 113.7 115.9 117.0 117.6 120.6 123.1 123.3 124.9 125.4 126.2 126.6
Alcoholic beverages and tobacco 2019 171.2 162.1 166.0 166.4 167.0 167.2 167.7 169.2 169.5 181.0 182.7 184.7 2018 149.6 126.6 136.2 145.6 148.6 149.7 150.3 153.5 155.9 156.1 157.1 157.3 158.6
Clothing and footwear 2019 115.0 114.7 114.7 114.7 114.7 114.7 114.7 114.9 114.9 114.9 115.4 116.6 2018 114.6 114.4 114.6 114.6 114.6 114.6 114.6 114.6 114.6 114.7 114.7 114.7 114.7
Housing, water, electricity, gas, 2019 120.7 119.8 120.4 120.6 121.1 121.2 120.5 120.1 119.8 120.4 120.7 123.4 and other fuels 2018 116.7 114.5 114.9 114.7 114.9 115.3 115.5 116.0 118.4 118.8 118.7 119.2 119.4
Furnishing, household equipment, 2019 110.0 108.4 108.7 108.9 109.1 109.2 109.2 110.8 110.8 111.3 111.6 111.5 and routine maintenance of the 2018 105.9 105.4 105.5 105.5 105.6 105.6 105.6 105.9 105.9 106.0 106.2 106.2 107.9 house
Health 2019 117.1 115.3 115.6 115.7 115.9 116.2 117.6 117.9 118.0 118.3 118.4 119.2 2018 114.5 114.2 114.2 114.2 114.3 114.4 114.4 114.5 114.6 114.6 114.7 114.8 114.8
Transport 2019 106.8 104.7 102.2 105.5 108.7 110.6 108.2 107.2 106.2 106.5 107.2 108.3 2018 106.1 102.1 103.5 104.0 105.4 106.6 107.4 107.7 107.3 107.5 107.9 108.1 106.2
Communication 2019 103.9 103.7 103.7 103.7 103.7 103.8 103.8 104.0 104.0 104.0 104.0 104.1 2018 103.1 103.0 103.0 103.0 103.0 103.0 103.0 103.0 103.0 103.0 103.0 103.0 103.7
Recreation and culture 2019 110.7 108.9 108.9 108.9 108.9 109.9 110.5 111.7 111.8 112.2 112.7 113.3 2018 108.3 107.9 108.0 107.9 108.0 108.0 108.0 108.0 108.5 108.5 108.9 108.9 108.9
Education 2019 104.6 99.6 99.6 99.6 99.6 99.6 103.6 105.6 110.7 110.8 110.8 110.8 2018 104.5 109.1 109.0 109.1 109.1 109.1 111.8 98.5 99.6 99.6 99.6 99.6 99.6
29
Continued

30
TABLE 1.1--Continued
Indicator Year Average January February March April May June July August September October November December
Restaurant and miscellaneous 2019 112.9 111.6 111.8 112.0 112.0 112.2 112.4 113.1 113.2 113.5 113.7 116.1 goods and services 2018 109.8 109.0 109.0 109.2 109.2 109.3 109.3 110.0 110.0 110.1 110.3 111.0 111.2
ARMM - Autonomous Region in Muslim Mindanao
All items 2019 127.1 127.2 125.9 126.1 126.4 127.0 127.5 127.1 127.6 127.6 127.6 127.6 2018 123.9 119.9 121.1 121.5 121.9 122.0 124.1 124.5 125.4 126.8 126.3 126.7 126.9
Food and non-alcoholic beverages 2019 133.7 135.4 133.0 132.7 132.9 133.5 134.4 133.8 134.5 134.0 133.6 133.4 2018 131.4 127.0 128.1 128.8 129.1 129.1 132.1 131.9 132.8 134.7 134.0 134.1 134.8
Food 2019 134.6 136.5 133.9 133.6 133.7 134.4 135.3 134.6 135.4 134.8 134.4 134.2 2018 132.6 128.3 129.4 130.1 130.4 130.4 133.4 133.1 134.1 136.0 135.2 135.2 136.0
Bread and Cereals 2019 124.0 125.6 125.6 124.6 124.9 124.5 124.7 124.4 123.9 123.2 121.3 121.7 2018 125.0 119.8 121.3 122.3 122.6 123.5 126.0 126.5 127.7 129.5 128.0 126.7 126.6
Meat 2019 132.1 132.3 131.1 131.0 130.2 131.8 132.9 132.7 132.7 133.1 133.1 132.7 2018 129.4 127.5 126.1 125.6 126.5 127.1 127.9 130.4 133.5 133.1 132.1 131.3 131.6
Fish 2019 147.7 157.4 144.4 145.2 144.0 145.8 146.8 145.2 150.2 148.9 149.9 146.8 2018 142.6 138.1 139.6 138.9 139.9 138.8 143.6 138.4 139.4 143.9 146.4 150.9 153.7
Milk, cheese, and eggs 2019 121.1 121.1 121.5 121.3 120.8 120.4 119.9 119.8 120.0 121.2 123.2 123.0 2018 120.7 118.5 119.3 119.7 118.8 118.9 120.9 121.0 123.3 122.6 122.2 121.6 121.3
Oils and fats 2019 139.1 133.1 134.0 137.4 139.1 139.4 139.8 140.0 140.2 141.4 142.3 143.1 2018 123.3 117.6 118.2 119.7 120.0 120.0 121.3 123.0 123.6 126.1 128.6 130.2 131.1
Fruit 2019 145.5 147.5 146.8 145.8 144.3 144.8 146.0 145.3 144.9 143.0 143.9 148.7 2018 155.8 158.7 159.8 159.8 160.6 160.0 166.4 155.5 156.2 154.3 148.3 145.7 144.6
Vegetables 2019 162.4 156.1 156.8 156.2 159.0 162.8 166.6 164.8 165.4 165.8 166.7 166.6 2018 151.4 147.4 148.3 149.7 147.8 147.5 150.0 156.6 154.0 154.8 152.6 152.9 155.3
Sugar, jam, honey, chocolate, 2019 127.1 129.7 128.2 127.3 127.4 127.4 128.0 126.6 125.8 125.9 126.5 125.6 and confectionery 2018 127.5 121.0 121.1 124.6 124.8 122.1 126.7 128.0 130.5 134.5 133.7 131.7 131.7
Food products N.E.C. 2019 129.5 124.8 125.8 127.5 128.2 129.4 131.4 131.3 131.6 131.8 131.4 130.9 2018 119.9 115.1 116.3 116.8 118.5 117.8 118.6 121.4 123.3 124.1 122.2 122.2 122.4
Non-alcoholic beverages 2019 120.3 118.2 118.4 119.0 119.5 119.6 120.0 120.7 121.1 121.9 122.2 122.6 2018 112.2 107.0 108.4 109.3 109.6 110.1 111.7 112.6 113.3 114.5 115.6 116.5 117.3
Prices, Inflation Rate, and Purchasing Power of the Peso
Continued

Prices, Inflation Rate, and Purchasing Power of the Peso
TABLE 1.1--Concluded
Indicator Year Average January February March April May June July August September October November December
Alcoholic beverages and tobacco 2019 163.7 162.0 162.4 162.8 162.8 163.0 163.4 163.5 164.0 164.9 165.4 166.4 2018 152.5 140.4 142.7 144.1 147.5 147.5 148.6 156.9 157.5 160.6 160.7 161.5 161.8
Clothing and footwear 2019 121.3 119.2 119.5 120.0 120.3 120.8 121.3 121.7 122.1 122.6 123.0 123.3 2018 116.2 113.2 114.8 114.2 114.4 114.5 115.4 116.5 118.2 117.9 118.0 118.2 118.5
Housing, water, electricity, gas, 2019 112.3 110.6 110.7 112.1 112.4 112.4 112.2 112.0 112.4 112.7 113.5 114.1 and other fuels 2017 133.9 132.2 132.9 133.1 134.9 133.4 134.3 133.5 134.0 134.1 134.4 134.7 135.1
Furnishing, household equipment, 2019 119.6 118.4 118.6 119.1 119.2 119.5 119.6 119.9 120.0 120.2 120.5 121.0 and routine maintenance of the 2018 116.4 114.1 114.5 115.2 115.7 115.8 116.4 117.3 117.5 117.4 117.3 117.6 117.8 house
Health 2019 117.1 115.5 115.8 116.2 116.7 117.0 117.2 117.3 117.6 117.9 118.3 119.0 2018 111.5 108.0 108.8 109.4 110.8 111.1 111.2 112.2 112.5 113.2 113.3 113.3 113.7
Transport 2019 104.7 100.4 101.6 104.1 105.4 108.9 107.9 104.9 103.1 105.1 105.4 104.8 2018 101.5 97.9 100.3 99.2 100.3 101.2 102.1 104.2 103.6 103.0 99.6 105.0 101.8
Communication 2019 103.2 103.2 103.2 103.3 103.3 103.3 103.3 103.3 103.3 103.3 103.3 102.9 2018 102.4 100.9 100.9 100.9 101.0 101.0 103.2 103.2 103.5 103.5 103.5 103.5 103.5
Recreation and culture 2019 118.5 116.6 116.7 116.6 117.1 117.4 119.1 119.8 119.9 120.3 120.2 120.1 2018 115.1 112.1 112.7 113.6 114.1 114.1 114.6 115.7 116.3 116.8 117.0 117.1 117.1
Education 2019 117.9 116.9 116.9 116.9 116.9 116.9 116.9 119.0 119.0 119.0 119.0 119.0 2018 119.4 121.9 121.6 121.9 121.9 121.9 122.0 116.9 116.9 116.9 116.9 116.9 116.9
Restaurant and miscellaneous 2019 125.2 123.1 123.2 123.5 124.0 124.3 124.5 125.3 125.9 127.2 128.0 128.1 goods and services 2018 117.1 111.9 113.2 114.2 114.5 114.8 115.0 116.4 119.8 120.6 121.2 121.7 122.4
Source : Philippine Statistics Authority
31

32
Indicator Year Average January February March April May June July August September October November December
All items 2019 116.0 115.6 115.9 116.1 116.2 116.3 115.9 116.0 116.12018 183.2 181.0 181.9 182.2 182.0 182.3 183.1 183.2 183.6 185.2 185.0 184.7 183.8
Food 2019 119.4 119.3 119.4 119.6 119.6 119.7 119.1 119.2 119.42018 212.3 211.0 211.9 211.5 210.3 209.7 211.4 210.9 212.2 216.3 214.5 214.4 213.3
Beverages and tobacco 2019 140.5 139.8 140.1 140.4 140.4 140.6 140.6 140.7 141.22018 250.1 238.4 244.9 248.7 250.2 251.0 251.4 252.0 252.3 252.6 253.2 253.3 253.4
Crude materials, inedible except 2019 113.9 114.3 114.0 113.8 113.6 113.7 113.7 113.9 114.2 fuels 2018 178.4 175.9 176.1 176.6 176.7 176.7 177.1 177.8 178.2 178.2 180.8 180.8 186.1
Mineral fuels, lubricants, and 2019 98.7 93.6 97.2 100.2 101.2 102.0 98.1 98.8 98.1 related materials 2018 297.4 280.4 286.9 285.6 285.9 300.4 302.7 303.9 305.0 311.7 319.6 304.4 282.8
Chemicals, including animal 2019 111.3 111.2 111.2 111.1 111.3 111.4 111.3 111.6 111.6 or vegetable oils and fats 2018 171.9 170.9 171.1 171.5 171.6 171.7 171.7 172.1 171.9 172.1 172.3 172.7 172.8
Manufactured goods classified 2019 110.9 110.7 110.8 110.8 110.9 110.9 110.8 110.9 111.0 chiefly by materials 2018 157.8 156.0 156.2 157.0 157.5 157.6 158.1 158.3 158.3 158.3 158.5 158.9 158.7
Machinery and transport 2019 116.1 115.9 115.9 116.0 116.2 116.2 116.0 116.2 116.3 equipment 2018 143.8 142.6 143.1 143.5 143.7 143.7 143.7 144.1 144.0 144.2 144.2 144.3 144.7
Miscellaneous manufactured 2019 109.3 109.0 109.0 109.1 109.2 109.4 109.4 109.5 109.52018 156.1 155.1 155.4 155.6 155.7 155.9 156.3 156.5 156.5 156.5 156.6 156.8 156.8
Source : Philippine Statistics Authority3/ Excludes petroleum oil, coal, coke and carbon4/ Excludes basic and industrial chemicals, animal and vegetable oils and fats, fertilizers and limes, crude dye stuffs and tanning extracts.5/ Excludes leather and leather manufactures, other than rubber and related products, other wood, cane and cork products, pulp and paperboard, containers, abaca, clay products, primary metals.6/ Excludes agricultural machinery and equipment. `
Prices, Inflation Rate, and Purchasing Power of the Peso
TABLE 1.2 General Retail Price Index in NCR by Commodity 2018 (2000=100) and 2019 (2012=100)

Indicator Year Average January February March April May June July August September October November December
All items 2019 112.1 111.9 112.0 112.1 112.3 112.2 112.1 112.2 112.12018 189.3 187.3 187.5 188.3 188.9 189.0 189.2 189.5 189.5 189.8 190.4 191.1 191.5
Carpentry materials 2019 115.3 115.2 115.0 114.8 115.3 115.3 115.2 115.6 115.82018 162.7 159.3 159.5 161.3 162.8 163.1 163.4 163.4 163.5 163.6 163.0 164.7 165.2
Electrical materials 2019 106.0 106.0 106.1 106.1 106.1 106.1 105.9 105.8 105.92018 212.2 211.2 210.9 211.3 211.7 211.7 211.6 212.5 212.2 212.9 213.0 213.1 213.8
Masonry materials 2019 109.2 109.2 109.3 109.3 109.3 109.4 109.0 108.9 109.12018 203.1 200.1 200.3 201.0 201.5 201.5 201.9 202.0 202.4 202.4 206.5 206.9 210.8
Painting materials and related 2019 108.3 107.8 108.1 108.3 108.4 108.4 108.2 108.5 108.4 compounds 2018 191.9 191.0 191.1 191.8 191.9 192.0 191.9 191.9 191.7 192.3 192.4 192.3 192.3
Plumbing materials 2019 111.3 110.8 110.9 111.2 111.5 111.5 111.5 111.6 111.62018 171.9 170.9 170.5 171.5 172.0 172.0 172.0 172.2 172.2 172.2 172.4 172.5 172.5
Tinsmithry materials 2019 121.0 120.7 120.8 121.2 121.2 121.1 120.8 121.1 120.82018 148.9 147.5 147.9 148.0 148.2 148.2 148.4 148.8 149.0 149.0 149.6 152.7 149.7
Miscellaneous construction 2019 104.7 104.9 104.9 104.9 104.9 104.9 104.7 104.5 104.2 materials 2018 314.3 312.2 312.9 313.9 313.3 313.3 314.9 314.9 313.8 314.0 314.3 315.8 317.7
Source : Philippine Statistics Authority
Indicator Year Average January February March April May June July August September October November December
Philippines
All items 2019 113.5 112.8 112.9 113.2 113.3 113.8 113.9 113.8 114.3 p
2018 112.2 111.4 112.0 112.0 112.1 112.5 112.0 112.1 112.4 112.4 112.7 112.6 112.1
Food 2019 115.8 114.9 114.6 115.4 115.9 116.4 116.2 116.1 117.12018 113.3 112.6 113.1 113.1 112.6 114.0 112.9 113.1 113.5 113.2 113.8 114.1 113.6
Beverages and tobacco 2019 171.3 165.3 168.7 168.7 169.7 171.4 174.6 174.6 177.12018 155.3 148.5 153.1 153.3 153.4 153.4 153.4 153.4 156.0 156.8 160.0 159.9 162.0
Crude materials, inedible except 2019 91.5 97.9 91.9 91.3 92.4 90.6 90.1 88.3 89.4 p
fuel 2018 108.3 103.0 104.7 105.0 107.0 109.6 110.6 110.7 110.9 114.0 115.7 111.0 97.5
33
Continued
(2012=100)
2018 (2000=100) and 2019 (2012=100)
Prices, Inflation Rate, and Purchasing Power of the Peso
TABLE 1.3 Retail Price Index for Construction Materials in NCR
TABLE 1.4 General Wholesale Price Index by Commodity and Major Group Island: 2018 and 2019

34
TABLE 1.4--Continued
Indicator Year Average January February March April May June July August September October November December
Mineral fuels, lubricants, and 2019 100.5 95.4 99.0 102.3 102.9 103.9 99.4 101.0 100.2 related materials 2018 108.3 103.0 104.7 105.0 107.0 109.6 110.6 110.7 110.9 114.0 115.7 111.0 97.5
Chemicals, including animal 2019 116.7 119.9 119.9 118.1 116.6 116.1 114.6 114.0 114.0 and vegetable oils and fats 2018 119.7 119.3 119.9 119.9 121.1 120.2 119.6 119.2 119.1 119.3 119.3 119.2 120.0
Manufactured goods classified 2019 107.9 106.0 106.2 107.1 107.2 107.6 109.8 109.5 109.6 chiefly by material 2018 108.0 107.1 108.0 108.2 108.4 108.4 108.5 108.5 108.6 108.1 108.2 108.4 106.0
Machinery and transport 2019 108.9 108.2 108.3 108.4 108.5 109.2 109.4 109.4 109.6 equipment 2018 106.4 106.0 106.1 106.2 106.2 106.2 106.2 106.2 106.4 106.7 106.7 106.7 107.5
Miscellaneous manufactured 2019 106.5 108.3 108.4 106.0 106.3 106.4 105.3 105.4 105.7 articles 2018 104.2 103.3 103.7 103.8 103.8 104.0 104.0 104.0 104.0 104.0 104.0 104.0 108.1
Luzon
All items 2019 113.5 112.8 113.0 113.2 113.3 113.7 113.9 113.8 114.4 p
2018 112.3 111.6 112.2 112.2 112.1 112.7 112.1 112.2 112.4 112.4 112.8 112.8 112.2
Food 2019 115.0 114.2 113.9 114.7 115.1 115.5 115.3 115.2 116.32018 112.6 112.0 112.5 112.5 111.8 113.4 112.1 112.4 112.7 112.3 113.0 113.4 112.8
Beverages and tobacco 2019 171.3 165.0 168.7 168.3 169.4 171.3 174.8 174.8 177.72018 153.8 147.6 151.5 151.5 151.5 151.5 151.5 151.5 154.3 155.3 158.9 158.9 161.3
Crude materials, inedible except 2019 91.1 98.3 91.4 90.8 92.0 90.1 89.5 87.6 88.8 p
fuel 2018 115.0 150.4 133.7 121.0 124.8 118.4 106.1 108.8 110.6 109.4 103.3 94.5 98.4
Mineral fuels, lubricants, and 2019 100.9 95.5 99.4 102.7 103.3 104.4 99.7 101.4 100.5 related materials 2018 110.0 104.8 106.6 106.8 108.7 111.2 112.5 112.5 112.7 115.8 117.6 113.1 98.0
Chemicals, including animal 2019 117.9 121.5 121.5 119.5 117.8 117.3 115.5 114.8 114.9 and vegetable oils and fats 2018 121.4 121.2 121.9 121.9 123.0 122.0 121.2 120.8 120.7 120.9 120.8 120.7 121.6
Manufactured goods classified 2019 108.3 106.2 106.4 107.4 107.5 108.0 110.5 110.2 110.3 chiefly by material 2018 108.6 107.7 108.7 108.9 109.1 109.1 109.1 109.1 109.2 108.6 108.8 109.0 106.3
Machinery and transport 2019 109.2 108.5 108.6 108.7 108.8 109.6 109.8 109.8 110.1 equipment 2018 106.7 106.2 106.3 106.4 106.4 106.4 106.4 106.4 106.6 106.9 106.9 107.0 107.9
Miscellaneous manufactured 2019 106.7 108.8 108.9 106.2 106.5 106.7 105.4 105.5 105.9 articles 2018 104.4 103.4 103.9 104.0 104.0 104.2 104.2 104.2 104.2 104.2 104.2 104.2 108.9
Visayas
All items 2019 112.0 110.9 111.0 111.3 112.0 112.6 112.6 112.6 112.82018 110.1 108.6 109.2 109.3 110.0 110.0 110.2 110.1 110.5 110.6 110.8 110.6 110.7
Prices, Inflation Rate, and Purchasing Power of the Peso
Continued

TABLE 1.4--Continued `
Indicator Year Average January February March April May June July August September October November December
Food 2019 120.1 118.0 117.9 118.1 119.9 121.5 121.7 121.8 122.22018 115.9 114.3 114.8 114.7 115.5 115.3 115.8 115.7 116.6 116.4 116.8 117.1 117.4
Beverages and tobacco 2019 170.1 164.6 166.0 171.4 171.4 171.4 171.4 172.4 172.42018 162.5 147.7 161.7 163.1 163.3 163.3 163.3 163.8 164.8 164.9 164.9 164.6 164.6
Crude materials, inedible except 2019 88.1 89.2 89.9 88.7 88.4 87.6 87.1 87.1 87.0 fuel 2018 102.7 125.3 107.4 107.4 107.4 108.0 104.2 100.5 99.4 100.9 94.0 89.2 89.2
Mineral fuels, lubricants, and 2019 101.0 97.7 99.4 102.1 102.9 103.2 100.5 100.6 101.2 related materials 2018 100.4 93.6 94.7 96.3 99.9 102.0 101.5 101.6 101.9 105.1 107.9 100.6 99.4
Chemicals, including animal 2019 110.0 109.6 109.7 109.7 110.0 110.0 110.2 110.2 110.2 and vegetable oils and fats 2018 108.3 105.7 105.7 106.1 108.7 108.9 108.9 109.0 109.0 109.4 109.6 109.6 109.5
Manufactured goods classified 2019 101.2 101.3 101.3 101.3 101.2 101.2 101.2 101.2 101.2 chiefly by material 2018 101.2 101.0 101.0 101.2 101.2 101.2 101.2 101.2 101.2 101.3 101.3 101.3 101.3
Machinery and transport 2019 104.7 104.7 104.7 104.7 104.7 104.7 104.7 104.7 104.7 equipment 2018 104.6 104.6 104.6 104.6 104.6 104.6 104.6 104.6 104.7 104.7 104.7 104.7 104.7
Miscellaneous manufactured 2019 102.4 102.4 102.4 102.5 102.4 102.4 102.4 102.4 102.4 articles 2018 102.4 102.3 102.3 102.4 102.4 102.4 102.4 102.4 102.4 102.4 102.4 102.4 102.4
Mindanao
All items 2019 115.4 115.1 115.0 115.5 115.7 115.9 115.5 115.3 115.22018 113.5 111.6 112.6 112.7 113.2 113.4 113.9 113.9 114.1 114.6 114.4 114.0 113.8
Food 2019 123.6 123.0 122.7 123.6 124.0 124.6 124.1 123.2 123.22018 122.6 120.2 121.7 122.2 122.4 122.2 122.9 122.8 123.2 124.2 123.7 123.2 122.8
Beverages and tobacco 2019 173.0 171.6 171.6 171.6 173.5 173.8 173.8 173.8 173.92018 171.9 166.1 170.6 170.8 173.0 173.2 173.2 173.2 173.3 173.2 173.2 171.6 171.5
Crude materials, inedible except 2019 104.0 103.8 104.1 104.5 104.5 104.6 104.6 102.9 102.9 fuel 2018 108.8 109.1 108.8 108.8 108.8 108.8 108.8 108.8 108.8 108.8 108.8 108.8 108.8
Mineral fuels, lubricants, and 2019 93.6 89.6 91.8 95.4 96.6 96.2 91.5 93.7 93.7 related materials 2018 89.0 84.6 85.4 85.6 86.8 91.0 90.3 90.7 91.5 93.3 93.6 89.0 86.1
Chemicals, including animal 2019 104.7 105.4 105.5 105.4 105.4 104.1 104.1 104.0 103.9 and vegetable oils and fats 2018 105.1 104.2 104.4 103.6 104.7 104.8 105.7 105.7 105.7 105.7 105.7 105.7 105.7
Manufactured goods classified 2019 109.6 109.3 109.5 109.5 109.5 109.8 109.7 109.8 109.8 chiefly by material 2018 107.1 104.9 105.7 105.6 106.5 106.8 107.6 107.8 107.8 108.2 108.2 108.2 108.3
35 Prices, Inflation Rate, and Purchasing Power of the Peso
Continued

36
TABLE 1.4--Concluded
Indicator Year Average January February March April May June July August September October November December
Machinery and transport 2019 108.1 108.5 108.1 108.3 108.3 108.4 108.3 108.3 106.3 equipment 2018 105.1 104.6 105.0 104.9 105.2 105.2 105.2 105.2 105.2 105.2 105.2 105.2 105.2
Miscellaneous manufactured 2019 107.7 107.5 107.7 107.7 107.7 107.7 107.7 107.7 107.7 articles 2018 102.6 102.1 102.4 102.3 102.5 102.6 102.6 102.6 102.7 102.9 102.9 102.9 102.9
Source : Philippine Statistics Authority
Indicator Year Average January February March April May June July August September October November December
All items 2019 117.5 117.0 116.9 116.9 116.9 117.2 117.5 117.2 118.1 118.7 118.42018 114.3 112.1 112.6 113.2 113.8 113.8 113.9 113.8 114.1 114.3 115.4 116.9 117.1
Sand and gravel 2019 131.2 128.3 129.9 131.4 131.4 131.0 131.0 132.0 132.4 132.0 132.22018 120.7 117.9 118.0 118.3 118.6 118.6 119.5 119.7 119.8 120.0 125.1 126.0 127.3
Concrete products and Cement 2019 120.4 120.8 120.8 119.9 120.0 120.5 120.9 118.7 119.2 121.6 121.62018 115.5 114.0 114.3 114.6 114.6 114.6 114.6 113.7 113.7 114.0 116.3 120.5 120.8
Hardware 2019 115.5 113.9 113.9 114.5 114.5 114.8 116.6 116.4 116.4 116.4 117.42018 113.9 111.1 111.7 112.5 113.3 113.3 113.3 114.3 115.1 115.4 115.6 115.6 115.8
Plywood 2019 113.8 113.2 113.3 113.6 113.6 114.2 113.8 114.0 113.9 113.9 114.12018 111.7 110.0 111.1 111.1 111.6 111.6 111.8 111.5 111.7 112.5 112.5 112.6 112.1
Lumber 2019 126.8 125.1 125.4 126.0 125.7 127.0 127.4 127.6 127.6 127.6 128.22018 120.6 114.0 116.6 117.9 120.0 120.0 121.1 121.9 122.6 122.9 123.2 123.5 123.5
Galvanized Iron (G.I) sheets 2019 109.5 107.5 107.5 108.8 108.8 108.8 110.3 110.7 111.0 111.0 111.02018 107.0 106.8 107.5 107.5 107.5 107.4 106.0 106.7 106.9 106.9 107.0 107.1 107.1
Reinforcing and Structural Steel 2019 115.9 116.1 115.0 114.9 114.9 115.0 115.0 115.7 118.1 118.1 116.32018 115.6 112.3 113.3 114.4 115.5 115.7 115.8 115.8 116.6 116.8 116.4 117.0 117.2
Tileworks 2019 115.0 113.5 113.5 113.5 113.5 113.5 114.5 114.2 117.6 117.6 118.82018 112.9 111.3 111.2 113.0 113.0 113.0 113.0 113.2 113.1 113.1 113.6 113.6 113.5
(2012=100)
Prices, Inflation Rate, and Purchasing Power of the Peso
Continued
TABLE 1.5 Wholesale Price Index for Construction Materials in NCR: 2018 and 2019

TABLE 1.5--Concluded
Indicator Year Average January February March April May June July August September October November December
Glass and glass products 2019 104.9 104.9 104.9 104.9 104.9 104.9 104.9 104.9 104.9 104.9 104.92018 104.9 104.9 104.9 104.9 104.9 104.9 104.9 104.9 104.9 104.9 104.9 104.9 104.9
Doors, jambs, and steel casement 2019 109.9 110.8 111.0 109.5 109.5 109.5 109.8 109.8 109.8 109.8 109.82018 109.7 107.7 107.8 107.8 110.3 110.3 110.3 110.0 110.0 110.0 110.0 111.3 111.4
Electrical works 2019 123.1 121.1 121.9 122.5 123.4 123.6 124.1 123.5 123.3 123.3 124.12018 117.0 110.9 111.8 112.9 114.9 116.3 117.8 118.9 119.6 120.1 120.0 120.3 120.5
Plumbing fixtures and accessories/ 2019 124.3 122.8 122.8 123.4 123.6 124.5 125.1 125.0 125.2 125.2 125.8 waterworks 2018 119.4 118.5 119.1 118.9 119.1 119.1 119.0 119.7 119.7 119.7 119.7 120.0 120.0
Painting works 2019 104.8 104.5 104.5 104.7 104.7 104.7 104.7 105.1 104.9 105.1 105.32018 104.7 104.2 104.5 104.5 104.6 104.6 104.5 104.8 105.0 105.1 105.0 104.9 104.9
PVC pipes 2019 109.1 107.4 107.4 107.4 107.4 107.4 108.1 111.5 111.3 111.3 111.52018 107.1 106.6 106.7 106.7 106.7 106.7 106.7 107.1 107.5 107.5 107.5 107.5 107.5
Fuels and lubricants 2019 120.3 112.6 117.6 122.4 123.9 126.5 118.6 121.2 119.7 119.6 120.62018 117.7 109.4 112.1 112.6 114.8 117.4 119.5 119.3 119.8 123.6 125.8 120.4 117.3
Asphalt 2019 104.0 104.2 104.2 104.2 104.2 104.2 104.2 104.2 104.2 102.4 104.22018 104.2 104.2 104.2 104.2 104.2 104.2 104.2 104.2 104.2 104.2 104.2 104.2 104.2
Machinery and equipment rental 2019 146.9 146.9 146.9 146.9 146.9 146.9 146.9 146.9 146.9 146.9 146.92018 146.9 146.9 146.9 146.9 146.9 146.9 146.9 146.9 146.9 146.9 146.9 146.9 146.9
Source : Philippine Statistics Authority
Prices, Inflation Rate, and Purchasing Power of the Peso 37

38
Indicator Year Average January February March April May June July August September October November December
Total manufacturing 2019 136.7 139.7 138.9 139.6 137.0 r 135.9 135.7 134.7 136.0 135.1 r 134.22018 133.8 134.2 134.4 133.1 133.6 134.6 133.9 133.8 133.9 134.9 134.7 132.6 132.1
Food manufacturing 2019 180.0 181.8 181.0 180.8 180.4 179.9 180.3 180.1 179.1 178.5 r 178.32018 187.0 186.2 186.5 187.0 187.8 187.5 188.4 188.3 188.4 188.2 187.6 186.3 181.8
Beverages 2019 227.7 223.5 225.8 225.8 227.6 229.0 229.0 229.1 229.1 229.1 229.02018 221.0 219.9 219.9 220.0 220.0 220.0 221.1 222.1 221.1 222.1 222.1 222.1 222.1
Tobacco products 2019 313.4 294.4 315.2 315.1 315.2 315.1 315.5 315.6 316.4 316.0 315.62018 301.9 298.7 299.5 299.5 299.1 299.3 303.7 303.4 303.8 303.8 303.9 303.9 303.9
Textiles 2019 180.4 187.6 186.8 189.3 177.6 177.4 176.7 175.5 176.1 178.7 r 177.92018 180.8 175.1 177.4 180.3 180.3 179.3 179.9 181.9 182.0 180.1 184.7 186.3 181.7
Footwear and wearing apparel 2019 303.2 317.1 313.6 314.1 315.5 305.6 289.9 290.5 r 297.2 r 295.8 293.02018 323.8 316.3 322.6 320.6 320.2 326.1 321.9 315.4 326.9 332.8 331.1 329.8 322.1
Leather products 2019 101.5 110.3 110.4 111.0 112.5 106.5 88.8 100.1 98.3 94.1 r 83.42018 109.6 117.4 112.7 112.5 113.5 116.3 114.2 108.6 111.8 105.9 104.5 105.4 92.3
Wood and wood products 2019 81.3 84.8 82.7 84.7 80.5 83.1 81.2 78.2 80.6 78.3 r 78.52018 87.2 90.2 90.5 85.8 86.5 86.4 88.8 87.8 88.4 86.6 85.7 86.2 84.0
Paper and paper products 2019 123.9 125.3 124.7 124.9 124.5 124.8 123.1 r 122.5 r 122.0 123.8 123.42018 123.4 122.5 122.8 118.6 119.3 121.7 124.2 125.2 124.6 125.5 125.0 125.3 126.4
Printing 2019 333.6 333.6 333.6 333.6 333.6 333.6 333.6 333.6 333.6 333.6 333.62018 329.9 323.2 323.2 326.0 326.0 326.0 332.7 333.6 333.6 333.6 333.6 333.6 333.6
Petroleum products 2019 315.3 321.8 309.2 321.9 321.5 321.9 311.4 311.6 310.7 315.1 r 308.22018 332.0 345.5 319.1 318.0 336.1 331.1 333.9 334.9 333.2 343.3 341.7 327.7 319.0
Chemical products 2019 143.1 143.6 144.9 143.6 142.6 142.5 142.6 142.2 142.4 143.3 r 142.82018 151.5 151.7 150.7 151.6 151.0 151.2 150.9 151.8 152.3 151.5 151.7 152.0 151.8
Rubber and plastic products 2019 145.5 146.3 146.7 145.8 145.2 145.6 145.6 144.8 145.0 144.9 145.12018 139.1 137.4 137.4 138.0 138.0 138.2 138.4 139.4 139.5 139.9 140.3 141.4 140.7
Rubber products 2019 76.4 76.7 76.7 76.6 75.9 76.4 76.2 76.1 76.5 76.4 76.12018 73.5 72.7 72.1 72.2 72.2 72.3 73.3 73.9 73.9 74.3 74.2 75.0 75.4
Plastic products 2019 182.8 184.0 184.6 183.0 182.8 183.0 183.2 181.8 181.5 181.6 182.32018 181.5 179.3 180.0 181.1 181.2 181.5 180.4 181.6 181.7 182.1 182.9 184.1 182.2
TABLE 1.6 Producers Price Index for Manufacturing: Philippines, 2018 and 2019
Continued
Prices, Inflation Rate, and Purchasing Power of the Peso
(2000=100)

TABLE 1.6--Concluded
Indicator Year Average January February March April May June July August September October November December
Non-metallic mineral products 2019 160.0 159.8 162.0 162.0 160.3 160.2 158.7 r 159.9 r 159.3 r 159.1 r 158.52018 148.8 143.0 144.0 145.0 144.7 144.2 147.2 147.1 153.9 153.1 156.2 153.2 153.5
Glass and glass products 2019 125.0 124.9 124.3 125.1 124.5 124.9 125.0 125.8 125.8 125.4 123.92018 121.3 112.6 121.4 122.0 121.8 122.0 121.7 121.7 122.2 123.1 122.6 122.0 122.0
Cement 2019 169.6 169.0 173.8 172.8 171.9 170.9 167.1 r 167.7 167.6 167.1 168.52018 164.6 160.4 159.3 161.2 160.7 158.0 164.1 164.9 168.7 166.5 173.8 168.7 168.5
Miscellaneous non-metallic 2019 155.3 155.5 155.9 156.7 153.9 154.6 154.8 r 157.0 r 155.7 r 155.8 153.4 products 2018 139.4 132.8 133.4 133.5 133.4 135.3 135.9 134.7 147.4 147.7 146.9 145.5 146.6
Basic metals 2019 164.3 168.7 165.7 168.5 165.7 164.2 163.9 161.8 162.1 r 161.8 r 160.62018 175.2 174.1 175.0 175.1 178.9 178.9 174.5 175.0 175.7 175.6 174.6 176.0 169.1
Iron and steel 2019 190.5 194.9 192.8 194.6 193.4 191.6 189.1 188.5 r 189.3 r 186.4 r 184.72018 198.0 191.9 194.8 195.6 197.7 198.5 201.6 202.0 201.4 198.7 199.3 198.3 195.9
Non-ferrous metal 2019 136.7 141.0 137.3 140.9 136.8 135.6 137.2 133.8 133.8 135.7 r 135.02018 154.3 157.7 156.7 156.0 161.4 160.7 149.9 150.5 152.1 154.2 151.9 155.4 144.9
Fabricated metal products 2019 69.6 75.9 75.5 75.6 75.4 63.8 66.2 65.7 66.1 66.1 65.72018 73.2 74.8 73.6 72.2 73.5 73.3 71.5 71.4 71.3 73.9 74.0 74.4 74.7
Machinery excluding electrical 2019 93.0 97.5 93.8 93.0 92.7 93.3 92.8 90.1 93.3 92.2 90.92018 93.9 90.9 91.1 91.4 90.8 92.1 95.2 95.2 95.6 96.7 96.2 95.2 96.7
Electrical machinery 2019 122.5 124.5 123.9 125.9 123.1 122.8 123.0 119.3 121.0 121.3 120.62018 123.3 120.4 121.2 120.8 121.1 122.7 123.2 124.5 125.4 126.9 126.0 123.7 124.1
Transport equipment 2019 115.8 120.0 120.8 122.0 112.4 113.0 113.4 114.2 116.4 113.2 r 112.52018 116.8 115.7 117.3 116.8 116.7 117.7 117.2 117.7 116.6 117.6 117.9 115.8 114.5
Furniture and fixtures 2019 10.9 11.1 11.0 11.0 11.0 10.8 10.9 10.8 11.0 10.9 10.82018 6.9 7.5 7.7 7.2 7.1 7.3 6.8 6.6 6.7 6.7 6.7 6.4 6.5
Miscellaneous manufactures 2019 83.8 84.5 84.3 84.5 83.8 r 84.0 r 83.1 r 82.6 r 84.3 r 83.7 r 82.82018 86.1 88.0 88.3 88.7 89.3 90.6 89.6 90.5 80.5 82.4 82.0 80.9 81.9
Source : Philippine Statistics Authority
39 Prices, Inflation Rate, and Purchasing Power of the Peso

40
Indicator Year Average January February March April May June July August September October November December
Inflation Rate
Philippines 2019 2.5 4.4 3.8 3.3 3.0 3.2 2.7 2.4 1.7 0.9 0.8 1.3 2018 5.2 3.4 3.9 4.3 4.5 4.6 5.2 5.7 6.4 6.7 6.7 6.0 5.1
National Capital Region 2019 2.6 4.6 3.8 3.2 3.1 3.4 3.0 2.3 1.4 0.9 1.3 1.5 2018 5.6 4.7 4.7 5.2 5.2 4.9 5.8 6.5 7.0 6.3 6.1 5.6 4.8
Areas Outside NCR 2019 2.5 4.4 3.8 3.4 3.0 3.1 2.6 2.4 1.8 0.9 0.7 1.2 2018 5.1 3.1 3.6 4.1 4.3 4.6 5.1 5.5 6.2 6.8 6.8 6.2 5.3
Purchasing Power of the Peso (1/Consumer Price Index x 100)
Philippines 2019 0.8 0.8 0.8 0.8 0.8 0.8 0.8 0.8 0.8 0.8 0.8 0.8 2018 0.9 0.9 0.9 0.9 0.9 0.9 0.9 0.9 0.8 0.8 0.8 0.8 0.8
National Capital Region 2019 0.8 0.9 0.9 0.9 0.8 0.8 0.8 0.8 0.8 0.8 0.8 0.8 2018 0.9 0.9 0.9 0.9 0.9 0.9 0.9 0.9 0.9 0.9 0.9 0.9 0.9
Areas Outside NCR 2019 0.8 0.8 0.8 0.8 0.8 0.8 0.8 0.8 0.8 0.8 0.8 0.8 2018 0.8 0.9 0.9 0.9 0.9 0.9 0.9 0.8 0.8 0.8 0.8 0.8 0.8
Source : Philippine Statistics Authority
TABLE 1.7 Inflation Rate and Purchasing Power of the Peso by Area: 2018 and 2019
Prices, Inflation Rate, and Purchasing Power of the Peso
(2012=100)

CHAPTER II Trade

Trade 43
Indicator Year Total January February March April May June July August September October November December
Export Value 2019 58,642.32 5,278.98 5,177.45 5,876.43 5,506.24 6,154.90 6,007.69 6,174.37 6,250.91 5,898.02 6,317.33 p
All commodities 2018 68,617.28 5,372.87 5,225.71 6,024.47 5,481.97 5,761.74 5,916.49 5,966.51 6,216.23 6,052.78 6,308.84 r 5,568.79 4,720.88
Electronic products 2019 33,181.39 2,791.44 2,816.93 3,230.83 3,121.00 3,449.80 3,543.29 3,432.61 3,658.62 3,593.69 3,543.18 p
2018 37,969.19 2,744.73 2,795.18 3,354.18 3,030.92 3,248.33 3,397.19 3,335.42 3,433.47 3,461.68 3,309.91 r 3,155.51 2,702.67
Other manufactured goods 2019 3,535.52 312.85 296.68 329.33 332.33 397.86 342.72 381.47 330.63 318.45 493.20 p
2018 4,340.67 369.29 339.33 358.49 319.55 420.40 363.24 360.99 401.98 339.94 471.51 r 310.67 285.28
Ignition wiring sets and other 2019 1,906.42 195.83 172.17 195.01 187.03 190.01 176.51 202.54 188.47 183.68 215.17 p
wiring sets used in vehicles, 2018 1,984.69 126.74 178.67 162.13 163.33 144.32 150.14 172.23 175.14 197.55 210.97 r 151.33 152.14 aircrafts, and ships 1/
Machinery and transport 2019 2,370.77 317.66 194.72 249.92 232.26 194.08 230.53 252.17 218.20 275.75 205.48 p
equipment 2018 3,397.73 418.81 233.74 278.30 180.78 475.22 223.75 203.56 244.61 344.49 358.31 r 276.94 159.22
Bananas, fresh 2019 1,612.37 160.57 124.11 186.89 174.67 176.04 152.58 147.83 122.34 189.36 177.98 p
2018 1,437.23 70.50 80.29 102.99 98.87 136.90 122.63 109.86 124.01 121.75 153.85 r 156.27 159.31
Other mineral products 2019 1,204.73 78.21 82.14 106.18 116.17 141.28 111.51 143.58 137.08 130.26 158.32 p
2018 1,153.57 48.18 61.74 93.49 131.87 131.99 110.26 133.11 149.42 68.69 85.62 r 81.70 57.50
Travel goods and handbags 2019 614.82 39.45 50.66 50.14 40.79 52.05 54.19 72.24 62.29 63.73 129.28 p
2018 506.00 44.87 39.13 48.35 44.22 49.85 50.04 64.75 54.73 59.54 50.52 r
Metal components 2019 1,188.78 126.91 124.66 124.11 113.62 128.08 123.38 112.69 114.32 94.17 126.84 p
2018 1,668.46 197.79 172.61 125.58 155.99 112.35 138.69 127.80 118.73 126.84 152.27 r 120.17 119.64
Chemicals 2019 1,084.79 92.49 123.84 130.33 116.67 131.33 96.08 113.52 111.42 64.07 105.04 p
2018 1,363.42 87.76 123.82 123.06 134.01 109.37 118.76 116.47 132.77 100.47 128.69 r 102.59 85.65
Gold 2/ 2019 1,120.45 122.09 90.33 120.91 123.06 111.66 102.76 140.58 121.73 92.81 94.52 p
2018 1,122.32 183.17 110.71 107.36 90.43 103.13 93.33 102.51 63.02 94.52 61.80 r 52.72 59.62
1/ consists only of electrical wiring harness for motor vehicles2/ extracted from copper
Source : Philippine Statistics Authority
TABLE 2.1 Total Value of Merchandise Exports of Top 10 Commodity: 2018 and 2019(F.O.B in Million US $)

44 Trade
Indicator Year Total January February March April May June July August September October November December
Import Value 2019 89,741.81 9,034.81 7,965.59 9,013.94 9,005.27 9,429.52 8,480.29 9,567.48 8,659.70 9,017.49 9,567.72 p
All commodities 2018 111,825.69 8,535.65 7,762.25 8,364.28 9,180.81 9,972.39 9,469.46 9,982.73 9,814.79 10,076.42 10,724.29 r 9,469.40 8,473.22
Electronic products 1/ 2019 23,502.83 2,351.68 2,039.36 2,394.15 2,358.20 2,462.51 2,386.16 2,455.45 2,349.14 2,283.85 2,422.33 p
2018 28,523.47 2,259.34 2,127.17 2,248.58 2,312.19 2,415.07 2,343.32 2,328.29 2,500.11 2,457.59 2,744.29 r 2,556.58 2,230.94
Transport equipment 2019 9,042.50 851.88 964.18 720.20 725.24 834.20 910.90 1,062.21 860.88 948.61 1,164.20 p
2017 12,153.60 637.56 741.95 754.89 1,003.05 1,034.17 1,042.08 1,206.40 1,214.39 1,028.84 1,205.49 r 948.69 1,336.09
Mineral fuels, lubricants, 2019 10,691.48 820.54 941.35 1,091.13 1,217.88 1,182.52 1,066.00 1,113.99 1,043.56 1,092.17 1,122.34 p
and related products 2018 13,844.99 911.09 814.76 1,248.52 892.52 1,428.40 1,146.50 1,303.33 1,184.98 1,277.16 1,293.79 r 1,206.82 1,137.12
Industrial machinery and 2019 5,333.52 607.13 500.58 562.27 548.58 560.18 453.04 570.57 482.61 532.07 516.49 p
equipment 2018 6,753.75 580.22 538.70 505.88 613.68 588.26 571.53 579.54 570.01 538.54 604.50 r 532.09 530.80
Iron and steel 2019 407.62 407.62 329.82 414.05 421.38 442.88 341.67 332.23 300.27 305.69 361.60 p
2018 5,762.57 446.68 395.44 452.55 491.19 594.33 572.11 517.22 538.12 574.40 529.51 r 449.73 382.67
Other food and live animals 2019 2,674.77 276.21 228.97 317.99 307.61 302..01 262.08 306.97 292.24 331.45 351.25 p
2018 3,472.33 261.62 208.99 238.25 298.01 313.52 280.96 273.25 305.75 326.10 372.10 r 346.28 247.50
Miscellaneous manufactured 2019 3,033.78 310.69 236.46 255.08 290.79 308.53 275.63 335.76 332.63 352.14 336.07 p
articles 2018 3,329.19 268.37 263.84 183.60 262.01 285.28 276.00 282.44 266.29 317.11 345.46 r 329.79 249.00
Telecommunications equipment 2019 2,461.86 268.39 218.97 256.76 225.79 252.58 201.73 246.48 253.26 263.44 274.46 p
and electrical machinery 2/ 2018 2,784.00 250.22 203.43 187.13 227.96 252.15 229.71 252.49 227.34 235.17 261.52 r 240.31 216.57
Plastics in primary and 2019 2,166.81 232.36 188.32 235.04 215.53 205.56 196.59 231.98 210.09 224.28 227.06 p
non-primary forms 2018 2,708.03 209.23 190.79 205.88 251.30 238.33 235.23 230.92 230.18 247.64 256.52 r 228.77 183.24
Cereals and cereal 2019 2,657.21 414.18 259.30 274.90 226.88 335.12 193.77 234.12 216.37 288.23 214.34 p
preparations 2018 2,821.24 226.98 201.90 138.91 168.44 194.77 274.40 220.90 282.65 369.47 261.81 r 263.53 217.48
1/ includes consigned and edited importation using the expanded coverage of electronic products2/ includes telecommunications and sound recording and reproducing apparatus and equipment
Source : Philippine Statistics Authority
TABLE 2.2 Total Value of Merchandise Imports of Top 10 Commodity: 2018 and 2019 (F.O.B in Million US $)

Trade 45
Indicator Year Total January February March April May June July August September October November December
Trade value by selected country (in million US dollars)
Total trade 2019 148,384.11 14,313.79 13,143.04 14,890.37 14,511.51 15,584.42 14,487.97 15,741.85 14,910.61 14,915.51 15,885.04 Import 89,741.81 9,034.81 7,965.59 9,013.94 9,005.27 9,429.52 8,480.29 9,567.48 8,659.70 9,017.49 9,567.72 p
Export 58,642.32 5,278.98 5,177.45 5,876.43 5,506.24 6,154.90 6,007.69 6,174.37 6,250.91 5,898.02 6,317.33 p
Balance of trade (24,598.69) (3,755.82) (2,788.14) (3,137.51) (3,499.02) (3,274.62) (2,472.60) (3,393.11) (2,408.79) (3,119.47) 3,250.39
Total trade 2018 174,915.54 13,754.43 12,384.17 13,627.77 13,843.74 15,224.24 14,750.60 15,248.71 15,840.47 15,581.05 16,428.07 15,038.19 13,194.10 Import 108,710.27 8,535.65 7,724.71 8,117.85 8,729.21 9,462.49 9,050.21 9,397.39 9,676.98 9,753.15 10,320.01 9,469.40 8,473.22 Export 66,204.51 5,218.78 4,659.47 5,509.92 5,114.53 5,761.74 5,700.39 5,851.32 6,163.49 5,827.15 6,108.05 5,568.79 4,720.88 Balance of trade (42,506.49) (3,316.87) (3,065.24) (2,607.92) (3,614.68) (3,700.75) (3,349.82) (3,546.06) (3,513.49) (3,926.76) (4,211.96) (3,900.60) (3,752.34)
China, People's Republic of Total trade 2019 28,171.75 2,646.23 2,282.28 2,656.92 2,953.38 3,042.38 2,754.62 3,057.11 2,948.27 2,908.92 2,921.64 Import 20,186.18 2,005.44 1,617.47 1,924.77 2,148.99 2,145.43 1,929.77 2,196.92 2,004.04 2,128.68 2,084.67 p
Export 7,985.57 640.79 664.81 732.15 804.39 896.95 824.85 860.19 944.23 780.24 836.97 p
Balance of trade (12,200.62) (1,364.65) (952.67) (1,192.62) (1,344.59) (1,248.48) (1,104.92) (1,336.74) (1,059.81) (1,348.44) (1,247.70)
Total trade 2018 29,760.96 2,202.49 2,061.98 1,914.23 2,342.72 2,685.07 2,664.52 2,632.40 2,864.10 2,580.38 2,933.49 2,453.01 2,426.57 Import 21,407.11 1,610.58 1,540.93 1,238.02 1,752.85 1,923.67 1,934.75 1,859.38 1,924.12 1,857.76 2,128.96 1,766.44 1,869.65 Export 8,353.84 591.91 521.04 676.21 589.87 761.40 729.77 773.01 939.98 722.62 804.53 686.57 556.93 Balance of trade (13,053.27) (1,018.67) (1,019.89) (561.80) (1,162.98) (1,162.26) (1,204.99) (1,086.37) (984.13) (1,135.14) (1,324.44) (1,079.88) (1,312.72)
Japan 1/
Total trade 2019 17,338.06 1,673.95 1,692.63 1,775.08 1,608.72 1,684.47 1,696.79 1,849.76 1,670.35 1,788.94 1,897.37 Import 8,477.20 789.00 859.65 882.87 827.73 822.32 822.60 915.14 800.32 831.88 925.69 p
Export 8,860.84 884.95 832.98 892.20 780.99 862.15 874.18 934.62 870.03 957.06 971.68 p
Balance of trade 383.63 95.95 (26.67) 9.33 (46.74) 39.82 51.58 19.48 69.71 125.18 45.99
Total trade 2018 19,906.95 1,735.79 1,485.37 1,665.84 1,662.66 1,657.58 1,674.68 1,710.50 1,704.57 1,607.82 1,768.99 1,722.35 1,510.80 Import 10,552.74 840.75 804.61 891.21 958.19 901.27 881.00 911.48 857.93 858.44 918.53 903.28 826.05 Export 9,354.21 895.04 680.76 774.63 704.47 756.31 793.69 799.02 846.64 749.38 850.45 819.07 684.75 Balance of trade (1,198.53) 54.29 (123.84) (116.57) (253.73) (144.96) (87.31) (112.46) (11.29) (109.06) (68.08) (84.21) (141.31)
USA 2/
Total trade 2019 16,038.12 1,484.55 1,430.98 1,618.76 1,570.93 1,791.70 1,577.34 1,679.88 1,601.85 1,547.65 1,734.48 Import 6,418.05 650.68 529.11 712.43 663.95 710.60 602.98 635.03 609.13 643.50 660.64 p
Export 9,620.06 833.87 901.86 906.33 906.98 1,081.10 974.36 1,044.85 992.72 904.15 1,073.84 p
Balance of trade 3,202.03 183.19 372.75 193.90 243.03 370.51 371.38 409.82 383.60 260.65 413.20
Total trade 2018 18,183.99 1,446.57 1,262.70 1,489.76 1,433.92 1,529.85 1,476.65 1,625.66 1,647.58 1,604.72 1,718.57 1,515.95 1,432.06 Import 7,816.96 701.65 557.50 624.51 644.38 689.71 592.00 653.14 713.54 638.37 721.71 622.75 657.70 Export 10,367.05 744.92 705.20 865.25 789.54 840.15 884.65 972.52 934.04 966.35 996.86 893.20 774.37 Balance of trade 2,550.08 43.27 147.70 240.73 145.16 150.44 292.66 319.38 220.50 327.98 275.14 270.45 116.67
1/ includes Okinawa2/ includes Alaska and Hawaii Continued
(F.O.B in Million US $)TABLE 2.3 Total Value of Trade of Top 10 Country: 2018 and 2019

46 Trade
TABLE 2.3--Continued
Indicator Year Total January February March April May June July August September October November December
Hong Kong Total trade 2019 10,898.43 951.76 825.37 1,092.53 994.72 1,093.49 1,107.73 1,175.83 1,258.96 1,181.84 1,216.20 Import 2,952.28 306.59 168.14 263.51 289.90 328.66 295.20 332.93 320.69 313.25 333.41 p
Export 7,946.15 645.17 657.24 829.02 704.82 764.83 812.53 842.90 938.26 868.59 882.79 p
Balance of trade 4,993.87 338.58 489.10 565.51 414.92 436.18 517.33 509.97 617.57 555.33 549.38
Total trade 2018 11,417.88 943.12 837.11 1,055.35 1,107.78 1,079.08 116.10 1,127.64 1,121.40 1,074.89 1,051.17 1,018.74 885.50 Import 3,021.87 216.88 201.07 207.74 270.02 282.61 264.90 267.66 269.47 252.18 276.89 289.73 222.72 Export 9,445.98 726.24 636.04 847.60 837.76 796.47 901.20 859.98 851.94 822.70 774.27 729.01 662.77 Balance of trade 6,424.12 509.36 434.97 639.86 567.75 513.86 636.30 592.32 582.47 570.52 497.38 439.28 440.05
Korea, Republic of Total trade 2019 9,674.56 994.98 858.21 993.02 963.43 978.01 980.69 1,065.08 861.50 955.65 1,023.99 Import 6,980.06 789.56 657.05 701.86 710.41 750.06 678.10 794.17 586.30 626.21 686.34 p
Export 2,694.53 205.43 201.17 291.17 253.02 227.95 302.59 270.92 275.20 329.43 337.65 p
Balance of trade (4,285.52) (584.13) (455.88) (410.69) (457.39) (522.10) (375.51) (523.25) (311.10) (296.78) (348.69)
Total trade 2018 13,660.64 1,118.15 922.77 1,015.68 1,115.96 1,252.90 1,072.18 1,109.90 1,131.96 1,292.50 1,332.11 1,351.70 944.83 Import 11,162.21 899.99 765.66 830.88 958.48 978.61 886.31 936.49 932.21 1,090.02 1,078.10 1,029.90 775.56 Export 2,498.44 218.16 157.11 184.80 157.48 274.29 185.87 173.42 199.75 202.48 254.00 321.80 169.28 Balance of trade (8,663.77) (681.83) (608.55) (646.08) (801.00) (704.32) (700.44) (763.07) (732.45) (887.54) (824.10) (708.11) (606.28)
Singapore Total trade 2019 8,573.45 738.03 670.03 848.46 831.21 994.69 854.36 1,021.09 882.98 823.46 909.14 Import 5,442.55 439.60 414.65 525.78 555.89 665.53 518.12 701.40 529.45 506.05 586.08 p
Export 3,130.91 298.43 255.37 322.68 275.33 329.17 336.24 319.69 353.53 317.41 323.06 p
Balance of trade (2,311.64) (141.17) (159.28) (203.10) (280.56) (336.36) (181.87) (381.71) (175.92) (188.64) (263.03)
Total trade 2018 10,154.10 825.43 816.10 860.37 821.81 881.49 909.83 852.02 903.98 836.33 889.44 802.56 754.74 Import 6,020.39 506.58 459.86 516.23 480.02 515.10 547.10 507.58 494.17 486.91 537.71 496.13 473.00 Export 4,133.73 318.85 356.24 344.14 341.78 366.39 362.74 344.44 409.81 349.42 351.74 306.44 281.74 Balance of trade (1,886.68) (187.73) (103.62) (172.10) (138.24) (148.71) (184.36) (163.14) (84.37) (137.49) (185.97) (189.69) (191.26)
Thailand Total trade 2019 8,155.44 844.60 767.54 811.35 723.84 887.08 773.78 804.90 795.30 839.91 907.14 Import 5,706.92 602.67 560.94 551.71 475.91 613.97 521.37 555.01 548.53 621.31 655.50 p
Export 2,448.53 241.93 206.60 259.64 247.93 273.11 252.41 249.89 246.77 218.61 251.64 p
Balance of trade (3,258.41) (360.73) (354.34) (292.08) (227.99) (340.86) (268.97) (305.12) (301.76) (402.70) (403.86)
Total trade 2018 10,304.37 743.58 863.41 811.40 806.29 885.71 924.92 898.29 987.11 901.74 888.40 812.44 781.08 Import 7,623.05 539.65 650.98 574.90 602.54 655.85 692.63 653.96 756.68 684.79 639.80 599.71 571.56 Export 2,681.30 203.94 212.43 236.49 203.75 229.86 232.28 244.33 230.43 216.96 248.59 212.73 209.51 Balance of trade (4,941.76) (335.71) (438.55) (338.41) (398.79) (426.00) (460.35) (409.63) (526.25) (467.83) (391.21) (386.98) (362.05)
Continued
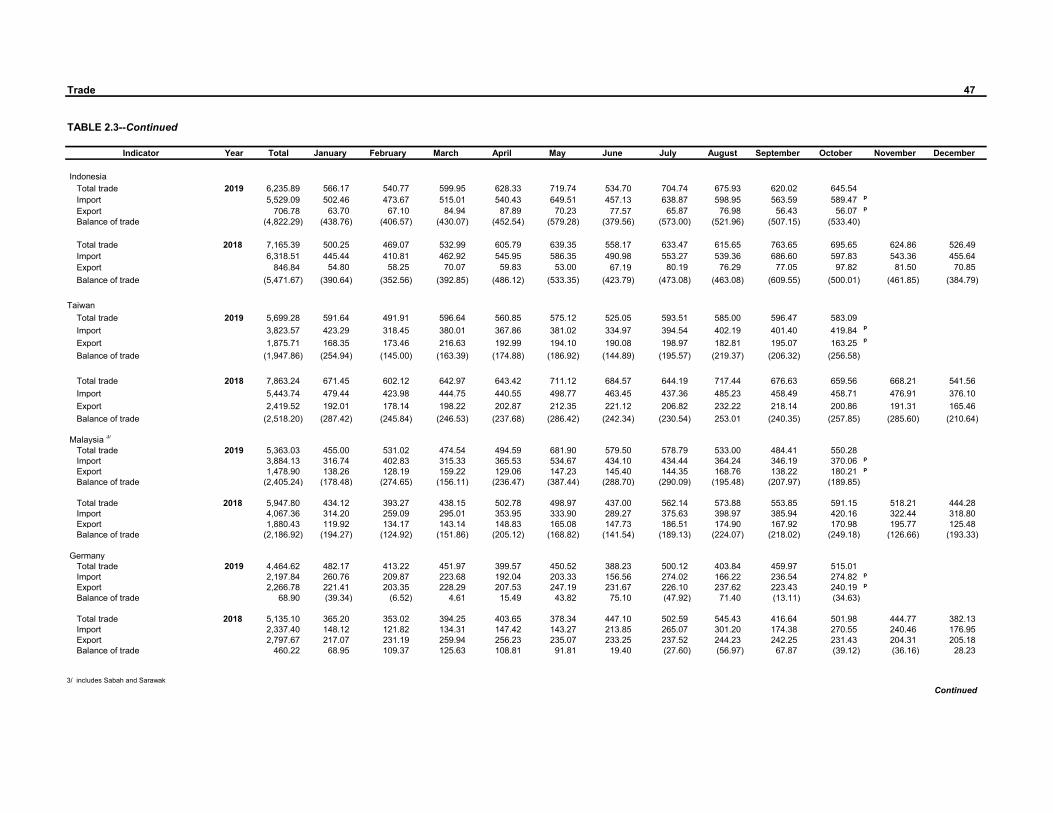
Trade 47
TABLE 2.3--Continued
Indicator Year Total January February March April May June July August September October November December
Indonesia Total trade 2019 6,235.89 566.17 540.77 599.95 628.33 719.74 534.70 704.74 675.93 620.02 645.54 Import 5,529.09 502.46 473.67 515.01 540.43 649.51 457.13 638.87 598.95 563.59 589.47 p
Export 706.78 63.70 67.10 84.94 87.89 70.23 77.57 65.87 76.98 56.43 56.07 p
Balance of trade (4,822.29) (438.76) (406.57) (430.07) (452.54) (579.28) (379.56) (573.00) (521.96) (507.15) (533.40)
Total trade 2018 7,165.39 500.25 469.07 532.99 605.79 639.35 558.17 633.47 615.65 763.65 695.65 624.86 526.49 Import 6,318.51 445.44 410.81 462.92 545.95 586.35 490.98 553.27 539.36 686.60 597.83 543.36 455.64 Export 846.84 54.80 58.25 70.07 59.83 53.00 67.19 80.19 76.29 77.05 97.82 81.50 70.85 Balance of trade (5,471.67) (390.64) (352.56) (392.85) (486.12) (533.35) (423.79) (473.08) (463.08) (609.55) (500.01) (461.85) (384.79)
Taiwan Total trade 2019 5,699.28 591.64 491.91 596.64 560.85 575.12 525.05 593.51 585.00 596.47 583.09 Import 3,823.57 423.29 318.45 380.01 367.86 381.02 334.97 394.54 402.19 401.40 419.84 p
Export 1,875.71 168.35 173.46 216.63 192.99 194.10 190.08 198.97 182.81 195.07 163.25 p
Balance of trade (1,947.86) (254.94) (145.00) (163.39) (174.88) (186.92) (144.89) (195.57) (219.37) (206.32) (256.58)
Total trade 2018 7,863.24 671.45 602.12 642.97 643.42 711.12 684.57 644.19 717.44 676.63 659.56 668.21 541.56 Import 5,443.74 479.44 423.98 444.75 440.55 498.77 463.45 437.36 485.23 458.49 458.71 476.91 376.10 Export 2,419.52 192.01 178.14 198.22 202.87 212.35 221.12 206.82 232.22 218.14 200.86 191.31 165.46 Balance of trade (2,518.20) (287.42) (245.84) (246.53) (237.68) (286.42) (242.34) (230.54) 253.01 (240.35) (257.85) (285.60) (210.64)
Malaysia 3/
Total trade 2019 5,363.03 455.00 531.02 474.54 494.59 681.90 579.50 578.79 533.00 484.41 550.28 Import 3,884.13 316.74 402.83 315.33 365.53 534.67 434.10 434.44 364.24 346.19 370.06 p
Export 1,478.90 138.26 128.19 159.22 129.06 147.23 145.40 144.35 168.76 138.22 180.21 p
Balance of trade (2,405.24) (178.48) (274.65) (156.11) (236.47) (387.44) (288.70) (290.09) (195.48) (207.97) (189.85)
Total trade 2018 5,947.80 434.12 393.27 438.15 502.78 498.97 437.00 562.14 573.88 553.85 591.15 518.21 444.28 Import 4,067.36 314.20 259.09 295.01 353.95 333.90 289.27 375.63 398.97 385.94 420.16 322.44 318.80 Export 1,880.43 119.92 134.17 143.14 148.83 165.08 147.73 186.51 174.90 167.92 170.98 195.77 125.48 Balance of trade (2,186.92) (194.27) (124.92) (151.86) (205.12) (168.82) (141.54) (189.13) (224.07) (218.02) (249.18) (126.66) (193.33)
Germany Total trade 2019 4,464.62 482.17 413.22 451.97 399.57 450.52 388.23 500.12 403.84 459.97 515.01 Import 2,197.84 260.76 209.87 223.68 192.04 203.33 156.56 274.02 166.22 236.54 274.82 p
Export 2,266.78 221.41 203.35 228.29 207.53 247.19 231.67 226.10 237.62 223.43 240.19 p
Balance of trade 68.90 (39.34) (6.52) 4.61 15.49 43.82 75.10 (47.92) 71.40 (13.11) (34.63)
Total trade 2018 5,135.10 365.20 353.02 394.25 403.65 378.34 447.10 502.59 545.43 416.64 501.98 444.77 382.13 Import 2,337.40 148.12 121.82 134.31 147.42 143.27 213.85 265.07 301.20 174.38 270.55 240.46 176.95 Export 2,797.67 217.07 231.19 259.94 256.23 235.07 233.25 237.52 244.23 242.25 231.43 204.31 205.18 Balance of trade 460.22 68.95 109.37 125.63 108.81 91.81 19.40 (27.60) (56.97) 67.87 (39.12) (36.16) 28.23
3/ includes Sabah and SarawakContinued

48 Trade
TABLE 2.3--Concluded
Indicator Year Total January February March April May June July August September October November December
Vietnam Total trade 2019 4,064.78 446.29 330.07 469.94 462.97 467.03 392.67 378.35 382.77 404.57 330.12 Import 3,012.91 356.86 223.85 337.61 351.09 357.98 289.09 273.54 281.67 320.86 220.36 p
Export 1,051.86 89.43 106.22 132.33 111.88 109.05 103.58 104.81 101.10 83.70 109.76 p
Balance of trade (1,961.05) (267.43) (117.64) (205.28) (239.21) (248.93) (185.51) (168.73) (180.56) (237.16) (110.60)
Total trade 2018 3,072.36 266.23 206.18 295.51 250.73 271.04 272.78 223.14 262.56 299.60 242.43 253.89 228.27 Import 615.26 56.66 43.63 46.16 52.05 64.92 49.86 52.68 40.76 60.44 50.78 46.13 51.19 Export 2,457.09 209.57 162.55 249.35 198.68 206.13 222.92 170.46 221.79 239.16 191.65 207.76 177.07 Balance of trade 1,841.84 152.91 118.93 203.19 146.62 141.21 173.06 117.78 181.03 178.72 140.87 161.64 125.88
Netherlands Total trade 2019 2,458.03 251.45 238.10 220.01 267.16 242.16 248.55 262.60 256.03 221.28 250.69 Import 526.07 50.89 44.28 60.55 52.67 45.28 43.81 48.04 57.29 50.19 73.07 p
Export 1,931.94 200.56 193.81 159.46 214.49 196.88 204.74 214.56 198.75 171.08 177.61 p
Balance of trade 1,405.87 149.67 149.53 98.91 161.82 151.60 160.93 166.52 141.46 120.89 104.54
Total trade 2018 3,072.36 266.23 206.18 295.51 250.73 271.04 272.78 223.14 262.56 299.60 242.43 253.89 228.27 Import 615.26 56.66 43.63 46.16 52.05 64.92 49.86 52.68 40.76 60.44 50.78 46.13 51.19 Export 2,457.09 209.57 162.55 249.35 198.68 206.13 222.92 170.46 221.79 239.16 191.65 207.76 177.07 Balance of trade 1,841.84 152.91 118.93 203.19 146.62 141.21 173.06 117.78 181.03 178.72 140.87 161.64 125.88
Note : Details may not add up to total due to rounding.
Source : Philippine Statistics Authority

CHAPTER III Industrial Production

Industrial Production
Indicator Year Average January February March April May June July August September October November December
Total manufacturing 2019 189.1 193.0 190.4 205.3 183.2 r 191.6 r 184.2 184.6 r 180.3 r 185.0 r 193.5 2018 200.9 193.7 203.1 214.8 207.7 205.6 199.7 195.3 197.4 191.6 202.2 201.7 197.7
Food manufacturing 2019 289.2 300.3 298.9 331.7 283.2 295.5 286.7 r 282.3 r 274.9 r 255.4 r 283.22018 312.2 327.4 370.9 390.6 370.8 363.7 301.4 265.0 269.0 255.0 267.6 275.3 289.9
Processed meat and fish 2019 165.0 153.0 138.4 164.2 145.2 180.9 158.1 178.8 172.8 r 173.4 r 185.12018 161.0 152.5 150.7 153.9 140.7 159.8 171.0 183.9 170.5 159.4 173.0 165.1 150.9
Processed fruits and 2019 459.4 418.2 380.1 415.4 394.0 396.3 487.2 562.4 677.3 424.6 r 438.6 vegetables 2018 430.3 376.6 389.2 433.4 419.3 425.8 509.4 468.7 422.7 385.2 384.2 406.1 542.9
Vegetable or animal 2019 93.2 102.2 96.0 96.8 91.1 93.1 87.7 90.7 82.2 r 89.7 102.0 oils and fats 2018 116.9 149.3 137.9 141.7 111.8 113.5 102.2 105.3 114.9 112.3 104.7 106.5 102.8
Milk and dairy products 2019 408.1 391.6 389.6 445.6 395.2 401.9 395.5 418.6 414.6 r 395.0 r 433.32018 389.0 351.0 384.5 385.7 391.3 361.5 374.2 420.2 417.6 404.9 424.5 421.3 331.8
Grain mill products 2019 292.3 299.0 287.3 304.5 272.7 300.5 285.8 r 298.7 r 289.5 r 285.5 r 299.12018 292.4 254.6 268.6 283.4 277.9 303.0 271.7 289.0 315.4 287.9 326.1 317.7 313.1
Animal feeds 2019 438.6 497.9 394.4 423.6 420.9 460.1 457.4 438.8 439.2 400.9 r 452.62018 399.4 367.9 344.6 373.1 403.1 392.8 396.2 401.8 429.9 415.3 461.8 429.7 376.6
Bakery products 2019 575.8 444.6 598.8 601.7 548.8 588.5 568.2 614.4 592.8 r 591.4 r 608.42018 428.1 412.9 416.2 433.9 393.2 420.6 421.6 435.3 452.0 406.6 436.8 445.2 462.8
Milled and refined sugar 2019 508.9 805.4 812.7 883.1 607.7 578.4 473.5 241.0 131.8 208.5 r 347.02018 909.1 1,150.2 1,553.4 1,631.4 1,529.0 1,428.2 795.5 356.6 399.8 411.6 426.4 517.6 709.1
Coconut products 2019 349.1 317.6 329.0 462.5 378.5 314.9 381.1 345.4 337.1 335.4 289.42018 441.7 482.7 240.4 678.4 476.3 497.4 436.2 407.2 534.9 413.1 348.8 362.8 422.6
Miscellaneous foods 2019 110.6 78.7 82.0 115.2 106.1 119.4 120.0 131.8 113.1 119.7 r 119.82018 89.9 104.6 114.4 106.6 111.6 111.8 74.7 77.3 78.2 72.1 80.5 77.0 70.4
Beverages 2019 369.4 342.9 330.0 385.5 344.7 391.9 419.4 368.4 348.6 r 383.1 r 379.02018 339.2 309.1 271.3 350.7 355.3 353.7 348.0 344.6 350.7 333.6 356.1 341.0 356.1
Tobacco products 2019 13.4 10.2 10.5 11.2 10.6 14.8 14.2 15.9 14.8 15.1 r 16.42018 11.5 9.3 10.3 11.0 14.6 12.4 14.3 11.1 9.2 9.7 11.7 12.8 11.3
Textiles 2019 65.4 66.4 67.7 71.4 61.8 67.2 65.3 66.6 r 64.6 r 63.8 r 59.02018 64.6 57.9 57.1 62.1 62.5 68.2 67.7 68.1 69.7 67.0 66.2 64.5 63.6
Textile products 2019 59.4 62.1 62.7 65.8 56.0 60.5 58.7 59.7 58.3 r 58.1 r 52.42018 59.8 53.8 53.0 58.0 57.9 62.9 63.6 63.9 65.0 61.5 60.8 58.7 58.9
51
Continued
TABLE 3.1 Value of Production Index of Key Manufacturing Enterprises by Industry: 2018 and 2019 (2000 = 100)

52
TABLE 3.1--Continued
Indicator Year Average January February March April May June July August September October November December
Cordage, rope, and twine 2019 164.8 139.3 150.0 165.0 159.1 179.7 175.7 180.6 r 171.0 r 158.2 r 169.12018 143.4 127.4 125.6 130.7 138.5 158.1 137.0 137.0 147.3 158.4 155.7 162.2 142.7
Footwear and wearing 2019 62.5 62.5 61.9 65.6 59.1 r 60.5 63.8 r 61.4 r 63.0 r 62.4 r 65.0 apparel 2018 61.9 60.2 58.8 64.7 54.0 59.1 66.0 61.4 66.6 65.3 62.2 60.6 64.1
Leather products 2019 1.2 1.2 1.2 1.2 1.2 r 1.2 r 1.2 r 1.2 1.2 1.2 r 1.32018 1.2 1.2 1.2 1.2 1.2 1.3 1.3 1.2 1.2 1.2 1.2 1.2 1.2
Wood and wood 2019 73.7 141.8 71.6 64.9 55.3 62.1 62.4 67.7 68.7 69.4 r 73.1 products 2018 64.5 98.9 54.4 54.3 58.5 51.4 59.8 47.6 66.4 58.8 67.6 69.4 86.3
Planing and sawmill 2019 58.7 65.3 58.5 59.2 45.1 57.5 50.9 69.8 64.1 52.4 64.42018 54.1 43.4 45.6 46.7 57.8 50.1 54.6 56.3 54.3 49.1 55.8 72.5 62.5
Veneer and plywood 2019 23.3 21.1 19.6 21.1 23.3 23.5 25.7 24.2 25.0 25.6 r 23.82018 17.8 15.1 15.7 15.3 21.5 14.1 15.6 16.8 17.4 19.8 20.6 22.4 19.2
Other wood products 2019 164.2 406.0 162.3 134.9 113.6 123.4 129.1 128.1 137.4 152.8 r 154.62018 144.1 284.9 120.6 119.6 112.6 106.8 129.8 82.0 151.7 126.5 149.4 133.8 211.4
Paper and paper products 2019 124.9 132.7 122.0 128.5 119.3 124.6 r 117.4 r 123.8 r 121.6 r 126.5 r 132.32018 116.0 115.9 107.7 110.9 109.5 119.8 114.9 119.2 120.5 115.3 122.3 120.4 115.9
Printing 2019 293.3 173.5 182.6 194.1 177.8 425.5 464.9 309.1 305.7 r 353.4 r 346.52018 164.3 189.0 153.8 139.5 158.1 150.1 157.2 184.9 191.2 165.5 176.7 145.2 160.6
Petroleum products 2019 125.6 177.3 163.3 160.2 145.3 67.8 58.5 58.6 87.0 159.0 r 178.72018 199.7 192.1 175.0 198.0 187.7 119.6 178.9 229.1 227.6 212.3 240.2 226.6 209.0
Refined petroleum products 2019 125.1 177.4 162.9 160.0 144.9 66.9 57.8 57.7 86.2 158.8 178.42018 199.7 192.0 174.9 197.9 187.6 119.1 178.6 229.4 227.8 212.7 240.7 226.7 209.0
Coke and other fuel products 2019 204.6 166.9 237.7 199.8 220.1 213.8 185.1 193.1 219.8 194.0 r 215.72018 195.5 202.4 193.9 213.6 200.7 198.1 225.9 180.9 188.5 160.0 172.1 209.1 200.2
Chemical products 2019 243.1 227.4 232.9 248.3 227.6 r 251.7 r 238.5 r 254.4 r 242.1 r 243.6 r 264.2 (excluding plastic products) 2018 238.7 210.8 225.3 241.8 237.6 267.1 235.6 225.4 247.2 233.6 245.2 248.6 245.9
Basic chemical and industrial 2019 288.6 286.5 250.7 321.2 327.1 307.9 286.2 340.6 322.0 200.4 r 243.4 gases 2018 346.3 315.7 341.5 354.5 421.8 433.8 332.7 361.0 346.6 290.2 305.2 322.9 329.9
Fertilizers 2019 147.4 164.9 221.6 57.4 49.3 192.6 84.7 219.1 166.0 64.8 253.92018 184.7 111.0 171.6 73.2 159.1 217.7 165.3 233.4 262.6 181.9 201.0 220.5 218.7
Industrial Production
Continued

Industrial Production
TABLE 3.1--Continued
Indicator Year Average January February March April May June July August September October November December
Paints 2019 240.5 234.8 220.0 245.1 213.6 249.3 227.1 258.9 r 234.1 r 254.0 r 267.82018 234.3 223.1 218.2 221.5 241.5 248.0 267.2 244.9 238.2 217.1 244.7 234.4 212.3
Drugs and medicines 2019 286.7 210.4 251.5 293.4 274.9 290.8 310.3 230.7 316.6 344.8 r 343.62018 262.3 190.0 227.2 290.6 235.4 278.6 256.3 188.4 268.9 293.3 272.2 301.1 345.4
Cosmetics and toilet 2019 234.7 246.5 235.3 247.6 213.6 r 239.6 r 221.4 r 272.6 r 196.3 r 237.2 r 236.4 preparations 2018 212.2 216.0 207.9 219.2 209.7 236.5 209.3 213.9 215.4 199.4 232.2 213.3 173.7
Miscellaneous chemicals 2019 146.4 149.9 151.9 149.5 137.9 137.7 r 141.4 r 138.0 143.4 r 149.4 164.92018 155.7 162.1 162.0 161.8 136.9 156.1 162.0 157.8 152.1 155.6 155.4 149.3 156.8
Rubber and plastic products 2019 183.3 180.9 170.2 182.4 179.3 r 185.6 r 190.5 r 189.6 r 191.2 r 178.3 r 185.42018 167.9 154.6 152.6 162.1 165.4 162.3 165.9 176.0 175.9 170.0 186.3 174.9 168.4
Rubber products 2019 229.9 240.6 215.2 226.7 198.3 223.2 249.9 249.9 248.9 217.9 r 228.32018 209.5 201.5 174.0 196.2 221.9 214.6 208.2 213.4 218.5 222.9 231.9 205.7 205.5
Plastic products 2019 169.6 163.0 156.7 171.4 173.6 r 174.3 r 172.6 r 171.5 r 174.0 r 166.4 r 172.62018 155.4 140.6 146.1 151.8 148.5 146.6 153.2 164.8 163.1 154.2 172.6 165.7 157.3
Non-metallic mineral products 2019 254.4 246.6 233.9 269.2 250.6 252.6 265.3 252.8 263.8 r 250.2 r 258.52018 237.8 230.2 239.2 246.5 234.9 241.3 218.7 230.9 227.2 240.4 264.1 252.0 228.6
Glass and glass products 2019 202.3 196.6 189.7 190.5 196.5 201.0 212.4 213.4 201.6 r 209.6 r 211.52018 185.6 174.0 171.6 172.7 177.2 183.6 182.5 189.1 195.5 198.9 188.7 191.2 202.0
Cement 2019 418.2 402.5 384.4 449.1 415.9 413.3 440.4 412.3 437.2 r 406.8 r 420.12018 395.0 383.7 401.6 413.6 398.5 402.7 359.0 377.4 368.5 397.5 447.4 417.3 373.2
Miscellaneous non-metallic 2019 45.7 48.4 40.8 49.2 40.6 48.1 41.2 45.1 45.9 r 47.0 r 50.8 mineral products 2018 38.6 38.0 39.2 42.4 28.9 38.3 36.4 42.2 41.6 36.9 38.0 44.9 36.2
Basic metals 2019 332.2 354.7 378.5 375.8 306.9 372.9 323.7 337.0 322.0 r 269.5 r 280.62018 396.1 405.7 412.6 407.4 396.6 437.0 422.5 378.5 311.9 338.6 324.4 420.8 496.6
Iron and steel 2019 269.9 276.7 288.4 307.1 268.8 281.3 217.6 248.9 245.1 r 277.7 r 287.72018 367.0 370.7 373.0 372.4 389.2 402.8 399.3 310.0 267.2 298.8 314.6 397.5 508.9
Nonferrous metals 2019 480.5 540.8 593.0 539.7 397.9 591.1 576.5 547.0 505.4 249.8 r 263.92018 465.2 489.2 506.8 490.7 414.4 518.6 477.9 541.5 418.5 433.5 347.9 476.2 467.2
Fabricated metal products 2019 387.7 315.6 348.8 421.5 371.1 401.9 354.4 419.8 r 422.6 r 433.9 r 387.82018 341.5 329.0 312.5 349.7 316.5 323.6 354.5 328.9 371.0 352.3 395.2 335.7 328.7
53
Continued

54
TABLE 3.1--Concluded
Indicator Year Average January February March April May June July August September October November December
Machinery, excluding electrical 2019 65.6 55.7 57.9 67.8 64.3 r 69.5 r 61.1 r 77.1 r 64.2 r 69.3 r 69.42018 61.8 56.2 60.8 64.0 61.2 63.8 66.3 61.8 66.0 63.3 66.6 59.0 52.2
Machinery and equipment 2019 200.6 171.3 180.1 218.5 198.5 r 218.6 r 183.6 r 249.1 r 183.4 r 203.4 r 199.4 (N.E.C.) 2018 198.6 175.7 193.5 206.4 201.9 208.6 219.3 194.8 210.9 203.8 216.1 185.7 166.5
Office, accounting, and 2019 27.4 23.0 23.3 25.1 26.3 r 27.3 26.5 28.5 r 30.4 31.3 r 32.6 and computing machinery 2018 23.0 22.4 23.2 23.7 21.4 22.8 23.0 24.1 25.0 23.6 24.3 23.2 19.8 Electrical machinery 2019 139.8 145.7 137.2 142.4 138.7 r 143.3 r 142.0 r 142.0 r 138.5 r 136.9 r 131.0
2018 151.2 131.1 151.4 148.6 141.3 152.2 158.7 155.4 159.2 160.2 164.5 158.4 133.5
Electrical appliances 2019 114.1 100.0 104.7 110.2 116.3 r 119.7 r 119.0 r 115.4 r 121.9 r 116.4 r 117.22018 102.9 87.3 89.5 93.7 102.5 104.2 111.2 108.6 106.5 104.0 111.4 104.1 112.3
Wires and wirings 2019 142.9 151.0 145.3 150.4 137.5 137.7 126.5 143.6 149.4 r 145.4 r 142.22018 169.2 169.3 156.3 175.9 159.7 165.6 196.9 175.3 175.2 160.3 196.7 163.6 135.2
Batteries 2019 18.6 18.4 18.6 18.1 19.0 19.8 17.8 17.5 18.0 18.1 r 20.62018 11.8 13.2 12.2 11.5 10.6 9.8 9.3 9.4 11.2 11.9 13.3 12.1 16.5
Lamps and fixtures 2019 130.5 154.3 172.8 140.0 118.8 r 113.7 114.8 r 123.8 r 126.6 121.8 r 118.52018 131.1 114.6 115.0 127.8 115.9 117.7 123.9 128.5 140.7 141.1 149.5 166.9 132.0
Microcircuits 2019 153.4 164.5 147.3 157.3 152.8 r 159.4 r 158.2 r 157.3 r 148.7 r 149.0 r 139.92018 174.1 150.1 182.0 173.4 161.2 177.1 182.2 178.7 183.8 187.1 188.0 180.8 144.5
Transport equipment 2019 206.3 200.2 206.7 226.7 186.5 r 238.5 r 194.9 221.5 r 180.5 r 196.2 r 210.92018 205.8 186.2 201.2 193.9 208.8 199.4 206.2 211.4 219.0 218.3 228.4 220.5 176.0
Furniture and fixtures 2019 73.8 71.6 79.6 76.0 67.3 73.7 68.9 r 73.2 r 79.9 r 75.5 r 72.52018 69.3 69.8 64.1 67.1 56.3 76.2 73.0 59.1 87.2 65.2 66.7 75.4 71.1
Miscellaneous 2019 83.3 88.9 91.1 88.3 82.7 82.1 82.4 83.7 78.0 76.2 79.7 manufactures 2018 88.7 79.2 80.9 86.5 85.3 90.9 90.9 94.3 93.5 86.5 102.6 98.4 75.9
Source : Philippine Statistics Authority
Industrial Production

Industrial Production
Indicator Year Average January February March April May June July August September October November December
Total manufacturing 2019 138.4 138.2 137.1 147.1 133.7 r 140.9 r 135.7 137.0 r 132.6 r 136.9 r 144.5 2018 150.1 144.3 151.1 161.3 155.4 152.7 149.1 146.0 147.3 142.0 150.1 152.1 149.7
Food manufacturing 2019 160.6 165.2 165.1 183.4 157.0 164.3 159.0 156.7 r 153.5 r 143.1 r 158.92018 167.0 175.8 198.9 208.9 197.5 194.0 160.0 140.7 142.8 135.5 142.7 147.8 159.5
Beverages 2019 162.2 153.4 146.2 170.7 151.4 171.1 183.1 160.8 152.2 r 167.2 r 165.52018 153.7 140.5 123.4 159.4 161.5 160.7 157.3 155.2 158.6 150.9 161.1 154.2 161.1
Tobacco products 2019 4.3 3.5 3.3 3.5 3.4 4.7 4.5 5.0 4.7 4.8 r 5.22018 3.8 3.1 3.4 3.7 4.9 4.2 4.7 3.7 3.0 3.2 3.8 4.2 3.7
Textiles 2019 36.3 35.4 36.2 37.7 34.8 37.9 37.0 37.9 r 36.7 r 35.7 r 33.32018 35.7 33.1 32.2 34.5 34.7 38.1 37.6 37.4 38.3 37.2 35.8 34.6 35.0
Footwear and wearing apparel 2019 20.7 19.7 19.8 20.9 18.7 r 19.8 22.0 21.2 r 21.2 r 21.1 r 22.42018 19.1 19.0 18.2 20.2 16.9 18.1 20.5 19.5 20.4 19.6 18.8 18.4 19.9
Leather products 2019 1.2 1.1 1.1 1.1 1.0 r 1.1 r 1.4 r 1.2 1.3 1.3 r 1.52018 1.1 1.0 1.0 1.1 1.0 1.1 1.1 1.1 1.1 1.1 1.1 1.1 1.3
Wood and wood products 2019 90.5 167.2 86.8 76.6 68.7 74.8 76.9 86.6 85.3 88.7 r 93.22018 73.9 109.6 60.1 63.2 67.5 59.5 67.3 54.3 75.2 67.8 78.9 80.6 102.8
Paper and paper products 2019 101.1 105.9 97.8 102.9 95.8 99.8 95.4 r 101.1 r 99.7 102.1 r 110.02018 94.0 94.6 87.7 93.5 91.8 98.4 92.5 95.2 96.7 91.9 97.8 96.1 91.7
Printing 2019 87.9 52.0 54.7 58.2 53.3 127.5 139.4 92.7 91.6 r 105.9 r 103.92018 49.8 58.5 47.6 42.8 48.5 46.0 47.3 55.4 57.3 49.6 53.0 43.5 48.1
Petroleum products 2019 39.8 55.1 52.8 49.8 45.2 21.1 18.8 18.8 28.0 50.5 r 58.02018 60.1 55.6 54.8 62.3 55.8 36.1 53.6 68.4 68.3 61.9 70.3 69.1 65.5
Chemical products 2019 170.0 158.4 160.7 172.9 159.7 r 176.6 r 167.2 r 179.0 r 170.0 r 170.0 r 185.0 (excluding plastic products) 2018 157.5 139.0 149.5 159.5 157.3 176.6 156.2 148.5 162.3 154.1 161.6 163.5 162.0
Rubber and plastic products 2019 126.2 123.6 116.0 126.3 123.5 r 127.5 r 130.8 r 130.9 r 131.7 r 123.1 r 128.22018 120.7 112.5 111.0 117.4 119.8 117.4 119.8 126.2 126.1 121.5 132.8 123.7 119.8
Rubber products 2019 301.2 313.6 280.4 295.8 261.3 292.1 328.0 328.1 325.3 r 285.3 r 301.82018 285.1 277.1 241.3 271.8 307.4 296.8 284.1 288.5 295.5 300.1 312.4 274.1 272.6
Plastic products 2019 92.8 88.6 84.8 93.7 95.0 r 95.3 r 94.2 r 94.4 r 95.6 r 91.7 r 94.72018 85.6 78.4 81.2 83.8 81.9 80.8 84.9 90.7 89.7 84.6 94.4 90.0 86.4
Non-metallic mineral products 2019 159.0 154.4 144.4 166.1 156.3 157.6 167.2 r 158.1 r 165.5 r 157.3 r 163.22018 159.9 161.0 166.2 170.0 162.3 167.3 148.5 156.9 147.6 157.0 169.1 164.5 148.9
55
Continued
(2000=100)TABLE 3.2 Volume of Production Index of Key Manufacturing Enterprises by Industry: 2018 and 2019

56
TABLE 3.2--Concluded
Indicator Year Average January February March April May June July August September October November December
Glass and glass products 2019 161.9 157.3 152.5 152.3 157.8 160.9 169.9 169.6 160.2 r 167.1 r 171.02018 153.1 154.5 141.4 141.6 145.5 150.5 150.0 155.4 160.0 161.6 154.0 156.7 165.6
Cement 2019 246.6 238.1 221.2 259.8 241.9 241.9 263.5 r 245.9 r 260.9 r 243.5 r 249.52018 240.1 239.2 252.2 256.5 248.0 254.9 218.8 228.8 218.4 238.7 257.4 247.3 221.5
Miscellaneous non-metallic 2019 29.4 31.1 26.2 31.4 26.4 31.1 26.6 r 28.7 r 29.5 r 30.2 r 33.1 mineral products 2018 27.7 28.6 29.4 31.7 21.7 28.3 26.8 31.4 28.2 25.0 25.9 30.8 24.7
Basic metals 2019 202.1 210.3 228.4 223.0 185.2 227.0 197.5 208.3 198.6 r 166.6 r 175.82018 226.2 233.0 235.8 232.7 221.8 244.3 242.1 216.2 177.6 192.9 185.8 239.1 293.6
Iron and steel 2019 141.6 142.0 149.6 157.8 139.0 146.8 115.1 132.0 129.4 r 149.0 r 155.62018 185.6 193.2 191.5 190.4 196.9 202.9 198.1 153.5 132.7 150.3 157.8 200.5 259.8
Nonferrous metals 2019 351.4 383.4 431.8 382.9 290.9 435.8 420.0 408.7 377.8 184.1 198.52018 301.7 310.2 323.5 314.5 256.7 322.7 318.8 359.8 275.3 281.1 229.1 306.5 322.5
Fabricated metal products 2019 561.7 415.8 461.8 557.7 492.1 629.9 535.2 639.0 r 639.4 r 656.5 r 589.72018 466.6 440.0 424.5 484.2 430.8 441.3 495.6 460.6 520.3 476.6 533.9 451.4 439.8
Machinery, excluding electrical 2019 70.8 57.2 61.7 72.9 69.4 r 74.5 r 65.9 85.6 r 68.7 r 75.2 r 76.42018 65.8 61.8 66.7 70.0 67.4 69.3 69.6 64.9 69.1 65.5 69.3 62.0 53.9
Electrical machinery 2019 114.0 117.1 110.8 113.1 112.7 r 116.7 r 115.5 r 119.0 r 114.4 r 112.8 r 108.02018 122.5 108.8 124.9 123.0 116.7 124.0 128.8 124.8 126.9 126.2 130.5 128.1 107.5
Transport equipment 2019 178.6 166.9 171.1 185.8 166.0 r 211.0 r 171.9 193.9 r 155.1 r 173.4 r 190.72018 176.2 160.9 171.5 166.0 179.0 169.4 176.0 179.7 187.8 185.6 193.7 190.4 153.8
Furniture and fixtures 2019 676.0 645.6 724.5 691.7 613.3 679.9 633.1 r 676.8 r 726.2 r 695.2 r 673.42018 1,004.2 933.7 837.4 937.0 792.9 1,040.2 1,078.0 895.2 1,306.3 969.1 990.4 1,181.9 1,088.4
Miscellaneous manufactures 2019 99.5 105.3 108.0 104.5 98.7 r 97.8 r 99.1 r 101.3 r 92.6 r 91.0 r 96.32018 103.4 90.0 91.7 97.5 95.5 100.4 101.6 104.2 116.1 105.0 125.1 121.6 92.6
Source : Philippine Statistics Authority
Industrial Production

Industrial Production
Indicator Year Total January February March April May June July August September October November December
Logs (cu. m.) 2019 675,383 75,009 83,427 59,426 90,164 68,476 67,463 98,410 80,582 52,426 2018 881,317 59,839 68,671 58,185 80,622 73,125 66,981 82,224 71,979 72,660 85,183 64,114 97,734
Mineral Products
Metallics
Copper concentrate (DMT) 2019 234,981 25,528 26,184 29,347 25,864 24,624 25,198 27,891 27,529 22,816 2018 262,798 22,228 20,829 26,782 23,504 22,863 21,724 26,789 25,346 24,368 24,317 24,048 0
Gold (kg) 2019 16,041 1,885 1,671 2,085 1,816 1,822 1,963 1,924 1,645 1,230 2018 19,239 1,631 1,615 1,585 1,587 1,778 2,036 1,867 1,877 1,699 1,711 1,662 191
Silver (kg) 2019 24,778 2,839 2,730 2,901 2,719 2,661 2,918 3,023 2,746 2,241 2018 26,618 2,427 2,495 1,873 2,117 2,722 2,722 2,531 2,291 2,526 2,402 2,476 36
Chromite (DMT) 2019 19,719 2,567 1,916 4,430 5,217 4,780 0 809 0 0 2018 43,221 1,571 4,345 2,100 2,240 10,955 2,853 3,103 3,547 2,713 6,087 3,707 0
Non-metallics
Coal (mt) 2019 12,048,705 1,306,415 1,286,342 1,480,350 917,051 1,738,236 1,808,776 1,356,212 1,030,973 1,124,3502018 13,057,833 1,417,165 1,419,217 1,310,300 1,029,963 1,151,407 943,144 310,102 557,422 852,212 1,272,743 1,369,734 1,424,424
Sources : Philippine Statistics Authority, Forest Management Bureau, Mines and Geosciences Bureau, and Department of Energy
57
TABLE 3.3 Local Production of Forest and Mineral Products: 2018 and 2019

CHAPTER IV Money and Banking

Money and Banking
Indicator Year Average January February March April May June July r August r September p October November December
Total 2019 21,334.8 20,764.9 20,846.0 21,085.7 21,129.0 21,150.2 21,599.8 21,682.5 21,718.2 22,036.8 2018 19,918.2 19,145.5 19,228.2 19,442.6 19,468.4 19,684.9 19,810.2 19,849.0 20,035.8 20,245.3 20,544.8 20,501.2 21,062.3
Universal and commercial 2019 15,940.2 15,396.3 15,468.8 15,813.9 15,861.2 15,890.9 16,018.9 16,202.7 16,241.0 16,568.1 banks 2018 14,649.3 13,942.7 14,023.0 14,202.8 14,226.6 14,436.1 14,554.5 14,586.5 14,769.9 14,940.0 15,241.9 15,176.6 15,691.5
Thrift banks 2019 1,255.7 1,291.0 1,299.6 1,297.9 1,293.9 1,285.4 1,287.8 1,186.6 1,183.9 1,175.42018 1,239.3 1,208.1 1,210.6 1,214.4 1,216.4 1,223.3 1,236.6 1,243.5 1,246.8 1,254.0 1,251.7 1,273.3 1,293.2
Rural banks 2019 278.2 273.9 273.9 275.2 275.2 275.2 282.6 282.6 a 282.6 a 282.6 a
2018 265.9 258.9 258.9 258.9 261.5 261.5 261.5 269.2 269.2 269.2 273.9 273.9 273.9
Non banks 2019 3,860.6 3,803.7 3,803.7 3,698.7 3,698.7 3,698.7 4,010.5 r 4,010.5 a 4,010.5 a 4,010.5 a
2018 3,512.3 3,506.7 3,506.7 3,506.7 3,497.8 3,497.8 3,497.8 3,522.3 3,522.3 3,522.3 3,522.3 3,522.3 3,522.3
a: as of end-June 2019b: as of end-Mach 2019
Source: Bangko Sentral ng Pilipinas
Indicator Year Average January February March April May June July August September October November December
Total 2019 84,733.2 82,487.1 82,780.8 83,613.2 83,878.8 85,357.5 84,931.6 85,175.8 86,031.0 85,581.8 85,834.1 86,393.8 p
2018 78,140.3 81,224.0 80,431.6 80,511.2 79,608.8 79,202.4 77,525.1 76,721.6 77,933.9 74,938.8 74,710.9 75,682.1 79,193.4
Reserve position in the fund 2019 532.8 477.2 472.4 524.6 524.3 520.6 523.7 566.3 563.3 561.3 564.7 561.9 p
2018 459.6 431.5 428.2 430.1 424.0 418.7 489.3 488.4 487.2 483.4 481.4 478.8 473.8
Gold 2019 8,139.3 8,407.1 8,359.4 8,214.0 8,123.7 8,332.4 8,015.9 r 8,015.9 8,015.9 8,015.9 8,015.9 8,015.9 p
2018 8,026.3 8,500.7 8,307.8 8,375.1 8,251.3 8,196.6 7,913.2 7,787.5 7,622.1 7,577.3 7,853.8 7,776.1 8,153.5
Special drawing rights 2019 1,179.3 1,192.2 1,191.1 1,182.8 1,182.1 1,175.0 1,185.7 1,173.1 1,168.4 1,164.1 1,178.3 1,179.5 p
2018 1,202.0 1,235.4 1,226.6 1,233.3 1,217.4 1,202.9 1,194.4 1,193.2 1,191.2 1,186.0 1,182.6 1,177.3 1,183.7
Foreign investments 2019 72,279.6 69,969.6 70,370.0 71,409.2 71,847.9 72,478.8 72,540.9 72,810.3 73,522.0 72,970.7 73,689.6 73,466.7 p
2018 62,949.3 65,304.1 64,185.3 64,931.1 64,519.0 63,924.0 62,355.6 60,736.3 61,775.6 59,850.5 59,758.7 61,317.9 66,732.9
Foreign exchange 2019 2,602.3 2,441.0 2,388.0 2,282.7 2,200.8 2,850.7 2,665.4 2,610.2 2,761.4 2,869.9 2,385.6 3,169.7 p
2018 5,503.1 5,752.3 6,283.6 5,541.5 5,197.1 5,460.1 5,572.7 6,516.2 6,857.8 5,841.6 5,432.4 4,932.0 2,649.5
Source: Bangko Sentral ng Pilipinas
TABLE 4.2 Gross International Reserves of the Bangko Sentral ng Pilipinas: 2018 and 2019(In Million U.S. dollars)
(In Billion Pesos)
61
TABLE 4.1 Resources of the Financial System: 2018 and 2019

62
Indicator Year Average January February March April May June July August September October November December
Total 2019 84,719.7 82,478.4 82,770.7 83,598.4 83,859.3 85,336.5 84,927.5 85,167.2 86,021.0 85,567.3 85,815.2 86,375.0 p
2018 78,152.7 81,216.2 80,421.8 80,496.9 79,590.1 79,181.6 77,521.3 76,713.4 77,923.9 74,924.2 74,691.8 75,661.3 79,489.4
Total assets 2019 84,733.2 82,487.1 82,780.8 83,613.2 83,878.8 85,357.5 84,931.6 85,175.8 86,031.0 85,581.8 85,834.1 86,393.8 p
2018 78,140.3 81,224.0 80,431.6 80,511.2 79,608.8 79,202.4 77,525.1 76,721.6 77,933.9 74,938.8 74,710.9 75,682.1 79,193.4
Total liabilities 2019 13.5 8.7 10.1 14.8 19.5 20.9 4.1 8.6 10.0 14.4 18.8 18.8 p
2018 12.7 7.8 9.8 14.3 18.7 20.7 3.8 8.3 10.0 14.5 19.1 20.8 4.0
Source: Bangko Sentral ng Pilipinas
Indicator Year Average January February March April May June July August September October November December
Savings deposit 2019 1.313 1.403 1.239 1.409 1.326 1.358 1.244 1.365 1.341 1.130 (Percent per annum) 2018 0.895 0.798 0.670 0.758 0.747 0.811 0.795 0.877 0.896 0.983 1.081 1.126 1.196
Treasury Bill Rates
91 - day 2019 4.55 5.444 5.575 5.754 5.606 5.309 4.596 3.826 3.326 3.093 2.995 182 - day 4.90 6.096 5.926 5.953 5.978 5.721 4.976 4.169 3.574 3.425 3.173 364 - days 5.09 6.207 5.978 6.036 6.023 5.866 5.151 4.628 3.767 3.662 3.577 all maturities 4.88 6.019 5.842 5.938 5.851 5.669 4.944 4.261 3.585 3.414 3.280
91 - day 2018 3.61 2.277 2.670 3.008 3.440 3.407 3.356 3.297 3.239 3.349 4.778 5.181 5.356 182 - day 4.26 2.544 2.854 3.186 3.894 3.868 3.745 4.154 4.109 4.350 5.855 6.253 6.325 364 - days 4.65 2.877 3.040 3.393 3.906 4.235 4.348 4.760 4.885 5.112 6.126 6.527 6.546 all maturities 4.20 2.484 2.779 3.125 3.600 3.769 3.864 4.125 4.187 4.502 5.763 6.144 6.061
Time Deposit Rates
S - T < 360 days 2019 4.101 4.728 4.864 4.613 4.455 4.723 4.403 4.158 3.145 3.002 2.921 L - T > 360 days 4.615 5.482 5.374 5.190 5.637 4.835 4.588 4.668 3.739 3.463 3.178
S - T < 360 days 2018 3.111 2.416 2.578 2.602 2.573 2.717 2.574 3.071 3.241 3.309 3.562 4.521 4.171 L - T > 360 days 3.171 2.548 2.640 2.768 2.224 3.251 2.566 3.039 2.756 2.962 3.195 4.811 5.293
Source: Bangko Sentral ng Pilipinas
TABLE 4.3 Net International Reserves: 2018 and 2019
Money and Banking
TABLE 4.4 Bank Interest Rates: 2018 and 2019

Money and Banking
Indicator Year Average January February March April May June July August September October November December
Bank Lending Rates 2019 7.193 7.267 6.680 7.424 7.196 7.476 7.212 7.382 7.108 6.991 (Commercial Banks) 2018 6.119 5.726 5.353 5.842 5.749 6.025 5.901 6.199 6.212 6.149 6.602 6.640 7.024 WAIR in percent per annum
WAIR - weighted average interest rates
Source: Bangko Sentral ng Pilipinas
Indicator Year Average January February March April May June July August September October November December
Interbank Call Loan Rates 2019 4.819 5.098 5.114 5.175 5.223 5.043 4.937 4.773 4.408 4.323 4.0922018 3.786 3.090 3.076 3.075 3.165 3.300 3.501 3.643 3.990 4.221 4.645 4.772 4.948
Source: Bangko Sentral ng Pilipinas
Indicator Year Average January February March April May June July August September October November December
Exchange Rates 2019 51.8893 52.4679 52.1901 52.4134 52.1122 52.2620 51.8029 51.1429 52.0547 52.1052 51.5042 50.7268 (Peso per US Dollar) 2018 52.6614 50.5087 51.7856 52.0676 52.0986 52.1948 53.0476 53.4329 53.2735 53.9419 54.0086 52.8083 52.7691
Source: Bangko Sentral ng Pilipinas
Indicator Year Average January February March April May June July August September October November December
Reserve Money 2019 3,111,089 3,044,919 3,064,010 3,227,042 3,185,105 p 3,226,641 p 3,113,810 p 2,989,584 p 3,061,894 p 3,090,821 p 3,107,061 p
2018 3,034,819 2,937,520 3,001,797 3,045,785 3,026,581 2,979,015 2,980,255 2,908,321 2,988,198 3,017,687 3,065,096 3,129,541 3,338,027 p
Source: Bangko Sentral ng Pilipinas
TABLE 4.7 Exchange Rates: 2018 and 2019
TABLE 4.8 Reserve Money: 2018 and 2019(In Million Pesos)
TABLE 4.5 Bank Lending Rates: 2018 and 2019
TABLE 4.6 Interbank Call Loan Rates: 2018 and 2019
63

64
Indicator Year Average January February March April May June July August September October November December
Peso Cross Rates (Peso per unit
of foreign currency)
US Dollar 2019 51.8260 52.3520 52.0060 52.7820 52.1060 52.2570 51.3580 51.0130 52.3390 52.0420 51.0330 50.7980 Japan (Yen) 0.4748 0.4806 0.4686 0.4771 0.4668 0.4768 0.4765 0.4698 0.4915 0.4820 0.4689 0.4639 Euro 57.9954 60.1053 59.1412 59.2425 58.2910 58.1673 58.4043 56.9152 57.8817 56.9600 56.9120 55.9286 Pound (Sterling) 66.0324 68.6125 69.2044 68.8541 67.4200 65.8961 65.1117 61.9961 63.8117 64.0117 65.8581 65.5802 Canada (Dollar) 39.0777 39.8205 39.5453 39.2811 38.7233 38.7146 39.2195 38.8050 39.4000 39.3066 38.7906 38.2486 Swiss (Franc) 52.0707 52.6680 51.9540 53.0206 51.1094 51.8628 52.6047 51.5231 53.0553 52.5358 51.5902 50.8539 Brunei (Dollar) 37.8445 38.7162 38.4347 38.7761 38.1366 37.7607 37.8216 37.1004 37.5890 37.5429 37.3430 37.0680 Australia (Dollar) 36.0277 37.9500 37.1167 37.3433 36.7608 36.1148 35.9917 35.0510 35.1927 35.1856 35.2230 34.3750 Hong Kong (Dollar) 6.6116 6.6748 6.6254 6.7241 6.6435 6.6592 6.5717 6.5203 6.6710 6.6376 6.5094 6.4903 Netherlands (Dollar) 1.5402 1.7041 1.6892 1.7106 1.6864 1.6556 1.6560 1.6414 1.6718 1.6770 1.6801 1.6664 South Korea (Won) 0.0446 0.0472 0.0466 0.0465 0.0450 0.0439 0.0444 0.0432 0.0433 0.0433 0.0438 0.0431 Singapore (Dollar) 37.9832 38.8598 38.5773 38.9190 38.2767 37.8976 37.9614 37.2358 37.7245 37.6788 37.4802 37.2037 Malaysia (Ringgit) 12.5084 12.7532 12.7968 12.9495 12.6104 12.4718 12.3993 12.3728 12.4173 12.4324 12.2132 12.1759 Thailand (Baht) 1.6699 1.6694 1.6578 1.6619 1.6324 1.6438 1.6686 1.6557 1.7101 1.7007 1.6887 1.6803 Indonesia (Rupiah) 0.0036 0.0037 0.0037 0.0037 0.0036 0.0036 0.0036 0.0036 0.0037 0.0037 0.0036 0.0036 Saudi Arabia (Rial) 13.8195 13.9594 13.8675 14.0756 13.8946 13.9352 13.6955 13.6020 13.9563 13.8730 13.6081 13.5469 Chinese Yuan 7.5163 7.7956 7.7789 7.8314 7.7371 7.5720 7.4672 7.4098 7.3273 7.3067 7.2325 7.2209 UAE Dirham 14.1108 14.2540 14.1598 14.3719 14.1870 14.2285 13.9833 13.8894 14.2504 14.1688 13.8952 13.8309 S.D.R 71.5768 73.1457 72.6893 73.2662 72.0308 71.9621 71.3938 70.1689 71.6945 70.9983 70.2551 69.7406
US Dollar 2018 52.7247 50.5087 51.7856 52.2070 52.0986 52.6890 53.5220 53.2630 53.4340 54.2510 53.6060 52.6080 52.7240 Japan (Yen) 0.4779 0.4554 0.4793 0.4957 0.4847 0.4838 0.4844 0.4796 0.4815 0.4785 0.4740 0.4630 0.4751 Euro 62.2131 61.6042 63.9431 64.7628 64.0093 61.4617 61.9303 62.3603 62.3735 63.1644 60.8160 59.8206 60.3110 Pound (Sterling) 70.1938 69.7775 72.3817 73.9251 73.3727 70.0448 70.0068 69.9610 69.5283 70.9820 68.1279 67.4855 66.7328 Canada (Dollar) 40.6332 40.6329 41.2191 40.5302 40.9351 40.9299 40.4123 40.8678 41.1696 41.6035 40.9050 39.6593 38.7335 Swiss (Franc) 54.0168 52.5408 55.4033 55.1521 53.8784 53.2750 53.6723 53.9044 55.1491 55.5225 53.3446 52.9628 53.3968 Brunei (Dollar) 38.9259 38.0825 39.1006 39.7132 39.4689 39.2060 38.9960 39.0062 38.9347 39.5214 38.5738 38.1770 38.3308 Australia (Dollar) 39.2754 40.1687 40.7824 40.0793 40.0608 39.9119 39.3494 39.4359 38.8091 39.0933 38.0871 38.4564 37.0702 Hong Kong (Dollar) 6.7279 6.4597 6.6208 6.6535 6.6385 6.7143 6.8200 6.7867 6.8080 6.9416 6.8346 6.7231 6.7344 Netherlands (Dollar) 1.7481 1.7169 1.7712 1.7891 1.7759 1.7612 1.7516 1.7422 1.7381 1.7766 1.7324 1.7077 1.7137 South Korea (Won) 0.0479 0.0474 0.0480 0.0486 0.0488 0.0490 0.0477 0.0477 0.0480 0.0487 0.0471 0.0469 0.0471 Singapore (Dollar) 39.0702 38.2266 39.2487 39.8648 39.6189 39.3525 39.1386 39.1496 39.0771 39.6658 38.7131 38.3161 38.4706 Malaysia (Ringgit) 13.0532 12.7761 13.2477 13.4710 13.4156 13.2152 13.2480 13.1351 13.0073 13.1105 12.8244 12.5317 12.6558 Thailand (Baht) 1.6298 1.5826 1.6455 1.6744 1.6652 1.6414 1.6160 1.5990 1.6345 1.6754 1.6098 1.5937 1.6198 Indonesia (Rupiah) 0.0037 0.0038 0.0038 0.0038 0.0038 0.0038 0.0037 0.0037 0.0036 0.0036 0.0035 0.0036 0.0036 Saudi Arabia (Rial) 14.0585 13.4684 13.8093 13.9226 13.8928 14.0496 14.2717 14.2035 14.2475 14.4670 14.2919 14.0236 14.0545 Chinese Yuan 7.9464 7.8520 8.1960 8.3165 8.2785 8.2047 8.0790 7.8112 7.8074 7.8750 7.6937 7.5651 7.6773 UAE Dirham 14.3560 13.7533 14.1008 14.2153 14.1857 14.3457 14.5725 14.5020 14.5486 14.7722 14.5966 14.3237 14.3553 S.D.R 74.5636 72.5987 75.1915 76.1335 75.6169 74.5117 75.1941 74.7418 74.9294 76.0626 74.0921 72.5817 73.1097
Source: Bangko Sentral ng Pilipinas
TABLE 4.9 Peso Cross Rates by Country: 2018 and 2019
Money and Banking

Money and Banking
Indicator Year Total January February March April May June July August September October November December
CURRENT ACCOUNT 2019P (1,930) (1,286) 300 (609) (522) (190) 5672018 (7,879) (156) (46) (133) (1,239) (1,411) (856) (292) (705) (640) (1,212) (988) (201)
Goods, services and primary 2019P (15,054) (3,536) (1,783) (2,920) (2,742) (2,614) (1,459)income 2018 (34,698) (2,402) (2,151) (2,365) (3,411) (3,697) (3,003) (2,481) (3,023) (2,662) (3,502) (3,144) (2,857)
Export 2019P 51,575 8,098 8,157 8,755 8,462 9,028 9,0752018 101,210 8,316 7,591 8,265 7,823 8,474 8,310 8,788 9,024 8,977 9,095 8,431 8,116
Import 2019P 66,630 11,634 9,940 11,675 11,204 11,642 10,5352018 135,909 10,719 9,742 10,629 11,235 12,171 11,313 11,269 12,047 11,639 12,597 11,575 10,973
Goods and services 2019P (17,586) (4,042) (2,376) (3,128) (3,137) (3,055) (1,848)2018 (38,543) (2,830) (2,560) (2,326) (3,684) (3,906) (3,235) (3,083) (3,099) (3,002) (3,907) (3,584) (3,327)
Exports 2019P 45,089 7,041 7,112 7,674 7,324 7,939 7,9992018 89,144 7,451 6,711 7,357 6,865 7,493 7,339 7,666 7,994 7,941 7,956 7,440 6,931
Imports 2019P 62,673 11,083 9,488 10,802 10,460 10,993 9,8472018 127,687 10,281 9,271 9,683 10,549 11,400 10,574 10,749 11,093 10,942 11,863 11,024 10,258
Goods 2019P (23,528) (4,817) (3,393) (4,027) (4,231) (4,051) (3,009)2018 (49,036) (3,837) (3,544) (3,180) (4,211) (4,492) (3,960) (4,102) (4,134) (4,244) (4,560) (4,429) (4,343)
Credit: Exports 2019P 25,937 3,798 3,948 4,451 4,142 4,743 4,8552018p 51,673 4,157 3,735 4,400 3,998 4,518 4,493 4,420 4,744 4,628 4,773 4,270 3,537
Debit: Imports 2019P 49,464 8,615 7,341 8,477 8,373 8,794 7,8642018p 100,711 7,994 7,279 7,580 8,209 9,011 8,453 8,523 8,879 8,872 9,333 8,699 7,879
Services 2019P 5,941 775 1,016 899 1,094 996 1,1612018p 10,493 1,007 984 853 527 586 725 1,019 1,035 1,243 653 845 1,016
Credit: Exports 2019P 19,153 3,244 3,163 3,224 3,182 3,196 3,1442018p 37,469 3,294 2,976 2,957 2,867 2,975 2,846 3,245 3,249 3,313 3,183 3,170 3,394
Debit: Imports 2019P 13,210 2,468 2,147 2,325 2,087 2,200 1,9832018p 26,975 2,287 1,992 2,103 2,341 2,389 2,120 2,226 2,214 2,070 2,530 2,325 2,378
Primary income 2019P 2,532 506 594 208 394 441 3892018p 3,843 427 409 (38) 272 209 232 602 76 339 405 440 470
Credit: Receipts 2019P 6,487 1,057 1,046 1,080 1,138 1,090 1,0762018p 12,067 865 880 908 958 980 971 1,123 1,030 1,036 1,139 992 1,185
Debit: Payments 2019P 3,955 551 452 872 744 649 6872018p 8,224 438 471 946 686 771 739 521 954 697 734 551 716
TABLE 4.10 Balance of Payment: 2018 and 2019(In Million U.S. dollars)
Continued
65

66
TABLE 4.10--Continued
Indicator Year Total January February March April May June July August September October November December
Secondary income 2019P 13,315 2,250 2,083 2,311 2,221 2,424 2,026 2018 26,821 2,247 2,105 2,232 2,172 2,286 2,146 2,189 2,319 2,023 2,290 2,156 2,656
Credit: Receipts 2019P 13,749 2,331 2,153 2,381 2,291 2,492 2,101 2018 27,608 2,318 2,166 2,290 2,240 2,354 2,205 2,269 2,397 2,080 2,345 2,220 2,724
Debit: Payments 2019P 435 81 70 70 71 68 75 2018 787 71 61 59 68 68 58 80 78 57 55 64 68
Capital account 2019P 33 7 5 3 6 5 7 2018 65 3 7 4 5 4 7 7 0 8 6 6 8
Credit: Receipts 2019P 43 8 6 6 8 7 8 2018 102 11 9 7 8 7 8 9 8 10 8 7 10
Debit: Payments 2019P 9 1 1 3 1 2 1 2018 36 7 2 3 3 3 1 2 8 2 2 1 2
Financial account 2019P (5,719) (5,591) 120 (23) 365 (793) 203 2018 (7,830) 1,484 (590) (1,710) (194) (187) (1,245) (1,097) (1,169) 645 59 (3,103) (723)
Net acquisition of financial 2019P 3,479 (570) 869 874 827 (56) 1,535 assets 2018 6,037 302 112 487 70 1,273 (718) 533 1,363 1,796 (63) (68) 950
Net incurrence of liabilities 2019P 9,197 5,021 748 897 461 737 1,333 2018 13,872 (1,182) 702 2,197 264 1,460 528 1,630 2,533 1,152 (121) 3,036 1,673
Direct investment 2019P (1,755) (335) (514) (241) (707) 129 (87)2018 (5,853) (905) (251) 131 (958) (1,312) (402) (747) (463) (150) (98) (327) (371)
Net acquisition of financial 2019P 1,820 274 232 345 255 371 343 assets 2018 3,948 81 370 812 131 313 434 174 293 425 401 208 306
Net incurrence of liabilities 2019P 3,574 609 746 586 961 242 430 2018 9,801 986 621 681 1,089 1,625 836 920 756 575 500 535 677
Portfolio investment 2019P (4,372) (3,300) 309 (38) 136 (371) (1,108)2018 860 1,094 1,245 (726) 77 1,346 (402) 91 (130) (460) 1,293 (2,005) (563)
Net acquisition of financial 2019P 903 508 490 (343) 184 118 (54) assets 2018 4,223 857 1,431 (806) 343 789 (689) 493 507 46 149 476 627
Net incurrence of liabilities 2019P 5,277 3,809 181 (305) 48 489 1,055 2018 3,367 (236) 186 (79) 266 (557) (287) 402 637 507 (1,144) 2,481 1,191
Financial derivatives 2019P (88) (7) (25) (9) (12) (30) (5)2018 (54) (33) (38) 2 12 (5) 9 98 (43) (22) (42) 6 2
Money and Banking
Continued

Money and Banking
TABLE 4.10--Continued
Indicator Year Total January February March April May June July August September October November December
Net acquisition of financial 2019P (468) (88) (67) (80) (79) (73) (81) assets 2018 (1,466) (101) (64) (27) (21) (38) (20) (35) (65) (55) (96) (417) (527)
Net incurrence of liabilities 2019P (381) (81) (43) (71) (67) (44) (75)2018 (1,411) (68) (26) (29) (32) (33) (29) (133) (23) (33) (53) (423) (529)
Other investment 2019P 496 (1,950) 350 265 948 (520) 1,403 2018 (2,782) 1,328 (1,546) (1,117) 675 (216) (450) (539) (533) 1,277 (1,093) (777) 209
Net acquisition of financial 2019P 1,222 (1,265) 214 952 467 (472) 1,326 assets 2018 (669) (535) (1,624) 507 (383) 209 (443) (99) 629 1,380 (518) (335) 543
Net incurrence of liabilities 2019P 727 685 (136) 687 (481) 49 (77)2018 2,114 (1,863) (79) 1,624 (1,058) 425 8 441 1,162 102 576 442 334
NET UNCLASSIFIED ITEMS 2019P 777 (1,609) 282 1,211 1,348 320 (775)2018 (2,324) 1,106 (981) (1,847) 769 637 (1,572) (1,267) 808 (1,420) 806 (1,275) 1,912
OVERALL BOP POSITION 2019P 4,789 2,704 467 627 467 928 (404)2018 (2,304) (531) (429) (266) (270) (583) (1,177) (455) 1,272 (2,696) (458) 847 2,442
Debit: Change in reserve assets 2019P 4,788 2,708 468 632 472 929 (421)2018 (2,306) (527) (427) (262) (266) (581) (1,194) (451) 1,274 (2,692) (454) 849 2,425
Credit: Change in reserve 2019P 0 5 1 5 5 1 (17)2018 1 4 2 4 4 2 (17) 5 2 5 5 2 (17)
Memo Items:
Change in Net Foreign Assets 2019P 1,865 (508) 527 26 689 263 868 (NFA) of deposit-taking 2018 (484) 2,187 99 (918) 78 446 (830) 268 (674) 757 (659) (741) (497)
corporations except the Central Bank
Change in Commercial Banks 2019P 1,890 (530) 556 39 678 295 852 2018 (471) 2,100 172 (937) 98 451 (883) 274 (641) 761 (631) (748) (487)
Change in Thrift Banks (TBs) 2019P 15 22 (9) (4) (6) (8) 20 (NFA) 2018 (25) 53 (51) (10) 9 (11) 23 12 (20) (8) (31) 5 4
Change in Offshore Banking 2019P (41) (1) (20) (10) 18 (24) (4) Units (OBUs) NFA 2018 12 34 (22) 28 (29) 5 30 (18) (12) 4 3 2 (13)
Personal remittances 2019P 16,252 2,745 2,557 2,796 2,713 2,896 2,545 2018 32,212 2,655 2,528 2,627 2,616 2,746 2,615 2,675 2,760 2,490 2,757 2,586 3,157
67
Continued

68
TABLE 4.10--Concluded
Indicator Year Total January February March April May June July August September October November December
of which: Of cash remittances 2019P 14,639 2,484 2,301 2,514 2,441 2,609 2,290 channeled thru the banking 2018 28,942 2,379 2,267 2,360 2,347 2,469 2,357 2,401 2,476 2,237 2,474 2,326 2,849 system
Note : Totals may not add up due to rounding.
Source: Bangko Sentral ng Pilipinas
Indicator Year Average January February March April May June July August September October November December
Total Loans 2019p 9,120,539 8,852,484 8,844,774 8,918,522 9,086,615 9,013,257 9,204,615 9,326,023 9,285,620 9,552,9432018p 8,341,620 7,827,247 7,806,012 7,996,321 8,053,595 8,146,968 8,331,361 8,353,021 8,405,688 8,658,774 8,721,418 8,781,253 9,017,780
Expanded commercial banks 2019p 6,969,863 6,738,342 6,775,847 6,808,515 6,917,642 6,908,837 7,009,224 7,130,098 7,140,881 7,299,3822018p 6,373,361 6,019,713 6,032,827 6,142,550 6,204,221 6,291,608 6,380,790 6,386,630 6,409,457 6,532,880 6,571,919 6,626,459 6,881,280
Non-expanded commercial 2019p 351,481 363,526 348,794 341,697 354,185 349,699 346,219 356,857 346,926 355,422banks 2018p 328,770 323,712 301,422 305,492 309,165 319,744 314,590 331,102 341,645 348,141 355,736 349,374 345,120
Government 1 2019p 1,201,193 1,152,706 1,160,176 1,190,969 1,198,264 1,186,441 1,224,037 1,227,802 1,219,172 1,251,1662018p 1,060,193 927,196 944,246 1,008,656 992,258 992,655 1,066,631 1,047,159 1,037,986 1,169,818 1,175,291 1,164,040 1,196,382
Foreign 2 2019p 598,003 597,909 559,957 577,340 616,523 568,280 625,134 611,267 578,641 646,9722018p 579,295 556,626 527,517 539,622 547,950 542,961 569,349 588,130 616,600 607,935 618,472 641,379 594,998
Loan loss provisions 2019p 160,300 152,457 156,200 158,379 158,305 161,065 162,826 165,160 169,638 158,6712018p 156,984 148,978 154,615 159,597 160,884 158,478 158,846 160,699 161,301 155,904 157,607 158,563 148,339
Expanded commercial banks 2019p 114,505 108,147 111,663 114,031 113,853 116,096 116,582 118,088 120,874 111,2152018p 115,158 109,424 114,514 118,991 119,936 117,326 116,584 118,492 118,471 113,192 114,757 115,705 104,501
Non-expanded commercial 2019p 11,475 11,466 11,549 11,236 11,175 11,463 11,510 11,640 11,668 11,564banks 2018p 10,408 9,557 9,629 9,794 9,823 9,877 10,702 10,428 10,786 10,724 10,925 11,111 11,534
Government 1 2019p 25,053 23,441 23,576 23,859 24,038 24,206 25,268 25,810 27,472 27,8102018p 21,472 19,814 20,306 20,634 20,916 21,034 21,281 21,355 21,620 22,662 22,680 22,458 22,907
Foreign 2 2019p 9,456 9,403 9,412 9,253 9,240 9,300 9,465 9,621 9,624 9,7882018p 9,947 10,183 10,167 10,178 10,210 10,240 10,278 10,424 10,423 9,326 9,245 9,288 9,396
1 Consists of Land Bank, DBP and Al-Amanah Islamic Bank2 Consists of 13 foreign banks, excludes 3 foreign banks' subsidiaries
Source: Bangko Sentral ng Pilipinas
TABLE 4.11 Loans by Type of Commercial Banks: 2018 and 2019
Money and Banking
(In Million Pesos)

Money and Banking
Indicator Year Average January February March April May June July August September October November December
Broad money liabilities by 2019 11,767,181 11,433,354 11,514,811 11,583,601 11,666,995 11,741,648 11,801,627 11,887,876 11,877,665 12,038,137 r 12,126,092 p
composition (M3) (million P) 2018 11,064,610 10,600,467 10,735,994 10,919,092 10,905,992 11,039,096 11,067,458 11,117,680 11,169,660 11,179,447 11,155,774 11,259,401 11,625,258 r
Currency outside depository 2019 1,180,725 1,140,321 1,142,416 1,188,962 1,216,979 1,220,865 1,181,723 1,156,807 1,166,362 1,181,024 r 1,211,793 corporations 2018 1,065,152 982,200 991,916 1,056,668 1,053,850 1,059,495 1,050,494 1,029,224 1,041,619 1,065,917 1,093,226 1,124,891 1,232,326 r
Transferable deposits 2019 2,776,789 2,652,542 2,686,384 2,700,518 2,731,660 2,720,087 2,758,413 2,826,570 2,852,114 2,916,307 r 2,923,298 p
2018 2,643,639 2,560,905 2,589,446 2,609,525 2,667,834 2,693,366 2,684,582 2,698,333 2,641,765 2,650,034 2,622,237 2,648,583 2,657,056 r
Savings deposits 2019 4,613,872 4,613,012 4,609,236 4,570,591 4,561,910 4,583,355 4,576,248 4,657,077 4,620,583 4,663,134 r 4,683,570 p
2018 4,568,455 4,374,520 4,426,578 4,477,067 4,437,022 4,551,981 4,580,356 4,628,570 4,700,772 4,691,890 4,664,707 4,620,871 4,667,127 r
Time deposits 2019 2,573,800 2,469,624 2,472,309 2,517,015 2,540,851 2,596,659 2,664,628 2,588,614 2,582,627 2,644,287 r 2,661,384 p
2018 2,321,058 2,248,255 2,289,748 2,337,510 2,307,888 2,274,783 2,301,068 2,290,988 2,311,539 2,299,266 2,292,193 2,378,649 2,520,810 r
Securities other than shares 2019 621,995 557,856 604,466 606,514 615,595 620,683 620,614 658,808 655,979 633,385 r 646,047 p
included in broad money 2018 466,306 434,587 438,306 438,322 439,398 459,471 450,959 470,565 473,965 472,340 483,412 486,408 547,939 r
Broad money liabilities by 2019 11,767,181 11,433,354 11,514,811 11,583,601 11,666,995 11,741,648 11,801,627 11,887,876 11,877,665 12,038,137 r 12,126,092 p
origin (M3) (million P) 2018 11,064,610 10,600,467 10,735,994 10,919,092 10,905,992 11,039,096 11,067,458 11,117,680 11,169,660 11,179,447 11,155,774 11,259,401 11,625,258 r
Net foreign assets 2019 4,743,795 4,581,873 4,596,115 4,718,095 4,708,578 4,806,965 4,738,857 4,740,174 4,934,774 4,831,113 r 4,781,410 p
2018 4,515,058 4,639,140 4,665,685 4,621,732 4,533,656 4,604,137 4,539,316 4,479,128 4,531,896 4,460,019 4,360,840 4,284,225 4,460,925 r
BSP 2019 4,306,018 4,228,791 4,212,109 4,326,205 4,296,137 4,383,966 4,280,003 4,264,270 4,415,350 4,364,024 r 4,289,325 p
2018 4,042,033 4,095,150 4,112,166 4,130,062 4,043,220 4,086,464 4,064,205 4,002,718 4,091,231 3,977,283 3,922,474 3,890,542 4,088,881 r
Other depository 2019 437,777 353,082 384,006 391,890 412,441 422,999 458,854 475,904 519,424 467,089 r 492,085 p
corporations 2018 473,025 543,990 553,519 491,670 490,436 517,673 475,111 476,410 440,665 482,736 438,366 393,683 372,044 r
Domestic claims 2019 12,018,426 11,732,639 11,818,820 11,788,973 11,845,612 11,834,304 12,006,717 12,114,243 12,186,761 12,407,165 r 12,449,026 p
2018 11,218,994 10,427,841 10,562,139 10,792,733 10,874,463 11,077,473 11,204,026 11,352,613 11,378,380 11,540,062 11,656,669 11,742,474 12,019,058 r
Net claims on Central 2019 1,803,588 1,720,696 1,815,239 1,782,145 1,721,351 1,694,134 1,750,624 1,826,146 1,823,224 1,935,238 r 1,967,086 p
government 2018 1,789,875 1,628,883 1,671,016 1,778,049 1,710,350 1,810,669 1,816,195 1,853,982 1,779,931 1,825,736 1,841,550 1,855,811 1,906,322 r
Claims on other sectors 2019 10,214,838 10,011,943 10,003,581 10,006,828 10,124,260 10,140,169 10,256,093 10,288,097 10,363,537 10,471,927 r 10,481,941 p
2018 9,429,120 8,798,958 8,891,123 9,014,684 9,164,113 9,266,804 9,387,831 9,498,631 9,598,449 9,714,327 9,815,119 9,886,663 10,112,735 r
Transferable and other 2019 1,993,805 1,977,475 1,986,667 1,981,776 2,002,467 1,981,739 1,985,239 2,007,092 2,028,410 1,997,564 r 1,989,623 p
deposits in foreign 2018 1,924,296 1,917,591 1,921,371 1,876,384 1,874,286 1,897,036 1,894,138 1,932,205 1,920,492 1,954,015 1,972,394 1,964,293 1,967,345 r
currency (FCDs-residents)
Liabilities excluded from 2019 3,001,236 2,903,682 2,913,457 2,941,691 2,884,729 2,917,882 2,958,708 2,959,448 3,215,460 3,202,577 r 3,114,722 p
broad money 2018 2,745,147 2,548,923 2,570,460 2,618,990 2,627,841 2,745,478 2,781,746 2,781,857 2,820,124 2,866,620 2,889,342 2,803,005 2,887,381 r
Source: Bangko Sentral ng Pilipinas
TABLE 4.12 Broad Money Liabilities: 2018 and 2019(In Million Pesos)
69

70
Indicator Year Average January February March April May June July August September October November December
BSP rates Buying rate 2019 51.486 52.100 51.650 52.500 51.850 51.950 51.000 50.650 51.950 51.600 50.650 50.450
2018 52.563 51.150 51.800 52.050 51.700 52.350 53.250 52.950 53.200 54.000 53.350 52.350 52.600
Selling rate 2019 51.986 52.600 52.150 53.000 52.350 52.450 51.500 51.150 52.450 52.100 51.150 50.9502018 53.083 51.650 52.300 52.550 52.200 52.850 53.750 53.700 53.700 54.500 53.850 52.850 53.100
PDS reference rate 2019 51.736 52.350 51.900 52.750 52.100 52.200 51.250 50.900 52.200 51.850 50.900 50.7002018 52.811 51.400 52.050 52.300 51.950 52.600 53.500 53.220 53.430 54.230 53.600 52.600 52.850
Source: Bangko Sentral ng Pilipinas
Indicator Year Average January February March April May June July August September October November December
Nominal 2019 r 13.74 13.49 13.53 13.52 13.63 13.71 13.76 13.90 13.78 13.79 13.92 14.082018 r 13.30 13.61 13.17 13.06 13.07 13.25 13.13 13.25 13.36 13.21 13.29 13.60 13.56
Real 2019 r 84.44 85.02 83.78 83.22 84.21 84.59 84.97 85.01 83.86 83.62 84.58 r 85.942018 r 80.81 83.04 79.34 78.86 79.62 80.42 80.20 80.26 81.07 80.46 81.26 83.10 82.13
Source: Bangko Sentral ng Pilipinas
TABLE 4.14 Effective Exchange Rate Indices of the Peso: 2018 and 2019(1980=100)
TABLE 4.13 Guiding Rate Average: 2018 and 2019(Peso per US$)
Money and Banking

CHAPTER V Investments

Investments 73
Indicator Year Total January February March April May June July August September October November December
Philippine Stock Exchange 2019 87,076.96 8,007.48 7,705.49 7,920.93 7,952.72 7,970.02 7,999.71 8,045.80 7,979.66 7,779.07 7,977.12 7,738.96 Index (PSEi) 2018 92,507.92 8,764.01 8,475.29 7,979.83 7,819.25 7,497.17 7,193.68 7,672.00 7,855.71 7,276.82 7,140.29 7,367.85 7,466.02 (End of Period)
Source: Bangko Sentral ng Pilipinas
Indicator Year Total January February March April May June July August September October November December
Volume traded 2019 317,525.74 42,190.08 46,397.72 29,849.47 22,020.38 23,190.40 23,082.00 31,548.42 31,393.58 31,781.75 17,465.16 18,606.78 2018 403,847.17 22,887.50 64,930.38 88,550.87 34,510.26 22,002.45 20,890.98 21,627.49 31,520.51 19,999.70 19,178.91 26,095.81 31,652.31
Financial 2019 3,270.57 345.87 401.08 241.12 239.32 272.67 337.70 352.97 364.86 230.93 251.54 232.51 Industrial 30,982.68 3,539.16 2,873.43 2,091.00 2,459.72 3,653.40 5,131.29 2,183.35 2,549.76 2,228.02 2,114.42 2,159.13 Holding firms 37,841.33 2,927.79 7,645.29 4,593.10 2,487.58 2,423.62 3,425.47 3,265.28 2,693.02 2,251.03 1,983.60 4,145.55 Property 38,895.04 3,848.04 3,671.20 2,969.08 2,572.49 3,367.72 4,721.03 4,625.05 3,968.52 2,976.13 3,674.60 2,501.18 Services 50,197.07 8,298.95 8,292.55 5,728.72 3,313.18 3,536.89 3,886.28 5,049.32 3,416.54 4,034.05 3,042.41 1,598.18 Mining and oil 153,440.53 22,933.98 22,728.29 13,976.85 10,782.10 9,770.07 5,418.75 15,872.64 18,082.44 19,844.43 6,308.25 7,722.73
Stock Market Exchange 2,896.34 295.99 785.71 249.44 165.83 165.86 161.31 199.51 318.18 217.04 90.19 247.28 Exchange Traded Fund 1 2.21 0.30 0.16 0.15 0.16 0.18 0.17 0.30 0.27 0.13 0.17 0.22
Financial 2018 4,355.69 747.24 564.79 379.27 246.25 328.92 343.57 330.89 245.95 289.90 219.30 375.14 284.47 Industrial 28,560.42 1,610.76 1,895.11 3,203.89 3,136.96 1,624.93 2,270.61 1,460.45 2,178.85 1,919.02 1,832.96 5,007.55 2,419.33 Holding firms 37,510.42 2,494.96 3,868.29 3,537.51 2,608.24 2,881.30 2,773.42 4,448.37 4,656.20 2,936.36 2,119.71 2,820.39 2,365.67 Property 68,913.01 4,152.66 12,156.95 13,337.05 6,486.03 6,591.16 3,213.17 2,848.59 5,105.55 5,102.98 2,869.19 3,711.82 3,337.86 Services 64,474.42 6,001.04 12,885.22 7,647.51 3,375.21 2,754.27 3,780.20 4,757.68 6,848.22 3,530.18 2,788.26 5,243.29 4,863.34 Mining and oil 198,294.52 7,768.46 33,332.89 60,264.10 18,560.98 7,739.84 8,454.19 7,551.30 12,435.99 6,040.71 9,163.96 8,798.75 18,183.35
Stock Market Exchange 1,733.17 110.97 226.42 181.01 96.24 81.50 55.19 230.05 49.54 180.28 185.17 138.65 198.15 Exchange Traded Fund 5.56 1.42 0.73 0.53 0.35 0.54 0.63 0.16 0.22 0.28 0.36 0.22 0.12
1 Starting 2 December 2013, trading of an Exchange Traded Fund commenced. ETF is an open-end investment company that trades its shares in the stock exchange. An ETF company issues its shares in blocks called “Creation Units” in exchange for a basket of securities comprising the index it wishes to track. Creation is normally done by institutional investors, who break down the block into smaller portions and sell to retail investors in the Exchange.
Note : Totals may not add up due to rounding.
Source: Bangko Sentral ng Pilipinas
TABLE 5.1 Shares and Stocks: 2018 and 2019
TABLE 5.2 Volume Traded: 2018 and 2019(In Million Shares)

74
Indicator Year Total January February March April May June July August September October November December
Value of shares traded 2019 1,645,146.55 190,845.47 158,774.88 139,324.36 124,153.34 167,661.87 152,180.19 148,387.50 153,654.00 140,152.10 139,077.27 130,935.57 2018 1,736,822.36 179,615.24 167,939.77 173,369.60 131,138.94 137,944.72 125,459.41 110,368.93 133,763.61 117,143.30 111,828.07 212,745.90 135,504.87
Financial 2019 249,824.15 25,786.16 28,843.13 17,070.32 14,359.02 23,257.32 32,082.64 25,853.84 23,182.03 18,120.87 21,701.57 19,567.25 Industrial 297,656.21 31,368.64 26,586.31 25,996.18 22,292.97 34,258.83 31,991.12 29,974.66 29,568.07 24,629.66 22,660.33 18,329.44 Holding firms 415,563.17 55,143.09 32,137.69 40,399.60 25,880.19 44,071.00 27,948.86 34,073.10 35,162.11 34,016.70 38,333.66 48,397.17 Property 340,703.63 37,823.26 29,516.33 28,069.72 39,086.65 31,385.99 30,751.48 30,368.53 36,272.16 31,804.50 21,634.79 23,990.22 Services 297,852.31 37,664.93 38,380.68 25,286.03 20,180.54 30,182.68 27,404.80 23,920.50 22,866.26 23,266.05 31,612.84 17,087.00 Mining and oil 34,760.69 2,495.21 1,869.87 2,088.06 2,100.32 4,209.37 1,781.18 3,727.72 3,511.57 7,533.09 2,694.81 2,749.49
Stock Market Exchange 8,526.31 528.80 1,421.67 396.60 235.15 276.29 199.46 432.89 3,060.05 766.40 419.58 789.42 Exchange Traded Fund 1 260.05 35.36 19.20 17.84 18.49 20.39 20.66 36.26 31.77 14.82 19.68 25.58
Financial 2018 271,071.37 38,058.73 21,915.52 26,005.96 18,043.14 21,129.42 22,724.33 24,075.79 16,235.57 19,772.88 16,852.42 27,489.59 18,768.02 Industrial 355,193.79 31,110.58 24,262.10 27,186.51 30,262.46 24,703.43 22,461.48 17,524.09 22,541.62 21,802.88 25,656.77 78,955.34 28,726.53 Holding firms 400,471.44 40,700.04 36,024.17 47,958.76 31,376.04 32,978.90 30,875.85 28,208.35 32,246.83 32,345.81 25,130.57 31,792.66 30,833.47 Property 319,095.18 31,650.34 31,786.56 32,503.60 21,213.21 32,924.26 26,146.92 19,918.94 31,287.35 21,453.93 20,810.92 25,320.04 24,079.11 Services 332,909.85 33,212.29 44,132.25 32,478.65 25,331.06 23,427.27 20,159.60 17,191.00 25,497.44 18,338.14 19,459.99 43,309.22 30,372.94 Mining and oil 50,848.47 3,892.51 8,546.55 6,388.88 4,466.03 2,413.56 2,781.41 2,657.82 5,744.26 2,395.77 3,526.93 5,642.51 2,392.25
Stock Market Exchange 6,559.08 801.58 1,177.72 781.56 405.30 304.69 239.67 775.68 185.63 1,003.28 351.90 213.42 318.65 Exchange Traded Fund 673.16 189.16 94.90 65.68 41.71 63.19 70.16 17.25 24.92 30.61 38.57 23.12 13.89
1 Starting 2 December 2013, trading of an Exchange Traded Fund (ETF) commenced. ETF is an open-end investment company that trades its shares in the stock exchange. An ETF company issues its shares in blocks called “Creation Units” in exchange for a basket of securities comprising the index it wishes to track. Creation is normally done by institutional investors, who break down the block into smaller portions and sell to retail investors in the Exchange.
Note : Totals may not add up due to rounding.
Source: Bangko Sentral ng Pilipinas
(In Million Pesos)
Investments
TABLE 5.3 Value of Shares Traded: 2018 and 2019

CHAPTER VI Government Finance

Government Finance 77
Indicator Year Total January February March April May June July August September October November December
Total 2019 77,875,843 7,494,159 7,451,557 7,802,258 7,786,812 7,915,528 7,868,634 7,804,053 7,939,079 7,907,686 7,906,077 2018 84,110,924 6,726,091 6,820,660 6,878,889 6,874,708 6,832,572 7,016,191 7,043,586 7,103,854 7,159,776 7,167,079 7,195,018 7,292,500
Domestic 2019 51,846,925 4,909,837 4,898,184 5,196,823 5,205,372 5,256,382 5,294,830 5,250,668 5,272,295 5,257,760 5,304,774 2018 54,695,004 4,430,785 4,429,864 4,465,776 4,498,855 4,424,338 4,579,083 4,600,534 4,572,926 4,587,774 4,620,223 4,707,987 4,776,859
External 2019 26,028,918 2,584,322 2,553,373 2,605,435 2,581,440 2,659,146 2,573,804 2,553,385 2,666,784 2,649,926 2,601,303 2018 29,415,920 2,295,306 2,390,796 2,413,113 2,375,853 2,408,234 2,437,108 2,443,052 2,530,928 2,572,002 2,546,856 2,487,031 2,515,641
Source: Bureau of the Treasury
Indicator Year Total January February March April May June July August September October November December
Total 2019 583,420 77,614 99,781 42,801 53,840 27,407 83,811 92,460 31,581 48,923 25,202 2018 775,589 83,806 80,488 33,906 27,846 159,096 30,756 47,211 118,836 38,593 29,180 38,688 87,183
Interest Payments 2019 314,465 45,916 25,302 36,552 23,536 19,669 29,096 50,965 19,611 43,094 20,724 2018 349,215 43,516 26,097 27,549 23,172 21,111 24,065 44,841 28,301 32,675 24,015 24,660 29,213
Principal payments 2019 268,955 31,698 74,479 6,249 30,304 7,738 54,715 41,495 11,970 5,829 4,478 2018 426,374 40,290 54,391 6,357 4,674 137,985 6,691 2,370 90,535 5,918 5,165 14,028 57,970
Domestic 2019 356,867 25,115 85,683 27,259 42,480 15,775 23,450 70,585 17,927 34,338 14,255 2018 558,281 63,460 15,922 20,409 16,224 149,270 19,675 24,593 103,837 23,752 18,238 28,340 74,561
Interest payments 2019 210,401 25,108 14,813 26,915 16,528 15,775 23,450 30,639 9,144 34,338 13,691 2018 243,232 24,468 15,922 19,944 16,108 18,634 19,496 24,320 17,487 23,752 17,512 21,652 23,937
Principal payments 2019 146,466 7 70,870 344 25,952 0 0 39,946 8,783 0 564 2018 315,049 38,992 0 465 116 130,636 179 273 86,350 0 726 6,688 50,624
External 2019 226,553 52,499 14,098 15,542 11,360 11,632 60,361 21,875 13,654 14,585 10,947 2018 227,373 20,346 74,631 13,497 11,622 9,826 11,081 22,618 14,999 14,841 10,942 10,348 12,622
Interest payments 2019 104,064 20,808 10,489 9,637 7,008 3,894 5,646 20,326 10,467 8,756 7,033 2018 116,048 19,048 20,240 7,605 7,064 2,477 4,569 20,521 10,814 8,923 6,503 3,008 5,276
Principal payments 2019 122,489 31,691 3,609 5,905 4,352 7,738 54,715 1,549 3,187 5,829 3,914 2018 111,325 1,298 54,391 5,892 4,558 7,349 6,512 2,097 4,185 5,918 4,439 7,340 7,346
Source: Bureau of the Treasury
TABLE 6.1 National Government Outstanding Debt: 2018 and 2019 (In Million Pesos)
TABLE 6.2 National Government Debt Service: 2018 and 2019 (In Million Pesos)

78
Indicator Year Total January February March April May June July August September October November December
Revenues 2019 2,589,463 256,742 202,085 228,918 308,676 317,236 233,886 264,094 279,745 236,528 261,553 2018 2,850,184 238,898 178,535 202,360 307,558 258,992 224,199 241,743 256,875 202,351 246,762 259,702 232,209
Tax Revenues 2019 2,328,127 235,238 182,500 198,296 288,787 265,615 210,548 236,890 261,791 211,005 237,457 2018 2,565,910 218,070 162,882 177,710 280,947 226,887 188,226 217,699 239,609 183,445 222,248 242,220 205,967
Bureau of Internal 2019 1,780,872 185,088 135,720 147,411 235,461 204,838 157,829 180,341 205,587 150,475 178,122 Revenue 2018 1,951,850 175,612 116,641 130,827 232,618 172,032 136,780 163,999 185,091 130,573 164,792 192,048 150,837
Bureau of Customs 2019 527,701 48,376 44,200 49,294 51,674 58,168 51,298 54,644 53,593 58,802 57,6522018 593,111 40,831 43,716 45,251 46,794 52,747 50,049 52,144 52,012 51,075 55,953 47,902 54,637
Other offices 2019 19,554 1,774 2,580 1,591 1,652 2,609 1,421 1,905 2,611 1,728 1,6832018 20,949 1,627 2,525 1,632 1,535 2,108 1,397 1,556 2,506 1,797 1,503 2,270 493
Non-tax revenues 2019 261,146 21,504 19,581 30,593 19,881 51,615 23,247 27,203 17,954 25,517 24,0512018 284,223 20,828 15,653 24,650 26,611 32,105 35,951 24,044 17,266 18,906 24,514 17,482 26,213
Grants 2019 190 0 4 29 8 6 91 1 0 6 45 2018 51 0 0 0 0 0 22 0 0 0 0 0 29
Expenditures 2019 2,937,713 212,205 278,458 287,327 221,804 314,672 275,724 339,390 282,233 415,085 310,815 2018 3,408,443 228,707 230,204 313,053 261,243 291,865 278,487 328,126 259,462 298,598 306,627 298,820 313,251
Allotment to LGUs 2019 512,199 0 97,328 52,173 47,967 47,957 50,293 49,152 53,670 59,812 53,847 2018 575,653 43,308 59,162 46,272 58,836 48,657 46,427 46,356 45,939 47,868 44,601 44,059 44,168
Interest Payments 2019 314,465 45,916 25,302 36,552 23,536 19,669 29,096 50,965 19,611 43,094 20,724 2018 349,215 43,516 26,097 27,549 23,172 21,111 24,065 44,841 28,301 32,675 24,015 24,660 29,213
Tax Expenditures 2019 22,919 1,281 1,283 1,423 2,908 2,289 2,396 603 4,143 5,742 851 2018 21,592 1,441 354 2,584 2,513 574 744 1,524 2,272 1,982 831 690 6,083
Subsidy 2019 158,736 795 2,769 5,740 5,115 5,239 7,040 38,288 31,808 54,704 7,238 2018 136,652 922 9,126 35,240 3,874 3,832 14,750 32,470 5,037 19,583 1,551 8,086 2,181
Equity 2019 1,735 0 20 22 51 75 409 163 86 854 55 2018 3,985 0 31 2,000 18 0 538 484 6 770 25 90 23
Net lending 2019 17,121 (406) 3,252 698 135 14,963 170 (1,308) 3,197 (4,788) 1,208 2018 4,876 20 (1,078) 817 25 1,412 175 1,322 3,067 1,078 (1,316) 990 (1,636)
Others 2019 1,910,538 164,619 148,504 190,719 142,092 224,480 186,320 201,527 169,718 255,667 226,892 2018 2,316,474 139,503 136,512 198,591 172,805 216,279 191,789 201,129 174,840 194,642 236,920 220,245 233,219
Continued
Government Finance
TABLE 6.3 National Government Cash Operations: 2018 and 2019 (In Million Pesos)

Government Finance 79
TABLE 6.3--Concluded
Indicator Year Total January February March April May June July August September October November December
Surplus 2019 (348,250) 44,537 (76,373) (58,409) 86,872 2,564 (41,838) (75,296) (2,488) (178,557) (49,262) 2018 (558,259) 10,191 (51,669) (110,693) 46,315 (32,873) (54,288) (86,383) (2,587) (96,247) (59,865) (39,118) (81,042)
Financing 2019 843,482 217,107 56,724 308,218 33,268 117,869 (1,006) (2,909) 73,233 (4,817) 45,795 2018 783,315 44,661 54,479 45,031 32,018 50,509 153,291 42,026 129,601 38,061 28,937 90,380 74,321
External (Net) 2019 171,279 83,930 (2,697) 10,562 (922) 66,961 (40,350) 1,666 43,667 9,631 (1,169)
2018 191,790 16,980 55,948 9,931 (1,103) (4,815) (1,118) 20,975 71,668 23,614 (2,629) (3,930) 6,269
Domestic (Net) 2019 672,220 133,177 59,438 297,656 34,190 50,908 39,344 (4,575) 29,566 (14,448) 46,964 2018 591,525 27,681 (1,469) 35,100 33,121 55,324 154,409 21,051 57,933 14,447 31,566 94,310 68,052
Change-In-Cash 2019 236,360 215,141 (66,415) 206,233 106,952 104,529 (54,945) (140,883) 60,130 (188,825) (5,557) 2018 (52,649) 18,778 (17,787) (62,866) 86,260 (114,512) 64,604 (51,342) 82,270 (57,505) (32,372) 38,315 (6,492)
Note: Details may not add up to totals due to rounding.
Source: Bureau of the Treasury

CHAPTER VII Labor

83
Indicator Year Total January February March April May June July August September October November December
Total 2019 24,858,485 2,483,616 2,300,797 2,514,251 2,440,630 2,609,471 2,289,532 2,580,711 2,589,236 2,379,042 2,671,1992018 28,943,112 2,379,201 2,267,356 2,359,615 2,346,900 2,469,383 2,356,881 2,400,790 2,476,474 2,237,003 2,473,972 2,326,471 2,849,066
Land-based 2019 19,436,173 1,950,660 1,777,130 1,986,976 1,882,317 2,067,204 1,746,442 2,019,112 2,046,178 1,843,590 2,116,5642018 22,803,599 1,906,116 1,784,291 1,885,845 1,842,198 1,946,705 1,845,913 1,889,730 1,951,368 1,735,236 1,935,591 1,826,152 2,254,454
Sea-based 2019 5,422,312 532,956 523,667 527,275 558,312 542,267 543,090 561,600 543,058 535,452 554,6352018 5,870,827 410,251 460,817 527,364 481,529 461,843 529,105 474,046 514,311 494,129 486,673 488,155 542,604
Asia 2019 5,276,380 522,911 496,885 535,711 511,626 515,106 477,956 504,945 573,566 543,492 594,1822017 5,273,268 415,790 420,412 461,229 384,321 393,879 464,821 435,423 473,822 432,710 419,952 438,396 532,513
Land-based 2019 4,006,221 388,417 365,752 402,910 370,086 389,474 348,891 383,089 452,830 422,984 481,7882018 4,529,485 371,406 377,869 343,116 359,713 411,921 371,624 386,904 402,545 355,035 362,564 343,723 443,065
Sea-based 2019 1,270,159 134,494 131,133 132,801 141,539 125,632 129,065 121,855 120,737 120,509 112,3942018 1,394,927 105,681 112,192 104,777 103,934 118,079 109,475 117,714 112,514 123,639 109,185 124,204 153,533
Americas 2019 10,486,056 1,003,695 924,417 979,385 1,050,008 1,076,549 995,526 1,132,650 1,091,933 1,080,490 1,151,4032018 11,296,425 905,296 832,799 939,197 939,194 893,926 945,459 926,852 1,004,597 922,956 966,142 895,784 1,124,223
Land-based 2019 8,209,065 786,500 711,201 776,475 817,598 846,719 768,143 886,167 864,200 845,533 906,5292018 8,704,426 705,542 630,174 733,695 717,253 673,486 728,981 716,648 774,370 718,096 732,373 694,603 879,205
Sea-based 2019 2,276,994 217,195 213,216 202,910 232,411 229,830 227,384 246,483 227,733 234,958 244,8742018 2,592,000 199,754 202,626 205,502 221,941 220,439 216,478 210,204 230,227 204,860 233,770 201,181 245,018
Oceania 2019 675,528 75,280 63,183 73,504 64,977 72,835 62,857 69,382 67,049 67,053 59,4082018 804,028 42,468 59,861 54,875 67,008 74,197 65,926 69,837 71,328 74,204 67,621 72,151 84,552
Land-based 2019 589,935 63,020 56,380 61,550 56,401 66,782 55,509 62,094 58,361 59,008 50,8302018 733,122 38,940 55,556 50,298 62,804 69,707 60,857 60,084 65,072 66,646 61,188 66,251 75,719
Sea-based 2019 85,594 12,259 6,803 11,954 8,576 6,053 7,349 7,288 8,688 8,046 8,5782018 70,906 3,529 4,305 4,577 4,204 4,490 5,069 9,753 6,256 7,558 6,432 5,900 8,833
Europe 2019 3,296,911 344,848 325,421 341,621 330,085 334,715 346,176 341,568 320,380 274,525 337,5722018 4,153,281 338,752 336,530 316,358 350,081 376,544 350,246 353,138 336,486 329,191 352,484 317,750 395,721
Land-based 2019 1,623,713 187,738 164,958 173,421 164,034 166,494 177,542 168,630 143,657 116,159 161,0802018 2,195,744 182,762 182,271 167,793 185,389 205,635 179,501 191,039 170,839 175,029 173,245 160,523 221,718
Sea-based 2019 1,673,199 157,110 160,463 168,200 166,051 168,220 168,635 172,938 176,723 158,367 176,4922018 1,957,538 155,989 154,259 148,566 164,692 170,910 170,744 162,099 165,647 154,162 179,240 157,227 174,003
Continued
Labor
TABLE 7.1 Remittances of Overseas Filipino Workers by Country of Origin and Type of Worker : 2018 and 2019(In Thousand US Dollars)

84
TABLE 7.1--Concluded
Indicator Year Total January February March April May June July August September October November December
Middle East 2019 5,005,104 522,893 478,525 572,987 474,570 597,358 396,508 518,314 526,698 399,975 517,2762018 6,617,315 607,167 537,430 588,696 515,472 584,274 504,170 533,812 536,367 420,004 603,515 556,079 630,329
Land-based 2019 4,965,204 519,620 474,279 568,238 470,653 593,023 393,150 513,789 523,315 396,234 512,9032018 6,576,639 603,449 533,669 585,465 511,947 580,675 500,139 530,059 533,091 415,848 601,111 553,883 627,303
Sea-based 2019 39,900 3,273 4,246 4,749 3,917 4,335 3,358 4,525 3,383 3,741 4,3732018 40,675 3,718 3,761 3,231 3,525 3,599 4,031 3,752 3,276 4,156 2,404 2,196 3,026
Africa 2019 118,506 13,990 12,365 11,043 9,364 12,909 10,509 13,853 9,611 13,505 11,3572018 147,651 8,431 10,675 12,596 11,497 10,441 9,981 12,533 12,637 11,975 12,461 16,781 17,643
Land-based 2019 42,040 5,366 4,560 4,383 3,545 4,711 3,209 5,343 3,816 3,674 3,4332018 64,183 4,017 4,752 5,478 5,091 5,281 4,811 4,996 5,451 4,584 5,110 7,169 7,443
Sea-based 2019 76,465 8,624 7,805 6,660 5,819 8,197 7,299 8,510 5,795 9,832 7,9242018 83,470 4,414 5,924 7,118 6,406 5,160 5,171 7,537 7,186 7,391 7,351 9,612 10,200
Note: Details may not add up to totals due to rounding.
Source: Bangko Sentral ng Pilipinas
Labor

85
Indicator Year Total January February March April May June July August September October November December
Strike notices
Cases pending, beginning 2019 449 36 38 47 41 52 58 49 40 41 472018 568 31 31 45 46 47 52 51 59 60 53 49 44
New notices of strike/lockout 2019 195 13 21 18 18 23 12 16 21 23 30 filed 2018 202 10 22 17 16 17 17 26 23 19 12 11 12
Cases handled 2019 644 49 59 65 59 75 70 65 61 64 772018 770 41 53 62 62 64 69 77 82 79 65 60 56
Cases disposed 2019 172 11 12 24 7 17 21 25 20 17 182018 197 10 8 16 15 12 18 18 22 26 16 16 20
Settled 2019 148 9 11 20 6 16 19 22 15 14 162018 177 8 7 14 15 11 17 17 18 24 11 15 20
Assumed jurisdiction 2019 6 0 0 2 0 1 0 2 0 1 02018 2 0 0 0 0 0 0 0 0 0 1 1 0
Certified for compulsory 2019 3 0 0 0 0 0 0 0 3 0 0 arbitration 2018 1 1 0 0 0 0 0 0 0 0 0 0 0
Treated as Preventive 2019 1 0 0 1 0 0 0 0 0 0 0 Mediation Case 2018 0 0 0 0 0 0 0 0 0 0 0 0 0
Materialized into actual 2019 9 2 1 1 1 0 2 0 1 1 0 strike/lockout 2018 13 1 1 0 0 0 1 1 4 2 3 0 0
Subsumed/Consolidated to 2019 1 0 0 1 0 0 0 0 0 0 0 AJ/CCA 2018 1 0 0 0 0 0 0 0 0 0 1 0 0
Others 2019 5 0 0 0 0 0 0 1 1 1 22018 3 0 0 2 0 1 0 0 0 0 0 0 0
Pending, end of period 2019 472 38 47 41 52 58 49 40 41 47 592018 573 31 45 46 47 52 51 59 60 53 49 44 36
Workers involved in notices of 2019 56,692 3,107 4,901 1,898 2,874 9,470 2,148 10,720 4,815 6,211 10,548 strikes/lockouts filed during 2018 67,922 1,445 4,237 6,257 4,494 3,908 2,799 8,616 12,258 15,557 2,547 3,685 2,119 the period
Continued
TABLE 7.2 Strike Notices and Actual Strikes: 2018 and 2019
Labor

86
TABLE 7.2--Concluded
Indicator Year Total January February March April May June July August September October November December
Actual strikes
Cases pending, beginning 2019 32 3 3 2 3 2 2 4 4 5 42018 17 0 1 1 0 0 1 2 1 4 3 4 0
New strikes declared 2019 14 3 1 2 1 0 2 1 2 1 12018 14 1 1 0 0 1 1 1 4 2 3 0 0
Cases handled 2019 46 6 4 4 4 2 4 5 6 6 52018 31 1 2 1 0 1 2 3 5 6 6 4 0
Work normalized 2019 13 3 2 1 2 0 0 1 1 2 12018 11 0 1 1 0 0 0 2 1 3 2 1 0
Settled 2019 11 3 2 1 1 0 0 0 1 2 12018 7 0 1 1 0 0 0 0 1 2 1 1 0
Assumed jurisdiction by 2019 0 0 0 0 0 0 0 0 0 0 0 the Secretary 2018 1 0 0 0 0 0 0 0 0 1 0 0 0 Certified for compulsary 2019 0 0 0 0 0 0 0 0 0 0 0 arbitration 2018 1 0 0 0 0 0 0 0 0 0 1 0 0
Others 2019 2 0 0 0 1 0 0 1 0 0 02018 2 0 0 0 0 0 0 2 0 0 0 0 0
Workers involved 2019 2,941 595 80 160 90 0 408 220 676 212 5002018 8,102 270 240 0 0 133 1,400 231 691 209 4,928 0 0
Pending at the end of the period 2019 33 3 2 3 2 2 4 4 5 4 42018 20 1 1 0 0 1 2 1 4 3 4 3 0
Mandays lost from on-going 2019 97,577 12,550 1,538 2,654 2,768 1,475 5,317 15,825 16,572 17,187 21,691 strikes 2018 160,763 540 8,880 1,350 0 2,527 33,992 36,785 5,316 15,580 41,025 12,731 2,037
Source: National Conciliation and Mediation Board
Labor

CHAPTER VIII Tourism and Transportation

89
Indicator Year Total January February March April May June July August September October November December
Total 2019 6,800,052 723,390 766,865 714,309 662,987 621,719 643,780 719,057 702,843 606,553 638,5492018 7,145,792 732,506 673,831 642,757 591,137 537,743 530,267 609,078 551,088 512,240 518,362 559,057 687,726
ASEAN 2019 428,754 40,334 44,606 47,639 40,299 45,999 48,992 42,212 38,389 41,027 39,2572018 530,313 41,331 43,620 48,526 47,825 48,001 49,155 41,106 39,160 42,944 42,549 44,832 41,264
East Asia 2019 4,040,825 388,051 460,531 415,942 361,242 348,418 373,535 436,148 474,913 394,742 387,3032018 3,861,240 395,555 398,779 334,692 307,825 267,025 270,172 331,271 330,763 305,278 278,248 292,452 349,180
South Asia 2019 134,258 17,748 13,114 12,297 12,098 13,083 13,936 13,552 13,419 13,085 11,9262018 149,215 16,174 11,449 13,202 12,382 13,021 11,844 13,095 11,543 11,364 11,088 13,469 10,584
Middle East 2019 63,689 5,853 6,010 6,622 5,629 2,947 10,136 8,581 7,243 5,044 5,6242018 82,252 7,772 6,577 7,742 6,965 4,261 9,103 10,453 7,900 5,200 5,727 6,117 4,435
North America 2019 1,064,281 137,898 117,276 112,149 110,504 111,332 110,925 111,992 82,458 73,479 96,2682018 1,265,107 138,385 104,370 113,674 105,080 112,618 106,841 109,453 78,775 71,307 91,916 98,138 134,550
South America 2019 15,445 2,119 1,744 1,868 1,821 1,539 1,116 1,004 1,404 1,391 1,4392018 14,680 1,633 1,476 1,465 1,447 1,103 841 954 985 974 1,053 1,144 1,605
Western Europe 2019 239,688 30,823 34,889 31,655 30,219 20,318 15,202 22,612 18,114 15,213 20,6432018 267,278 27,448 28,615 28,102 25,725 19,521 14,073 22,074 16,571 14,256 18,204 21,980 30,709
Northern Europe 2019 246,871 28,493 27,510 26,618 31,093 22,990 22,728 28,156 20,395 16,865 22,0232018 297,843 29,238 25,193 32,798 24,687 21,393 21,238 27,629 19,970 16,314 20,583 23,056 35,744
Southern Europe 2019 79,247 9,069 8,836 8,245 9,413 6,100 5,539 8,607 10,539 5,628 7,2712018 88,310 8,936 7,054 8,082 6,697 5,521 5,043 7,895 9,437 5,248 6,381 8,424 9,592
Eastern Europe 2019 48,382 8,028 7,896 7,182 5,312 3,816 2,900 2,770 2,778 3,298 4,4022018 54,039 7,849 6,212 6,162 4,571 3,276 2,392 2,436 2,366 2,838 3,589 5,899 6,449
Eastern Mediterranean 2019 26,141 3,534 3,523 2,817 3,170 2,155 1,576 2,008 2,250 2,456 2,652Europe 2018 28,958 3,756 2,976 3,210 2,549 1,920 1,408 1,927 2,006 2,387 1,677 2,487 2,655
Australasia/Pacific 2019 280,299 36,140 26,256 26,785 34,503 27,445 25,195 27,579 21,756 25,867 28,7732018 354,038 38,189 24,320 29,910 31,522 27,828 27,106 27,737 22,304 25,341 26,550 28,207 45,024
Africa 2019 9,471 973 940 965 1,019 1,071 846 850 894 925 9882018 9,646 874 776 862 796 825 809 707 557 635 714 728 1,363
Others and not specified 2019 68,796 9,055 9,306 8,615 7,014 5,648 5,814 6,214 5,381 5,532 6,217 residences 2018 71,001 7,446 7,213 7,058 5,925 4,862 4,740 5,375 4,448 4,287 5,301 7,423 6,923
Continued
Tourism and Transportation
TABLE 8.1 Visitor Arrivals by Country of Residence: 2018 and 2019

90
TABLE 8.1--Concluded
Indicator Year Total January February March April May June July August September October November December
Overseas Filipinos 2019 53,905 5,272 4,428 4,910 9,651 8,858 5,340 6,772 2,910 2,001 3,7632018 71,872 7,920 5,201 7,272 7,141 6,568 5,502 6,966 4,303 3,867 4,782 4,701 7,649
Source: Department of Tourism
Indicator Year Average January February March April May June July August September October November December
Blue Line
Passenger traffic 2019 5.04 5.59 5.05 5.61 4.11 4.84 4.74 5.59 5.69 5.94 3.28 (In million passengers) 2018 5.39 5.79 5.44 5.21 4.90 4.97 4.87 5.35 5.82 5.57 6.01 5.47 5.29
Load factor 2019 60.68 60.94 66.29 65.53 55.50 58.33 56.69 63.01 67.02 65.57 47.93 (In percent) 2018 63.19 63.66 70.38 58.46 60.74 57.18 59.77 62.29 72.07 65.06 62.57 64.55 61.55
Gross revenue collection 2019 95.52 107.79 97.53 107.49 79.43 93.35 90.02 105.19 106.71 110.88 56.85 (In million pesos) 2018 104.22 111.70 105.16 100.31 94.82 96.42 93.31 108.74 111.42 106.70 115.00 105.30 101.75
Source : Light Rail Transit Authority
Tourism and Transportation
TABLE 8.2 Light Rail Transit: Philippines, 2018 and 2019

91
Indicator Year Total January February March April May June July August September October November December
Aircraft movement
Total 2018 809,700 79,824 71,614 80,974 76,365 89,784 74,981 53,155 49,435 51,578 58,125 55,652 68,213 2017 886,619 65,773 67,845 76,713 72,277 81,017 75,137 70,237 76,897 75,554 79,550 75,998 69,621
National Capital Region 2018 147,838 24,452 23,242 24,553 24,695 26,309 24,587 0 0 0 0 0 02017 285,291 24,861 22,378 24,328 24,165 25,227 23,733 23,571 23,925 22,528 23,727 22,590 24,258
Cordillera Administrative 2018 1,266 92 168 136 90 94 48 64 0 358 44 104 68 Region 2017 1,254 156 144 136 116 128 82 66 68 58 78 144 78
I - Ilocos Region 2018 92,224 6,834 7,504 6,459 6,936 8,767 6,637 8,669 5,505 8,522 10,168 7,811 8,412 2017 69,061 4,672 5,420 6,522 4,806 5,540 5,813 5,396 6,406 6,432 7,436 6,346 4,272
II - Cagayan Valley 2018 27,794 1,228 1,062 1,392 1,704 1,604 1,600 1,618 1,368 1,442 1,361 1,601 11,814 2017 15,991 1,052 1,144 1,470 1,623 1,696 1,693 1,225 1,154 1,290 1,224 1,264 1,156
III - Central Luzon 2018 88,294 9,703 9,607 7,111 1,691 11,539 3,933 5,046 5,934 6,898 8,251 8,591 9,990 2017 114,876 8,467 9,206 12,268 8,342 11,539 12,135 8,609 9,098 9,818 9,864 7,308 8,222
IV-A - CALABARZON 2018 76,302 7,474 7,550 6,891 7,298 8,707 5,665 5,414 6,164 5,283 5,069 5,856 4,931 and MIMAROPA Region 2017 78,109 4,077 6,086 7,146 6,829 7,916 6,225 5,111 7,343 6,029 8,547 8,195 4,605
V - Bicol Region 2018 10,733 779 750 860 862 943 935 961 906 837 1,069 809 1,022 2017 12,170 1,062 981 1,050 1,206 1,362 1,063 930 1,026 894 961 819 816
VI - Western Visayas 2018 74,584 7,609 6,193 7,955 7,613 6,506 4,992 4,964 4,654 4,906 5,814 6,193 7,185 2017 83,165 6,612 6,248 6,514 7,162 7,693 6,893 7,063 7,410 6,816 6,775 6,593 7,386
VII - Central Visayas 2018 30,050 2,406 2,476 2,798 2,514 2,838 2,488 2,441 2,463 2,356 2,598 2,481 2,191 2017 20,708 1,422 1,336 1,554 1,527 1,724 1,590 1,816 1,950 1,867 1,900 2,018 2,004
VIII - Eastern Visayas 2018 142,976 9,462 4,772 13,190 13,200 12,118 14,252 13,636 12,462 11,376 13,188 13,088 12,232 2017 110,912 6,146 8,334 8,392 8,506 9,558 8,144 8,412 9,882 11,858 11,002 12,602 8,076
IX - Zamboanga Peninsula 2018 19,492 1,761 1,293 1,685 1,723 1,808 1,518 1,554 1,777 1,416 1,576 1,647 1,734 2017 16,903 1,208 1,079 1,158 1,352 1,508 1,253 1,474 1,510 1,460 1,630 1,527 1,744
X - Northern Mindanao 2018 22,143 2,098 1,700 1,937 1,814 1,918 1,802 1,806 1,600 1,660 1,914 1,854 2,040 2017 18,558 1,360 1,212 1,490 1,558 1,610 1,488 1,536 1,646 1,586 1,576 1,712 1,784
XI - Davao Region 2018 51,293 4,158 3,721 4,178 4,317 4,475 4,350 4,682 4,256 4,302 4,813 3,725 4,316 2017 44,953 3,686 3,340 3,495 3,805 4,152 3,747 3,746 4,117 3,670 3,546 3,793 3,856
XII - SOCCSKSARGEN 2018 2,895 278 224 245 192 264 208 220 268 254 262 228 252 2017 2,688 190 166 190 174 198 220 274 270 264 248 260 234
Continued
TABLE 8.3 Domestic Air Transport by Region: 2017 and 2018
Tourism and Transportation

92
TABLE 8.4--Continued
Indicator Year Total January February March April May June July August September October November December
XIII - Caraga 2018 20,398 1,388 1,236 1,444 1,620 1,780 1,860 1,952 1,918 1,850 1,894 1,546 1,910 2017 10,867 712 687 878 1,030 1,086 940 888 970 930 956 768 1,022
Autonomous Region 2018 1,418 102 116 140 96 114 106 128 160 118 104 118 116 in Muslim Mindanao 2017 1,113 90 84 122 76 80 118 120 122 54 80 59 108
Passenger movement
Total 2018 43,793,330 5,178,394 4,601,043 5,035,042 5,508,498 5,835,328 4,985,271 1,994,822 2,012,924 1,875,958 2,071,726 2,085,148 2,609,176 2017 66,829,198 5,815,370 5,016,915 5,466,379 6,162,093 6,250,917 5,330,283 5,429,233 5,363,546 4,878,294 5,367,669 5,405,889 6,342,610
National Capital Region 2018 17,436,520 2,905,088 2,561,929 2,795,307 3,057,752 3,242,341 2,874,103 0 0 0 0 0 0
2017 42,194,790 3,762,681 3,230,470 3,500,244 3,855,695 3,878,095 3,403,712 3,476,258 3,421,556 3,060,409 3,391,039 3,409,993 3,804,638
Cordillera Administrative 2018 2,145 78 224 91 348 183 59 33 0 553 168 271 137 Region 2017 1,722 143 140 163 138 466 70 46 64 179 144 54 115
I - Ilocos Region 2018 230,700 18,649 21,162 19,125 21,767 22,631 23,068 25,166 17,060 18,265 18,337 14,198 11,272 2017 223,587 21,183 20,628 20,043 21,738 19,377 19,220 19,293 17,089 15,394 18,926 13,025 17,671
II - Cagayan Valley 2018 788,475 39,271 37,233 48,413 60,215 59,443 50,348 37,365 40,875 33,347 36,154 38,296 307,515 2017 431,044 31,104 31,729 35,925 43,743 43,579 37,789 36,088 34,965 31,313 32,399 33,280 39,130
III - Central Luzon 2018 16,861 1,454 1,498 1,730 1,768 1,337 1,394 1,100 1,010 1,285 1,348 1,583 1,3542017 15,932 1,462 1,380 1,679 1,382 1,337 1,156 859 1,347 1,422 1,480 1,332 1,096
IV-A - CALABARZON 2018 2,982,658 245,071 234,367 242,737 274,923 325,469 265,042 249,720 242,392 194,619 238,449 219,552 250,317 and MIMAROPA Region 2017 2,482,970 212,360 189,456 206,869 255,345 263,157 184,844 190,828 183,818 170,516 193,233 213,334 219,210
V - Bicol Region 2018 807,218 49,220 55,601 66,803 74,897 74,946 62,672 57,592 76,133 75,629 76,967 65,989 70,7692017 883,984 68,248 62,832 74,644 84,230 91,827 75,810 74,608 77,615 70,900 72,037 66,235 64,998
VI - Western Visayas 2018 7,052,958 776,230 706,172 739,393 733,877 680,341 445,390 419,683 415,676 401,688 465,627 585,216 683,6652017 7,789,069 670,328 609,383 641,257 748,705 738,335 629,709 609,810 604,672 561,083 626,430 633,311 716,046
VII - Central Visayas 2018 1,833,529 155,538 141,330 148,834 162,671 184,897 161,230 153,488 158,930 138,527 145,572 122,041 160,4712017 1,519,212 134,740 112,132 120,687 132,512 142,450 116,058 123,247 126,952 109,242 127,233 126,575 147,384
VIII - Eastern Visayas 2018 1,509,535 108,992 100,498 103,835 130,152 159,315 140,693 130,650 134,142 126,624 135,218 113,103 126,3132017 1,270,824 109,320 90,162 97,131 116,879 124,561 107,060 103,974 106,566 98,322 103,869 94,562 118,418
IX - Zamboanga Peninsula 2018 1,813,499 138,815 118,897 134,957 149,592 163,510 162,664 159,249 151,509 157,163 162,602 150,389 164,1522017 1,622,917 140,649 115,590 133,629 154,188 169,122 127,547 132,162 117,574 121,151 131,278 132,429 147,598
X - Northern Mindanao 2018 2,477,609 196,176 171,475 197,131 216,984 235,204 209,206 198,361 195,950 192,193 211,143 216,594 237,1922017 2,109,305 178,851 148,688 169,232 192,801 201,273 157,370 170,565 170,636 165,316 172,935 180,384 201,254
Continued
Tourism and Transportation

93
TABLE 8.4--Continued
Indicator Year Total January February March April May June July August September October November December
XI - Davao Region 2018 5,373,102 431,775 352,039 422,018 489,555 540,399 462,015 437,019 449,226 416,012 459,928 442,896 470,2202017 5,066,137 387,966 326,594 369,675 445,839 455,305 371,923 386,497 395,294 373,363 392,615 407,338 753,728
XII - SOCCSKSARGEN 2018 298,345 26,533 22,731 25,247 25,502 26,750 24,036 23,609 26,852 24,782 23,444 22,988 25,871 2017 289,229 23,130 18,602 22,789 22,267 26,155 23,270 25,808 25,566 26,438 24,496 24,827 25,881
XIII - Caraga 2018 1,140,551 83,552 72,731 85,911 106,406 116,002 101,565 99,389 101,670 92,515 94,596 89,079 97,1352017 904,232 72,351 57,984 70,826 84,936 91,848 72,466 76,574 77,527 72,036 77,538 67,240 82,906
Autonomous Region 2018 29,625 1,952 3,156 3,510 2,089 2,560 1,786 2,398 1,499 2,756 2,173 2,953 2,793 in Muslim Mindanao 2017 24,244 854 1,145 1,586 1,695 4,030 2,279 2,616 2,305 1,210 2,017 1,970 2,537
96 520 2,058 1,390 2,564 516 3,519 129 1,183 854 907 13,736 Cargo movement 14 47 16 441 1,798 108 161 142 2,727 (in kilograms)
Total 2018 518,257,266 60,777,309 60,903,209 63,825,813 52,235,832 61,431,118 60,116,405 20,803,264 24,408,413 26,520,191 25,617,848 23,312,146 38,305,7182017 889,226,370 62,821,419 61,471,400 70,958,582 68,944,183 72,437,791 70,759,912 76,102,962 74,374,893 76,921,179 82,043,194 80,323,957 92,066,898
National Capital Region 2018 238,246,760 40,312,210 40,827,530 43,366,390 32,689,460 40,646,730 40,404,440 0 0 0 0 0 02017 662,256,990 46,862,340 45,817,690 53,543,260 52,429,640 53,681,740 52,754,940 57,127,420 55,911,170 57,937,110 61,850,940 60,781,970 63,558,770
Cordillera Administrative 2018 0 0 0 0 0 0 0 0 0 0 0 0 0 Region 2017 254,658 0 0 0 0 0 0 254,658 0 0 0 0 0
I - Ilocos Region 2018 3,300,970 304,269 268,558 315,017 339,145 335,935 336,285 310,898 223,905 155,642 174,884 211,020 325,4122017 3,096,402 306,495 280,978 307,138 342,125 286,906 277,994 254,658 187,335 163,420 193,275 198,952 297,126
II - Cagayan Valley 2018 8,568,519 465,146 427,929 570,992 692,832 604,582 509,757 386,934 427,475 322,674 382,492 398,715 3,378,9912017 5,465,816 345,117 359,010 472,439 532,751 515,935 443,571 421,085 394,579 342,337 359,009 379,007 900,976
III - Central Luzon 2018 0 0 0 0 0 0 0 0 0 0 0 0 02017 0 0 0 0 0 0 0 0 0 0 0 0 0
IV-A - CALABARZON 2018 24,505,715 2,570,633 1,941,021 1,884,554 1,884,641 2,178,062 1,928,649 2,079,528 1,911,480 1,989,384 2,180,879 1,803,627 2,153,257 and MIMAROPA Region 2017 22,796,122 1,877,146 1,875,448 1,914,838 1,835,634 2,227,843 1,918,621 2,096,457 1,742,583 1,898,503 1,711,208 1,710,739 1,987,102
V - Bicol Region 2018 2,413,643 170,016 211,724 223,075 227,985 186,451 176,133 158,371 226,070 230,352 258,790 136,234 208,4422017 2,929,785 229,795 225,022 239,632 207,879 172,059 260,332 283,005 291,450 272,205 293,525 245,170 209,711
VI - Western Visayas 2018 54,663,074 4,647,664 4,138,683 4,659,681 4,440,282 4,963,018 3,980,734 4,092,801 4,109,950 4,577,628 4,825,695 4,629,478 5,597,4602017 43,481,960 2,320,841 2,739,971 2,914,942 2,978,075 4,305,870 3,814,198 3,661,609 3,843,682 3,437,663 4,233,693 4,192,512 5,038,904
VII - Central Visayas 2018 10,298,956 670,045 707,907 800,377 696,228 836,493 892,047 824,295 877,891 866,921 989,245 966,414 1,171,0932017 8,760,997 724,209 693,648 685,674 551,930 652,879 849,423 788,181 780,633 769,036 780,787 733,323 751,274
VIII - Eastern Visayas 2018 10,589,189 948,402 878,188 916,537 1,048,699 1,049,517 977,878 825,691 879,804 790,657 786,025 783,046 704,7452017 7,220,261 408,115 519,059 553,285 453,654 497,545 759,866 628,830 742,861 741,751 773,407 393,539 748,349
Continued
Tourism and Transportation

94
TABLE 8.4--Concluded
Indicator Year Total January February March April May June July August September October November December
IX - Zamboanga Peninsula 2018 20,009,190 1,570,768 1,467,096 1,868,819 1,580,553 1,737,044 1,535,609 1,555,853 1,848,878 2,174,097 1,557,511 1,525,926 1,587,0362017 19,123,017 1,507,879 1,123,512 1,552,991 1,493,167 1,740,719 1,536,843 1,608,495 1,566,796 1,960,261 1,919,527 1,485,381 1,627,446
X - Northern Mindanao 2018 31,240,367 1,918,143 2,154,333 2,359,260 2,079,452 2,056,045 2,286,065 2,333,272 3,138,995 3,930,372 3,480,047 2,887,549 2,616,8342017 22,913,169 1,873,736 1,754,748 1,935,200 1,821,815 1,942,703 1,900,680 1,798,174 1,624,932 1,640,492 1,816,342 2,475,274 2,329,073
XI - Davao Region 2018 101,512,194 6,415,110 7,123,048 6,043,129 5,677,522 5,814,312 6,074,108 7,160,062 9,381,380 9,930,704 9,584,395 8,688,756 19,619,6682017 80,252,503 5,598,430 5,369,250 5,224,878 5,550,444 5,607,060 5,472,864 6,238,964 6,370,906 6,913,916 7,161,003 6,958,614 13,786,174
XII - SOCCSKSARGEN 2018 3,036,681 183,508 160,489 202,893 209,610 262,706 220,021 167,324 449,454 335,884 335,884 241,793 267,1152017 1,934,413 177,521 163,360 147,600 141,617 159,257 156,470 159,517 183,815 110,056 173,390 186,070 175,740
XIII - Caraga 2018 9,584,035 586,395 546,703 608,862 653,423 738,132 781,679 819,255 933,064 1,205,876 1,044,001 1,018,298 648,3472017 8,464,004 589,795 522,704 1,414,705 526,452 586,914 604,954 745,525 734,041 733,567 776,091 583,168 646,088
Autonomous Region 2018 287,993 15,000 50,000 6,227 16,000 22,091 13,000 89,000 67 10,000 18,000 21,290 27,318 in Muslim Mindanao 2017 276,273 0 27,000 52,000 79,000 60,361 9,156 36,384 110 862 997 238 10,165
Source: Civil Aviation Authority of the Philippines
Indicator Year Average January February March April May June July August September October November December
Total 2018 30,985 30,425 27,040 36,561 29,038 35,469 37,631 20,730 … … … … …2017 29,964 23,808 25,150 27,515 27,697 30,317 32,993 29,967 32,472 31,451 31,132 32,966 34,104
Passenger car sales 2018 10,788 10,984 9,114 11,853 9,862 11,690 13,677 8,339 … … … … …2017 11,099 8,632 9,819 11,345 9,920 10,893 11,951 11,230 11,136 12,110 11,499 12,143 12,510
Commercial vehicle sales 2018 20,196 19,441 17,926 24,708 19,176 23,779 23,954 12,391 … … … … …2017 18,865 15,176 15,331 16,170 17,777 19,424 21,042 18,737 21,336 19,341 19,633 20,823 21,594
Source : Chamber of Automotive Manufacturers of the Philippines Inc.
TABLE 8.4 Sales of Motor Vehicles: 2017 and 2018
Tourism and Transportation
