novel technology to improve feeding...
TRANSCRIPT

Novel technology to improve feeding management
Javier Villa, Andromeda Ibérica
Nikos Papandroulakis, HCMR
INDUSTRY FORUM: SUSTAINABLE SOLUTIONS TO ADDRESS SEA BASS AND SEA BREAM FARMING CHALLENGES IN THE MEDITERRANEAN
The problem
• How much should I feed my fish?

Feeding
“All methods and practices employed to deliver nutritionallybalanced and adequate amounts of diets to animals formaintaining normal health and reproduction together withefficient growth and performance (Cho and Bureau, 1998)”.
• Feeds represent a high percentage of the production cost(from 40-60%)
• A lot of work for development of diets and feedingmethods
✓ More efficient formulas
✓ Feeding Automation (up to barge feeding)
✓ Feeding control ( cameras implementation etc)
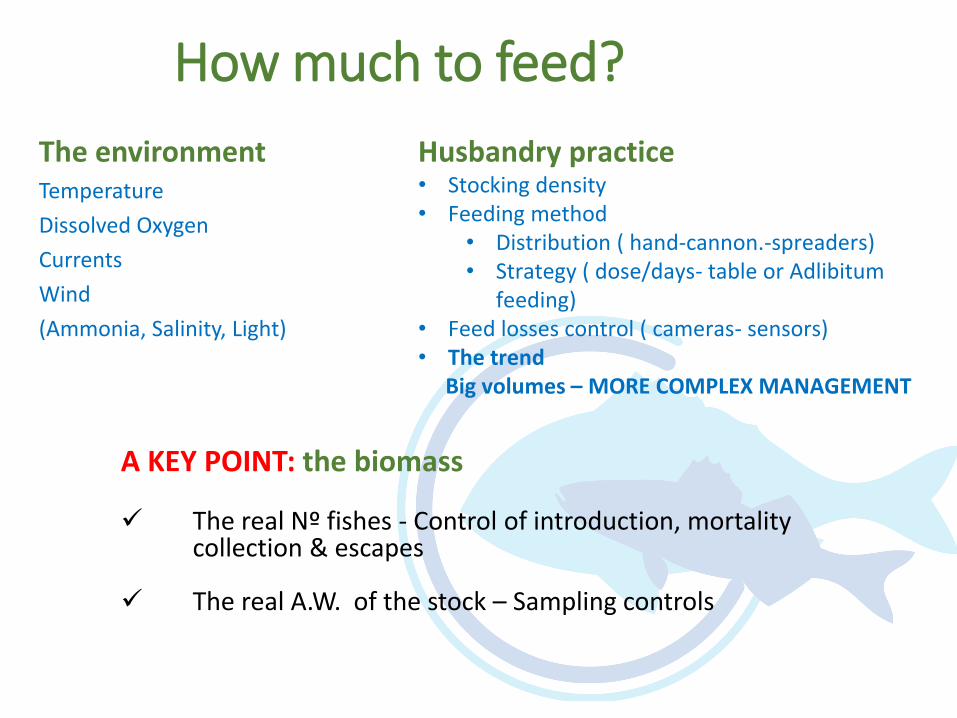
The environmentTemperature
Dissolved Oxygen
Currents
Wind
(Ammonia, Salinity, Light)
How much to feed?
A KEY POINT: the biomass
✓ The real Nº fishes - Control of introduction, mortality collection & escapes
✓ The real A.W. of the stock – Sampling controls
Husbandry practice• Stocking density• Feeding method
• Distribution ( hand-cannon.-spreaders)• Strategy ( dose/days- table or Adlibitum
feeding)• Feed losses control ( cameras- sensors)• The trend
Big volumes – MORE COMPLEX MANAGEMENT

Biomass simulation – sea bream breamIntro date April
Batch size 280000
AW intro 10gr
Harvest size 450 gr.
Cost Input
Feed €/Kg 0,90 €
production €/month 6.000 €
Fish €/unit 0,31 €
Commercial cost €/Kg. 0,65 €
Sales Price €/Kg. 5,0 €
APR MAY JUN JUL AUG SEP OCT NOV DEC JAN FEB MAR APR MAY JUN JUL
A.W.- P.M. 10 14.2 26.5 49.3 80.8 120.3 164.3 213.5 251.4 263.8 268.0 264.2 267.6 281.9 317.6 372.4 433.8
€/Kg 24.0 € 14.4 € 8.7 € 6.0 € 4.6 € 3.9 € 3.4 € 3.2 € 3.2 € 3.4 € 3.6 € 3.7 € 3.7 € 3.6 € 3.4 € 3.8 €
-2.0 €
3.0 €
8.0 €
13.0 €
18.0 €
23.0 €
0
50
100
150
200
250
300
350
400
450
500
€/K
g.
A.W
. G
r/fi
sh
BREAM SIMULATIONGROWTH & COST A.W.- P.M.
RESULTS
HARVEST 109.230
SURVIVAL 89,9%
FCR 1,7
€/Kg 3,8 €
PROFIT 130.013 €

Stock control– procedure
INTRO CONTROL COUNT BIOMASS
SCANNER
MORTALITY COLLECTION
(<100 gr.)
Every 1-2 DAYS
INTERMEDIATE CONTROL
CONTROL COUNT VACCINATION
GRADING
MORTALITY COLLECTION
(> 100 gr)
Twice week
HARVEST
Packing Count
High CannibalismEscapes Risk
• Scanner control – No 100% Accuracy• Cannibalism losses- High risk (below 100gr)• Escapes risk – Along all the cycle• Losses from Birds – could be critical• Other predators ( turtle- Other fishes)
84
86
88
90
92
94
96
98
100
0
100
200
300
400
500
AP
R
MA
Y
JUN
JUL
AU
G
SEP
OC
T
NO
V
DEC
JAN
FEB
MA
R
AP
R
MA
Y
JUN
JUL
Survival evolution%
A.W. (gr.)
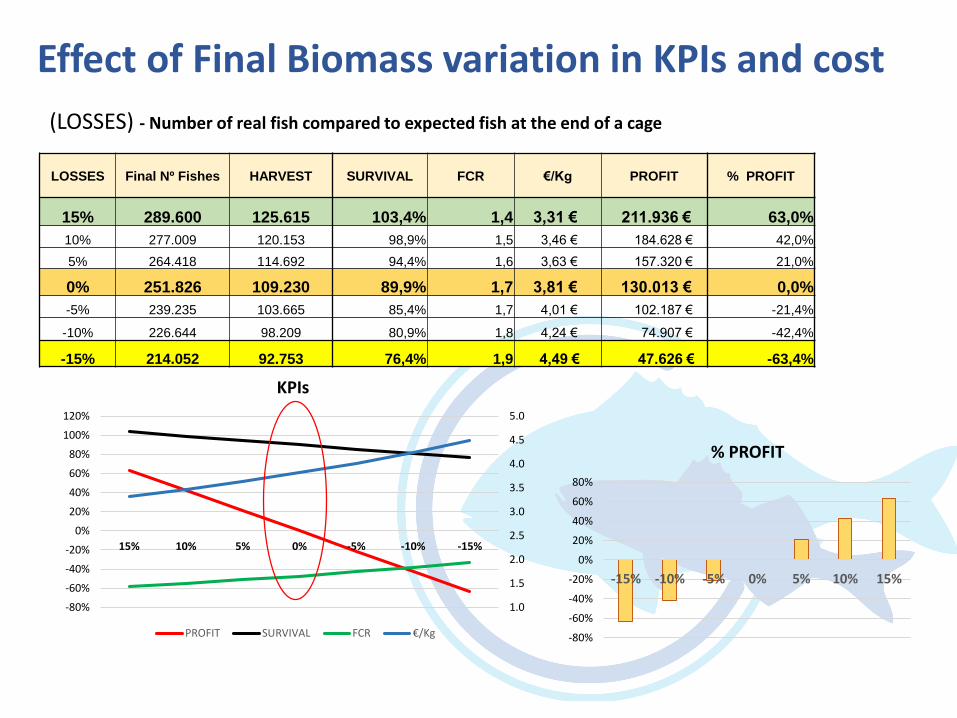
Effect of Final Biomass variation in KPIs and cost
-80%
-60%
-40%
-20%
0%
20%
40%
60%
80%
-15% -10% -5% 0% 5% 10% 15%
% PROFIT
1.0
1.5
2.0
2.5
3.0
3.5
4.0
4.5
5.0
-80%
-60%
-40%
-20%
0%
20%
40%
60%
80%
100%
120%
15% 10% 5% 0% -5% -10% -15%
KPIs
PROFIT SURVIVAL FCR €/Kg
(LOSSES) - Number of real fish compared to expected fish at the end of a cage
LOSSES Final Nº Fishes HARVEST SURVIVAL FCR €/Kg PROFIT % PROFIT
15% 289.600 125.615 103,4% 1,4 3,31 € 211.936 € 63,0%
10% 277.009 120.153 98,9% 1,5 3,46 € 184.628 € 42,0%
5% 264.418 114.692 94,4% 1,6 3,63 € 157.320 € 21,0%
0% 251.826 109.230 89,9% 1,7 3,81 € 130.013 € 0,0%
-5% 239.235 103.665 85,4% 1,7 4,01 € 102.187 € -21,4%
-10% 226.644 98.209 80,9% 1,8 4,24 € 74.907 € -42,4%
-15% 214.052 92.753 76,4% 1,9 4,49 € 47.626 € -63,4%

Objective of the work in PerformFISH
Development of an Accurate System for Biomass Estimation
➢ A parameter in the core of any feeding system ➢ The system will include estimation of
• fish size, hence growth (using optical methods and image analysis) and
• total biomass in the cage (using echo sounders)
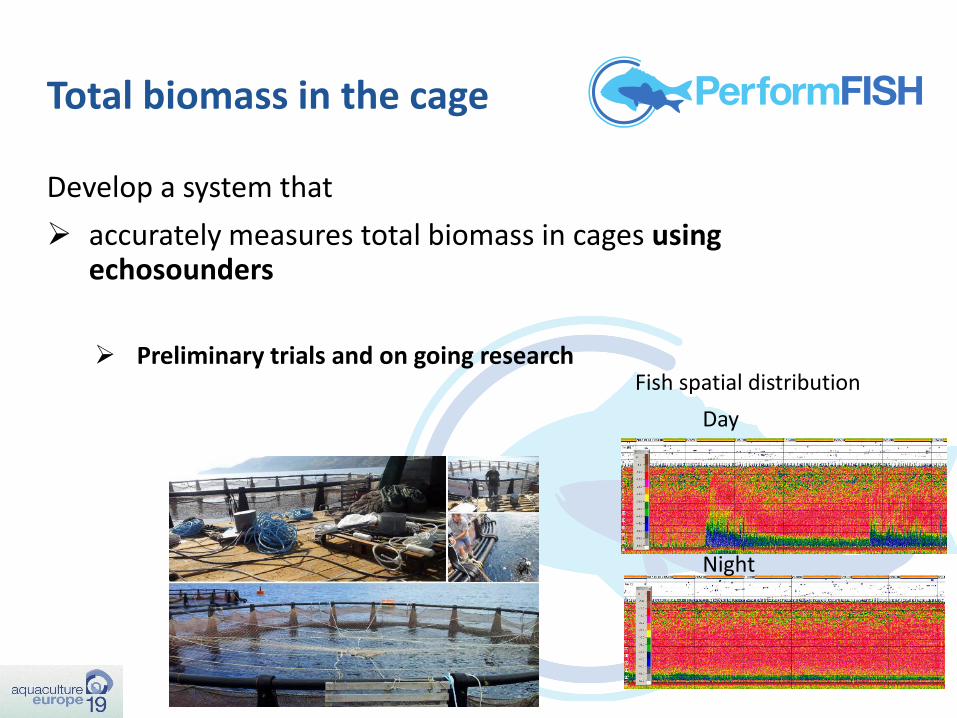
Total biomass in the cage
Develop a system that
➢ accurately measures total biomass in cages using echosounders
➢ Preliminary trials and on going research
Day
Night
Fish spatial distribution
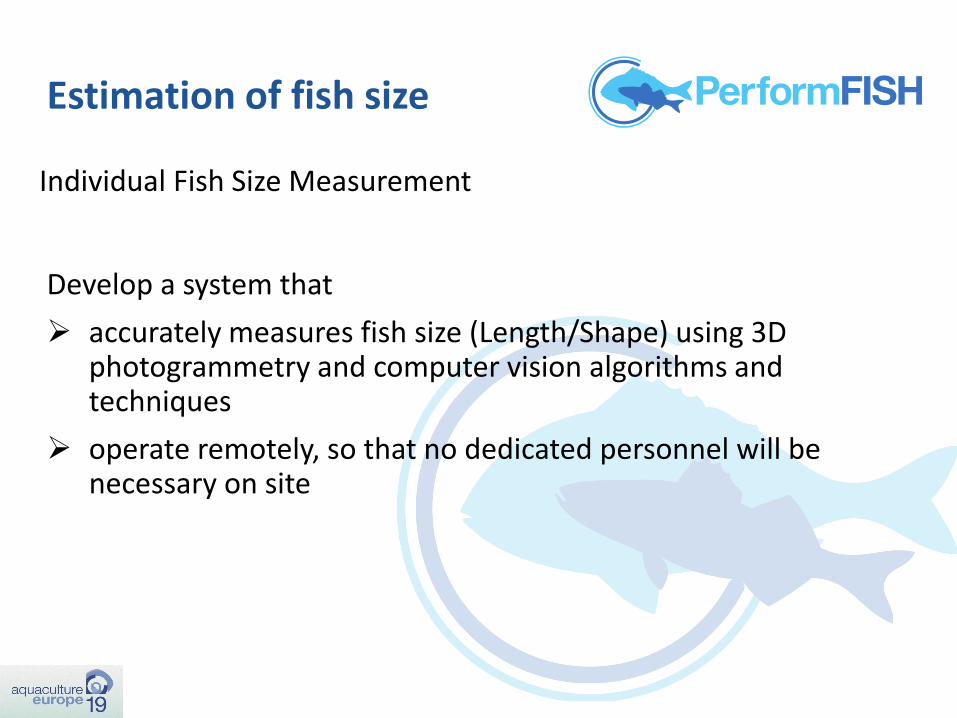
Individual Fish Size Measurement
Estimation of fish size
Develop a system that
➢ accurately measures fish size (Length/Shape) using 3D photogrammetry and computer vision algorithms and techniques
➢ operate remotely, so that no dedicated personnel will be necessary on site
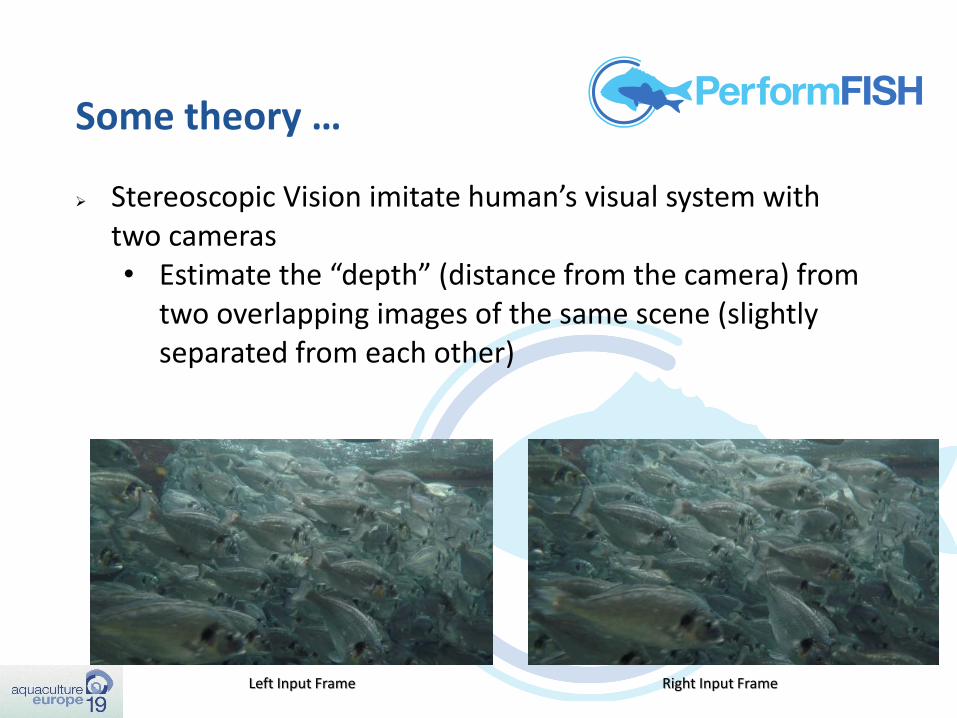
Some theory …
➢ Stereoscopic Vision imitate human’s visual system withtwo cameras• Estimate the “depth” (distance from the camera) from
two overlapping images of the same scene (slightly separated from each other)
Left Input Frame Right Input Frame
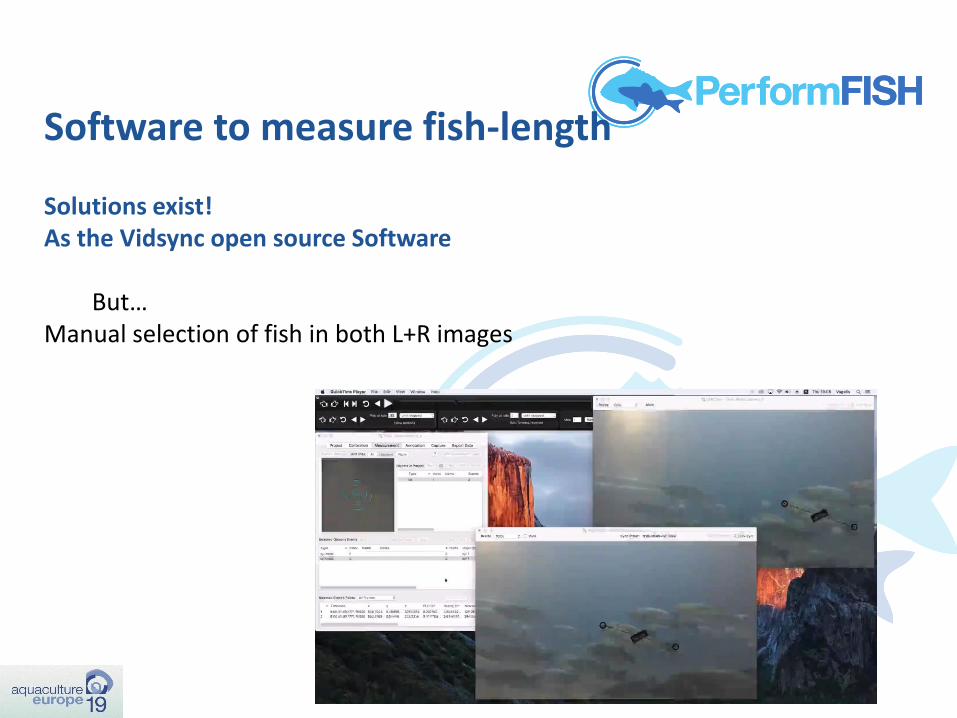
Software to measure fish-length
Solutions exist! As the Vidsync open source Software
But…Manual selection of fish in both L+R images
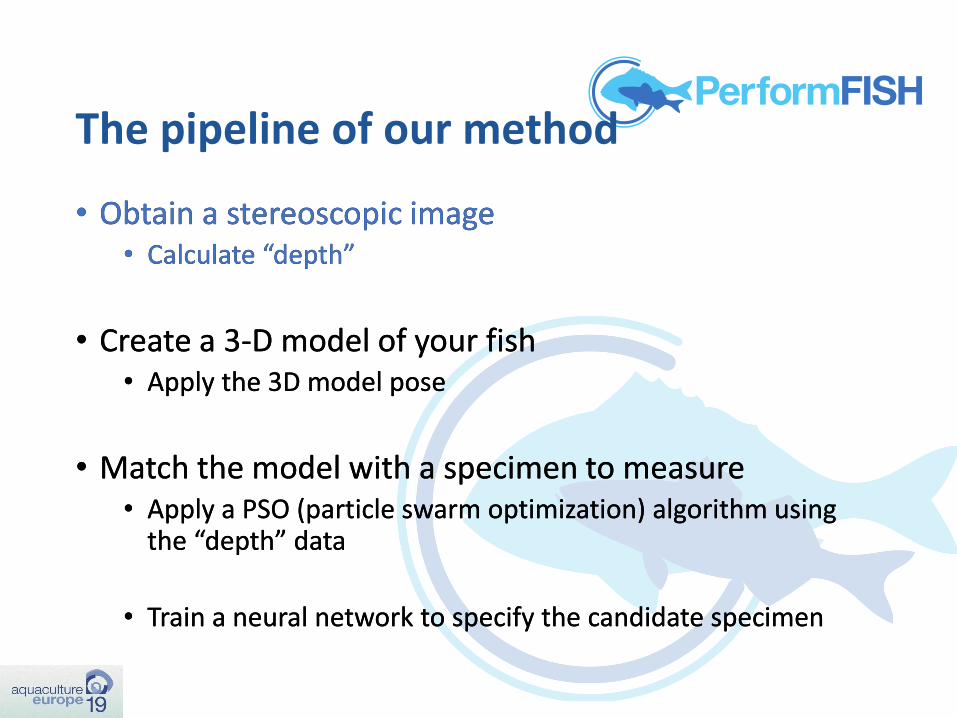
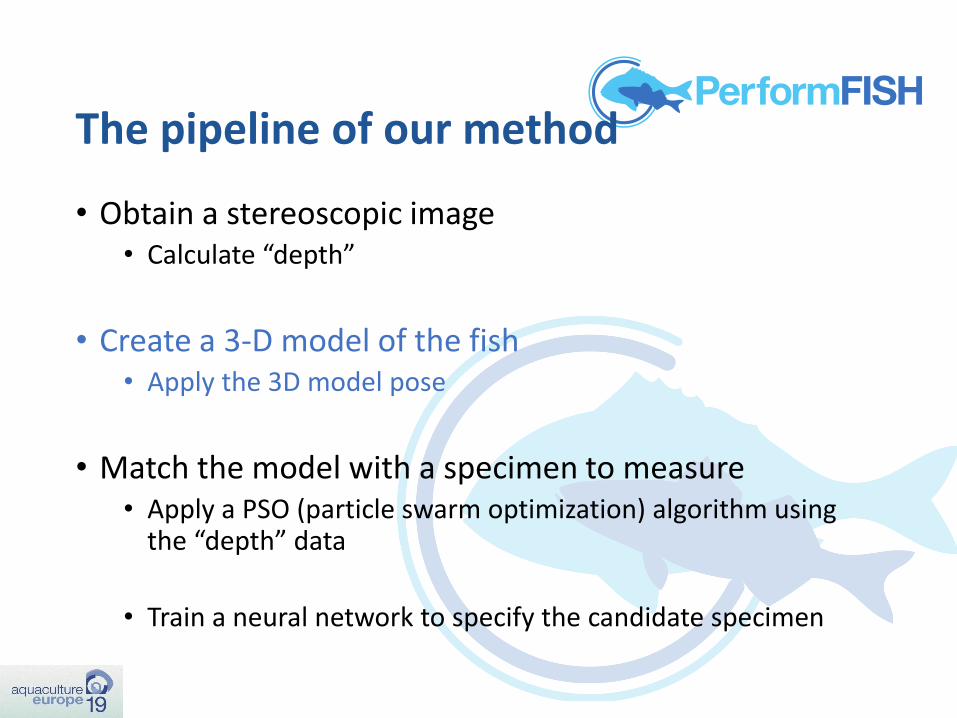
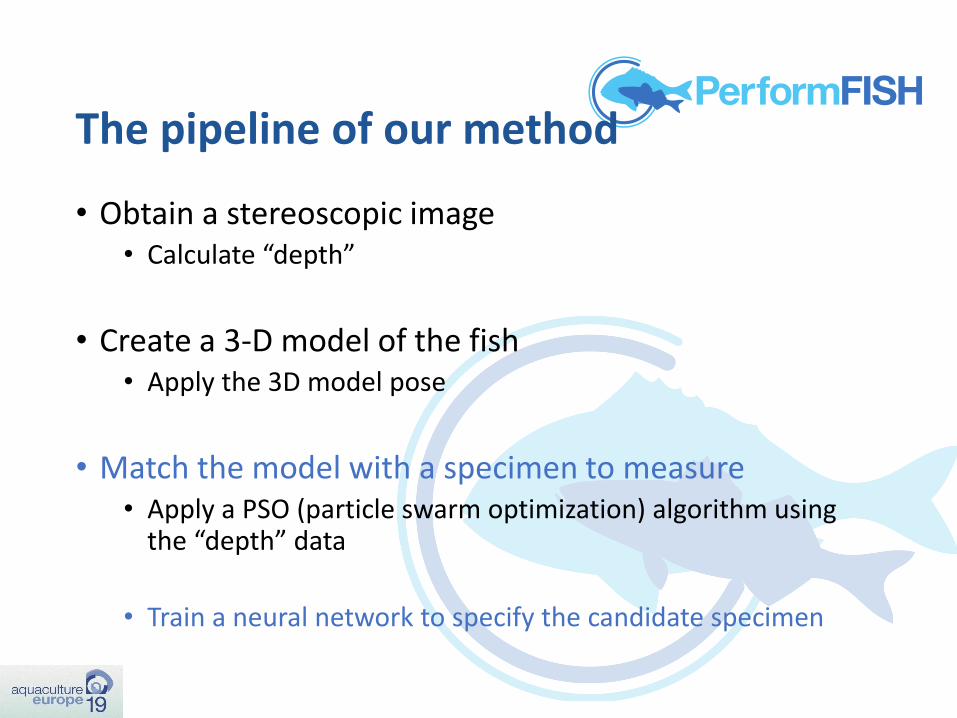
The pipeline of our method
• Obtain a stereoscopic image • Calculate “depth”
• Create a 3-D model of your fish• Apply the 3D model pose
• Match the model with a specimen to measure• Apply a PSO (particle swarm optimization) algorithm using
the “depth” data
• Train a neural network to specify the candidate specimen
• Obtain a stereoscopic image • Calculate “depth”
• Create a 3-D model of your fish• Apply the 3D model pose
• Match the model with a specimen to measure• Apply a PSO (particle swarm optimization) algorithm using
the “depth” data
• Train a neural network to specify the candidate specimen
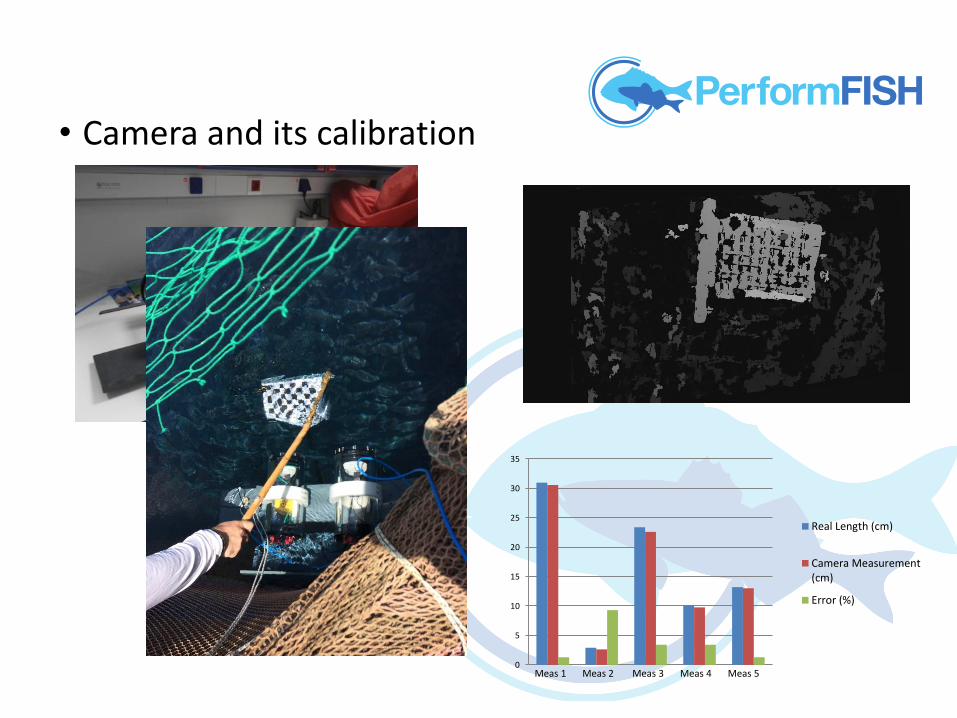
• Camera and its calibration
0
5
10
15
20
25
30
35
Real Length (cm)
Camera Measurement(cm)
Error (%)
Meas 1 Meas 2 Meas 3 Meas 4 Meas 5
The pipeline of our method
• Obtain a stereoscopic image • Calculate “depth”
• Create a 3-D model of the fish• Apply the 3D model pose
• Match the model with a specimen to measure• Apply a PSO (particle swarm optimization) algorithm using
the “depth” data
• Train a neural network to specify the candidate specimen
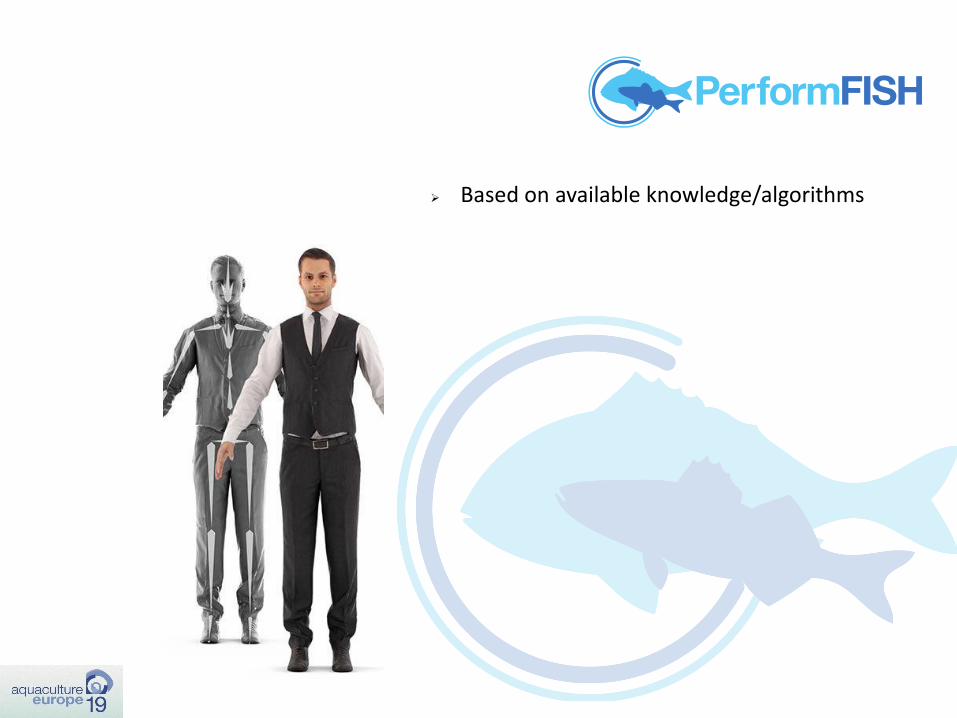
➢ Based on available knowledge/algorithms
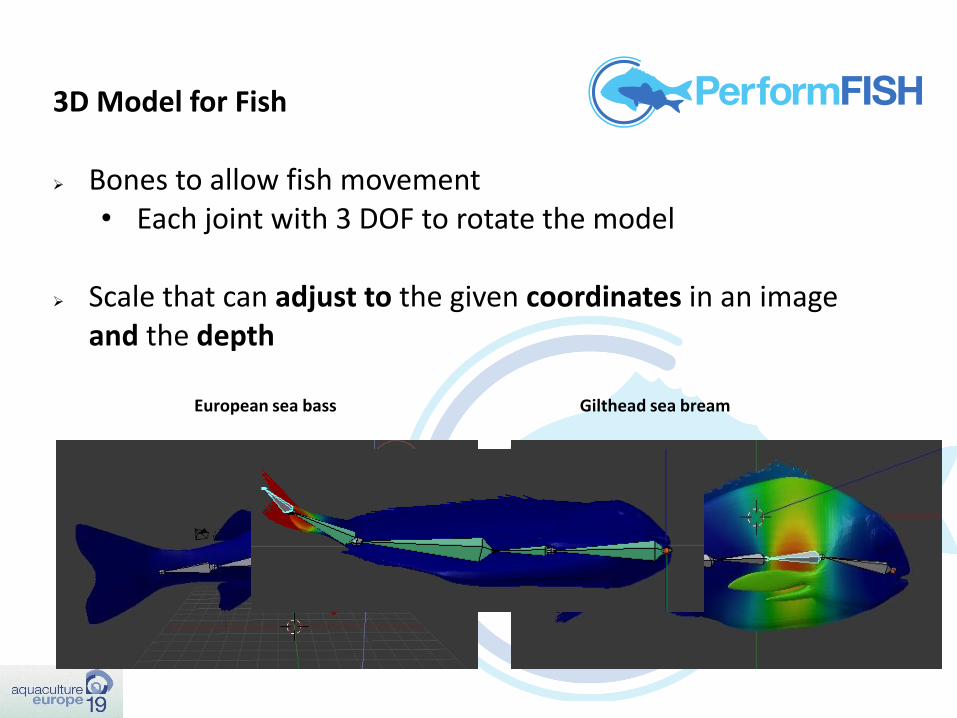
3D Model for Fish
➢ Bones to allow fish movement• Each joint with 3 DOF to rotate the model
➢ Scale that can adjust to the given coordinates in an image and the depth
European sea bass Gilthead sea bream

The pipeline of our method
• Obtain a stereoscopic image • Calculate “depth”
• Create a 3-D model of the fish• Apply the 3D model pose
• Match the model with a specimen to measure• Apply a PSO (particle swarm optimization) algorithm using
the “depth” data
• Train a neural network to specify the candidate specimen
Particle Swarm Optimization algorithm
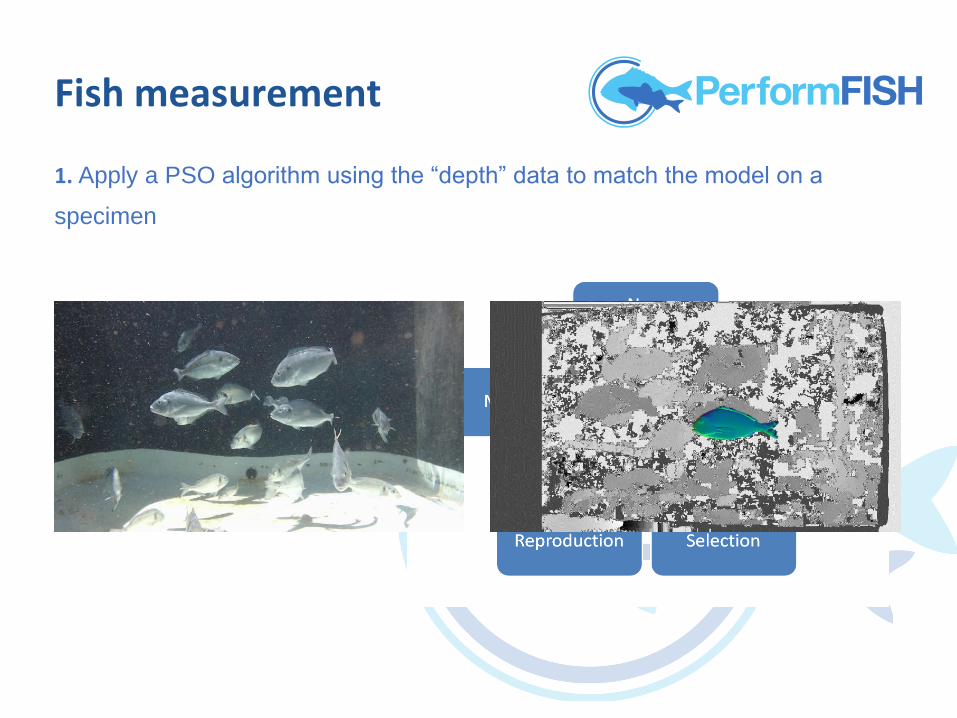
Fish measurement
1. Apply a PSO algorithm using the “depth” data to match the model on a
specimen
Fish measurement
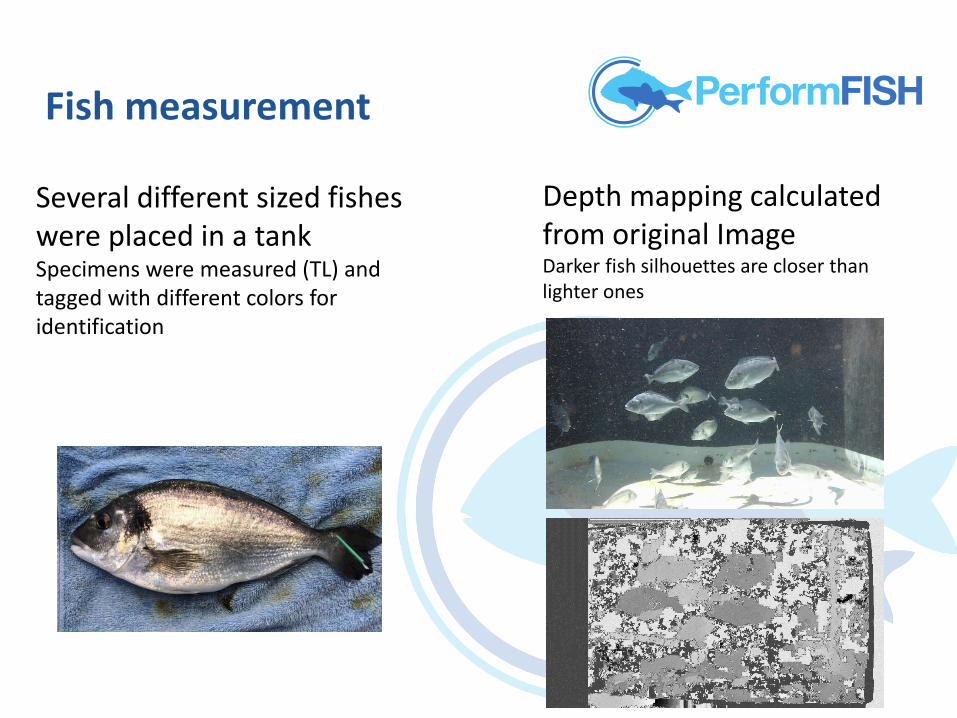
Several different sized fishes were placed in a tankSpecimens were measured (TL) and tagged with different colors for identification
TL (cm)
FL (cm)
WEIGHT (gr)
TAG SAMPLE
27.5 26.5 410.2 G
Depth mapping calculated from original Image Darker fish silhouettes are closer than lighter ones

• The system presents accuracy with reasonable deviation from the actual size
• Candidate image to measure based only on “depth” data
Test of the system

• A cage differs from a tank!
The pipeline of our method
• Obtain a stereoscopic image • Calculate “depth”
• Create a 3-D model of the fish• Apply the 3D model pose
• Match the model with a specimen to measure• Apply a PSO (particle swarm optimization) algorithm using
the “depth” data
• Train a neural network to specify the candidate specimen
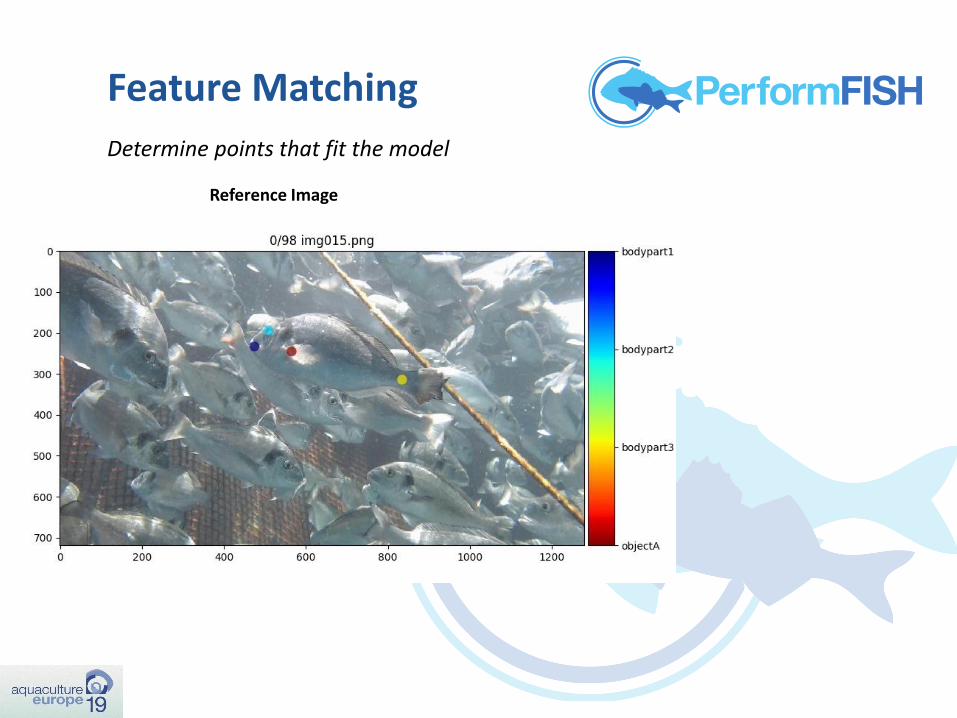
Determine points that fit the model
Reference Image
Feature Matching
* Optional

After “training” the systemCandidate Images

Next steps
• Test in real conditions and fine-tuning
• Continue with E. sea bass
Thanks you for your attention!
Nikos Papandroulakis
HCMR
This project has received funding from the European Union’s Horizon 2020 research and innovation programme under grant agreement No 727610. This output reflects the views only of the author(s), and the European Union cannot be held responsible for any use which may be made of the information contained therein.
V. Chalkiadakis, D. Voskakis, A. Makris,
M. Sfakiotakis, V. Trigonis, A. Kapelonis,
C. Schellewald, Walter Caharija
Javier Villa
Andromeda Ibérica