novel methods for dose response meta-analysis
TRANSCRIPT
Novel methods fordose–response meta-analysis
Alessio Crippa
Department of Public Health Sciences (PHS)Karolinska Institutet
April 13, 2018

Background Paper I Paper II Paper III Paper IV Paper V Conclusions
Acknowledgements
Main supervisorI Nicola Orsini
Co-supevisorI Alicja WolkI Matteo BottaiI Donna Spiegelman
Co-authors
OpponentI Christopher H. Schmid
Examination boardI Nele BrusselaersI Antonio GasparriniI Paul Lambert
The audience
Alessio Crippa Novel methods for dose–response meta-analysis Karolinska Institutet13 April 2018 1 of 30

Background Paper I Paper II Paper III Paper IV Paper V Conclusions
Dose–response meta–analysis
Summarize and contrast results on the relation between a quantitativeexposure and the occurrence of a health outcome.
Research questions based on multiple studies:I Is there any association between increasing dose levels and the
outcome? If so, what is the shape of the relationship?I Which exposure values are associated with the minimum or
maximum response?I Is there any difference in the study-specific dose–response
associations? Which factors can explain the observed heterogeneity?
Alessio Crippa Novel methods for dose–response meta-analysis Karolinska Institutet13 April 2018 2 of 30

Background Paper I Paper II Paper III Paper IV Paper V Conclusions
Dose–response meta–analysis
Summarize and contrast results on the relation between a quantitativeexposure and the occurrence of a health outcome.
Research questions based on multiple studies:I Is there any association between increasing dose levels and the
outcome? If so, what is the shape of the relationship?
I Which exposure values are associated with the minimum ormaximum response?
I Is there any difference in the study-specific dose–responseassociations? Which factors can explain the observed heterogeneity?
Alessio Crippa Novel methods for dose–response meta-analysis Karolinska Institutet13 April 2018 2 of 30

Background Paper I Paper II Paper III Paper IV Paper V Conclusions
Dose–response meta–analysis
Summarize and contrast results on the relation between a quantitativeexposure and the occurrence of a health outcome.
Research questions based on multiple studies:I Is there any association between increasing dose levels and the
outcome? If so, what is the shape of the relationship?I Which exposure values are associated with the minimum or
maximum response?
I Is there any difference in the study-specific dose–responseassociations? Which factors can explain the observed heterogeneity?
Alessio Crippa Novel methods for dose–response meta-analysis Karolinska Institutet13 April 2018 2 of 30

Background Paper I Paper II Paper III Paper IV Paper V Conclusions
Dose–response meta–analysis
Summarize and contrast results on the relation between a quantitativeexposure and the occurrence of a health outcome.
Research questions based on multiple studies:I Is there any association between increasing dose levels and the
outcome? If so, what is the shape of the relationship?I Which exposure values are associated with the minimum or
maximum response?I Is there any difference in the study-specific dose–response
associations? Which factors can explain the observed heterogeneity?
Alessio Crippa Novel methods for dose–response meta-analysis Karolinska Institutet13 April 2018 2 of 30
Background Paper I Paper II Paper III Paper IV Paper V Conclusions
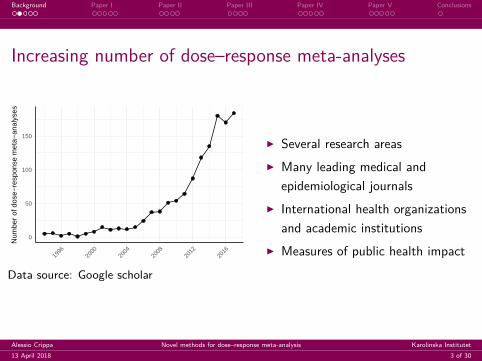
Increasing number of dose–response meta-analyses
0
50
100
150
1996
2000
2004
2008
2012
2016
Num
ber
of d
ose−
resp
onse
met
a−an
alys
es
Data source: Google scholar
I Several research areasI Many leading medical and
epidemiological journalsI International health organizations
and academic institutionsI Measures of public health impact
Alessio Crippa Novel methods for dose–response meta-analysis Karolinska Institutet13 April 2018 3 of 30

Background Paper I Paper II Paper III Paper IV Paper V Conclusions
Aggregated dose–response data
An example from a prospective study on coffee consumption (cups/day)and all-cause mortality (Crippa et al., Am. J. Epidemiol, 2014)
Exposure category Dose Cases n R̂R 95% CI
0-1 0.5 57 249 1.00 —2-3 2.5 136 655 0.75 0.57, 0.994-5 4.5 144 619 0.84 0.64, 1.106+ 6.5 115 387 1.09 0.83, 1.43
The R̂Rs are not independentThe predicted relative risk for reference category is 1
Alessio Crippa Novel methods for dose–response meta-analysis Karolinska Institutet13 April 2018 4 of 30

Background Paper I Paper II Paper III Paper IV Paper V Conclusions
Two stage dose–response meta-analysis
First stage
Define and estimate a common dose–response model in each study(i = 1, . . . , I)
Second stage
Combine study-specific regression coefficients using meta-analysis
Alessio Crippa Novel methods for dose–response meta-analysis Karolinska Institutet13 April 2018 5 of 30

Background Paper I Paper II Paper III Paper IV Paper V Conclusions
Challenges
I Lack of free and open source software (Paper I)
I Assessment of goodness of fit of dose–response meta–analyticmodels has not yet been discussed (Paper II)
I Little emphasis is placed on the assumptions underlying the commonmeasures of heterogeneity (Paper III)
I The effect of differential shape and exposure distribution is hard tobe addressed in a two-stage approach (Paper IV )
I Dose–response and meta-regression models may be affected by smallnumber of data points in some of the studies (Paper V )
Alessio Crippa Novel methods for dose–response meta-analysis Karolinska Institutet13 April 2018 6 of 30

Background Paper I Paper II Paper III Paper IV Paper V Conclusions
Challenges
I Lack of free and open source software (Paper I)I Assessment of goodness of fit of dose–response meta–analytic
models has not yet been discussed (Paper II)
I Little emphasis is placed on the assumptions underlying the commonmeasures of heterogeneity (Paper III)
I The effect of differential shape and exposure distribution is hard tobe addressed in a two-stage approach (Paper IV )
I Dose–response and meta-regression models may be affected by smallnumber of data points in some of the studies (Paper V )
Alessio Crippa Novel methods for dose–response meta-analysis Karolinska Institutet13 April 2018 6 of 30

Background Paper I Paper II Paper III Paper IV Paper V Conclusions
Challenges
I Lack of free and open source software (Paper I)I Assessment of goodness of fit of dose–response meta–analytic
models has not yet been discussed (Paper II)I Little emphasis is placed on the assumptions underlying the common
measures of heterogeneity (Paper III)
I The effect of differential shape and exposure distribution is hard tobe addressed in a two-stage approach (Paper IV )
I Dose–response and meta-regression models may be affected by smallnumber of data points in some of the studies (Paper V )
Alessio Crippa Novel methods for dose–response meta-analysis Karolinska Institutet13 April 2018 6 of 30

Background Paper I Paper II Paper III Paper IV Paper V Conclusions
Challenges
I Lack of free and open source software (Paper I)I Assessment of goodness of fit of dose–response meta–analytic
models has not yet been discussed (Paper II)I Little emphasis is placed on the assumptions underlying the common
measures of heterogeneity (Paper III)I The effect of differential shape and exposure distribution is hard to
be addressed in a two-stage approach (Paper IV )
I Dose–response and meta-regression models may be affected by smallnumber of data points in some of the studies (Paper V )
Alessio Crippa Novel methods for dose–response meta-analysis Karolinska Institutet13 April 2018 6 of 30

Background Paper I Paper II Paper III Paper IV Paper V Conclusions
Challenges
I Lack of free and open source software (Paper I)I Assessment of goodness of fit of dose–response meta–analytic
models has not yet been discussed (Paper II)I Little emphasis is placed on the assumptions underlying the common
measures of heterogeneity (Paper III)I The effect of differential shape and exposure distribution is hard to
be addressed in a two-stage approach (Paper IV )I Dose–response and meta-regression models may be affected by small
number of data points in some of the studies (Paper V )
Alessio Crippa Novel methods for dose–response meta-analysis Karolinska Institutet13 April 2018 6 of 30

Background Paper I Paper II Paper III Paper IV Paper V Conclusions
Paper I
Multivariate dose–response meta-analysis: the dosresmeta R Package. J.Stat. Softw, 2016
Specific aimI To develop, maintain, and share a package for dose–response
meta-analysis in the open source and free R software
Alessio Crippa Novel methods for dose–response meta-analysis Karolinska Institutet13 April 2018 7 of 30

Background Paper I Paper II Paper III Paper IV Paper V Conclusions
The dosresmeta R packageR> install.packages("dosresmeta")R> devtools::install_github("alecri/dosresmeta")
1−5050−100100−500500−1500>1500
Codes and examples and athttps://alecri.github.io/software/dosresmeta.html
Alessio Crippa Novel methods for dose–response meta-analysis Karolinska Institutet13 April 2018 8 of 30

Background Paper I Paper II Paper III Paper IV Paper V Conclusions
Package Description
I Two-stage dose–response meta-analysisI Greenland and Longnecker, and Hamling methodI print and summary functionI Meta-regression modelsI Dedicated predict functionI Methodologies presented in the thesis
Alessio Crippa Novel methods for dose–response meta-analysis Karolinska Institutet13 April 2018 9 of 30

Background Paper I Paper II Paper III Paper IV Paper V Conclusions
Coffee consumption and all-cause mortality
R> data("coffee_mort")R> # linear modelR> lin <- dosresmeta(logrr ˜ dose, id = id, se = se, type = type,+ cases = cases, n = n, data = coffee_mort)R> # restricted cubic spline modelR> k <- quantile(coffee_mort$dose, c(.1, .5, .9))R> spl <- dosresmeta(logrr ˜ rcs(dose, k), id = id, se = se, type = type,+ cases = cases, n = n, data = coffee_mort)R> # restricted cubic spline meta-regression modelR> spl_reg <- dosresmeta(logrr ˜ rcs(dose, k), id = id, se = se,+ cases = cases, n = n, type = type, data = coffee_mort,+ mod = ˜ gender + area)
Alessio Crippa Novel methods for dose–response meta-analysis Karolinska Institutet13 April 2018 10 of 30

Background Paper I Paper II Paper III Paper IV Paper V Conclusions
R> expand.grid(dose = seq(0, 8, .1), gender = levels(coffee_mort$gender),+ area = levels(coffee_mort$area)) %>%+ cbind(predict(spl_reg, newdata = ., expo = T)) %>%+ ggplot(aes(dose, pred, col = area)) + geom_line() + facet_grid(˜ gender) ++ scale_y_continuous(trans = "log", breaks = pretty_breaks()) ++ labs(x = "Coffee consumption (cups/day)", y = "Relative risk")
F M M/F
0 2 4 6 8 0 2 4 6 8 0 2 4 6 8
0.7
0.8
0.9
1.0
1.1
1.2
Coffee consumption (cups/day)
Rel
ativ
e ris
k area
Europe
Japan
USA
Alessio Crippa Novel methods for dose–response meta-analysis Karolinska Institutet13 April 2018 11 of 30

Background Paper I Paper II Paper III Paper IV Paper V Conclusions
Paper II
Goodness of fit tools for dose–response meta-analysis of binary outcomesRes Synth Meth, 2017
Specific aimI To present and discuss relevant measures and graphical tools to
assess the goodness-of-fit in dose–response meta-analytic models
Alessio Crippa Novel methods for dose–response meta-analysis Karolinska Institutet13 April 2018 12 of 30

Background Paper I Paper II Paper III Paper IV Paper V Conclusions
Goodness-of-fitDoes the pooled curve adequately summarize the aggregate data?
This question is typically ignored in published meta-analyses
A graphical comparison may be not be appropriate
0.5
0.6
0.7
0.8
0.9
1.01.1
40 60 80
Age (years)
Rel
ativ
e ris
k
1.001.10
1.25
1.50
1.75
2.00
40 60 80
Age (years)
Rel
ativ
e ris
k
Alessio Crippa Novel methods for dose–response meta-analysis Karolinska Institutet13 April 2018 13 of 30
Background Paper I Paper II Paper III Paper IV Paper V Conclusions
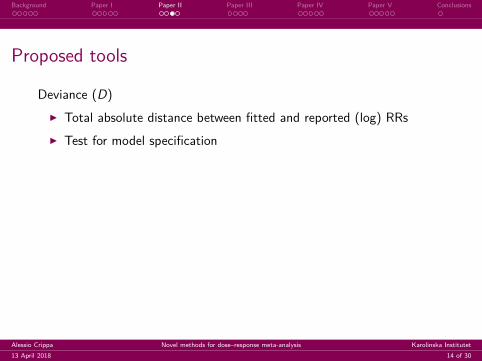
Proposed tools
Deviance (D)I Total absolute distance between fitted and reported (log) RRsI Test for model specification
Coefficient of determination (R2)I Descriptive measure of agreementI Dimensionless measure bounded between 0 and 1
Plot of decorrelated residuals versus exposureI Visual assessment of the goodness of fitI Evaluate how the pooled dose–response curve fits the data by
exposure levels
Alessio Crippa Novel methods for dose–response meta-analysis Karolinska Institutet13 April 2018 14 of 30

Background Paper I Paper II Paper III Paper IV Paper V Conclusions
Coffee consumption and all-cause mortality
Analysis Model Deviance df p value R2 R2adj
A Linear 225.244 78 0.000 0.488 0.482B RCS 141.332 77 0.000 0.679 0.671C RCS + interaction 100.372 69 0.008 0.772 0.739
−4
−2
0
2
4
0.0 2.5 5.0 7.5
Coffee consumption (cups/day)
Dec
orel
late
d re
sidu
als
LinearA
−4
−2
0
2
4
0.0 2.5 5.0 7.5
Coffee consumption (cups/day)
Dec
orel
late
d re
sidu
als
RCSB
−4
−2
0
2
4
0.0 2.5 5.0 7.5
Coffee consumption (cups/day)D
ecor
ella
ted
resi
dual
s
RCS + interactionC
Alessio Crippa Novel methods for dose–response meta-analysis Karolinska Institutet13 April 2018 15 of 30

Background Paper I Paper II Paper III Paper IV Paper V Conclusions
Paper III
A new measure of between-studies heterogeneity in meta-analysis. Stat.Med., 2016
Specific aimI To develop a new measure of between-study heterogeneity in the
broader context of meta-analysis
Alessio Crippa Novel methods for dose–response meta-analysis Karolinska Institutet13 April 2018 16 of 30

Background Paper I Paper II Paper III Paper IV Paper V Conclusions
Measures of heterogeneity
Heterogeneity measures, I2 and RI , relate the heterogeneity, τ 2, to thetotal variance, τ 2 + σ2
σ2 is a summary measure of the observed within-study variance, vi
Homogeneity of within-studies variances is unlikely to hold
Analysis v1, . . . , v5 CVvi s21 s2
2
A 5, 5.2, 4.9, 5.3, 4.8 0.04 5.0 5.0B 4, 17, 15, 2, 3.8 0.84 5.0 4.4
Alessio Crippa Novel methods for dose–response meta-analysis Karolinska Institutet13 April 2018 17 of 30

Background Paper I Paper II Paper III Paper IV Paper V Conclusions
Rb a new measure of heterogeneity
The new measure quantifies the contribution of τ 2 relative to thevariance of the pooled random effects estimate
Rb = τ 2
IVar(β̂re
) = 1I
I∑i=1
τ 2
vi + τ 2 (1)
Rb satisifies the properties for a measure of heterogeneity
Rb is a consistent and asymptotically normal distributed estimator(Wald-type confidence intervals)
It coincides with I2 and RI when vi = σ2 ∀i = 1, . . . , I
Alessio Crippa Novel methods for dose–response meta-analysis Karolinska Institutet13 April 2018 18 of 30

Background Paper I Paper II Paper III Paper IV Paper V Conclusions
Overall (Rb = 67%, p < 0.01)
0.65 1 1.5 2 3.5
Nagano et al., 2000Michaud et al., 2006Michaud et al., 2006Larsson et al., 2010Ferrucci et al., 2010Jakszyn et al., 2011
Tavani et al., 2000Closas et al., 2007Hu et al., 2008Aune et al., 2009Lin et al., 2012Wu et al., 2012Isa et al., 2013
3.24% 0.84 [0.42, 1.70] 7.04% 0.94 [0.67, 1.34] 8.56% 1.03 [0.79, 1.33] 8.74% 0.91 [0.71, 1.16] 9.07% 1.21 [0.96, 1.52] 11.37% 1.01 [0.96, 1.06]
6.95% 2.13 [1.50, 3.04] 9.51% 0.84 [0.68, 1.02] 8.91% 1.40 [1.10, 1.77] 9.02% 1.34 [1.07, 1.69] 5.37% 2.85 [1.79, 4.55] 7.36% 1.23 [0.88, 1.71] 4.86% 1.94 [1.16, 3.24]
100.00% 1.22 [1.05, 1.41]
Cohort
Case−control
Author(s), Year RR [95% CI]Weight
1.51 [1.13, 2.02]Subtotal (Rb = 81%, p < 0.01)
1.01 [0.97, 1.06]Subtotal (Rb = 0%, p = 0.62)
Red meat and bladder cancerfor every 100 g per day increment
Analysis β̂ (95% CI) Q test, p values CVvi R̂b (95% CI) I2 (95% CI) R̂I (95% CI)
Red meat 1.22 (1.05, 1.41) 60, < 0.01 5.94 67 (66, 68) 80 (79, 81) 89 (88, 89)Red meat, Prospective 1.01 (0.97, 1.06) 4, 0.6 3.51 0 (0, 4) 0 (0, 8) 0 (0, 100)Red meat, Case-control 1.51 (1.13, 2.02) 40, < 0.01 0.36 81 (80, 82) 85 (84, 86) 86 (85, 86)
Alessio Crippa Novel methods for dose–response meta-analysis Karolinska Institutet13 April 2018 19 of 30

Background Paper I Paper II Paper III Paper IV Paper V Conclusions
Paper IV
A pointwise approach to dose–response meta-analysis of aggregated data.
Specific aimI To move beyond the specification of a unique model across the
studies exploring possible advantages of a point-wise approach
Alessio Crippa Novel methods for dose–response meta-analysis Karolinska Institutet13 April 2018 20 of 30

Background Paper I Paper II Paper III Paper IV Paper V Conclusions
Paper IV
Possible limitations of a two-stage approachI Common study-specific functional relationship (1st stage)I Information on study-specific exposure range is not considered (2nd
stage)
ConsequencesI Poor fit in some of the study-specific dose–response analysesI Risk of extrapolating predicted relative risks
Alessio Crippa Novel methods for dose–response meta-analysis Karolinska Institutet13 April 2018 21 of 30

Background Paper I Paper II Paper III Paper IV Paper V Conclusions
Individual curves for 13 studies on red meat and bladder cancer riskCurve Common FP (−1, −0.5) Individual FP
1
2345
0 100 200 300 400
Study ID 1
1.0
1.5
2.0
100 200 300 400
Study ID 2
51015202530
0 100 200 300 400
Study ID 3
0.9
1.0
1.1
1.2
1.31.4
100 200 300 400
Study ID 4
51015202530
0 100 200 300 400
Study ID 5
0.8
1.0
1.21.41.61.8
0 100 200 300 400
Study ID 6
1
2
34567
100 200 300 400
Study ID 7
51015202530
0 100 200 300 400
Study ID 8
0.2
0.4
0.60.81.01.21.4
100 200 300 400
Study ID 9
0.8
1.0
1.2
1.41.6
0 100 200 300 400
Study ID 10
0.6
0.8
1.0
0 100 200 300 400
Study ID 11
1
2345
0 100 200 300 400
Study ID 13
2
4
6
100 200 300 400
Study ID 14
Red meat (g per day)
Rel
ativ
e ris
k
Alessio Crippa Novel methods for dose–response meta-analysis Karolinska Institutet13 April 2018 22 of 30

Background Paper I Paper II Paper III Paper IV Paper V Conclusions
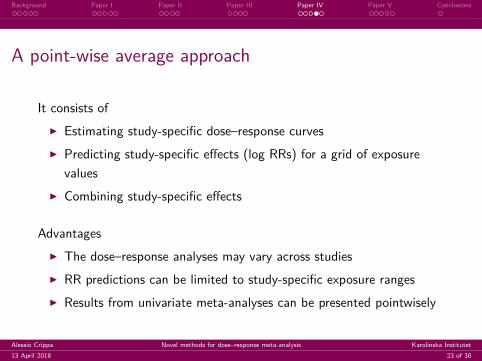
A point-wise average approach
It consists ofI Estimating study-specific dose–response curvesI Predicting study-specific effects (log RRs) for a grid of exposure
valuesI Combining study-specific effects
AdvantagesI The dose–response analyses may vary across studiesI RR predictions can be limited to study-specific exposure rangesI Results from univariate meta-analyses can be presented pointwisely
Alessio Crippa Novel methods for dose–response meta-analysis Karolinska Institutet13 April 2018 23 of 30
Background Paper I Paper II Paper III Paper IV Paper V Conclusions
A point-wise average approach
It consists ofI Estimating study-specific dose–response curvesI Predicting study-specific effects (log RRs) for a grid of exposure
valuesI Combining study-specific effects
AdvantagesI The dose–response analyses may vary across studiesI RR predictions can be limited to study-specific exposure rangesI Results from univariate meta-analyses can be presented pointwisely
Alessio Crippa Novel methods for dose–response meta-analysis Karolinska Institutet13 April 2018 23 of 30

Background Paper I Paper II Paper III Paper IV Paper V Conclusions
●● ● ●
● ●
●
●●
●● ●
0 50 100 150 200 250 300
0.5
1.0
1.5
2.0
2.5
3.0
Red meat consumption (g per day)
Ris
k ra
tio
●
●●
●● ● ● ● ● ● ● ●
●
● ●
● ●●
● ● ● ●● ● ● ●
● ●● ● ●
●●
● ●● ● ● ● ● ● ● ● ● ●
● ● ● ● ● ● ● ● ● ● ● ● ● ● ● ● ● ● ● ● ● ● ● ● ● ●
n
3712
Num
ber
of s
tudi
es
●
●
Point−wise averageTwo−stage
Alessio Crippa Novel methods for dose–response meta-analysis Karolinska Institutet13 April 2018 24 of 30

Background Paper I Paper II Paper III Paper IV Paper V Conclusions
Paper V
One-stage dose–response meta-analysis for aggregated data. Stat.Methods Med. Res., 2018
Specific aimI To avoid exclusion of studies in order to fit more complex and
informative models in an alternative one-stage approach fordose–response meta-analysis
Alessio Crippa Novel methods for dose–response meta-analysis Karolinska Institutet13 April 2018 25 of 30

Background Paper I Paper II Paper III Paper IV Paper V Conclusions
Paper V
Study-specific dose–response analyses are often limited (1 to 3 log RRs)Studies reporting one RR are excluded to model non-linear curves
A one-stage procedure for random-effects meta-analysis of non-linearcurves
I Conceptually easierI Fit more elaborate curvesI Avoid exclusion of studies with small observations
Alessio Crippa Novel methods for dose–response meta-analysis Karolinska Institutet13 April 2018 26 of 30
Background Paper I Paper II Paper III Paper IV Paper V Conclusions
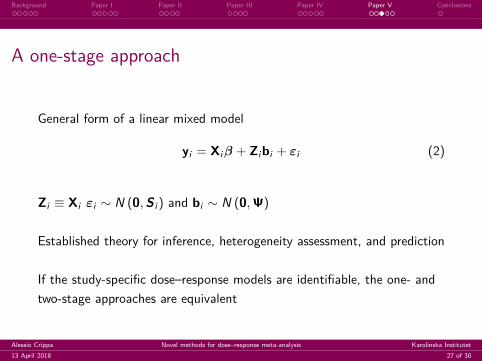
A one-stage approach
General form of a linear mixed model
yi = Xiβ + Zi bi + εi (2)
Zi ≡ Xi εi ∼ N (0,S i ) and bi ∼ N (0,Ψ)
Established theory for inference, heterogeneity assessment, and prediction
If the study-specific dose–response models are identifiable, the one- andtwo-stage approaches are equivalent
Alessio Crippa Novel methods for dose–response meta-analysis Karolinska Institutet13 April 2018 27 of 30

Background Paper I Paper II Paper III Paper IV Paper V Conclusions
Individual curves for 12 studies on coffee and mortalityCurve One−stage Two−stage
0.4
0.6
0.81.01.21.4
0 2 4 6 8
Study ID 2
0.6
0.7
0.8
0.9
1.0
0 2 4 6 8
Study ID 4
0.6
0.8
1.0
1.2
0 2 4 6 8
Study ID 5
0.8
1.0
1.2
1.41.61.82.0
0 2 4 6 8
Study ID 6
0.5
1.0
1.5
0 2 4 6 8
Study ID 7
0.6
0.7
0.8
0.9
1.0
0 2 4 6 8
Study ID 10
0.6
0.8
1.0
1.2
0 2 4 6 8
Study ID 11
0.6
0.8
1.0
1.21.4
0 2 4 6 8
Study ID 16
0.8
0.9
1.0
0 2 4 6 8
Study ID 17
0.8
0.9
1.0
1.1
0 2 4 6 8
Study ID 18
0.7
0.8
0.9
1.01.11.2
0 2 4 6 8
Study ID 28
0.8
0.9
1.0
1.1
0 2 4 6 8
Study ID 29
Coffee consumption (cups/day)
Rel
ativ
e ris
k
Alessio Crippa Novel methods for dose–response meta-analysis Karolinska Institutet13 April 2018 28 of 30

Background Paper I Paper II Paper III Paper IV Paper V Conclusions
0.80
0.85
0.90
0.95
1.00
0 2 4 6 8
Coffee consumption (cups/day)
Rel
ativ
e ris
k
Curve
One−stage
Two−stage
Alessio Crippa Novel methods for dose–response meta-analysis Karolinska Institutet13 April 2018 29 of 30

Background Paper I Paper II Paper III Paper IV Paper V Conclusions
ConclusionsMethodological advancements in dose–response meta-analysis
PracticeI The dosresmeta R package greatly facilitates applications
InterpretationI The proposed tools can help to evaluate the goodness-of-fitI The R̂b quantifies the impact of heterogeneity without any
assumption about the within-study error term
EstimationI A point-wise approach for evaluating heterogeneous curves and
exposure distributionsI A one-stage meta-analysis for addressing more elaborated research
questions based on all of the information available
Alessio Crippa Novel methods for dose–response meta-analysis Karolinska Institutet13 April 2018 30 of 30

Background Paper I Paper II Paper III Paper IV Paper V Conclusions
ConclusionsMethodological advancements in dose–response meta-analysisPractice
I The dosresmeta R package greatly facilitates applications
InterpretationI The proposed tools can help to evaluate the goodness-of-fitI The R̂b quantifies the impact of heterogeneity without any
assumption about the within-study error term
EstimationI A point-wise approach for evaluating heterogeneous curves and
exposure distributionsI A one-stage meta-analysis for addressing more elaborated research
questions based on all of the information availableAlessio Crippa Novel methods for dose–response meta-analysis Karolinska Institutet13 April 2018 30 of 30