novel methods for assessing left ventricular dyssynchrony
TRANSCRIPT
Novel methods for assessing left ventricular
dyssynchrony and myocardial function
PhD thesis 2012
Kristoffer Engh Russell
Department of Cardiology and Institute for Surgical research, University of Oslo Oslo University Hospital, Rikshospitalet

© Kristoffer Engh Russell, 2012 Series of dissertations submitted to the Faculty of Medicine, University of Oslo No. 1422 ISBN 978-82-8264-397-9 All rights reserved. No part of this publication may be reproduced or transmitted, in any form or by any means, without permission. Cover: Inger Sandved Anfinsen. Printed in Norway: AIT Oslo AS. Produced in co-operation with Akademika publishing. The thesis is produced by Unipub merely in connection with the thesis defence. Kindly direct all inquiries regarding the thesis to the copyright holder or the unit which grants the doctorate.

1
ACKNOWLEDGMENTS....................................................................................................... 2
ABBREVIATIONS ................................................................................................................. 3
LIST OF PAPERS................................................................................................................... 4
INTRODUCTION ................................................................................................................... 5 DYSSYNCHRONY IN THE HEART........................................................................................... 5 CARDIAC RESYNCHRONIZATION THERAPY ........................................................................ 6 ASSESSING REGIONAL MYOCARDIAL FUNCTION AND DYSSYNCHRONY............................ 7 ASSESSING REGIONAL MYOCARDIAL WORK....................................................................... 8 WASTED WORK .................................................................................................................... 9
AIMS OF THE THESIS ....................................................................................................... 10 GENERAL............................................................................................................................. 10 SPECIFIC.............................................................................................................................. 10
MATERIALS......................................................................................................................... 11 EXPERIMENTAL STUDIES ................................................................................................... 11
In vivo study (Papers 1-4) ............................................................................................... 11 In vitro study (Paper 2) ................................................................................................... 11
CLINICAL STUDIES.............................................................................................................. 11 Electromechanical delay group (Paper 2) ...................................................................... 11 Invasive LV pressure group (Paper 3 and 4).................................................................. 11 Cardiac Resynchronization Therapy Group (Paper 4) .................................................. 12 Control group (Paper 4) .................................................................................................. 12
MODELS AND METHODS................................................................................................. 13 EXPERIMENTAL STUDIES ................................................................................................... 13
In vivo animal model (Papers 1-4).................................................................................. 13 Data analysis - Experimental studies ............................................................................. 14 In vitro Papillary Muscle Study (Paper 2)...................................................................... 21
CLINICAL STUDIES.............................................................................................................. 22 Data analysis - Clinical studies....................................................................................... 23
SUMMARY OF RESULTS.................................................................................................. 24 PAPER 1. .............................................................................................................................. 24 PAPER 2. .............................................................................................................................. 25 PAPER 3. .............................................................................................................................. 25 PAPER 4. .............................................................................................................................. 27
DISCUSSION......................................................................................................................... 28 DIFFERENTIATION BETWEEN ELECTRICAL AND MECHANICAL DYSSYNCHRONY. ......... 28 ELECTRO-MECHANICAL DELAY DURING LEFT BUNDLE BRANCH BLOCK ....................... 29 A NON-INVASIVE INDEX OF MYOCARDIAL WORK ............................................................. 30
Calculation of work ......................................................................................................... 31 Estimated LV pressure curve .......................................................................................... 31
WASTED WORK .................................................................................................................. 32 LIMITATIONS ..................................................................................................................... 34
MAIN CONCLUSIONS........................................................................................................ 35 PAPER 1. .............................................................................................................................. 35 PAPER 2. .............................................................................................................................. 35 PAPER 3. .............................................................................................................................. 35 PAPER 4. .............................................................................................................................. 36
REFERENCE LIST .............................................................................................................. 37

2
Acknowledgments The present work was carried out at the department of cardiology, Institute of surgical
research, Oslo university Hospital, Rikshospitalet, from October 2008 to December 2011.
I have been privileged to have one of the world’s foremost authorities on heart physiology
and mechanics as my supervisor. Prof. Otto A. Smiseth possesses a vast and impressive
knowledge of pathophyiology of the heart. Otto has introduced me to heart mechanics and
experimental research while always emphasising the importance of clinical relevance. His
enthusiasm and hard work has served as tremendous encouragement. Despite his busy
schedule as head division of cardiovascular and pulmonary diseases, he has always found
time for research and discussion.
Prof. Thor Edvardsen has been in the forefront of echocardiography and cardiac imaging
research and is internationally renowned for his work. Thor possesses a unique ability to
motivate and encourage and I have found his advice and comments to be invaluable. As my
co supervisor Thor introduced me to echocardiography and measurements such as strain,
statistical analysis and much more. His door has always been open, something I have often
taken advantage of.
The clinical aspects of my thesis would not have been possible without the support of the
department of cardiology and its head, Lars Aaberge. Lars also played a central part in the
clinical study together with Nils Wilhelmsen and I would like to thank them and the rest of
the staff in the cath lab for their support. I would also like to thank Prof. Ansgard Aasen for
office facilities and a stimulating research environment at the Institute for Surgical Research.
I would also like to thank my fellow researchers Anders Opdahl, Espen W. Remme, Helge
Skulstad, Morten Eriksen, Ola Gjesdal, Kristina Haugaa and Espen Bøe for their support,
genuine interest and friendship. This would not have been possible without you.
I am grateful to the University of Oslo for their research fellowship and for support from the
Inger and John Fredriksen fund.
Finally I would like to thank my family. My parents Grete and David for always believing in
me and supporting me. I would also like to thank my parents’ partners Aage and Jeanette and
my parents in law Sybille and Sean for their encouragement. Most importantly, my thanks
and love goes to my beautiful wife Hannah who has given me unfailing support and who
makes it all worth while.

3
Abbreviations
LV
STE
CRT
LBBB
TDI
IM-EMG
AFG
EMD
REA
OS
IVC
IVR
FDG-PET
WWF
Left ventricle
Speckle tracking echocardiography
Cardiac resynchronization therapy
Left bundle branch block
Tissue Doppler imaging
Intramyocardial electromyograms
Active myocardial force generation
Electromechanical delay
Regional electrical activation
Onset of shortening
Isovolumic contraction
Isovolumic relaxation
18F-fluorodeoxyglucose positron
emission tomography imaging
Wasted work fraction

4
List of papers 1. Evaluation of left ventricular dyssynchrony by onset of active myocardial force generation - a novel method which differentiates between electrical and mechanical etiologies Kristoffer Russell; Anders Opdahl; Espen W. Remme; Ola Gjesdal; Helge Skulstad; Erik Kongsgaard; Thor Edvardsen; Otto A. Smiseth. Circ Cardiovasc Imaging. 2010 Jul 1;3(4):405-14
2. Mechanism of Prolonged Electro-Mechanical Delay in Late Activated Myocardium during Left Bundle Branch Block Kristoffer Russell; Otto A. Smiseth; Ola Gjesdal; Eirik Qvigstad; Per Andreas Norseng; Ivar Sjaastad; Anders Opdahl; Helge Skulstad; Thor Edvardsen; Espen W. Remme. Am J Physiol Heart Circ Physiol. 2011 Dec;301(6):H2334-43. Epub 2011 Oct 7.
3. A novel clinical method for quantification of regional left ventricular pressure-strain area – a noninvasive index of segmental work Kristoffer Russell; Morten Eriksen; Lars Aaberge; Nils Wilhelmsen; Helge Skulstad; Anders Opdahl; Espen W. Remme; Kristina Herman Haugaa; Thor Edvardsen; Otto A. Smiseth. Eur Heart J. 2012 Mar;33(6):724-33. Epub 2012 Feb 6.
4. Wasted work fraction – A novel method for quantifying left ventricular function. Kristoffer Russell; Morten Eriksen; Lars Aaberge; Nils Wilhelmsen; Helge Skulstad; Ola Gjesdal; Thor Edvardsen; Otto A. Smiseth. Submitted

5
Introduction
Dyssynchrony in the heart In the normal heart electrical activation spreads rapidly throughout the ventricles through the
specialized conduction system, resulting in a synchronous ventricular contraction. In some
patients this conduction system is damaged resulting in a slower spread of electrical activation
from myocyte to myocyte. In the left ventricle this may result in left bundle branch block
(LBBB). Patients with LBBB commonly demonstrate left ventricular (LV) mechanical
dyssynchrony, and the most prominent features are early contraction of the interventricular
septum and delayed contraction of LV lateral wall during the isovolumic contraction phase. This
abnormal contraction pattern is due to slowing of intraventricular electrical conduction with
early activation of the septum and late activation of the LV lateral wall, subsequently reducing
LV function.
Dyssynchrony may be divided into inter-ventricular dyssynchrony i.e. between the right and left
ventricle and intra-ventricular i.e. between different walls within the left ventricle. The relative
importance of inter- and intra-ventricular dyssynchrony, however, is not entirely clear and data
are somewhat conflicting regarding the clinical importance of measuring inter-ventricular
dyssynchrony 1, 2. However, most evidence suggests that interventricular dyssynchrony is not as
useful in the prediction of response to cardiac resynchronization therapy (CRT) as LV
intraventricular dyssynchrony 3. In the present thesis we therefore focus on LV intra-ventricular
dyssynchrony since this is known to decrease pump function and aggravate heart failure.
Intra-ventricular dyssynchrony is defined as uncoordinated regional myocardial contractions 4
and may in principle have the following etiologies; 1) Electrical conduction delay which
causes non-uniform timing of myocyte depolarization (primary electrical dyssychrony), 2)
abnormalities in excitation-contraction coupling (excitation-contraction related dyssynchrony),
and 3) abnormal myocardial contractility or load which cause regional delay in fiber
shortening (primary mechanical dyssychrony). This implies that observed mechanical
dyssynchrony may have electrical as well as non-electrical etiologies, and these need to be
differentiated since primary electrical dyssynchrony is most likely the only etiology amenable to
CRT.

6
Cardiac resynchronization therapy Congestive heart failure is one of the major causes of morbidity and mortality in Norway and
other countries. Unlike other common cardiovascular diseases, the age-adjusted mortality
attributed to heart failure appears to be increasing. This occurs in spite of several effective drug
treatments. Quite recently CRT has been documented to be a powerful treatment in patients with
severe congestive heart failure, causing reverse LV remodelling, improvement of symptoms and
reduction in mortality (Figure 1) 5, 6.
Figure 1. Right panel: The Care Heart Failure Trial showed marked reduction in mortality with
bi-ventricular pacing in severe heart failure (Cleland JG et al, N Engl J Med 2005 14;352:1539-
49).
The principle of CRT is that patients with ventricular dyssynchrony can be resynchronised and
improve contractile function through bi-ventricular pacing. This is achieved by using a
pacemaker with two ventricular electrodes which activates the right and the left ventricles
simultaneously (Figure 2).
Figure 2. Schematic illustration of how pacing leads are placed in the two ventricles during bi-
ventricular pacing. LBBB = left bundle branch block. Modified from JA Jarcho. N Engl J Med
2006;355:288.
7
This technology has evolved rapidly over a few years and is now established as effective
treatment in selected patients with congestive heart failure, causing improvement of symptoms,
reduction in mortality, and reverse LV remodelling reducing LV volumes. Based on current
guidelines, patients selected for CRT must have evidence of intra-ventricular electrical delay
with QRS > 120ms, severe congestive heart failure class III or ambulatory class IV, optimal
medical therapy, LV ejection fraction � 35 % and evidence of LV dyssynchrony 7. Recently,
guidelines also recommended that patients with heart failure class II and QRS >150ms be
considered for CRT 7. However, based on these guidelines, about one third of patients treated
with CRT do not show clinical improvement, and in some cases aggravation of symptoms may
occur after implantation of the CRT device 8, 9.
Therefore, a major problem with CRT is that many patients are non-responders, and we
need better methods for selection of candidates for this treatment modality.
The greatest challenge in the selection of patients for CRT is the verification of dyssynchrony
that may respond to resynchronization. Currently, electrocardiography is used as the main
screening tool for dyssynchrony, and patients are selected for CRT based on morphology and
duration of the QRS complex. In clinical trials which have documented clinical benefit of CRT,
one of the entry criteria has been QRS duration over 120 ms and most often with left bundle
branch block (LBBB) type morphology and sinus rhythm.
Several trials, however, have shown that QRS duration is not a very precise marker of LV
dyssynchrony, as patients with a wide QRS may not have LV dyssynchrony, and patients with a
narrow QRS may actually have dyssynchrony. This may explain why a substantial fraction of
patients with wide QRS are non-responders to CRT in the large trials 10, 11. There is therefore a
strong interest in developing better methods for identifying patients who will benefit from CRT.
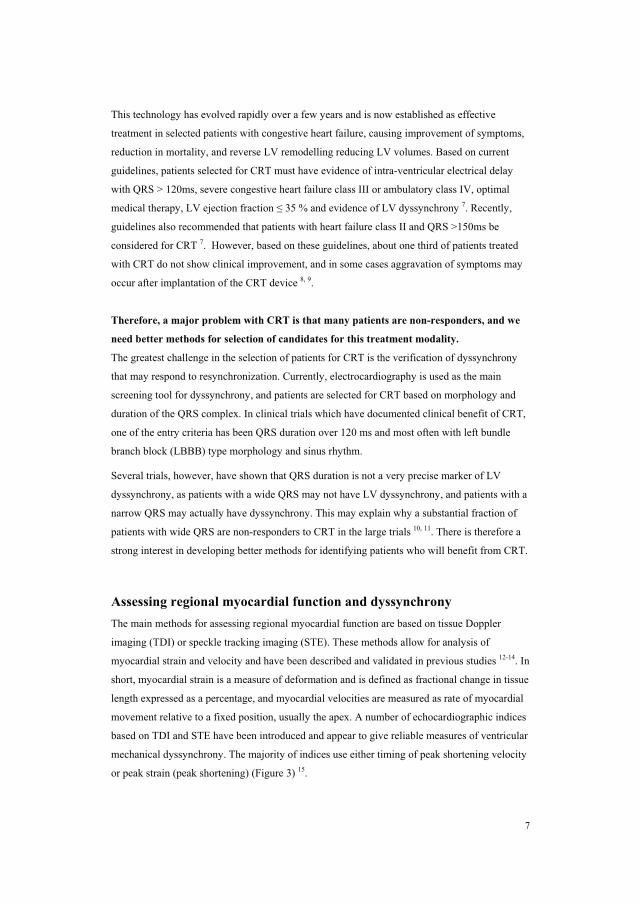
Assessing regional myocardial function and dyssynchrony The main methods for assessing regional myocardial function are based on tissue Doppler
imaging (TDI) or speckle tracking imaging (STE). These methods allow for analysis of
myocardial strain and velocity and have been described and validated in previous studies 12-14. In
short, myocardial strain is a measure of deformation and is defined as fractional change in tissue
length expressed as a percentage, and myocardial velocities are measured as rate of myocardial
movement relative to a fixed position, usually the apex. A number of echocardiographic indices
based on TDI and STE have been introduced and appear to give reliable measures of ventricular
mechanical dyssynchrony. The majority of indices use either timing of peak shortening velocity
or peak strain (peak shortening) (Figure 3) 15.
8
Figure 3. Representative traces from a 4 chamber view in a patient with left bundle branch block. Left panel:
traces showing peak strain by speckle tracking echocardiography (yellow arrows). Right panel: traces
showing peak ejection velocity (white arrows) by tissue Doppler velocity.
However, when tested against QRS-width in prospective clinical trials none of the
echocardiographic indices have been proven to give clinical benefit in patient selection for CRT 16, 17. Although QRS duration is an imperfect marker of responders to CRT, there is yet no other
consensus definition of dyssynchrony that has been sufficiently evaluated. Therefore, current
international guidelines do not recommend routine quantification of dyssynchrony by
echocardiography in the evaluation of patients who are considered potential candidates for CRT 7, 18.
One reason for the apparent failure of echocardiography to provide added value in selection of
patients for CRT may be that suboptimal methodological approaches have been used. Since it is
primarily dyssynchrony caused by electrical conduction delay which will respond to CRT,
methodology to differentiate between electrical and non-electrical etiologies of dyssynchrony is
important. Furthermore, timing based dyssynchrony indices may not always reflect the
hemodynamic consequence of the dyssynchrony, as a dyssynchronous contraction pattern is not
only based on the differences in activation between segments but also on differences in regional
function i.e. differences in regional work 15, 19, 20.
Assessing regional myocardial work In the normal heart all segments contract almost simultaneously. This means that all segments
contract against a similar LV pressure. However, when segmental contraction is delayed i.e. one
segment contracts after another, this is not the case. In these cases regional contraction within
the LV occurs against different pressures and therefore one needs information about both the
degree of shortening and LV pressure during shortening to compare regional work done by the
segments. Shortening indices, such as strain, do not incorporate load and do therefore not reflect

9
myocardial work or oxygen demand. As shown by Suga 21 in an experimental study, the area of
the LV pressure-volume loop reflects stroke work as well as myocardial oxygen consumption
and the clinical validity of this concept was later confirmed 22. According to the same principle,
the area of the myocardial force-segment length loop reflects regional myocardial work and
oxygen consumption 23. Because calculation of myocardial force is challenging, pressure is used
as a substitute for force and the area of the LV pressure-dimension loop is used as an index of
regional work 24-27. The introduction of strain by echocardiography has allowed for non-invasive
assessment of regional deformation and may be combined with LVP to assess pressure-strain
loops which is likely to provide important insights into cardiac mechanics for assessing
myocardial function. However, clinical use of this index is limited by the need for invasive
pressure.
Wasted Work
As discussed above a normal heart will have a synchronous LV contraction of all segments.
However, in patients with regional differences in contractility as in ischemia, or delay in
electrical conduction as in LBBB, some segments are stretched while others contract, resulting
in a dyssycnhronous contraction pattern. The result of this dyssynchrony is that substantial
amounts of LV work is “wasted” on stretching opposing segments and does not contribute
effectively to LV ejection. Left ventricular electrical dyssynchrony (LBBB) is associated with
marked intersegment differences in myocardial work 28. During LBBB the septum performs
little or even negative work, whereas the LV lateral wall is hyperactive due to pre-systolic
stretching (increased preload) caused by the early-activated septum. When work is wasted due
to electrical dyssynchrony it should in theory, provided the myocardium is viable, be possible to
convert the wasted work into effective work if ventricular contractions become resynchronized.
Therefore, calculation of wasted work may be an important clinical tool for quantifying the
mechanical impact of dyssynchrony on regional and global LV function. Analysis of regional
work during electrical dyssynchrony may provide important insights into mechanisms of
remodeling and LV dysfunction29, 30. Furthermore, abnormal intersegmental work distribution
during LBBB is associated with differences in regional blood flow and oxygen demand and may
also account for remodeling of the left ventricle 26, 31-33 .

10
Aims of the thesis General Aims The general aim of the present studies was to investigate mechanisms of dyssynchrony
and based on this, develop better methods for assessment of patients with dyssynchrony
in the heart.
Specific Aims
1. The aim of paper 1 was to establish a method which can differentiate between electrical
and non-electrical etiologies of left ventricular (LV) dyssynchrony, because primary electrical
dyssynchrony is most likely the only etiology amenable to CRT.
2. During left bundle branch block (LBBB) electromechanical delay (EMD), defined as time
from regional electrical activation (REA) to onset shortening, is prolonged in the late
activated left ventricular (LV) lateral wall compared to the septum. The aim of paper 2 was to
determine the mechanism of the prolonged EMD allowing for a better understanding of
dyssynchrony measurements that rely on timing of regional myocardial shortening.
3. The main objective of paper 3 was to determine if LV pressure-strain loop area can be
estimated with an entirely non-invasive approach by using an estimated LV pressure curve in
combination with strain by speckle tracking echocardiography. Furthermore, to investigate if
non-invasive pressure-strain area reflects regional work and metabolism.
4. The main aim of paper 4 was to investigate if LV work that is wasted during
dyssynchronous LV contraction can be measured and quantified non-invasively using wasted
work fraction (WWF).

11
Materials
Experimental studies
In vivo study (Papers 1-4)
A total of 15 mongrel dogs were studied. In 7 dogs LBBB was induced by radiofrequency
ablation 34 and in 8 dogs ischemia was induced by occlusion of the left anterior descending
coronary artery.
In vitro study (Paper 2)
Four New Zealand White rabbits were used for the papillary muscle study.
The National Animal Experimentation Board approved the study. The laboratory animals
were supplied by Center for Comparative Medicine, Oslo University Hospital, Rikshospitalet,
Norway.
Clinical studies
Electromechanical delay group (Paper 2)
Nine patients with heart failure (NYHA II-IV) and implanted bi-ventricular pacing devices
were included (3 patients with ischemic cardiomyopathy and 6 patients with non-ischemic
dilated cardiomyopathy). All patients had LBBB before implantation of the CRT pacing
device.
Invasive LV pressure group (Paper 3 and 4)
Eighteen patients with heart failure (NYHA II-IV) underwent LV catheterization, including
11 with ischemic cardiomyopathy and 7 with non-ischemic dilated cardiomyopathy. Twelve
of these patients had LBBB. Four of the patients with LBBB had a CRT device allowing for
echocardiographic measurements with CRT on and off with color tissue Doppler imaging
(Paper 2), however, only two had image quality sufficient for STE (Paper 3).

12
Positron Emission Tomography group (Paper 3)
Six patients with dilated cardiomyopathy and LBBB (NYHA II-IV) were included for 18F-
fluorodeoxyglucose positron (FDG-PET) analysis. In these patients coronary artery disease
was ruled out by coronary angiography prior to investigation.
Cardiac Resynchronization Therapy Group (Paper 4)
Ten patients with heart failure (NYHA II-IV) and LBBB were included. In these patients
coronary artery disease was ruled out by coronary angiography prior to investigation.
Echocardiography was preformed prior to CRT implantation and at follow up 8±3 months
after implantation.
Control group (Paper 4)
Twenty healthy individuals were age and sex matched and recruited from hospital staff. All
had normal clinical examination, ECG and echocardiography.
All studies were approved by the Regional Committee for Medical Research Ethics and all
subjects gave written informed consent.

13
Models and Methods
Experimental studies In vivo animal model (Papers 1-4)
Animal preparation
The dogs were anesthetized, ventilated, and surgically prepared as previously described 35. In
addition pacemaker leads were attached epicardially on the left ventricular lateral wall and
right atrium and endocardially in the right ventricular outflow tract close to the septum.
Aortic, left atrial and LV pressures were measured by micromanometers 35. A fluid-filled
catheter in the left atrium served as an absolute pressure reference.
Sonomicrometry and regional electromyograms
In each dog 2 mm sonomicrometry crystals (Sonometrics Corp., London, Ontario, Canada)
with bipolar electrodes for measuring IM-EMG were implanted sub-endocardially and sub-
epicardially as illustrated in Figure 4. In each of the dogs 4 circumferential and 2 longitudinal
(anterior and posterior) segments were measured. In the animals with LBBB we additionally
measured longitudinal dimension in the mid-segments in septum and lateral wall.
Figure 4. Schematic illustration of placement of myocardial crystals.36
Depending on the specific aim of the study, various combinations of crystal pairs were
analyzed and reported (as described in the papers). Timing of regional electrical activation
was measured at onset R in IM-EMG, defined as the onset of the first spike that lead to a
deflection of more than 20% of total QRS amplitude.

14
Echocardiography
A Vivid 7 ultrasound scanner (GE Vingmed Ultrasound AS, Horten, Norway) was used to
record color-coded TDI images in apical 2, 4 and long chamber views. Conventional 2-D
grayscale images of the LV equatorial short-axis and apical long axis, 2 and 4 chamber views
were acquired for STE.
Data analysis - Experimental studies
Regional strain and shortening velocity (Paper 1)
Myocardial strain was obtained by sonomicrometry calculated as a percentage of end-
diastolic length, and strain by echocardiography using STE. Myocardial shortening velocity
by sonomicrometry was calculated as the time derivative of segment length and shortening
velocity by echocardiography using TDI. The following time markers were measured for
myocardial shortening velocity and strain:
- Timing of onset of systolic shortening velocity
- Timing of peak shortening velocity during ejection (S)
- Timing of peak systolic strain.
Onset active force generation (AFG) by sonomicrometry and LVP (Paper 1 and 2)
The time of onset AFG was determined by analyzing myocardial pressure-segment length
loops, and was defined as the time when the pressure-segment length coordinate was shifted
upwards relative to the passive-elastic curve for the same segment. The calculation of onset
AFG is illustrated in Figure 5. The passive-elastic curve was constructed by an exponential fit
to a series of end-diastolic pressure-segment length coordinates obtained during caval
constriction (Figure 5, left panel i-iii). End-diastolic measurements were used in order to
ensure that the myocardium was completely relaxed. Onset AFG was defined as the time
when the pressure-segment length coordinate was shifted upwards relative to the passive-
elastic curve for the same segment (Figure 5, middle panel). Since the pressure-segment
length relationship provides no timing information, onset AFG was extracted from a
corresponding time point in either the pressure or the segment length curve (Figure 5, right
panel).

15
Figure 5. Measurement of onset active force generation (AFG) in a representative experiment.
Left panel. Construction of passive elastic curve. i) Pressure-segment length loops during
caval constriction. ii) High gain LV pressure (LVP) showing end-diastolic points. iii)
Exponential fit to end-diastolic points. Middle panel. Onset AFG was defined as the first
coordinate of the pressure segment length loop that leads to a deviation from the passive-
elastic curve. Right panel. Timing of onset AFG was extracted from either LVP or segment
length traces.36
Onset AFG by STE and LVP (Paper 1)
Onset AFG was also assessed by combining LVP with strain by STE. Because strain represents
a relative value, this analysis does not provide a range of end-diastolic pressure-dimension
relations, and the late-diastolic portion of each loop was used to define the passive-elastic state.
Identification of onset AFG was based on subjective, visual assessment, defined as the first
marked upward deviation of the pressure-strain loop that resulted in a continued upward shift
after onset of R in ECG.
Quantification of LV dyssynchrony (Paper 1):
Left ventricular dyssynchrony was quantified by two different approaches; 1) as peak
intersegment time difference, measured as time difference between the earliest and the latest
activated segments, and 2) as standard deviation for 6-8 segments of time from onset R in ECG
to timing of each of the indices, referred to as SD of timing. In addition we presented times
from onset R in ECG to timing of each of the indices. The latter approach allows presentation
of individual timing data from all segments and all animals in a single graph.

16
Electromechanical activation time (Papers 1 and 2)
Electromechanical delay (EMD) for LV septal and lateral wall segments was quantified by two
different approaches: 1) as time from regional electrical activation to onset of shortening
(EMDOS), and 2) as time from regional electrical activation to onset of active force generation
(EMDAFG). Timing of onset AFG (as defined above) reflects the earliest mechanical sign of
active force and we therefore used EMDAFG as the reference method for electromechanical
coupling time.
Calculation of estimated LV pressure curve (Paper 3 and 4)
The non-invasively estimated LV pressure curve was validated first in the dog model which
allowed testing under a wide range of hemodynamic conditions. Thereafter, the method was
validated in patients with various cardiac disorders. As an estimate of peak LV pressure, aortic
pressure measured invasively was used in dogs and brachial artery cuff pressure in patients.
The profile of the estimated LV pressure curve was determined by using an empiric reference
curve which was adjusted according to duration of the isovolumic and ejection phases as
determined by echocardiography.
Calculating LV pressure reference curve
The LV pressure reference curve was calculated by pooling single cycle LV pressure traces
from all interventions and normalizing each pressure trace using timing of valvular events in
the following three steps: 1. The timing of opening and closure of the mitral and aortic valves
was identified by echocardiography and assigned to each of the pressure traces (Figure 6 A1
and B1). 2. Each of the raw data traces were stretched or compressed along the time axis
between individual valve events in order to make the valvular events coincide for all
recordings (Figure 6 A2 and B2). 3. All traces were scaled vertically to have the same peak
value. An averaged waveform was then calculated (black line in black Figure 6 A2 and B2).
Applying LV pressure reference curve to a specific subject
The profile of the averaged LV pressure waveform was used for predicting LVP in the specific
subject by measuring the actual valvular timing for the relevant cardiac cycle and adjusting the
duration of time intervals of IVC, ejection and IVR phases by stretching or compressing the
time axis of the averaged LV pressure curve to match the measured time intervals (Figure 6 B3
and 4). Peak arterial pressure was used to scale the amplitude of the pressure curve. Separate
reference curves were used for dogs and patients. Note that data from all interventions in the
dog study were used and that data from all patient observations were included in the

17
calculation of the normalized LV pressure reference curve without considering their clinical
status.
Figure 6. Estimation of LV pressure curve A. 1) Raw LV pressure data from dogs used for
creating a profile of the reference pressure waveform, consisting of pressure recordings
during different haemodynamic situations. Timing of mitral and aortic valve events are
indicated. 2) The raw pressure waveforms (grey curves) have been stretched or compressed
along the time axis between individual valve events in order to make the valvular events
coincide for all recordings. The waveforms have also been vertically scaled to have the same
peak value. The averaged waveform to be used for predicting pressure traces is indicated by
the black curve. B. 1 and 2) Patient data: estimation of average pressure waveform as
described in A.1 and 2. 3) The averaged waveform with arbitrary time intervals, transferred
from panel B.2. 4) Prediction of the LV pressure waveform is based on timing of valvular
event. The LV pressure waveform is constructed by adjusting the duration of time intervals to
match the actual valvular timing as determined by echocardiography in the specific subject.
In addition to the time axis adjustments, the waveform has been scaled according to systolic
arterial cuff pressure 37.

18
Pressure strain loops (Paper 3)
Strain and pressure data were synchronized using onset R in ECG as a common time
reference. Strain by STE was converted to the same sampling rate as sonomicrometry (200
Hz). Loop area was calculated by the following methods:
1.Invasive method: The area of the LV pressure-strain loops by LVP and STE.
2.Non-invasive method: The area of the LV pressure-strain loops by the estimated LV
pressure curve and STE.
Comparison between LV pressure-strain loop area and myocardial work
LV pressure-strain loop area as an index and myocardial work does not take into account
effects on work related to changes in radius of curvature or contribution from different fibre
directions. To determine the magnitude of this effect we measured myocardial work
incorporating LV geometry (circumferential and longitudinal) and area strain during LBBB.
To be able to compare the two methods we correlated work done by the septum divided by
work done by the lateral wall using the two methods. A comparison between septum and
lateral wall was made because during LBBB the septum does less work compared to the
lateral wall.
Calculation of segmental work as a function of time
Work for individual segments as a function of time throughout the cardiac cycle was
calculated from the strain recordings and from measured or estimated LV pressure. This was
done by obtaining the rate of segmental shortening (strain rate) by differentiation of the strain
curve (Figure 7 A), and multiplying this with instantaneous left ventricular pressure (Figure 7
B). This resulted in a measure of instantaneous power, which was integrated over time to give
work as a function of time (Figure 7 C). Performing this calculation for the IVC, ejection and
IVR phases of a cardiac cycle is mathematically the same as calculation of the area between
the x-axis and the corresponding segment of the strain – pressure loop, however keeping in
mind that areas under sections of the loop that represent elongation are counted as negative.

19
Figure 7. Work of individual segments was calculated from the strain recordings and the left
ventricular pressure. Instead of calculating only one value of work in a completed cardiac
cycle for each segment, equal to the area of the strain – pressure loop, work was calculated
as a function of time throughout the cardiac cycle. This was done by obtaining the rate of
segmental shortening (strain rate) by differentiation of the strain curve (Figure 7A), and
multiplying this by instantaneous left ventricular pressure (Figure 7B). This resulted in a
measure of instantaneous power, which was integrated over time to give work as a function of
time (Figure 7C) (From Paper 4).
Analysis of segment work curves
Information was extracted from the segmental work curves over a time interval spanning from
mitral valve closure to mitral valve opening. The following variables were calculated:
Wpos Total positive work, sum of all work performed during shortening of the segment
(Figure 8, red line).
Wneg Total negative work, sum of all work performed during elongation of the segment
(Figure 8, black line).
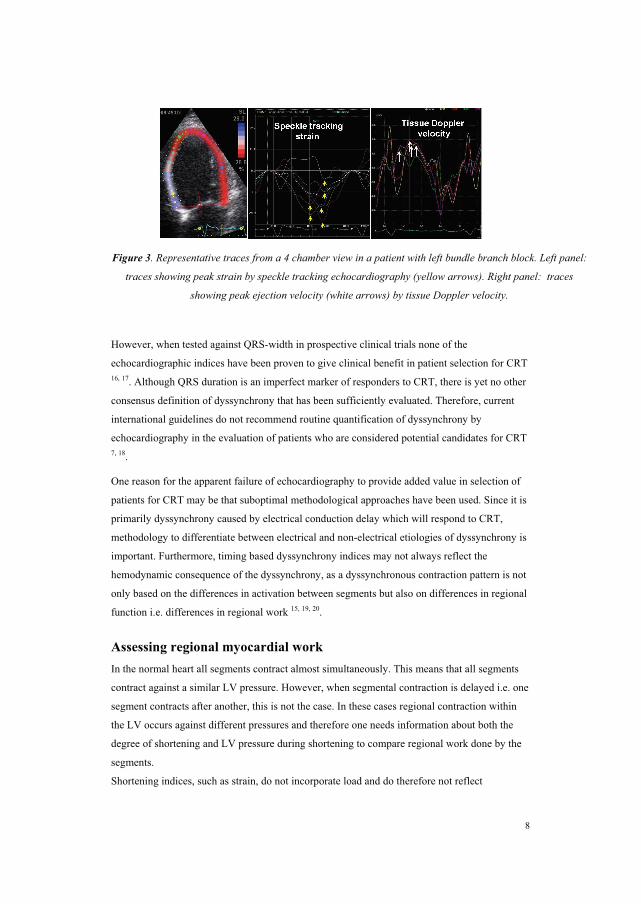
WWF was calculated globally from the sum of work for all segments:
20
����
pos
negglobal W
WWWF 100
The net work contributing to systolic ejection for each segment was calculated as:
negposnet WWW ��
A segmental Negative/Positive work ratio for each segment was also calculated:
pos
neg
WW
ratio workpositive / negative Segmental �
Figure 8. Estimated LV pressure (upper panels), strain (middle panels) and
calculation of wasted work for septum and lateral wall (lower panels) in a
representative patient with left bundle branch block (LBBB) (left panel) and after
treatment with cardiac resynchronization therapy (CRT) (right panel). Horizontal lines
indicate valvular events measured by echocardiography. In the lower panels negative
and positive work during systole is marked as red and black, respectively. In lower
panels the segmental Negative/Positive work ratios are indicated. Please note that the
ratio improved markedly in the septum with CRT, indicating a conversion to
predominantly positive work. (From paper 4)

21
In vitro Papillary Muscle Study (Paper 2) Quantification of Electromechanical Delay
The papillary muscles were extracted and prepared as described in paper 2.
Onset of electrical activation was defined as the start of the stimulation spike. Onset of
shortening was defined as the first data point after peak length of the papillary muscle that led
to continued shortening.
To assess if the load at the time of activation affected the delay from electrical activation to
OS, we activated the papillary muscle at different isotonic loads: F= 40, 50, 60, and 70% of
Fmax (Figure 9 A) where Fmax was peak isometric force developed by the muscle. We
subsequently measured time from electrical activation to OS.
To assess if rate of load rise (dF/dt) at time of activation (equivalent to dP/dt in the in vivo
heart) affected the delay from electrical activation to OS, we activated the papillary muscle
and applied linearly increasing load (dF/dt) at different slopes from the time of electrical
activation (Figure 9 B), i.e. ramp loading. Different slopes were applied by linearly increasing
F from preload to 40, 50, 60, and 70% of Fmax in a constant time interval. (Figure 9 B).
Figure 9. Papillary muscle experiment. A. Delay in onset shortening as a function of isotonic
load B. Delay as a function of dF/dt 38.

22
Clinical studies
Echocardiographic and Hemodynamic measurements (Papers 2-4)
For all patients a Vivid 7 ultrasound scanner (GE) was used to record color-coded TDI images
in apical 2, 4 and long chamber views. Conventional 2-D grayscale images of the LV
equatorial short-axis and apical 2, 4 and long chamber views were acquired for speckle
tracking echocardiography (STE). In the six patients who underwent PET echocardiography
was performed immediately after the PET.
In the 18 patients with invasive measurements, LVP was measured by a micromanometer-
tipped catheter (Millar Mikro-Tip SPC-454F, Houston, Texas) and a fluid-filled catheter
connected to an external pressure transducer served as absolute pressure reference. Brachial
arm cuff pressure was measured. Pressure and imaging data were stored on the ultrasound
scanner. All the analysis was performed offline.
Assessing electro mechanical activation (Paper 2)
Regional electrical activation for septum and lateral wall was assessed using the pacemaker
electrodes as regional EMGs. Onset of regional electrical activation was defined as onset R in
EMG as described above. Onset of shortening was assessed in septal and lateral wall
segments corresponding to lead position using longitudinal strain by TDI. Time from regional
electrical activation to OS (EMDOS) for the septum and lateral wall was then calculated for
each patient with pacing ON and OFF. In four patients LVP was measured by
micromanometry and simultaneous echocardiographic recordings were performed.
FDG-PET (Paper 3)
Patient preparation is described in paper 3 and in previous publications 39. Gated FDG-PET
acquisition (Simens Biograph 64) was started 60-80 min after intravenous administration of
the FDG (370-380 MBq ), with 8 gates per RR interval. The acquisition was also gated for
respiration. Images were reconstructed and analyzed on the Xeleris workstation (GE
healthcare). The point in the LV myocardium with the highest FDG uptake was used as a
reference (100%), and segmental values were reported as percentages of this value.

23
Data analysis - Clinical studies
Pressure-strain loops (Paper 3)
The non-invasively estimated LV pressure curve was constructed using the same approach as
described in the experimental study section. As an estimate of peak LV pressure, brachial
artery cuff pressure was measured in patients. The profile of the estimated LV pressure curve
was determined by using an empiric reference curve which was adjusted according to
duration of the isovolumic and ejection phases as determined by echocardiography (Figure 6
B and C). Separate reference curves were used for dogs and patients (Figure 6 A and B).
Note that data from all interventions from all patient observations were included in the
calculation of the normalized LV pressure reference curve without considering their clinical
status.
Wasted work fraction
Echocardiography and estimated vs. invasive LV pressure
In the patients with invasive LV pressure, work was analyzed by two different methods: 1.
STE strain and measured LV pressure 2. STE strain and estimated LV pressure.
Echocardiography and estimated LV pressure
To assess responses to CRT, work analysis was performed before implantation of the CRT
device and at 8±3 months follow up, using estimated LV pressure and strain from the 3
apical views. Measurements were also performed in the normal control population using the
same approach.
Statistical analysis
Values are expressed as mean±SD. Variables were compared using least-squares linear
regression, Pearson correlation coefficients, intraclass correlation coefficients and Bland-
Altman methods. To account for multiple measurements from each animal when using Bland-
Altman we display reference intervals based on agreement between methods of measurement
with multiple observations per individual 40. Significance for mean difference was assessed
using paired t-test method. For multiple comparisons we used two-way repeated
measurements ANOVA with LSD post test (SPSS 15.0, SPSS Inc, Chicago, IL). All post hoc
tests are compared to baseline. P<0.05 was considered significant.
Interobserver variability was assessed using the interclass correlation coefficient (� value) and
Bland-Altman method.

24
Summary of results
Paper 1. In fourteen anesthetized dogs we induced ischemia by occluding the left anterior descending
artery (n=8) and bundle branch block (LBBB) by radiofrequency ablation (n=6). LV
mechanical dyssynchrony was evaluated by two different approaches. First, we measured
timing of peak myocardial shortening velocity and strain. Secondly, we measured first sign of
tension development by onset AFG as defined by myocardial pressure-segment length loops
upward shift from its passive-elastic state (Figure 5). Electrical dyssynchrony was measured
by intramyocardial electromyograms (IM-EMG). Dyssynchrony was quantified as peak
intersegment time difference and as standard deviation of timing for 6-8 myocardial
segments.
During baseline, reduced preload and myocardial ischemia shortening velocity and strain
indicated segmental mechanical heterogeneity, while onset AFG and onset R in IM-EMG
indicated synchronous activation of all segments (Figure 10). After induction of LBBB all
methods indicated dyssynchrony. Peak intersegment time difference for shortening velocity
and strain showed moderate correlations (r=0.57 and 0.32) and weak agreements (mean
differences, -47±27 and -28±27 ms, respectively) with IM-EMG. Onset AFG by pressure-
segment length loops, however, correlated well with IM-EMG (r=0.93), and agreement was
good (mean difference, -0.6±6.8 ms). Results were similar for standard deviation of timing.
Onset AFG from pressure-strain analysis by echocardiography showed accuracy similar to
sonomicrometry.
Onset AFG was an accurate marker of myocardial electrical activation, and was superior
to shortening velocity and strain. Identification of electrical dyssynchrony by onset AFG may
be feasible clinically using LV pressure-strain analysis.
Figure 10. Peak intersegment time difference during baseline, load alteration and ischemia
illustrating the variability in different dyssynchrony indices. Lines show mean±SD 36.

25
Paper 2. In an experimental LBBB dog model (n=7), in patients (n=9) with bi-ventricular pacing
devices, in an in vitro papillary muscle study (n=6), and a mathematical simulation model we
measured left ventricular pressures, myocardial deformation, and regional electrical activation
(REA). In the dogs, there was a greater mechanical than electrical delay (82±12 vs. 54±8 ms,
p=0.002) due to prolonged EMD in the lateral wall vs. septum (39±8 vs.11±9 ms, p=0.002).
The prolonged EMD in later activated myocardium could not be explained by increased
excitation-contraction coupling time or increased pressure at the time of REA, but was
strongly related to dP/dt at the time of REA (r=0.88, Figure 11 A). Results in humans were
consistent with experimental findings. The papillary muscle study showed that EMD was
prolonged at higher dF/dt because it took longer for the muscle to generate active force at a
rate superior to the load rise which is a requirement for shortening (Figure 11 B) and these
findings were also supported by a mathematical model.
We conclude that during LBBB prolonged EMD in late activated myocardium is caused
by a higher dP/dt at the time of activation, resulting in aggravated mechanical relative to
electrical dyssynchrony. These findings suggest that LV contractility may modify mechanical
dyssynchrony.
Figure 11. A. Correlation for pooled data between dP/dt and time from regional electrical
activation to onset of shortening. R value for animal data only. B. Correlation between dF/dt
and time from electrical activation to onset of shortening for a representative papillary
muscle 38.
Paper 3. In an experimental dog model (n=12) and in patients (n=18) pressure-strain loop area was
measured using measured left ventricular pressure (LVP) and estimated LVP. LVP was
estimated by utilizing the profile of an empiric, normalized reference curve which was
adjusted according to duration of LV isovolumic and ejection phase, as defined by timing of

26
aortic and mitral valve events by echocardiography. Absolute LV systolic pressure was set
equal to arterial pressure measured invasively in dogs and non-invasively in patients. In 6
patients myocardial glucose metabolism was measured by positron emission tomography
(PET). First, we studied anaesthetized dogs and observed strong correlation (r=0.96) and good
agreement between estimated LV pressure-strain loop area and loop area by LV
micromanometer and sonomicrometry. Secondly, we validated the method in patients with
various cardiac disorders, including LV dyssynchrony and confirmed strong correlation
(r=0.99) and good agreement between pressure-strain loop areas using non-invasive and
invasive LV pressure. Non-invasive pressure-strain loop area reflected work calculated using
changes in LV geometry and 2-D strain (r=0.97), and showed good correlation with regional
myocardial glucose metabolism by PET (r=0.81) (Figure 12).
The novel non-invasive method for regional LV pressure-strain loop area corresponded well
with invasive measurements and with directly measured myocardial work and it reflected
myocardial metabolism. This method for assessment of regional work may be of clinical
interest for several patient groups, including LV dyssynchrony and ischaemia.
Figure 12. Data from one representative patient A) Bull’s-eye plot showing relative glucose
metabolism by FDG-PET in a representative patient with LBBB. The point in the LV
myocardium with the highest FDG uptake was used as a reference (100%), and segmental
values were reported as percentages of this value. B) Bull’s-eye plot with similar anatomical
distribution as in A. showing relative loop area by estimated LV pressure and STE. The
segment with the largest loop area was used as a reference (100%), and segmental values
were reported as percentages of this value. C) Correlation between regional metabolism by
FDG-PET and loop area by estimated LV pressure and STE. D) Representative pictures
showing regional distribution of glucose metabolism by FDG-PET for short axis (left panel)

27
and four chamber (right panel) views. E) Estimated LV pressure and STE loops from septum
and lateral wall 37.
Paper 4.
Segmental work was calculated by multiplying strain rate by LV pressure (LVP) to get
instantaneous power, which was integrated to give work as a function of time (Figure 7). The
WWF was calculated as work consumed during segmental lengthening (wasted work) as a
fraction of work during segmental shortening. A non-invasive LVP curve was derived using
the previously validated method described in paper 3, and was combined with strain by
speckle tracking echocardiography (STE) to calculate WWF non-invasively. The non-
invasive WWF was validated in 6 anesthetized dogs against WWF by invasive LVP and
sonomirometry, and in 18 patients against invasive LVP and strain by STE. Effect on WWF
by cardiac resynchronization therapy (CRT) was studied in 10 patients with left bundle
branch block (LBBB).
The validity of non-invasive WWF was confirmed in the dog model by strong correlation (r
=0.94) and good agreement with WWF by micromanometer and sonomicrometry.
Furthermore, in patients, non-invasive WWF showed strong correlation (r =0.96) and good
agreement with WWF using invasive LVP (Figure 13). Finally, we showed that WWF during
LBBB was reduced from 36±16 to 17±7%, (p<0.001) in CRT responders.
WWF quantifies "wasted work" that may contribute to global LV function if synchronized,
and may serve as an important tool when evaluating the effect of CRT and optimizing device
settings.
Figure 13. Work analysis by LVP and speckle tracking echocardiography (STE) (solid line)
vs. the non-invasive method by estimated LVP and STE (dashed line), for a septal and lateral
wall segment in patient with the CRT device turned on and off. (From paper 4)

28
Discussion
Differentiation between electrical and non-electrical dyssynchrony. In a clinical setting the differentiation between dyssynchrony with electrical and non-
electrical etiologies is essential since electrical dyssycnhrony is most likely the one etiology
amenable to CRT. Paper 1 introduces assessment of onset of active force generation as a
method to quantify LV electrical dyssynchrony and to differentiate between electrical and
non-electrical dyssynchrony. Unlike the QRS duration, onset AFG gives regional information
and allows for direct comparison between LV walls. The principle behind this novel method
is that onset of active force generation is the first mechanical sign of actine-myosin
interaction, and in contrast to indices based only on myocardial velocity and strain, it is
independent of loading conditions and contractility.
When using pressure-dimension curves, active forces are verified by showing an upward-shift
of the LV pressure-segment length relation relative to the passive-elastic curve. An upward-
shift means that a higher pressure (or force) is needed to distend the segment to a given
length, which implies that stiffness is increased. With this approach onset AFG can identify
mechanical activation even in segments with systolic lengthening. During changes in load, myocardial ischemia and LBBB, the electro-mechanical activation
time was essentially constant, hence, onset AFG tracked changes in timing of electrical
activation. Accordingly, onset AFG, which primarily is a measure of mechanical activation,
was an accurate measure of electrical activation as well. The AFG method was feasible not
only with sonomicrometry, but also when strain by STE was used as an analog for segment
length, suggesting a potential for measuring onset AFG clinically during left heart
catheterization. Using onset R in IM-EMG as reference method for electrical dyssynchrony,
we demonstrated that onset AFG was superior to conventional timing indices based on
myocardial velocity and deformation.
Consistent with the study of Ruffy et al 41 we observed no significant delay in subendocardial
electrical activation during short term ischemia. Therefore, electrical delay could not account
for the observed dyssynchrony during ischemia. Possibly, more severe and longer lasting
ischemia could induce conduction delays. The aim of paper 1, however, was to determine if
onset AFG could identify mechanical activation in segments with decreased regional
contraction and we therefore used ischemia to depress myocardial function. Furthermore, the
principle of onset AFG is such that it should identify delay in electrical activation regardless
of etiology.

29
Electro-mechanical delay during left bundle branch block The finding in paper 1 that electromechanical delay remained unchanged after induction of
LBBB is in apparent contrast to previous studies which have used epicardial sensors to
measure electromechanical delay. Prinzen et al showed increased electromechanical delay
(time from electrical activation to onset shortening, EMDOS) in the latest activated segments
during pacing in the right ventricular outflow tract 42. However, the different findings in our
study can be explained by the different definition of mechanical activation: i.e. onset AFG vs
onset of shortening. In paper 2 we investigated the mechanism of the apparently prolonged
electromechanical activation time in late activated LV lateral wall during LBBB. As
described in paper 1 we did not observe any indication of prolonged excitation-contraction
coupling time (time form electrical activation to onset AFG, EMDAFG) in the late activated
region. Furthermore, increased load (LVP) at time of electrical activation in the late activated
lateral wall showed a weak relationship to the increased EMDOS, and was not significant
when adjusted for the increased dP/dt at time of activation. However, there was a strong
correlation between dP/dt at time of activation and delay in OS. The findings from the
different sub-studies indicate that OS is delayed until rate of rise in myocardial active force
exceeds rate of rise of applied load. Since rate of rise of regional load in the intact heart is
directly related to LV dP/dt, there will be a progressive increase in time from electrical
activation to OS at higher LV dP/dt.
Our results suggest that the prolonged delay from electrical activation to OS in late activated
segments increases the mechanical dyssynchrony by ~40-50% relative to the underlying
electrical dyssynchrony, e.g. electrical dyssynchrony of 54 ms vs. mechanical dyssynchrony
of 82 ms in the dog model. In a clinical setting understanding the mechanism of the prolonged
delay is important for two main reasons: 1. Onset of shortening may potentially influence
almost all dyssynchrony measurements performed by echocardiography. Because time from
electrical activation to OS differs substantially between early and late activated segments this
means that OS may not serve as an accurate marker for electrical activation in assessment of
dyssynchrony. 2. Mechanical dyssynchrony measured as differences in OS, is dependent on
both electrical propagation time in the LV and differences in regional EMDOS. This means
that prolongation of EMDOS in late activated segments may aggravate mechanical
dyssynchrony, subsequently reducing LV function. Furthermore, since LV dP/dt reflects LV
function and contractility, the magnitude of mechanical dyssynchrony may vary over time in
a given patient when there are changes in LV function.
Intuitively one may believe that it is the higher pressure at time of activation of the lateral
wall that is responsible for the increased delay from regional electrical activation to OS.
However, in the dog study in paper 2 we found that it was not LVP at time of regional

30
activation, but rate of pressure rise (LV dP/dt) that directly affected the delay from electrical
activation to OS. To further investigate this we performed a papillary muscle study where
these two mechanisms could be isolated and tested in a controlled environment. When a
constant force was applied, OS occurred without increased delay even when applied force
was substantially increased (70% of Fmax) (Figure 9 A). However, when we applied a rising
force (simulating continuous rise in LVP), time to OS was progressively delayed with higher
dF/dt (Figure 9 B).
Segmental force is a sum of both active and passive elastic forces which is equal to the
external load according to Newton's 3rd law. Prior to activation a higher pressure stretches
and hence increases the passive force of a late activated segment, thus maintaining the
balance of external and internal forces. Subsequent activation and addition of active force
should therefore result in instantaneous OS of the segment. However, a late activated segment
does not contract against a static pressure, but a pressure that has already started to rise. The
pressure rise continues to stretch the segment until the generation of opposing contractile
force is faster than the load rise. Active force development is nonlinear, i.e. it initially
increases at a slow rate and gradually accelerates to peak rate 43. Therefore, the higher the LV
dP/dt, the longer it takes before active force is generated at a rate equal to and subsequently
faster than load rise, which delays OS and prolongs EMDOS.
In summary papers 1 and 2 introduce assessment of onset of active force generation as a
method to quantify LV electrical dyssynchrony and to differentiate between electrical and
non-electrical dyssynchrony. Furthermore, they show that electro-mechanical activation time
was essentially constant during changes in load, myocardial ischemia and LBBB, however,
time from regional electrical activation to onset of shortening depended on rate of LV
pressure rise at time of activation suggesting that timing of onset shortening may be affected
by LV contractility.
A non-invasive index of myocardial work In paper 3 we demonstrate that LV pressure-strain loop area, which is an index of regional LV
work, can be measured clinically by an entirely non-invasive approach. This was feasible by
combining a non-invasive LV pressure analog with strain by STE. The validity of this method
was confirmed in the experimental part of the study by an excellent correlation and good
agreement with loop area by pressure-segment length analysis. In the clinical study LV
pressure-strain loop area using the non-invasive LV pressure analog showed strong
correlation and good agreement with loop area using invasive LV pressure. When the non-
invasive pressure-strain assessment was applied in patients with LBBB we observed marked

31
non-uniformity in regional work distribution with reduced work in the septum and increased
work in the LV lateral wall, suggesting that the work analysis may represent a means to
explore the hemodynamic impact of electrical dyssynchrony and to monitor responses to
CRT. Non-uniformity in work distribution was also apparent when comparing ischemic vs.
non-ischemic segments. Furthermore, we show that this non-invasive method reflects both
regional metabolism and work calculations incorporating changes in LV geometry which
strongly supports its use as a regional work index.
Calculation of work
In principle, the area of the myocardial force-dimension loop represents regional LV work
and may also be used as a mechanical index of regional myocardial oxygen consumption 23.
In the present study we used pressure as a substitute for force and the area of the LV pressure-
strain loop was used as an index of regional work. This index does not provide a measure
which has units of work, and does not incorporate the modifying effect of local radii of
curvature or contributions from different fiber orientations on force. To address these issues
and in particular to explore how changes in septal curvature during LBBB would modify the
ability of septal pressure-strain loop area to reflect the force-strain loop area, we performed
additional analysis. There was a good correlation between relative work using the two
methods (r=0.97), indicating that the pressure-strain loop area gives adequate clinical
information regarding relative differences in work distribution within the same heart.
Furthermore, in our laboratory we have previously demonstrated that changes in segmental
pressure-dimension loops approximate changes in the stress-dimension loops during
myocardial ischemia 44.
The ability of pressure length area to reflect myocardial oxygen consumption has been shown
previously 26. In the present study we found that the non-invasive LV pressure-strain loop
area had good correlation and agreement with regional glucose metabolism using FDG-PET.
Previous studies have shown that glucose metabolism reflects myocardial work 45, and this
finding therefore supports our conclusion that pressure-strain loop area reflects differences in
myocardial work distribution. The present findings of regional changes in work distribution in
patients with LBBB are in keeping with the observations by Prinzen et al 46 in a dog model
with right ventricular pacing.
Estimated LV pressure curve
There are numerous techniques which can provide a more accurate central aortic pressure
than just using brachial artery cuff pressure, and these may be applied in combination with the
present method. However, when the non-invasive pressure method is used for comparing
work between segments, the main issue is the abnormal distribution of work and not the
absolute values.

32
It is important to note that the only application of the non-invasive pressure curve proposed in
this study was to serve as a pressure estimate when calculating LV pressure-strain loop areas,
and for this application it served its purpose very well, as indicated by the excellent
relationship to reference methods for pressure-loop area. It does not have sufficient accuracy,
however, to provide a measure of LV diastolic pressure or peak rate of rise or fall in LV
pressure.
Whereas correct timing of peak LV pressure was of little importance for pressure-strain loop
area, errors in timing of early systolic rise in pressure (IVC) and early-diastolic fall in LV
pressure (IVR) would be expected to have effects on loop area, in particular when there is
pre-ejection or post-ejection shortening. Thus, the pre-ejection septal shortening during
LBBB which occurs against low LV pressure, and therefore represents little work, would
appear erroneously as a more substantial work if timing of aortic valve opening was set
prematurely. Similarly, the work represented by post-systolic shortening in ischemic
myocardium would be overestimated if timing of aortic valve closure was set too late. The
error in timing of IVC and IVR, however, was minor as demonstrated by testing sensitivity to
errors in timing of AVO and AVC.
Assessing Wasted Work In paper 4 we introduce wasted work fraction as a novel principle for quantifying function in
ventricles with dyssynchronous contraction patterns. The WWF measures how much
mechanical energy is used by the ventricle to do work which does not contribute to ejection,
and therefore is considered as wasted. Wasted work fraction is total negative work as a
fraction of total positive work calculated as a global measure for all segments. The method
also gives segmental information about positive and negative work allowing for regional
assessment of local energetic efficacy. The strong relation between regional LV pressure-
strain loop area and regional myocardial glucose uptake shown previously by our group 37
supports that WWF also reflects a waste in myocardial metabolism and oxygen consumption.
Furthermore, we show that wasted work can be measured clinically by an entirely non-
invasive approach by combining a non-invasive LV pressure curve with strain by STE. The
validity of this method was confirmed in the experimental part of the study. In the clinical
study LV work analysis using the non-invasively estimated LV pressure and strain showed
that significant work was wasted during LBBB and was subsequently recruited when CRT
was introduced, suggesting that the work analysis may represent a means to explore the
hemodynamic impact of electrical dyssynchrony and to monitor responses to CRT.
33
Wasted work
In a normal heart, contraction of all segments occur almost simultaneously and they therefore
contract against a similar LV pressure. However, in a ventricle with regional differences in
timing of contraction, regional contraction occurs against different pressures and information
about both the degree of shortening and LV pressure during shortening is therefore needed to
compare regional work done by the segments. The same is true for calculation of energy
losses during elongation/stretching of a segment, since the energy loss depends on both
elongation distance and the instantaneous LV pressure during elongation. In ventricles where
timing of relaxation is different between segments, some segments will start relaxing at
elevated LV pressure while others are still contracting. This means that a substantial amount
of work done by the contracting segments is wasted on stretching of other segments.
Measuring wasted work is therefore a method for quantifying work that is being done by the
ventricle but does not contribute to LV ejection, and provided the myocardium is viable,
should represent a measure of contractile reserve. This was supported by our data in the
patient population with LBBB which showed a decrease in WWF and increased ejection
fraction when CRT was introduced.
When we are assessing LV function we are interested in quantifying how the myocardium
contributes to LV function globally and regionally. Strain imaging has given us a unique tool
for this, however, in patients with regional differences in timing of shortening peak strain may
not reflect work. Typically, during LBBB much of septal contraction occurs during the pre-
ejection phase at a time when the LVP is low, and therefore the septum performs little work.
As seen in the present study peak septal strain during LBBB in the animal model is only
marginally reduced compared to the lateral wall, but net work done by the septum is
approximately one third relative to the lateral wall. In the patients with LBBB peak strain for
the septum was on average half of that for the lateral wall which is in keeping with previous
studies 47. Segmental Negative/Positive work ratio, however, was over 1.5, indicating that
instead of the septum contributing to the hemodynamic performance of the LV, external work
was done on the septum which thereby “absorbed” work done by other segments.
Since the metabolism of myocardial segments is unable to recycle chemical energy when the
segments are stretched, this energy will instead be converted to heat in the tissue.
Measurements of WWF will for this reason indicate the overall efficacy of the LV
myocardium in converting metabolic substrates into cardiac work. A high WWF indicates that
the myocardium requires a disproportionately high coronary blood supply.
In summary papers 3 and 4 introduce a novel non-invasive method for work analysis by LV
pressure-strain loop areas. Furthermore, we introduce wasted work fraction, a method that
34
allows for us to quantify how much mechanical energy is used by the ventricle to do work
which does not contribute to ejection, and therefore is considered as wasted.
Limitations The in vivo experiments in the thesis utilized a heavily instrumented animal model and this
preparation may not always represent normal physiology. Although the open-chest condition
and instrumentation may have induced some degree of LV dysfunction during baseline, this
should not modify the main conclusions from this study. In the in vivo model we investigated
isolated mechanical and electrical dyssynchrony. In a clinical situation, however, one may
encounter concomitant electrical conduction delay and regional impairment of contractility.
The small sample size in the studies may be viewed as a limitation, however, the consistency
in our findings support our conclusions.
A limitation of the AFG method is that it requires invasive pressures. However, many patients
undergo left heart catheterization as part of a work up prior to CRT and this would give
access to LV pressure and pressure-strain loops can be constructed.
Speckle tracking echocardiography measures motion in the image plane while
sonomicrometry measures motion of material points in the myocardium. Therefore, a
misalignment of the ultrasound plane vs. the crystals may account for some of the
discrepancies between the two measurements.
FDG-PET assesses glucose metabolism and will show increased uptake in areas both with
aerobic and anaerobic (ischemia) metabolism. Therefore only patients with a normal coronary
angiography and no history of coronary artery disease were included. The observed abnormal
changes in LV glucose metabolism during LBBB is in keeping with previous findings 48. The
use of a reference curve to define the LV pressure waveform is in principle a limitation of the
estimated pressure curve method since patients have different timing of peak LV pressure and
the timing varies from time to time in a given patient, however, the good correlation and
agreement with invasively measured data support our conclusion.
Strain analysis has limitations, both when using TDI and STE, such as angle dependency and
the need for good image quality for the software to track the speckles 49. All methods
described in the present thesis require echocardiographic image quality that allows for strain
analysis and are therefore limited to patients were this is possible.
In the present thesis novel methods have been introduced and further studies should be
performed to investigate the clinical benefit of onset AFG and work analysis.
35
Main conclusions Through the studies in the present thesis we have made a contribution to the understanding
and assessment of dyssynchrony in the heart.
Paper 1. Paper 1 demonstrates that onset AFG is an accurate marker of timing of regional electrical
activation, allowing for differentiation between primary electrical and primary mechanical
dyssynchrony, independent of regional differences in load and contractility. Furthermore, it
shows that current indices based on myocardial shortening velocity and strain have significant
limitations, and although they measure dyssynchrony, they have limited ability to establish
underlying etiology.
Paper 2. Prolonged delay from regional electrical activation to onset of shortening in late activated
segments during LBBB is due to increased rate of pressure rise (LV dP/dt) at the time of
activation. Therefore, a late activated segment needs more time to generate active force at a
higher rate than the rise of the applied load (LV dP/dt), which in turn leads to shortening of
the segment. The prolonged delay substantially increased mechanical dyssynchrony relative
to the underlying electrical dyssynchrony in LBBB patients which implies that shortening
indices may overestimate the extent of electrical dyssynchrony in these patients. These
findings also suggest that changes in LV contractility may modify mechanical dyssynchrony.
We conclude that during LBBB prolonged EMD in late activated myocardium is caused by a
higher dP/dt at the time of activation, resulting in aggravated mechanical relative to electrical
dyssynchrony. These findings suggest that LV contractility may modify mechanical
dyssynchrony.
Paper 3. In paper 3 we introduce a novel non-invasive method for LV pressure-strain analysis which
may serve as a means to quantify regional myocardial work. Furthermore we show that non-
invasive pressure-strain area reflects regional work and metabolism. Assessing work
distribution will give the clinician additional information when assessing patients with
ischemia and selecting patients for CRT. Work analysis may also play an important part in
optimizing CRT settings and improve responder rate.

36
Paper 4. Paper 4 introduces WWF as a non-invasive clinical method to quantify the negative impact of
dyssynchrony on myocardial work and energy utilization. Furthermore, we show that
significant work was wasted during LBBB and was subsequently recruited when CRT was
introduced, suggesting that the work analysis may represent a means to explore the
hemodynamic impact of electrical dyssynchrony and to monitor responses to CRT.

37
Reference List
Reference List
1. Penicka M, Bartunek J, De BB, Vanderheyden M, Goethals M, De ZM, Brugada P, Geelen P. Improvement of left ventricular function after cardiac resynchronization therapy is predicted by tissue Doppler imaging echocardiography. Circulation. 2004;109:978-983.
2. Bader H, Garrigue S, Lafitte S, Reuter S, Jais P, Haissaguerre M, Bonnet J, Clementy J, Roudaut R. Intra-left ventricular electromechanical asynchrony. A new independent predictor of severe cardiac events in heart failure patients. J Am Coll Cardiol. 2004;43:248-256.
3. Gorcsan J, III, Abraham T, Agler DA, Bax JJ, Derumeaux G, Grimm RA, Martin R, Steinberg JS, Sutton MS, Yu CM. Echocardiography for cardiac resynchronization therapy: recommendations for performance and reporting--a report from the American Society of Echocardiography Dyssynchrony Writing Group endorsed by the Heart Rhythm Society. J Am Soc Echocardiogr. 2008;21:191-213.
4. Epstein AE, DiMarco JP, Ellenbogen KA, Estes NAM, Freedman RA, Gettes LS, Gillinov AM, Gregoratos G, Hammill SC, Hayes DL, Hlatky MA, Newby LK, Page RL, Schoenfeld MH, Silka MJ, Stevenson LW, Sweeney MO. ACC/AHA/HRS 2008 Guidelines for Device-Based Therapy of Cardiac Rhythm Abnormalities. Circulation. 2008;117:2820-2840.
5. Cleland JG, Daubert JC, Erdmann E, Freemantle N, Gras D, Kappenberger L, Tavazzi L. The effect of cardiac resynchronization on morbidity and mortality in heart failure. N Engl J Med. 2005;352:1539-1549.
6. Bristow MR, Saxon LA, Boehmer J, Krueger S, Kass DA, De MT, Carson P, DiCarlo L, DeMets D, White BG, DeVries DW, Feldman AM. Cardiac-resynchronization therapy with or without an implantable defibrillator in advanced chronic heart failure. N Engl J Med. 2004;350:2140-2150.
7. Dickstein K, Vardas PE, Auricchio A, Daubert JC, Linde C, McMurray J, Ponikowski P, Priori SG, Sutton R, van Veldhuisen DJ, Vahanian A, Auricchio A, Bax J, Ceconi C, Dean V, Filippatos G, Funck-Brentano C, Hobbs R, Kearney P, McDonagh T, Popescu BA, Reiner Z, Sechtem U, Sirnes PA, Tendera M, Vardas P, Widimsky P, Tendera M, Anker SD, Blanc JJ, Gasparini M, Hoes AW, Israel CW, Kalarus Z, Merkely B, Swedberg K, Camm AJ. 2010 Focused Update of ESC Guidelines on device therapy in heart failure: an update of the 2008 ESC Guidelines for the diagnosis and treatment of acute and chronic heart failure and the 2007 ESC Guidelines for cardiac and resynchronization therapy. Developed with the special contribution of the Heart Failure Association and the European Heart Rhythm Association. Europace. 2010;12:1526-1536.
8. Abraham WT, Fisher WG, Smith AL, Delurgio DB, Leon AR, Loh E, Kocovic DZ, Packer M, Clavell AL, Hayes DL, Ellestad M, Trupp RJ, Underwood J, Pickering F, Truex C, McAtee P, Messenger J, the MIRACLE Study Group. Cardiac Resynchronization in Chronic Heart Failure. N Engl J Med. 2002;346:1845-1853.
9. Reuter S, Garrigue S, Barold SS, Jais P, Hocini M, Haissaguerre M, Clementy J. Comparison of characteristics in responders versus nonresponders with biventricular pacing for drug-resistant congestive heart failure. The American Journal of Cardiology. 2002;89:346-350.
10. Leclercq C, Faris O, Tunin R, Johnson J, Kato R, Evans F, Spinelli J, Halperin H, McVeigh E, Kass DA. Systolic Improvement and Mechanical Resynchronization Does Not Require Electrical Synchrony in the Dilated Failing Heart With Left Bundle-Branch Block. Circulation. 2002;106:1760-1763.

38
11. Bax JJ, Abraham T, Barold SS, Breithardt OA, Fung JW, Garrigue S, Gorcsan J, III, Hayes DL, Kass DA, Knuuti J, Leclercq C, Linde C, Mark DB, Monaghan MJ, Nihoyannopoulos P, Schalij MJ, Stellbrink C, Yu CM. Cardiac resynchronization therapy: Part 1--issues before device implantation. J Am Coll Cardiol. 2005;46:2153-2167.
12. Amundsen BH, Helle-Valle T, Edvardsen T, Torp H, Crosby J, Lyseggen E, Stoylen A, Ihlen H, Lima JA, Smiseth OA, Slordahl SA. Noninvasive myocardial strain measurement by speckle tracking echocardiography: validation against sonomicrometry and tagged magnetic resonance imaging. J Am Coll Cardiol. 2006;47:789-793.
13. Edvardsen T, Urheim S, Skulstad H, Steine K, Ihlen H, Smiseth OA. Quantification of left ventricular systolic function by tissue Doppler echocardiography: added value of measuring pre- and postejection velocities in ischemic myocardium. Circulation. 2002;105:2071-2077.
14. Wilkenshoff UM, Sovany A, Wigstrom L, Olstad B, Lindstrom L, Engvall J, Janerot-Sjoberg B, Wranne B, Hatle L, Sutherland GR. Regional mean systolic myocardial velocity estimation by real-time color Doppler myocardial imaging: a new technique for quantifying regional systolic function. J Am Soc Echocardiogr. 1998;11:683-692.
15. Smiseth OA, Russell K, Skulstad H. The role of echocardiography in quantification of left ventricular dyssynchrony: state of the art and future directions. Eur Heart J Cardiovasc Imaging. 2012;13:61-68.
16. Chung ES, Leon AR, Tavazzi L, Sun JP, Nihoyannopoulos P, Merlino J, Abraham WT, Ghio S, Leclercq C, Bax JJ, Yu CM, Gorcsan J, III, St John Sutton M, De Sutter J, Murillo J. Results of the Predictors of Response to CRT (PROSPECT) Trial. Circulation. 2008;117:2608-2616.
17. Miyazaki C, Redfield MM, Powell BD, Lin GM, Herges RM, Hodge DO, Olson LJ, Hayes DL, Espinosa RE, Rea RF, Bruce CJ, Nelson SM, Miller FA, Oh JK. Dyssynchrony indices to predict response to cardiac resynchronization therapy: a comprehensive prospective single-center study. Circ Heart Fail. 2010;3:565-573.
18. Jessup M, Abraham WT, Casey DE, Feldman AM, Francis GS, Ganiats TG, Konstam MA, Mancini DM, Rahko PS, Silver MA, Stevenson LW, Yancy CW. 2009 focused update: ACCF/AHA Guidelines for the Diagnosis and Management of Heart Failure in Adults: a report of the American College of Cardiology Foundation/American Heart Association Task Force on Practice Guidelines: developed in collaboration with the International Society for Heart and Lung Transplantation. Circulation. 2009;119:1977-2016.
19. De Boeck BWL, Meine M, Leenders GE, Teske AJ, van Wessel H, Kirkels JH, Prinzen FW, Doevendans PA, Cramer MJ. Practical and conceptual limitations of tissue Doppler imaging to predict reverse remodelling in cardiac resynchronisation therapy. European Journal of Heart Failure. 2008;10:281-290.
20. Leenders GE, Cramer MJ, Bogaard MD, Meine M, Doevendans PA, De Boeck BW. Echocardiographic prediction of outcome after cardiac resynchronization therapy: conventional methods and recent developments. Heart Fail Rev. 2011;16:235-250.
21. Suga H. Total mechanical energy of a ventricle model and cardiac oxygen consumption. Am J Physiol. 1979;236:H498-H505.
22. Takaoka H, Takeuchi M, Odake M, Yokoyama M. Assessment of myocardial oxygen consumption (Vo2) and systolic pressure-volume area (PVA) in human hearts. Eur Heart J. 1992;13 Suppl E:85-90.
23. Hisano R, Cooper G. Correlation of force-length area with oxygen consumption in ferret papillary muscle. Circ Res. 1987;61:318-328.

39
24. Tyberg JV, Forrester JS, Wyatt HL, Goldner SJ, Parmley WW, Swan HJ. An analysis of segmental ischemic dysfunction utilizing the pressure-length loop. Circulation. 1974;49:748-754.
25. Forrester JS, Tyberg JV, Wyatt HL, Goldner S, Parmely WW, Swan HJ. Pressure-length loop: a new method for simultaneous measurement of segmental and total cardiac function. J Appl Physiol. 1974;37:771-775.
26. Delhaas T, Arts T, Prinzen FW, Reneman RS. Regional fibre stress-fibre strain area as an estimate of regional blood flow and oxygen demand in the canine heart. J Physiol. 1994;477 ( Pt 3):481-496.
27. Urheim S, Rabben SI, Skulstad H, Lyseggen E, Ihlen H, Smiseth OA. Regional myocardial work by strain Doppler echocardiography and LV pressure: a new method for quantifying myocardial function. Am J Physiol Heart Circ Physiol. 2005;288:H2375-H2380.
28. Prinzen FW, Hunter WC, Wyman BT, McVeigh ER. Mapping of regional myocardial strain and work during ventricular pacing: experimental study using magnetic resonance imaging tagging. J Am Coll Cardiol. 1999;33:1735-1742.
29. Prinzen FW, Cheriex EC, Delhaas T, van Oosterhout MFM, Arts T, Wellens HJJ, Reneman RS. Asymmetric thickness of the left ventricular wall resulting from asynchronous electric activation: A study in dogs with ventricular pacing and in patients with left bundle branch block. American Heart Journal. 1995;130:1045-1053.
30. van Oosterhout MFM, Arts T, Muijtjens AMM, Reneman RS, Prinzen FW. Remodeling by ventricular pacing in hypertrophying dog hearts. Cardiovasc Res. 2001;49:771-778.
31. Ukkonen H, Beanlands RS, Burwash IG, de Kemp RA, Nahmias C, Fallen E, Hill MR, Tang AS. Effect of cardiac resynchronization on myocardial efficiency and regional oxidative metabolism. Circulation. 2003;107:28-31.
32. Prinzen FW, Augustijn CH, Arts T, Allessie MA, Reneman RS. Redistribution of myocardial fiber strain and blood flow by asynchronous activation. Am J Physiol. 1990;259:H300-H308.
33. van Oosterhout MF, Prinzen FW, Arts T, Schreuder JJ, Vanagt WY, Cleutjens JP, Reneman RS. Asynchronous electrical activation induces asymmetrical hypertrophy of the left ventricular wall. Circulation. 1998;98:588-595.
34. Gjesdal O, Remme EW, Opdahl A, Skulstad H, Russell K, Kongsgaard E, Edvardsen T, Smiseth OA. Mechanisms of abnormal systolic motion of the interventricular septum during left bundle-branch block. Circ Cardiovasc Imaging. 2011;4:264-273.
35. Urheim S, Edvardsen T, Torp H, Angelsen B, Smiseth OA. Myocardial Strain by Doppler Echocardiography : Validation of a New Method to Quantify Regional Myocardial Function. Circulation. 2000;102:1158-1164.
36. Russell K, Opdahl A, Remme EW, Gjesdal O, Skulstad H, Kongsgaard E, Edvardsen T, Smiseth OA. Evaluation of left ventricular dyssynchrony by onset of active myocardial force generation: a novel method that differentiates between electrical and mechanical etiologies. Circ Cardiovasc Imaging. 2010;3:405-414.
37. Russell K, Eriksen M, Aaberge L, Wilhelmsen N, Skulstad H, Remme EW, Haugaa KH, Opdahl A, Fjeld JG, Gjesdal O, Edvardsen T, Smiseth OA. A novel clinical method for quantification of regional left ventricular pressure-strain loop area: a non-invasive index of myocardial work. Eur Heart J. 2012;33:724-733.
38. Russell K, Smiseth OA, Gjesdal O, Qvigstad E, Norseng PA, Sjaastad I, Opdahl A, Skulstad H, Edvardsen T, Remme EW. Mechanism of prolonged electromechanical delay in late activated

40
myocardium during left bundle branch block. Am J Physiol Heart Circ Physiol. 2011;301:H2334-H2343.
39. Martin WH, Jones RC, Delbeke D, Sandler MP. A simplified intravenous glucose loading protocol for fluorine-18 fluorodeoxyglucose cardiac single-photon emission tomography. Eur J Nucl Med. 1997;24:1291-1297.
40. Bland JM, Altman DG. Agreement between methods of measurement with multiple observations per individual. J Biopharm Stat. 2007;17:571-582.
41. Ruffy R, Lovelace DE, Mueller TM, Knoebel SB, Zipes DP. Relationship between changes in left ventricular bipolar electrograms and regional myocardial blood flow during acute coronary artery occlusion in the dog. Circ Res. 1979;45:764-770.
42. Prinzen FW, Augustijn CH, Allessie MA, Arts T, Delhaas T, Reneman RS. The time sequence of electrical and mechanical activation during spontaneous beating and ectopic stimulation. Eur Heart J. 1992;13:535-543.
43. Gamble J, Taylor PB, Kenno KA. Myocardial stretch alters twitch characteristics and Ca2+ loading of sarcoplasmic reticulum in rat ventricular muscle. Cardiovasc Res. 1992;26:865-870.
44. Skulstad H, Edvardsen T, Urheim S, Rabben SI, Stugaard M, Lyseggen E, Ihlen H, Smiseth OA. Postsystolic shortening in ischemic myocardium: active contraction or passive recoil? Circulation. 2002;106:718-724.
45. Bergman BC, Tsvetkova T, Lowes B, Wolfel EE. Myocardial glucose and lactate metabolism during rest and atrial pacing in humans. J Physiol. 2009;587:2087-2099.
46. Prinzen FW, Hunter WC, Wyman BT, McVeigh ER. Mapping of regional myocardial strain and work during ventricular pacing: experimental study using magnetic resonance imaging tagging. J Am Coll Cardiol. 1999;33:1735-1742.
47. Klimusina J, De Boeck BW, Leenders GE, Faletra FF, Prinzen F, Averaimo M, Pasotti E, Klersy C, Moccetti T, Auricchio A. Redistribution of left ventricular strain by cardiac resynchronization therapy in heart failure patients. Eur J Heart Fail. 2011;13:186-194.
48. Nowak B, Sinha AM, Schaefer WM, Koch KC, Kaiser HJ, Hanrath P, Buell U, Stellbrink C. Cardiac resynchronization therapy homogenizes myocardial glucose metabolism and perfusion in dilated cardiomyopathy and left bundle branch block. J Am Coll Cardiol. 2003;41:1523-1528.
49. Mor-Avi V, Lang RM, Badano LP, Belohlavek M, Cardim NM, Derumeaux G, Galderisi M, Marwick T, Nagueh SF, Sengupta PP, Sicari R, Smiseth OA, Smulevitz B, Takeuchi M, Thomas JD, Vannan M, Voigt JU, Zamorano JL. Current and evolving echocardiographic techniques for the quantitative evaluation of cardiac mechanics: ASE/EAE consensus statement on methodology and indications endorsed by the Japanese Society of Echocardiography. Eur J Echocardiogr. 2011;12:167-205.

Paper 1


Paper 2


Paper 3


. . . . . . . . . . . . . . . . . . . . . . . . . . . . . . . . . . . . . . . . . . . . . . . . . . . . . . . . . . . . . . . . . . . . . . . . . . . . . . . . . . . . . . . . . . . . . . . . . . . . . . . . . . . . . . . . . . . . . . . . . . . . . . . . . . . . . . . . . . . . . . . . . . . . . . . . . . . . . . . . . . . . . . . . . . . . . . . . . . . . .
. . . . . . . . . . . . . . . . . . . . . . . . . . . . . . . . . . . . . . . . . . . . . . . . . . . . . . . . . . . . . . . . . . . . . . . . . . . . . . . . . . . . . . . . . . . . . . . . . . . . . . . . . . . . . . . . . . . . . . . . . . . . . . . . . . . . . . . . . . . . . . . . . . . . . . . . . . . . . . . . . . . . . . . . . . . . . . . . . . . . .
CLINICAL RESEARCH
A novel clinical method for quantification ofregional left ventricular pressure–strain looparea: a non-invasive index of myocardial workKristoffer Russell1,2,3, Morten Eriksen1,3, Lars Aaberge2,3, Nils Wilhelmsen2,Helge Skulstad1,2, Espen W. Remme1,3,4, Kristina H. Haugaa1,2,3, Anders Opdahl1,2,Jan Gunnar Fjeld5, Ola Gjesdal1,2, Thor Edvardsen1,2,3, and Otto A. Smiseth1,2,3*
1Institute for Surgical Research, Oslo University Hospital, Rikshospitalet, University of Oslo, Oslo, Norway; 2Department of Cardiology, Oslo University Hospital, Rikshospitalet,University of Oslo, N-0027 Oslo, Norway; 3Center for Cardiological Innovation, Oslo University Hospital, University of Oslo, Oslo, Norway; 4KG Jebsen Cardiac Research Centre,Oslo, Norway; and 5Department of Radiology and Nuclear Medicine, Oslo University Hospital, University of Oslo, Oslo, Norway
Received 9 November 2011; revised 22 December 2011; accepted 16 January 2012
Aims Left ventricular (LV) pressure–strain loop area reflects regional myocardial work and metabolic demand, but the clin-ical use of this index is limited by the need for invasive pressure. In this study, we introduce a non-invasive method tomeasure LV pressure–strain loop area.
Methodsand results
Left ventricular pressure was estimated by utilizing the profile of an empiric, normalized reference curve which wasadjusted according to the duration of LV isovolumic and ejection phases, as defined by timing of aortic and mitralvalve events by echocardiography. Absolute LV systolic pressure was set equal to arterial pressure measured inva-sively in dogs (n ¼ 12) and non-invasively in patients (n ¼ 18). In six patients, myocardial glucose metabolism wasmeasured by positron emission tomography (PET). First, we studied anaesthetized dogs and observed an excellentcorrelation (r ¼ 0.96) and a good agreement between estimated LV pressure–strain loop area and loop area by LVmicromanometer and sonomicrometry. Secondly, we validated the method in patients with various cardiac disorders,including LV dyssynchrony, and confirmed an excellent correlation (r ¼ 0.99) and a good agreement between pres-sure–strain loop areas using non-invasive and invasive LV pressure. Non-invasive pressure–strain loop area reflectedwork when incorporating changes in local LV geometry (r ¼ 0.97) and showed a strong correlation with regionalmyocardial glucose metabolism by PET (r ¼ 0.81).
Conclusions The novel non-invasive method for regional LV pressure–strain loop area corresponded well with invasive measure-ments and with directly measured myocardial work and it reflected myocardial metabolism. This method for assess-ment of regional work may be of clinical interest for several patients groups, including LV dyssynchrony and ischaemia.
- - - - - - - - - - - - - - - - - - - - - - - - - - - - - - - - - - - - - - - - - - - - - - - - - - - - - - - - - - - - - - - - - - - - - - - - - - - - - - - - - - - - - - - - - - - - - - - - - - - - - - - - - - - - - - - - - - - - - - - - - - - - - - - - - - - - - - - - - - - - - - - - - - - - - - - - - - -Keywords Heart failure † Dyssynchrony † Cardiac resynchronization therapy
IntroductionClinical assessment of left ventricular (LV) systolic function is com-monly performed by measuring indices of myocardial fibre shorten-ing such as LV ejection fraction which is a global index, and LV wallthickening, myocardial velocity, and strain which reflect regionalfunction. The shortening indices, however, do not reflect myocardialwork or oxygen demand. As shown by Suga1 in an experimentalstudy, the area of the LV pressure–volume loop reflects stroke
work as well as myocardial oxygen consumption, and it waslater confirmed that this concept is valid clinically.2 According tothe same principle, the area of the myocardial force–segmentlength loop reflects regional myocardial work and oxygen consump-tion.3 Because calculation of myocardial force is challenging, pres-sure is used as a substitute for force and the area of LVpressure–dimension loop is used as an index of regional work.4–7
In the present study, we introduce a non-invasive method for LVwork analysis which is based upon an estimated LV pressure curve
* Corresponding author. Tel: +47 23070000/+47 23073271, Fax: +47 23073917, Email: [email protected]
Published on behalf of the European Society of Cardiology. All rights reserved. & The Author 2012.This is an Open Access article distributed under the terms of the Creative Commons Attribution Non-Commercial License (http://creativecommons.org/licenses/by-nc/3.0/), whichpermits unrestricted non-commercial use, distribution, and reproduction in any medium, provided the original work is properly cited.
European Heart Journaldoi:10.1093/eurheartj/ehs016
European Heart Journal Advance Access published February 18, 2012
at University of O
slo on March 8, 2012
http://eurheartj.oxfordjournals.org/D
ownloaded from

in combination with strain by speckle-tracking echocardiography(STE). The estimated pressure curve is generated by adjustingthe profile of a reference LV pressure curve according to the dur-ation of the isovolumic and ejection phases as measured by echo-cardiographic timing of aortic and mitral valve events. Peak LVpressure was estimated non-invasively from brachial artery cuffpressure. The main objective of the present study was to deter-mine whether LV pressure–strain loop area can be estimatedwith an entirely non-invasive approach by using the estimated pres-sure curve in combination with strain by STE. First, we tested theprinciple in a dog model under a wide range of haemodynamicconditions with LV micromanometer and implanted ultrasonic di-mension crystals as reference methods. Secondly, we validatedthe non-invasive method in patients and used invasive LV pressurein combination with strain by STE as a reference method for pres-sure–strain loop area. Finally, to determine whether pressure–strain loop area reflects regional myocardial metabolism, we com-pared loop area with glucose turnover measured by positron emis-sion tomography (PET).
Methods
Experimental studyAnimal preparationTwelve mongrel dogs of either sex and body weight 36+2 kg wereanaesthetized, ventilated, and surgically prepared as previouslydescribed,7 including induction of left bundle branch block (LBBB,n ¼ 6) by radiofrequency ablation8 and regional ischaemia (n ¼ 6) byleft anterior descending coronary artery (LAD) occlusion. The studywas approved by the National Animal Experimentation Board. The la-boratory animals were supplied by Centre for Comparative Medicine,Oslo University Hospital, Rikshospitalet, Norway.
Haemodynamic measurements and sonomicrometryAscending aortic pressure, left atrial pressure, and LV pressure (LVP)were measured by micromanometers (MPC-500, Millar InstrumentsInc., Houston, TX, USA). Segment lengths were measured using sono-micrometry crystals implanted endocardially (Sonometrics Corp.,London, Ontario, Canada). In dogs with LBBB, longitudinal crystalpairs were placed in the septum and LV lateral wall, and a circumfer-ential pair was placed in the posterolateral LV free wall. In the ischae-mia group, a longitudinal pair was placed in the perfusion territory ofthe LAD. Strain was calculated as the percentage of end-diastoliclength. Data were sampled at 200 Hz.
EchocardiographyA Vivid 7 ultrasound scanner (GE Vingmed Ultrasound AS, Horten,Norway) was used to record two-dimensional (2D) grey-scaleimages and strain by STE. Recordings were done in the LV equatorialshort-axis and two- and four-chamber views (frame rate 63+ 13 s21),and recordings were also done corresponding to the location of ultra-sound crystals. Strain was measured successfully at all interventions,except for one dog during ischaemia.
Experimental protocolIn six dogs, measurements were performed at baseline and after induc-tion of LBBB. In the remaining six animals, recordings were donebefore and after LAD occlusion for 60 min. Data were recordedwith the ventilator temporarily switched off.
Clinical studyThe study population included 24 patients with mean age 66+8 years(25% females). All patients had chronic heart failure (NYHA II– IV). Atotal of 18 patients underwent LV catheterization, including 11 with is-chaemic cardiomyopathy and 7 with non-ischaemic dilated cardiomy-opathy. Twelve of these patients had LBBB (QRS 160+20 ms).Two of the patients with LBBB had a cardiac resynchronizationtherapy (CRT) device allowing for measurements with CRT on and off.The six remaining patients were studied with 18F-fluorodeoxyglucose
PET imaging (FDG-PET). These patients had dilated cardiomyopathy andLBBB (QRS 165+ 16 ms). Coronary artery disease was ruled out bycoronary angiography. In these patients, only the non-invasivelyestimated pressure curve was used for calculation of work. The studywas approved by the Regional Committee for Medical ResearchEthics. All subjects gave written informed consent.
Haemodynamic and echocardiographic measurementsLeft ventricular pressure was measured by a micromanometer-tippedcatheter (Millar) and a fluid-filled catheter connected to an externalpressure transducer served as an absolute pressure reference. Brachialartery cuff pressure was measured. Myocardial strain was measured bySTE in apical long-axis and two- and four-chamber views (frame rate67+ 7 s21), and 2D images with a narrow sector over the valves(frame rate 91+23 s21) were used to define opening and closureof the aortic and mitral valves. Pressure and strain data were recordedin a synchronized fashion and stored on the scanner for offline analysis.Echocardiography was performed immediately after the PET study.Patients with echocardiography images not amenable for speckle track-ing were excluded prior to invasive pressure measurements (n ¼ 2).An average of 16+ 2 segments were analysed in each patient.
Fluorodeoxyglucose positron emission tomographyTo reduce myocardial fatty acid metabolism and stimulate insulin-dependent glucose uptake, plasma glucose levels were titrated withoral glucose and i.v. insulin as described previously.9 Gated FDG-PETacquisition (Simens Biograph 64) was started 60–80 min after i.v. ad-ministration of the FDG (370–380 MBq), with eight gates per RRinterval. The acquisition was also gated for respiration. Images werereconstructed and analysed on the Xeleris workstation (GE Health-care). The point in the LV myocardium with the highest FDG uptakewas used as a reference (100%), and segmental values were reportedas percentages of this value.
Calculation of estimated left ventricularpressure curveThe non-invasively estimated LV pressure curve was validated first inthe dog model which allowed testing under a wide range of haemo-dynamic conditions. Thereafter, the method was validated in patientswith various cardiac disorders. As an estimate of peak LV pressure,aortic pressure measured invasively was used in dogs and brachialartery cuff pressure in patients. The profile of the estimated LV pres-sure curve was determined by using an empiric reference curve whichwas adjusted according to the duration of the isovolumic and ejectionphases as determined by echocardiography.
Calculating left ventricular pressure reference curveThe LV pressure reference curve was calculated by pooling single cycleLV pressure traces from all interventions and normalizing each pres-sure trace using timing of valvular events in the following threesteps: (i) the timing of opening and closure of the mitral and aorticvalves was identified by echocardiography and assigned to each of
K. Russell et al.Page 2 of 10
at University of O
slo on March 8, 2012
http://eurheartj.oxfordjournals.org/D
ownloaded from
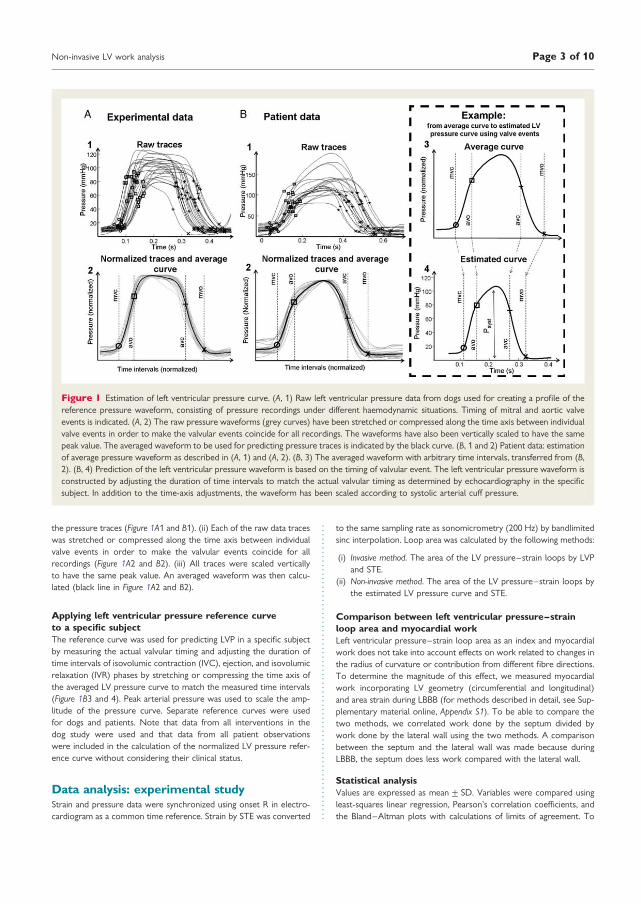
the pressure traces (Figure 1A1 and B1). (ii) Each of the raw data traceswas stretched or compressed along the time axis between individualvalve events in order to make the valvular events coincide for allrecordings (Figure 1A2 and B2). (iii) All traces were scaled verticallyto have the same peak value. An averaged waveform was then calcu-lated (black line in Figure 1A2 and B2).
Applying left ventricular pressure reference curveto a specific subjectThe reference curve was used for predicting LVP in a specific subjectby measuring the actual valvular timing and adjusting the duration oftime intervals of isovolumic contraction (IVC), ejection, and isovolumicrelaxation (IVR) phases by stretching or compressing the time axis ofthe averaged LV pressure curve to match the measured time intervals(Figure 1B3 and 4). Peak arterial pressure was used to scale the amp-litude of the pressure curve. Separate reference curves were usedfor dogs and patients. Note that data from all interventions in thedog study were used and that data from all patient observationswere included in the calculation of the normalized LV pressure refer-ence curve without considering their clinical status.
Data analysis: experimental studyStrain and pressure data were synchronized using onset R in electro-cardiogram as a common time reference. Strain by STE was converted
to the same sampling rate as sonomicrometry (200 Hz) by bandlimitedsinc interpolation. Loop area was calculated by the following methods:
(i) Invasive method. The area of the LV pressure–strain loops by LVPand STE.
(ii) Non-invasive method. The area of the LV pressure–strain loops bythe estimated LV pressure curve and STE.
Comparison between left ventricular pressure–strainloop area and myocardial workLeft ventricular pressure–strain loop area as an index and myocardialwork does not take into account effects on work related to changes inthe radius of curvature or contribution from different fibre directions.To determine the magnitude of this effect, we measured myocardialwork incorporating LV geometry (circumferential and longitudinal)and area strain during LBBB (for methods described in detail, see Sup-plementary material online, Appendix S1). To be able to compare thetwo methods, we correlated work done by the septum divided bywork done by the lateral wall using the two methods. A comparisonbetween the septum and the lateral wall was made because duringLBBB, the septum does less work compared with the lateral wall.
Statistical analysisValues are expressed as mean+ SD. Variables were compared usingleast-squares linear regression, Pearson’s correlation coefficients, andthe Bland–Altman plots with calculations of limits of agreement. To
Figure 1 Estimation of left ventricular pressure curve. (A, 1) Raw left ventricular pressure data from dogs used for creating a profile of thereference pressure waveform, consisting of pressure recordings under different haemodynamic situations. Timing of mitral and aortic valveevents is indicated. (A, 2) The raw pressure waveforms (grey curves) have been stretched or compressed along the time axis between individualvalve events in order to make the valvular events coincide for all recordings. The waveforms have also been vertically scaled to have the samepeak value. The averaged waveform to be used for predicting pressure traces is indicated by the black curve. (B, 1 and 2) Patient data: estimationof average pressure waveform as described in (A, 1) and (A, 2). (B, 3) The averaged waveform with arbitrary time intervals, transferred from (B,2). (B, 4) Prediction of the left ventricular pressure waveform is based on the timing of valvular event. The left ventricular pressure waveform isconstructed by adjusting the duration of time intervals to match the actual valvular timing as determined by echocardiography in the specificsubject. In addition to the time-axis adjustments, the waveform has been scaled according to systolic arterial cuff pressure.
Non-invasive LV work analysis Page 3 of 10
at University of O
slo on March 8, 2012
http://eurheartj.oxfordjournals.org/D
ownloaded from

account for multiple measurements from each animal or patient whenusing the Bland–Altman plots, we display reference intervals based onagreement between methods of measurement with multiple observa-tions per individual.10 For multiple comparisons, we used two-wayrepeated-measurements ANOVA with least significant differencepost-test (SPSS 15.0, SPSS Inc., Chicago, IL, USA). All post hoc tests arecompared with baseline. A value of P, 0.05 was considered significant.To assess interobserver variability, loop area using estimated LV
pressure for six randomly selected patients was analysed by two inde-pendent observers, using the interclass correlation coefficient(a value) and the Bland–Altman method.
Results
Experimental studyHaemodynamic variables at baseline, LBBB, and LAD occlusion aredisplayed in Table 1. There was a strong correlation between
measured LVP and the estimated LV pressure curve for allanimals during all interventions with mean r ¼ 0.99 (range 0.98–1.0; Figure 2A and B). Figure 2C shows a good agreementbetween measured LV pressure vs. the estimated LV pressurecurve as a function of time (limit of agreement 28.9–8.9 mmHg).
Pressure–strain loopsWhen comparing the areas of the pressure–strain loops using theestimated LV pressure curve and the LV pressure–segment lengthloop, there was an excellent correlation (r ¼ 0.96) and a goodagreement (Figure 3A and B). There was also an excellent correl-ation (r ¼ 0.99) and a good agreement between areas of the pres-sure–strain loop using the estimated LV pressure curve and thepressure–strain loops using measured LVP (Figures 4A and 5Aand B). Induction of LBBB was associated with a marked decreasein LV pressure–strain loop area in the septum and there was an
. . . . . . . . . . . . . . . . . . . . . . . . . . . . . . . . . . . . . . . . . . . . . . . . . . . . . . . . . . . . . . . . . . . . . . . . . . . . . . . . . . . . . . . . . . . . . . . . . . . . . . . . . . . . . . . . . . . . . . . . . .
. . . . . . . . . . . . . . . . . . . . . . . . . . . . . . . . . . . . . . . . . . . . . . . . . . . . . . . . . . . . . . . . . . . . . . . . . . . . . . . . . . . . . . . . . . . . . . . . . . . . . . . . . . . . . . . . . . . . . . . . . . . . . . . . . . . . . . . . . . . . . . . . . . . . . . . . . . . . . . . . . . . . . . . . . . . . . . .
. . . . . . . . . . . . . . . . . . . . . . . . . . . . . . . . . . . . . . . . . . . . . . . . . . . . . . . . . . . . . . . . . . . . . . . . . . . . . . . . . . . . . . . . . . . . . . . . . . . . . . . . . . . . . . . . . . . . . . . . . . . . . . . . . . . . . . . . . . . . . . . . . . . . . . . . . . . . . . . . . . . . . . . . . . . . . . .
Table 1 Haemodynamic variables and loop areas in experimental study
LBBB group Ischaemia group
Baseline (n 5 6) LBBB (n 5 6) Baseline (n 5 6) Ischaemia (n5 6)
Haemodynamic variables and ECG
Heart rate (b.p.m.) 121+17 122+13 107+16 134+9*
QRS width (ms) 68+5 116+7* 69+9 67+8
LV dP/dtmax (mmHg/s) 1284+198 1098+189 1794+337 1737+102
LV EDP (mmHg) 10+3 10+4 8+1 10+2
Peak LVP (mmHg) 96+12 94+9 111+11 114+9
Loop areas
Septum Lateral wall Septum Lateral wall Anterior wall Anterior wall
Invasive method
Loop area by LV pressure–strain(mmHg %)
693+256 659+264 155+289* 1024+486* 932+239 322+250*
Non-invasive method
Loop area by estimated LVpressure–strain (mmHg%)
839+230 770+269 227+278* 1031+475* 914+242 295+221*
Values are mean+ SD. LBBB, left bundle branch block; EDP, end-diastolic pressure; anterior wall affected by ischaemia. Strain was measured by speckle trackingechocardiography.*P, 0.05 vs. baseline.
Figure 2 Comparison between estimated and measured left ventricular pressure. (A) Traces from a representative dog. (B) Point-for-pointcorrelation between measured left ventricular pressure and the estimated left ventricular pressure curve for the same animal as in (A). (C)There was good agreement between measured left ventricular pressure vs. estimated left ventricular pressure as a function of time for allthe animals (limits of agreement 28.9–8.9 mmHg).
K. Russell et al.Page 4 of 10
at University of O
slo on March 8, 2012
http://eurheartj.oxfordjournals.org/D
ownloaded from

Figure 3 (A) Correlation and agreement between area of the pressure–strain loops by estimated left ventricular pressure and speckle track-ing echocardiography vs. measured left ventricular pressure and sonomicrometry. (B) Representative traces showing pressure–strain loops byleft ventricular pressure and sonomicrometry (black line) vs. estimated left ventricular pressure and echocardiography (red dotted line). Mea-surements during baseline (left panel) and ischaemia (right panel). Sono, sonomicrometry; echo, speckle tracking echocardiography.
Figure 4 Correlation and agreement between area of the pressure–strain loops by estimated left ventricular pressure and speckle trackingechocardiography (STE) vs. measured left ventricular pressure and STE. (A) Experimental data. (B) Clinical data. Note that the same strain dataare used for calculation by the two methods to show the isolated variation in loop area by using the non-invasive left ventricular pressure curvevs. measured left ventricular pressure. RI, reference interval.
Non-invasive LV work analysis Page 5 of 10
at University of O
slo on March 8, 2012
http://eurheartj.oxfordjournals.org/D
ownloaded from

increase in loop area in the LV lateral wall (Figure 5A and Table 1).As predicted, the LV pressure–strain loop area decreased signifi-cantly in the segments affected by ischaemia compared with base-line (Figures 3B and 5B, and Table 1).
Relationship between myocardial workand pressure–strain loop area during LBBBInduction of LBBB was associated with flattening of the septumrelative to the lateral wall. This was expressed as a decrease inmean systolic curvature for the septum relative to the LV freewall: reduction in septal curvature/reduction in lateral wallcurvature ¼ 1.14. Furthermore, work done by the septum relativeto the lateral wall was greater when calculated using curvature dataand area–strain compared with calculations done using the non-invasive method with ratios of 0.54+ 0.60 and 0.43+0.67, re-spectively, but these differences were not statistically significant(P ¼ 0.202). There was, however, an excellent correlationbetween the two methods (r ¼ 0.97, y ¼ 0.73x + 0.15, P,0.0001) when comparing relative values between the septum andthe LV lateral wall.
Clinical studyThe patients had a QRS width of 140+40 ms, a peak LVP of128+ 22 mmHg, and a heart rate of 73+ 29 b.p.m. The peak bra-chial systolic pressure was 131+19 mmHg.
Left ventricular pressure–strain loopsThere was an excellent correlation (r ¼ 0.99) and a good agree-ment between areas of the pressure–strain loops using measuredand estimated LV pressure (Figure 4B). Similar to observations inthe experimental study, patients with LBBB demonstrated marked-ly reduced work in the septum compared with the lateralwall (358+ 512 vs. 1308+495 and 402+539 vs.1315+
473 mmHg %, by the invasive and non-invasive methods, respect-ively). Pressure–strain loops from a representative patient are dis-played in Figure 6 and show how CRT alters loop areas. Also in theischaemic cardiomyopathy patients without LBBB, findings weresimilar to those in the experimental study. The pressure–strainloop area was significantly reduced in areas supplied by anoccluded coronary artery compared with areas with normal perfu-sion assessed by angiography (248+629 vs.1181+626 and223+636 vs.1186+ 583, by the invasive and non-invasivemethods, respectively).
Relationship between myocardial glucose metabolism(fluorodeoxyglucose positron emission tomography) andpressure–strain loop area during left bundle branch blockGlucose metabolism in the patients with LBBB showed significantregional differences and was highest in the lateral wall andlowest in the septum. The non-invasive LV pressure–strain looparea showed a pattern of regional work distribution which wasvery similar to the distribution of glucose uptake (Figure 7). Thecorrelation between segmental values of the loop area and FDGuptake for all the patients was strong with average r ¼ 0.81 and in-dividual values ranging from 0.70 to 0.87.
Interobserver variabilityMeasurements of 22 loop areas by two independent observersshowed a mean difference of 246 mmHg % with an average looparea of 765 mmHg %. The intraclass correlation coefficientbetween the twoobserverswas 0.99, indicating good reproducibility.
DiscussionIn the present study, we demonstrate that LV pressure–strain looparea, which reflects regional LV myocardial work, can be measured
Figure 5 Representative traces showing pressure–strain loops by left ventricular pressure and speckle-tracking echocardiography (solid line)vs. estimated left ventricular pressure and speckle-tracking echocardiography (dashed line). Measurements during baseline and left bundlebranch block (A) and during baseline and ischaemia (B) in the experimental dog model.
K. Russell et al.Page 6 of 10
at University of O
slo on March 8, 2012
http://eurheartj.oxfordjournals.org/D
ownloaded from

clinically by an entirely non-invasive approach. This was feasible bycombining a non-invasively estimated LV pressure curve with strainby STE. The validity of this method was confirmed in the experi-mental part of the study by an excellent correlation and a goodagreement with loop area by invasive pressure–segment lengthanalysis. In the clinical study, LV pressure–strain loop area usingthe non-invasive LV pressure curve showed a strong correlationand a good agreement with loop area using invasive LV pressure.When the non-invasive pressure–strain assessment was appliedin patients with LBBB, we observed a marked non-uniformity inwork distribution with reduced work in the septum and increasedwork in the LV lateral wall, suggesting that the work analysis mayrepresent a means to explore the haemodynamic impact ofelectrical dyssynchrony and to monitor responses to CRT.Non-uniformity in work distribution was also apparent when com-paring ischaemic vs. non-ischaemic segments. Furthermore, weshow that non-invasive pressure–strain loop area reflects regionalmetabolism, which further supports its use as an index of myocar-dial work.
Calculation of workIn principle, the area of the myocardial force–dimension looprepresents regional LV work and may also be used as a mechanicalindex of regional myocardial oxygen consumption.3 Regional workby force–dimension analysis can be measured in animal prepara-tions using LV pressure in combination with sonomicrometry or
cardiac magnetic resonance imaging and by taking local geometryinto consideration.11,12 There is, however, no easily accessibleclinical method to record myocardial force–dimension loopssince calculation of force requires measurements which are diffi-cult to obtain simultaneously and continuously throughout theheart cycle. In the present study, we used pressure as a substitutefor force and the area of the LV pressure–strain loop was used asan index of regional work. This index does not provide a measure,which has units of work, and does not incorporate the modifyingeffect of local radii of curvature or contributions from differentfibre orientations on force. To address these issues and in particu-lar to explore how changes in septal curvature during LBBB wouldmodify the ability of septal pressure–strain loop area to reflect theforce–strain loop area, we performed additional analysis. This ana-lysis showed that induction of LBBB was associated with a decreasein mean systolic (circumferential and longitudinal) curvature forboth the septum and the lateral wall, compared with baseline. Al-though the septum flattens during LBBB as a result of its initialrapid contraction during IVC,8 the relative difference in mean sys-tolic curvature between the septum and the lateral wall was notstatistically significant because after this initial contraction, theseptum was stretched and maintained its curvature during ejectionrelative to the lateral wall. We also observed a tendency, althoughnot significant, that the relative difference in work done by theseptum compared with the lateral wall was greater when calcu-lated using curvature data and area–strain compared with
Figure 6 Loop areas by left ventricular pressure and speckle-tracking echocardiography (solid line) vs. the non-invasive method by estimatedleft ventricular pressure and speckle-tracking echocardiography (dashed line), for a septal and lateral wall segment in a patient with the cardiacresynchronization therapy device turned on and off.
Non-invasive LV work analysis Page 7 of 10
at University of O
slo on March 8, 2012
http://eurheartj.oxfordjournals.org/D
ownloaded from

calculations done using pressure–strain loop area. However, therewas a strong correlation between relative work using the twomethods (r ¼ 0.97), indicating that the pressure–strain loop areagives adequate clinical information regarding relative differencesin work distribution within the same heart. Furthermore, in our la-boratory, we have previously demonstrated that changes in seg-mental pressure–dimension loops approximate changes in thestress–dimension loops during myocardial ischaemia.13
The ability of pressure length area to reflect myocardial oxygenconsumption has been shown previously.6 In the present study, wefound that the non-invasive LV pressure–strain loop area had astrong correlation and agreement with regional glucose metabol-ism using FDG-PET. Previous studies have shown that glucose me-tabolism reflects myocardial work,14 and this finding thereforesupports our conclusion that pressure–strain loop area reflectsdifferences in myocardial work distribution. The present findingsof regional changes in work distribution in patients with LBBBare in keeping with the observations by Prinzen et al.12 in a dogmodel with right ventricular pacing.
Estimated left ventricular pressure curveThere are numerous techniques which can provide a more accur-ate central aortic pressure than just using brachial artery cuff
pressure, and these may be applied in combination with thepresent method. However, when the non-invasive pressuremethod is used for comparing work between segments, the mainissue is the abnormal distribution of work and not the absolutevalues.
It is important to note that the only application of the non-invasive pressure curve proposed in this study was to serve as apressure estimate when calculating LV pressure–strain loopareas, and for this application, it served its purpose very well, asindicated by the excellent relationship to reference methods forpressure loop area. It does not have sufficient accuracy,however, to provide a measure of LV diastolic pressure or peakrate of rise or fall in LV pressure.
Whereas correct timing of peak LV pressure was of little im-portance for pressure–strain loop area, errors in timing of earlysystolic rise in pressure (IVC) and early-diastolic fall in LV pressure(IVR) would be expected to have effects on loop area, in particularwhen there is pre-ejection or post-ejection shortening. Thus, thepre-ejection septal shortening during LBBB which occurs againstlow LV pressure, and therefore represents little work, wouldappear erroneously as a more substantial work if timing of aorticvalve opening (AVO) was set prematurely. Similarly, the workrepresented by post-systolic shortening in ischaemic myocardium
Figure 7 Data from one representative patient. (A) Bull’s eye plot showing relative glucose metabolism by fluorodeoxyglucose positron emis-sion tomography (FDG-PET) in a representative patient with left bundle branch block. The point in the left ventricular myocardium with thehighest FDG uptake was used as a reference (100%), and segmental values were reported as percentages of this value. (B) Bull’s eye plot withsimilar anatomical distribution as in (A), showing relative loop area by estimated left ventricular pressure and speckle-tracking echocardiography.The segment with the largest loop area was used as a reference (100%), and segmental values were reported as percentages of this value. (C)Correlation between regional metabolism by FDG-PET and loop area by estimated left ventricular pressure and speckle-tracking echocardiog-raphy. (D) Representative pictures showing regional distribution of glucose metabolism by FDG-PET for short-axis (left panel) and four-chamber (right panel) views. (E) Estimated left ventricular pressure and speckle-tracking echocardiography loops from the septum andlateral wall.
K. Russell et al.Page 8 of 10
at University of O
slo on March 8, 2012
http://eurheartj.oxfordjournals.org/D
ownloaded from

would be overestimated if timing of aortic valve closure (AVC) wasset too late. The error in timing of IVC and IVR, however, wasminor as demonstrated by testing sensitivity to errors in timing ofAVO and AVC (see Supplementary material online, Appendix S2).Strain by STE is dependent on image quality to be able to accuratelytrack the speckles from frame to frame. Therefore, work analysismay not be feasible in all patients. Furthermore, in patients withvalvular pathology such as aortic stenosis, the pressure gradientover the valve will invalidate peripheral systolic arterial pressure asan estimate of peak LV pressure, and in these patients, the use ofthe estimated non-invasive pressure does therefore not apply.
LimitationsThe use of a reference curve to define timing of peak systolic pres-sure is in principle a limitation of the estimated pressure curvemethod since patients have different timing of peak LV pressureand this may vary from time to time in a given patient. Thismight have been improved by using brachial artery tonometry ora similar method to define timing of peak pressure and the pres-sure profile during LV ejection. However, additional analysisdescribed in Supplementary material online, Appendix S2, showedthat accurate timing of true peak pressure did not really mattersince the impact on work of under- or overestimating LV pressureduring the first part of the LV ejection phase was essentially com-pensated for by the opposite effect during the last part. For detec-tion of more subtle differences in regional work, however, the useof a tonometrically recorded pressure curve may be of value. Mea-sured LVP data from the analysed subject was not excluded fromthe average curve, as doing so did not significantly alter the esti-mated LV pressure waveform.Speckle-tracking echocardiography measures motion in the
image plane while sonomicrometry measures motion of materialpoints in the myocardium. Therefore, a misalignment of the ultra-sound plane vs. the crystals may account for some of the discrep-ancies between the two measurements. When calculating areastrain and curvature, we used circumferential and longitudinal mea-surements obtained from two separate 2D echocardiographic pro-jections. This method assumes that the projections are orthogonaland misalignment is a potential source of error.Fluorodeoxyglucose positron emission tomography assesses
glucose metabolism and will show increased uptake in areasboth with aerobic and anaerobic (ischaemia) metabolism. There-fore, in the present study, we included only patients with anormal coronary angiography and no history of coronary arterydisease. The observed abnormal changes in LV glucose metabolismduring LBBB are in keeping with previous findings.15
The sample size in the present study is small and further valid-ation of the findings should therefore be performed in a largercohort; however, the consistency of the data support our findings.
Potential for clinical applicationAs suggested by previous studies,12,16,17 analysis of cardiacmechanics and regional work during ventricular dyssynchronymay provide important insights into mechanisms of remodellingand LV dysfunction. During LBBB, the early-activated septal seg-ments produce little or negative work, while the late-activated
segments are hyperstretched by the early septal contraction, andtherefore generate more work than normal segments.8,12 The dif-ference in intersegmental work distribution during LBBB is asso-ciated with differences in regional blood flow and oxygendemand and may also account for remodelling of the left ven-tricle.6,15,17,18 A clinical method which can assess regional workis therefore likely to provide important insights into cardiacmechanics and may be useful when evaluating patients who arecandidates for CRT.
Because the proposed method uses LVP as a surrogate for force,it does not reflect changes in force that result from individual dif-ferences in LV geometry, and therefore, comparison betweenhearts is difficult. The most important application of the methodwould be to compare work between segments in a given ventricle.Such insight might be used to explore how non-uniformity of workdistribution contributes to LV remodelling. Furthermore, studiesshould be done to determine whether work distribution duringLV dyssynchrony may be used to identify responders to CRTand serve as a means to optimize electrode placement. Similar in-formation cannot be obtained by just measuring strain, as illu-strated by septal pre-ejection shortening and post-systolicshortening in the ischaemic myocardium which represent substan-tial shortening, but little work since LV pressure is low.
ConclusionsIn the present study, we introduce a novel non-invasive method forLV pressure–strain analysis which may serve as a means to quantifyregional myocardial work and may also provide informationregarding metabolic demand. Assessing work distribution willgive the clinician additional information when assessing patientswith ischaemia and might be useful for selecting patients forCRT. Furthermore, work analysis may play an important part in op-timizing CRT settings and improve responder rate. Further studiesare needed to define the clinical role of the proposed method.
Supplementary materialSupplementary material is available at European Heart Journalonline.
AcknowledgementsThe expert technical assistance of Randi Moen Forfang with thePET studies is gratefully acknowledged.
FundingK.R., E.W.R., and O.G. were recipients of clinical research fellow-ships from the University of Oslo, Helse Sør-Øst, and The Norwe-gian Research Council, respectively.
Conflict of interest: none declared.
References1. Suga H. Total mechanical energy of a ventricle model and cardiac oxygen con-
sumption. Am J Physiol 1979;236:H498–H505.
Non-invasive LV work analysis Page 9 of 10
at University of O
slo on March 8, 2012
http://eurheartj.oxfordjournals.org/D
ownloaded from

2. Takaoka H, Takeuchi M, Odake M, Yokoyama M. Assessment of myocardialoxygen consumption (Vo2) and systolic pressure–volume area (PVA) in humanhearts. Eur Heart J 1992;13(Suppl. E):85–90.
3. Hisano R, Cooper G. Correlation of force–length area with oxygen consumptionin ferret papillary muscle. Circ Res 1987;61:318–328.
4. Tyberg JV, Forrester JS, Wyatt HL, Goldner SJ, Parmley WW, Swan HJ. An ana-lysis of segmental ischemic dysfunction utilizing the pressure–length loop.Circulation 1974;49:748–754.
5. Forrester JS, Tyberg JV, Wyatt HL, Goldner S, Parmely WW, Swan HJ. Pressure–length loop: a new method for simultaneous measurement of segmental and totalcardiac function. J Appl Physiol 1974;37:771–775.
6. Delhaas T, Arts T, Prinzen FW, Reneman RS. Regional fibre stress-fibre strain areaas an estimate of regional blood flow and oxygen demand in the canine heart.J Physiol 1994;477(Pt 3):481–496.
7. Urheim S, Rabben SI, Skulstad H, Lyseggen E, Ihlen H, Smiseth OA. Regional myo-cardial work by strain Doppler echocardiography and LV pressure: a new methodfor quantifying myocardial function. Am J Physiol Heart Circ Physiol 2005;288:H2375–H2380.
8. Gjesdal O, Remme EW, Opdahl A, Skulstad H, Russell K, Kongsgaard E,Edvardsen T, Smiseth OA. Mechanisms of abnormal systolic motion of the inter-ventricular septum during left bundle-branch block. Circ Cardiovasc Imaging 2011;4:264–273.
9. Martin WH, Jones RC, Delbeke D, Sandler MP. A simplified intravenous glucoseloading protocol for fluorine-18 fluorodeoxyglucose cardiac single-photon emis-sion tomography. Eur J Nucl Med 1997;24:1291–1297.
10. Bland JM, Altman DG. Agreement between methods of measurement with mul-tiple observations per individual. J Biopharm Stat 2007;17:571–582.
11. Goto Y, Igarashi Y, Yasumura Y, Nozawa T, Futaki S, Hiramori K, Suga H. Inte-grated regional work equals total left ventricular work in regionally ischemiccanine heart. Am J Physiol Heart Circ Physiol 1988;254:H894–H904.
12. Prinzen FW, Hunter WC, Wyman BT, McVeigh ER. Mapping of regional myocar-dial strain and work during ventricular pacing: experimental study using magneticresonance imaging tagging. J Am Coll Cardiol 1999;33:1735–1742.
13. Skulstad H, Edvardsen T, Urheim S, Rabben SI, Stugaard M, Lyseggen E, Ihlen H,Smiseth OA. Postsystolic shortening in ischemic myocardium: active contractionor passive recoil? Circulation 2002;106:718–724.
14. Bergman BC, Tsvetkova T, Lowes B, Wolfel EE. Myocardial glucose and lactatemetabolism during rest and atrial pacing in humans. J Physiol 2009;587(Pt 9):2087–2099.
15. Nowak B, Sinha AM, Schaefer WM, Koch KC, Kaiser HJ, Hanrath P, Buell U,Stellbrink C. Cardiac resynchronization therapy homogenizes myocardialglucose metabolism and perfusion in dilated cardiomyopathy and left bundlebranch block. J Am Coll Cardiol 2003;41:1523–1528.
16. Prinzen FW, Cheriex EC, Delhaas T, van Oosterhout MFM, Arts T, Wellens HJJ,Reneman RS. Asymmetric thickness of the left ventricular wall resulting fromasynchronous electric activation: a study in dogs with ventricular pacing and inpatients with left bundle branch block. Am Heart J 1995;130:1045–1053.
17. van Oosterhout MF, Prinzen FW, Arts T, Schreuder JJ, Vanagt WY, Cleutjens JP,Reneman RS. Asynchronous electrical activation induces asymmetrical hyper-trophy of the left ventricular wall. Circulation 1998;98:588–595.
18. Prinzen FW, Augustijn CH, Arts T, Allessie MA, Reneman RS. Redistribution ofmyocardial fiber strain and blood flow by asynchronous activation. Am J Physiol1990;259(2 Pt 2):H300–H308.
K. Russell et al.Page 10 of 10
at University of O
slo on March 8, 2012
http://eurheartj.oxfordjournals.org/D
ownloaded from

Paper 4
