novel binding partners of pbf in thyroid tumourigenesisetheses.bham.ac.uk/4766/1/sharma14phd.pdf ·...
TRANSCRIPT
NOVEL BINDING PARTNERS OF PBF
IN THYROID TUMOURIGENESIS
By
Neil Sharma
A thesis presented to the College of Medical and Dental Sciences at
the University of Birmingham for the Degree of Doctor of Philosophy
Centre for Endocrinology, Diabetes and Metabolism, School of
Clinical and Experimental Medicine
August 2013

University of Birmingham Research Archive
e-theses repository This unpublished thesis/dissertation is copyright of the author and/or third parties. The intellectual property rights of the author or third parties in respect of this work are as defined by The Copyright Designs and Patents Act 1988 or as modified by any successor legislation. Any use made of information contained in this thesis/dissertation must be in accordance with that legislation and must be properly acknowledged. Further distribution or reproduction in any format is prohibited without the permission of the copyright holder.

SUMMARY
Thyroid cancer is the most common endocrine cancer, with a rising incidence. The
proto-oncogene PBF is over-expressed in thyroid tumours, and the degree of over-expression
is directly linked to patient survival. PBF causes transformation in vitro and tumourigenesis in
vivo, with PBF-transgenic mice developing large, macro-follicular goitres, effects partly
mediated by the internalisation and repression of the membrane-bound transporters NIS and
MCT8. NIS repression leads to a reduction in iodide uptake, which may negatively affect the
efficacy of radioiodine treatment, and therefore prognosis.
Work within this thesis describes the use of tandem mass spectrometry to produce a list
of potential binding partners of PBF. This will aid further research into the pathophysiology
of PBF, not just in relation to thyroid cancer but also other malignancies. From this list, the
interaction with three proteins was further investigated and validated by GST pull-down
assays and/or co-immunoprecipitation. Thyroglobulin is an essential component of thyroid
hormone synthesis. Preliminary studies suggested co-localisation with PBF within intra-
cellular vesicles, although further research is needed to explore this functionally. Cortactin
has a role in the cellular transport of proteins, and also promotes invadopodia formation and
metastases in cancer. Co-localisation was observed in vesicles and at the membrane, with PBF
additionally demonstrated in cell membrane projections – indicating a potential mechanism
for the shuttling of PBF to and from the cell membrane, and its secretion. SRC is a tyrosine
kinase intimately linked to cancer. SRC phosphorylated PBF, an effect abrogated by treatment
with specific inhibitors, including PP1. Importantly, PP1 treatment was then found to increase
iodide uptake in human primary thyroid cultures over-expressing PBF.
Overall, these data describe a list of possible binding partners for PBF, and specifically
identify a novel potential therapeutic strategy for iodide-refractory thyroid cancer.

DEDICATION
For Hannah and Jake.

ACKNOWLEDGEMENTS
I would like to thank Professor Chris McCabe, Dr Martin Read and Professor Jayne
Franklyn for their excellent supervision of this research project, and for their continued
support of my academic aspirations. Thanks also to Dr Vicki Smith and Dr Kristien Boelaert
for their patience, time and teaching, Dr Craig Doig for both his advice and constant
questioning, and Dr Andrew Turnell and Dr Ashley Martin for their guidance and coaching
through the world of proteomics. I am grateful to Rob, Greg, Craig, Gavin and Perkin for
helping to keep me sane and slightly fit during my three years in the lab, as well as everyone
on the 2nd floor IBR for providing a great working environment. Finally, thanks to Mr John
Watkinson for his support in all aspects of my career and for giving me the opportunity to get
started in research, and to Chris for helping to keep me here.
This work was funded by the Get Ahead Charitable Trust, the Royal College of
Surgeons of England and the Medical Research Council, to whom I am grateful for their
support and confidence.
Abbreviations
i
ABBREVIATIONS
°C Degrees centigrade 125I Iodine-125 ¹³¹I Iodine-131 ATA American Thyroid Association ATC Anaplastic thyroid cancer BCA Bicinchoninic acid BSA Bovine serum albumin BTA British Thyroid Association cDNA Complementary deoxyribonucleic acid CI Confidence interval cpm Counts per minute Da Dalton DIT Di-iodo-tyrosine DMEM Dulbecco Modified Eagle's Media DMSO Dimethyl sulfoxide DNA Deoxyribonucleic acid DTC Differentiated thyroid cancer DTT Dithiothreitol EDTA Ethylenediaminetetraacetic acid EGFR Epidermal growth factor receptor ELISA Enzyme Linked Immunosorbent Assay ERE Oestrogen response elements ESI Electrospray ionisation FACS Fluorescence activated cell sorting FAK Focal adhesion kinase FAP Familial Adenomatous Polyposis FBS Fetal bovine serum FGF2 Fibroblast growth factor 2 FGFR Fibroblast growth factor receptor FNAC Fine needle aspiration cytology FTC Follicular thyroid cancer GST Glutathione-S-Transferase HA Haemagglutinin HBSS Hanks Balanced Salt Solution HPLC High performance liquid chromatography HRP Horseradish peroxidase HSP90 Heat shock protein 90 IP Immunoprecipitation kDa Kilodalton LB Lysogeny broth LC Liquid chromatography LRRK Leucine-rich repeat kinase m/z Mass to charge ratio MALDI Matrix assisted laser desorption/ionisation
Abbreviations
ii
MAPK Mitogen activated protein kinase MCT8 Monocarboxylate transporter 8 MEN Multiple endocrine neoplasia MET Hepatocyte growth factor MIFC Minimally invasive follicular carcinoma MIT Mono-iodo-tryosine MNG Multinodular goitre mRNA Messenger ribonucleic acid MS/MS Tandem mass spectrometry MTC Medullary thyroid cancer NaI Sodium Iodide NCS Newborn Calf Serum NIS Sodium-Iodide Symporter NTRK1 Neurotrophic tyrosine receptor kinase type 1 PAX8 Paired box gene 8 PBF PTTG Binding Factor (also PTTG1IP) PBF-HA Haemagglutinin-tagged PBF PBF-Tg PBF transgenic PBS Phosphate buffered saline PCR Polymerase chain reaction PDGF-R Platelet derived growth factor receptor PEI Polyethylenimine PI Protease inhibitor PP1 Src-selective kinase inhibitor PPARγ1 Peroxisome proliferator-activator receptor gamma 1 PTC Papillary thyroid cancer PTEN Phosphatase and tensin homologue PTTG Pituitary tumor transforming gene PTM Post translational modification PVDF Polyvinylidene difluoride pY174 PBF phosphorylated at Y174 RAF Serine/threonine-protein kinase RAS Rat sarcoma viral oncogene RET/PTC Rearranged during transfection/Papillary thyroid cancer RIPA Radioimmunoprecipitation assay RLN Recurrent laryngeal nerve RNA Ribonucleic acid RR Relative Risk RTK Receptor tyrosine kinase SDS Sodium dodecyl sulphate SDS-PAGE SDS-polyacrylamide gel electrophoresis SFK SRC family kinase SH2/3 Src homology domain 2/3 SILAC Stable isotope labelling by amino acid in culture SIR Standardised incidence ratio siRNA Short interfering RNA STN Solitary thyroid nodule
Abbreviations
iii
SUMO Small ubiquitin-like modifier T/F Transfection T3 Tri-iodothyronine T4 Tetraiodothyronine TBS-T Tris buffered saline with tween TE Transfection efficiency TEMED Tetramethylethylenediamine Tg Thyroglobulin TKI Tyrosine kinase inhibitor TNM Tumour, Node, Metastases ToF Time of flight TRH Thyrotropin releasing hormone TSH Thyroid stimulating hormone
UACA Uveal autoantigen with coiled-coil domains and ankyrin repeats
USF1 Upstream transcription factor 1 UT Untransfected v/v Volume to volume ratio VEGFR Vascular endothelial growth factor receptor VO Vector Only w/v Weight to volume ratio WB Western blot WHO World Health Organisation WIFC Widely invasive follicular carcinoma

Publications
i
PUBLICATIONS RELATING TO THIS THESIS
Smith VE*, Sharma N*, Watkins RJ, Read ML, Ryan GA, Kwan PP, Martin A, Watkinson
JC, Boelaert K, Franklyn JA, McCabe CJ. Manipulation of PBF/PTTG1IP Phosphorylation
Status; a Potential New Therapeutic Strategy for Improving Radioiodine Uptake in Thyroid
and Other Tumors. J Clin Endocrinol Metab. 2013 Jul;98(7):2876-86. * = joint first author
Sharma N, Martin A, McCabe CJ. Mining the proteome: the application of tandem mass
spectrometry to endocrine cancer research. Endocr Relat Cancer. 2012 Jul 22;19(4):R149-61.
Smith VE, Read ML, Turnell AS, Sharma N, Lewy GD, Fong JC, Seed RI, Kwan P, Ryan G,
Mehanna H, Chan SY, Darras VM, Boelaert K, Franklyn JA, McCabe CJ. PTTG-binding
factor (PBF) is a novel regulator of the thyroid hormone transporter MCT8. Endocrinology.
2012 Jul;153(7):3526-36.
Lewy GD, Sharma N, Seed RI, Smith VE, Boelaert K, McCabe CJ. The pituitary tumor
transforming gene in thyroid cancer. J Endocrinol Invest. 2012 Apr;35(4):425-33.
Read ML, Lewy GD, Fong JC, Sharma N, et al. Proto-oncogene PBF/PTTG1IP regulates
thyroid cell growth and represses radioiodide treatment. Cancer Res. 2011 Oct 1;71(19):6153-
64.
Watkins RJ, Read ML, Smith VE, Sharma N, Reynolds GM, Buckley L, Doig C, Campbell
MJ, Lewy G, Eggo MC, Loubiere LS, Franklyn JA, Boelaert K, McCabe CJ. Pituitary tumor
transforming gene binding factor: a new gene in breast cancer. Cancer Res. 2010 May
1;70(9):3739-49.

Table of Contents
ii
TABLE OF CONTENTS Chapter 1 General Introduction .......................................................................................... 1
1.1 The Physiological Role of the Thyroid Gland ......................................................... 2 1.1.1 Thyroid structure and development ........................................................................ 2 1.1.2 Thyroid hormone synthesis ..................................................................................... 3 1.1.3 The role of the thyroid gland in health.................................................................... 4
1.2 Thyroid Cancer .......................................................................................................... 6 1.2.1 Incidence of Thyroid Cancer .................................................................................. 6 1.2.2 Risk factors for developing DTC ............................................................................ 7 1.2.3 Types of thyroid cancer .......................................................................................... 9 1.2.4 Diagnosing thyroid cancer .................................................................................... 11 1.2.5 Management of differentiated thyroid cancer ....................................................... 13 1.2.6 Prognosis ............................................................................................................... 16
1.3 The molecular basis of thyroid cancer ................................................................... 17 1.3.1 Oncogenes and thyroid cancer .............................................................................. 17
1.4 PTTG-Binding Factor (PBF) .................................................................................. 30 1.4.1 Physiology ............................................................................................................ 30 1.4.2 PBF in thyroid cancer ........................................................................................... 35
1.5 Mass spectrometry and protein-protein interactions ........................................... 46 1.5.1 Role of protein-protein interactions in the cell ..................................................... 46 1.5.2 General principles ................................................................................................. 47 1.5.3 Protein complexes ................................................................................................. 49 1.5.4 Protein quantitation ............................................................................................... 49 1.5.5 Mass spectrometry and thyroid cancer ................................................................. 52
1.6 Hypothesis and aims ................................................................................................ 57
Chapter 2 Materials and Methods ..................................................................................... 60
2.1 Cell lines .................................................................................................................... 61 2.2 Transfection .............................................................................................................. 62
2.2.1 Plasmid purification .............................................................................................. 62 2.2.2 Transfection of bacterial plasmids ........................................................................ 66 2.2.3 siRNA transfection ............................................................................................... 67
2.3 Western blotting ....................................................................................................... 67 2.3.1 Protein Extraction and quantification ................................................................... 67 2.3.2 Western blotting .................................................................................................... 68
2.4 Co-immunoprecipitation ......................................................................................... 69 2.5 GST-tagged pull down assays ................................................................................. 70
2.5.1 Expression of GST-tagged PBF ............................................................................ 70 2.5.2 Translation of L-α-[35S]-methionine labelled protein ........................................... 71 2.5.3 Binding assay ........................................................................................................ 71
2.6 Fluorescence immunocytochemistry ...................................................................... 72
Table of Contents
iii
2.7 Human primary thyroid cultures ........................................................................... 73 2.8 Statistical analysis .................................................................................................... 74
Chapter 3 Optimisation of tandem mass spectrometry ................................................... 75
3.1 Introduction .............................................................................................................. 76 3.2 Methods ..................................................................................................................... 78
3.2.1 Cell culture ............................................................................................................ 78 3.2.2 Bacterial plasmids ................................................................................................. 78 3.2.3 Fluorescence-activated cell sorting (FACS) ......................................................... 78 3.2.4 Western blotting .................................................................................................... 79 3.2.5 Tandem mass spectrometry (MS/MS) .................................................................. 79
3.3 Results ....................................................................................................................... 81 3.3.1 Optimisation of transfection efficiencies for K1 and TPC1 cells ......................... 81 3.3.2 Optimisation of MS/MS ........................................................................................ 85 3.3.3 Optimum conditions for MS/MS .......................................................................... 93
3.4 Discussion ................................................................................................................. 94
Chapter 4 Novel binding partners of PBF identified by MS/MS .................................... 98
4.1 Introduction .............................................................................................................. 99 4.2 Methods ..................................................................................................................... 99
4.2.1 MS/MS protocol ................................................................................................... 99 4.2.2 Statistical methods .............................................................................................. 100
4.3 Results ..................................................................................................................... 100 4.3.1 Immunoprecipitation with anti-HA..................................................................... 100 4.3.2 Binding partners identified in TPC1 cells ........................................................... 101 4.3.3 Immunoprecipitation using an anti-PBF antibody .............................................. 102 4.3.4 Shortlisting of potential binding partners ........................................................... 103
4.4 Discussion ............................................................................................................... 106
Chapter 5 PBF and thyroglobulin interact in thyroid cells ........................................... 112
5.1 Introduction ............................................................................................................ 113 5.2 Methods ................................................................................................................... 113
5.2.1 Cell culture and transfection ............................................................................... 113 5.2.2 GST pull-down assay .......................................................................................... 113 5.2.3 Co-immunoprecipitation and Western Blot ........................................................ 114 5.2.4 Primary thyroid culture ....................................................................................... 114 5.2.5 Homogenisation of thyroid tissue ....................................................................... 114 5.2.6 Fluorescence immunocytochemistry .................................................................. 114 5.2.7 Statistical analysis ............................................................................................... 114
5.3 Results ..................................................................................................................... 115 5.3.1 Translation of [35S]-methionine labelled thyroglobulin and GST pull-down
assay .................................................................................................................... 115 5.3.2 Co-immunoprecipitation ..................................................................................... 116 5.3.3 Fluorescence immunocytochemistry .................................................................. 122

Table of Contents
iv
5.4 Discussion ............................................................................................................... 124
Chapter 6 Investigating the interaction between cortactin and PBF ........................... 130
6.1 Introduction ............................................................................................................ 131 6.2 Methods ................................................................................................................... 132
6.2.1 Cell lines and transfection ................................................................................... 132 6.2.2 GST pull down assays......................................................................................... 132 6.2.3 Western blotting and co-immunoprecipitation ................................................... 132 6.2.4 Fluorescence immunocytochemistry .................................................................. 132 6.2.5 Secretion assay .................................................................................................... 133
6.3 Results ..................................................................................................................... 134 6.3.1 Validation of the interaction between cortactin and PBF ................................... 134 6.3.2 Cortactin has no effect on PBF expression ......................................................... 138 6.3.3 Cortactin and PBF may co-localise in intra-cellular vesicles ............................. 139 6.3.4 PBF is present in membrane projections ............................................................ 140 6.3.5 Investigations into the effect of cortactin on PBF secretion ............................... 141
6.4 Discussion ............................................................................................................... 145
Chapter 7 Validation of the interaction between SRC and PBF ................................... 151
7.1 Introduction ............................................................................................................ 152 7.2 Methods ................................................................................................................... 153
7.2.1 Cell culture and transfection ............................................................................... 153 7.2.2 GST pull-down assay .......................................................................................... 154 7.2.3 Subcloning of SRC cDNA into pcDNA3.1+ ....................................................... 154 7.2.4 Western blotting and co-immunoprecipitation ................................................... 154 7.2.5 Fluorescence immunocytochemistry .................................................................. 154
7.3 Results ..................................................................................................................... 154 7.3.1 Validation of the interaction between SRC and PBF .......................................... 154 7.3.2 PBF and SRC co-localise .................................................................................... 158 7.3.3 SRC does not alter the sub-cellular localisation of PBF-HA .............................. 159
7.4 Discussion ............................................................................................................... 160
Chapter 8 The role of SRC and its inhibition on PBF-induced NIS repression .......... 162
8.1 Introduction ............................................................................................................ 163 8.2 Methods ................................................................................................................... 165
8.2.1 Cell culture and transfection ............................................................................... 165 8.2.2 Western Blotting ................................................................................................. 165 8.2.3 Fluorescence immunocytochemistry .................................................................. 166 8.2.4 Assessment of phosphorylation status ................................................................ 166 8.2.5 Iodide uptake assays ........................................................................................... 167
8.3 Results ..................................................................................................................... 169 8.3.1 SRC over-expression leads to phosphorylation of PBF ...................................... 169 8.3.2 TKIs affect pY174 in a time and dose dependent manner .................................. 171

Table of Contents
v
8.3.3 Inhibition of SRC by PP1 leads to reduced pY174 expression........................... 176 8.3.4 PP1 treatment leads to a significant reduction in pY174 expression in human
primary thyroid cultures ...................................................................................... 178 8.3.5 Effect of PBF and SRC on 125I uptake ................................................................ 180 8.3.6 Effect of TKIs on iodide uptake ......................................................................... 186
8.4 Discussion ............................................................................................................... 191
Chapter 9 Final conclusions and future directions ........................................................ 197
Chapter 10 References ........................................................................................................ 207
Chapter 11 Appendix 1 ....................................................................................................... 220
11.1 List of potential interacting partners identified by MS/MS ............................... 221
Chapter 12 Bibliography .................................................................................................... 245

List of Figures
vi
LIST OF FIGURES
Figure 1.1 A -‐ Cross-sectional structure of a thyroid follicle. B -‐ Detail of a thyroid follicular cell..... 2
Figure 1.2 Hypothalamic-Pituitary-Thyroid axis................................................................................... 4
Figure 1.3 Thyroid cancer demographic data.. ...................................................................................... 7
Figure 1.4 The Mitogen Activated Protein Kinase pathway.. ............................................................. 18
Figure 1.5 Frequency of genetic mutations in papillary and follicular thyroid cancer. ....................... 19
Figure 1.6 Disease free survival from time of diagnosis of thyroid cancer, depending on BRAF mutation status .............................................................................................................. 20
Figure 1.7 Trk-T1 mice are more prone to PTC, an effect enhanced by p27 knockout. ..................... 28
Figure 1.8 Amino acid sequence of PBF, demonstrating high conservation across species. .............. 31
Figure 1.9 Putative structure of PBF.. ................................................................................................. 32
Figure 1.10 Predicted sites of serine, threonine and tyrosine phosphorylation within PBF.. .............. 35
Figure 1.11 PBF mRNA expression is significantly higher in thyroid cancer compared to normal thyroid tissue and higher levels of PBF mRNA expression are associated with recurrent disease. .......................................................................................................... 37
Figure 1.12 Western blot demonstrating thyroid specific over-expression of PBF-HA in the PBF-Tg mouse ...................................................................................................................... 38
Figure 1.13 Thyroidal effects of PBF-HA over-expression.. .............................................................. 39
Figure 1.14 Thyroid hormone profiles in the PBF-Tg mouse compared to WT. ................................ 40
Figure 1.15 PBF and PTTG inhibit NIS expression and activity in primary thyroid cultures. ............ 43
Figure 1.16 Effect of PBF over-expression on NIS in COS-7 cells. ................................................... 44
Figure 1.17 Effects of PBF on NIS and iodide uptake in murine thyroid tissue ................................. 45
Figure 1.18 The process of triple quadrupole mass spectrometry.. ..................................................... 51
Figure 3.1 Western blot demonstrating PBF-HA transfection in K1 cells .......................................... 82
Figure 3.2 Representative FACS output from cells transfected with pMax-GFP. .............................. 83
Figure 3.3 Transfection efficiencies of K1 and TPC1 cells ................................................................. 84
Figure 3.4 Representative scan of polyacrylamide gel stained with colloidal Coomassie blue after SDS-PAGE. .................................................................................................................. 86
Figure 3.5 Flowcharts demonstrating the process by which the original list of proteins identified by MS/MS was reduced to give a final shortlist of potential interacting proteins.. ...... 89
Figure 3.6 Flowchart demonstrating the process by which the shortlist of potential binding partners was generated. ................................................................................................ 92
Figure 3.7 Amino acid sequence for PBF.. .......................................................................................... 93
Figure 4.1 Flowchart demonstrating protein elimination process for TPC1 cells. ............................ 102
Figure 4.2 Flowcharts detailing analyses of a PBF transfected run (A) and an untransfected run (B). .............................................................................................................................. 103
List of figures
vii
Figure 5.1 GST tagged pull-down assay to investigate an interaction between PBF and thyroglobulin. ............................................................................................................. 116
Figure 5.2 Thyroglobulin expression in K1 and TPC1 cells ............................................................. 118
Figure 5.3 Attempted co-immunoprecipitation of PBF and Tg in K1 cells. ...................................... 119
Figure 5.4 Western blot of human primary thyrocytes, TPC1 and K1 cells to demonstrate the expression of Tg. ........................................................................................................ 120
Figure 5.5 Co-immunoprecipitation of PBF and Tg in human primary thyroid cells. ...................... 121
Figure 5.6 Co-immunoprecipitation of PBF and Tg in homogenised human thyroid tissue.. ........... 122
Figure 5.7 Fluorescence immunocytochemistry of K1 and TPC1 cells.. .......................................... 123
Figure 5.8 Immunofluorescence of untransfected primary human thyroid culture. .......................... 123
Figure 5.9 Immunofluorescence of primary human thyroid cells transfected with PBF-HA. ........... 124
Figure 5.10 Confocal microscopy of a cross section through a PBF-transgenic mouse thyroid.. ..... 128
Figure 6.1 GST pull down assay investigating an interaction between PBF and cortactin. .............. 135
Figure 6.2 Western blot of HeLa cells demonstrating transfection with Cort-Myc-FLAG ............... 137
Figure 6.3 Cortactin-Myc-FLAG interacts with PBF-HA ................................................................. 138
Figure 6.4 PBF and cortactin do not affect expression of each other. ............................................... 139
Figure 6.5 Fluorescence immunocytochemistry demonstrating co-localisation of PBF-HA and cortactin in K1, TPC1 and HeLa cells. ....................................................................... 140
Figure 6.6 Fluorescence immunocytochemistry of three different HeLa cells. ................................. 141
Figure 6.7 Representative Western blot demonstrating knock down and over-expression of cortactin in HeLa cells. ............................................................................................... 142
Figure 6.8 Assessment of the effect of cortactin on PBF secretion by Western blotting. ................. 143
Figure 6.9 Assessment of the effect of cortactin on PBF secretion by ELISA. ................................. 145
Figure 7.1 Diagrammatic representation of SRC. .............................................................................. 153
Figure 7.2 GST pull down assay demonstarting an interaction between SRC and GST-PBF. ......... 155
Figure 7.3 Over-expression of SRC in K1, TPC1 and HeLa cell lines demonstrated by Western blot. ............................................................................................................................. 156
Figure 7.4 Over-expression of SRC does not affect PBF-HA expression. ........................................ 156
Figure 7.5 PBF-HA binds to SRC in HeLa cells in forward and reverse co-immunoprecipitation assays. ......................................................................................................................... 157
Figure 7.6 Fluorescence immunocytochemistry demonstrating co-localisation of PBF-HA and SRC in K1, TPC1 and HeLa cells. ............................................................................. 158
Figure 7.7 Fluorescence immunocytochemistry demonstrating that SRC does not affect PBF sub-cellular localisation. .................................................................................................... 159
Figure 8.1 SRC lies downstream of several receptor tyrosine kinases. ............................................. 164
Figure 8.2 Detection of pY174 by fluorescence immunocytochemistry.. ......................................... 169

List of figures
viii
Figure 8.3 SRC over-expression leads to increased phosphorylation of PBF at Y174. .................... 170
Figure 8.4 Western blot analysis of the effect of various TKIs on pY174 expression). .................... 171
Figure 8.5 SU11274 reduces pY174 expression in a dose dependant manner .................................. 173
Figure 8.6 Time course treatment of HeLa cells with SU11274 ....................................................... 175
Figure 8.7 Western blot analysis of HeLa cells transfected with PBF-HA, demonstrating an increase in pY174 with SRC over-expression and also a reduction in pY174 when treated with the SRC inhibitor PP1. ............................................................................ 176
Figure 8.8 Western blot analysis of K1, TPC1 and HeLa cells and the effect on pY174 of various tyrosine kinase inhibitors.. .......................................................................................... 177
Figure 8.9 Effect of TKIs on pY174 in human primary thyroid cultures. ......................................... 179
Figure 8.10 125I uptake in cell lines.. .................................................................................................. 181
Figure 8.11 Variation in iodide uptake between different patient cultures.. ...................................... 183
Figure 8.12 Relative 125I uptake by human primary thyrocytes in a single prep.. ............................. 184
Figure 8.13 Iodide uptake in human primary thyrocytes following transfection............................... 185
Figure 8.14 125I uptake of human primary thyrocytes after treatment with TKIs. ............................. 187
Figure 8.15 125I uptake in untransfected human primary thyrocytes treated with DMSO or PP1 for 24 hours.. .................................................................................................................... 188
Figure 8.16 125I uptake in FRTL5 cells treated with either DMSO or PP1 for 24 hours.. ................. 189
Figure 8.17 125I uptake in human primary thyrocytes transfected with either VO or PBF-HA and treated for 24 hours with DMSO or PP1 .................................................................... 190
Figure 9.1 Hypothesis regarding the secretion and phosphorylation of PBF.. ................................. 206
List of Tables
ix
LIST OF TABLES
Table 1.1 Table detailing the systemic effects of thyroid hormone. ............................................... 5
Table 1.2 Subtypes of thyroid cancer including mode of presentation and primary treatment modality. .................................................................................................................... 10
Table 1.3 Current recommendations for the reporting of thyroid FNAC specimens, with the associated risk of malignancy for each category........................................................ 12
Table 1.4 TNM staging classification for DTC ............................................................................ 13
Table 1.5 Indications for I ablation post-surgery. ..................................................................... 15
Table 1.6 Factors influencing risk of recurrence. ......................................................................... 16
Table 1.7 Association of BRAF mutation with the most aggressive characteristics of PTC. ....... 20
Table 1.8 The range of described RET rearrangements. ............................................................... 25
Table 3.1 Optimum transfection conditions for K1 and TPC1 cells. ............................................ 85
Table 3.2 Proteins identified as contaminants in MS/MS ............................................................. 87
Table 3.3 Table detailing the highest ranking non-specific interactions identified by MS/MS. ... 88
Table 3.4 Number of peptides attributed to contaminants in both test and control samples......... 90
Table 3.5 Comparison of the number of peptides attributed to contamination.. ........................... 92
Table 3.6 Summary of the optimum conditions needed for MS/MS. ........................................... 94
Table 4.1 Table demonstrating elimination process for proteins identified by MS/MS runs R3 to R5. ........................................................................................................................ 101
Table 4.2 Contamination of MS/MS samples in runs R3 to R5. ................................................. 101
Table 4.3 Table listing the proteins identified by MS/MS as most likely to interact with PBF.. 105
Table 5.1 Molecular weights of known sub-units of Tg following denaturing ........................... 126
Table 8.1 Dose and target(s) of tyrosine kinase inhibitors used ................................................. 167

Chapter 1 General Introduction
1
Chapter 1 General Introduction

Chapter 1 General Introduction
2
1.1 The Physiological Role of the Thyroid Gland
1.1.1 Thyroid structure and development
The thyroid is an important endocrine organ located in the anterior neck and is found in
all vertebrates. In humans, it originates from the base of the tongue in the 3rd to 4th week
gestation and migrates into the neck over the next few weeks. Macroscopically, it is
composed of two lobes lying on either side of the trachea and connected by an isthmus
(McGlashan 2008). Microscopically, the thyroid consists of many follicles - spheres of
cuboidal follicular epithelial cells (Figure 1.1).
Figure 1.1 A -‐ Cross-sectional structure of a thyroid follicle. B -‐ Detail of a thyroid follicular cell, showing the process by which the follicle produces thyroid hormones. I = Iodine, Tyr = Tyrosine, MIT/DIT = Mono/Di-‐iodotyrosine, T3 = Triiodothyronine, T4 = Thyroxine, MCT8 = Monocarboxylate transporter 8, NIS = Sodium iodide symporter, Lys = Lysosome, BL = baso-‐lateral, mb = membrane.

Chapter 1 General Introduction
3
There are around 3 million follicles in a healthy adult thyroid, each surrounding an area
of protein-rich colloid which forms the bulk of the mass of the thyroid. The most abundant
protein within the colloid is thyroglobulin, a 660 kDa dimeric protein synthesised in the
endoplasmic reticulum. Each follicle is surrounded by a network of capillaries and clusters of
parafollicular cells.
1.1.2 Thyroid hormone synthesis
The predominant role of the thyroid is to produce the thyroid hormones triiodothyronine
(T3) and tetraiodothyronine (“thyroxine” or T4). The synthetic pathway is complex (Figure
1.1B) and dependent on the influx of iodide into the thyroid via the sodium-iodide symporter
(NIS), a transmembrane glycoprotein located at the basolateral membrane of the thyroid
follicular cell. NIS actively transports 2 sodium ions with 1 iodide ion, resulting in an
intracellular iodide concentration up to 50 times higher than the plasma. Iodide diffuses across
the cell, and is then transported across the apical membrane into the colloid by pendrin, where
it is oxidated to iodine by thyroid peroxidase at the outer surface of the membrane. The
reactive species liberated from this reaction iodinates thyroglobulin at its tyrosyl residues. The
products of this iodination are monoiodotyrosine and diiodotyrosine, which in turn can
combine to form the thyroid hormone triiodothyronine (T3) and thyroxine (T4), still bound to
thyroglobulin. Thyroid-stimulating hormone (TSH), released from the anterior pituitary gland,
binds to the TSH receptor on the basolateral membrane, stimulating endocytosis of thyroid
hormones. T3 and T4 are liberated from thyroglobulin following the fusion of the endosomes
with lysosomes, and subsequently transported across the basolateral membrane into the
bloodstream via monocarboxylate transporter 8 (MCT8) (Di Cosmo et al. 2010; Trajkovic-
Arsic et al. 2010).

Chapter 1 General Introduction
4
The control of thyroid hormone production and secretion is via the hypothalamic-
pituitary-thyroid axis, an endocrine negative feedback loop where low circulating levels of
T3/T4 stimulate the hypothalamus to release thyrotropin releasing hormone (TRH). This
stimulates the anterior pituitary to release thyroid stimulating hormone (TSH). As well as the
effects on the secretion of T3 and T4, TSH also stimulates expression of NIS, thus acting
throughout the pathway of thyroid hormone synthesis (Dohan et al. 2003).
Figure 1.2 Hypothalamic-Pituitary-Thyroid axis. The release of TRH and TSH is under the control of a negative feedback loop by T3 and T4. TRH - Thyrotropin Releasing Hormone, TSH - Thyroid Stimulating Hormone.
1.1.3 The role of the thyroid gland in health
Both T3 and T4 are transported in the bloodstream bound primarily to thyroxine-binding
globulin, with a smaller amount bound to either thyroxine-binding albumin or para-albumin.
In the bound state, the hormones are inactive and it is therefore the free T3 and T4 (< 0.5 % of
Chapter 1 General Introduction
5
total) that exert a cellular effect. T4 has a long half-life and acts as a pro-hormone for the
biologically active T3. T4 is converted in the periphery to T3 by iodothyronine deiodinases,
and then actively transported across the cell membrane by a small number of identified
transporters, namely OATP1C1, monocarboxylate transporter (MCT) 8 and MCT10 (Visser et
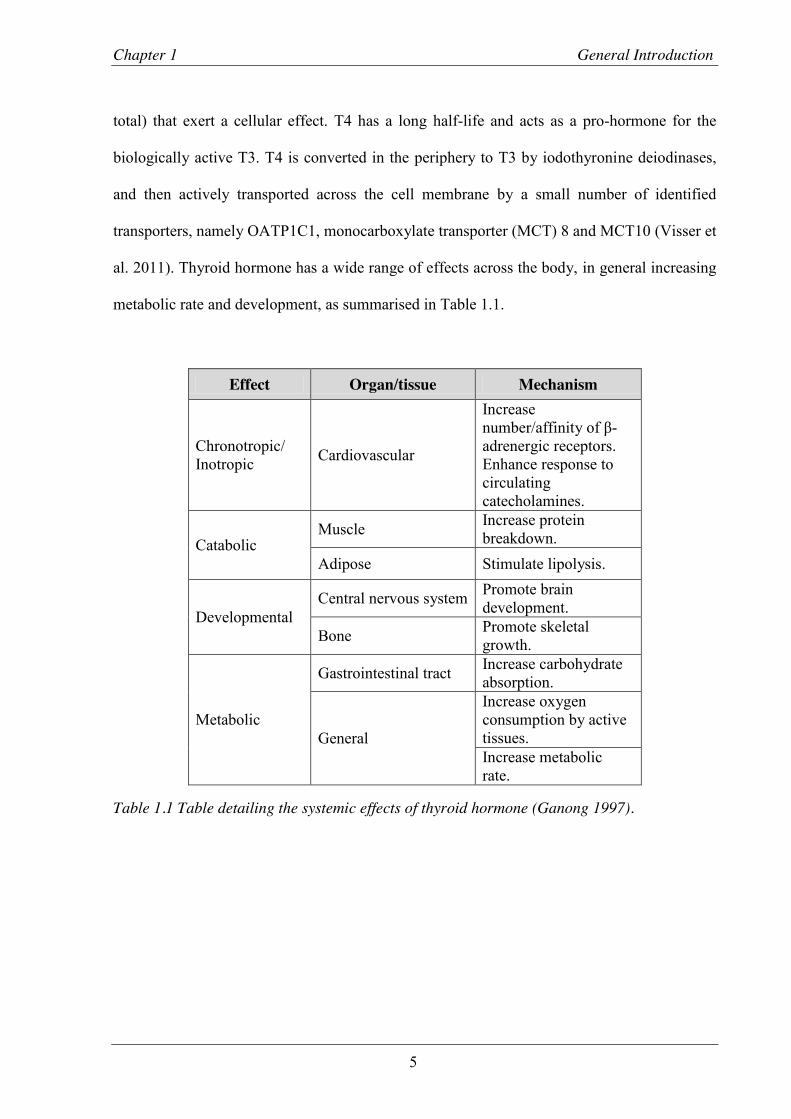
al. 2011). Thyroid hormone has a wide range of effects across the body, in general increasing
metabolic rate and development, as summarised in Table 1.1.
Effect Organ/tissue Mechanism
Chronotropic/ Inotropic Cardiovascular
Increase number/affinity of β-adrenergic receptors. Enhance response to circulating catecholamines.
Catabolic Muscle Increase protein
breakdown. Adipose Stimulate lipolysis.
Developmental Central nervous system Promote brain
development.
Bone Promote skeletal growth.
Metabolic
Gastrointestinal tract Increase carbohydrate absorption.
General
Increase oxygen consumption by active tissues. Increase metabolic rate.
Table 1.1 Table detailing the systemic effects of thyroid hormone (Ganong 1997).

Chapter 1 General Introduction
6
1.2 Thyroid Cancer
1.2.1 Incidence of Thyroid Cancer
Thyroid cancer is the commonest endocrine cancer, with an incidence of 3.6 cases per
100,000 per year in the UK. Women have a 2.5 times greater risk of developing thyroid
cancer than men (5.6 vs 2.2 per 100,000), with a peak incidence during the 4th decade (Figure
1.3A) (Cancer Research UK 2013). The incidence of differentiated thyroid cancer (DTC) has
almost tripled in the United States between 1975 and 2009, and the disease has the fastest
rising incidence of any cancer in the USA (Figure 1.3B and C) (Howlader N 2012). The exact
cause for this rise in incidence is unknown, but has been attributed to the increase in the
detection of small, early tumours (“incidentalomas”) during investigations for other
conditions (Leenhardt et al. 2004; Cooper et al. 2009), and interestingly the rise is not
associated with a corresponding rise in mortality (Figure 1.3D) (Howlader N 2012). However,
the fact that the incidence of later stage cancers is also increasing implies that more
sophisticated detection methods cannot account for the increase alone (Chen et al. 2009; Sipos
and Mazzaferri 2010).

Chapter 1 General Introduction
7
Figure 1.3 Thyroid cancer demographic data. A – Incidence of thyroid cancer per 100,000 across age groups by gender (CRUK 2013). B – USA age-adjusted incidence per 100,000 between 1975 and 2009. C – US annual percentage change in incidence of malignancy across all cancer sites. D – USA age-adjusted mortality rate per 100,000 between 1975 and 2009 (B – D from SEER data (Howlader N 2012)).
1.2.2 Risk factors for developing DTC
There are several well documented risk factors for developing thyroid cancer. One of the
most widely studied is the effect of ionising radiation on the thyroid gland in childhood. First
considered in a report of 28 childhood thyroid cancers, of whom 11 received radiation to the
thymus for respiratory obstructive symptoms (Duffy and Fitzgerald 1950), the association was
further explored over the subsequent decades (Kaplan et al. 2009). The atomic bomb

Chapter 1 General Introduction
8
survivors of Hiroshima provided a long term cohort that have been extensively studied; a
recent study has shown that the excess thyroid cancer risk of those exposed as children has
continued for over 50 years after exposure (Furukawa et al. 2013). The more recent disaster at
Chernobyl in 1986 led to a sharp increase in the number of cases of DTC in the surrounding
areas (Stsjazhko et al. 1995). Papillary carcinomas are the most frequent DTC to be associated
with radiation exposure, with chromosomal rearrangements (principally RET/PTC (35 %) and
occasionally PAX8/PPARγ (3 %)) most common, and point mutations (BRAF (15 %) and
RAS (8 %)) also present (Leeman-Neill et al. 2013). The effects of the Fukoshima disaster
following the Japanese earthquake and tsunami on the health of the surrounding prefecture
will be monitored closely over the following decades, with the World Health Organisation
predicting a 70 % increase risk of thyroid cancer in females exposed as infants (WHO 2013).
A previous history of benign hyperplastic thyroid disease increases the risk of thyroid
cancer (relative risk (RR) 14.5, P < 0.01) (Preston-Martin et al. 1987), as does a family
history of thyroid cancer. The lifetime risk of thyroid cancer in a patient with a first degree
relative diagnosed with a non-medullary thyroid cancer is 2 % (standardised incidence ratio
(SIR) 2.9, 95 % CI 2.4 to 3.4, p < 0.00001) for women and 1 % (SIR 2.5, 95 % CI 1.9 to 3.3,
p < 0.00001) for men. When 2 or more family members are affected, the SIR rises to 23.2 (95
% CI 10.6 to 44.0, p< 0.00001). The younger the family member was diagnosed with DTC,
the higher the risk of developing the disease (Fallah et al. 2013).
Thyroid cancer is more common in association with certain hereditary diseases. Familial
adenomatous polyposis coli (FAP) is an autosomal dominant pre-malignant disease caused by
mutations in the tumour suppressor gene APC. Affecting 3 to 10 per 100,000 (Half et al.
2009), patients develop a large number of colonic polyps, and there is a 100 % progression to
colorectal cancer. It is also associated with a number of extra-colonic manifestations, of which

Chapter 1 General Introduction
9
the cribriform morular variant of papillary thyroid cancer is one. The rate of thyroid cancer
amongst patients with FAP ranges from 0.4 to 11.8 % (Steinhagen et al. 2012), with a relative
risk of 7.6 (95 % CI 2.5 to 17.7) (Giardiello et al. 1993). A specific mechanism for this
association has not, as yet, been described. Cowden, and Cowden-like, syndrome, are
characterised by the development of multiple cutaneous hamartomas, and due to autosomal
dominantly inherited mutations in one or more of the PTEN, SDHx and KLLN gene. In a
cohort of 2723 patients with the syndrome, for those with a PTEN mutation the SIR for
thyroid cancer was 72 (95 % CI 51 to 99, p < 0.001) and this was disproportionally follicular
thyroid cancer. The SIR for SDHx and KLLN mutations was 63 (95% CI 42 to 92, p < 0.001)
for SDHx variants, and 45 (95% CI, 26 to 73, p < 0.001) respectively (Ngeow et al. 2011).
Chronic lymphocytic (Hashimoto’s) thyroiditis leads to an increased risk of thyroid
lymphoma (as well as systemic myeloproliferative and lympho-proliferative neoplasms
generally) but not DTC, with an estimated relative risk of 67 (p < 0.000001) (Holm et al.
1985).
1.2.3 Types of thyroid cancer
The majority of thyroid cancers arise from follicular cells and are termed differentiated
thyroid cancers (DTCs). The commonest sub-type is papillary thyroid cancer (PTC), which
accounts for approximately 70 % of all thyroid cancer and is further split into pure papillary,
follicular and mixed PTC. PTC metastasis is usually via lymphatic spread, and an involved
cervical lymph node may be the first sign of the disease in some patients (Lim et al. 2012).
Follicular thyroid cancer (FTC) accounts for around 10 – 20 % of thyroid cancers.
Unlike PTC, lymph node metastasis is rare, with blood borne spread to lungs and bone being
more common. The 2 subtypes are Minimally Invasive Follicular Carcinoma (MIFC), which
although macroscopically appearing the same as a follicular adenoma demonstrates capsular
Chapter 1 General Introduction
10
and/or vascular invasion microscopically, and Widely Invasive Follicular Carcinoma (WIFC),
which demonstrates diffuse infiltration of the thyroid gland, and a consequently poorer
survival rate.
Medullary thyroid cancer (MTC) originates from the parafollicular cells and represents
5% of thyroid cancers. There is a strong hereditary component to the disease; 25% of MTC
cases are caused by germline mutations in the RET proto-oncogene that result in multiple
endocrine neoplasia (MEN) 2A (80%), MEN 2B (5%) and familial MTC (5-15%) (Ceolin et
al. 2012). The cancers secrete calcitonin (used as a serum marker for the disease), which can
cause the characteristic flushing and diarrhoea associated with the disease.
Anaplastic, or de-differentiated, thyroid cancer typically presents later in life and is
associated with rapid mitosis and high rate of lympho-vascular invasion. It accounts for
around 5 % of all thyroid cancers and is almost universally fatal (Ain 1998).
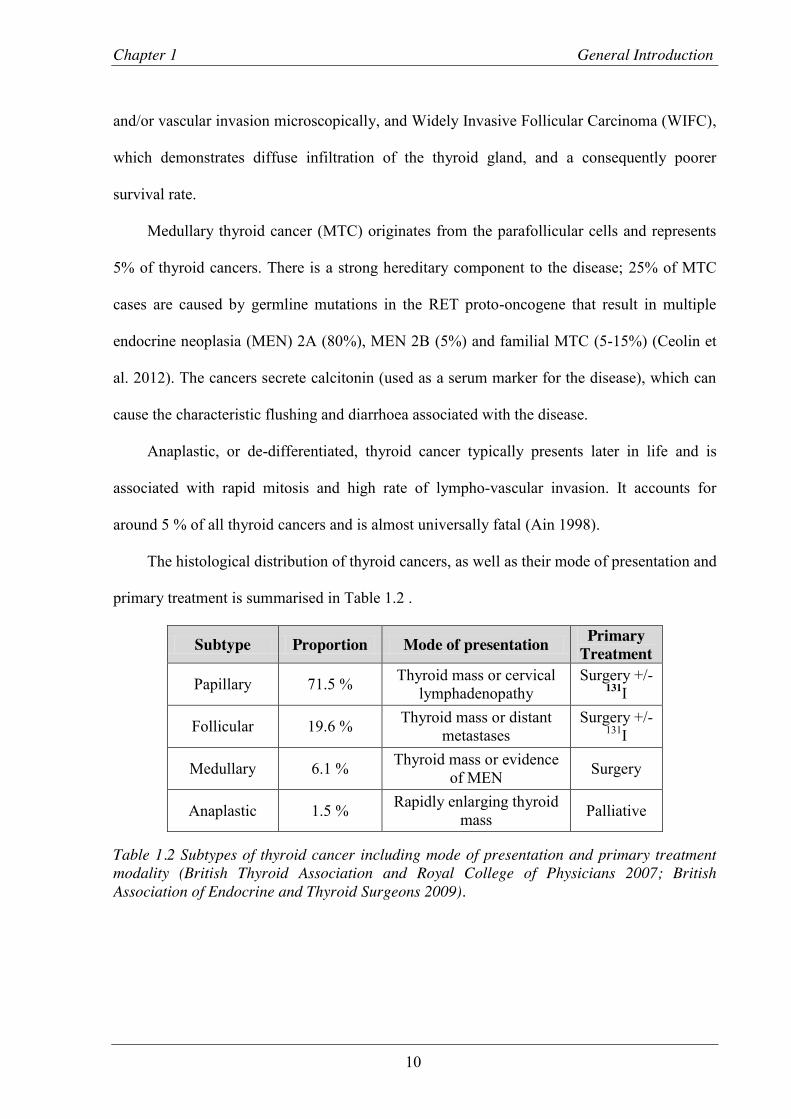
The histological distribution of thyroid cancers, as well as their mode of presentation and
primary treatment is summarised in Table 1.2 .
Subtype Proportion Mode of presentation Primary Treatment
Papillary 71.5 % Thyroid mass or cervical lymphadenopathy
Surgery +/- 131I
Follicular 19.6 % Thyroid mass or distant metastases
Surgery +/- 131I
Medullary 6.1 % Thyroid mass or evidence of MEN Surgery
Anaplastic 1.5 % Rapidly enlarging thyroid mass Palliative
Table 1.2 Subtypes of thyroid cancer including mode of presentation and primary treatment modality (British Thyroid Association and Royal College of Physicians 2007; British Association of Endocrine and Thyroid Surgeons 2009).

Chapter 1 General Introduction
11
1.2.4 Diagnosing thyroid cancer
The commonest presentation of DTC is a solitary thyroid nodule (STN), which may
have been identified by the patient or their general practitioner, or incidentally when the
patient was being investigated for an unrelated problem. Once identified, the usual method of
assessment of a STN is via ultrasonography and fine needle aspiration cytology (FNAC).
There are a number of ultrasound characteristics that suggest a malignant nodule as opposed
to a benign diagnosis: microcalcifications, irregular nodule margins, parenchymal
hypoechogenicity, increased nodule vascularity and abnormal neck lymphadenopathy
(Alexander 2008). However, none of these are definitive.
FNAC aims to provide a cellular sample from the nodule in question, thus allowing a
cytological analysis with the aim of determining if the nodule is benign or malignant. FNAC
can be performed using palpation alone or via ultrasound guidance; the latter is associated
with higher “hit” rates and more reliable diagnosis, as the ultrasonographer is able to target
the needle to the most suspicious area. FNAC results are split into 5 broad categories (see
Table 1.3), known as the “Thy” classification.

Chapter 1 General Introduction
12
RCPath modified BTA nomenclature
Description Risk of
malignancy (%)
Thy1 Non-diagnostic (virtually acellular) 0-10
Thy1c Non-diagnostic- Cystic lesion
Thy2 Non-neoplastic (Consistent with a benign
follicular nodule or lymphocytic thyroiditis or subacute thyroiditis) 0-3
Thy 2c Non-neoplastic, cystic lesion
Thy3a Neoplasm possible- atypia 5-15
Thy3f Neoplasm possible- suggestive of follicular neoplasm 15-30
Thy4 Suspicious for papillary/ medullary/ metastatic/lymphoma/carcinoma 60-75
Thy5 Malignant 97-100
Table 1.3 Current recommendations for the reporting of thyroid FNAC specimens, with the associated risk of malignancy for each category (British Thyroid Association and Royal College of Physicians 2007; RCPath 2009).
In general, if a Thy2 result is obtained from FNAC, the patient will go on to have a
repeat sample taken, usually at an interval of 3 to 6 months, and only if this is again benign
will this be taken as a valid result. On the other end of the scale, a Thy5 result mandates at
least a hemi-thyroidectomy (see section 1.2.5.2). Difficulties arise in the problematic area of
the Thy3 result. It is not possible for a cytologist to determine whether follicular cells in a
sample represent a benign follicular adenoma or the malignant follicular carcinoma, and
therefore these results are classed as indeterminate. Most centres will proceed with a
“diagnostic lobectomy”, removing the half of the thyroid gland containing the suspicious
nodule and thereby allowing a full histological diagnosis. The rate of malignancy in Thy3
FNACs is approximately 28 %, although the risk increases at ages less than 30 and greater
than 60 years, in males, and for larger nodules (Mihai et al. 2009). This results in a large
Chapter 1 General Introduction
13
number of patients undergoing surgery for what is in fact a benign disease, and over a quarter
of patients requiring a second operation for what proves to be malignancy. At present, studies
are underway to utilise biomarkers or mutation analysis of FNAC samples in an attempt to
improve the diagnostic accuracy of these indeterminate results.
1.2.5 Management of differentiated thyroid cancer
1.2.5.1 Staging
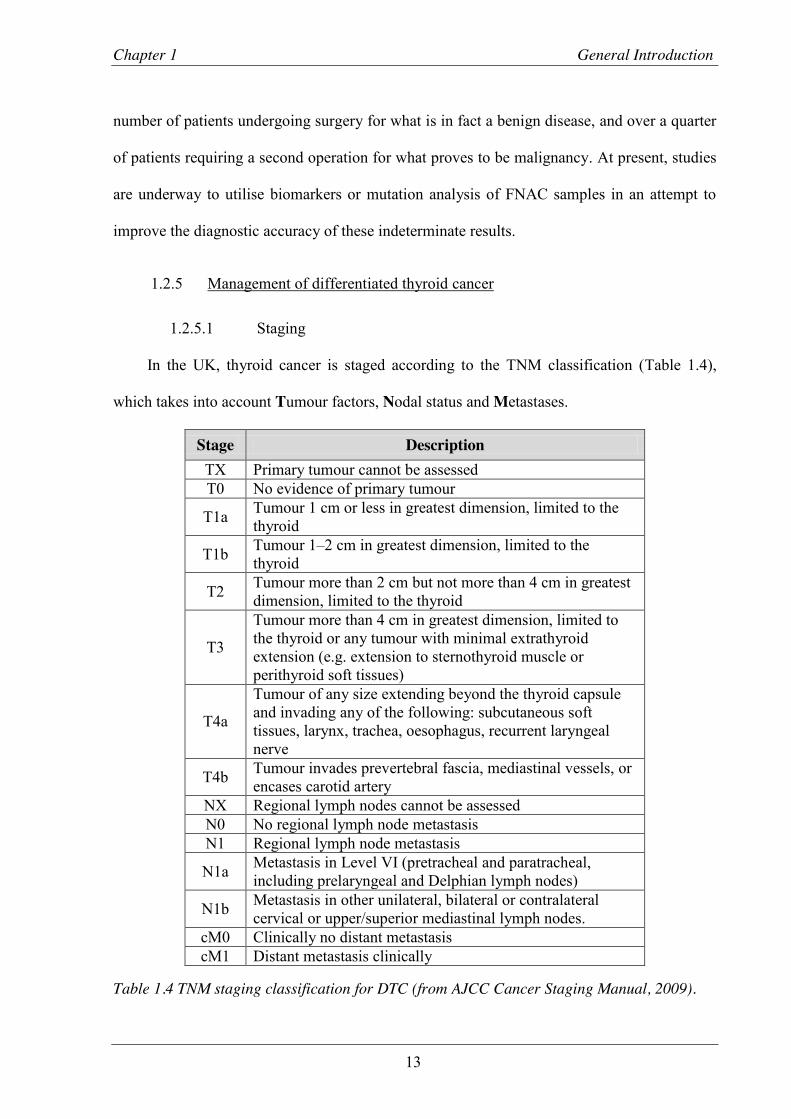
In the UK, thyroid cancer is staged according to the TNM classification (Table 1.4),
which takes into account Tumour factors, Nodal status and Metastases.
Stage Description TX Primary tumour cannot be assessed T0 No evidence of primary tumour
T1a Tumour 1 cm or less in greatest dimension, limited to the thyroid
T1b Tumour 1–2 cm in greatest dimension, limited to the thyroid
T2 Tumour more than 2 cm but not more than 4 cm in greatest dimension, limited to the thyroid
T3
Tumour more than 4 cm in greatest dimension, limited to the thyroid or any tumour with minimal extrathyroid extension (e.g. extension to sternothyroid muscle or perithyroid soft tissues)
T4a
Tumour of any size extending beyond the thyroid capsule and invading any of the following: subcutaneous soft tissues, larynx, trachea, oesophagus, recurrent laryngeal nerve
T4b Tumour invades prevertebral fascia, mediastinal vessels, or encases carotid artery
NX Regional lymph nodes cannot be assessed N0 No regional lymph node metastasis N1 Regional lymph node metastasis
N1a Metastasis in Level VI (pretracheal and paratracheal, including prelaryngeal and Delphian lymph nodes)
N1b Metastasis in other unilateral, bilateral or contralateral cervical or upper/superior mediastinal lymph nodes.
cM0 Clinically no distant metastasis cM1 Distant metastasis clinically
Table 1.4 TNM staging classification for DTC (from AJCC Cancer Staging Manual, 2009).

Chapter 1 General Introduction
14
In DTC, the disease is further staged by the patient’s age to allow prognostication (see
section 1.2.6).
1.2.5.2 Surgery
At present, the only definitive way of treating DTC is with surgery to remove all or part
of the thyroid gland, affected lymph nodes and metastases. In the past, there was a tendency to
perform sub-total thyroidectomy (leaving a significant portion of the gland behind in an
attempt to preserve the recurrent laryngeal nerve (RLN)) but this was shown to increase
recurrence rates when compared to total or near-total thyroidectomy. The main complications
from the surgery are damage to the RLNs (resulting in voice change or in extreme cases
airway compromise and respiratory embarrassment requiring tracheotomy) and/or parathyroid
glands (resulting in temporary or permanent hypoparathyroidism); although in experienced
hands these should occur in only a small number of cases. As more DTCs (in particular PTCs)
with a diameter less than 10 mm are diagnosed, more centres are treating these with thyroid
lobectomy. While this undoubtedly reduces complications, studies have shown that between
30 and 46 % of PTCs are multifocal and contralateral (Ricci and Alfonso 2012; Lee et al.
2013), meaning that some of these patients will have residual foci of malignancy in the neck
following surgery.
1.2.5.3 Radioiodine ablation
Given the thyroid’s ability to concentrate iodine, radioiodine ablative therapy has been
used since the 1940s to treat thyroid disease (Miller and Soley 1948). The isotope used in
thyroid cancer treatment is iodine-131 ( I). This has a decay half-life of around 8 days, and
emits both gamma (10 %) and beta (90 %) radiation. The isotope can therefore be imaged
using gamma-readers, although it is not possible to detect the beta emissions. It is the latter
that facilitates the death of thyroid tissue where it is taken up.
Chapter 1 General Introduction
15
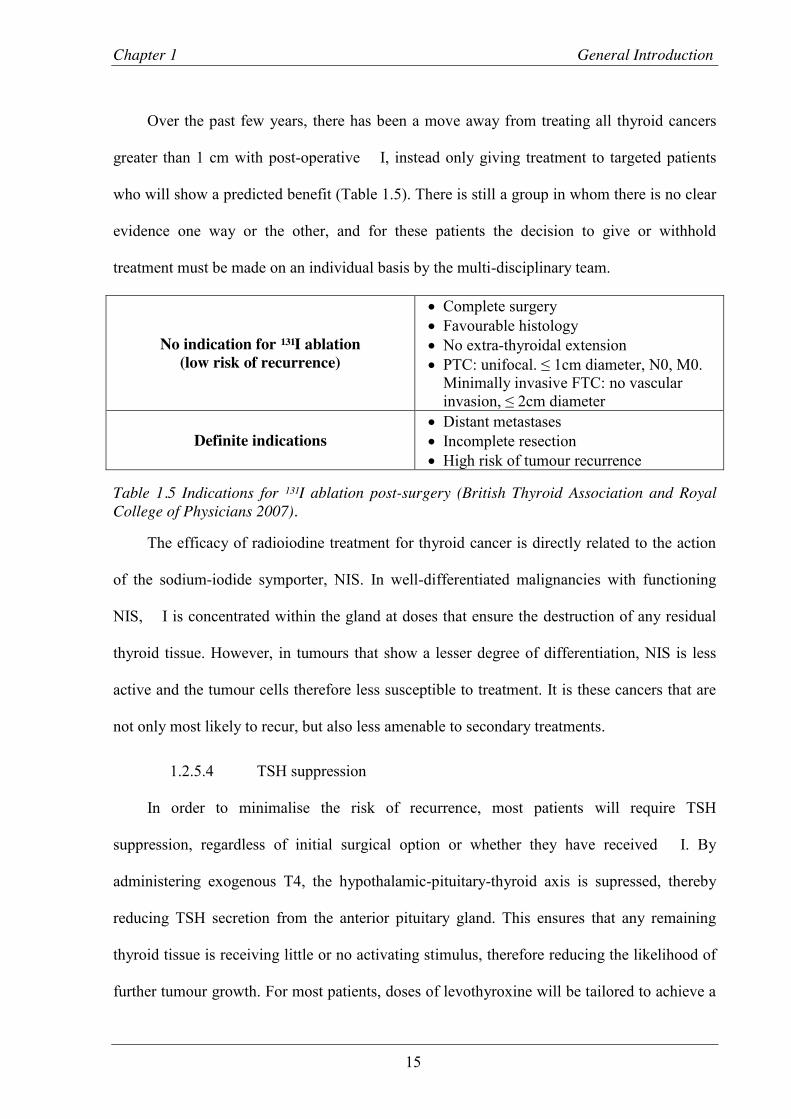
Over the past few years, there has been a move away from treating all thyroid cancers
greater than 1 cm with post-operative I, instead only giving treatment to targeted patients
who will show a predicted benefit (Table 1.5). There is still a group in whom there is no clear
evidence one way or the other, and for these patients the decision to give or withhold
treatment must be made on an individual basis by the multi-disciplinary team.
No indication for ¹³¹I ablation (low risk of recurrence)
x Complete surgery x Favourable histology x No extra-thyroidal extension x PTC: unifocal. ≤ 1cm diameter, N0, M0.
Minimally invasive FTC: no vascular invasion, ≤ 2cm diameter
Definite indications x Distant metastases x Incomplete resection x High risk of tumour recurrence
Table 1.5 Indications for ¹³¹I ablation post-surgery (British Thyroid Association and Royal College of Physicians 2007).
The efficacy of radioiodine treatment for thyroid cancer is directly related to the action
of the sodium-iodide symporter, NIS. In well-differentiated malignancies with functioning
NIS, I is concentrated within the gland at doses that ensure the destruction of any residual
thyroid tissue. However, in tumours that show a lesser degree of differentiation, NIS is less
active and the tumour cells therefore less susceptible to treatment. It is these cancers that are
not only most likely to recur, but also less amenable to secondary treatments.
1.2.5.4 TSH suppression
In order to minimalise the risk of recurrence, most patients will require TSH
suppression, regardless of initial surgical option or whether they have received I. By
administering exogenous T4, the hypothalamic-pituitary-thyroid axis is supressed, thereby
reducing TSH secretion from the anterior pituitary gland. This ensures that any remaining
thyroid tissue is receiving little or no activating stimulus, therefore reducing the likelihood of
further tumour growth. For most patients, doses of levothyroxine will be tailored to achieve a

Chapter 1 General Introduction
16
serum TSH of less than 0.1 mIU/L, however for lower risk patients a measurable level below
the reference range (i.e. 0.1 – 0.5 mIU/L) may be maintained with no increase in risk of
recurrence.
1.2.6 Prognosis
The prognosis of appropriately managed DTC is favourable, with many patients being
classed as “cured”. Unfortunately, cancers have been known to recur many years following
treatment and therefore lifelong surveillance is mandatory.
1.2.6.1 Recurrence
The American Thyroid Association stratifies patients into low, intermediate and high
risk of recurrence (Table 1.6). Despite the generally good prognosis, the overall recurrence
rate for DTC is 30 % at 30 years (Mazzaferri and Jhiang 1994), although this risk may be
reduced by radioiodine ablation, TSH suppression and prophylactic central neck dissection
(McLeod et al. 2013).
Low risk Intermediate risk High risk
x No metastatic spread (local/distant)
x Full macroscopic resection x No locoregional invasion x Non-aggressive histology x No I uptake outside of
the thyroid bed
x Microscopic invasion into perithyroidal soft tissues
x Cervical lymph node metastases
x Aggressive histology x Uptake of I outside of
the thyroid bed
x Macroscopic tumour invasion
x Incomplete resection x Distant metastases x Increase thyroglobulin out
of proportion to post-treatment scan
Table 1.6 Factors influencing risk of recurrence (Cooper et al. 2009).
Recurrence is most often in the thyroid bed, although the exact cause is often unknown.
Factors associated with recurrence include extra-thyroidal extension of the primary tumour,
bulky nodal metastatic lesions, macroscopic local invasion, and aggressive histologic
subtypes; inadequate primary surgery may also contribute (Shaha 2012). Although recurrent

Chapter 1 General Introduction
17
DTC are less radioiodine avid than primary tumours, there is still a role for radioiodine,
especially in combination with surgery, either as a pre-operative debulking tool or a post-
operative ablative technique. Metastases are most common in the neck, either in the central
and lateral compartment; distant metastases occur predominantly in the lung or bones (79 %)
(Jin et al. 2013).
1.2.6.2 Mortality
The 5 year survival for thyroid cancer is 98.9 % below the age of 65 years, although this
drops to 91.1 % after this; the mortality rate has risen slightly over the last 15 years in the
USA from 0.44 to 0.51 per 100,000 per year (Howlader N 2012). The reason behind the
relatively stable mortality rate despite the rising incidence is that DTC is being diagnosed
much earlier, allowing more successful treatment. There are, however, a significant cohort of
patients for whom the diagnosis is made after disease progression, and it is in this group that
the majority of the early mortality (less than 5 years from diagnosis) occurs. Late mortality is
often due to an increased aggressiveness, difficulty in resection and lack of response to
adjuvant therapies of recurrent tumours.
1.3 The molecular basis of thyroid cancer
1.3.1 Oncogenes and thyroid cancer
Most malignant thyroid tumours are monoclonal in origin, meaning that genetic
alterations in a single cell within an otherwise healthy thyroid gland are responsible for the
disease. These alterations may reflect activating mutations of oncogenes or inactivation of
tumour suppressor genes.

Chapter 1 General Introduction
18
1.3.1.1 Mitogen-Activated Protein Kinase Pathway
The MAPK pathway, also known as the RAS-RAF-MEK-ERK pathway, is an important
cascade that allows signalling from a cell surface receptor to trigger nuclear transcription, and
thereby govern key cellular events (Figure 1.4).
Uncontrolled activation of the pathway is a feature of many cancers and this is often
brought about by mutation of its constituent kinases. These mutually exclusive mutations are
found in approximately 75 % of PTCs and 70 % of FTCs (Figure 1.5) (Bhaijee and Nikiforov
2011).
Figure 1.4 The Mitogen Activated Protein Kinase pathway. Binding of a growth factor (GF) to a receptor tyrosine kinase (RTK) leads to the subsequent interaction with Growth Factor Receptor Bound protein (GRB) 2 via its SH3 site. GRB2 then binds Son of Sevenless (SOS), which facilitates a guanine exchange, converting RAS-GDP to RAS-GTP. This triggers a cascade of phosphorylation reactions culminating in a number of key nuclear events.

Chapter 1 General Introduction
19
Figure 1.5 Frequency of genetic mutations in papillary and follicular thyroid cancer (Bhaijee and Nikiforov 2011).
1.3.1.2 Point mutations
1.3.1.2.1 BRAF
There are 3 RAF genes - A, B and C – the corresponding proteins of which are
serine/threonine kinases. BRAF mutations have been identified in many human cancers
(Davies et al. 2002), the commonest of which is the point mutation T1799A, which leads to
the amino acid change V600E. This leads to oncogenic activation of the BRAF kinase. BRAF
mutation occurs in 44 % of PTC and 24 % of papillary derived ATC, but does not occur in
FTC, MTC or benign thyroid disease such as thyroid adenomas or hyperplasia (Xing 2005).
PTCs displaying the BRAF mutation are more aggressive, showing lymph node spread, extra-
thyroidal invasion, distant metastases (Xing 2007) (Table 1.7) and loss of radioiodine avidity
(Xing et al. 2005).

Chapter 1 General Introduction
20
Clinicopathologic characteristic
Odds Ratio with BRAF mutation (95% confidence
interval)
Lymph node metastases 1.83 (1.58-2.13)
Extra-thyroidal invasion 2.50 (2.11-2.97)
Disease stage III or IV 2.14 (1.79-2.56)
Table 1.7 Association of BRAF mutation with the most aggressive characteristics of PTC (Xing 2007).
Recurrence is also more likely in the presence of BRAF mutation (odds ratio 2.65, p <
0.001 (Xing 2007)) and is associated with a reduced disease free survival (Figure 1.6) (Kim et
al. 2006). The increased recurrence rates are valid even when taking into account the poor
prognostic factors detailed above.
Figure 1.6 Disease free survival from time of diagnosis of thyroid cancer, depending on BRAF mutation status, taken from Kim et al. 2006.

Chapter 1 General Introduction
21
In vivo work also confirms that BRAFV600E induces thyroid enlargement and PTC, with
one study of transgenic mice expressing this mutation demonstrating carcinomas in 14 of 15
mice by 12 weeks, most with an aggressive phenotype (Knauf et al. 2005). Further work has
suggested that TSH plays a key role in inducing BRAFV600E PTC, with oncogenic BRAF
knock-in mice requiring the TSH receptor in order to transform thyroid follicular cells
(Franco et al. 2011).
This link between BRAF mutation and aggressiveness of tumour phenotype has
prompted research into both the therapeutic significance and diagnostic and prognostic value
of the mutation. Using siRNA, BRAF knockdown in human ATC cell lines in vitro reduced
the phosphorylation of downstream proteins in the MAPK cascade as well as significantly
reducing their growth. This was then replicated using BAY 43-9006, a small molecule RAF
kinase inhibitor (Salvatore et al. 2006), thus demonstrating that these compounds may be
effective in treatment for ATC containing the BRAFV600E mutation. For diagnostic purposes,
Xing et al used both direct DNA sequencing and a colorimetric mutation detection method to
identify the BRAFV600E mutation in pre-operative FNAC samples from patients undergoing
thyroidectomy for nodular thyroid disease (Xing et al. 2004). Of those patients with a final
diagnosis of PTC, 50 % were positive for BRAFV600E, whereas no patients with other
malignancies or benign thyroid disease harboured the mutation. While this would not be
useful for those patients in whom a follicular neoplasm is suspected (see Section 1.2.4), it
may aid the planning of the extent of surgery in patients with a possible or confirmed
diagnosis of PTC. Yip et al compared 106 BRAF-positive to 100 BRAF-negative PTC
patients, the majority of which were identified post-operatively. Significantly more of the
former group required further surgery for persistent/recurrent disease (p = 0.04), with the

Chapter 1 General Introduction
22
authors suggesting that had the BRAF status been known pre-operatively, 24 % of patients
would have had more extensive surgery at initial operation (Yip et al. 2009).
1.3.1.2.2 RAS
The RAS proteins are another family involved in cell growth and proliferation. Named
after the “Rat sarcoma” virus, they were first discovered as proteins encoded by retroviral
oncogenes. Subsequently, these were shown to be constitutively activated by point mutations.
The RAS family are GTP-binding proteins, with different subsets controlling different aspects
of cell behaviour. RAS carries out its normal functions when localised to the cytosolic surface
of the cell membrane, and is involved in the MAPK cascade (see Figure 1.4). Inactive RAS is
bound to guanosine diphosphate (GDP) and is converted to the active, GTP bound protein, by
guanine nucleotide exchange factors, two of the most studied of which are Son of Sevenless
(SOS) 1 and 2. Following the activation of receptor tyrosine kinases, GRB2 binds via its SH2
domain to the TKR and then via its SH3 domain to SOS1/2. This brings SOS1/2 into
proximity with RAS and via nucleotide exchange brings about the conversion of GDP to
GTP. Activated RAS then continues to signal downstream via the MAPK pathway.
Approximately 20 % of malignancies involve a mutation in one of the RAS genes (Bos
1989). The three RAS genes most frequently involved in human tumour formation are HRAS,
KRAS and NRAS, with point mutations in codons 12, 13 or 61 leading to aberrant activation
and uncontrolled stimulation of the cellular proliferation pathways. RAS mutations are found
in both papillary and follicular thyroid cancers, although are more common in FTC. However,
mutations are also found in almost 50 % of follicular adenomas (Nikiforova et al. 2003); in
both carcinomas and adenomas the predominant mutation is in NRAS codon 61. This implies
that RAS activation alone is insufficient to cause malignancy, but does sensitise the tumour to
other genetic alterations. The high prevalence of RAS mutations in follicular adenomas may
Chapter 1 General Introduction
23
also suggest that these tumours are not completely benign, but may represent a pre-cancerous
stage in FTC development. A study of poorly-differentiated thyroid cancers reported that in a
cohort of 65 patients, NRAS codon 61 mutations were the most common genetic alteration
present (15/65, 23 %). This was in contrast to the PTC “markers”: BRAF mutations (1/65, < 1
%), PAX8/PPARγ translocation (0/65, 0 %) and RET/PTC re-arrangement (0/65, 0 %)
(Volante et al. 2009). The authors suggest that these findings indicate that RAS mutation is a
key step in the progression to poorly-differentiated thyroid cancer, more so than the other well
recognised mutations. However, in their cohort there were 49 patients in whom none of the
above mutations was identified. This implies that their testing was limited, and that wider
screening may identify an oncogene that is more important, and that again RAS mutation is
merely acting as a sensitising precursor to progression.
Studies examining the RAS pathway as a therapeutic target in the treatment of cancer are
on-going. Farnesyltransferase (FTase) adds the 15-carbon isoprenoid group to the C terminal
of RAS, thus ensuring its localisation to the plasma membrane, and was therefore an obvious
target for inhibition. Unfortunately, due to the ability of other transferases to modify RAS,
inhibition of FTase alone did not result in an inhibition of tumour growth. However, when
used in combination with the EGFR inhibitor Gefitinib, the FTase inhibitor Tipifarnib
reduced the viability of C-643 cells (thyroid follicular cells with HRAS point mutations at
codons 12 and 61), with a corresponding reduction in the phosphorylation of the downstream
effector ERK (Frasca et al. 2013). As the majority of RAS mutations in thyroid tumours
involve KRAS and NRAS, with only a few involving HRAS, the clinical relevance of this
observation may be small.
Chapter 1 General Introduction
24
1.3.1.3 Rearrangements
1.3.1.3.1 RET/PTC
RET (REarranged during Transfection) is a proto-oncogene located on chromosome
10q11.2 that encodes a receptor tyrosine kinase (RTK), which acts as a receptor for the glial
cell line-derived neurotrophic factor (GDNF) family of ligands (GFLs). GFLs are involved in
cell survival, differentiation and migration and specifically in neurite outgrowth. Alteration in
RET can lead to thyroid cancers in 2 different ways. As wild-type RET in the thyroid gland is
predominantly found in parafollicular C cells, it follows that activating mutations will result
in C cell hyperplasia and ultimately medullary thyroid cancer (MTC). Indeed, point mutation
in exon 16 is found in 95 % of patients with Multiple Endocrine Neoplasia type 2B (MEN
2B), of which MTC is a feature (Martucciello et al. 2012). The second mechanism is via
chromosomal re-arrangement. Wild type RET harbours an extracellular, transmembrane, and
intracellular tyrosine kinase domain. In RET/PTC rearrangements, chromosomal
translocations in intron 11 fuse the kinase domain with an activating gene. There are three
major types of RET rearrangement; RET/PTC1 and 3 are paracentric inversions involving
another gene on chromosome 10q while RET/PTC2 is between chromosomes 10 and 17. An
additional 8 rearrangements have been described, most of which are associated with radiation
exposure (Table 1.8).

Chapter 1 General Introduction
25
Name Activating gene Location
RET/PTC1 H4 10q21
RET/PTC2 RIα 17q23
RET/PTC3 ELE1 10q11.2
RET/PTC4 ELE1 (different breakpoint) 10q11.2
RET/PTC5 GOLGA5 14q
RET/PTC6 HTIF1 7q32
RET/PTC7 RFG7 1p13
RET/PTC8 KTN1 14q22.1
RET/ELKS ELKS 12p13
RET/RFG8 RFG8 18q21-22
RET/PCM-1 PCM-1 8p21-22
Table 1.8 The range of described RET rearrangements, with corresponding activating gene and its chromosomal location (Nikiforov 2002).
As these re-arrangements are lacking the transmembrane domain of RET, the protein
product can be located in different subcellular locations, and therefore can produce different
effects. Of the three main re-arrangements, thyroidal over-expression of RET/PTC1 and 3 in
mice has been shown to result in papillary thyroid cancer formation (Santoro et al. 1996;
Powell et al. 1998). The prevalence of RET/PTC varies widely by location and this is
compounded by differences in testing measures. In Caucasian adults and children with no
history of radiation exposure, the prevalence of RET/PTC in papillary thyroid carcinomas is
around 35 %, with RET/PTC1 being the most common. Both RET/PTC1 and 3 are present in
PTCs associated with radiation exposure after the Chernobyl disaster (22 % and 13 % of
tumours respectively (Leeman-Neill et al. 2013)). RET/PTC3 containing cancers are more
likely to develop early than RET/PTC1, and are associated with more aggressive clinical
behaviour (Ciampi and Nikiforov 2007).

Chapter 1 General Introduction
26
Numerous strategies have been implemented to use RET as a therapeutic target, not just
in thyroid cancer but in tumourigenesis in general. These have been developed to target
different steps in the RET pathway, from ligand binding to recruitment of adaptor proteins (de
Groot et al. 2006), but none are yet in clinical use.
1.3.1.3.2 PAX8/PPARγ
The Paired Box Gene 8 (PAX8) / Peroxisome proliferator-activated receptor gamma
(PPARγ) fusion protein is brought about by a translocation between chromosomes 2 and 3
(t(2;3)(q13;p25)). It was identified first in 5 of 8 follicular thyroid cancers (Kroll et al. 2000),
and the prevalence is thought to be approximately 20 – 60 % in FTC (Dwight et al. 2003;
Bhaijee and Nikiforov 2011). The prevalence of the translocation in follicular adenoma is
contentious, with reports ranging from 0 – 4 % (Nikiforova et al. 2002; French et al. 2003;
Nikiforova et al. 2003; Hibi et al. 2004), although these tumours may represent pre-malignant
FTCs, merely lacking capsular or vascular invasion (Dwight et al. 2003). FTCs expressing the
PAX8/PPARγ fusion tend to affect younger patients, be smaller in size, and exhibit more
vascular invasion compared to those without (French et al. 2003; Nikiforova et al. 2003). It is
found in a small number of PTCs, possibly linked to radiation exposure (Leeman-Neill et al.
2013).
Given that PAX8/PPARγ is relatively specific to FTC, testing fine needle aspiration
cytology specimens for the re-arrangement, with the aim of differentiating those patients with
benign and malignant follicular lesions, has been attempted, with mixed results (Ferraz et al.
2012; Pauzar et al. 2012). While the absence of the re-arrangement does not denote benign
disease, the presence indicates a much higher probability of malignancy, or at least atypical
follicular adenoma, and therefore this strategy may prove useful in the future when deciding
which patients should receive radical, as opposed to diagnostic, surgery.
Chapter 1 General Introduction
27
As a therapeutic target, both PAX8 and PPARγ have shown promise, although the aim is
restoration of function rather than inhibition as both proteins increase the degree of
differentiation of thyroid follicular cells. In K1 and F133 thyroid cell lines, transfection with
PAX8 significantly increased 125II uptake and reduced cell survival after radioiodine therapy
(Mu et al. 2012). Treatment with PPARγ agonists increases anaplastic thyroid cancer
differentiation in vivo (Aiello et al. 2006), and murine studies also support a potential in vivo
application (Dobson et al. 2011)
1.3.1.3.3 TRK
TRK oncogenes are the result of mutation of the NTRK1 gene. This encodes the
neurotrophic tyrosine kinase receptor type 1 (TRK1), a receptor for nerve growth factor, NGF
(Kaplan et al. 1991). This plays a role in cell differentiation and sensory neuronal pathway
development, as well as proliferation of keratinocytes and lymphocytes (Di Marco et al.
1993). The oncogenes are the result of activating translocations and are associated with
papillary thyroid cancer. There are 4 described re-arrangements, the most common of which is
the fusion between NTRK1 and TPM3 (Greco et al. 2010).
Transgenic mice with the Trk-T1 oncogene under the control of the thyroglobulin
promoter have been shown to develop hyperplasia and papillary carcinoma at a young age (4
and 6 of 26 mice respectively under 7 months of age), with 100 % of older mice having either
hyperplasia or PTC (2 and 7 of 9 mice) (Russell et al. 2000). Unfortunately this study did not
comment on the frequency of disease in wild type mice. However, another group examined
the effect on the thyroid when the Trk-T1 mouse was crossed with the p27-null mouse strain
(Fedele et al. 2009), which develop multi-organ hyperplasia, lung/GIT/gonadal tumours but
no thyroid tumours (Fero et al. 1996). An increase in the percentage of papillary thyroid
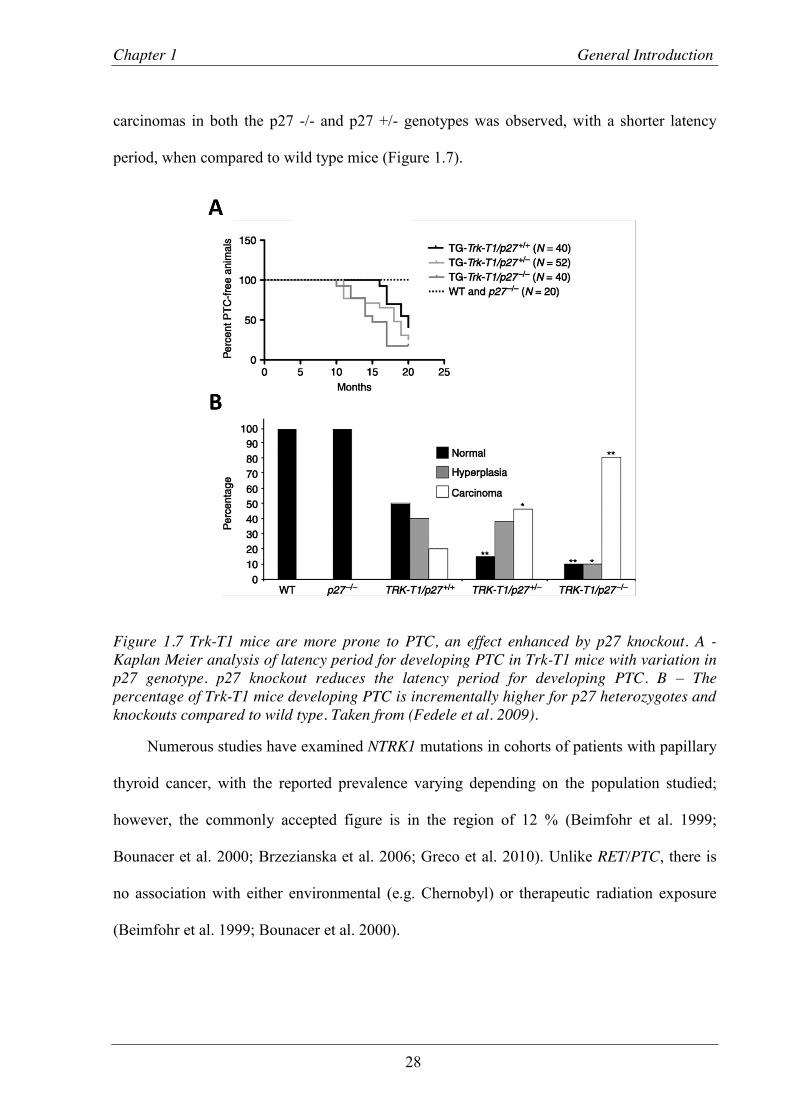
Chapter 1 General Introduction
28
carcinomas in both the p27 -/- and p27 +/- genotypes was observed, with a shorter latency
period, when compared to wild type mice (Figure 1.7).
Figure 1.7 Trk-T1 mice are more prone to PTC, an effect enhanced by p27 knockout. A - Kaplan Meier analysis of latency period for developing PTC in Trk-T1 mice with variation in p27 genotype. p27 knockout reduces the latency period for developing PTC. B – The percentage of Trk-T1 mice developing PTC is incrementally higher for p27 heterozygotes and knockouts compared to wild type. Taken from (Fedele et al. 2009).
Numerous studies have examined NTRK1 mutations in cohorts of patients with papillary
thyroid cancer, with the reported prevalence varying depending on the population studied;
however, the commonly accepted figure is in the region of 12 % (Beimfohr et al. 1999;
Bounacer et al. 2000; Brzezianska et al. 2006; Greco et al. 2010). Unlike RET/PTC, there is
no association with either environmental (e.g. Chernobyl) or therapeutic radiation exposure
(Beimfohr et al. 1999; Bounacer et al. 2000).
Chapter 1 General Introduction
29
There are no effective therapies targeting this gene in the treatment of thyroid cancer,
and there is less focus on their development, likely due to the lower frequency at which it is
found in both sporadic and radiation induced PTC when compared to RET/PTC. Studies have
investigated the potential of NTRK1 mutation testing to improve the detection of malignancy
in thyroid nodule aspirates (Sapio et al. 2007; Cantara et al. 2010). While valid in theory,
these have not translated into a clinical use due to zero pick up rate of the mutation in patient
cohorts studied.
1.3.1.4 p53
In contrast to many other solid organ malignancies, the tumour suppressor gene p53 is
rarely mutated in well-differentiated thyroid cancer. It is, however, frequently mutated in
poorly differentiated and undifferentiated (anaplastic) thyroid cancer (Donghi et al. 1993;
Fagin et al. 1993). This loss of p53 function is thought to be a trigger of progression from
well- to poorly-differentiated carcinoma (Nikiforov 2004) (especially if co-existing with a
mutation such as RET/PTC (Quiros et al. 2005)). Reports are conflicted as to whether re-
introduction of p53 into p53-mutant cells is able to rescue the phenotype (Moretti et al. 1997;
Blagosklonny et al. 1998), and if not this suggests that other factors continue to drive tumour
growth once de-differentiation has occurred.
1.3.1.5 PTEN
PTEN is a protein phosphatase and acts as a tumour suppressor by inhibiting the
AKT/PI3K pathway. It dephosphorylates PIP3, an upstream effector in the pathway, thus
preventing AKT induced cell growth and proliferation (Chu and Tarnawski 2004). Loss of
PTEN function is associated with a wide range of human malignancies, including follicular
thyroid cancer. A thyroid specific Pten knockout mouse model (Pten -/-) develops follicular
adenomas by 10 months of age (Yeager et al. 2007), and when followed up half of all females

Chapter 1 General Introduction
30
developed invasive follicular carcinomas, while the remainder had either follicular adenomas
or hyperplasia (Antico-Arciuch et al. 2010). Methylation, and associated inactivation, of
PTEN is linked with greater degrees of de-differentiation in human thyroid tumours (Hou et
al. 2008), thus implicating PTEN in the progression of thyroid tumours.
1.4 PTTG-Binding Factor (PBF)
1.4.1 Physiology
PBF was first identified as a binding partner of the pituitary tumor transforming gene,
PTTG (Chien and Pei 2000). PTTG acts as a securin, inhibiting separase activity and thus
preventing sister chromatid separation during mitosis (Zou et al, 1999). PTTG stimulates
expression of fibroblast growth factor 2 (FGF2) and vascular endothelial growth factor
(VEGF) (McCabe et al. 2002). Given these functions, and that PTTG is involved in DNA
repair mechanisms (Kim et al. 2005), it is unsurprising that PTTG over-expression has been
described in several solid organ tumours, including thyroid cancer (Kim et al. 2005).
In order to determine the mechanism of PTTG action, yeast 2-hybrid assays were
performed to identify potential binding partners, with PBF as one of the results (Chien and Pei
2000). In subsequent studies, it was established that PBF was a ubiquitously expressed 180
amino acid protein, with a mass of 22 kDa. PBF was subsequently matched to a previously
cloned gene, C21orf3, located on the long arm of chromosome 22 at 22q22.3 (Yaspo et al.
1998). Although there is no significant homology with other human proteins, PBF is highly
conserved across species (Figure 1.8). This implies not only a specific and unique function
but also an evolutionary importance.

Chapter 1 General Introduction
31
Figure 1.8 Amino acid sequence of PBF, demonstrating high conservation across species.
1.4.1.1 Structure
PBF is a type 1a transmembrane glycoprotein which, although thus far poorly
characterised, has several putative functional domains (Figure 1.9). The N-terminal contains a
32 amino acid signal peptide region, within which exists a leucine rich putative nuclear export
signal (la Cour et al. 2004). Between residues 40 and 95 is a plexin-semaphorin-integrin (PSI)
domain. Typically, PSI domains consist of 8 cysteine residues in an approximately 50 amino
acid section, between which disulphide bonds exist (usually between cysteines 2-4, 3-8, 5-7,
and occasionally 1-6) (Bork et al. 1999). PSI domains are usually extracellular and involved
in protein-protein interaction and cellular signalling (Bork et al. 1999; Kozlov et al. 2004).
There then follows a transmembrane domain (residues 95 to 122).
Towards the C-terminal, there is a bipartate nuclear localisation signal and further
sorting signal. This NLS plays a role in the translocation of PTTG into the nucleus; without
this region PTTG is unable to regulate FGF-2 (Chien and Pei 2000).

Chapter 1 General Introduction
32
Figure 1.9 Putative structure of PBF. PBF contains an N terminal extracellular signal peptide with nuclear export signal (NES), alongside a cysteine rich region PSI domain, with di-sulphide bonds represented by red lines. The C-terminus contains a nuclear localisation signal and sorting signal and is necessary for the interaction with PTTG. A putative nucleolus signal (Nu.S) is also present in the intra-cellular region.

Chapter 1 General Introduction
33
1.4.1.2 Expression and regulation
PBF is ubiquitously expressed in normal tissues (Yaspo et al. 1998; Chien and Pei
2000). The mechanism of its regulation is not yet understood; PTTG over-expression results
in an increase in PBF mRNA (Stratford et al. 2005), although neither EGFR or TGF-α
affected expression in vitro despite causing an increase in PTTG levels (Vlotides et al. 2006).
The PBF promoter contains a variable number of oestrogen response elements (ERE), with
oestrogen receptor α (ERα) binding to the promoter (Watkins et al. 2010). In MCF-7 breast
cancer cells, treatment with both diethylstilbestrol and 17β-estradiol induced PBF mRNA and
protein expression (Watkins et al. 2010). The PBF promoter was also identified as a
transcriptional target for Runx2 during a differential hybridisation screen (Stock et al. 2004).
PBF was up-regulated in Runx2-expressing cells, and the PBF promoter bound Runx2, with
transactivation in MC3T3-El cells.
More recently, work on micro-RNAs in liver disease has shown that miR-122 may effect
PBF expression (Li et al. 2013). Micro-RNAs are small segments of non-coding RNA which
interact with complementary regions of a target mRNA, with subsequent repression of
function (Krol et al. 2010); the group identified a predicted miR-122 complementary site in
the 3’-untranslated region (UTR) of PBF, with repression of expression of GFP labelled PBF
after treatment with miR-122 (Li et al. 2013).
1.4.1.3 Function and subcellular localisation
Despite the evidence for functional domains within the protein structure of PBF, the
precise function of the protein is largely unknown beyond its interaction with PTTG. This
interaction occurs at the C-terminus, allowing the nuclear translocation of PTTG (which does
not contain an NLS) and facilitating the role of PTTG as a securin, and also a transcriptional
activator of FGF-2. Both PTTG and PBF are required for the transactivation of FGF-2, with

Chapter 1 General Introduction
34
expression of each alone having no effect on the FGF-2 promoter (Chien and Pei 2000). In
addition to this nuclear localisation of PBF, it has also been identified in intracellular vesicles,
where it co-localised with the late endosomal marker CD63, while a C-terminal deletion
mutant accumulates at the cell membrane (Smith et al. 2009).
1.4.1.4 Post-translational modifications
Although still relatively poorly characterised, there are a number of residues in the PBF
amino acid sequence that are likely sites of post-translational modification (PTM).
1.4.1.4.1 Glycosylation
Asparagine residues located at position 45 and 54 both fulfil the criteria for potential N-
linked glycosylation sites. These are predicted when the local sequence reads Asp-Xaa-
Ser/Thr, where Xaa is any amino acid except proline (Rao and Bernd 2010). For PBF, the
consensus sequences are N-K-T (N45) and N-V-S (N54).
1.4.1.4.2 Phosphorylation
Phosphorylation is a key process in the regulation of function of many cellular processes
and is carried out by kinases that have varying specificities for phosphorylation motifs.
Phosphorylation prediction software highlights several potential sites for serine, threonine or
tyrosine phosphorylation. These were identified using the NetPhos 2.0 Server from the
Technical University of Denmark (available at http://www.cbs.dtu.dk/services/NetPhos/).
Putative phosphotyrosine sites were identified at Y174, while phosphoserine/threonine sites
were identified at S85, S126, S132 and T10 (Figure 1.10).

Chapter 1 General Introduction
35
Figure 1.10 Predicted sites of serine, threonine and tyrosine phosphorylation within PBF. Scores are relative to 1, with a threshold set at 0.5 (from NetPhos 2.0, available at http://www.cbs.dtu.dk/services/NetPhos/).
Software is also available to predict which kinases may phosphorylate a given residue (e.g.
www.phosphonet.ca).
1.4.1.4.3 SUMOylation
The Small Ubiquitin-Like Modifier (SUMO) protein, similar to ubiquitin, is covalently
bound to many proteins with effects on their cellular function. PBF has one predicted
SUMOylation site, at lysine 169 (Ren et al. 2009).
1.4.2 PBF in thyroid cancer
1.4.2.1 PBF has a significant role in thyroid cancer
The first description of the potential role of PBF in tumourigenesis identified increased
levels of PBF mRNA in pituitary tumours compared to normal tissue, where a positive
correlation was found between expression of PTTG and PBF in pituitary tumours (McCabe et
al. 2003). A contemporaneous report described increased levels of PTTG and FGF-2 in
follicular thyroid cancers compared to normal tissues, and suggested a potential role as
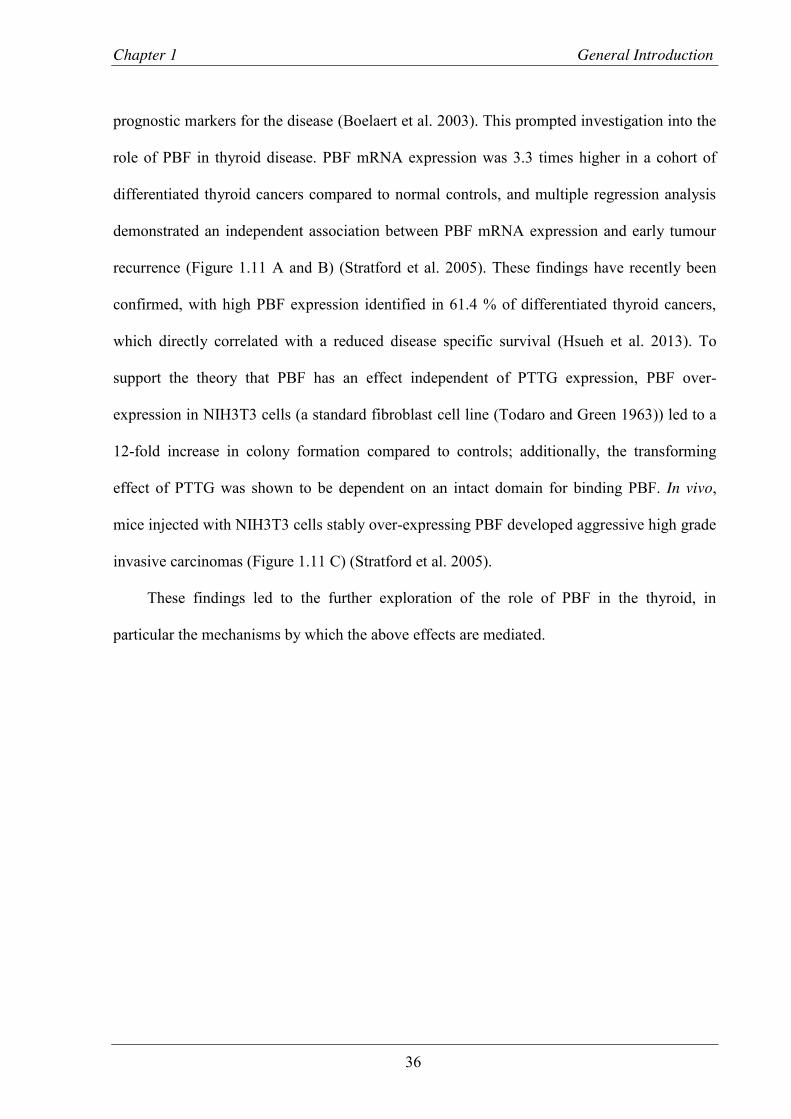
Chapter 1 General Introduction
36
prognostic markers for the disease (Boelaert et al. 2003). This prompted investigation into the
role of PBF in thyroid disease. PBF mRNA expression was 3.3 times higher in a cohort of
differentiated thyroid cancers compared to normal controls, and multiple regression analysis
demonstrated an independent association between PBF mRNA expression and early tumour
recurrence (Figure 1.11 A and B) (Stratford et al. 2005). These findings have recently been
confirmed, with high PBF expression identified in 61.4 % of differentiated thyroid cancers,
which directly correlated with a reduced disease specific survival (Hsueh et al. 2013). To
support the theory that PBF has an effect independent of PTTG expression, PBF over-
expression in NIH3T3 cells (a standard fibroblast cell line (Todaro and Green 1963)) led to a
12-fold increase in colony formation compared to controls; additionally, the transforming
effect of PTTG was shown to be dependent on an intact domain for binding PBF. In vivo,
mice injected with NIH3T3 cells stably over-expressing PBF developed aggressive high grade
invasive carcinomas (Figure 1.11 C) (Stratford et al. 2005).
These findings led to the further exploration of the role of PBF in the thyroid, in
particular the mechanisms by which the above effects are mediated.
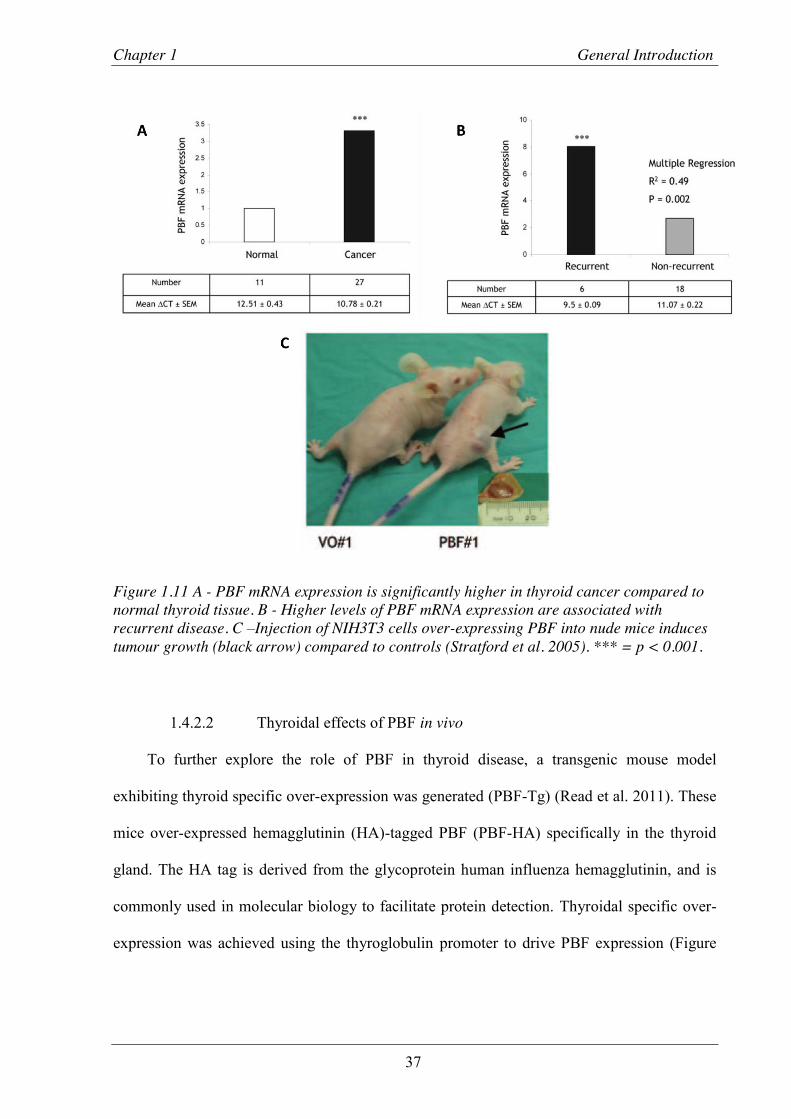
Chapter 1 General Introduction
37
Figure 1.11 A - PBF mRNA expression is significantly higher in thyroid cancer compared to normal thyroid tissue. B - Higher levels of PBF mRNA expression are associated with recurrent disease. C –Injection of NIH3T3 cells over-expressing PBF into nude mice induces tumour growth (black arrow) compared to controls (Stratford et al. 2005). *** = p < 0.001.
1.4.2.2 Thyroidal effects of PBF in vivo
To further explore the role of PBF in thyroid disease, a transgenic mouse model
exhibiting thyroid specific over-expression was generated (PBF-Tg) (Read et al. 2011). These
mice over-expressed hemagglutinin (HA)-tagged PBF (PBF-HA) specifically in the thyroid
gland. The HA tag is derived from the glycoprotein human influenza hemagglutinin, and is
commonly used in molecular biology to facilitate protein detection. Thyroidal specific over-
expression was achieved using the thyroglobulin promoter to drive PBF expression (Figure
Chapter 1 General Introduction
38
1.12), thus ensuring that not only would PBF over-expression be limited to the thyroid, but
that it would only be found in thyroid follicular cells.
Figure 1.12 Western blot demonstrating thyroid specific over-expression of PBF-HA in the PBF-Tg mouse (Read et al. 2011).
The most characteristic phenotype of these mice was their significantly enlarged thyroid
size. Compared to wild type littermates, the transgenic mice had thyroid glands 1.7 times
heavier by week 7 and 3.2 times heavier by 52 weeks (Figure 1.13 A and B). In addition, the
thyroids of the PBF-Tg mice were nodular and exhibited macro-follicles (Figure 1.13 C),
suggesting that the over-expressed PBF may be altering the normal structural development of
the thyroid. Another finding was that of both focal and nodular follicular hyperplasia. These
lesions had large nuclei, and an increase in expression of phosphorylated AKT (a target of PI3
kinase (PI3K)) and cyclin D1 (a downstream proliferation marker) (Read et al. 2011). The
PI3K pathway is a signalling cascade involved in cellular proliferation which is frequently
dysregulated in cancer.

Chapter 1 General Introduction
39
Figure 1.13 Thyroidal effects of PBF-HA over-expression. A - PBF-Tg mice developed significantly larger thyroid glands than their wild type (WT) litter mates. B- Representative image of thyroid glands from WT and PBF-Tg mice at 52 weeks (thyroid glands are outlined by dashed lines). C – H&E stained sections through mouse thyroid glands: Compared to WT (i), PBF-Tg mice developed macro-follicles (ii) and areas of hyperplasia (iii) (Read et al. 2011).
Given this phenotype, the potential impact of PBF on the thyroid hormone secretory
pathway was investigated. PBF was found to sequester the thyroid hormone transporter
MCT8 away from the plasma membrane and into the cell. Additionally, there was an increase
in intra-thyroidal T3 and T4 levels (Smith et al. 2012). This did not, however, correspond to a
difference in total serum T3 or T4, suggesting that although thyroidal MCT8 functional is
repressed, there is compensation to maintain a steady state of thyroid hormone export.
Subsequently, the hypothalamic-pituitary-thyroid negative feedback loop was not affected and
there was no observed increase in serum TSH (Figure 1.14 A and B) (Read et al. 2011). There
was, however, an increase in the expression of the TSH receptor (TSHR) (Figure 1.14 C)
(Read et al. 2011) suggesting an increased responsiveness to TSH within the transgenic

Chapter 1 General Introduction
40
thyroids, although from that it was not possible to say whether this was as a direct or indirect
response to excess PBF and repressed MCT8 function. Interestingly, this increase in TSHR
did not seem to have a functional effect. When the mice were administered 50 mU of TSH,
the increase in serum T4 found in wild type was absent in the transgenic mice (Figure 1.14 D)
(Smith et al. 2012).
Figure 1.14 Thyroid hormone profiles in the PBF-Tg mouse compared to WT. A - Intra-thyroidal levels of unbound T3 (i) and T4 (ii), demonstrating an increase in the PBF-Tg mouse. B – Serum levels of TSH in WT and PBF-Tg mice, demonstrating no significant difference between the two. C – Western blot demonstrating increased levels of thyroidal TSHR in the PBF-Tg mouse. D – Change in serum T4 levels following administration of 50 mU TSH in WT and PBF-Tg mice. No response to TSH was seen in the transgenic mouse ((Read et al. 2011; Smith et al. 2012). WT = wild type, Non-Tg = non-thyroglobulin bound, TSH = Thyroid stimulating hormone. TSHR = TSH-receptor, NS = not significant, * = p < 0.05, ** = P < 0.01.

Chapter 1 General Introduction
41
Taken together, these data imply that excess PBF is causing a sequestering of thyroid
hormone within the thyroid gland, while preventing the hormones from being transported to
the blood stream. To maintain a steady state level of serum T3 and T4, the amount of TSHR
expressed by follicular cells is increased. However, this appears to be at a maximum capacity
for responsiveness given that any further increase in TSH has no effect on serum thyroid
hormone.
No thyroid malignancies were observed in the transgenic mice, a fact which is
potentially at odds with the finding that PBF is significantly over-expressed in human thyroid
cancer. However, these data demonstrate a role for PBF in the proliferation of thyrocytes via
the activation of AKT. In addition, these events may well provide the first “hit” in the steps
towards thyroid carcinogenesis. Therefore, while over-expression of PBF in isolation may not
be sufficient to cause carcinogenesis, a second hit in combination could be.
1.4.2.3 PBF and the sodium iodide symporter
FGF2 had been shown to reduce iodide uptake in thyroid follicular cells (Cocks et al.
2003), and both PBF and PTTG are required for the transcription of FGF2 (Chien and Pei
2000). Given that PBF levels are higher in thyroid cancer compared to normal tissue, and that
over-expression of PBF is associated with a poorer prognosis in thyroid cancer, experiments
were performed to assess the effect that PBF (and PTTG) may have on the sodium iodide
symporter, NIS. As described in Section 1.2.5.3, NIS is vital to the uptake of radioiodine into
thyroid follicular cells, and it follows that any disruption to this function would lead to a
poorer response to treatment.
PTTG and PBF over-expression were shown to reduce NIS mRNA in primary
thyrocytes (86 % and 95 % reduction respectively), with similar levels seen when co-
transfecting the two together, and also when transfecting a mutated PTTG which lacked the
Chapter 1 General Introduction
42
ability to transactivate FGF2 (Figure 1.15 A). This also had a functional effect, with PBF
over-expression leading to a reduction in 125I uptake by 68 %, while PTTG over-expression
resulted in a fall of 59 %. Here, co-transfection led to a greater reduction (83 %), while
transfection of the mutant PTTG resulted in a fall of only 34 % (Figure 1.15 B). Together,
these data indicated that while the suppression of NIS function by PTTG occurs mostly via
FGF2, PBF mediates its effect via an independent mechanism. Promoter studies examined the
effect of PBF and PTTG on the NIS promoter. Both proteins caused transcriptional repression
via a PAX8/USF1 site within the human NIS upstream enhancer element, while PBF also
repressed the basal NIS promoter, which harbours the transcriptional activation site (Boelaert
et al. 2007).

Chapter 1 General Introduction
43
Figure 1.15 PBF and PTTG inhibit NIS expression and activity in primary thyroid cultures. A – NIS mRNA expression is reduced by PBF and PTTG transfection alone and in combination, and also with the SH3 deletion mutant of PTTG (SH3-). B – Iodide uptake in primary thyrocytes after transfection with PBF/PTTG/SH3- * = p < 0.05, ** = p < 0.01, *** = p < 0.001 (Boelaert et al. 2007).
The mechanism by which PBF repressed NIS function was examined in further studies.
Interaction between PBF and NIS was confirmed by glutathione-S-transferase (GST) pull-
down and co-immunoprecipitation assays. PBF over-expression was shown to alter the sub-
cellular localisation of NIS, internalising it away from the plasma membrane and into
intracellular vesicles (Figure 1.16), a process mediated via clathrin-dependant endocytosis due
to strong co-localisation with CD63, a marker for late endosomes (Smith et al. 2009).

Chapter 1 General Introduction
44
Figure 1.16 Effect of PBF over-expression on NIS in COS-7 cells. A – Immunofluorescence in the presence of wild type (i) or over-expressed (ii) PBF, with NIS localising to intracellular vesicles with increased PBF. B – Corresponding cell surface biotinylation study demonstrating reduced cell surface NIS (i) but no change in total NIS (ii) with over-expressed PBF compared to WT levels (Smith et al. 2009).
PBF-induced NIS repression was also observed in the PBF-Tg mouse model. In a similar
effect to that apparent in the in vitro model, for age and sex-matched mice, NIS mRNA
expression was reduced by approximately 50 % in the PBF-Tg mouse compared to wild type,
and immunohistochemistry demonstrated a marked reduction in NIS staining in the transgenic
thyroids (Figure 1.17 A and B) (Read et al. 2011). Primary cultures from these murine
thyroids showed a 70 % repression of iodide uptake in the transgenic thyroids compared to
wild type. Perhaps most importantly, this effect could be completely reversed by knocking
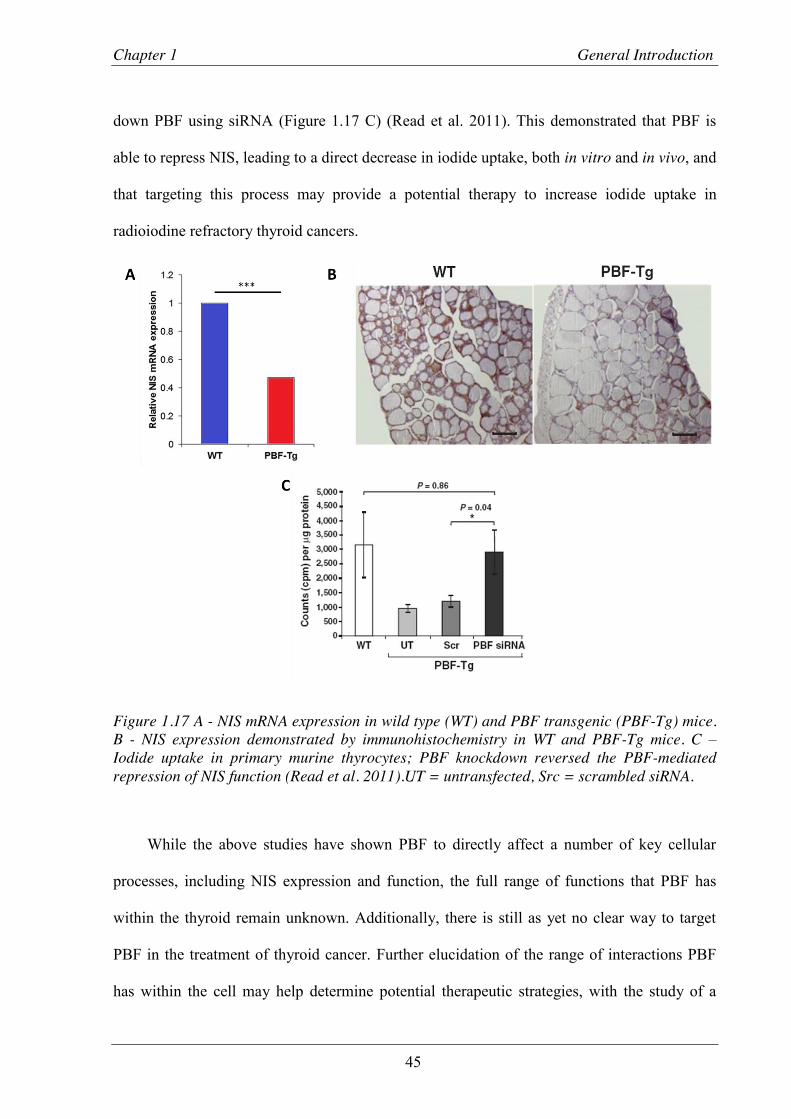
Chapter 1 General Introduction
45
down PBF using siRNA (Figure 1.17 C) (Read et al. 2011). This demonstrated that PBF is
able to repress NIS, leading to a direct decrease in iodide uptake, both in vitro and in vivo, and
that targeting this process may provide a potential therapy to increase iodide uptake in
radioiodine refractory thyroid cancers.
Figure 1.17 A - NIS mRNA expression in wild type (WT) and PBF transgenic (PBF-Tg) mice. B - NIS expression demonstrated by immunohistochemistry in WT and PBF-Tg mice. C – Iodide uptake in primary murine thyrocytes; PBF knockdown reversed the PBF-mediated repression of NIS function (Read et al. 2011).UT = untransfected, Src = scrambled siRNA.
While the above studies have shown PBF to directly affect a number of key cellular
processes, including NIS expression and function, the full range of functions that PBF has
within the thyroid remain unknown. Additionally, there is still as yet no clear way to target
PBF in the treatment of thyroid cancer. Further elucidation of the range of interactions PBF
has within the cell may help determine potential therapeutic strategies, with the study of a
Chapter 1 General Introduction
46
protein’s range of interactions being recognised as an important pre-requisite to the
development of novel treatments for cancer. Mass spectrometry (MS) plays an ever increasing
part in this process, and techniques to improve accuracy and combat technical difficulties are
evolving. There is an increasing body of evidence demonstrating that MS has important and
wide ranging applications to endocrine and thyroid cancer. As discussed above, thyroid
cancers are often difficult to distinguish from benign tumours during initial investigation, and
in some cases present late with a consequently worse prognosis. In addition, there is often a
complex interplay between the on-going normal physiology of the thyrocyte, aberrant
production of secreted hormones and disordered cellular function. Together, this results in
thyroid cancer research being particularly amenable to mass spectromtery.
1.5 Mass spectrometry and protein-protein interactions
1.5.1 Role of protein-protein interactions in the cell
Proteins do not exist in isolation in a cell, and each protein will have many other proteins
with which it interacts (its “interactome” (Sanchez et al. 1999)). These interactions are key to
all cellular processes; understanding and mapping these is taking on an increasing importance
in the field of translational molecular biology. The consequences of these include altered
kinetic properties, substrate channelling, formation of new binding sites, inactivation of one
or both proteins and a change in specificity for a given substrate (Phizicky and Fields 1995).
In general, interactions can be classified as either stable or transient. Stable interactions
are found in complex, multi-protein molecules such as haemoglobin. Transient interactions
form the backbone of most cellular processes. The transient nature is brought about by the
fact that a specific condition, for example a particular sub-cellular localisation or post-
translational modification, may be required for the interaction to occur and persist.

Chapter 1 General Introduction
47
Despite the variety of potential binding sites with a protein, which may change
depending on cellular conditions, there are some domains which are associated with protein-
protein interaction. Examples of this include the leucine zipper (involved in stable
interactions) and SH2/SH3 domains. The latter 2 are named for their homology to sections of
the SRC oncogene in which they were first identified and are frequently involved in signal
transduction and tyrosine kinase binding.
As a translational approach, studying the expression and interactions of proteins in both
normal and malignant tissues significantly enhances the understanding of the mechanisms of
disease progression and pathogenesis. By mapping the human interactome, new therapeutic
targets may be identified which can lead to the development of novel cancer treatments.
1.5.2 General principles
The principle behind protein identification by tandem mass spectrometry (MS/MS) lies
in the fact that every protein has a predictable fragmentation pattern (“peptide fingerprint”)
when cleaved by a digestive enzyme (Steen and Mann 2004). The most commonly used
enzyme is trypsin, which cleaves peptide chains at the carboxyl side of lysine and arginine
residues. An efficient, reproducible digestion is essential to generate worthwhile data and
strategies include solubilising using 4 % SDS, which is removed by centrifuging the sample
through a 35 kDa cut-off filter where the unfolded proteins are retained and the detergent
removed in the filtrate. After concentration and purification, samples are digested using
endoproteinase Lys C and / or trypsin and the peptides harvested for analysis (Wisniewski et
al. 2009). Another common approach is the digestion of proteins in gel slices following
separation of the proteins using SDS PAGE. This process is also reliable as once again the
protein substrates are denatured and unfolded.
Chapter 1 General Introduction
48
Tryptic digestion will often generate very complex peptide mixtures that are usually
analysed by liquid chromatography (LC) MS/MS, where the peptides are separated using
reverse phase HPLC prior to mass spectrometry. The peptides are eluted using a gradient of
acetonitrile where the rate of the gradient is matched to the sample complexity. There has
been considerable improvement in the design and performance of HPLC instrumentation and
columns, allowing routine implementation of nano-bore (sub-μm / min flow rate) methods
using columns with internal diameters of 50-100 μm. Therefore, peptides elute from these
columns in a very small volume, meaning that the actual concentration of peptides in the
HPLC eluate is relatively high (Steen and Mann 2004).
The mass spectrometric analysis of the HPLC-resolved peptides typically utilises two
basic approaches; electrospray ionisation (ESI), or matrix assisted laser desorption/ionisation
with a time of flight mass spectrometer (MALDI ToF/ToF). In the case of a MALDI
instrument, a defined time period of HPLC column outflow is automatically spotted onto a
MALDI target plate. Typically, several hundred or more spots are generated for a complex
sample. In electrospray ionisation the column eluate is sprayed into the mass spectrometer
source via an emitter (a fine needle that can conduct an electrical current) which is spatially
isolated from the actual mass spectrometer. A high charge (1-5 kV) is applied to the emitter
which ionises the peptides in the acidified HPLC solvent. As this liquid exits the fine tip,
small droplets are generated and manipulated by electric fields according to their mass to
charge ratio (m/z). The ions reach a detector and a mass spectrum is generated. By examining
the separation pattern of the peaks produced, the specific m/z of each ion can be calculated.
Tandem mass spectrometry (MS/MS) refers to the further fragmentation of the most abundant
precursor ions using an inert gas. These are then passed through the spectrometer again and
Chapter 1 General Introduction
49
the individual product ions assigned further peaks based on their m/z. Each product ion is the
result of the loss of one or more amino acid residues from the precursor ion; by examining the
population of peaks and their m/z (the peptide “tandem mass spectrum”) it is therefore
possible to determine the amino acid sequence of the ion, and therefore the structure of the
precursor ion. Once the mass spectrum has been matched to a peptide sequence, computer
databases use the predictable cleavage sites of trypsin to match the peptide to a parent protein.
1.5.3 Protein complexes
The isolation of proteins using affinity purification of a target (bait) protein has allowed
the detection of novel protein-protein interactions in many studies. Antibodies to native or
tagged proteins have been used extensively in this work and efforts to decrease the detection
of non-specific binding partners have utilised tandem affinity tags (TAP-TAG) (Rigaut et al.
1999). However the protein complex is isolated, it is usual that the proteins are identified
following resolution of the proteins using SDS-PAGE, band excision, and tryptic digestion. It
is important to perform suitable controls to detect non-specific interactions and it is
particularly useful if some interactions with the target protein are already known as these can
act as positive controls, as does the detection of the target. As well as individual protein-
protein interactions, the duration of these interactions and their relation to cellular function
can also be determined, mapping out cell signalling pathways (Bisson et al. 2011).
1.5.4 Protein quantitation
Initially, the analysis of complex samples (often termed “shot-gun proteomics”)
focussed on identifying as many peptides/proteins as possible in complex samples such as
blood serum and plasma, urine, CSF or tissue and cell lysates. However, it soon became clear
that it is more relevant to determine either the absolute or relative abundance of proteins,

Chapter 1 General Introduction
50
particularly in biomarker discovery. Several approaches have been developed and the actual
protocol utilised is usually limited by the sample type, cost, mass spectrometer available and
by the quality of data required. All of the methods have advantages and disadvantages
compared to the other protocols and the choice of approach can be affected by the experience
and personal preferences of the group performing the analyses.
Currently the most common approaches use stable isotope labelling strategies such that 2
(or more) isotopically labelled versions of each peptide are produced (Elliott et al. 2009).
These molecules are identical chemically and behave in exactly the same way during
purification steps but vary by a known mass. Therefore, since they are analysed under
identical conditions, differences in the peak intensities of the isotopic versions represent an
accurate estimation of the relative abundance of the isotopic species.
The vast majority of quantitative proteomic methods attempt to determine the relative
amount of large numbers of different peptides or proteins in complex samples without any
prior knowledge of the proteins under investigation. However, a focussed analysis of specific
proteins can be performed if the protein of interest is known and if preliminary analysis can
determine which unique tryptic peptides are consistently observed in LC MS/MS of digests of
the target protein. Then, an isotopically labelled version of the peptide is synthesised and a
known amount spiked into samples. When analysed by LC MS/MS, the natural and isotopic
versions co-elute meaning that their relative MS spectra intensities can be used to calculate
the concentration of endogenous peptide in the original sample (Gerber et al. 2003; Elliott et
al. 2009). More recently the approach has been improved, to a large extent because of
improvements in the performance of “triple quad” mass spectrometers, which generate a
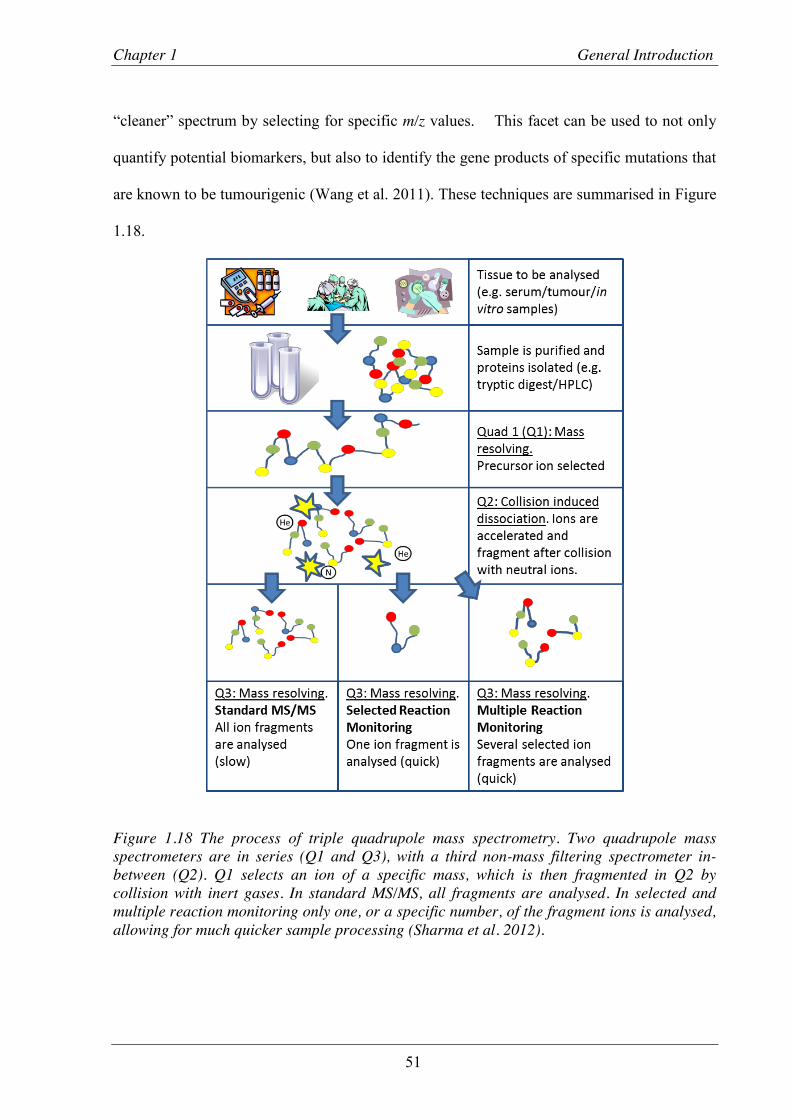
Chapter 1 General Introduction
51
“cleaner” spectrum by selecting for specific m/z values. This facet can be used to not only
quantify potential biomarkers, but also to identify the gene products of specific mutations that
are known to be tumourigenic (Wang et al. 2011). These techniques are summarised in Figure
1.18.
Figure 1.18 The process of triple quadrupole mass spectrometry. Two quadrupole mass spectrometers are in series (Q1 and Q3), with a third non-mass filtering spectrometer in-between (Q2). Q1 selects an ion of a specific mass, which is then fragmented in Q2 by collision with inert gases. In standard MS/MS, all fragments are analysed. In selected and multiple reaction monitoring only one, or a specific number, of the fragment ions is analysed, allowing for much quicker sample processing (Sharma et al. 2012).

Chapter 1 General Introduction
52
Stable Isotope Labelling by Amino acid in Culture (SILAC) is a method of isotopically
labelling proteins metabolically, where 2 (or more) cell types, or the same cell type under
different conditions, are grown in either “heavy” or “light” media (Ong et al. 2002). In the
“heavy” media either the naturally occurring 12C-arginine and/or the 12C-lysine is/are replaced
by 13C versions. When the cells grow and use the amino acids from the media to make new
proteins, the cells grown in the “heavy” media isotopically label their own proteins and if
sufficient rounds of cell division are allowed the labelling will approach equilibrium. An
attempt to extend the SILAC approach for the quantitation of proteins in tissue samples has
been reported (Geiger et al. 2010). This “super SILAC” approach is relatively expensive as
several cell lines have to be grown in 13C labelled amino acid containing media.
1.5.5 Mass spectrometry and thyroid cancer
In the field of thyroid cancer research, MS/MS has several distinct applications,
including identifying biomarkers, facilitating personalised medicine and also in developing
novel therapies.
1.5.5.1 Identification of biomarkers
One of the most significant areas of cancer biology in which MS/MS has had an impact
is the identification of biomarkers. These are used in pre-diagnosis screening as well as
prognostication of cancers and identification of recurrence. Standard molecular biology
techniques such as immunohistochemistry and quantitative PCR remain in routine use to
identify genes that may serve to stratify a tumour into a particular sub-group. However, using
MS/MS, plasma and urine can be analysed as well as tumour tissue, enabling the detection of
circulating proteins that have been either secreted by the cancer or have “leaked” out (Manne
et al. 2005; Ward et al. 2008; Turtoi et al. 2011). The application of this to the field of cancer

Chapter 1 General Introduction
53
research raises some exciting possibilities. The identification of a thyroid cancer biomarker
that would allow the differentiation between a follicular adenoma and carcinoma may prevent
a significant number of patients undergoing surgery. In addition, determining which tumours
are more likely to de-differentiate or metastasise would clearly be invaluable when planning
treatment.
Despite thyroid cancer being the commonest endocrine malignancy, there remains a lack
of reliable markers available that predict cancer within a thyroid nodule. The two most
commonly used serum markers, thyroglobulin for differentiated thyroid cancer and calcitonin
for medullary cancer, both have their disadvantages, and there is a continued need for further
development. Genetic mutations such as RET/PTC, BRAF and RAS have all been identified in
thyroid cancer specimens (Namba et al. 2003; Carta et al. 2006; Stanojevic et al. 2011), but
these again require a tissue sample in order to identify them. While Fine Needle Aspiration
Cytology (FNAC) can be useful for this, the amount of material obtained is often minimal
and, even with ultrasound guidance, not necessarily fully representative of the tumour. As an
alternative approach, a number of studies over the past decade have examined the proteome of
thyroid samples. Initially, 2D electrophoresis was used to identify protein spots from normal,
goitrous, hyperplastic, adenomatous and malignant thyroid specimens followed by sequencing
from polyvinylidene difluoride (PVDF) membranes and MS/MS to determine which proteins
were most abundant (Srisomsap et al. 2002). Cathepsin B was reportedly over-expressed in
thyroid cancer and ATP synthase and prohibitin were specifically over-expressed in the
papillary variant; proteins that had not been previously linked to thyroid cancer. Although this
first study used both MS/MS and traditional methods, as MS/MS technology has advanced,
the need to run synchronous techniques has diminished. Later, proteins over-expressed in 29
thyroid tumour samples when compared with normal thyroid were identified using SELDI-

Chapter 1 General Introduction
54
TOF MS/MS (Sofiadis et al. 2010). When the spectra produced from nuclear and cytosolic
fractions of cell lysates were analysed, the Ca2+ binding ion S100A6 was over-expressed in
PTC compared to FTC and normal thyroid, which was confirmed by Western blotting and
immunohistochemistry (Sofiadis et al. 2010). Additionally, 2-hydroxyglutarate levels have
been shown to be elevated in PTC compared to both normal thyroid and hyperplastic nodules
(without the IDH1 and IDH2 mutations usually seen in gliomas and myeloid leukemias),
although these results are yet to be validated (Rakheja et al. 2011).
Characterisation of a thyroid tumour, then, may prove useful in further stratifying
tumour tissue post-biopsy/surgery. However, it is the high-throughput analysis of serum and
urine for secreted proteins that may serve as biomarkers which highlights the potential of
MS/MS as a vital tool in cancer proteomics. Two recent studies have taken different
approaches to the identification of the thyroid cancer secretome. The first utilised an in vitro
model of TPC-1 (PTC) and CAL62 (ATC) cell lines (Kashat et al. 2010). After culturing cells
in serum free conditions, media was collected, trypsinised and run through LC MS/MS.
Proteins were classed as high-confidence if identified by 2 or more peptides with ≥95%
confidence. Forty six proteins were shortlisted; the mean number of peptides identified was
4.82 with average sequence coverage of 12.5%. After further validation, 6 proteins were
determined to be present in the thyroid cancer secretome; biotinidase, nucleolin, enolase1,
PTMA, CYR61 and clusterin. The expression of these proteins in the serum of patients with
thyroid cancer was then examined but unfortunately none of the proteins were proven to be
over-expressed in this setting. This inability to translate results from an in vitro to an in vivo
setting is a shortcoming observed in a number of MS/MS studies. However, identifying those
proteins selectively secreted by thyroid tumours remains a fundamental imperative. Using
human serum directly to identify secreted proteins has the advantage of being applicable to a

Chapter 1 General Introduction
55
large number of patients and also being representative of the in vivo setting. SELDI-TOF
MS/MS was employed to study the serum protein profile of 224 patients, 108 with PTC and
116 normal controls (Fan et al. 2009). Haptoglobin alpha-1 was found to be up-regulated in
PTC while apolipoproteins CI and CII were down-regulated. Further, as the stage of tumour
increased, there was a corresponding rise in haptoglobin alpha-1 and fall in the
apolipoproteins. Further work is now needed to consolidate these observations and to
determine if these proteins may be of use in the initial investigation of patients with suspected
thyroid cancer. To differentiate PTCs from both nodular goitres and normal thyroids, a
metabolomic approach comparing the three groups found that the greatest difference occurred
in lipid metabolism, with 3-hydroxybutyric acid expression much higher in the PTC group
compared to the others (Yao et al. 2011). The authors suggest that this may therefore be a
potential marker to distinguish between PTC and benign nodular lesions.
1.5.5.2 Personalised medicine
The search for biomarkers for thyroid cancer does not seek to find a way of tailoring
treatment, rather identifying novel proteins that can then be studied in a more translational
context. When treating patients with cancer, future therapies are likely to evolve away from
protocol driven management strategies to a more tailored, individual approach (Pirmohamed
2010). In this respect, MS/MS can be used to identify proteomic differences between different
groups of cancer patients and although not yet widespread in the field of thyroid cancer, has
been used to study other malignancies. While most ovarian cancers will be initially
susceptible to platinum based chemotherapy, many will eventually become resistant (Cho and
Shih Ie 2009). Using ESI-MS/MS to examine the proteome of primary and post-
chemotherapy ovarian cancers, 11 proteins were identified that were expressed at higher
levels in the recurrent group, all of which were confirmed by RT-PCR (Jinawath et al. 2010).
Chapter 1 General Introduction
56
By knocking down 2 of these (RELA (NF-κB p65) and STAT5), carboplatin-resistance in
vitro was reversed. Most importantly, by treating the cells with either a NF-κB or STAT5
inhibitor, their sensitivity to carboplatin was significantly enhanced. A similar study
compared the proteome of paclitaxel-resistant and -sensitive cell lines, using both MALDI-
TOF and LC-MS/MS (Di Michele et al. 2009). A number of proteins that showed significant
differential expression between the two were demonstrated and grouped into those related to
stress response, metabolism, protein biosynthesis and apoptosis. Collectively, these studies
provide a possible way of determining whether a patient will benefit from a particular
chemotherapeutic agent prior to its delivery, potentially avoiding both unnecessary side
effects and cost.
Previous techniques have performed proteomic analyses on either serum or fresh tissue,
but in some cases the specimen may have already been paraffin embedded and examined by a
pathologist. Several methods exist for carrying out HPLC-MS/MS on formalin fixed and
paraffin embedded (FFPE) tissue, which is much more applicable to a hospital setting
(Gustafsson et al. 2010; Paulo et al. 2011). In this way, previously archived samples could be
revisited in certain cases or as new discoveries regarding treatment are made, allowing a
patient’s treatment to remain contemporary, regardless of when the original diagnosis was
made or surgery performed. As mentioned above, statistical analysis is often hampered by
insufficient sample numbers for what are often rare or unusual malignancies and by the short
follow up time that the patients recruited to current studies have available. By using FFPE
tissue, which has been archived and for which long term patient outcomes are known, studies
will be able to compare larger numbers of samples and correlate different proteomic measures
to specific patient factors, such as recurrence and response to treatment.
Chapter 1 General Introduction
57
1.5.5.3 Interaction proteomics
MS has enabled the large scale identification of protein-protein interactions (Downard
2006; Volkel et al. 2010), and from these large interaction networks have been generated.
Tyrosine kinase inhibitors (TKIs) are promising agents in the treatment of many cancers
(Raymond et al. 2011; Verbeek et al. 2011), and proteomic analysis of interactions can
identify more accurately specific kinases to target (Gorla et al. 2009). Directly related to this,
MS/MS allows the identification of post-translational protein modifications (Chung et al.
2011), including phosphorylation, which can lead to further therapeutic insight. However, if
high molecular weight proteins are examined, the presence of post-translational modifications
may obscure the data; analyses must therefore be tailored to specific events, such as
phosphorylation or glycosylation. It has been demonstrated that resistance to the TKI
lapatinib in breast cancer cell lines is linked to increased phosphorylation of Src family
kinases (Rexer et al. 2011). Further, by treating these cells with Src inhibitors the sensitivity
to lapatinib is restored. Similarly, LC-MS/MS has been utilised to explore the
phosphorylation of the epidermal growth factor receptor (EGFR) (Zhang et al. 2011). Thirty
phosphorylation sites were documented and were related to activating mutations in cancer cell
lines as well as sensitivity to the EGFR inhibitor erlotinib. These strategies thus highlight the
potential to target treatment for specific cancers based on the proteomic profile of the tumour
tissue, and to monitor and address disease progression in the light of the on-going treatment
regimen.
1.6 Hypothesis and aims
Over recent years, PBF has been shown to have transforming effects in vitro, and
tumourigenic effects in vitro. Specifically in relation to thyroid disease, PBF over-expression

Chapter 1 General Introduction
58
leads to a macro-follicular goitre with areas of hyperplasia. High levels of PBF are found in
thyroid cancer when compared to normal tissue, and the amount of PBF present within
thyroid tissue has a positive correlation with thyroid cancer recurrence. At a cellular level,
PBF binds to both NIS and MCT8, internalising them away from the cell membrane, with a
direct functional response in terms of iodide uptake and thyroid hormone transport. This has
important consequences for the treatment of thyroid cancer and implications on prognosis.
The hypothesis of this thesis is that in addition to those described, PBF has a range of
interactions with the thyroid cell, and that increased levels of PBF, as observed in thyroid
cancer, lead to a disruption of cellular processes key to normal thyrocyte function and, by
extension, to the treatment of thyroid cancer.
From this, the aims of this thesis were:
1. Identification of potential novel binding partners of PBF. Tandem mass
spectrometry was used to identify potential binding partners of PBF. From the
large list of potential proteins, scoring systems and validation strategies were
employed to generate a shortlist of most likely interactors, and from this 3 were
chosen to be further validated based on predicted function.
2. Validation of binding partners. GST-tagged pull down assays and co-
immunoprecipitation were used to validate the potential binding partners
identified by MS/MS.
3. Functional assessment of the significance of interactions. Functional studies,
including iodide uptake and secretion assays, were used to investigate the

Chapter 1 General Introduction
59
functional significance of the interactions, and the potential to utilise them as
targets for future therapies for thyroid cancer were assessed.

Chapter 2 Material and Methods
60
Chapter 2 Materials and Methods
Chapter 2 Material and Methods
61
Unless otherwise stated, all reagents described were obtained from Sigma-Aldrich
(Poole, UK).
2.1 Cell lines
K1 cells were obtained from the European Collection of Cell Cultures (Salisbury, UK).
The K1 line is a moderately-well differentiated human papillary thyroid carcinoma cell line
displaying the V600E BRAF mutation (Meireles et al. 2007), but expressing wild-type p53.
The TPC-1 cell line is a moderately differentiated human PTC line expressing wild type p53
and BRAF, but with the RET/PTC1 re-arrangement on chromosome 10 (Ribeiro et al. 2008).
They were kindly provided by Dr Rebecca Schweppe (Division of Endocrinology,
Metabolism, & Diabetes, University of Colorado Denver, Aurora, Colorado). Both cell lines
were cultured from passage 7 (P7) as a monolayer in 75 cm2 flasks in RPMI with L-
Glutamine (Life Technologies, Grand Island, NY, USA), 105 U/L penicillin, 100 mg/L
streptomycin (Invitrogen, Paisley, UK) and 10 % fetal bovine serum (FBS) (Invitrogen). Cells
were passaged twice weekly, using a 10 % (K1) and 5 % (TPC1) division and kept in a 37 °C
incubator with 5 % CO2, with fresh P7 cells re-cultured every 6 to 8 weeks.
The FRTL-5 cell line is a rat thyroid cell line derived from normal rat thyroid tissue, and
displays normal thyroid cellular functions, including iodide uptake and thyroglobulin
synthesis (Ambesi-Impiombato 1986). Cells were cultured from P10 in 1 x Coon’s modified
Hamm’s F-12 medium (Biochrom AG, Berlin, Germany) with 30 mM sodium bicarbonate
made up to 1 litre with H₂O then sterilised through a 0.22 µm pore 54.5 cm polyethersulfone
membrane (Corning Ltd, Ewloe, UK), with 105 U/L penicillin, 100 mg/L streptomycin, 300
U/L thyroid stimulating hormone and 300 µg/L insulin) with 5 % FBS.

Chapter 2 Material and Methods
62
HeLa cells, a malignant epithelial cell line derived from a cervical epidermoid
carcinoma (Scherer et al. 1953), were used as a non-thyroid cell line due to their ease of
transfection and well characterised phenotype. Cells were cultured from P5 in Dulbecco
Modified Eagle’s Media (DMEM) (PAA, Pasching, Austria), supplemented with 4.5 g/dL
glucose, 105 U/L penicillin, 100 mg/L streptomycin and 10 % FBS. Cells were passaged twice
weekly and split at 20 %.
2.2 Transfection
2.2.1 Plasmid purification
2.2.1.1 Vectors
Over-expression of protein was achieved through transfection with mammalian
expression vectors containing the complete coding sequence for the gene of interest. Plasmids
used were pCI-Neo (Promega, Madison, WI, USA), pcDNA3.1+ (Invitrogen), pCMV6-XL
(Origene, Rockville, M, USA). All contained the cytomegalovirus promoter and sites for
antibiotic resistance.
2.2.1.2 Restriction digest and ligation
The Invitrogen Restriction Digest kit was used to digest a cDNA sequence from a vector
according to the manufacturer’s instructions. Unique restriction enzymes were chosen as
described in relevant chapters. 4 µg of insert and vector DNA were combined with the
restriction enzymes (each at 10% of digest mixture), 10 % 1 x BSA, 10 % Buffer H and
incubated at 37 °C for 2 hours. The digest solution was combined with DNA loading dye
(0.042 % bromophenol blue, 0.042 % Xylene cyanol FF, 2.5 % Ficoll) and run through a 1 %
agarose gel in 1 x TAE buffer (40mM Tris, 20mM acetic acid, 1mM EDTA) at 100 V for 1

Chapter 2 Material and Methods
63
hour. Using ultraviolet light, the DNA bands corresponding to the insert and the linearised
vector were excised with a clean scalpel.
DNA was extracted using the QIAquick Gel Extraction Kit (QiaGen) according to the
manufacturer’s instructions, with all centrifugation steps carried out at 17,900 x g in a table
top microcentrifuge. Briefly, Buffer QG was added to the gel slice in a ratio of 3:1 (v:w) in a
microcentrifuge tube and then incubated at 50 °C for 10 minutes with regular vortexing. Once
completely dissolved, 10 µL of 3 M sodium acetate pH 5.0 were added before adding 1:1
isopropanol and mixing. The sample was then centrifuged in a spin column for 1 minute to
bind the DNA and the flow through discarded. After adding 0.5 ml Buffer QG the sample was
spun again for a further minute and flow through again discarded. The DNA was washed with
0.75 ml Buffer PE for 1 minute and the spun again for a further minute to remove any residual
wash solution. The DNA was eluted with Buffer EB by spinning for 1 minute, collecting the
supernatant in a clean microcentrifuge tube. DNA purity was assessed using the NanoDrop©
ND-1000 Spectrophotometer (NanoDrop), with a pure sample having a 260/280 ratio between
1.8 and 2 : 1. Where indicated, samples were purified using the Macherey Nagel PCR Clean
Up Kit (Macherey Nagel), according to manufacturer’s instructions. All steps were at room
temperature with all centrifugation at 11,000 x g for 30 seconds unless otherwise stated. One
part DNA was combined with 2 parts Buffer NTI and transferred to a Clean-up Column. After
centrifugation to bind the DNA, the sample was washed twice with 700 µL Buffer NT3. The
membrane was then dried by centrifuging for 2 minutes and the DNA eluted in 35 µL of
Buffer NE for 1 minute, then re-assessed using the NanoDrop as above.
Ligation of the 2 digest products was performed using DNA ligase (Invitrogen). Equal
molar quantities of linearised vector and insert were incubated with 10 % DNA Ligase and 10
% 10 x Buffer for 16 hours at 6 °C. The samples were then incubated at 22 °C for 3 minutes

Chapter 2 Material and Methods
64
then 70 °C for 10 minutes to heat inactivate the DNA Ligase. The DNA samples were then
used to transform bacteria as described below.
2.2.1.3 Bacterial transformation
Transformation was carried out using Subcloning Efficiency™ DH5α™ Competent E.
Coli Cells (Invitrogen) according to the manufacturer’s instructions. 10 ng of plasmid DNA
were added to 50 µL of DH5α™ cells in a 1.5 ml microcentrifuge tube. After incubation on
ice for 30 minutes to increase the permeability of the cell membrane, cells were heat shocked
at 42 °C for 20 seconds and then incubated on ice for a further 2 minutes. 950 µL of
Lysogeny Broth (LB) were added and the samples incubated at 37 °C for 1 hour with shaking.
Bacterial cells were pelleted by centrifugation on at 13,000 rpm on a bench top centrifuge and
the supernatant discarded. The cells were then re-suspended in the remaining LB
(approximately 100 µL). This suspension was plated on warmed LB-Agar (1 % Agar)
containing antibiotics. Plates were incubated at 37 °C for 16 hours.
2.2.1.4 DNA purification and sequencing
Purification was performed using the Wizard® Plus SV Miniprep DNA Purification
System (Promega) according to manufacturer’s instructions. Following incubation, a single
colony was selected from the plate and incubated in 5 ml LB with antibiotics at 37 °C for 16
hours with shaking. All subsequent steps were carried out at room temperature. The bacterial
suspension was centrifuged at 10,000 x g for 5 minutes and the supernatant discarded. Cells
were re-suspended in 250 µL of Cell Resuspension Solution by vortexing and transferred to a
1.5 ml microcentrifuge tube. A cleared lysate was then prepared by the addition of 250 µL of
Cell Lysis Solution and incubating the suspension until it had cleared. 10 µL of alkaline
protease were added to inactivate any endocucleases released during cell lysis and the lysate
incubated for 5 minutes. Finally, 350 µL of neutralisation solution were added to terminate
Chapter 2 Material and Methods
65
the lysis and the tube inverted 4 times before centrifuging for 10 minutes at 14,000 x g.
Subsequent centrifugation was carried out at 14,000 x g for 1 minute. After transferring to a
spin column, the cleared lysate was centrifuged and the eluate discarded. Plasmid DNA was
washed twice by centrifugation with Column Wash Solution (750 µL wash 1, 250 µL wash 2)
by centrifugation. Finally, the DNA was eluted with 100 µL of nuclease free water (NF-H₂O).
DNA quantification was carried out using the NanoDrop© ND-1000 Spectrophotometer
(NanoDrop) and accompanying ND-1000 v3.3 software on the DNA-50 setting.
To sequence the plasmid DNA, 250 ng of DNA were combined with 3.2 pmol of
forward or reverse primer and made up to 10 µL with NF-H₂O. Primers for pcDNA3.1+ were
T7 forward (TAATACGACTCACTATAGGG) and BGH reverse
(TAGAAGGCACAGTCGAGG).
Samples containing bacteria that had incorporated the plasmid DNA were used to
prepare a glycerol stock, which was then used to re-amplify the DNA as needed. 0.5 ml of 30
% filter-sterilised glycerol were mixed with 0.5 ml of the bacterial culture. After incubation
on ice for 30 minutes, the stock was stored at -80 °C.
2.2.1.5 DNA Amplification
Once the sequence of the plasmid DNA had been verified as correct, amplification of
plasmid DNA was performed using the GenElute™ HP Plasmid Maxiprep Kit (Sigma)
according to the manufacturer’s instructions. 5 ml of LB with antibiotics were inoculated with
a pipette dipped in the appropriate glycerol stock for 8 hours at 37 °C with shaking. This was
then transferred to 150 ml of LB with antibiotics and cultured overnight at 37 °C on an orbital
shaker. All subsequent steps took place at room temperature unless otherwise stated. After
transferring to 50 ml centrifuge tubes, the culture was then centrifuged at 5000 x g for 10
minutes and the supernatant discarded. The bacterial pellet was re-suspended thoroughly with
Chapter 2 Material and Methods
66
a total of 12 ml chilled resuspension solution, following which 12 ml of lysis buffer were
added, the tube inverted 6 times and left to stand for 5 minutes. The solution was then
neutralised by adding 12 ml neutralisation solution and inverting 4 times. DNA was bound
using 9 ml binding solution and after inverting twice the mixture was transferred to the barrel
of a filter syringe and incubated for 5 minutes. During this period, a spin column was
prepared by centrifuging 12 ml of Column Preparation Solution at 3000 x g for 2 minutes.
The DNA solution was then filtered through the syringe into the spin column and centrifuged
for 2 minutes at 3000 x g. The DNA was then washed by centrifuging first with 12 ml
Column Wash Solution 1 for 2 minutes at 3000 x g then 12 ml of Column Wash Solution 2
for 5 minutes, again at 3000 x g. Finally, DNA was eluted using 3 ml Elution Buffer and
centrifuging for 5 minutes at 1000 x g. Sequencing was performed as above to verify the
plasmid as well as additional purification steps, if necessary, as described.
2.2.2 Transfection of bacterial plasmids
Cells were seeded into 6 well plates 10 x 104 cells per well. After 24 hours incubation at
37 °C, transfection was carried out using Fugene6 (Roche, Indianapolis, USA), or
polyethylenimine (PEI). All quantities refer to transfection per well of a 6 well dish. Fugene6
transfection was carried out according to the manufacturer’s instruction using an optimised
ratio of 6 µL Fugene6 : 2 µg plasmid DNA.
PEI facilitates high transfection efficiencies with low toxicity in cells that had previously
been difficult to transfect (Neu et al. 2005). PEI was used at 3 mM in 20 mM HEPES buffer
(4-(2-hydroxyethyl)-1-piperazineethanesulfonic acid), with 150 mM NaCl, allowing for 20
µL per well. As for Fugene6 transfection, plasmid DNA was used at 2 µg per well, made up
to the same volume as PEI with 20 mM HEPES buffer and 150 mM NaCl. After 5 minutes
incubation at room temperature, PEI and DNA were combined and incubated for a further 20
Chapter 2 Material and Methods
67
minutes. Immediately prior to transfection, the well medium was changed for 1 ml of SFM.
Forty microliters of transfection mix per well were then added and the plates returned to the
incubator for 4 hours. After this time, the medium was replaced with 2 ml of fresh media
supplemented with 105 U/L penicillin, 100 mg/L streptomycin and 10 % FBS.
2.2.3 siRNA transfection
Short interfering RNA (siRNA) was used to activate the RNA interference pathway,
thereby reducing specific gene expression. siRNA transfection was facilitated by
Lipofectamine 2000 (Invitrogen). Scrambled siRNA was used as a control transfection. Cells
were cultured as described in Section 2.2.2 and incubated for 24 hours. Gene specific siRNA
(see relevant chapters) or scrambled siRNA was transfected to deliver a concentration of 100
nM in serum free Opti-MEM (Invitrogen). Thirty minutes prior to transfection, media was
changed to 1 ml of serum free (SF) Opti-MEM. Six microliters of Lipofectamine and siRNA
were prepared in separate aliquots of 100 µL SF Opti-MEM and incubated for 5 minutes at
room temperature. The two solutions were then combined and incubated for a further 15
minutes, before drop-wise addition into the culture wells.
2.3 Western blotting
2.3.1 Protein Extraction and quantification
Twenty-four hours following transfection (72 hours for siRNA transfection), cells were
washed in phosphate buffered saline (PBS) then lysed in Radioimmunoprecipitation Assay
(RIPA) buffer (50 mM Tris pH 7.4, 150 mM NaCl, 1 % v/v Igepal CA-630, 6 mM sodium
deoxycholate, 1mM ethylenediaminetetraacetic acid (EDTA)), with 60 µL/ml Protease
Inhibitor Cocktail (containing 104 mM 4-(2-aminoethyl)benzenesulfonyl fluoride (AEBSF),
Chapter 2 Material and Methods
68
80 µM Aprotinin, 4 mM Bestatin, 1.4 mM E-64, 2 mM Leupeptin, 1.5 mM Pepstatin A, in
dimethyl sulfoxide (DMSO)) (Sigma), which specifically inhibits serine, cysteine and aspartic
proteases, and amidopeptidases. Lysis was completed by a 20 minute freeze-thaw cycle
followed by 30 seconds vortex mixing.
Protein concentration was measured using the bicinchoninic acid (BCA) colorimetric
assay kit (Pierce), with cell lysates compared to bovine serum albumin (BSA) standards of 0,
0.125, 0.25, 0.5, 0.75, 1 and 2 mg/ml in RIPA buffer. Both lysates and standards were
measured in duplicate, with 78.4 µL Reagent A and 1.6 µL Reagent B added to each sample.
After incubation for 30 minutes at 37 °C, absorbance was measured at 560 nM using the
Victor3 1420 Multilabel Counter (PerkinElmer). The standard curve produced from the BSA
concentrations was then used to determine the sample concentration.
2.3.2 Western blotting
Western blotting was performed as previously described (Smith et al. 2009; Watkins et
al. 2010; Read et al. 2011). 15-30 µg of protein was incubated for 5 minutes at 95 °C with 40
% v/v loading buffer (Laemmli buffer (Biorad) with 0.105 g/ml dithiothreitol (DTT, Sigma)).
The samples were then pulse centrifuged at 13,000 rpm on a bench-top centrifuge. Resolving
gel (375 mM Tris (from 1.5 M, pH 8.8 stock), 12 % acrylamide (from 30 % (w/v) acrylamide
: 0.8 % (w/v) bis-acrylamide stock (Geneflow)), 3.5 mM sodium dodecyl sulphate (SDS), 0.1
% (v/v) tetramethylethylenediamine (TEMED, Sigma), 4.4 mM ammonium persulphate
(APS)) and stacking gel (375 mM Tris (from 1.5 M, pH 6.8 stock), 5 % acrylamide, 7 mM
SDS, 0.2 % TEMED, 8.8 mM APS) were made and wells rinsed using running buffer (24.8
mM Tris, 192 mM glycine, 3.47 mM SDS). Protein samples were then separated by SDS-
Polyacrylamide Gel Electrophoresis (SDS-PAGE) in running buffer as above, with 5 µL
Precision Plus Protein Standard (Biorad) used as a molecular weight marker.

Chapter 2 Material and Methods
69
Following separation, proteins were transferred onto previously activated (immersion in
100 % methanol for 30 seconds ) PVDF membrane in transfer buffer (25.0 mM Tris, 192 mM
glycine, in 20 % methanol) at 360 mA for 1 hour. PVDF membranes were then blocked in 5
% w/v non-fat milk (Marvel) in Tris-buffered saline with Tween (TBS-T) (20 mM Tris (from
1 M, pH 7.6 stock), 137 mM NaCl, 0.00025 % v/v Tween 80) for a minimum of 1 hour at
room temperature. Primary antibodies were prepared in either 5 % w/v milk or 5 % w/v
Bovine Serum Albumin (BSA) in TBS-T. Primary antibodies were used at (v/v ratios):
polyclonal rabbit anti-human PBF 1:300, anti-Cortactin 1:1000, anti-HA (mouse) 1:2000,
anti-HA (rabbit) 1:1000, anti-Src 1:1000, suppliers are listed in individual chapters. The
membranes were incubated with 5 ml of the primary antibody on a rocker overnight at 4 °C.
Excess antibody was eliminated by washing membranes 4 times for 15 minutes in TBS-T at
room temperature before incubating with secondary antibody (horse radish peroxidase (HRP)-
conjugated polyclonal goat anti-rabbit immunoglobulin or HRP-conjugated polyclonal rabbit
anti-mouse immunoglobulin (both at 650 ng/ml) made in 5 % w/v milk in TBS-T) on a rocker
for 1 hour at room temperature. Following 6 ten minute washes with TBS-T, antigen-antibody
complexes were detected using ECL (Pierce) according to the manufacturer’s instructions.
2.4 Co-immunoprecipitation
Cells were cultured in T25 flasks and treated as required by the specific experiment.
Cells were harvested using 500 µL RIPA / 30 µL PI cocktail as above. After end-over-end
rotation at 4 °C for 10 minutes, cells were sonicated for 30 seconds (medium setting,
Bioruptor Standard, Diagenode, Liège, Belgium) before undergoing end-over-end rotation for
a further 10 minutes at 4 °C. The samples were then centrifuged at 12,000 g for 10 minutes at
4 °C and the cell lysate transferred to a clean micro-centrifuge tube. Thirty micrograms of
Chapter 2 Material and Methods
70
protein (as determined by BCA assay, above) were retained and the samples incubated with
primary antibody overnight at 4 °C with end-over-end rotation. Protein G sepharose beads
(GE Lifesciences, Little Chalfont, Buckinghamshire, UK) were pulse washed with RIPA
buffer before a 1:1 (v:v) bead slurry was prepared with RIPA. Fifty microliters of slurry were
added to the samples and incubated for 2 hours at 4 °C with end-over-end rotation. Pulse
centrifugation precipitated the beads and the supernatant was discarded. The beads were
washed in 500 µL RIPA by pulse centrifugation 4 times. Bound proteins were then eluted
with loading buffer (1:20 β-mercaptoethanol and 1 % SDS in Laemlli buffer and incubated at
37 °C for 30 minutes). Loading buffer was added to the retained cell lysates and both these
and the samples were analysed by Western blotting as described above.
2.5 GST-tagged pull down assays
2.5.1 Expression of GST-tagged PBF
The pGEX plasmid (Amersham, Biosciences, Little Chalfont, Buckinghamshire, UK)
was used to express PBF as a fusion protein with a GST tag as previously described (Turnell
et al. 2000; Smith et al. 2009). This was expressed from overnight cultures of E. Coli; After
induction with isopropyl β-D-1-thiogalactopyranoside for 3 hours, the culture was centrifuged
at 5000 rpm for 5 minutes. The pellet was re-suspended in 14 ml lysis buffer (8 M urea, 15
mM Tris–HCl, pH 7.4, 15 mM beta-mercaptoethanol), with the remainder of the process
carried out on ice. After sonicating 4 times for 1 minute, the solution was centrifuged twice at
18,000 rpm for 20 and 5 minutes, preserving the supernatant. The supernatant was again
preserved and combined with 1 ml of packed agarose beads, before being incubated on a
rotating mixer at 4 °C overnight. The beads and bound protein were isolated by centrifugation
at 3000 rpm for 5 minutes, and subsequently washed 4 times by centrifugation in 50 ml GST

Chapter 2 Material and Methods
71
lysis buffer (50 mM Tris pH 7.5, 150 mM NaCl, 0.05 % NP-40) and in 50 ml then 15 ml
EDTA buffer (50 mM Tris-HCl pH 7.4, 0.5 M NaCl, 5 % sucrose (w/v), 1 mM EDTA and 1
% NP-40). GST-PBF was eluted from the beads with 3 ml elution buffer (40 μl of 25 mM
glutathione in 50 mM Tris-HCl, pH 8,) for 3 hours at 4 °C. The protein was finally purified by
dialysis tubing in EDTA buffer with a cut off of 12-14 kDa.
2.5.2 Translation of L-α-[35S]-methionine labelled protein
The TNT Couples Reticulocyte Lysate System (Promega) was used to translate and
[35S]-methionine label each protein of interest from the relevant plasmid, according to the
manufacturer’s instructions. The reaction consisted of: 25 µL rabbit Reticulocyte lysate, 2 µL
TNT buffer, 1 µL amino acid mixture (minus methionine), 0.5 µL RNAsin Ribonuclease
Inhibitor, 2 µg plasmid DNA, 2 µL [35S]-methionine, 1 µL TNT RNA polymerase and 17 µL
nuclease free water. This was then incubated for 2 hours at 30 °C.
2.5.3 Binding assay
Twenty micrograms of GST-PBF (and separately 20 µg GST only control) were
combined with 10 µL [35S]-methionine labelled protein and incubated on ice for 30 minutes.
After the addition of 500 µL low salt buffer (50 mM Tris pH 7.4, 150 mM NaCl, 1 % NP-40),
50 µL packed glutathione agarose beads were added to each sample and incubated at 4 °C for
2 hours with end over end rotation. The beads were then pulsed and the supernatant discarded
before washing 4 times with low salt buffer. GST-PBF was then eluted with 40 µL of 25 mM
glutathione in 50 mM Tris pH 8 for 1 hour at 4 °C. Subsequently, 40 µL of loading buffer
(Laemmli sample buffer with 5% (v/v) β-mercaptoethanol) were added to each sample and
analysed by SDS-PAGE. 1 µL [35S]-methionine labelled protein was combined with 20 µL
Chapter 2 Material and Methods
72
loading buffer and run as a 10 % input control. Following electrophoresis, the gel was dried
and exposed to radiographic film for between 1 and 24 hours at –20 °C.
2.6 Fluorescence immunocytochemistry
Glass cover slips were washed in 100 % ethanol, rinsed in PBS and placed in 34.8 mm
diameter cell culture plates. Cells were seeded into the wells at a varied concentration
depending on cell type: K1 – 75,000 / well, TPC1 and HeLa – 50,000 / well.
After 24 hours growth, transfection was carried out as described previously. After a
further 72 hours, medium was removed and the wells rinsed with 1 ml PBS. The following
steps took place at room temperature unless otherwise stated. The coverslips were fixed for 20
minutes in 800 µL fixing solution (0.1 M phosphate buffer (from 0.2 M Na2HPO4 pH
corrected to 7.4 using 0.2 M NaH2PO4), 0.2 % paraformaldehyde, 0.2 % glucose, 0.02 %
sodium azide). After rinsing twice with PBS, cells were permeabilised with 800 µL of chilled
100 % methanol for 20 minutes. Cells were rinsed again twice with PBS and then blocked
with 800 µL 10% newborn calf serum (NCS) in PBS. After blocking, the coverslips were
placed face down onto 80 µL of 1 % BSA in PBS with primary antibody, on parafilm and
incubated in the dark for 1 hour. Specific antibody concentrations are detailed in the relevant
chapters. Subsequently, the coverslips were rinsed 3 times with PBS, then placed face down
onto 80 µL of 1 % BSA in PBS with 1 % NCS, 1:250 Alexa Fluor® 488 Goat Anti-Mouse
IgG (H+L) (Invitrogen), 1:250 Alexa Fluor® 594 Goat Anti-Rabbit IgG (H+L) (Invitrogen)
and 1:1000 Hoechst stain 33258 (Sigma) and incubated for 1 hour in the dark. The coverslips
were again rinsed 3 times in PBS and after removing any excess liquid were mounted on to
slides using Fluorescent Mounting Medium (Dako) and air dried in the dark. Coverslips were

Chapter 2 Material and Methods
73
then fixed to the slides using nail varnish (Monsoon Accessorize, London, UK) and slides
stored at 4 °C.
2.7 Human primary thyroid cultures
Fresh thyroid tissue was obtained from patients undergoing thyroidectomy
(hemi/total/completion) with the approval of the Local Research Ethics Committee. All
patients gave written informed consent for their tissue to be collected. Collected thyroid tissue
was surplus to histological requirements, and was taken from an area of macroscopically
normal tissue in the contra-lateral lobe to the site of disease. Thyroid tissue was collected
from patients with diagnoses of multinodular goitre, suspicious thyroid nodules and thyroid
cancer.
Thyroid specimens were prepared as described previously (Eggo et al. 1996). Thyroid
tissue was extensively macerated under sterile conditions until a smooth consistency was
obtained. The tissue was then digested in 0.2 % collagenase Type 2 (Worthington
Biochemicals, NJ, USA) in Hanks’ Balanced Salt Solution (HBSS) (Sigma) (filter sterilised
through a 0.22µm pore 54.5 cm polyethersulfone membrane (Corning)) for 16 hours at room
temperature or 3 hours at 37 °C. The resulting tissue was further filtered through a 1 ml sieve
and the pellet washed in HBSS. The pellet was re-suspended in primary thyroid media as
described previously (Ambesi-Impiombato 1986; Eggo et al. 1996): 1 x Coon’s modified
Hamm’s F-12 modified medium (Biochrom AG) with 30 mM sodium bicarbonate made up to
1 litre with H₂O then sterilised as above, supplemented with 105 U/L penicillin, 100 mg/L
streptomycin, 300 U/L thyroid stimulating hormone, 300 µg/L insulin and 5 % fetal bovine
serum, and, after plating, incubated at 37 °C. After 72 hours, serum was omitted. Cells were
considered ready for experimentation between days 9 and 11.
Chapter 2 Material and Methods
74
2.8 Statistical analysis
Data were analysed using IBM SPSS Statistics Version 19 (IBM, UK). Normal
distribution of data was determined and parametric data groups were analysed by student’s t-
test. Significance was taken as p < 0.05. ImageJ (public domain software, available at
http://rsb.info.nih.gov/ij/) was used to calculate scanning densitometry results.

Chapter 3 Optimisation of tandem mass spectrometry
75
Chapter 3 Optimisation of tandem mass spectrometry

Chapter 3 Optimisation of tandem mass spectrometry
76
3.1 Introduction
Despite being first described over 10 years ago (Chien and Pei 2000), relatively little is
understood regarding the precise role of PBF within the cell, certainly compared to its named
binding partner PTTG. The majority of the work concerning PBF has focussed on its
involvement with thyroid disease, and specifically thyroid cancer (see section 1.4.2). PBF
over-expression has a diverse range of effects within the cell, interacting with NIS and
internalising it from the cell membrane (Boelaert et al. 2007; Smith et al. 2009), with a similar
effect observed in relation to the thyroid hormone transporter MCT8 (Smith et al. 2012). PBF
is transforming in vitro, tumourigenic in vivo, and over-expression is found in thyroid cancers
and is associated with early cancer recurrence (Stratford et al. 2005). It has recently been
shown to be additionally related to the presence of metastases, advanced stage, multicentricity
and increased mortality; acting as an independent prognostic indicator (Hsueh et al. 2013).
PBF also increases the invasiveness of breast cancer cells in vitro (Watkins et al. 2010), an
observation which may underlie the increased recurrence observed in thyroid cancer.
To help explain this diversity of effect it is important to understand the breadth of PBF
relationships within the cellular interactome. Currently described interactors with PBF are
PTTG (Chien and Pei 2000), NIS (Smith et al. 2009), MCT8 (Smith et al. 2012) and p53
(unpublished data) but these are insufficient to fully explain the range of effects PBF is
involved in. Key areas of interest include proteins involved in the movement of PBF around
the cell, allowing it to reach the cell membrane and internalise the membrane transporters.
Given the association with early cancer recurrence, another is any role of PBF in pathways
associated with invasion or metastasis. A final area of specific interest is the identification of
the serine/threonine or tyrosine kinases which may be responsible for phosphorylating PBF.
Chapter 3 Optimisation of tandem mass spectrometry
77
MS/MS is a tool that is developing momentum as the optimum method of identifying
protein-protein interactions. Although several variations exist, one of the most straightforward
is the analysis of samples that have been immunoprecipitated with the protein of interest.
With the powerful detection that is inherent in MS/MS also come limitations. The first of
these is the contamination of test samples by material exogenous to the experimental process
(i.e. dust, skin etc.). Where small amounts of target protein are present, these additions can
significantly hamper results. The second is the software used to analyse the mass spectra.
Each protein has a unique fingerprint, based on the position of trypsin digestion sites and the
subsequent chains of amino acids generated. When a peptide chain is analysed, the resulting
mass spectrum, caused by the ionisation and fragmentation of the peptide, is assigned by the
software to a protein. If the spectrum contains all possible fragments of the peptide (therefore
scoring highly), and the protein is identified by several such peptide spectra, it can be
assumed that it is genuinely present in the sample. Unfortunately, where the spectrum is
ambiguous, containing some identified and some unidentified peaks, it may be assigned
incorrectly to a protein. In these cases it is likely that only 1 peptide will be assigned to this
protein, and it can therefore be discarded from further analysis. A difficulty arises where a
protein that is present, but in low quantities, is only identified by 1 peptide and is therefore
wrongly excluded. A way to account for this is to either examine the spectra for these proteins
manually to determine if it is accurate, or to match those proteins identified by 1 peptide
across several experiments, lending credibility to what may otherwise have been a discarded
result.
The aim of this chapter, therefore, was to establish the optimal conditions for MS/MS,
from cell culture, transfection and immunoprecipitation to gel digest, MS/MS and data

Chapter 3 Optimisation of tandem mass spectrometry
78
analysis. Key contaminants and non-specific interactions would be identified and spreadsheet
templates to facilitate the fast analysis of the large amounts of data would be produced.
3.2 Methods
3.2.1 Cell culture
K1 and TPC1 cells were maintained in RPMI as described in Section 2.1. For analysis
by Western blotting, cells were seeded onto 6 well plates; for immunoprecipitation, T25 and
T75 flasks were used.
3.2.2 Bacterial plasmids
PBF-HA in pci-Neo was sublcloned into pcDNA3.1+ using the restriction enzymes
EcoR1 and Xba1 as described in Section 2.2.1. Transfection was carried out using Fugene6 or
PEI as described in Section 2.2.2.
3.2.3 Fluorescence-activated cell sorting (FACS)
K1 and TPC1 cells were transfected with the pMax-GFP plasmid (Amaxa, Cologne,
Germany). After 24 hours, cells were processed as described in Section 2.3.1, with 1 %
paraformaldehyde instead of RIPA / PI. After transferring to a test tube, samples were
analysed using the FACSCalibur 4-colour flow cytometer (BD Biosciences, Oxford, UK).
GFP was detected in the FL1 channel with settings calibrated using mock-transfected cells as
a negative control. FL1 was set to log 400 with an amplification gain of 400. Forward and
side scatter were set to linear. The M1gate was set at approximately 2.5 x 101.

Chapter 3 Optimisation of tandem mass spectrometry
79
3.2.4 Western blotting
Western blotting was performed as described in Section 2.3. Primary antibodies were
anti-HA (mouse monoclonal, HA.11 Clone 16B12, Covance, UK) 1:2000 and monoclonal
anti-β-actin (clone AC-15, Sigma-Aldrich), 1:10000.
3.2.5 Tandem mass spectrometry (MS/MS)
3.2.5.1 Immunoprecipitation
K1 and TPC1 cells were cultured in T75 flasks and transfected with PBF-HA or blank
vector using PEI, as described in Section 2.4. Cells were washed 4 times with 10 ml cold PBS
then scraped into a 50 ml centrifuge tube, combining samples from several T75 flasks in each
tube. The samples were spun for 5 minutes at 1200 rpm and the supernatant discarded. The
cells were re-suspended in 1ml of high salt lysis buffer (50 mM Tris pH 7.4, 1% v/v Igepal
CA-630, 400 mM NaCl) / PI cocktail (ratio 1 ml lysis buffer:60 µl PI) and the resultant
suspension transferred to a micro-centrifuge tube. Subsequent steps were as described in
Section 2.4, using anti-HA (above) as primary antibody and high salt lysis buffer instead of
RIPA.
Proteins were separated using the NuPage Bis-Tris electrophoresis system (Invitrogen)
as per manufacturer’s instructions, using 1x running buffer with 500 µl NuPage antioxidant.
Under positive pressure in dust-free conditions, the gels were removed from the casing and
incubated in Colloidal Coomassie Blue stain (0.08 % Coomassie Brilliant Blue G250 (Sigma),
1.6 % Orthophosphoric Acid, 8 % Ammonium Sulphate, 20 % Methanol) with gentle
agitation overnight at room temperature. Gels were de-stained with 4 to 5 washes in 1 %
acetic acid and stored in 1 % acetic acid at 4 °C until digest.

Chapter 3 Optimisation of tandem mass spectrometry
80
3.2.5.2 Gel digest
All steps were undertaken in a positive pressure hood to minimize keratin contamination
and all washes and incubations carried out at room temperature with gentle agitation unless
otherwise stated. Gels were scanned and processed to allow identification of visible bands.
The gels were then placed onto a clean glass slide and each lane excised and divided into
sections approximately 2 mm in height. Gel pieces were washed twice with 500 µl 50 %
acetonitrile / 50 mM ammonium bicarbonate for 45 minutes. They were then incubated for
one hour at 56 °C with 50 µl of 50 mM DTT in 10 % acetonitrile/50 mM ammonium
bicarbonate and the supernatant discarded. After adding 50 µl of 100 mM iodoacetamide in
10 % acetonitrile with 50 mM ammonium bicarbonate, samples were incubated in the dark for
30 minutes and the supernatant removed. A further three washes with 500 µl 10 %
acetonitrile in 40 mM ammonium bicarbonate for 15 minutes were undertaken and the bands
subsequently dried down using a vacuum centrifuge for 60 minutes. 200 µg / ml trypsin
solution were prepared using Sequencing Grade Modified Trypsin (Promega) according to the
manufacturer’s instructions and diluted to 12 µg / ml with 10 % acetonitrile with 40 mM
ammonium bicarbonate. 30 µl of this were added to the dried gel pieces and the samples
incubated for 60 minutes. 40 µl of 10 % acetonitrile with 40 mM ammonium bicarbonate
were added and the samples incubated at 37 °C overnight. The supernatant was collected and
the samples incubated in 60 µl of 3 % formic acid for 60 minutes. After collecting the
supernatant, a further 60 µl of formic acid were added to the gel pieces and incubated for 60
minutes. The supernatant was again retained and combined with the previous sample
collected.
Chapter 3 Optimisation of tandem mass spectrometry
81
3.2.5.3 Sample processing
100 µl of sample were loaded into clean sample tubes. These were then loaded into the
Ultimate 3000 High Performance Liquid Chromatography (HPLC) unit (Dionex, California,
USA) as per manufacturer’s instructions. An acetonitrile gradient was used as advised.
Following HPLC, the samples were run in continuity through the AmaZon ETD ion trap and
tandem mass spectrometer (Bruker Daltronics, Coventry, UK).
3.2.5.4 Data analysis
Mass spectrographs were analysed using a pan-mammalian database via the Mascot
search engine (v2.2.06, Matrix Science Ltd, London, UK), with results generated by
ProteinScape (v3.0.0.446, Bruker, Coventry, UK).
3.3 Results
3.3.1 Optimisation of transfection efficiencies for K1 and TPC1 cells
3.3.1.1 Subcloning PBF-HA into pcDNA3.1
Full length PBF-HA, already in use within our group in the mammalian expression
vector pCI-Neo, was subcloned into pcDNA3.1+, using the restriction enzymes EcoR1 and
Xba1, as described in section 2.2.1.2. Correct insertion was confirmed by sequencing using
the T7 and BGHrev primers. Transfection was confirmed by Western blotting (Figure 3.1).

Chapter 3 Optimisation of tandem mass spectrometry
82
Figure 3.1 Western blot demonstrating PBF-HA transfection in K1 cells, compared to untransfected (UT) and vector only (VO) transfected cells. β actin is shown as a loading control.
3.3.1.2 Polyethylenimine results in the greatest transfection efficiencies
In order to obtain the greatest transfection efficiency (TE) for the thyroid cancer cell
lines, Fugene6 – the transfection reagent used for transfection of K1 and TPC1 cells within
our group, was compared with polyethylenimine (PEI, Sigma). Cells were transfected with a
Green Fluorescent Protein (GFP) -tagged vector (pMax-GFP (Amaxa, Cologne, Germany))
and, after trypsinisation, were analysed by Fluorescence-Activated Cell Sorting (FACS). K1
and TPC1 cells were transfected under a number of conditions, with varying amounts of
transfection reagent, plasmid DNA and agitation. Untransfected cells were used as a negative
control – as they demonstrated only base line fluorescence, a cut off could be set above which
the cells were classed as “transfected” (the “M1 gate”, Figure 3.2A). When transfected cells
were analysed under the same conditions, the percentage of cells that fell within the M1 gate,
and could thus be classed as transfected, was determined (Figure 3.2B).

Chapter 3 Optimisation of tandem mass spectrometry
83
Figure 3.2 Representative FACS output from cells untransfected (A) and transfected (B) with pMax-GFP. The FL1 axis indicated the degree of fluorescence, with the y axis representing the number of cells. The percentage of M1 gated cells was substantially higher for the transfected sample compared to the untransfected cells.
Each set of transfections was carried out in triplicate and repeated on 3 occasions with a
different passage of cells. For PEI transfection, using NaCl supplemented serum-free media
improved transfection (data not shown). Centrifuging the plates after transfection had a
negative effect on transfection of K1 cells (many cells became detached) but in the TPC1 cell
line, although a negative trend was seen, variability was such that no significance could be
attributed to this. The optimum ratio of PEI to DNA was 10:1, using 2 µg DNA for K1s and
4 µg DNA for TPC1s (for a 6 well plate transfection). The maximum TE was 81.4 ± 1.6 %
for K1s and 55.5 ± 4.8 % for TPC1s (Figure 3.3).
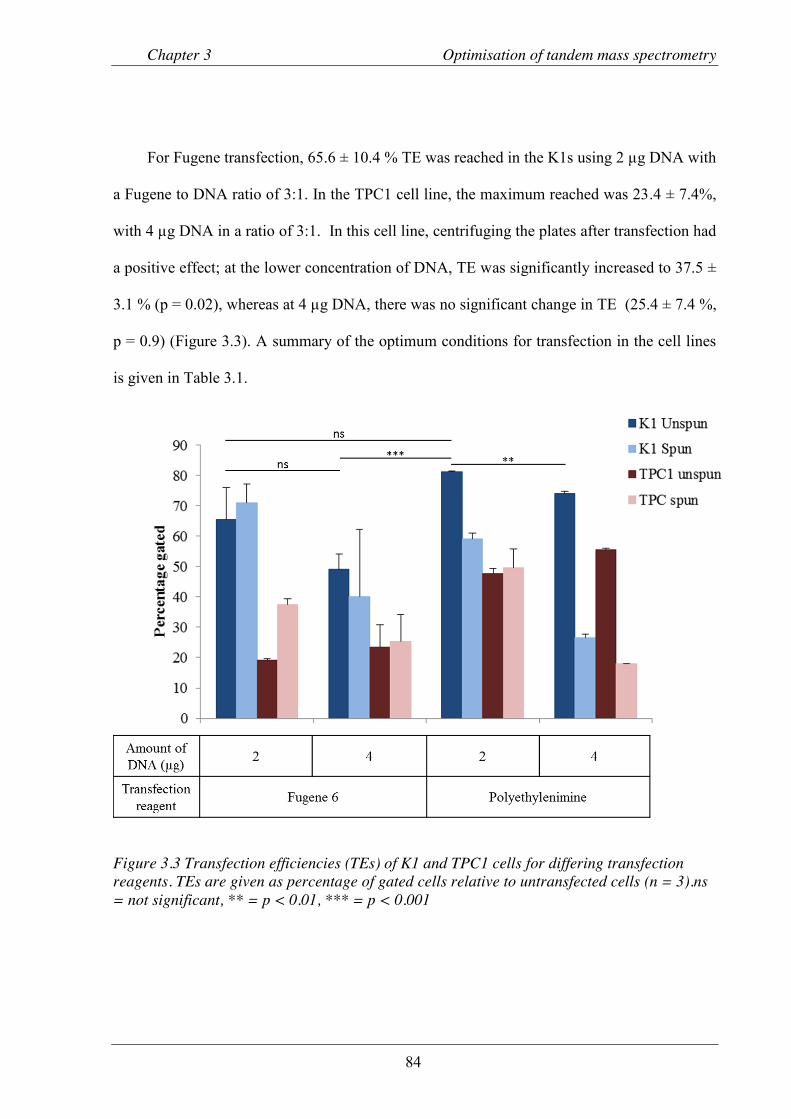
Chapter 3 Optimisation of tandem mass spectrometry
84
For Fugene transfection, 65.6 ± 10.4 % TE was reached in the K1s using 2 µg DNA with
a Fugene to DNA ratio of 3:1. In the TPC1 cell line, the maximum reached was 23.4 ± 7.4%,
with 4 µg DNA in a ratio of 3:1. In this cell line, centrifuging the plates after transfection had
a positive effect; at the lower concentration of DNA, TE was significantly increased to 37.5 ±
3.1 % (p = 0.02), whereas at 4 µg DNA, there was no significant change in TE (25.4 ± 7.4 %,
p = 0.9) (Figure 3.3). A summary of the optimum conditions for transfection in the cell lines
is given in Table 3.1.
Figure 3.3 Transfection efficiencies (TEs) of K1 and TPC1 cells for differing transfection reagents. TEs are given as percentage of gated cells relative to untransfected cells (n = 3).ns = not significant, ** = p < 0.01, *** = p < 0.001
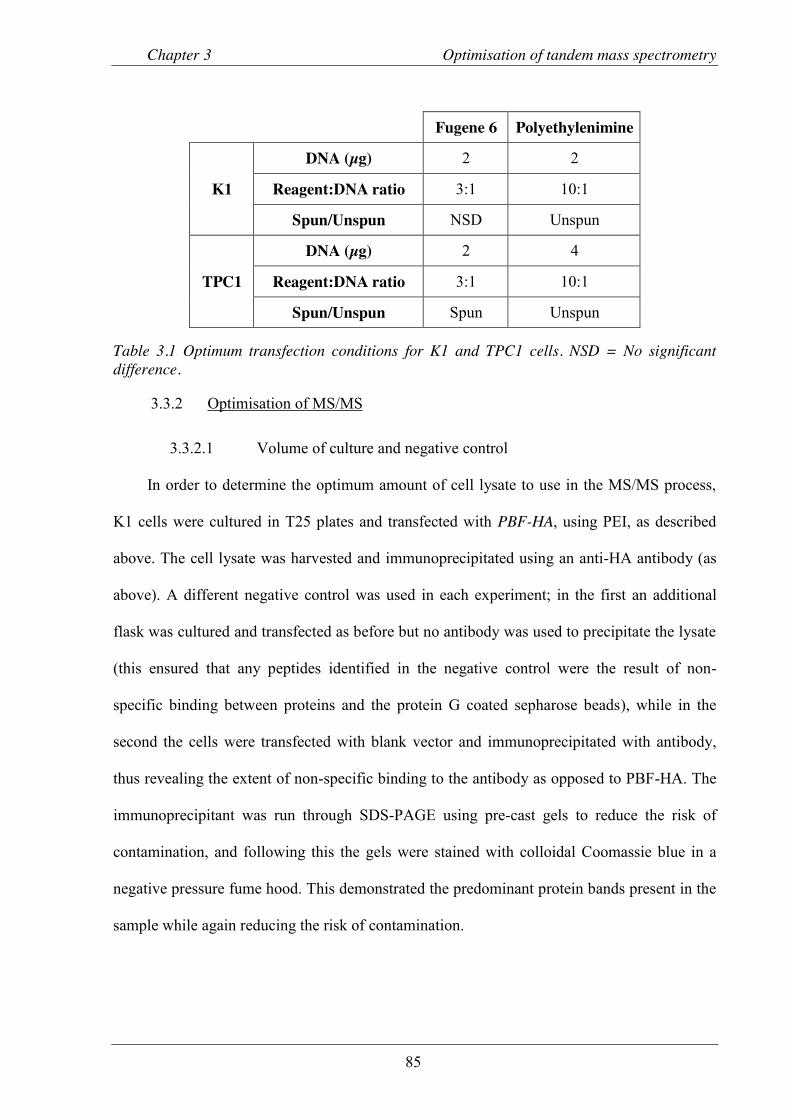
Chapter 3 Optimisation of tandem mass spectrometry
85
Fugene 6 Polyethylenimine
K1
DNA (µg) 2 2
Reagent:DNA ratio 3:1 10:1
Spun/Unspun NSD Unspun
TPC1
DNA (µg) 2 4
Reagent:DNA ratio 3:1 10:1
Spun/Unspun Spun Unspun
Table 3.1 Optimum transfection conditions for K1 and TPC1 cells. NSD = No significant difference.
3.3.2 Optimisation of MS/MS
3.3.2.1 Volume of culture and negative control
In order to determine the optimum amount of cell lysate to use in the MS/MS process,
K1 cells were cultured in T25 plates and transfected with PBF-HA, using PEI, as described
above. The cell lysate was harvested and immunoprecipitated using an anti-HA antibody (as
above). A different negative control was used in each experiment; in the first an additional
flask was cultured and transfected as before but no antibody was used to precipitate the lysate
(this ensured that any peptides identified in the negative control were the result of non-
specific binding between proteins and the protein G coated sepharose beads), while in the
second the cells were transfected with blank vector and immunoprecipitated with antibody,
thus revealing the extent of non-specific binding to the antibody as opposed to PBF-HA. The
immunoprecipitant was run through SDS-PAGE using pre-cast gels to reduce the risk of
contamination, and following this the gels were stained with colloidal Coomassie blue in a
negative pressure fume hood. This demonstrated the predominant protein bands present in the
sample while again reducing the risk of contamination.
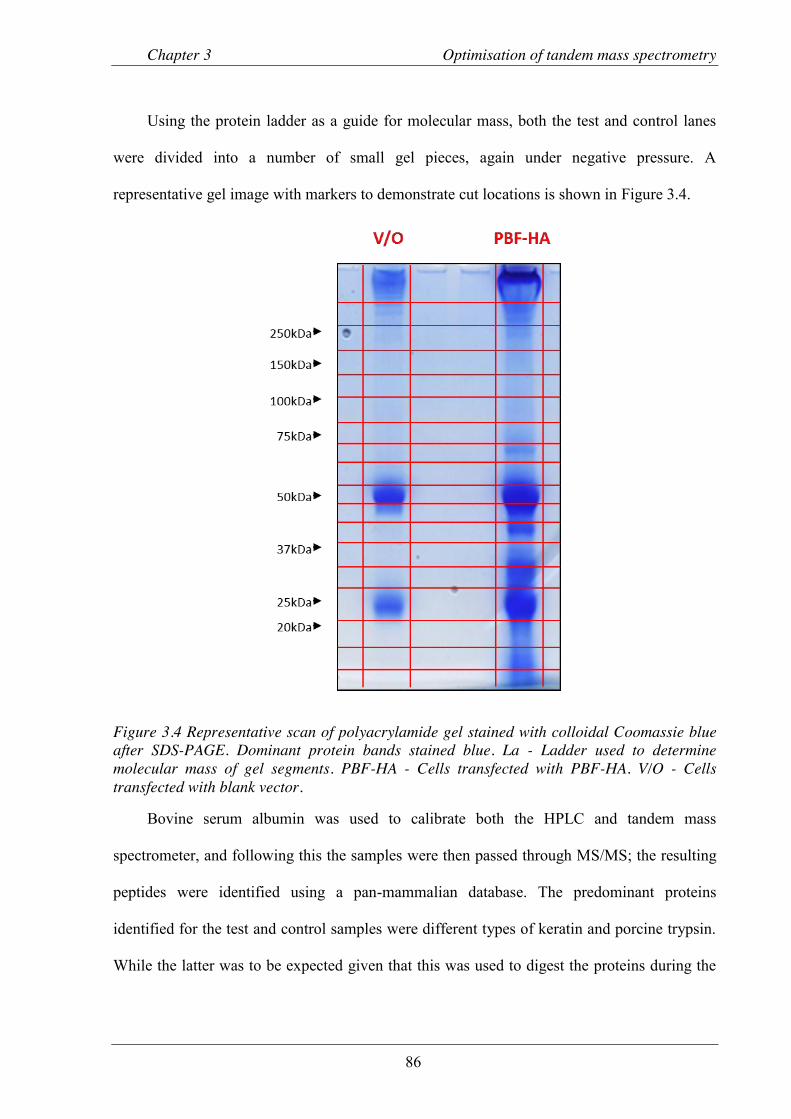
Chapter 3 Optimisation of tandem mass spectrometry
86
Using the protein ladder as a guide for molecular mass, both the test and control lanes
were divided into a number of small gel pieces, again under negative pressure. A
representative gel image with markers to demonstrate cut locations is shown in Figure 3.4.
Figure 3.4 Representative scan of polyacrylamide gel stained with colloidal Coomassie blue after SDS-PAGE. Dominant protein bands stained blue. La - Ladder used to determine molecular mass of gel segments. PBF-HA - Cells transfected with PBF-HA. V/O - Cells transfected with blank vector.
Bovine serum albumin was used to calibrate both the HPLC and tandem mass
spectrometer, and following this the samples were then passed through MS/MS; the resulting
peptides were identified using a pan-mammalian database. The predominant proteins
identified for the test and control samples were different types of keratin and porcine trypsin.
While the latter was to be expected given that this was used to digest the proteins during the

Chapter 3 Optimisation of tandem mass spectrometry
87
extraction process, the former were all due to contamination of the samples at one, or several
points, of the process from gel staining to entry into HPLC. There were several other proteins
identified in all samples across both experiments, again most likely resulting from
contamination, and these are summarised in Table 3.2.
Contaminant Collagen Dermcidin
Desmoglein Desmoplakin
Dynein Hornerin
Junction plakoglobin Keratin
Kinesin Laminin
Myosin Vimentin
Table 3.2 Proteins identified as contaminants in both experiments and in multiple samples.
Once these contaminants had been discounted, the control samples were examined to
identify those proteins present due to non-specific binding, either to the anti-HA antibody or
to the sepharose beads. This was determined to be any protein identified by greater than 2
peptides in either of the control samples, which was not in the contaminant list above. In
general, the number of peptides by which these were identified ranged from 3 to 8, while the
contaminants were identified by > 30 peptides. The other group of proteins were those that
had been carried over to MS/MS during the preceding steps. These included trypsin, as
mentioned above, immunoglobulins and proteins likely remaining from the culture process
(e.g. bovine albumin). A list was thus developed of proteins whose presence in a test sample
was unlikely to be attributable to interaction with PBF, and could therefore be discounted, the
highest ranking of which are listed in Table 3.3.
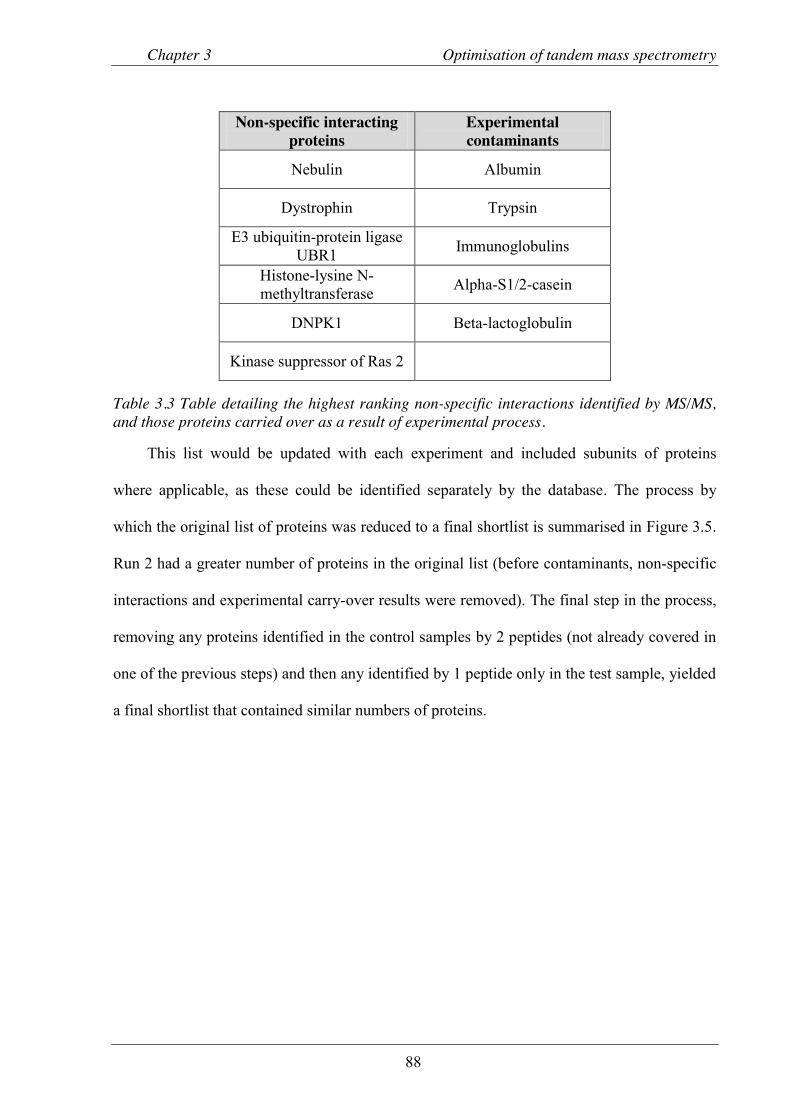
Chapter 3 Optimisation of tandem mass spectrometry
88
Non-specific interacting proteins
Experimental contaminants
Nebulin Albumin
Dystrophin Trypsin
E3 ubiquitin-protein ligase UBR1 Immunoglobulins
Histone-lysine N-methyltransferase Alpha-S1/2-casein
DNPK1 Beta-lactoglobulin
Kinase suppressor of Ras 2
Table 3.3 Table detailing the highest ranking non-specific interactions identified by MS/MS, and those proteins carried over as a result of experimental process.
This list would be updated with each experiment and included subunits of proteins
where applicable, as these could be identified separately by the database. The process by
which the original list of proteins was reduced to a final shortlist is summarised in Figure 3.5.
Run 2 had a greater number of proteins in the original list (before contaminants, non-specific
interactions and experimental carry-over results were removed). The final step in the process,
removing any proteins identified in the control samples by 2 peptides (not already covered in
one of the previous steps) and then any identified by 1 peptide only in the test sample, yielded
a final shortlist that contained similar numbers of proteins.
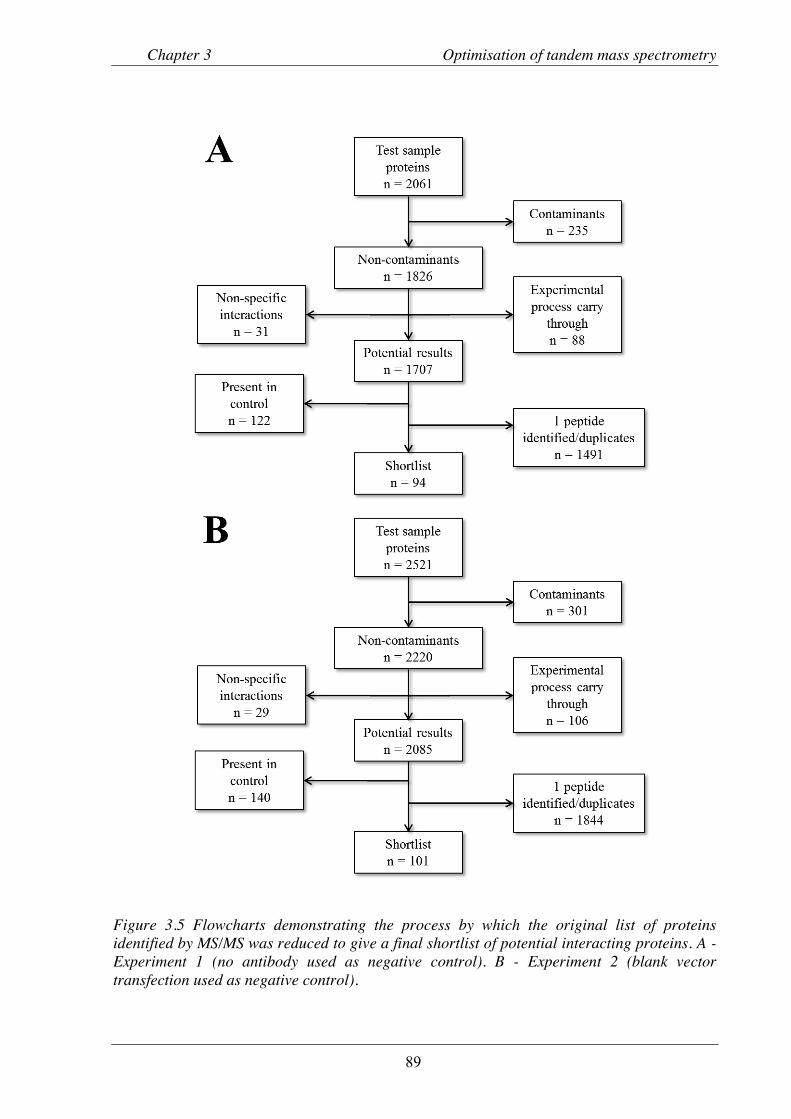
Chapter 3 Optimisation of tandem mass spectrometry
89
Figure 3.5 Flowcharts demonstrating the process by which the original list of proteins identified by MS/MS was reduced to give a final shortlist of potential interacting proteins. A - Experiment 1 (no antibody used as negative control). B - Experiment 2 (blank vector transfection used as negative control).
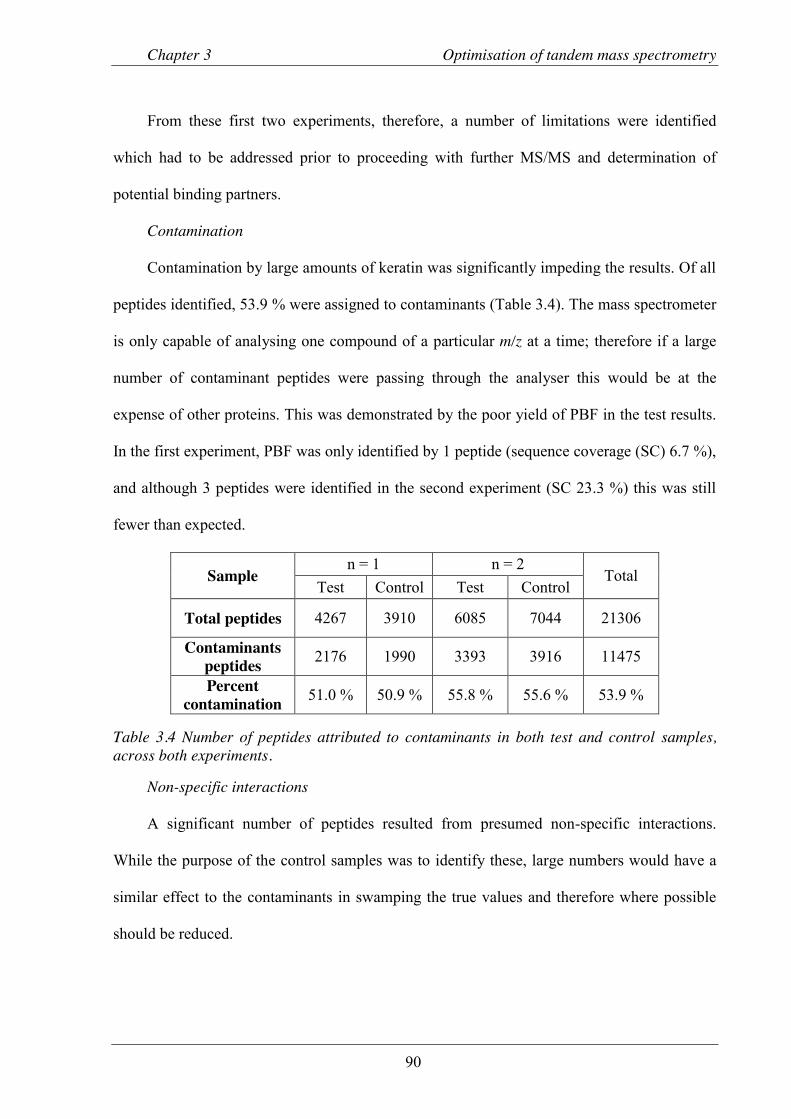
Chapter 3 Optimisation of tandem mass spectrometry
90
From these first two experiments, therefore, a number of limitations were identified
which had to be addressed prior to proceeding with further MS/MS and determination of
potential binding partners.
Contamination
Contamination by large amounts of keratin was significantly impeding the results. Of all
peptides identified, 53.9 % were assigned to contaminants (Table 3.4). The mass spectrometer
is only capable of analysing one compound of a particular m/z at a time; therefore if a large
number of contaminant peptides were passing through the analyser this would be at the
expense of other proteins. This was demonstrated by the poor yield of PBF in the test results.
In the first experiment, PBF was only identified by 1 peptide (sequence coverage (SC) 6.7 %),
and although 3 peptides were identified in the second experiment (SC 23.3 %) this was still
fewer than expected.
Sample n = 1 n = 2
Total Test Control Test Control
Total peptides 4267 3910 6085 7044 21306
Contaminants peptides 2176 1990 3393 3916 11475
Percent contamination 51.0 % 50.9 % 55.8 % 55.6 % 53.9 %
Table 3.4 Number of peptides attributed to contaminants in both test and control samples, across both experiments.
Non-specific interactions
A significant number of peptides resulted from presumed non-specific interactions.
While the purpose of the control samples was to identify these, large numbers would have a
similar effect to the contaminants in swamping the true values and therefore where possible
should be reduced.
Chapter 3 Optimisation of tandem mass spectrometry
91
Low peptide yield
As well as reducing swamping, increasing the amount of lysate present would improve
the average peptide yield per protein, helping to identify the true binding partners.
To manage these limitations, the following conditions were changed:
x Cell culture was carried out in T75 flasks, increasing the seeding area and cell count at
confluency by 3 fold.
x High salt lysis buffer reduces non-specific interactions when immunoprecipitating for
mass spectrometry (Shimwell et al. 2009) and this was therefore used in place of RIPA
buffer. Additional wash steps were performed prior to cell lysis to remove as many
residual proteins as possible.
x All steps of the procedure were undertaken in negative pressure conditions, using
unopened, sealed microcentrifuge tubes for each experiment to reduce the risk of external
contamination.
For the third experiment, again using K1s, the negative control used was blank vector
transfected cells, with an additional list of control proteins transferred from the first 2
experiments. The process by which the shortlist of proteins was generated is described in
Figure 3.6.

Chapter 3 Optimisation of tandem mass spectrometry
92
Figure 3.6 Flowchart demonstrating the process by which the shortlist of potential binding partners was generated.
There was less contamination, with 25.9 % of peptides belonging to contaminants (as
opposed to 50.9 % and 55.7 % in the first 2 experiments) (Table 3.5).
Sample n = 1 n = 2 n = 3
Test Control
Total peptides 8177 13129 6522 9452
Contaminants peptides 4166 7309 1307 2998
Percent contamination 50.9 % 55.7 % 20.0 % 31.7 %
Table 3.5 Comparison of the number of peptides attributed to contamination. Experiment 1 (no antibody negative control) and Experiment 2 (blank vector negative control) show totals for both test and control results.
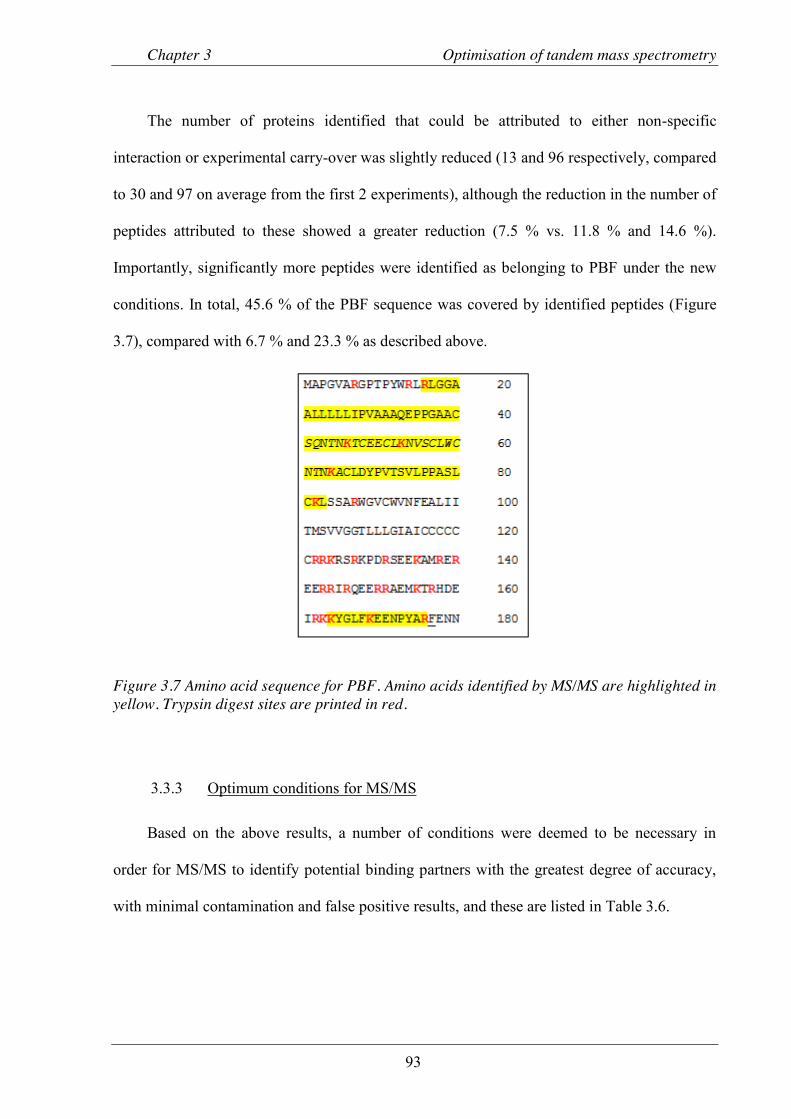
Chapter 3 Optimisation of tandem mass spectrometry
93
The number of proteins identified that could be attributed to either non-specific
interaction or experimental carry-over was slightly reduced (13 and 96 respectively, compared
to 30 and 97 on average from the first 2 experiments), although the reduction in the number of
peptides attributed to these showed a greater reduction (7.5 % vs. 11.8 % and 14.6 %).
Importantly, significantly more peptides were identified as belonging to PBF under the new
conditions. In total, 45.6 % of the PBF sequence was covered by identified peptides (Figure
3.7), compared with 6.7 % and 23.3 % as described above.
Figure 3.7 Amino acid sequence for PBF. Amino acids identified by MS/MS are highlighted in yellow. Trypsin digest sites are printed in red.
3.3.3 Optimum conditions for MS/MS
Based on the above results, a number of conditions were deemed to be necessary in
order for MS/MS to identify potential binding partners with the greatest degree of accuracy,
with minimal contamination and false positive results, and these are listed in Table 3.6.

Chapter 3 Optimisation of tandem mass spectrometry
94
Co-immunoprecipitation
Culture K1 cells in a T75 flask
Transfect 15 µg DNA
Transfect using PEI at 10:1
Lyse and wash using high salt lysis buffer
Use sterile, new microcentrifuge tubes for each step
Gel staining and digest Work in negative pressure hood for all steps
Analysis of output
Discard all contaminants Discard proteins identified as non-specific interactors Produce a shortlist based on proteins not found in a control sample and identified by ≥ 2 peptides
Table 3.6 Summary of the optimum conditions needed for MS/MS.
3.4 Discussion
MS/MS provides a valuable method of identifying small amounts of protein from within
a complex sample, although it is prone to misleading results due to contamination and non-
specific interactions in the case of immunoprecipitated proteins. The aim of this chapter was
to define the optimum conditions for co-immunoprecipitation and MS/MS, in order to
develop a protocol that would allow for the accurate identification of potential binding
partners of PBF.
Once the PBF-HA cDNA had been successfully sub-cloned into the vector pcDNA3.1+,
optimum transfection conditions were determined using FACS. It was essential that a high
level of transfection was achieved; the immunoprecipitation step relied on the transfected HA
tag, therefore low levels of transfection would result in a smaller amount of PBF-HA
immunoprecipitating and with that a smaller number of interacting proteins. By using K1 and
TPC1 cells transfected with pMax-GFP, FACS identified those cells that had undergone
transfection by their degree of fluorescence. Altering the amount of plasmid DNA as well as

Chapter 3 Optimisation of tandem mass spectrometry
95
transfection reagent allowed for multiple conditions to be assessed, with TEs of 81.4 % for
K1 and 55.5 % for TPC1 cells achieved.
Once the optimal conditions for transfection had been established, the cells were lysed
and passed through MS/MS. In the two initial experiments, 2 different negative controls were
implemented. The first, using cells that had been transfected with PBF-HA as for the test
samples but immunoprecipitated without the anti-HA antibody, identified those proteins
present in the output data as a result of binding to the protein G sepharose beads and any that
had been carried across as a result of the experimental process. In the second, the negative
control was treated in exactly the same way as the test sample, but the cells were transfected
with blank vector only. This had the advantage of identifying the same group of proteins as
the first control, but with the addition of any proteins that had been carried through as a result
of non-specific binding to the anti-HA antibody. Together, these 2 controls were able to
provide a list of contaminants, non-specific interactors and carry-through proteins that could
be discarded from future results.
The above measures removed many proteins from the output data, but there were still
1707 in the first and 2085 in the second to be analysed. The next step of the process removed
any proteins that had been identified by 2 peptides in either of the control samples. The
principle behind this step were that there would be many peptides/proteins that were identified
that were not the result of true interaction between themselves and PBF-HA, and not
identified by enough peptides to be placed on the previous list of exclusions. Using
spreadsheet analyses, these lists could be compared easily and any peptide that met the criteria
removed. Finally, only proteins that had been identified by more than one peptide were
included in the shortlist of potential binding partners.

Chapter 3 Optimisation of tandem mass spectrometry
96
This method of shortlisting did have shortcomings. It is possible that some interacting
proteins were discarded due to a chance/false finding in the control sample. Similarly, one
may have been overlooked as it was only identified by one peptide, either due to a small
amount of protein present or as a result of swamping by a more abundant peptide.
Another limitation of the process was that PBF was only identified by one peptide in the
first and 3 peptides in the second experiment. It was not possible to determine whether this
was a result of swamping by other peptides or a lack of protein brought forward to MS/MS.
To improve on these results, a number of conditions were changed to address the
potential and definite problems. Firstly, cells were cultured in larger quantities, which
increased by three-fold the amount of lysate used for immunoprecipitation. More wash steps
were undertaken, using a high salt lysis buffer, with the aim of both reducing the number of
non-specific interactions and reducing the amount of protein brought through from cell
culture. Finally, all steps were undertaken in a negative pressure fume hood with a clean filter,
to reduce the amount of dust contamination.
The following results were much improved, contamination by keratin and similar
proteins was reduced by 50 – 60 %, and although the number of proteins from the non-
specific and carry-over lists remained similar, the proportion of peptides attributed to them
was reduced by almost a half. Additionally, PBF was strongly identified in this experiment,
adding credibility to other strongly identified proteins.
Concluding remarks
This chapter has described the process by which the optimal conditions for identification
of potential binding partners of PBF have been determined. The process involved keeping
contamination by keratin and other dust based contaminants to a minimum, while also

Chapter 3 Optimisation of tandem mass spectrometry
97
reducing the amount of non-specific interactions using high salt lysis buffer and stringent
wash steps.
Although the final shortlist from the first two experiments would not be used in further
analysis, they provided important information as to the proteins that could be discarded from
analysis.

Chapter 4 Novel binding partners of PBF
98
Chapter 4 Novel binding partners of PBF identified by MS/MS

Chapter 4 Novel binding partners of PBF
99
4.1 Introduction
Chapter 3 discussed the optimisation of the MS/MS process to achieve the greatest
possible sensitivity for the detection of potential binding partners of PBF. This was an
important step as although MS/MS is an exceptionally sensitive tool, it is also
undiscriminating and will therefore “identify” a very large number of proteins, which will
include the true interactors as well as contaminants, non-specific interactors and those
proteins inherent to the experimental process. A number of experimental conditions and
analysis parameters were therefore set which limited the results to those proteins most likely
to represent true interacting partners. Although there may be some valid results that would be
discounted as a result of this, as well as many false positives that would be carried forward,
these would be minimised.
The aim of this chapter, therefore, was to generate a shortlist of likely binding partners
and, from these, select three to take forward to validation experiments and functional studies.
In addition, a secondary aim was to determine a larger list of potential binding partners that
could be used in further studies of PBF function.
4.2 Methods
4.2.1 MS/MS protocol
Mass spectrometry was carried out as described in Section 3.2.5. K1 and TPC1 cells
were used for transfection, co-immunoprecipitation and generation of gel fragments for use in
HPLC and MS/MS. Anti-HA was used to immunoprecipitate lysates from cells transfected
with PBF-HA, while our polyclonal rabbit anti-human PBF (Eurogentec, Seraing, Belgium,

Chapter 4 Novel binding partners of PBF
100
(Smith et al. 2009)) was used for cells transfected with untagged PBF or untransfected cells.
Analysis was as described in Section 3.2.5.4.
4.2.2 Statistical methods
Full lists of protein hits from both test and control samples were exported to MS Excel.
Contaminants, non-specific interactions, carry over proteins and duplicates were deleted (see
section 3.3.2). Any protein identified in the control samples by 3 peptides once, or 1 or 2
peptides more than once, was also removed. The resulting long-list was used to compare
results across the different runs, with protein hits assessed on the number of peptides
identified, the number of runs the protein was found in, and the score for each protein.
4.3 Results
4.3.1 Immunoprecipitation with anti-HA
Using the protocol optimised in Chapter 3, potential binding partners of PBF were
identified using K1 cells. Despite variation in the total number of proteins identified in each
run, the final shortlist number was similar, with most variation occurring in the number of
proteins identified by one peptide only or with duplicated proteins assigned to different
species (Table 4.1). The amount of contamination varied across experiments, despite strict
adherence to dust free protocol; the major contributor to this was keratin (Table 4.2).
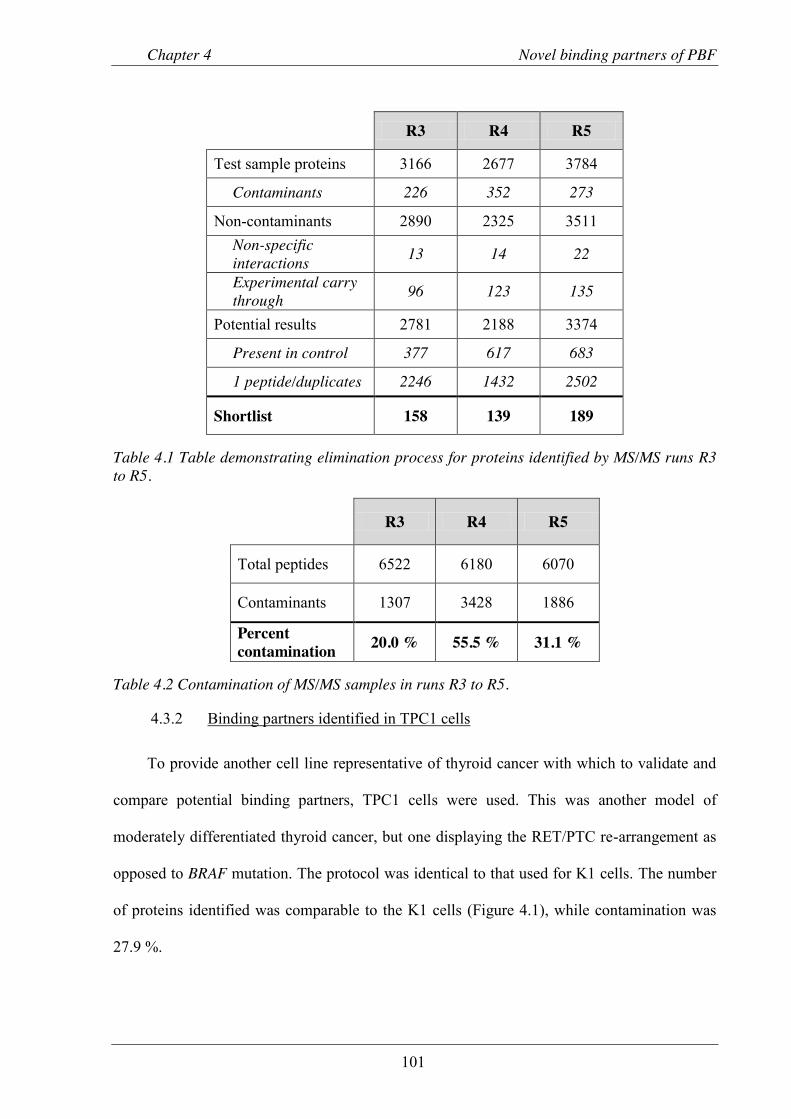
Chapter 4 Novel binding partners of PBF
101
R3 R4 R5
Test sample proteins 3166 2677 3784
Contaminants 226 352 273
Non-contaminants 2890 2325 3511 Non-specific interactions 13 14 22
Experimental carry through 96 123 135
Potential results 2781 2188 3374
Present in control 377 617 683
1 peptide/duplicates 2246 1432 2502
Shortlist 158 139 189
Table 4.1 Table demonstrating elimination process for proteins identified by MS/MS runs R3 to R5.
R3 R4 R5
Total peptides 6522 6180 6070
Contaminants 1307 3428 1886
Percent contamination 20.0 % 55.5 % 31.1 %
Table 4.2 Contamination of MS/MS samples in runs R3 to R5.
4.3.2 Binding partners identified in TPC1 cells
To provide another cell line representative of thyroid cancer with which to validate and
compare potential binding partners, TPC1 cells were used. This was another model of
moderately differentiated thyroid cancer, but one displaying the RET/PTC re-arrangement as
opposed to BRAF mutation. The protocol was identical to that used for K1 cells. The number
of proteins identified was comparable to the K1 cells (Figure 4.1), while contamination was
27.9 %.
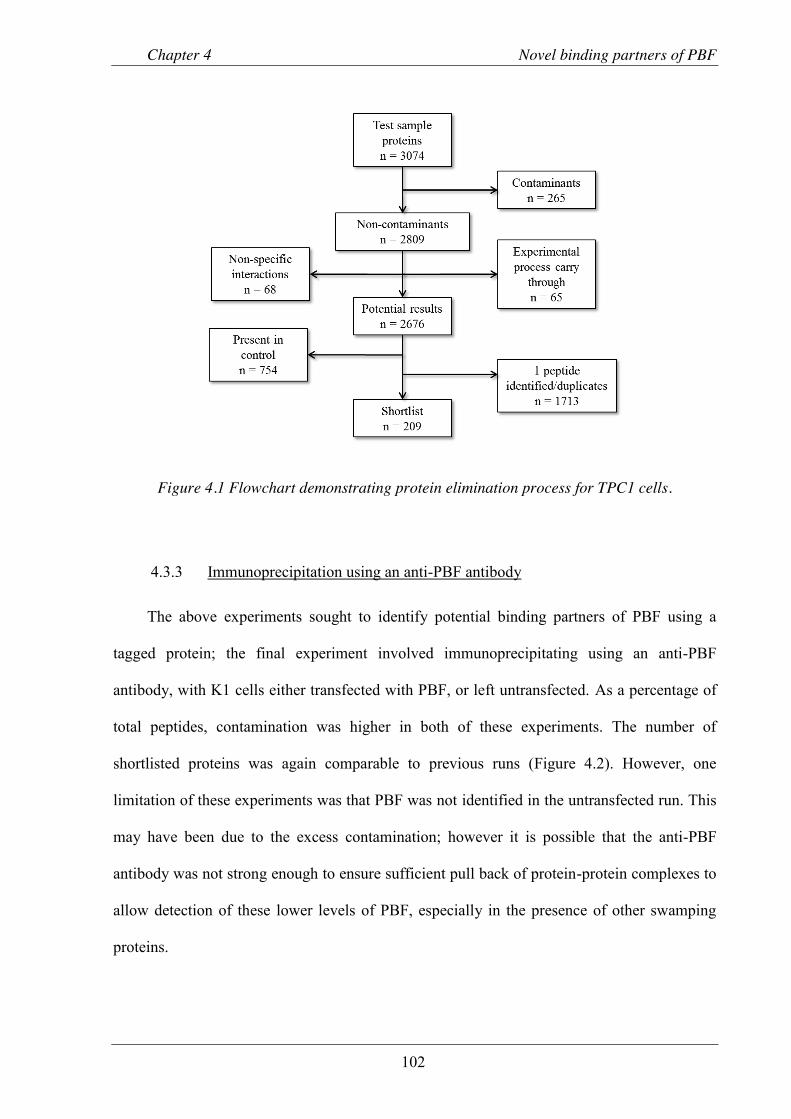
Chapter 4 Novel binding partners of PBF
102
Figure 4.1 Flowchart demonstrating protein elimination process for TPC1 cells.
4.3.3 Immunoprecipitation using an anti-PBF antibody
The above experiments sought to identify potential binding partners of PBF using a
tagged protein; the final experiment involved immunoprecipitating using an anti-PBF
antibody, with K1 cells either transfected with PBF, or left untransfected. As a percentage of
total peptides, contamination was higher in both of these experiments. The number of
shortlisted proteins was again comparable to previous runs (Figure 4.2). However, one
limitation of these experiments was that PBF was not identified in the untransfected run. This
may have been due to the excess contamination; however it is possible that the anti-PBF
antibody was not strong enough to ensure sufficient pull back of protein-protein complexes to
allow detection of these lower levels of PBF, especially in the presence of other swamping
proteins.

Chapter 4 Novel binding partners of PBF
103
Figure 4.2 Flowcharts detailing analyses of a PBF transfected run (A) and an untransfected run (B).
4.3.4 Shortlisting of potential binding partners
To draw up a final list of potential binding partners, the shortlist from each experiment
was compared, with those proteins scoring highest across several runs being included.
Following this, the full list of proteins (i.e. including those identified by 1 peptide only) was

Chapter 4 Novel binding partners of PBF
104
compared across each experiment, to identify any proteins that may have been excluded based
on a lower score that were actually present in multiple runs, thus representing potential true
positives. This list is documented in Appendix 1. Finally, a search was carried out for any
proteins that had been predicted as potential binding partners based on analysis of PBF
structure. Ranking of this final shortlist was carried out by assessing the total score assigned
to the protein across all experiments by the Mascot search engine, and factoring in the total
number of peptides identified. The final list of 9 proteins is shown in Table 4.3. After
assessing the scores and potential relevance to PBF physiology as well as practicality of
future experiments, three proteins were chosen for validation: thyroglobulin, cortactin and src
/ src-family kinases.

Chapter 4 Novel binding partners of PBF
105
Table 4.3 Table listing the proteins identified by MS/MS as most likely to interact with PBF. Score was assigned by Proteinscape for each experiment. Ranking was based on average score per peptide across the experiments (n=6). Peps = Number of peptides, Sc = Score, Untrans = Untransfected, “-“ = no peptides found.

Chapter 4 Novel binding partners of PBF
106
4.4 Discussion
In chapter 3, the optimum conditions for MS/MS were described, and in this chapter
these were used to generate a list of proteins that may interact with PBF. Initially, 3
experiments were performed utilising HA-tagged PBF and immunoprecipitating with an anti-
HA antibody. Each provided a similar number of proteins for consideration. A further 3
experiments were then carried out with varied conditions; in the first, the K1 cell line was
substituted for the TPC cell line. Although both represent papillary thyroid carcinoma, the
genotype of the two varies and there may have been proteins identified in the TPC1 line that
were missed in the K1 cells. Similarly, should a protein be found in both cell lines, this would
lend credibility to the potential interaction. Finally, K1 cells were again used but
immunoprecipitation was carried out using an anti-PBF antibody, with both over-expressed
and endogenous levels of PBF. In the former, this would hopefully identify any proteins in
which an interaction with PBF was disrupted by the HA tag, and the latter would provide
strong evidence for an interaction as only those proteins present in abundance in the
immunoprecipitant would be picked up by MS/MS.
To develop a final shortlist, the results from all experiments were compared on an Excel
spreadsheet. It was not practical to validate all potential interactions, or even all those that
appeared most likely, and therefore a number of strategies, both objective and subjective,
were employed to generate a list of proteins for validation. Firstly, the elimination protocol
described in Chapter 3 was used on each list of proteins, although in this case those identified
by 1 peptide only were retained. Filters were then used to remove all proteins identified by
only 1 peptide in 1 run, and proteins identified by a total of 2 peptides were manually
searched and eliminated if their scores were low. In the next stage, the number of peptides
each protein was identified by in each run was combined, as was the score assigned by
Chapter 4 Novel binding partners of PBF
107
Mascot. This then allowed a “score per peptide” to be generated, and the remaining proteins
ranked by this result. The list was again manually searched, and a shortlist of 9 proteins was
generated, based on both final score and also potential relevance. Each of these proteins
would benefit from further study, but due to restraints on time and resources, 3 were chosen
for further validation and, if proven as true interacting partners, functional studies.
Cortactin: Average score per peptide (ASP) – 40.0
Cortactin was first described in the early 1990s as a Src substrate that bound to
filamentous actin and was present in lamellipodia; cytoskeletal actin projections from the
mobile edge of a cell which aid movement (Wu and Parsons 1993). The CTTN gene is located
at 11q13, which is a region amplified in a number of cancers, including breast and head and
neck (Schuuring et al. 1993). Cortactin has seen been implicated in a number of processes key
to cancer progression: invadopodia formation (protrusions from the cell membrane associated
with invasion), cell migration, stabilising of branched actin networks and membrane
trafficking (Weaver 2008; Kirkbride et al. 2011). Cortactin had the highest score of all the
shortlisted proteins, and was identified in both K1 and TPC1 cells. Given that PBF is a protein
that is shuttled to and from the cell membrane, and that over-expression leads to an increase in
cell invasion, an interaction with cortactin may serve to further explain these effects. This,
combined with its high score, led to cortactin being chosen for validation.
Thyroglobulin: ASP 33.5
Thyroglobulin is the essential pre-cursor to thyroid hormone and is present in abundance
in the thyroid follicle. Although at first it was thought possible that its presence may have
been due to the high quantity present and therefore a non-specific binding/carry over, none
Chapter 4 Novel binding partners of PBF
108
was identified in any of the control samples and therefore it could not be discounted.
Additionally, when the data generated from the first 2 experiments (carried out in T25 flasks)
was searched, thyroglobulin was identified by 2 peptides in each, lending further credence to
the result. Given that the PBF-Tg mice displayed macro-follicular, hyperplastic goitres with
deranged thyroid hormone content, this potential interaction may provide clues as to the
mechanism by which this occurs.
Src family kinases: ASP 29.1
A number of Src family kinases (SFKs) were identified, including Lyn, Src and Yes; the
former of which had the highest score. The SFKs have significant homology and it is possible
that peptides assigned to one member actually belonged to another. These proteins were of
particular interest, as kinase prediction software had identified Src as a potential kinase for
PBF. Given this fact, and that there are a number of cancer therapies currently being trialled
using Src as a target, it was felt appropriate to shortlist the SFKs as potential binding partners.
The parent member of the group - and the kinase with the highest predicted score on
phosphorylation prediction software - was Src, and these factors led to its inclusion in the
validatory group.
The remaining proteins were from a variety of functional classes, and future research
will focus on defining these in more detail.
Heat shock protein 90 – beta: ASP 38.6
Hsp90 is a 90 kDa protein which is ubiquitoiusly expressed and plays a key role in
protein homeostasis. It is a chaperone protein involved in protein folding as well as

Chapter 4 Novel binding partners of PBF
109
intracellular trafficking (Pearl and Prodromou 2006). Expression of Hsp90 is abundant, and
this rises 2 to 3 fold in tumours compared to normal tissue (Moulick et al. 2011). Inhibition of
Hsp90 has been the subject of clinical trials for some time (Barrott and Haystead 2013),
although none are in regular oncological use. The protein scored highly in MS/MS, and it will
certainly warrant further investigation.
Leucine-rich repeat flightless-interacting protein 1 / 2: ASP 27.5
LRRK1 is a large, 225 kDa protein which is thought to function as a GDP/GTP-binding
protein (Korr et al. 2006). Although its paralogue, LRRK2, is associated with Parkinson’s
disease (Lu and Tan 2008), very little is known regarding the function of LRRK1. Mutations
have been described in both LRRK1 and 2; a barrier to clear functional work on either protein
is the lack full length recombinant proteins, with either truncated or tagged proteins being
used (Civiero and Bubacco 2012). LRRK1 scored highly, however despite this the lack of
commercially available materials with which to perform validatory experiments meant that it
would not have been feasible to pursue it at this stage and LRRK1 and 2 were therefore
discarded.
Focal Adhesion kinase 1: ASP 24.3
FAK is a non-receptor tyrosine kinase with important roles in normal human
development, as well as cell migration (via the actin cytoskeleton) and proliferation (Schaller
2010). Perhaps most importantly in relation to this thesis, FAK phosphorylates Src, and in
doing so increases its kinase activity (Aleshin and Finn 2010). It is possible that FAK was
identified through indirect interaction with PBF, with a complex forming between activated
Src, FAK and PBF at the cell periphery. Another possibility is that FAK is the kinase

Chapter 4 Novel binding partners of PBF
110
responsible for phosphorylating PBF. Given the limited time available for this PhD, and the
strength of data suggesting Src as the principle kinase for PBF (both with phosphorylation
prediction software and MS/MS), only Src was taken further for validation.
Uveal autoantigen with coiled-coil domains and ankyrin repeats: ASP 21.2
UACA is an autoantigen initially identified in thyroid tissue and shown to be
upregulated by TSH (Wilkin et al. 1996). Most studied in relation to its role in panuveitis
(Ohkura et al. 2004), it has recently been shown to be upregulated in a lung and prostate
cancer, with the proposed mechanism being inhibition of apoptosis (Burikhanov et al. 2013).
How this would correlate with the effects of PBF is unclear, and while a potential interaction
with UACA is interesting and will warrant further study in the future, the paucity of evidence
regarding its structure and function at the current time led to its exclusion from further study.
Adenomatous polyposis coli protein: ASP 21.1
The APC gene encodes a protein that down-regulates the Wnt signalling pathway
through interaction with β-catenin, and thereby inhibits tumourigenesis (Yokoyama et al.
2011). Mutations in APC result in Familial Adenomatous Polyposis (FAP), a hereditary
disorder of multiple colonic polyps with a 100 % progression to malignancy. There is a 1-6 %
lifetime risk of thyroid cancer with FAP, usually papillary (Steinhagen et al. 2012). In
addition, β-catenin mutations are observed in anaplastic thyroid carcinomas (Yokoyama et al.
2011), further indicating that aberrant activation of this pathway is important in thyroid
cancer. However, its contribution outside of FAP / specific ATC studies is as yet unknown.
An interaction between APC and PBF could, therefore, provide an explanation for the
tumourigenic effects of PBF, and will be an exciting avenue for further research.

Chapter 4 Novel binding partners of PBF
111
Citron Rho-interacting kinase: ASP 19.2
Citron kinase is a serine/threonine kinase first identified as a binding partner of Rho (a
small GTP-ase from the same family as the proto-oncogene Ras) (Zhao and Manser 2005).
Having been mainly studied in the context of neuronal growth, it has a role in the contractile
process of cytokinesis (Madaule et al. 2000). Mice deficient in the CRIK gene display
abnormal cytokinesis and apoptosis of neuronal precursors (Di Cunto et al. 2000). The
relevance of citron kinase to PBF physiology is not readily apparent. While it is known to
phosphorylate MLC (Yamashiro et al. 2003), further studies have not been carried out to
identify other substrates, and whether it was identified due to direct or indirect interaction
with PBF will prove interesting for further research in the future.
Concluding remarks
This chapter has described the generation of a shortlist of potential binding partners of
PBF, and also provided a longer list (Appendix 1), both of which will serve as a resource for
further research beyond the scope of this thesis. Three proteins have been highlighted for
validation and functional experiments: Thyroglobulin, cortactin and src, all of which have the
potential to provide further insight into the mechanisms by which PBF has its effects of the
cell.
Chapter 5 Thyroglobulin
112
Chapter 5 PBF and thyroglobulin interact in thyroid cells
Chapter 5 Thyroglobulin
113
5.1 Introduction
The first of the 3 proteins chosen for validation, thyroglobulin is a large, 660 kDa
dimeric molecule that is a vital component of the thyroid follicle. It is synthesised within the
thyroid follicular cell via a complex series of steps, increasing in size until the final product is
fully assembling immediately prior to secretion into the colloid (Malthiery and Lissitzky
1987). Thyroglobulin (Tg) was identified in 3 of the main experiments and also in the initial,
standard setting experiments and was therefore one of the stronger results produced. This was
especially interesting as the thyroid glands of the PBF-Tg mice displayed macro-follicular
goitres with higher intra-thyroidal levels of T3 and T4 (Read et al. 2011; Smith et al. 2012); it
is conceivable, therefore, that an interaction between PBF and Tg might contribute to this
phenotype. The aim of this chapter was thus to validate the interaction between PBF and Tg,
and if proved, to assess its functional significance.
5.2 Methods
5.2.1 Cell culture and transfection
K1 and TPC1 cells were maintained in RPMI as described in section 2.1. PBF-HA was
transfected into K1, TPC1 and primary thyrocytes as described in Section 2.2.2.
5.2.2 GST pull-down assay
GST-tagged PBF was translated as described in 2.5.1. [35S]-methionine labelled
thyroglobulin was prepared using the TNT® T7/SP6 Coupled Reticulocyte Lysate System
(Promega, as described in Section 2.5) from the full length Tg cDNA in the vector pCR-XL-
TOPO (IMAGE clone 9056745, Source Biosciences). The assay was performed as described
in Section 2.5.

Chapter 5 Thyroglobulin
114
5.2.3 Co-immunoprecipitation and Western Blot
Protein was extracted from cell lysates as described in section 2.3.1. Co-
immunoprecipitation was performed as per Section 2.4, with anti-Tg (Dako UK Ltd, Ely, UK)
used at concentrations of 1:10, 1:7.5 and 1:5 to immunoprecipitate thyroglobulin. For Western
blotting, anti-Tg was used at 1:500, anti-HA at 1:2000 and anti-PBF at 1:500. Anti-β actin
was used as a loading control as described above.
5.2.4 Primary thyroid culture
Human thyroid tissue was obtained and cultured as described in Section 2.7 with the
approval of the Local Ethics and Research Committee.
5.2.5 Homogenisation of thyroid tissue
Human thyroid tissue was obtained from macroscopically normal thyroid tissue after
thyroidectomy with approval of the Local Ethics Research Committee. Tissue was snap
frozen in liquid nitrogen and stored at -80 °C. Thyroid tissue was homogenised in 300 µL
RIPA / PI (described in Section 2.3.1). Prior to analysis, the homogenate was diluted with
RIPA in to final concentrations of 12.5 %, 33.3 %, 50 % and 100 % homogenate.
5.2.6 Fluorescence immunocytochemistry
Samples were prepared as described in Section 2.6. Primary antibodies were anti-Tg
(EPR3614, Abcam, Cambridge, UK) (1:100) and anti-HA (1:200).
5.2.7 Statistical analysis
Statistical analysis was performed as described in 2.8.
Chapter 5 Thyroglobulin
115
5.3 Results
5.3.1 Translation of [35S]-methionine labelled thyroglobulin and GST pull-down
assay
Despite scoring highly in MS/MS, the interaction between PBF and Tg needed to be
validated by at least one other independent technique. The first to be implemented was the
GST pull-down assay. In this experiment, GST-tagged PBF and [35S]-methionine labelled Tg
were translated and analysed in a cell free setting. GST-tagged PBF was first generated and
found to run at the predicted size of 42 kDa when probed with our anti-PBF antibody (Figure
5.1A). Tg was translated but when run on SDS-PAGE, no band was seen at the predicted
mass of 330 kDa (for the monomeric molecule). Instead, a number of bands were observed at
lower masses, as indicated in Figure 5.1B by asterisks. It was thought possible that these may
represent sub-units of Tg, and therefore the pull-down assay was run to test if any of these
fragments bound to GST-PBF. No evidence of an interaction was evident for any of these
bands (Figure 5.1C, n = 3), and given the difficultly in translating such a large molecule in
vitro, further attempts at pull-down were not attempted.

Chapter 5 Thyroglobulin
116
Figure 5.1 GST tagged pull-down assay to investigate an interaction between PBF and thyroglobulin. A: GST-tagged PBF ran at the expected size of 42 kDa. B: [35S]-methionine Tg translation produced a number of bands of differing molecular weight (indicated by asterisks). C: No evidence of an interaction between GST-PBF and Tg was observed (n = 3).
5.3.2 Co-immunoprecipitation
Due to the large size of the Tg molecule and the difficulties encountered during the pull-
down assay with translation of the protein from cDNA, an assessment of binding of
endogenous Tg to PBF was made, the first step of which involved determining the expression
of Tg within the thyroid cell lines used in this thesis.

Chapter 5 Thyroglobulin
117
5.3.2.1 Thyroglobulin expression in transformed cell lines
In the first instance, untransfected K1 and TPC1 cells were assessed by Western blotting
for their endogenous Tg content. In both of these cell lines, there was a predominant band at
approximately 140 kDa, with some fainter bands evident at lower masses (Figure 5.2A). No
bands were observed above 140 kDa that could be attributed to the full length monomeric or
dimeric molecule. A similar picture was observed when 6 % acrylamide gels were used as
opposed to 12 %, although the gels were more difficult to work with and as no additional
information was gained they were not used further (data not shown). These bands may have
represented denatured sub-units (see Discussion, Section 5.4), as peptide chains were
identified by MS/MS at these levels (approximately 150, 50 and 30 kDa) and some binding to
PBF should therefore be evident.
Given the altered thyroid hormone content of the PBF-transgenic mouse thyroids, the
effect of over-expressing PBF-HA on Tg content was assessed prior to co-
immunoprecipitation to identify if there was a potential alteration in expression which would
hinder interpretation of results. There was no significant difference in Tg levels between cells
transfected with PBF-HA and those transfected with vector only (105.7 ± 33.6 % of control, p
= ns, n = 3) (Figure 5.2).

Chapter 5 Thyroglobulin
118
Figure 5.2 Thyroglobulin expression in K1 and TPC1 cells. A: In TPC1 and K1 cells, Tg was identified predominantly as a band at 140 kDa. B: Representative Western blot demonstrating no change in Tg with PBF-Ha transfection (i), and scanning densitometry showing relative value with VO vs. PBF-HA transfection (n = 3). β actin is shown as a loading control.
5.3.2.2 Co-immunoprecipitation in cell lines
Having established that thyroglobulin levels were not altered by the over-expression of
PBF-HA, K1 cells were transfected with PBF-HA and the lysates immunoprecipitated with an
anti-HA antibody. The subsequent solution was run through SDS-PAGE and probed for Tg.
There was no evidence of interaction between the two proteins in this assay (Figure 5.3, n =
3). The reverse co-immunoprecipitation, in which lysates were immunoprecipitated with anti-
Tg and probed for PBF-HA, did not demonstrate an interaction (data not shown).
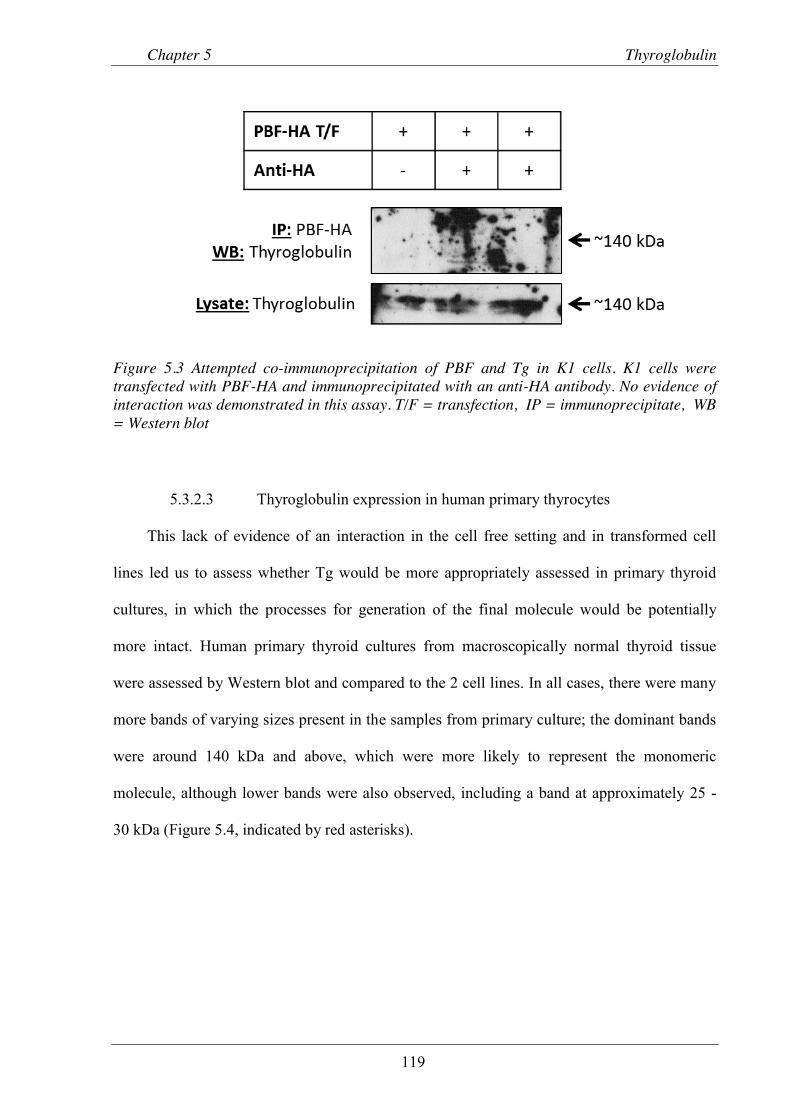
Chapter 5 Thyroglobulin
119
Figure 5.3 Attempted co-immunoprecipitation of PBF and Tg in K1 cells. K1 cells were transfected with PBF-HA and immunoprecipitated with an anti-HA antibody. No evidence of interaction was demonstrated in this assay. T/F = transfection, IP = immunoprecipitate, WB = Western blot
5.3.2.3 Thyroglobulin expression in human primary thyrocytes
This lack of evidence of an interaction in the cell free setting and in transformed cell
lines led us to assess whether Tg would be more appropriately assessed in primary thyroid
cultures, in which the processes for generation of the final molecule would be potentially
more intact. Human primary thyroid cultures from macroscopically normal thyroid tissue
were assessed by Western blot and compared to the 2 cell lines. In all cases, there were many
more bands of varying sizes present in the samples from primary culture; the dominant bands
were around 140 kDa and above, which were more likely to represent the monomeric
molecule, although lower bands were also observed, including a band at approximately 25 -
30 kDa (Figure 5.4, indicated by red asterisks).
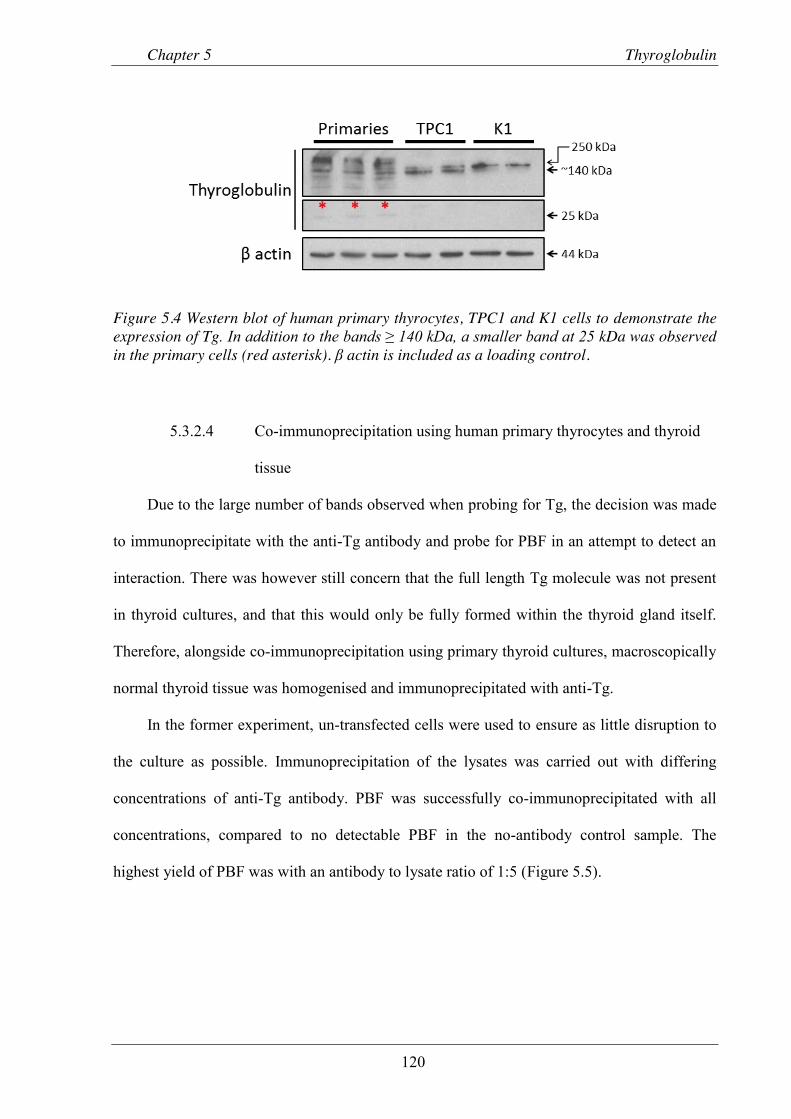
Chapter 5 Thyroglobulin
120
Figure 5.4 Western blot of human primary thyrocytes, TPC1 and K1 cells to demonstrate the expression of Tg. In addition to the bands ≥ 140 kDa, a smaller band at 25 kDa was observed in the primary cells (red asterisk). β actin is included as a loading control.
5.3.2.4 Co-immunoprecipitation using human primary thyrocytes and thyroid
tissue
Due to the large number of bands observed when probing for Tg, the decision was made
to immunoprecipitate with the anti-Tg antibody and probe for PBF in an attempt to detect an
interaction. There was however still concern that the full length Tg molecule was not present
in thyroid cultures, and that this would only be fully formed within the thyroid gland itself.
Therefore, alongside co-immunoprecipitation using primary thyroid cultures, macroscopically
normal thyroid tissue was homogenised and immunoprecipitated with anti-Tg.
In the former experiment, un-transfected cells were used to ensure as little disruption to
the culture as possible. Immunoprecipitation of the lysates was carried out with differing
concentrations of anti-Tg antibody. PBF was successfully co-immunoprecipitated with all
concentrations, compared to no detectable PBF in the no-antibody control sample. The
highest yield of PBF was with an antibody to lysate ratio of 1:5 (Figure 5.5).
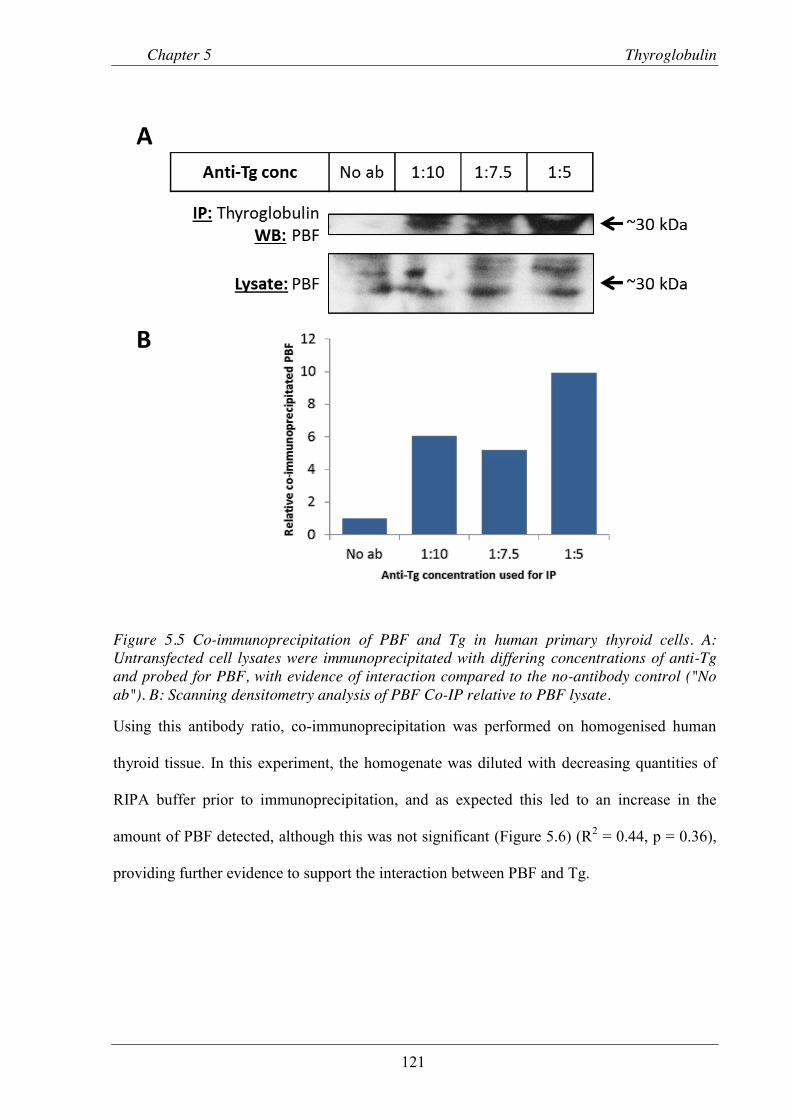
Chapter 5 Thyroglobulin
121
Figure 5.5 Co-immunoprecipitation of PBF and Tg in human primary thyroid cells. A: Untransfected cell lysates were immunoprecipitated with differing concentrations of anti-Tg and probed for PBF, with evidence of interaction compared to the no-antibody control ("No ab"). B: Scanning densitometry analysis of PBF Co-IP relative to PBF lysate.
Using this antibody ratio, co-immunoprecipitation was performed on homogenised human
thyroid tissue. In this experiment, the homogenate was diluted with decreasing quantities of
RIPA buffer prior to immunoprecipitation, and as expected this led to an increase in the
amount of PBF detected, although this was not significant (Figure 5.6) (R2 = 0.44, p = 0.36),
providing further evidence to support the interaction between PBF and Tg.

Chapter 5 Thyroglobulin
122
Figure 5.6 Co-immunoprecipitation of PBF and Tg in homogenised human thyroid tissue. A: Homogenised tissue was diluted with differing amounts of RIPA buffer and immunoprecipitated with anti-Tg then probed for PBF. B: Scanning densitometry analysis of the amount of co-immunoprecipitated PBF (n = 3).
5.3.3 Fluorescence immunocytochemistry
5.3.3.1 Thyroglobulin and PBF co-localise in intra-cellular vesicles
Having validated the MS/MS findings, fluorescence immunocytochemistry was
undertaken to assess in what areas of the cell PBF and Tg interact. Initially, this was
performed in K1 and TPC1 cells, and a small degree of co-localisation was observed within
intra-cellular vesicles in the peri-nuclear region, with some co-localisation also apparent at
the cell membrane (Figure 5.7).
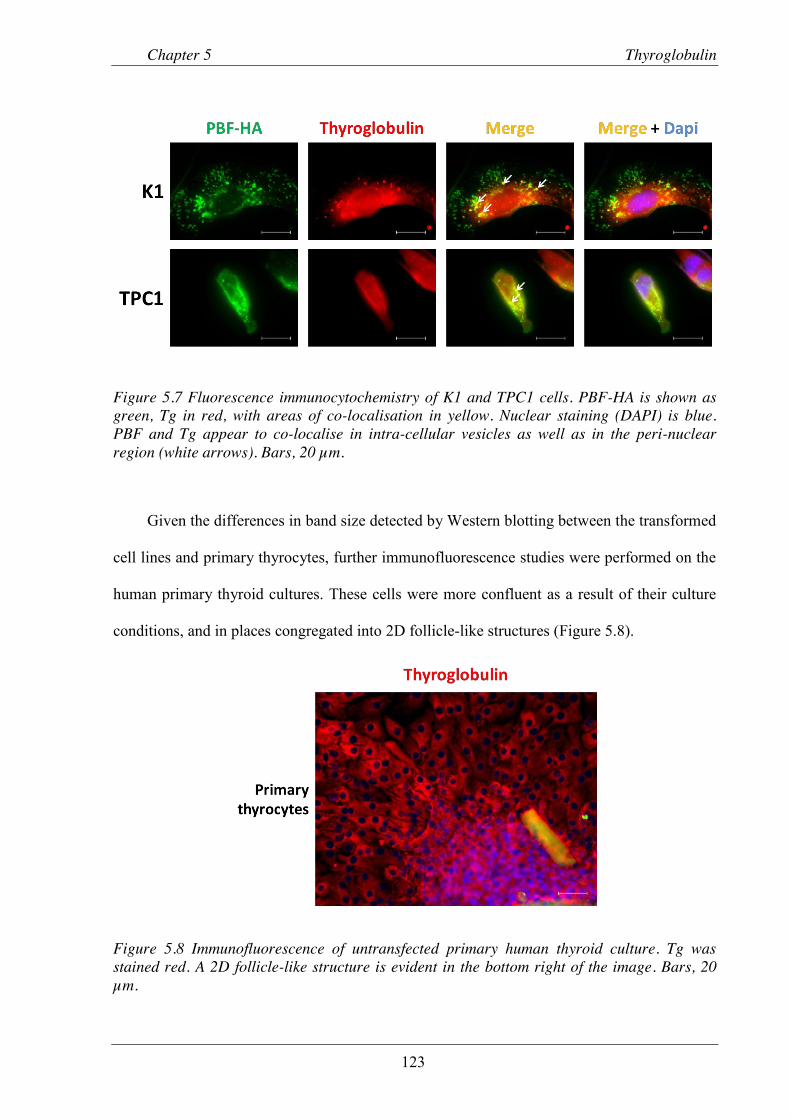
Chapter 5 Thyroglobulin
123
Figure 5.7 Fluorescence immunocytochemistry of K1 and TPC1 cells. PBF-HA is shown as green, Tg in red, with areas of co-localisation in yellow. Nuclear staining (DAPI) is blue. PBF and Tg appear to co-localise in intra-cellular vesicles as well as in the peri-nuclear region (white arrows). Bars, 20 µm.
Given the differences in band size detected by Western blotting between the transformed
cell lines and primary thyrocytes, further immunofluorescence studies were performed on the
human primary thyroid cultures. These cells were more confluent as a result of their culture
conditions, and in places congregated into 2D follicle-like structures (Figure 5.8).
Figure 5.8 Immunofluorescence of untransfected primary human thyroid culture. Tg was stained red. A 2D follicle-like structure is evident in the bottom right of the image. Bars, 20 µm.

Chapter 5 Thyroglobulin
124
When these cells were transfected with PBF-HA and stained for both HA and Tg, some
co-localisation was again seen in vesicles, but this was not a consistent finding, and there
were examples of cells where there was no evidence of co-localisation (Figure 5.9). Due to
the high density and overlap of cells, it was not possible to determine the precise intracellular
nature of any co-localisation within the follicle-like structures.
Figure 5.9 Immunofluorescence of primary human thyroid cells transfected with PBF-HA. PBF-HA was shown as green, Tg in red with areas of co-localisation in yellow. Nuclear staining (DAPI) is blue. As for the cell lines, possible co-localisation of PBF and Tg is observed in intra-cellular vesicles (white arrows). Bars, 20 µm.
5.4 Discussion
Thyroglobulin, in its most stable form, exists as a 660 KDa dimeric protein made up of 2
identical peptide chains of 2748 amino acid each (Dunn and Dunn 1999). It is the most
abundant protein within the thyroid gland and essential for the synthesis of thyroid hormone.
It is in this respect that Tg is most studied, as the clinical effects of deranged thyroid hormone
synthesis can be profound. There is, however, significantly less evidence regarding the
synthetic pathway of the protein itself, and how aberrations in this pathway may arise.

Chapter 5 Thyroglobulin
125
Initial studies focussed on attempting to validate the MS/MS findings using GST pull-
down assays. In these, no interaction was observed between PBF and Tg; the [35S]-methionine
labelled Tg also produced bands of differing sizes and none at the expected masses of 330
kDa or 660 kDa. When Tg expression was determined in TPC1 and K1 thyroid cancer cell
lines, again no large size band was detected, but rather a strong band at 140 kDa, as well as
other, fainter, lower mass bands. The potential explanation for these findings lies in the
synthesis of Tg and also its sub-unit structure.
Tg polypeptide chains undergo glycosylation in the rough endoplasmic reticulum, and
the process of dimerization begins here. Chaperone proteins prevent the progression of Tg
synthesis unless all aspects of post-translational modification are met, and therefore the final
molecule (as exported into the colloid) will only be present in the cell should the pre-existing
conditions be favourable (den Hartog et al. 1995; Miot et al. 2012). Clearly, in a cell free
setting this is not possible and it is likely, therefore, that precursor peptides were detected.
The GST pull-down assay, therefore, would not appear to be the best method with which to
test an interaction with Tg.
The banding pattern demonstrated on Western blotting is most likely due to the
breakdown of protein structure during denaturing prior to SDS-PAGE. The weight of Tg sub-
units has been described (Spiro 1973) (Table 5.1), and several of the bands observed,
including the major band at 140 kDa, are documented. The authors of this study used a variety
of gels of differing concentration to fully assess the sub-units; however, in these experiments
the lower percentage gels did not yield additional data, and given their difficult handling and
lack of reliable results, 12 % acrylamide was used. This also correlated with the MS/MS
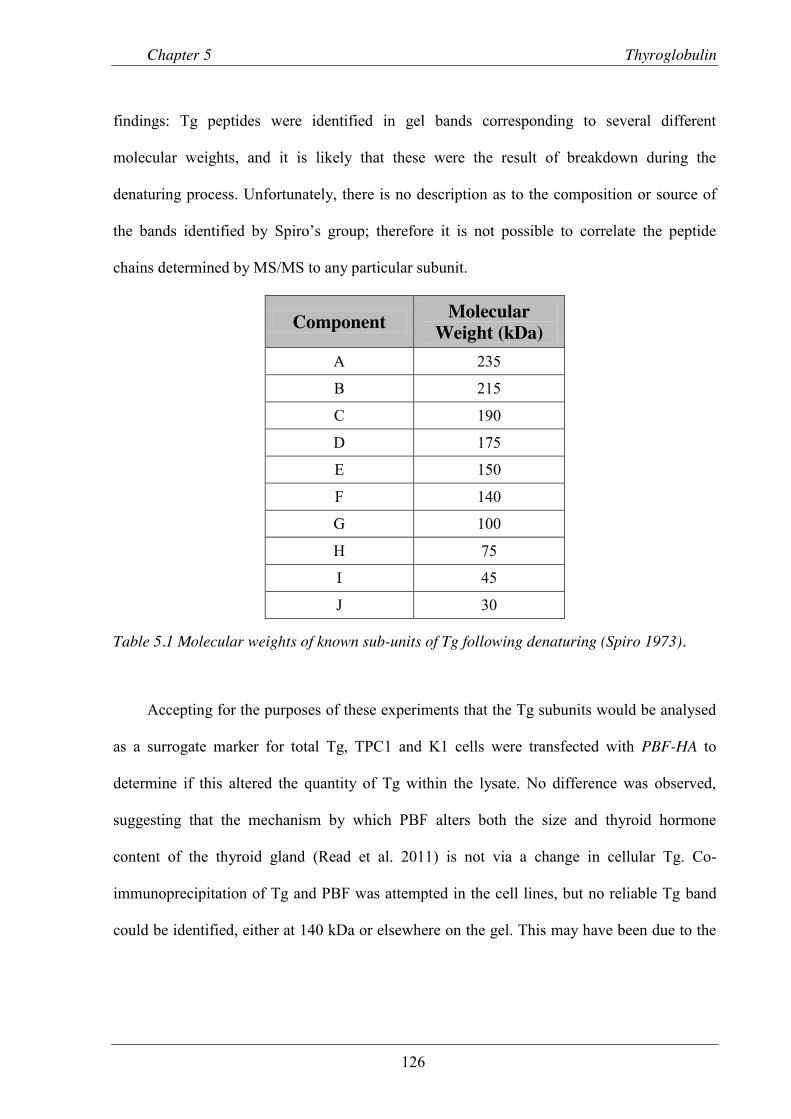
Chapter 5 Thyroglobulin
126
findings: Tg peptides were identified in gel bands corresponding to several different
molecular weights, and it is likely that these were the result of breakdown during the
denaturing process. Unfortunately, there is no description as to the composition or source of
the bands identified by Spiro’s group;; therefore it is not possible to correlate the peptide
chains determined by MS/MS to any particular subunit.
Component Molecular Weight (kDa)
A 235
B 215
C 190
D 175
E 150
F 140
G 100
H 75
I 45
J 30
Table 5.1 Molecular weights of known sub-units of Tg following denaturing (Spiro 1973).
Accepting for the purposes of these experiments that the Tg subunits would be analysed
as a surrogate marker for total Tg, TPC1 and K1 cells were transfected with PBF-HA to
determine if this altered the quantity of Tg within the lysate. No difference was observed,
suggesting that the mechanism by which PBF alters both the size and thyroid hormone
content of the thyroid gland (Read et al. 2011) is not via a change in cellular Tg. Co-
immunoprecipitation of Tg and PBF was attempted in the cell lines, but no reliable Tg band
could be identified, either at 140 kDa or elsewhere on the gel. This may have been due to the

Chapter 5 Thyroglobulin
127
smaller quantities of Tg sub-units present after Co-IP which, while identified by MS/MS,
were not detectable on Western blotting.
To over-come the difficulties observed with studying Tg in cell lines, human primary
thyroid cultures were used. TG gene expression is controlled by a number of thyroid specific
transcription factors, of which TTF-1, TTF-2 and Pax-8 are the most important (Fayadat et al.
1998). Cultures from macroscopically normal human thyroid tissue contain a more
differentiated phenotype than transformed cell lines. Although the Tg content of TPC1 and
K1 cells has not been investigated, studies have shown that transfecting PAX-8 into K1 cells
increased the expression of Tg (Mu et al. 2012). Primary thyrocytes subjected to the same
protein extraction conditions as K1 and TPC1 cells demonstrated a similar band pattern,
although there was an increase in high molecular weight bands compared to the cell lines.
These bands correlated more closely with the bands described in Table 5.1.
Immunoprecipitation was performed with the anti-Tg antibody, therefore ensuring that any
intact Tg would be precipitated. To determine if there was an optimum concentration of
antibody to use, 3 conditions were used, as well as a no-antibody control. While the latter lane
remained empty, co-immunoprecipitated PBF was identified in each of the other samples,
supporting the interaction first identified by MS/MS. For the higher concentration of anti-Tg,
there was an increase in the amount of PBF detected relative to the quantity in the cell lysate
which would again support that PBF was detected as a specific binding partner to Tg.
The final step in the binding analysis was to use homogenised thyroid tissue. The vast
majority of Tg in the thyroid gland is situated within the colloid. These structures are not
present in two dimensional cell cultures and therefore cells grown in vitro (either cell lines or
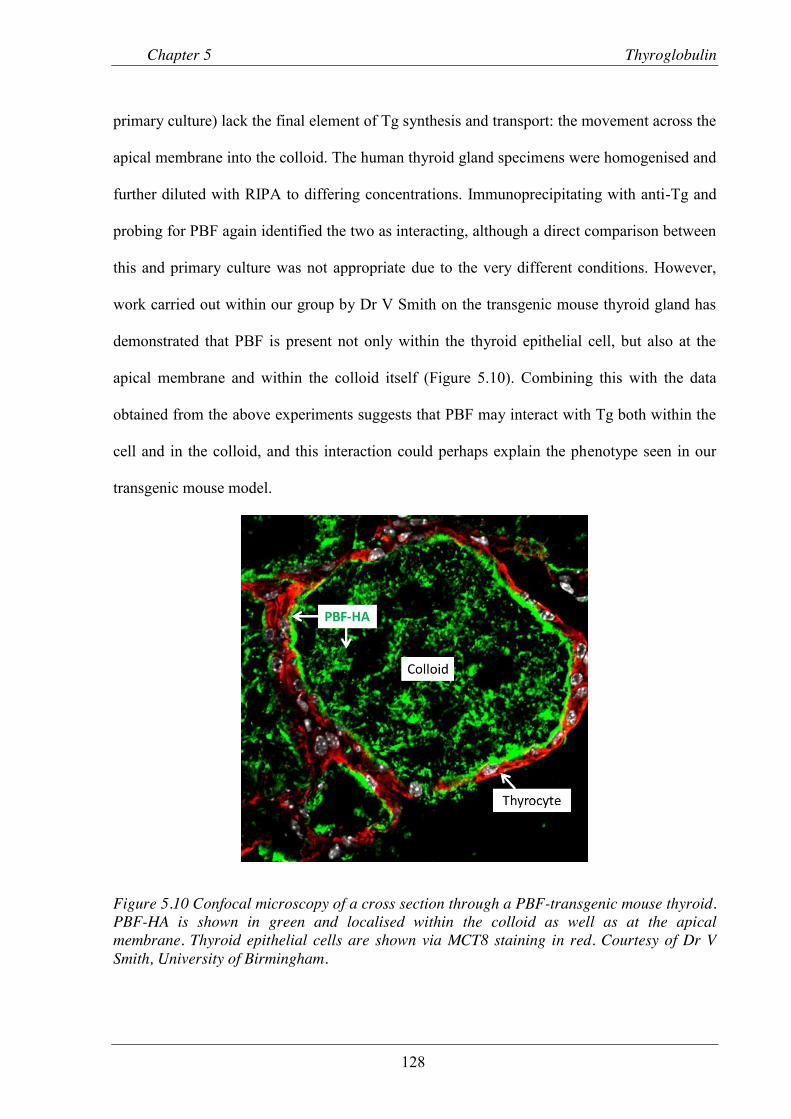
Chapter 5 Thyroglobulin
128
primary culture) lack the final element of Tg synthesis and transport: the movement across the
apical membrane into the colloid. The human thyroid gland specimens were homogenised and
further diluted with RIPA to differing concentrations. Immunoprecipitating with anti-Tg and
probing for PBF again identified the two as interacting, although a direct comparison between
this and primary culture was not appropriate due to the very different conditions. However,
work carried out within our group by Dr V Smith on the transgenic mouse thyroid gland has
demonstrated that PBF is present not only within the thyroid epithelial cell, but also at the
apical membrane and within the colloid itself (Figure 5.10). Combining this with the data
obtained from the above experiments suggests that PBF may interact with Tg both within the
cell and in the colloid, and this interaction could perhaps explain the phenotype seen in our
transgenic mouse model.
Figure 5.10 Confocal microscopy of a cross section through a PBF-transgenic mouse thyroid. PBF-HA is shown in green and localised within the colloid as well as at the apical membrane. Thyroid epithelial cells are shown via MCT8 staining in red. Courtesy of Dr V Smith, University of Birmingham.

Chapter 5 Thyroglobulin
129
Preliminary experiments into the co-localisation of Tg and PBF identified intra-cellular
vesicles as well as the peri-nuclear region as potential sites of interaction, both in cell lines
and human primary thyrocytes. The significance of this remains to be determined; whether
PBF is transported with Tg to the cell membrane, or if the interaction is only transient within
the cell will be the focus of further study. In addition, techniques such as 3D cell culture,
which allow the formation of functional colloid units within primary thyroid cultures in vivo,
will be essential to assess the functional significance of the interaction.
Concluding remarks
This chapter has investigated the potential interaction between PBF and thyroglobulin.
Due to its large size and the requirement for a number of physiological conditions to be met in
order for the full length protein to be assembled, studies using the transformed cell lines did
not generate conclusive data. However, co-immunoprecipitation of PBF with Tg was
demonstrated in primary thyroid cultures and homogenised thyroid tissue. In addition,
fluorescence immunocytochemistry identified potential co-localisation sites within
intracellular vesicles and the peri-nuclear region of the cell. These preliminary observations,
therefore, provide a basis on which to further investigate the interaction and assess its
functional significance, particularly in light of the transgenic mouse phenotype.

Chapter 6 Cortactin
130
Chapter 6 Investigating the interaction between cortactin and PBF
Chapter 6 Cortactin
131
6.1 Introduction
In Chapter 4, cortactin was identified by MS/MS as a protein highly likely to interact
with PBF. Cortactin interacts with filamentous actin and thus regulates the actin cytoskeleton,
in particular the stabilisation of the branched actin assembly (Weaver et al. 2001). It is also
found in the leading edge of migrating cells, with over-expression of cortactin leading to
increased cell mobility and knockdown reducing it (Bryce et al. 2005).While this is part of the
normal physiological process of the cell, cortactin has also been shown to play a role in
cancer, including in the formation of invadopodia and podosomes (Artym et al. 2006), and in
the membrane trafficking of proteins to and from the cell surface (Cao et al. 2003). Cortactin
also has a role in the secretion of certain proteins, and this is important in the Extra Cellular
Matrix (ECM)-degrading properties of invadopodia (Clark and Weaver 2008). To date,
cortactin over-expression has been found in head and neck squamous cell carcinoma, as well
as cancers of the breast, ovary, stomach, liver, colon and oesophagus (Kirkbride et al. 2011).
Thus, the finding of cortactin as a possible binding partner of PBF had the potential to
explain some of the effects previously observed with PBF over-expression. PBF is a protein
present within the cytoplasm of the cell as well as at the cell membrane (Smith et al. 2009),
and it is possible that cortactin may be key to this membrane trafficking. In addition, work
within our group has shown that PBF is a secreted protein (Watkins et al. 2010), a process
cortactin might influence. Finally, the link between PBF over-expression and increased cell
invasiveness could potentially be mediated by cortactin.
The initial aim of this chapter, therefore, was to attempt to validate the interaction
between PBF and cortactin. If confirmed, the effect of changes in cortactin expression on PBF
physiology would be assessed. Specifically, these experiments would address PBF
localisation, secretion and membrane transport.
Chapter 6 Cortactin
132
6.2 Methods
6.2.1 Cell lines and transfection
K1, TPC1 and HeLa cells were maintained as described in Section 2.1 and transfected
with PBF-HA, pCDNA3.1+, or Myc- and FLAG-tagged cortactin (Cambridge Bioscience,
Cambridge, UK). Cortactin knock-down was achieved with siRNA transfection, carried out as
described (Section 2.2.3) using ON-TARGETplus Human CTTN siRNA (Thermo Scientific).
6.2.2 GST pull down assays
GST-tagged PBF was translated as described in 2.5.1. [35S]-methionine cortactin was
prepared using the TNT® T7/SP6 Coupled Reticulocyte Lysate System (Promega; as
described in Section 2.5) from the full length CTTN cDNA (in the bacterial vector POTB7
(IMAGE clone 3637586, Source Biosciences). The assay was performed as described in
Section 2.5.
6.2.3 Western blotting and co-immunoprecipitation
These were carried out as described in Section 2.3. Antibodies used were anti-cortactin,
1:1000 for Western blotting, 1:10 for immunoprecipitation (clone 4F11, Millipore, UK), anti-
HA (see Section 2.3.1), anti-Myc Tag, 1:2000 for Western blotting, 1:50 for
immunoprecipitation (clone 9B11, Cell Signalling), anti-FLAG (Agilent Technologies,
Wokingham, UK ), 1:2000 for Western blotting, 1:50 for immunoprecipitation.
6.2.4 Fluorescence immunocytochemistry
This was performed as described in Section 2.6, using K1, TPC1 and HeLa cells.

Chapter 6 Cortactin
133
6.2.5 Secretion assay
6.2.5.1 Cell seeding and transfection
Cells were seeded into 6 well plates and transfected as described in section 2.2.2. For
cells undergoing knockdown and over-expression, siRNA transfection took place at 24 hours
after seeding, and plasmid transfection a further 24 hours later. Medium was changed to 1 ml
RPMI as above with 5% FBS at either 24 or 48 hours after initial transfection. At 72 hours,
media and cells were harvested for analysis.
6.2.5.2 Confirmation of transfection
Cells were harvested in RIPA/protease inhibitor as described previously and protein
concentration determined by Bradford assay. Thirty micrograms of protein were assessed by
Western blotting to determine over-expression/knock down prior to further analysis.
6.2.5.3 Assessment of secretion by Western blotting
The medium was transferred to a 1.5 ml microcentrifuge tube and spun at 12,000 rpm on
a benchtop centrifuge for 5 minutes to separate cell debris. The supernatant was then
transferred to a 15 ml centrifuge tube, and protein precipitated by the addition of 2 ml 100 %
ethanol and centrifuging for 15 minutes at 1000 rpm. The pellet was then re-suspended in
RIPA with protease inhibitor. Protein concentration was quantified using the Bradford assay;
30 µg of protein was then separated by SDS-PAGE and Western blotting performed as per
section 2.3.
6.2.5.1 Enzyme-Linked Immunosorbent Assay (ELISA)
Secretion of PBF was determined using the PTTG1IP ELISA kit (USCN Life Science
Inc., China), as per manufacturer’s instructions: Standards were prepared from serial dilution
of the provided stock standard, to dilutions ranging from 0.156 to 50 ng / mL. 100 µL of
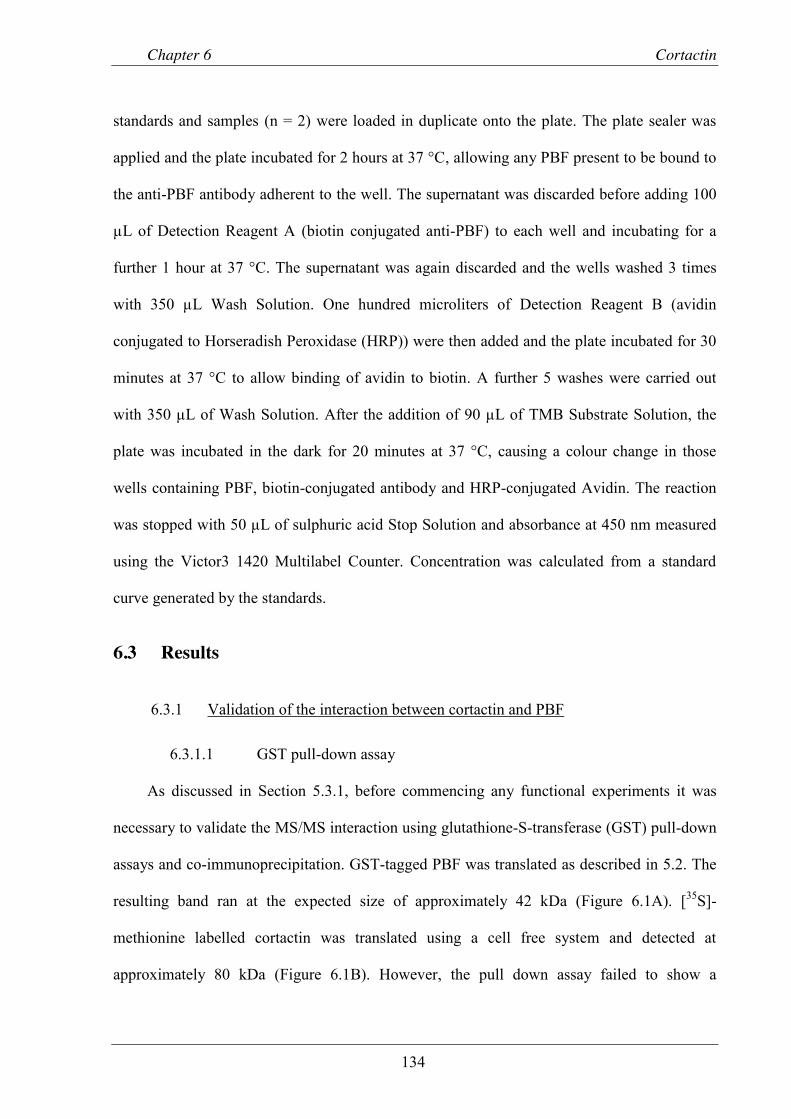
Chapter 6 Cortactin
134
standards and samples (n = 2) were loaded in duplicate onto the plate. The plate sealer was
applied and the plate incubated for 2 hours at 37 °C, allowing any PBF present to be bound to
the anti-PBF antibody adherent to the well. The supernatant was discarded before adding 100
µL of Detection Reagent A (biotin conjugated anti-PBF) to each well and incubating for a
further 1 hour at 37 °C. The supernatant was again discarded and the wells washed 3 times
with 350 µL Wash Solution. One hundred microliters of Detection Reagent B (avidin
conjugated to Horseradish Peroxidase (HRP)) were then added and the plate incubated for 30
minutes at 37 °C to allow binding of avidin to biotin. A further 5 washes were carried out
with 350 µL of Wash Solution. After the addition of 90 µL of TMB Substrate Solution, the
plate was incubated in the dark for 20 minutes at 37 °C, causing a colour change in those
wells containing PBF, biotin-conjugated antibody and HRP-conjugated Avidin. The reaction
was stopped with 50 µL of sulphuric acid Stop Solution and absorbance at 450 nm measured
using the Victor3 1420 Multilabel Counter. Concentration was calculated from a standard
curve generated by the standards.
6.3 Results
6.3.1 Validation of the interaction between cortactin and PBF
6.3.1.1 GST pull-down assay
As discussed in Section 5.3.1, before commencing any functional experiments it was
necessary to validate the MS/MS interaction using glutathione-S-transferase (GST) pull-down
assays and co-immunoprecipitation. GST-tagged PBF was translated as described in 5.2. The
resulting band ran at the expected size of approximately 42 kDa (Figure 6.1A). [35S]-
methionine labelled cortactin was translated using a cell free system and detected at
approximately 80 kDa (Figure 6.1B). However, the pull down assay failed to show a

Chapter 6 Cortactin
135
difference in detection of cortactin between samples incubated with GST-PBF and GST alone
(n = 3) (Figure 6.1C). Therefore this technique was unable to validate an interaction between
the two.
Figure 6.1 GST pull down assay investigating an interaction between PBF and cortactin. A: GST-tagged PBF ran at the expected size of 42 kDa. B: [35S]-methionine labelled cortactin was translated and ran at 80 kDa. C: No evidence of an interaction was observed when comparing GST-PBF to GST alone (n = 3).
6.3.1.2 Co-immunoprecipitation
Given that GST pull-down assays had failed to demonstrate an interaction between
cortactin and PBF, co-immunoprecipitation was used to assess whether a more physiological
setting was necessary for the two to bind. The endogenous expression of cortactin in K1,
TPC1 and HeLa cells was examined and shown to be similar (data not shown). Following
this, K1 and TPC1 cells were transfected with PBF-HA and immunoprecipitated with an anti-
cortactin antibody before being run through SDS-PAGE. Due to a strong light chain band
from the anti-cortactin antibody at 25 kDa, it was not possible to reliably identify PBF on

Chapter 6 Cortactin
136
immunoblotting. When the reverse experiment was performed, i.e. immunoprecipitating with
an anti-HA antibody, any cortactin band was hidden again by immunoglobulin bands.
It was decided, therefore, to transfect cortactin into the cells. Given that cortactin was
potentially hidden during Western blotting by non-specific antibody bands, a tagged vector
was used for transfection, containing full length cortactin cDNA as well as an N-terminal Myc
and FLAG tag (“Cort-Myc-FLAG”). This would allow a highly specific antibody to be used
to immunoprecipitate cortactin and might therefore permit more efficient PBF detection by
Western blotting. The tag would also help detect cortactin in the reciprocal experiment. In
order to ensure the validity of the tagged protein, Western blotting was performed on the
lysate of cells transfected with Cort-Myc-FLAG. The same samples were run in triplicate, and
transfected cortactin was detected using an anti-cortactin antibody as well as ones directed to
Myc and FLAG epitopes (Figure 6.2), demonstrating that this over-expressed protein could be
detected by any of the three antibodies. Cortactin exists in predominantly two isoform within
the cell, p80/85 (Buday and Downward 2007); over-expression resulted in an increase in both
forms, although only the larger isoform was detected by the anti-Myc antibody.

Chapter 6 Cortactin
137
Figure 6.2 Western blot of HeLa cells demonstrating transfection with Cort-Myc-FLAG, with detection by 3 different antibodies. β actin is included as a loading control.
Using this plasmid, HeLa cells were transfected with both cortactin and PBF-HA and the
resulting cell lysate immunoprecipitated using the anti-Myc antibody. After running these
through SDS-PAGE, immunoblotting showed a clear interaction between PBF-HA and
Cortactin-Myc, when compared to cells transfected with PBF-HA only, or in the no-antibody
control (Figure 6.3). The reverse experiment, in which lysates were immunoprecipitated using
anti-HA, and immunoblotted for anti-Myc, could not be interpreted again due to interference
from non-specific / immunoglobulin bands at 75 kDa (data not shown).

Chapter 6 Cortactin
138
Figure 6.3 Cortactin-Myc-FLAG interacts with PBF-HA as demonstrated by co-immunoprecipitation. Western blot showing co-immunoprecipitation of PBF-HA after immunoprecipitating with an anti-Myc antibody. T/F = transfection, IgG control = immunoglobulin only control, IP = immunoprecipitation, WB = Western blot.
6.3.2 Cortactin has no effect on PBF expression
Before proceeding to functional studies, HeLa cells were again used to establish if over-
expression of one protein had an effect on the amount of the other within the cell. When PBF-
HA was over-expressed, there was no significant difference in the amount of cortactin
compared to vector only controls (76.2 ± 7.1 % of control, p = ns, n = 3) (Figure 6.4A).
Similarly, over-expression of Cort-Myc-FLAG had no effect on PBF-HA levels (123.4 ± 17.3
% of vector only controls, p = ns, n = 3) (Figure 6.4B)
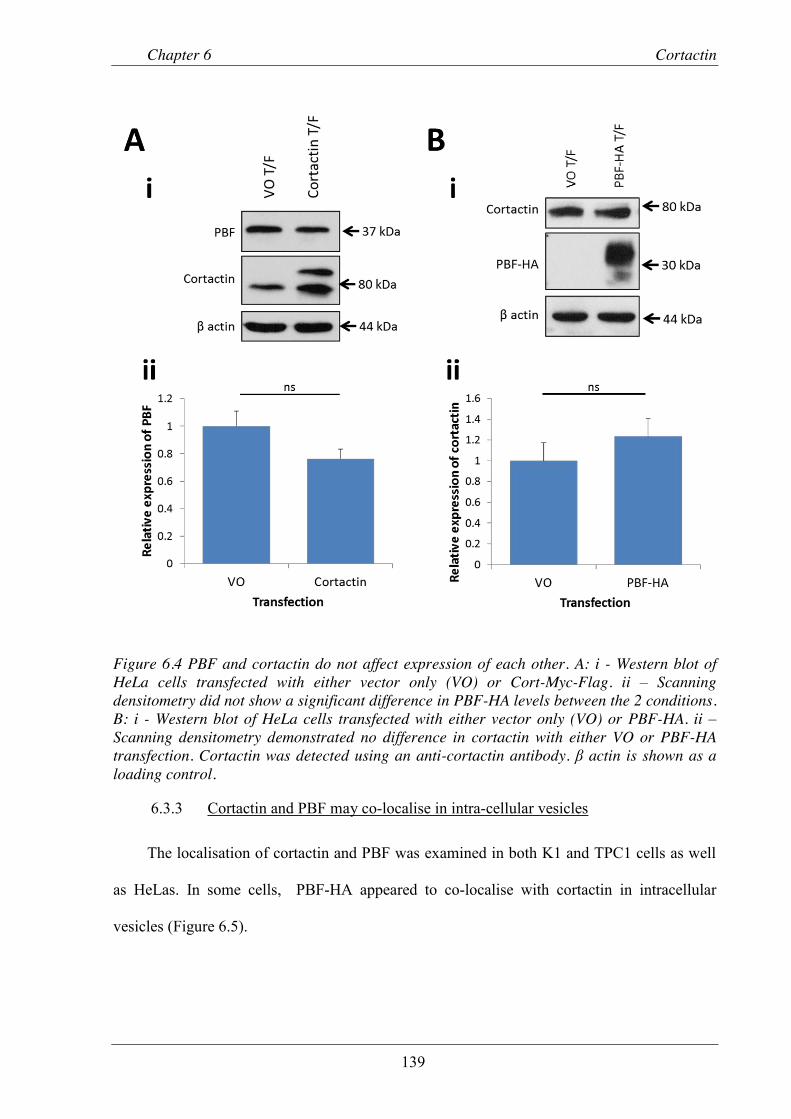
Chapter 6 Cortactin
139
Figure 6.4 PBF and cortactin do not affect expression of each other. A: i - Western blot of HeLa cells transfected with either vector only (VO) or Cort-Myc-Flag. ii – Scanning densitometry did not show a significant difference in PBF-HA levels between the 2 conditions. B: i - Western blot of HeLa cells transfected with either vector only (VO) or PBF-HA. ii – Scanning densitometry demonstrated no difference in cortactin with either VO or PBF-HA transfection. Cortactin was detected using an anti-cortactin antibody. β actin is shown as a loading control.
6.3.3 Cortactin and PBF may co-localise in intra-cellular vesicles
The localisation of cortactin and PBF was examined in both K1 and TPC1 cells as well
as HeLas. In some cells, PBF-HA appeared to co-localise with cortactin in intracellular
vesicles (Figure 6.5).
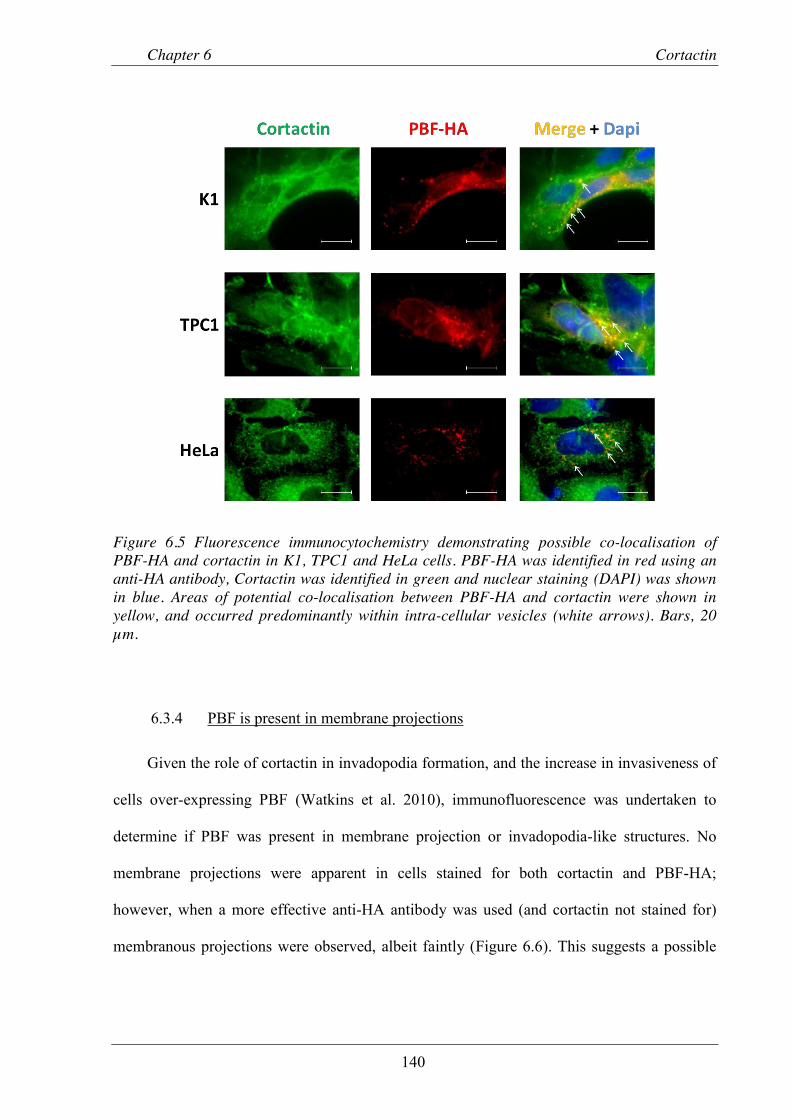
Chapter 6 Cortactin
140
Figure 6.5 Fluorescence immunocytochemistry demonstrating possible co-localisation of PBF-HA and cortactin in K1, TPC1 and HeLa cells. PBF-HA was identified in red using an anti-HA antibody, Cortactin was identified in green and nuclear staining (DAPI) was shown in blue. Areas of potential co-localisation between PBF-HA and cortactin were shown in yellow, and occurred predominantly within intra-cellular vesicles (white arrows). Bars, 20 µm.
6.3.4 PBF is present in membrane projections
Given the role of cortactin in invadopodia formation, and the increase in invasiveness of
cells over-expressing PBF (Watkins et al. 2010), immunofluorescence was undertaken to
determine if PBF was present in membrane projection or invadopodia-like structures. No
membrane projections were apparent in cells stained for both cortactin and PBF-HA;
however, when a more effective anti-HA antibody was used (and cortactin not stained for)
membranous projections were observed, albeit faintly (Figure 6.6). This suggests a possible
Chapter 6 Cortactin
141
role for PBF in invadopodia, although further experiments will be required to elucidate any
potential mechanism.
Figure 6.6 Fluorescence immunocytochemistry of three different HeLa cells. PBF-HA is stained green and over-exposed to demonstrate membrane projections (white arrows). Bars, 20 µm.
6.3.5 Investigations into the effect of cortactin on PBF secretion
PBF is a secreted protein (Watkins et al. 2010), although the mechanism for this has not
yet been established. Given the known role of cortactin in protein export, its effect on PBF
secretion was assessed using 2 assays: Western blotting and ELISA. Cortactin was over-
expressed as described above. In order to determine if a lack of cortactin had a detrimental
effect on the secretion of PBF, siRNA targeting cortactin was transfected into HeLa cells.
This led to a substantial knock down of cortactin expression when compared to transfection of
scrambled siRNA. A representative Western blot demonstrating cortactin over-expression and
knockdown is shown in Figure 6.7.
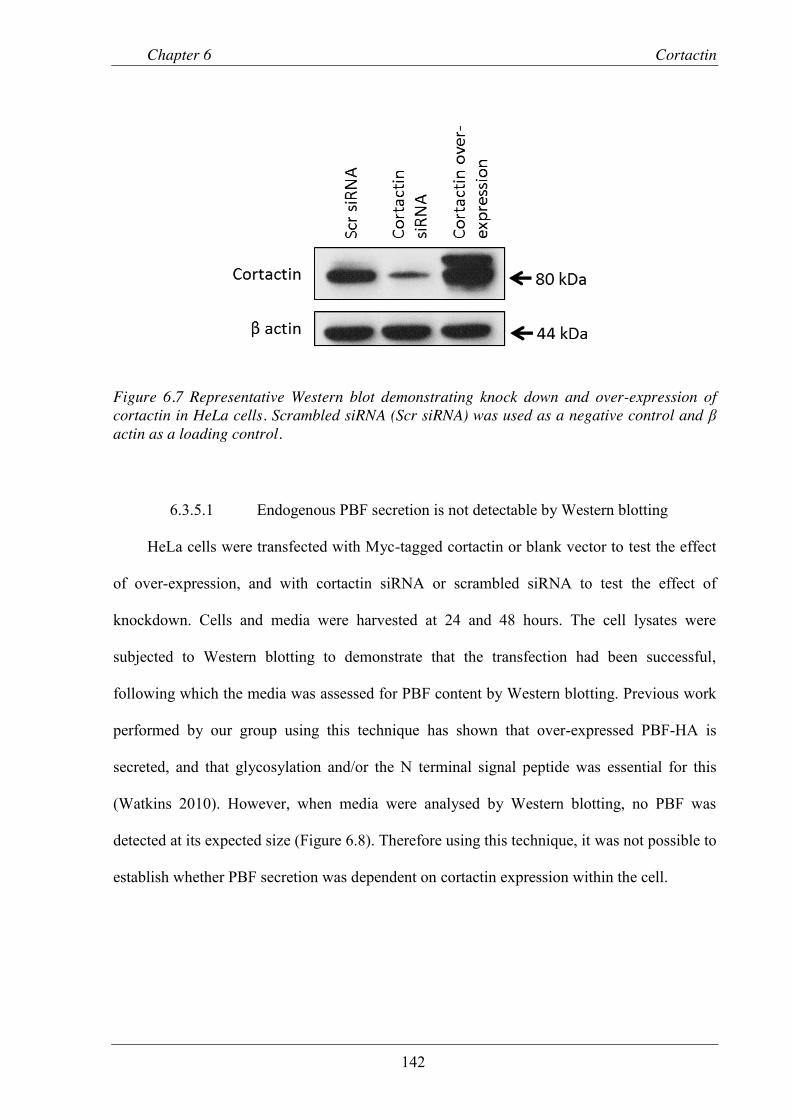
Chapter 6 Cortactin
142
Figure 6.7 Representative Western blot demonstrating knock down and over-expression of cortactin in HeLa cells. Scrambled siRNA (Scr siRNA) was used as a negative control and β actin as a loading control.
6.3.5.1 Endogenous PBF secretion is not detectable by Western blotting
HeLa cells were transfected with Myc-tagged cortactin or blank vector to test the effect
of over-expression, and with cortactin siRNA or scrambled siRNA to test the effect of
knockdown. Cells and media were harvested at 24 and 48 hours. The cell lysates were
subjected to Western blotting to demonstrate that the transfection had been successful,
following which the media was assessed for PBF content by Western blotting. Previous work
performed by our group using this technique has shown that over-expressed PBF-HA is
secreted, and that glycosylation and/or the N terminal signal peptide was essential for this
(Watkins 2010). However, when media were analysed by Western blotting, no PBF was
detected at its expected size (Figure 6.8). Therefore using this technique, it was not possible to
establish whether PBF secretion was dependent on cortactin expression within the cell.

Chapter 6 Cortactin
143
Figure 6.8 Assessment of the effect of cortactin on PBF secretion by Western blotting. Media were analysed at 24 (A) and 48 (B) hours post-transfection. Efficacy of transfection and knockdown were demonstrated by Western blot of the cell lysate. PBF was not detected in the media at either timepoint.

Chapter 6 Cortactin
144
6.3.5.2 Cortactin does not affect PBF secretion as demonstrated by ELISA
Due to the failure to detect secreted PBF by Western blotting, a separate, independent
experiment to assess PBF secretion was performed using Enzyme-Linked Immunosorbent
Assay (ELISA). Transfection of HeLa cells was performed as described in Section 2.2.2; at
both 24 hour and 48 hour timepoints, media and cells were harvested, and cell lysates
analysed to ensure adequate transfection and knockdown of cortactin. As demonstrated
previously, the cell lysates exhibited a marked increase in cortactin with over-expression, and
no detectable cortactin when siRNA was used. At the 24 hour timepoint when cortactin was
over-expressed, there was no significant difference in the amount of secreted PBF (99.5 ±
38.9 % of control, p = ns); a similar effect was observed at the 48 hour timepoint (92.2 ± 29.9
% of control, p = ns). For cortactin knockdown, a greater drop was observed for both
timepoints (79.9 ± 37.1 % at 24 hours, 80.5 ± 32.6 % at 48 hours) although neither of these
differences were significant (Figure 6.9). Of note, there was a wide variability in the amount
of secreted PBF detected, and this contributed to the large inter-experimental error.
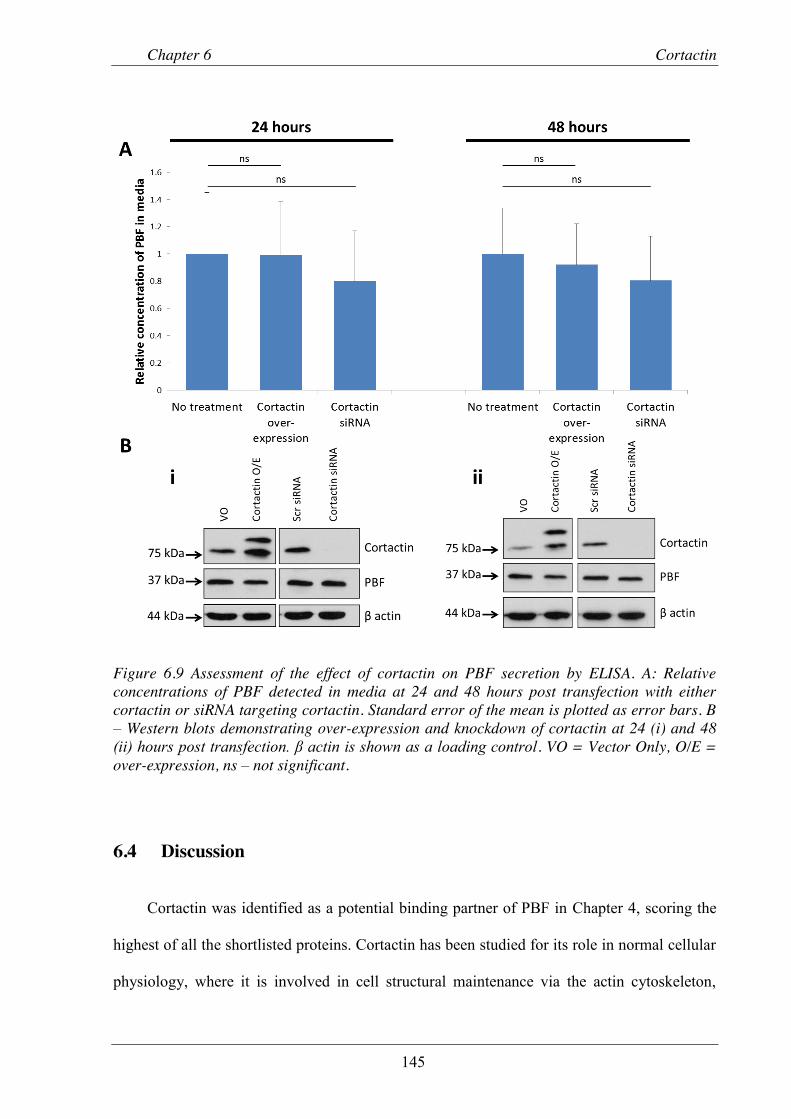
Chapter 6 Cortactin
145
Figure 6.9 Assessment of the effect of cortactin on PBF secretion by ELISA. A: Relative concentrations of PBF detected in media at 24 and 48 hours post transfection with either cortactin or siRNA targeting cortactin. Standard error of the mean is plotted as error bars. B – Western blots demonstrating over-expression and knockdown of cortactin at 24 (i) and 48 (ii) hours post transfection. β actin is shown as a loading control. VO = Vector Only, O/E = over-expression, ns – not significant.
6.4 Discussion
Cortactin was identified as a potential binding partner of PBF in Chapter 4, scoring the
highest of all the shortlisted proteins. Cortactin has been studied for its role in normal cellular
physiology, where it is involved in cell structural maintenance via the actin cytoskeleton,

Chapter 6 Cortactin
146
membrane trafficking of proteins and cell mobility via lamellipodia. In addition to this,
cortactin has a clear role in the development of malignancy. It is over-expressed in a number
of cancers, and in vitro studies have demonstrated that cortactin is involved in the formation
of invadopodia; membranous protrusions that promote invasion by secreting enzymes which
can break down the extra-cellular matrix (Kirkbride et al. 2011).
To determine whether the interaction identified by MS/MS was valid, GST pull-down
studies were first undertaken to assess binding in a cell-free setting. Although [35S]-
methionine labelled cortactin was successfully translated at the predicted molecular mass, no
binding was identified in the assay. While this did not support the MS/MS findings, it was
possible that binding could only occur within the cell once a particular post-translational
modification had taken place, to either cortactin or PBF, or required the presence of a binding
partner to facilitate the interaction.
Co-immunoprecipitation was therefore performed, immunoprecipitating lysates from
cells transfected with PBF-HA with either an anti-HA or anti-cortactin antibody.
Unfortunately, both of these experiments were hindered by non-specific immunoglobulin
bands obscuring the target areas on the Western blot (25 kDa for PBF-HA and 75 kDa for
cortactin). To counter this, cells were transfected with cortactin which had been tagged with
Myc and FLAG epitopes. Both these tags were small, and had well established antibodies
suitable for co-immunoprecipitation. By also increasing the amount of cortactin within the
cell, this allowed the amount of antibody used in the immunoprecipitation step to be reduced,
and also reduced the exposure time needed for Western blot detection of protein. This plasmid
was successfully validated, showing a significant increase in the amount of cortactin
following transfection. Importantly, when anti-Myc and anti-FLAG antibodies were used,
there was no non-specific interaction identified. Interestingly, expression of the p85 isoform

Chapter 6 Cortactin
147
of cortactin was greater than the p80. The significance of the ratio of the 2 isoforms has not
been established, although it has been suggested that the p85 is associated with tumour
invasiveness (Zhang et al. 2006). Using this plasmid for over-expression, PBF-HA was
successfully co-immunoprecipitated with Myc-tagged cortactin; no non-specific binding was
identified and due to the lower amount of antibody used and short exposure time, there was
no contamination by light chain immunoglobulin. While this provided good evidence for an
interaction between the 2 proteins, the reverse experiment remained problematic, due to the
large immunoglobulin band at 75 kDa. Methods exist to counter this problem, such as using
magnetic beads, and are currently being used within our group to further investigate this
angle.
PBF is known to have a direct effect on the expression of NIS via the NIS promoter
(Boelaert et al. 2007). Therefore, before any functional studies were performed, experiments
were undertaken to ascertain whether the over-expression of either PBF or cortactin had any
effect on expression of the other. When analysed by Western blotting, there was no difference
in the amount of either protein detected when the other was over-expressed.
Having established that the 2 proteins interact, fluorescence immunocytochemistry was
performed to identify areas of co-localisation within the cell. The resulting data were
inconclusive, however in both the thyroid cell lines (K1 and TPC1) and also in the HeLa cells,
cortactin demonstrated potential co-localisation with PBF-HA in intra-cellular vesicles,
although further experiments would be needed to explore this observation. PBF has been
shown to internalise the membrane proteins NIS (Smith et al. 2009) and MCT8 (Smith et al.
2012), although the exact mechanism of this remains unclear. PBF co-localises with the late
endosome marker CD63, suggesting that this may be mediated by clathrin-dependant
endocytosis (Smith et al. 2009). Cortactin regulates both clathrin-dependent and –independent
Chapter 6 Cortactin
148
endocytosis (Cao et al. 2003; Sauvonnet et al. 2005), and this may therefore be key in
understanding and potentially preventing the reduction and subsequent repression of these
membrane bound transporters by PBF.
As cortactin plays a role in invadopodia formation and function, a feature which is
directly related to tumour invasiveness, and PBF increases invasiveness (Watkins et al. 2010),
as an additional preliminary study the potential role PBF in invadopodia was then assessed.
No co-localisation between PBF and cortactin was observed in cell membrane projections,
although when cells stained only for PBF-HA were over-exposed, membrane protrusions
staining for PBF-HA were apparent. These invadopodia-like structures were visible in a
number of cells types with PBF-HA transfection. These preliminary data are currently the
focus of study within our group to further define the potential role of PBF in invadopodia
function, using specific invadopodia assays.
The invasive potential of PBF is reliant on its secretion (Watkins 2010); the above
studies have suggested a role for cortactin in the transport of PBF to and from the cell
membrane, and also a link between PBF and invadopodia. The final area assessed was to
determine whether cortactin had a role in the secretion of PBF. As well as stabilising
invadopodia, cortactin regulates the secretion of matrix metalloproteases (MMPs) which
degrade the ECM (Clark and Weaver 2008), and therefore may also provide the mechanism
for PBF secretion. Two separate assays were performed to investigate a link between PBF
secretion and cortactin. For both, secretion was assessed with over-expression of cortactin
(using blank vector transfection as a control) and cortactin knockdown. Loss of cortactin
results in a reduction in invadopodia number as well as reduced ECM degradation (the latter
through reduced secretion of MMPs) (Clark et al. 2007). The first method used - assessment
by Western blotting - had been successfully implemented to demonstrate that PBF was a
Chapter 6 Cortactin
149
secreted protein previously by our group (Watkins 2010). However, in this experiment, no
PBF was detected in the media at 24 and 48 hours, although the cells themselves had
transfected successfully as indicated by Western blotting of the cell lysates. Given that
endogenous as opposed to over-expressed PBF was used, the concentration of any PBF within
the media would have been significantly lower than identified in previous studies (Watkins et
al. 2010), potentially below the detection limit of Western blotting.
This led to the second method, Enzyme-Linked Immunosorbent Assay (ELISA), which
utilised an antibody to immobilise PBF to a plate, with subsequent detection being potentially
more sensitive than Western blotting. There was significant variability in the output generated
from the ELISA, which led to high standard errors and the results not reaching significance.
There was a trend towards reduced secretion of PBF with cortactin knockdown, however.
These 2 experiments, therefore, should be seen as preliminary studies on which to base
future research. Questions that will need to be addressed include the validity of co-
transfecting PBF alongside either cortactin or siRNA, and also (perhaps most importantly) the
timing at which analysis should be performed. In addition, cell surface biotinylation assays
will allow the quantitative assessment of the effect of cortactin on PBF membrane trafficking.
These experiments are on-going within our group.
Concluding remarks
This chapter has validated the interaction between PBF and cortactin, and suggested that
they may co-localise in intra-cellular vesicles, which may explain the membrane trafficking of
PBF as well as its secretion. PBF is found in protrusions from the cell membrane when over-
expressed; preliminary studies have identified potential ways of studying the effects of
Chapter 6 Cortactin
150
cortactin knockdown and over-expression on PBF secretion, and will provide a starting point
for future work researching this interaction and its functional significance.

Chapter 7 Src
151
Chapter 7 Validation of the interaction between SRC and PBF
Chapter 7 Src
152
7.1 Introduction
The SRC tyrosine kinase family are non-receptor tyrosine kinases, members of which
are SRC, LYN, YES, FYN, FGR, LCK, HCK, BLK and FRK. Two members of this group,
LYN and SRC, were identified by MS/MS. The two proteins share 78 % homology (BLAST
analysis, available at http://blast.ncbi.nlm.nih.gov/Blast.cgi?PAGE=Proteins), which includes
the sections of the peptide chains identified by MS/MS. As phosphorylation prediction
software had identified SRC as a potential kinase for PBF, and as the most well studied
member of the group, SRC was chosen for validation studies and potential functional work.
c-SRC is regarded as the first identified oncogene, and is the cellular homologue of v-
SRC, the oncogenic component of the Rous sarcoma virus, which causes tumours in chicken.
c-SRC, henceforth referred to as SRC, contains four SRC homology (“SH”) domains, of
which SH2 and SH3 are key to its regulatory mechanism (Figure 7.1A) (Bjorge et al. 2000).
Inactivation of SRC is brought about by phosphorylation at Y530; this then interacts with the
SH2 domain to bring the protein into a closed configuration, thereby inactivating it. In
addition, the SH3 domain interacts with a proline rich segment within the kinase domain
causing further de-activation. When de-phosphorylated at Y530, the molecule opens to allow
auto-phosphorylation at Y419 and subsequent activation (Figure 7.1) (Anbalagan et al. 2012).
Activated SRC is involved in cellular proliferation, survival, migration and angiogenesis, and
it follows that an aberrant increase in SRC expression is associated with many human
malignancies.
The aim of this chapter was to independently validate the binding between SRC and
PBF, an essential process prior to functional studies exploring the interaction.
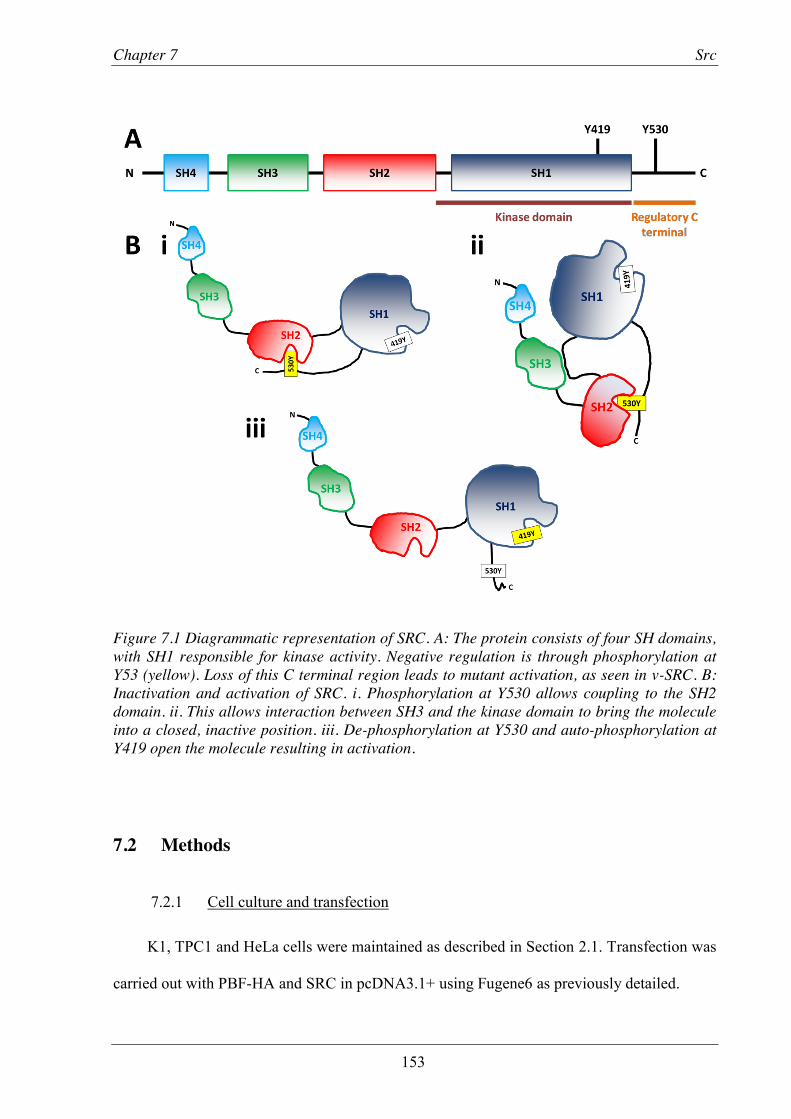
Chapter 7 Src
153
Figure 7.1 Diagrammatic representation of SRC. A: The protein consists of four SH domains, with SH1 responsible for kinase activity. Negative regulation is through phosphorylation at Y53 (yellow). Loss of this C terminal region leads to mutant activation, as seen in v-SRC. B: Inactivation and activation of SRC. i. Phosphorylation at Y530 allows coupling to the SH2 domain. ii. This allows interaction between SH3 and the kinase domain to bring the molecule into a closed, inactive position. iii. De-phosphorylation at Y530 and auto-phosphorylation at Y419 open the molecule resulting in activation.
7.2 Methods
7.2.1 Cell culture and transfection
K1, TPC1 and HeLa cells were maintained as described in Section 2.1. Transfection was
carried out with PBF-HA and SRC in pcDNA3.1+ using Fugene6 as previously detailed.
Chapter 7 Src
154
7.2.2 GST pull-down assay
GST-tagged PBF was translated and [35S]-methionine labelled SRC was translated from
full length SRC cDNA (kindly provided by Dr Yotis Senis, University of Birmingham, in the
bacterial expression vector pOTB7) as described in Section 2.5.
7.2.3 Subcloning of SRC cDNA into pcDNA3.1+
In order to allow transfection of cell lines, SRC was subcloned into pcDNA3.1+, using
the restriction enzymes EcoR1 and Xba1, as described in Section 2.2.1.2. Correct insertion
was confirmed by sequencing using the T7 and BGHrev primers.
7.2.4 Western blotting and co-immunoprecipitation
Western blotting and co-immunoprecipitation was performed as previously described in
2.4. Monocloclonal rabbit anti-human SRC (Cell Signalling, Danvers, MA) was used at
1:1000 for Western blot and 1:10 for immunoprecipitation. Anti-HA and anti-β actin were
used as previously described.
7.2.5 Fluorescence immunocytochemistry
This was carried out as described in Section 2.6. Anti-Src was used at 1:100. Other
antibodies were used as previously described.
7.3 Results
7.3.1 Validation of the interaction between SRC and PBF
7.3.1.1 GST pull down assay
Before examining the functional significance of a potential interaction between SRC and
PBF, the putative interaction was investigated using glutathione-S-transferase (GST) pull

Chapter 7 Src
155
down assays and co-immunoprecipitation. In a cell-free setting, GST-tagged PBF was
translated and its size determined by SDS-PAGE with the resulting band running at the
expected (Figure 7.2A). [35S]-methionine labelled SRC was translated using a cell free system
and detected at 60 kDa (Figure 7.2B). To test for an interaction, GST-tagged PBF was
incubated with [35S]-methionine labelled SRC, using GST alone as a negative control. After
eluting, the samples were run through SDS-PAGE with 10% [35S]-methionine labelled SRC
as a positive control. When compared to GST alone, GST-PBF appeared to bind SRC in this
cell free setting (Figure 7.2C), although a small degree of binding was apparent in the GST-
only control lane.
Figure 7.2 GST pull down assay. A: Western blot of translated GST-PBF. B: [35S]-methionine labelled SRC detectable at approximately 60 kDa. C: GST pull-down assay demonstrating binding between SRC and GST-PBF when compared to GST alone.
7.3.1.2 Co-immunoprecipitation
As well as examining the interaction in a cell free system, co-immunoprecipitation was
performed to establish if the interaction occurred in a more physiological setting. As the
endogenous expression of SRC in TPC and K1 cells is low, over-expressed SRC was used.
The full length human cDNA for SRC was sub-cloned into the mammalian expression vector
pcDNA3.1+ from the bacterial vector pOTB7. The resulting plasmid was sequenced and
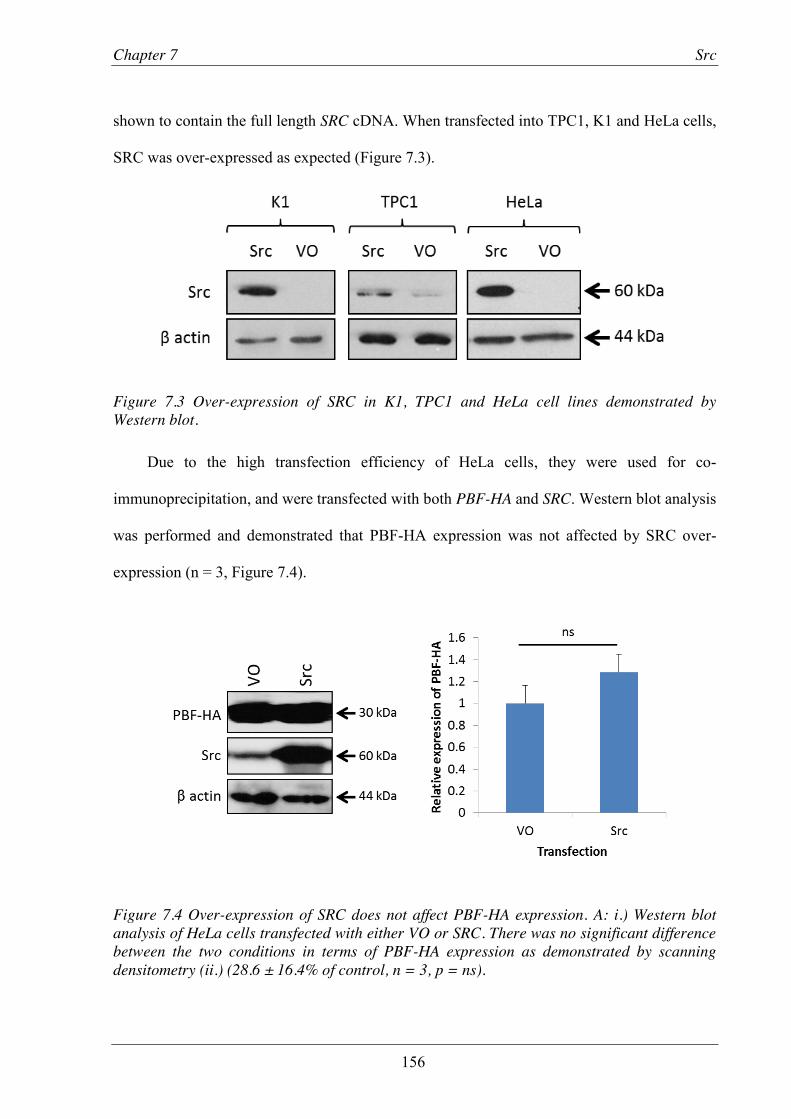
Chapter 7 Src
156
shown to contain the full length SRC cDNA. When transfected into TPC1, K1 and HeLa cells,
SRC was over-expressed as expected (Figure 7.3).
Figure 7.3 Over-expression of SRC in K1, TPC1 and HeLa cell lines demonstrated by Western blot.
Due to the high transfection efficiency of HeLa cells, they were used for co-
immunoprecipitation, and were transfected with both PBF-HA and SRC. Western blot analysis
was performed and demonstrated that PBF-HA expression was not affected by SRC over-
expression (n = 3, Figure 7.4).
Figure 7.4 Over-expression of SRC does not affect PBF-HA expression. A: i.) Western blot analysis of HeLa cells transfected with either VO or SRC. There was no significant difference between the two conditions in terms of PBF-HA expression as demonstrated by scanning densitometry (ii.) (28.6 ± 16.4% of control, n = 3, p = ns).
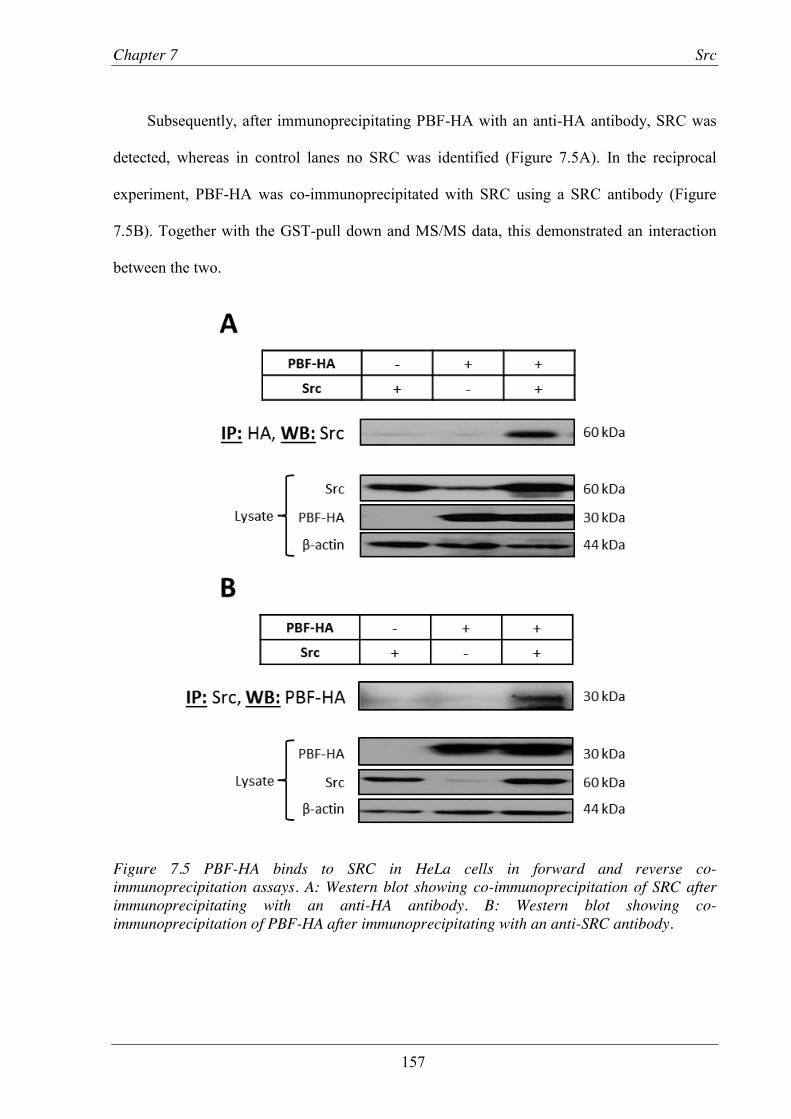
Chapter 7 Src
157
Subsequently, after immunoprecipitating PBF-HA with an anti-HA antibody, SRC was
detected, whereas in control lanes no SRC was identified (Figure 7.5A). In the reciprocal
experiment, PBF-HA was co-immunoprecipitated with SRC using a SRC antibody (Figure
7.5B). Together with the GST-pull down and MS/MS data, this demonstrated an interaction
between the two.
Figure 7.5 PBF-HA binds to SRC in HeLa cells in forward and reverse co-immunoprecipitation assays. A: Western blot showing co-immunoprecipitation of SRC after immunoprecipitating with an anti-HA antibody. B: Western blot showing co-immunoprecipitation of PBF-HA after immunoprecipitating with an anti-SRC antibody.

Chapter 7 Src
158
7.3.2 PBF and SRC co-localise
Having confirmed the interaction between SRC and PBF, their cellular localisation was
then examined using fluorescence immunocytochemistry in K1, TPC1 and HeLa cells
transfected with PBF-HA and SRC. In all 3 cell lines, the distribution of both PBF-HA and
SRC was similar; both were found in the cytoplasm and at the cell membrane (Figure 7.6).
Figure 7.6 Fluorescence immunocytochemistry demonstrating co-localisation of PBF-HA and SRC in K1, TPC1 and HeLa cells. PBF-HA was identified in green using an anti-HA antibody, SRC was identified in red, nuclear staining was shown in blue. Areas of co-localisation between PBF-HA and SRC were shown in yellow, and occur within intra-cellular vesicles (white arrows) and at the cell membrane (blue arrow). Bars, 20 µm.

Chapter 7 Src
159
7.3.3 SRC does not alter the sub-cellular localisation of PBF-HA
The final analysis performed was to assess the effect of Src over-expression on PBF sub-
cellular localisation. An increase in SRC expression did not have an effect on PBF sub-
cellular localisation, as apparent in Figure 7.7, where 2 adjacent cells are displayed. The lower
right cell is co-transfected with PBF-HA and SRC, while the upper cell is transfected with
PBF-HA only. It is readily apparent that PBF-HA has a similar distribution in both cells.
Figure 7.7 Fluorescence immunocytochemistry demonstrating that SRC does not affect PBF sub-cellular localisation. HeLa cells were transfected with SRC (red) and PBF-HA (green), areas of co-localisation are shown in yellow and nuclear staining in blue. In the 2 cells, only the lower cell has been transfected with SRC; however PBF-HA distribution is similar in both. Bars, 20 µm.
Chapter 7 Src
160
7.4 Discussion
The SFKs were identified by MS/MS as potential interacting partners of PBF, and SRC
had been identified as a potential kinase for PBF. These factors led to the decision to include
SRC in the final shortlist of proteins to take on for further experiments. As in previous
chapters, the first step in this process was to independently validate the interaction between
PBF and SRC, using GST-tagged pull down assays and also co-immunoprecipitation. The
GST pull-down assay demonstrated an interaction in a cell-free setting, but initial attempts at
co-immunoprecipitation were unsuccessful (data not shown) as the expression of SRC was
not sufficient for detection by Western blotting. MS/MS is significantly more sensitive than
co-immunoprecipitation, with the capability of detecting femtomolar concentrations of
peptides, hence the identification of SRC in those assays when compared to co-
immunoprecipitation. The c-DNA for SRC was subcloned into a mammalian expression
vector, which facilitated its transfection into the cell lines used in previous chapters. The over-
expression was confirmed in all cell lines on Western blotting. Using this model, SRC was
over-expressed in HeLa cells and an interaction was confirmed by forward and reverse co-
immunoprecipitation. Taken together, these data validated the interaction between PBF and
SRC first identified by MS/MS.
Finally, fluorescence immunocytochemistry was performed to investigate any co-
localisation of the two proteins. Western blot analysis demonstrated no change in PBF-HA
expression when SRC was over-expressed. Immunofluorescence indicated co-localisation at
both the cell membrane and within intra-cellular vesicles in HeLa cells. The location of SRC
within the cell is important to understanding any potential kinase role it may have regarding
PBF. Usually, cytoplasmic SRC is in the pY530 inactive state; de-phosphorylation here leads

Chapter 7 Src
161
to translocation to the cell membrane where full activation is achieved through
phosphorylation at Y419 (Anbalagan et al. 2012). The findings above indicate co-localisation
at the cell membrane, where active SRC may be able to phosphorylate PBF, and also within
intra-cellular vesicles, the consequences and reasons for which are as yet unknown and are the
focus of on-going study.
Concluding remarks
This chapter has validated the interaction between PBF and the tyrosine kinase SRC
using two independent binding assays. Co-localisation was observed within intra-cellular
vesicles and also at the cell membrane, and it is at this location that SRC is active as a protein
kinase. These data, taken together with phosphorylation prediction, suggest that SRC may be
the kinase responsible for phosphorylating PBF. The following chapter further explores this
interaction, and the functional implications of targeting it.

Chapter 8 Src and iodide uptake
162
Chapter 8 The role of SRC and its inhibition on PBF-induced NIS repression
Chapter 8 Src and iodide uptake
163
8.1 Introduction
The previous chapter validated the interaction between SRC and PBF using GST pull-
down assay and co-immunoprecipitation. Additionally, co-localisation was observed in intra-
cellular vesicles and at the cell membrane. These data were important preliminary steps prior
to any investigation into the kinase role of SRC within PBF physiology, and what effect SRC
may have on PBF function and thyroid cancer development.
SRC lies downstream of a number of cell membrane receptor tyrosine kinases, and thus
plays a vital part in many of the key cellular process they govern (Figure 8.1). In human
malignancies such as breast, gastrointestinal, lung, ovary and lymphomas, SRC is
overexpressed, with its effects on adhesion, cell growth and angiogenesis contributing to
metastasis formation (Alvarez et al. 2006). However, over-expression of SRC alone is
insufficient to act as a transforming event in these cells, rather depending on the mutation of
the c-terminal part of the protein, as seen in v-SRC, which constitutionally activates the
kinase (Shalloway et al. 1984). A truncated version of the protein lacking the c-terminal
regulatory mechanism was found in 12% of advanced colorectal carcinomas, demonstrating a
direct role in disease progression (Irby et al. 1999).

Chapter 8 Src and iodide uptake
164
Figure 8.1 SRC lies downstream of several receptor tyrosine kinases. Activation of SRC leads to activation of other pathways which in turn control key cellular events. Increased activation of these physiological processes can lead to increased invasiveness and metastasis of cancer. EGFR – epidermal growth factor receptor, PDGFR – platelet derived growth factor receptor, FGFR – fibroblast growth factor receptor, MET – hepatocyte growth factor receptor. Adapted from (Irby and Yeatman 2000).
Despite a potential link between SRC activity and medullary thyroid cancer being put
forward in 2004 (Liu et al. 2004), the relationship between SRC and differentiated thyroid
cancer was not described until 2009 where a SRC inhibitor was shown to reduce growth and
invasion in a number of thyroid cancer cell lines, although this was thought to be due to
inhibition of SRC phosphorylating Focal Adhesion Kinase (FAK) (Schweppe et al. 2009).
Since then, SRC has been identified as up-regulated in invasive thyroid cancers (Cho et al.
2012), with inhibition of SRC reducing metastases and tumour growth (Chan et al. 2012).
Total SRC is not increased in thyroid cancers, therefore it is the phosphorylation, and

Chapter 8 Src and iodide uptake
165
consequently the activation, of SRC that promotes this aggressive tumour behaviour, although
the exact pathway by which this effect is mediated remains unknown.
Tyrosine phosphorylation is a post-translational modification that is often key to
controlling a protein’s activity within a cell. Unpublished data within the McCabe group have
recently shown PBF to be phosphorylated at Y174, although the kinase responsible was
unknown. Phospho-site prediction software identified SRC as a potential kinase for this
residue. The aims of this chapter were therefore to determine whether SRC, which was
confirmed to bind PBF in Chapter 7, was responsible for phosphorylating PBF. This
interaction could then be targeted with a variety of inhibitors, with the aim of reducing
phosphorylation and potentially increasing iodide uptake in radioiodine refractory, PBF over-
expressing, thyroid cells.
8.2 Methods
8.2.1 Cell culture and transfection
K1, TPC1, HeLa and FRTL-5 cells were maintained as described in 2.1. Human primary
thyroid tissues were cultured with approval of the Local Ethics and Research Committee as
described in Section 2.7.
8.2.2 Western Blotting
Western Blotting was performed as described in Section 2.3.2. In addition to antibodies
previously described, a PBF phospho-specific antibody to residue Y174 (“anti-Y174”)
(CovalAb, Villeurbanne, France) was kindly provided by Dr V Smith, University of
Birmingham, and was used at 1:500.
Chapter 8 Src and iodide uptake
166
8.2.3 Fluorescence immunocytochemistry
Immunofluorescence was carried out as described in Section 2.6. In addition to
previously described antibodies, anti-Y174 was used at 1:100.
8.2.4 Assessment of phosphorylation status
8.2.4.1 Treatment with a phosphatase inhibitor
In order to preserve the phosphorylation status of proteins, cells were harvested using the
irreversible tyrosine phosphatase inhibitor sodium orthovanadate (Na₃VO₄). Prior to
harvesting, cells were treated for 15 minutes with 100 µM pervanadate (from a 30 mM stock
solution: 951.1 µL PBS, 6 µL hydrogen peroxide, 42.9 µL Na₃VO₄, incubated in the dark at
room temperature for 15 minutes). The medium was then removed and the cells washed with
1 ml cold PBS before adding 100 µL modified RIPA (50 mM Tris, 150 mM NaCl, 1 %
Igepal, 6 mM sodium deoxycholate, 1 mM ethylene glycol tetraacetic acid (EGTA), buffered
to pH 7.4) with 1 mM Na₃VO₄ and 6 % protease inhibitor cocktail. Cells were scraped into a
microcentrifuge tube, sonicated for 30 seconds and spun on a benchtop centrifuge at 12,000
rpm for 20 minutes. The supernatant was then stored at -20 °C.
8.2.4.2 Treatment with tyrosine kinase inhibitors (TKIs)
In an attempt to alter the phosphorylation of PBF, cells were treated with a panel of
TKIs. The different TKIs used, with their known targets and dose, are shown in Table 8.1.
Thirty minutes prior to harvesting, appropriate TKIs were added to the media and plates
returned to the incubator. Protein was then harvested as described above.

Chapter 8 Src and iodide uptake
167
TKI Dose (nM) Target(s)
Gefitinib 10 Epidermal growth factor receptor (Ciardiello 2000)
Imatinib 10 Abl, c-kit α, platelet derived growth factor receptor (Buchdunger et al. 1996)
PD173074 10 Fibroblast growth factor receptor, Vascular endothelial growth factor receptor (Mohammadi et al. 1998)
SU11274 10 c-MET (Sattler et al. 2003)
PF573228 10 Focal adhesion kinase (Slack-Davis et al. 2007)
PP1 2 – 10 Src (Hanke et al. 1996)
PP3 2 - 10 Src family negative control (Liu et al. 1999)
Table 8.1 Dose and target(s) of tyrosine kinase inhibitors (TKIs) used.
8.2.5 Iodide uptake assays
8.2.5.1 TSH responsiveness
Prior to uptake analysis, functionality of primary thyrocyte cultures were assessed.
Primary human thyrocytes are able to remain functional for several weeks when cultured as
described in Section 2.7, although this decreases with time (Eggo et al. 1996). In addition,
cultures from some patients may not exhibit functions associated with differentiated thyroid
follicular cells. This may be due to the specimen originating from macroscopically normal,
but histologically abnormal, thyroid tissue. The response to TSH by primary thyrocytes is a
reliable marker of thyroid cell function, with increasing concentrations of TSH resulting in an
increase in iodide concentration by the cell. However, at super-physiologic doses of TSH,
iodide uptake falls (Eggo et al. 1996). For each prep, half of a 24 well plate was kept in TSH
and serum free medium from day 4 (the other half being maintained in serum-free medium
only). On day 7, the cells were treated (in duplicate) with 0.01, 0.1, 0.3, 1 and 10 U of TSH.
Chapter 8 Src and iodide uptake
168
On day 9 the ability of the cells to take up 125I was measured as described below; any
preparations that did not show the anticipated TSH response were discarded.
8.2.5.2 Iodide uptake
Primary thyroid cells were treated with sodium iodide (NaI) containing 100,000 cpm 125I
(Hartmann Analytic, Braunschweig, Germany) to give a final concentration of 10-7 NaI. This
concentration of iodide ions had been optimised to ensure maximal uptake by thyrocytes
(Eggo et al. 1996). The cells were returned to the incubator for 3 hours to allow the uptake of
125I by the thyrocytes. Subsequently, the cells were washed rapidly twice with HBSS to
remove any residual 125I and lysed in 200 µL 2 % SDS. After transferring to a test tube, 125I
uptake was assessed by analysing the gamma emissions as measured on a LKB Wallac 1260
Multi gamma II gamma counter for 1 minute. To standardise the results between wells, the
amount of protein present was quantified using the BCA assay as described in Section 2.3.1,
with BSA standards made in 2 % SDS. In addition, transfection was determined by running
25 µL of the lysate through SDS-PAGE and immunoblotting with antibodies targeting the
transfected protein.
Iodide uptake was also measured in HeLa, TPC1 and K1 cells. Cells were seeded in 9.5
cm2 tissue culture wells and transfected as previously described. After 48 hours further
incubation at 37 °C, cells were treated with NaI containing 125I and iodide uptake measured as
described above.
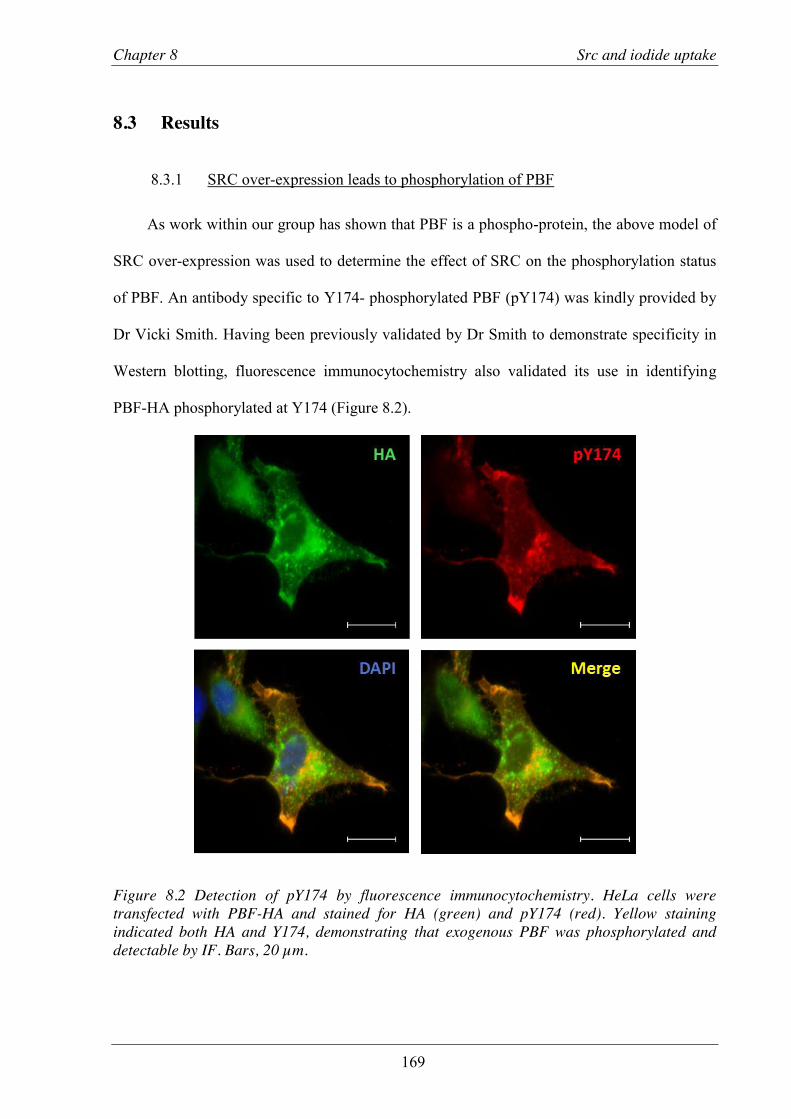
Chapter 8 Src and iodide uptake
169
8.3 Results
8.3.1 SRC over-expression leads to phosphorylation of PBF
As work within our group has shown that PBF is a phospho-protein, the above model of
SRC over-expression was used to determine the effect of SRC on the phosphorylation status
of PBF. An antibody specific to Y174- phosphorylated PBF (pY174) was kindly provided by
Dr Vicki Smith. Having been previously validated by Dr Smith to demonstrate specificity in
Western blotting, fluorescence immunocytochemistry also validated its use in identifying
PBF-HA phosphorylated at Y174 (Figure 8.2).
Figure 8.2 Detection of pY174 by fluorescence immunocytochemistry. HeLa cells were transfected with PBF-HA and stained for HA (green) and pY174 (red). Yellow staining indicated both HA and Y174, demonstrating that exogenous PBF was phosphorylated and detectable by IF. Bars, 20 µm.

Chapter 8 Src and iodide uptake
170
HeLa cells were transfected to transiently over-express PBF-HA, and co-transfected
with either SRC or blank vector. As phosphorylation is a post-translational modification that
can easily be disrupted by the process of harvesting and lysing cells, the phosphatase inhibitor
pervanadate was added 30 minutes prior to harvesting in order to preserve the phosphorylated
state of PBF, with vehicle-only treatment as a control. With vector only transfection, pY174
was apparent at low to undetectable levels; however, SRC was shown to significantly increase
the amount of pY174 (n = 3) (Figure 8.3). Cells transfected with the Y174A mutant of PBF
(which cannot be phosphorylated at residue 174) were used as a negative control and did not
demonstrate detectable phosphorylation. In addition, using pervanadate increased the yield of
pY174 as would be expected.
Figure 8.3 SRC over-expression leads to increased phosphorylation of PBF at Y174 (pY174). Western blot analysis of HeLa cells co-transfected with PBF-HA and either SRC or VO. Treatment was either with (PV+) or without (PV-) pervanadate. Y174A was a mutant of PBF which could not be phosphorylated at Y174. β actin shown for loading control and HA to demonstrate transfection.
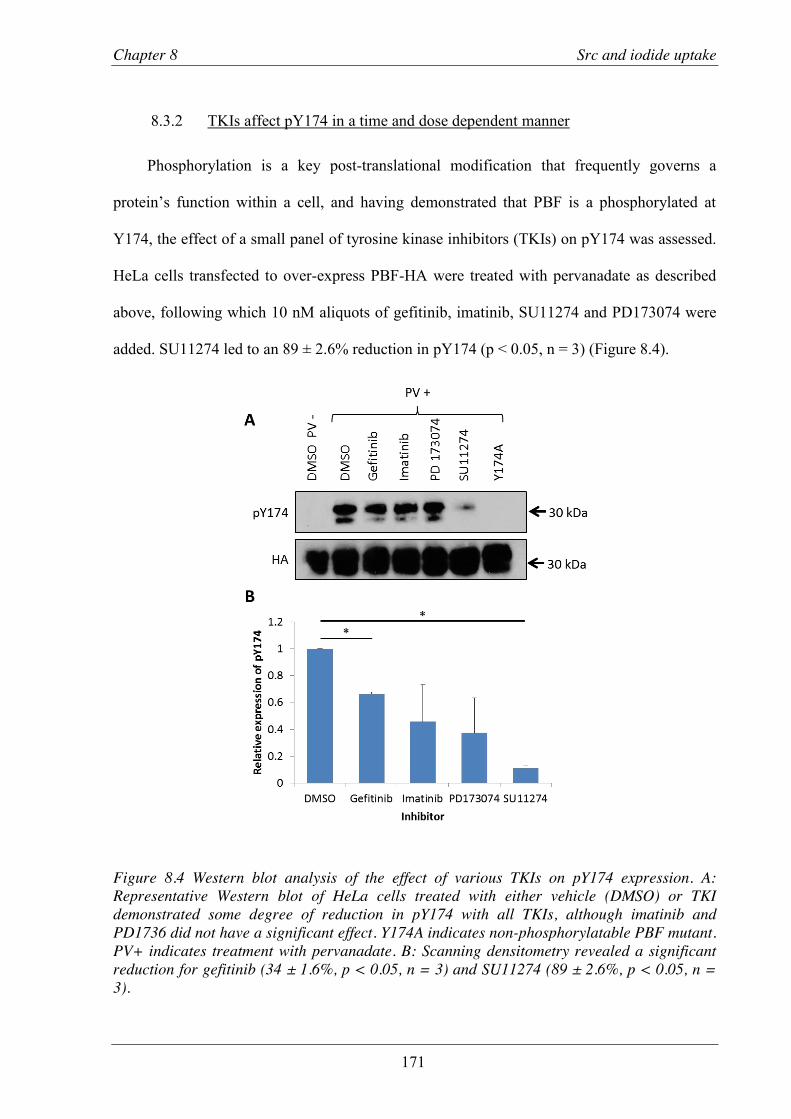
Chapter 8 Src and iodide uptake
171
8.3.2 TKIs affect pY174 in a time and dose dependent manner
Phosphorylation is a key post-translational modification that frequently governs a
protein’s function within a cell, and having demonstrated that PBF is a phosphorylated at
Y174, the effect of a small panel of tyrosine kinase inhibitors (TKIs) on pY174 was assessed.
HeLa cells transfected to over-express PBF-HA were treated with pervanadate as described
above, following which 10 nM aliquots of gefitinib, imatinib, SU11274 and PD173074 were
added. SU11274 led to an 89 ± 2.6% reduction in pY174 (p < 0.05, n = 3) (Figure 8.4).
Figure 8.4 Western blot analysis of the effect of various TKIs on pY174 expression. A: Representative Western blot of HeLa cells treated with either vehicle (DMSO) or TKI demonstrated some degree of reduction in pY174 with all TKIs, although imatinib and PD1736 did not have a significant effect. Y174A indicates non-phosphorylatable PBF mutant. PV+ indicates treatment with pervanadate. B: Scanning densitometry revealed a significant reduction for gefitinib (34 ± 1.6%, p < 0.05, n = 3) and SU11274 (89 ± 2.6%, p < 0.05, n = 3).

Chapter 8 Src and iodide uptake
172
Given that SU11274 led to the greatest response of the panel of TKIs, this was used to
determine the optimum dose that could be applied in order to demonstrate an effect. Using
concentrations varying from 0 to 10 µM, SU11274 was applied to HeLa cells over-expressing
PBF-HA. A reduction in pY174 was observed with the lowest dose, 0.5 µM (79.5 ± 2.1% of
control, p < 0.05, n = 3) (Figure 8.5). There was a significant difference between the reduction
observed with 0.5 µM and concentrations of 2 µM (95.2 ± 1.5%), 5 µM (95.5 ± 1.2%) and 10
µM (96.4 ± 1.4%) (all p < 0.01, n = 3). The optimum dose was therefore taken to be 2 µM.

Chapter 8 Src and iodide uptake
173
Figure 8.5 SU11274 reduces pY174 expression in a dose dependent manner. Representative Western blot showing a reduction in pY174 with increasing concentrations of SU11274. Below, scanning densitometry demonstrated a significant reduction compared to control with all concentrations used (p < 0.05, n = 3).
Once the optimum dose of TKI had been determined, the optimum treatment time was
assessed. HeLa cells were again transfected with PBF-HA, and all treated with 2 µM
SU11274. In these experiments, treatment time ranged from 0 minutes to 24 hours. All cells
were treated with pervanadate as above to preserve phosphorylation after cell harvest. In
Western blot, a decrease in pY174 expression was observed at all timepoints when compared

Chapter 8 Src and iodide uptake
174
to the 0 minutes negative control (Figure 8.6A). However, the change across the range was
small and therefore it was decided to use the 30 minute timepoint for subsequent experiments,
given the potential cytotoxicity of the inhibitor.
Fluorescence immunocytochemistry across the same timepoints was also performed.
Interestingly, for all timepoints there appeared to be a fall in the amount of pY174 associated
with the cell membrane, with more being located in intracellular vesicles. However, this was
not quantified directly (Figure 8.6B).

Chapter 8 Src and iodide uptake
175
Figure 8.6 Time course treatment of HeLa cells with SU11274. A: Representative Western blot demonstrating a time-dependent reduction in pY174 with SU11274 treatment (2 µM). B: Fluorescence immunocytochemistry of HeLa cells treated for differing time periods with SU11274, with pY174 staining in red. With increasing treatment time, there was less membrane localisation observed. Bars, 20 µm.
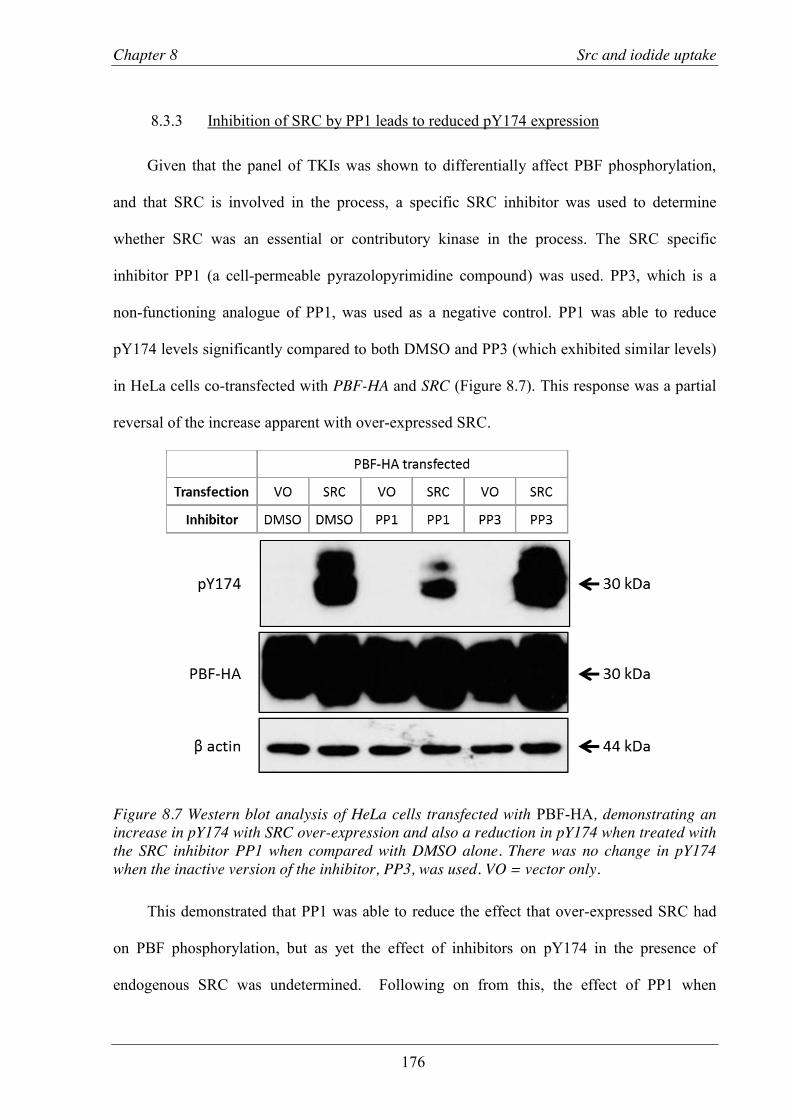
Chapter 8 Src and iodide uptake
176
8.3.3 Inhibition of SRC by PP1 leads to reduced pY174 expression
Given that the panel of TKIs was shown to differentially affect PBF phosphorylation,
and that SRC is involved in the process, a specific SRC inhibitor was used to determine
whether SRC was an essential or contributory kinase in the process. The SRC specific
inhibitor PP1 (a cell-permeable pyrazolopyrimidine compound) was used. PP3, which is a
non-functioning analogue of PP1, was used as a negative control. PP1 was able to reduce
pY174 levels significantly compared to both DMSO and PP3 (which exhibited similar levels)
in HeLa cells co-transfected with PBF-HA and SRC (Figure 8.7). This response was a partial
reversal of the increase apparent with over-expressed SRC.
Figure 8.7 Western blot analysis of HeLa cells transfected with PBF-HA, demonstrating an increase in pY174 with SRC over-expression and also a reduction in pY174 when treated with the SRC inhibitor PP1 when compared with DMSO alone. There was no change in pY174 when the inactive version of the inhibitor, PP3, was used. VO = vector only.
This demonstrated that PP1 was able to reduce the effect that over-expressed SRC had
on PBF phosphorylation, but as yet the effect of inhibitors on pY174 in the presence of
endogenous SRC was undetermined. Following on from this, the effect of PP1 when
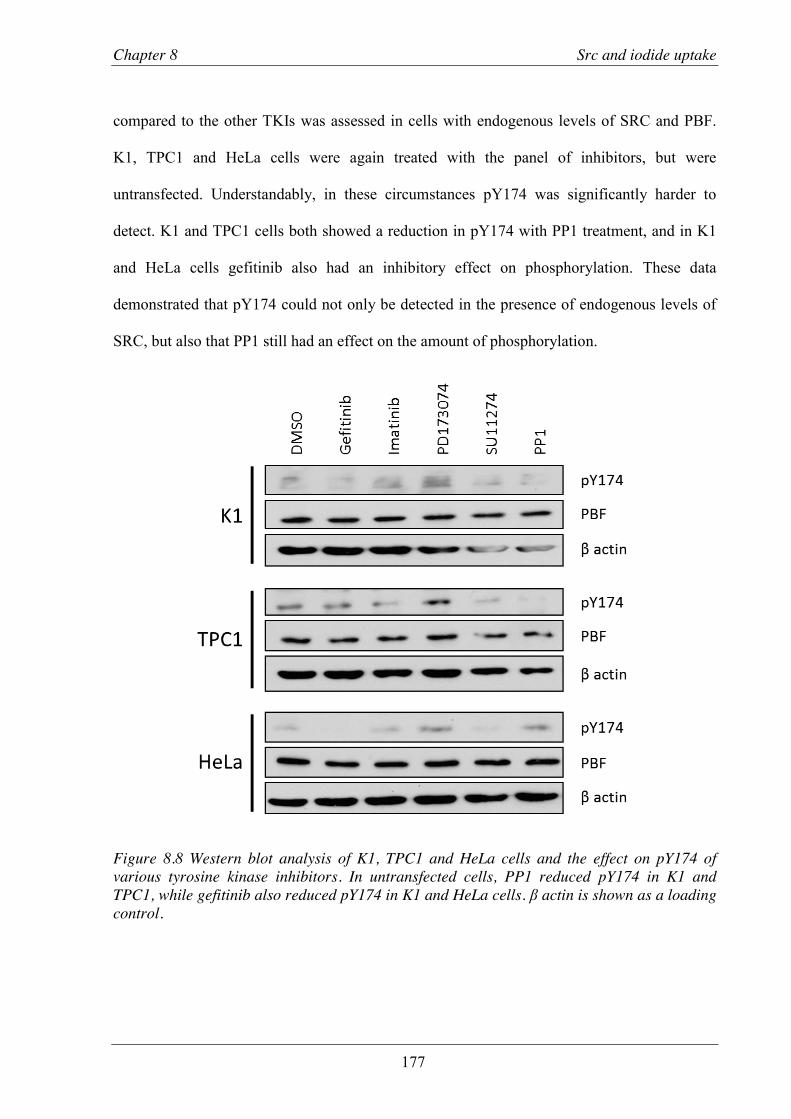
Chapter 8 Src and iodide uptake
177
compared to the other TKIs was assessed in cells with endogenous levels of SRC and PBF.
K1, TPC1 and HeLa cells were again treated with the panel of inhibitors, but were
untransfected. Understandably, in these circumstances pY174 was significantly harder to
detect. K1 and TPC1 cells both showed a reduction in pY174 with PP1 treatment, and in K1
and HeLa cells gefitinib also had an inhibitory effect on phosphorylation. These data
demonstrated that pY174 could not only be detected in the presence of endogenous levels of
SRC, but also that PP1 still had an effect on the amount of phosphorylation.
Figure 8.8 Western blot analysis of K1, TPC1 and HeLa cells and the effect on pY174 of various tyrosine kinase inhibitors. In untransfected cells, PP1 reduced pY174 in K1 and TPC1, while gefitinib also reduced pY174 in K1 and HeLa cells. β actin is shown as a loading control.

Chapter 8 Src and iodide uptake
178
8.3.4 PP1 treatment leads to a significant reduction in pY174 expression in human
primary thyroid cultures
The above experiments were carried out on transformed cells lines, all of which behave
in different ways depending on their particular cancer genotype, and may have aberrantly
activated kinase pathways. While this is useful for initially testing hypotheses, a more
physiological model is to use normal human thyroid tissue. The inhibitor experiments were
therefore repeated using human primary thyroid cultures, where the tissue was taken from
macroscopically normal thyroid. As pY174 was easier to detect in primary thyroid tissue,
these cells were left untransfected in order to reduce the amount of cell death and therefore
maximise yield. As would be expected, human thyroid tissue demonstrated a large variation
in culture across different preps, which affected statistical analysis. However, across a number
of cultures, gefitinib and PP1 yielded the greatest reduction in pY174, with PP1 having the
largest effect (Figure 8.9A). PP1 was therefore examined in isolation compared to treatment
with DMSO alone. PP1 led to an 81.1 ± 7.8% reduction in pY174 (p < 0.001, n = 5),
demonstrating that in both transformed cell lines and primary cultures, it is the most potent
inhibitor of PBF phosphorylation at Y174 (Figure 8.9B).

Chapter 8 Src and iodide uptake
179
Figure 8.9 Effect of TKIs on pY174 in human primary thyroid cultures. A: Western blot analysis demonstrating that treatment with gefitinib and PP1 led to a reduction in pY174. B: Scanning densitometry revealed an 81.1 ± 7.8% reduction in pY174 (p < 0.001, n = 5) with PP1 treatment compared to DMSO alone (n=3).
Chapter 8 Src and iodide uptake
180
8.3.5 Effect of PBF and SRC on 125I uptake
8.3.5.1 Determination of uptake efficiency in different cell lines
Work within our group has demonstrated that over-expression of PBF significantly
reduces 125I uptake in both murine and human primary thyroid cultures (Read et al. 2011). In
order to explore the relationship between PBF phosphorylation and 125I uptake, the human
primary thyroid model was validated and the cell lines assessed for uptake experiments. When
measured on a gamma counter, untransfected and untreated human primary thyrocytes and
FRTL5 cells both had counts in excess of 15,000 cpm per 3.7 cm2 of culture. The K1, TPC1
and HeLa cells all had low counts, the highest being in the TPC1 cells where the average
count was just over 500 cpm (n = 3) (Figure 8.10). While this was to be expected in the HeLa
cells which do not express NIS, the low uptake in the thyroid cell lines was an indicator of
their degree of de-differentiation from normal thyroid tissue and their lack of functional NIS.
Given that these counts were low in the absence of treatment or transfection, it was thought
unlikely that they would be suitable for further uptake experiments as the cell death that
inevitably occurs would render the counts too low to be meaningful, and further uptake
experiments were subsequently conducted on the primary cultures and FRTL5s, discounting
the other cell lines.
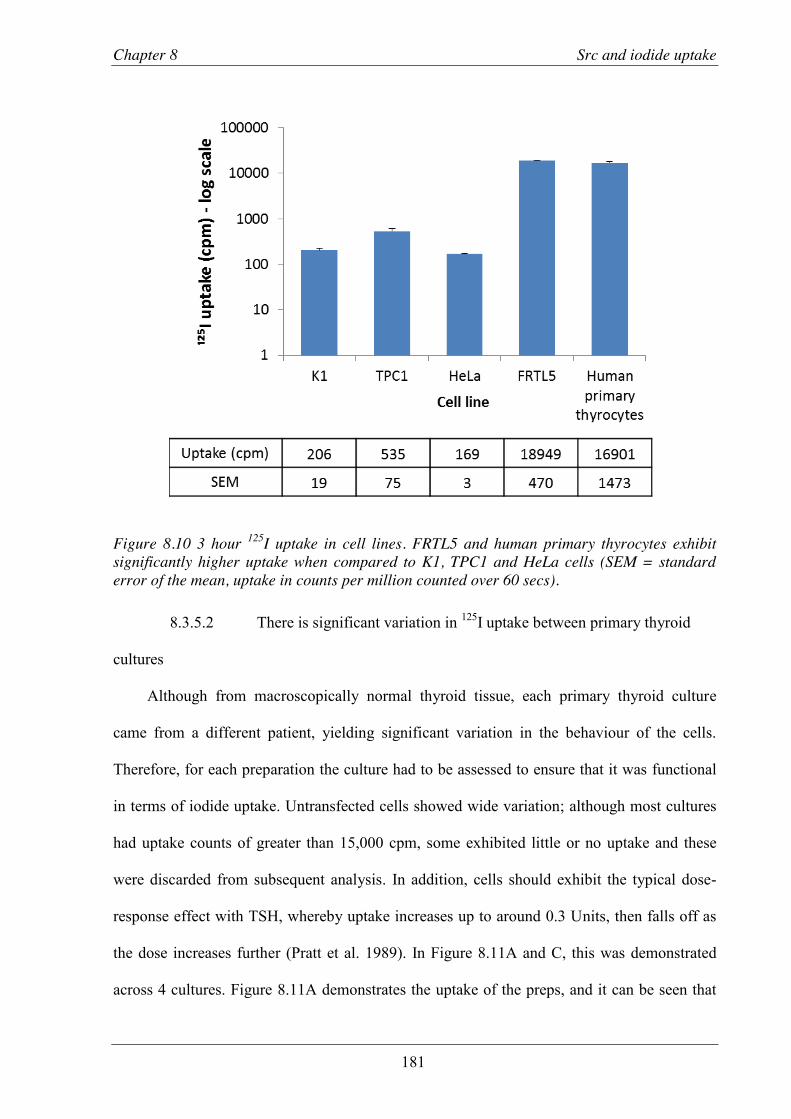
Chapter 8 Src and iodide uptake
181
Figure 8.10 3 hour 125I uptake in cell lines. FRTL5 and human primary thyrocytes exhibit significantly higher uptake when compared to K1, TPC1 and HeLa cells (SEM = standard error of the mean, uptake in counts per million counted over 60 secs).
8.3.5.2 There is significant variation in 125I uptake between primary thyroid
cultures
Although from macroscopically normal thyroid tissue, each primary thyroid culture
came from a different patient, yielding significant variation in the behaviour of the cells.
Therefore, for each preparation the culture had to be assessed to ensure that it was functional
in terms of iodide uptake. Untransfected cells showed wide variation; although most cultures
had uptake counts of greater than 15,000 cpm, some exhibited little or no uptake and these
were discarded from subsequent analysis. In addition, cells should exhibit the typical dose-
response effect with TSH, whereby uptake increases up to around 0.3 Units, then falls off as
the dose increases further (Pratt et al. 1989). In Figure 8.11A and C, this was demonstrated
across 4 cultures. Figure 8.11A demonstrates the uptake of the preps, and it can be seen that
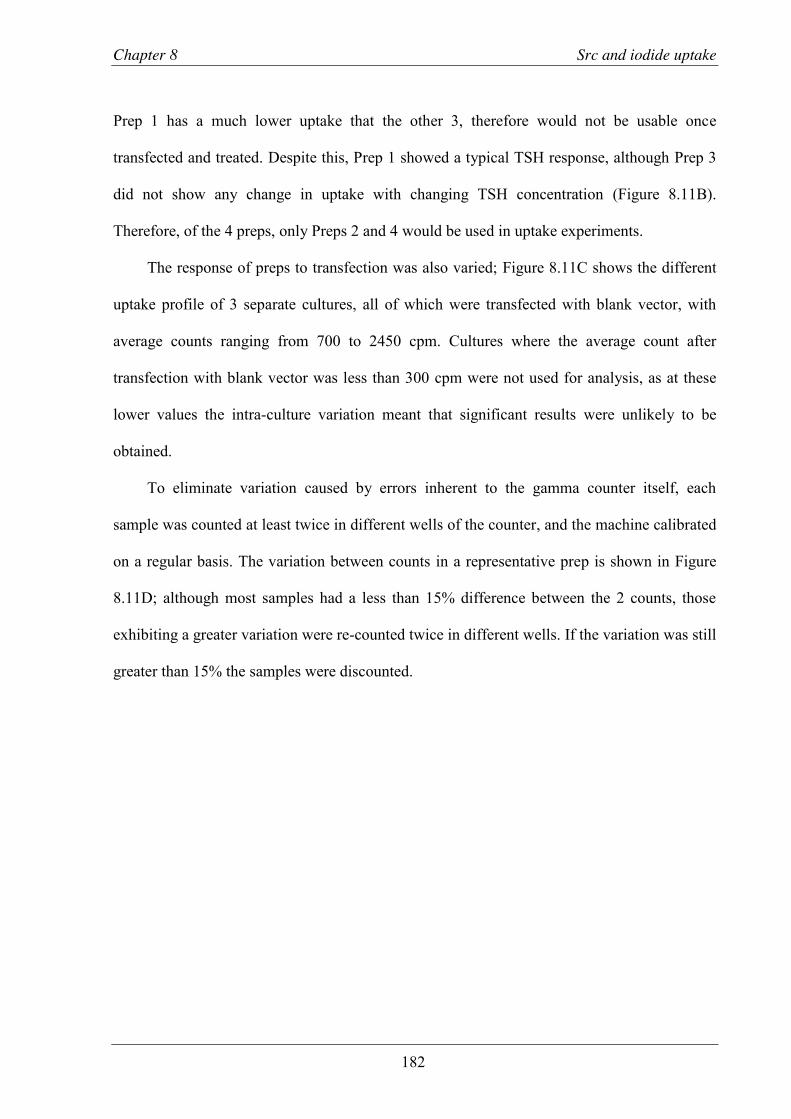
Chapter 8 Src and iodide uptake
182
Prep 1 has a much lower uptake that the other 3, therefore would not be usable once
transfected and treated. Despite this, Prep 1 showed a typical TSH response, although Prep 3
did not show any change in uptake with changing TSH concentration (Figure 8.11B).
Therefore, of the 4 preps, only Preps 2 and 4 would be used in uptake experiments.
The response of preps to transfection was also varied; Figure 8.11C shows the different
uptake profile of 3 separate cultures, all of which were transfected with blank vector, with
average counts ranging from 700 to 2450 cpm. Cultures where the average count after
transfection with blank vector was less than 300 cpm were not used for analysis, as at these
lower values the intra-culture variation meant that significant results were unlikely to be
obtained.
To eliminate variation caused by errors inherent to the gamma counter itself, each
sample was counted at least twice in different wells of the counter, and the machine calibrated
on a regular basis. The variation between counts in a representative prep is shown in Figure
8.11D; although most samples had a less than 15% difference between the 2 counts, those
exhibiting a greater variation were re-counted twice in different wells. If the variation was still
greater than 15% the samples were discounted.

Chapter 8 Src and iodide uptake
183
Figure 8.11 Variation in iodide uptake between different patient cultures. A: Uptake from 4 preps demonstrated poor uptake in Prep 1, and some variation in the uptake in the other preps. B: TSH response curves for the same 4 preps; Prep 3 did not exhibit the physiologically correct response and was therefore discarded. C: Iodide uptake in a separate 3 preps following transfection with blank vector; uptake was generally lower than observed in untransfected preps - Preps 5 and 7 demonstrated a more marked reduction. D: Variation in count obtained when measuring the same sample in different wells of the gamma counter. Red lines indicate a 15% difference between the 2; results outside these lines were re-counted and if still variable then discarded.
Provided the samples met the initial criteria for uptake and TSH response, they were
then assessed for their response to PBF over-expression. Some cultures did not show any
change in 125I uptake with PBF over-expression. In some cases this was due to lack of
transfection, although in others it appeared that PBF did not affect 125I uptake at all (Figure
8.12). As the aim of these experiments was to attempt to modulate the effect that PBF had on

Chapter 8 Src and iodide uptake
184
125I uptake, and because several publications have now confirmed that PBF represses iodide
uptake in vitro and in vivo (Smith et al. 2009; Read et al. 2011), only those that demonstrated
a significant reduction in uptake with PBF over-expression were used.
Figure 8.12 Relative 125I uptake by human primary thyrocytes in a single prep. This prep did not demonstrate any change in uptake with PBF transfection and was therefore not used (1.05 ± 0.05 fold change, p = ns).
8.3.5.3 PBF and SRC inhibit 125I uptake in human primary thyroid cultures
For those thyroid cultures which adhered to the criteria described in the previous section,
over-expression of PBF-HA led to a 60 ± 8% reduction in iodide uptake (p < 0.05, n = 4).
When untagged PBF was transfected, there was a similar, albeit smaller, reduction in uptake
(45 ± 17% decrease compared to VO, p = ns, n = 4), although there was no significant
difference between the two (Figure 8.13A). This was in keeping with previously published
data from our group (Smith et al. 2009; Read et al. 2011).
To assess the relationship between SRC over-expression and 125I uptake in the context of
PBF expression, PBF and SRC were co-transfected into human primary thyroid cultures, with
blank vector used as a control (n = 3) (Figure 8.13B). Despite the fact that when co-
transfecting, half the amount of cDNA was used for each vector, there was still a 52.4 ±
16.4% reduction in 125I uptake when PBF was over-expressed compared to blank vector at 48
hours post-transfection. When SRC alone was transfected, a similar reduction in uptake was

Chapter 8 Src and iodide uptake
185
seen (48.6 ± 16.7%), although interestingly when PBF and SRC were co-transfected the
subsequent reduction in 125I uptake was no different (46.2 ± 9.8%), i.e. there was no
cumulative effect of the dual transfection. Unfortunately, given the variable nature of thyroid
preps, in particular the variability when transfecting in blank vector, none of these results
reached statistical significance (Figure 8.13B).
Figure 8.13 Iodide uptake in human primary thyrocytes following transfection. A: Transfection with PBF-HA resulted in a 60 ± 8% fall in uptake (p < 0.05, n = 4); untagged PBF transfection resulted in a 45 ± 17% fall (p = ns, n = 4). B: Co-transfection of PBF and SRC caused uptake to fall by 46.2 ± 9.8%, which was no different to when PBF and VO (52.4 ± 16.4%) or SRC and VO (48.6 ± 16.7%) were transfected (for all compared to VO: p = ns, n = 3). * = p < 0.01, ns = not significant.

Chapter 8 Src and iodide uptake
186
8.3.6 Effect of TKIs on iodide uptake
8.3.6.1 Treatment for 30 minutes does not alter 125I uptake
Having demonstrated that PBF and SRC both cause a reduction in 125I uptake in human
primary thyrocytes, and having previously shown that SRC leads to an increase in pY174,
experiments were performed to determine if this reduction in uptake could be reversed by
targeting the phosphorylation of PBF at Y174. The uptake in primary thyrocytes transfected
with PBF, SRC, or both was measured after 30 minutes treatment with the inhibitors
previously shown to have the most effect on PBF phosphorylation: SU11274, gefitinib and
PP1, with PP3 acting as a negative control. As previously observed, both PBF and SRC over-
expression led to a reduction in 125I uptake when compared to blank vector transfection, both
independently and when co-transfected, although this did not reach statistical significance
(Figure 8.14). However, following treatment with the panel of TKIs for 30 minutes, there was
no difference in the uptake when compared to either DMSO or PP1 treatment, thus indicating
that treatment with these inhibitors and for this time period had no effect on the PBF induced
repression of iodide uptake.
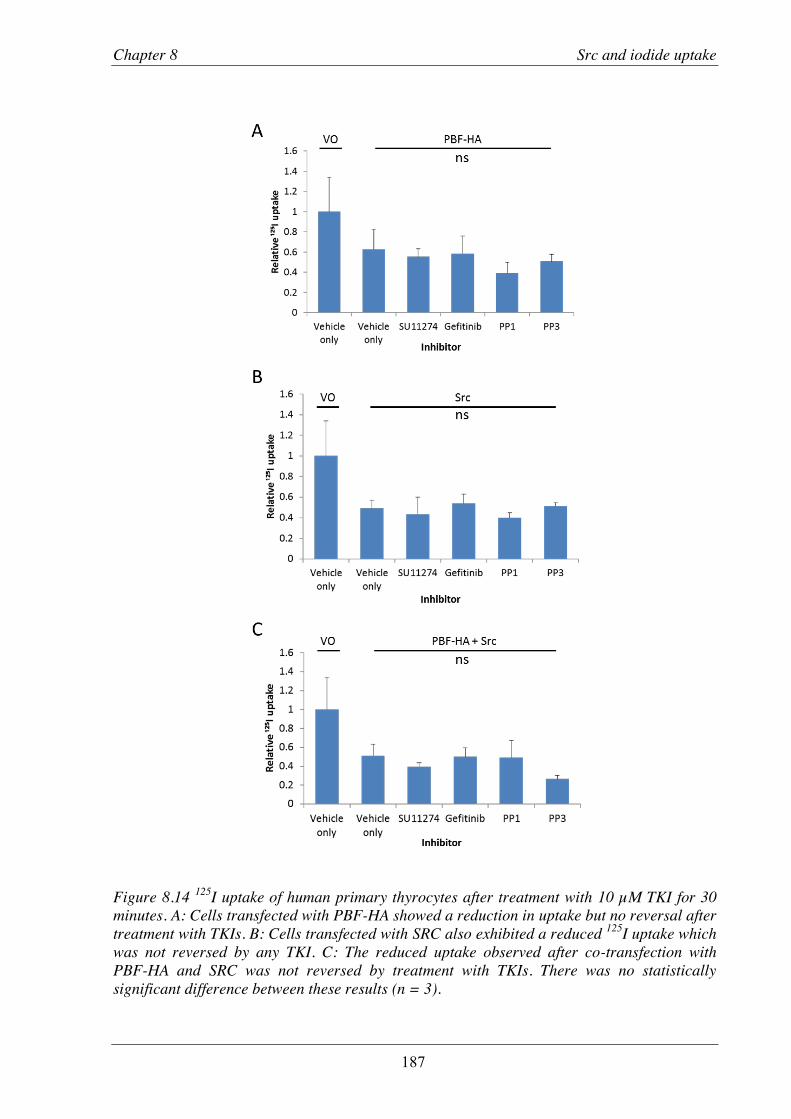
Chapter 8 Src and iodide uptake
187
Figure 8.14 125I uptake of human primary thyrocytes after treatment with 10 µM TKI for 30 minutes. A: Cells transfected with PBF-HA showed a reduction in uptake but no reversal after treatment with TKIs. B: Cells transfected with SRC also exhibited a reduced 125I uptake which was not reversed by any TKI. C: The reduced uptake observed after co-transfection with PBF-HA and SRC was not reversed by treatment with TKIs. There was no statistically significant difference between these results (n = 3).
Chapter 8 Src and iodide uptake
188
8.3.6.2 PP1 increases 125I uptake
Despite the fact that PBF phosphorylation was significantly reduced by the TKIs (Figure
8.4), there was no apparent effect on 125I uptake after 30 minutes treatment (Figure 8.14).
Given that we have shown PBF to internalise NIS and reduce its expression (Smith et al.
2009), it was felt likely that 30 minutes treatment may be too short a time to reverse this
process and therefore facilitate an increase in uptake.
To test this theory, untransfected human primary thyrocytes were treated with PP1 for 24
hours, with control wells treated with DMSO only. The PP1-treated cells demonstrated a 65%
± 15% increase in 125I uptake compared to DMSO treated cells (p < 0.001, n = 3) (Figure
8.15).
Figure 8.15 125I uptake in untransfected human primary thyrocytes treated with DMSO or PP1 for 24 hours. PP1 treatment resulted in a 65 ± 15% increase in iodide uptake (p < 0.001, n = 3).
Alongside this experiment, FRTL5 cells were transfected with PBF or blank vector and
treated with PP1 or DMSO for 24 hours. In both the VO and PBF samples, uptake was
increased by PP1 treatment (19.1 ± 5.2%, p < 0.05 and 31.1 ± 9.2%, p < 0.01 respectively, n =

Chapter 8 Src and iodide uptake
189
3). However, no difference was observed between the VO and PBF transfected cells as a
whole (Figure 8.16). When examined by Western blotting, the FRTL5 cells were shown not
to have transfected efficiently, essentially leading to no genotypic difference between the two
groups and hence the similarity in uptake profile (data not shown). Despite this lack of
transfection, these data again pointed to PP1 as an agent that could increase 125I uptake in
thyroid cells.
Figure 8.16 125I uptake in FRTL5 cells treated with either DMSO or PP1 for 24 hours. PP1 increased uptake in both VO and PBF transfected cells (19.1 ± 5.2%, p < 0.05 and 31.1 ± 9.2%, p < 0.01 respectively). There was no difference in uptake between the DMSO treated VO and PBF transfected cells (2.4 ± 5.1%, p = ns), although subsequent analysis showed that these cells had not taken up the transfection (n = 3).
8.3.6.3 PP1 reverses the PBF induced repression of iodide uptake
To examine the effect of PP1 in the most physiologic in vitro setting, primary human
thyrocytes were transfected with either blank vector or PBF-HA, and subsequently treated for
24 hours with PP1 or DMSO (n = 5). In these cultures, treating blank vector transfected cells

Chapter 8 Src and iodide uptake
190
with DMSO made no difference to the iodide uptake (7.4 ± 9.9% increase, p = ns).
Transfection with PBF-HA resulted in a 47.3 ± 7.3% reduction in 125I uptake compared with
blank vector (p < 0.01). Most importantly, this effect was completely reversed by treatment
with PP1, with PBF-HA transfected cells treated with PP1 showing no significant difference
to blank vector transfected cells receiving only DMSO treatment (4.1 ± 17.7% difference
from VO, p = ns) (Figure 8.17). Therefore, treatment of human primary thyrocytes with PP1
for 24 hours led to a full recovery from PBF-mediated iodide uptake repression.
Figure 8.17 125I uptake in human primary thyrocytes transfected with either VO or PBF-HA and treated for 24 hours with DMSO or PP1. PBF-HA transfection led to a 47.3 ± 7.3% (p < 0.01, n = 5) reduction in uptake compared to VO transfection. PP1 treatment was able to reverse this, with PBF-HA transfected cells treated with PP1 having a significantly higher uptake than those treated with DMSO (82.8 ± 33.6%, p < 0.05, n = 5). This abrogation of the PBF response resulted in treated cells exhibiting no differnce in uptake compared to VO untreated cells (4.1 ± 17.7% reduction compared to VO, p = ns, n = 5).
Chapter 8 Src and iodide uptake
191
8.4 Discussion
PBF is a phosphoprotein, with a potential site of tyrosine phosphorylation identified as
Y174 (see Section 1.4.1.4.2). Phosphorylation prediction software identified SRC as a
potential tyrosine kinase at this site, and the identification of SRC in the MS/MS dataset of
Chapter 4 was therefore interesting, especially as targeting tyrosine kinases is a rapidly
emerging field in the treatment of aggressive cancers. The previous chapter validated the
interaction between PBF and SRC, with evidence of co-localisation within intra-cellular
vesicles and at the plasma membrane; this chapter sought to further explore this interaction in
relation to PBF phosphorylation and implications for iodide uptake in thyroid cells.
A specific antibody to pY174 PBF was already in use within our group and had recently
been validated by Western blotting (data not shown); Chapter 7 validated its use for
fluorescence immunocytochemistry. Using this antibody, SRC over-expression was shown to
significantly increase the amount of pY174 in HeLa cells, although not to alter the sub-
cellular localisation of PBF. SRC acts within a number of signalling networks and therefore it
could not be determined from this experiment whether SRC was acting as the kinase itself or
if it was part of a cascade that resulted in PBF phosphorylation. Given the multiple ways SRC
may affect PBF, a panel of inhibitors that are currently in use in trials/clinical care was tested
to determine whether any of these (which all target a kinase linked to SRC) could reduce PBF
phosphorylation. The most successful of these was SU11274, a potent and selective inhibitor
of MET (Wang et al. 2003). MET is the receptor for hepatocyte growth factor (HGF),
activation of which leads to increased cellular proliferation, survival, motility and invasion.
Inhibition of MET using small molecule inhibitors has been shown to reduce SRC
phosphorylation and kinase activity in breast cancer cells (Mueller et al. 2008), and this
corresponds well with the observed result. Having identified SU11274 as the most potent

Chapter 8 Src and iodide uptake
192
inhibitor of the panel in HeLa cells, the optimum dose and treatment time was then
established. Various studies using TKIs have reported results with concentrations ranging
from 0.5 to 10 µM and treatment times from 15 minutes to 24 hours. In these experiments, no
further reduction in pY174 was identified on Western blotting with a treatment time of longer
than 30 minutes and an inhibitor concentration greater than 2 µM, and therefore these were
the conditions used.
In addition to the panel of TKIs tested, the SRC family kinase specific inhibitor PP1 was
also tested for its ability to inhibit pY174. PP1, first described in 1996 (Hanke et al. 1996) is a
potent selective inhibitor for the SRC family, and is often used when studying both SRC
individually as well as the family as a whole. As a negative control, PP3 (which has a similar
structure to PP1 but does not affect SRC kinase activity) was used. If SRC was part of a
kinase cascade that at some point resulted in PBF phosphorylation, then given the overlaps
that exist in such pathways, inhibition of SRC would not result in a complete loss of pY174.
However, if SRC was the kinase responsible for Y174 phosphorylation it would be expected
that levels of pY174 would be almost undetectable. In the first experiments, PP1 was assessed
with both endogenous and over-expressed SRC. When the two conditions were directly
compared, SRC once again led a large increase in pY174, and this could be reversed to some
extent by PP1 (although not by PP3). pY174 was not reduced to the levels observed with
endogenous SRC, which was most likely due to the excess of SRC resulting from
transfection. To compare the effect of PP1 with the other TKIs, in particular SU11274, and
also to assess its efficacy with endogenous levels of SRC, pY174 was measured in K1, TPC1
and HeLa cells. In all 3 cell lines, PP1 had an effect on pY174 expression. In TPC1 and K1
cells, PP1 inhibited pY174 the most, although in HeLas SU11274 and gefitinib appeared the
most potent. The reason for the discrepancy in the HeLa results is unclear; and may be a
Chapter 8 Src and iodide uptake
193
consequent of constitutively altered and therefore different kinase activation in this cell line.
This is a problem that is inherent to using transformed cancer cell lines, as each will have
varying mutations that affect the cell’s basic physiological processes.
To combat this factor, human primary thyrocytes were used. These cultures were taken
from macroscopically normal thyroid tissue and were therefore as close to physiologically
normal cells as possible. As in vivo, there were differences in the behaviour of the cultures
between different patients. This, at times, resulted in wide variation and therefore reduced the
significance of some results.
With normal human tissue now the subject of analysis, the panel of inhibitors was once
again tested in untransfected cells. pY174 was much easier to detect in primary cells than for
the cell lines, which resulted in the ability to assess the response of pY174 to the TKIs in a
more physiological setting, as a precursor to the model of PBF over-expression found in
thyroid cancers. In these circumstances, PP1 resulted in an almost complete abrogation of
pY174, with reduction also observed with gefitinib and SU11274. A second experiment,
treating cells with only PP1 or DMSO, confirmed this as a significant 81% reduction.
Having established that PBF phosphorylation was modulated by SRC, and that
phosphorylation could be affected by PP1, the next process was to assess the physiological
impact of both this phosphorylation and its inhibition in the context of radio-iodide uptake.
Iodide uptake is a key feature of thyroid epithelial cells, and forms an essential aspect of post-
surgical treatment of thyroid cancer. Previous work within our group had demonstrated that
PBF represses NIS and thereby reduces iodide uptake (Smith et al. 2009), and that the murine
transgenic model of thyroidal over-expression of PBF similarly demonstrates reduced iodide
uptake in vivo (Read et al. 2011). Vitally, this phenotype could be rescued by PBF
knockdown in primary cultures of murine thyrocytes (Read et al. 2011). The aim of these
Chapter 8 Src and iodide uptake
194
experiments was thus to further elucidate a mechanism for this process, and if possible to
target PBF-induced repression using a chemical inhibitor.
Firstly, it was necessary to select the most appropriate model for experimentation. Both
TPC1 and K1 cell lines had a low 125I uptake. Both cell lines are de-differentiated to a degree;
the K1 line is known to have poor NIS expression (Petrich et al. 2002) and both have low
expression of TSHR, which in turn reduces NIS expression (Meireles et al. 2007), and
therefore these cell lines would not be suitable. The uptake in the non-thyroidal HeLa cell line
was, as expected, poor and all three cell lines were therefore discounted from iodide uptake
studies.
As a result, human primary thyroid cultures were deemed to be the most appropriate
cells on which to examine iodide uptake in the context of PBF phosphorylation, despite the
high degree of variation between individual cultures. A number of validatory steps had to be
performed for each culture before it was included in iodide uptake assays. The cells had to be
shown to respond to TSH in the physiologically normal manner, indicating that the cellular
processes governing TSH response, iodide uptake and thyroid hormone synthesis were
functioning correctly. In addition to these normal functions of thyrocytes, the cells had to
demonstrate a reduction in 125I uptake with PBF transfection. The purpose of these
experiments was to attempt to reverse the reduction in iodide uptake demonstrated by tumours
with high levels of PBF. Experiments on thyroid cancers not displaying a PBF response
would still be valid, but were beyond the scope of this project.
Both PBF-HA and untagged-PBF reduced iodide uptake in human primary thyroid
cultures, further validating the work previously performed in our group (Smith et al. 2009).
Interestingly, SRC also had a negative effect on uptake, independent of PBF transfection.
However, no cumulative increase was observed when SRC and PBF were co-transfected. One

Chapter 8 Src and iodide uptake
195
explanation for this is that SRC, in isolation, increases phosphorylation of endogenous PBF
and this represses NIS to similar levels as seen when PBF is over-expressed, i.e. the total
amount of pY174 is similar in the 2 settings. When they are co-transfected, pY174 repression
of NIS is already at a maximum and therefore increasing the amount of SRC/PBF is unable to
drive the response further.
Following on from this, primary thyrocytes were therefore co-transfected with PBF or
SRC for the purpose of assessing the effect of TKIs on 125I uptake. Initially, the panel of
inhibitors was used at the dose (2 µM) and timepoint (30 minutes) shown to have significant
effect on pY174 at the protein level as determined by Western blotting. However, none of the
inhibitors, including PP1, had any effect on uptake following treatment. pY174 was
appropriately repressed as measured by Western blotting (data not shown) but this did not
translate into a measurable effect on uptake. A hypothesis to explain this finding was that the
30 minute treatment was not sufficient to allow the relocation of NIS to the cell membrane.
Indeed other studies examining iodide uptake in response to various treatments have used 24
hours as a timepoint (Kogai et al. 2006). Therefore the further experiments were carried out
with a treatment time of 24 hours.
Initially, the response of untransfected cells to PP1 for 24 hours was assessed. There was
a significant 65% increase in 125I uptake in the treated cells compared to those treated with
DMSO, indicating that this was a more suitable time-point for this assay. To measure the
ability of PP1 to reverse the PBF response, endogenous as opposed to over-expressed SRC
was used. This had the added advantage of allowing for a more realistic disease model; we
have demonstrated that PBF expression is increased in thyroid cancer (Stratford et al. 2005),
but there is no evidence that SRC is regularly over-expressed or aberrantly activated alongside
PBF in differentiated thyroid cancers. As a cell line that had previously shown high levels of

Chapter 8 Src and iodide uptake
196
iodide uptake, the rat follicular cell-derived line FRTL5 was also employed at this point. PP1
again led to a significant increase in iodide uptake but unfortunately the cells were not
amenable to transfection and there was therefore no difference in uptake between blank vector
and PBF transfected cells.
The most important model, therefore, was one consisting of multiple cultures of human
thyrocytes, transfected with either blank vector or PBF and treated for 24 hours with PP1.
Compared to the untransfected cells, there was no significant increase in uptake in the vector
only transfected cells with PP1 treatment. Most important was the finding that treating PBF-
HA transfected cells with PP1 led to a complete reversal in the repression of iodide uptake,
returning levels back to those apparent with vector only transfection.
Concluding remarks
This chapter has demonstrated that SRC over-expression leads to an increase in PBF
phosphorylation at Y174, an effect which could be reversed by the SRC family kinase
inhibitor PP1, the latter with both endogenous and over-expressed levels of SRC. This effect
was also observed in human primary thyrocytes at the protein level. These data suggested that
SRC is the likely kinase responsible for phosphorylating PBF.
Functionally, PBF and SRC both (although not cumulatively) reduced iodide uptake in
human primary thyrocytes. Treatment of thyrocytes over-expressing PBF, as found in human
thyroid cancer, with PP1 significantly increased their avidity for iodide, thus providing a
potential new adjuvant treatment modality for radioiodine-refractory thyroid cancer.

Chapter 9 Final Conclusions
197
Chapter 9 Final conclusions and future directions

Chapter 9 Final Conclusions
198
The work presented in this thesis described investigations into the binding partners of
the product of the proto-oncogene PBF, in particular in relationship to thyroid disease. This
was based on previous work detailing the important role PBF has in thyroid cancer; increased
expression is observed in cancers compared to normal tissues, and high levels of PBF are
independently associated with distant metastases, tumour multicentricity, advanced TNM
stage, loco-regional recurrence and disease-specific mortality (Stratford et al. 2005; Hsueh et
al. 2013). PBF is known to interact with a number of cellular proteins. It was first described as
interacting with PTTG (Chien and Pei 2000), a process which was essential for the
transactivation of FGF2. Subsequently PBF has been identified as a binding partner for NIS
(Smith et al. 2009) and MCT8 (Smith et al. 2012); both of these interactions result in the
internalisation of the transporter into the cell, from its usual location at the cell membrane. In
the case of NIS, this leads to a reduction in iodide uptake into the thyroid cell. The effects of
the internalisation of MCT8 are less well characterised, but it does appear to lead to an
increase in intra-thyroidal thyroid hormone levels (Smith et al. 2012), and PBF-transgenic
mice exhibit large, macro-follicular goitres (Read et al. 2011). Additional work carried out
involving the PBF-Tg mouse model demonstrated that by knocking-down PBF in mouse
primary thyroid cultures, iodide uptake could be restored to wild-type levels (Read et al.
2011).
Mapping the PBF interactome
The above research highlighted PBF as a novel and important protein in the thyroid
cancer pathway, and also as a potential therapeutic target in the treatment of thyroid cancer as
an adjunct to surgery. Although the peptide structure of the protein is known, and several
Chapter 9 Final Conclusions
199
putative functional domains have been identified, the exact mechanism by which PBF exerts
the above effects is not yet known. Tandem mass spectrometry has emerged in the past
decade as a powerful and efficient tool with which to determine the range of a protein’s
interactions within a cell (Downard 2006), and this information may facilitate the
identification of methods to alter that protein’s function (Sharma et al. 2012). The technique
has drawbacks, however, in relation to its sensitivity and the subsequently large datasets
generated. Therefore, initial experiments focussed on optimising the protocol for MS/MS,
using K1 papillary thyroid cancer cells transfected with PBF-HA as a model to reduce
contamination and non-specific binding, and then spreadsheet algorithms to determine the
most relevant proteins from the software output.
Following optimisation, PBF from K1 and TPC1 cells was immunoprecipitated, using
either over-expressed (HA-tagged / untagged), or endogenous PBF. After HPLC and MS/MS,
the results from the different runs were combined and analysed according to the parameters
set out in Chapter 3. This generated a list of proteins with which PBF may interact and was, as
expected, extensive. This list inevitably contained false positives, and by the nature of
MS/MS would also have omitted some true binding partners, but would contain a substantial
number of binding partners for consideration in future research. This list is presented in
Appendix 1.
For the purposes of this work, however, the list was further scrutinised to produce a
shortlist of 9 proteins which were thought most likely to interact with PBF, based upon on
their score across several runs as well as the number of peptides identified. The proteins
included were cortactin, HSP90, thyroglobulin, Src family kinases, LRRK1/2, FAK1, UACA,
adenomatous polyposis coli protein, and citron kinase. All of these potential binding proteins

Chapter 9 Final Conclusions
200
merit further investigation, although only three could be taken forward for further research;
these were thyroglobulin, cortactin and the Src family kinases.
Investigating the interaction between PBF and thyroglobulin
The first protein to be assessed was thyroglobulin. This large protein is the precursor to
the thyroid hormones T3 and T4; given the phenotype of the PBF transgenic mouse thyroid,
an interaction with PBF may alter the metabolic pathway of thyroid hormones within the
gland. Attempts at validation using GST pull-down assays were unsuccessful, likely due to
the large protein size and multi-step process in the cell which results in its finished form. Co-
immunoprecipitation was also technically challenging in the thyroid cell lines, complicated by
the multiple subunits identified on Western blotting. When the experiments were repeated in
primary cultures and in homogenised thyroid tissue, the MS/MS findings of an interaction
were supported. Preliminary studies then highlighted areas of potential co-localisation in
intra-cellular vesicles, although these were inconclusive. Future work exploring this
interaction and its functional consequences will need to address the problems of protein
translation and cell line phenotype; the use of primary thyroid cultures and / or tissue will be
key to studying any translational and physiological effects.
Cortactin may be responsible for PBF membrane trafficking and secretion
Cortactin was the highest scoring of the short-listed proteins and has been the focus of
increasing research with regards its role in cell invasion and metastases in cancer (Kirkbride
et al. 2011). It interacts with the actin cytoskeleton and has an important role in membrane
Chapter 9 Final Conclusions
201
trafficking, regulating both clathrin-dependent and -independent endocytosis (Weaver et al.
2001; Cao et al. 2003; Kirkbride et al. 2011). It is a commonly used marker to characterise
invadopodia - cytoplasmic projections from the cell membrane from which ECM-degrading
proteins are secreted (Clark and Weaver 2008).
As for thyroglobulin, independent experiments were first undertaken to validate the
findings of MS/MS. Unfortunately, pull-down assays again failed to demonstrate an
interaction, and therefore co-immunoprecipitation was performed. Initially, these studies were
unsuccessful, due to heavy immunoglobulin / non-specific binding on Western blotting.
However, when Myc-tagged cortactin was over-expressed, an interaction was supported.
Western blotting did not demonstrate any change in expression of PBF with increased levels
of cortactin, and in the reverse experiment cortactin levels remained constant with over-
expressed PBF-HA. To begin to determine the functional significance of the interaction
between cortactin and PBF, immunofluorescence was performed and demonstrated potential
co-localisation within intra-cellular vesicles. This would support a hypothesis that cortactin is
responsible for the membrane shuttling of PBF; whether this is an endocytic or exocytic
process could not be determined from these experiments. Immunofluorescence studies with a
more sensitive anti-HA antibody did indicate what appeared to be membrane protrusions from
cells transfected with PBF-HA; however this assay was not specific enough to determine if
these were invadopodia, or in fact if they represented a step in the secretory mechanism of
PBF. Secretion assays were therefore undertaken to investigate if cortactin played a part in
PBF export, a process previously explored by our group (Watkins 2010). Initial attempts at
this were unsuccessful, and failed to detect any evidence of secreted PBF on Western blotting.
However, this study involved endogenous as opposed to over-expressed PBF (as previous
work had done), and it is probable, therefore, that the quantity of PBF was below the

Chapter 9 Final Conclusions
202
detection limit for Western blotting. To overcome this problem, the experiment was repeated
but with ELISA as the detection technique. This proved more successful, and identified
secreted PBF in the media, but failed to demonstrate any change with either cortactin over-
expression or knock-down. This may be due to the fact that cortactin is not involved in PBF
secretion, or that it does have a role but the time frame required to demonstrate an effect was
not met in these experiments. These data do, however, further increase our understanding of
how PBF may be transported around the cell, and work is now on-going to further explore the
role of PBF in invadopodia formation, and whether cortactin expression affects PBF
secretion.
SRC phosphorylates PBF and reduces iodide uptake
The final protein to be examined was SRC. The Src-family kinases are a group of non-
receptor tyrosine kinases which share a significant homology (Aleshin and Finn 2010). LYN
and SRC were both identified by MS/MS, and closer inspection of the peptides identified
them within a homologous part of the sequence. As phosphorylation is a modification often
necessary for a protein to carry out a particular function, and as SRC had been identified by
phosphorylation prediction software as a likely kinase for PBF Y174, this was pursued.
In this case, GST pull-down assay as well as forward and reverse co-
immunoprecipitation supported an interaction between PBF and SRC, although SRC was
over-expressed in the cells due to endogenous levels being poorly detected by Western
blotting. Using fluorescence immunocytochemistry, co-localisation was observed at the cell
membrane and within intra-cellular vesicles. SRC is active at the cell membrane and it is
therefore at this site that phosphorylation of PBF would be most likely to occur. There did

Chapter 9 Final Conclusions
203
not appear to be any alteration in the sub-cellular localisation of PBF when SRC was over-
expressed compared to endogenous levels of the kinase, although further quantitative studies
would be needed to formally determine this.
Having confirmed an interaction, experiments were then undertaken to assess the effect
of SRC on PBF phosphorylation. An antibody specific to PBF phosphorylated at Y174
(pY174) was already in use within our group and validated for Western blotting. After
confirming its suitability also for immunocytochemistry, Western blot studies demonstrated a
significant increase in pY174 expression when SRC was over-expressed; supporting the
hypothesis that SRC phosphorylates PBF. In HeLa cells, the effect of a panel of TKIs on this
finding was tested, with SU11274 and gefitinib significantly reducing this phosphorylation.
SU11274 was then shown to have a dose- and time-dependent effect on PBF phosphorylation,
as demonstrated by both Western blotting and immunofluorescence. An explanation for the
reduction in pY174 observed with both gefitinib and SU11274 (and to a non-significant
degree with the other TKIs), was the cross over in signalling pathways that exists within cells
and which may be aberrantly activated in transformed cell lines. To further investigate the
specificity of SRC as the kinase responsible for phosphorylating PBF, cells were treated with
a specific SRC inhibitor, PP1, and its inactive counterpart, PP3. PP1 treatment resulted in a
significant reduction in pY174 in cells over-expressing SRC and PBF-HA, an effect
replicated in untransfected cells across all 3 cell lines used. Finally, human primary cell
cultures were assessed for a response to the TKI panel; a significant reduction in pY174 was
observed with PP1 treatment. Taken together, these data provide strong evidence that PBF is
phosphorylated by SRC, and that this process can be inhibited by treatment with a specific
SRC inhibitor.
Chapter 9 Final Conclusions
204
To measure the effect of this functionally, iodide uptake assays were then performed.
The efficacy of the various cell lines, including with transfection of NIS, was examined, and
found to be too low to allow reproducible, reliable data. Experiments were therefore carried
out on human primary thyrocytes; these also exhibited significant variation in both uptake and
response to TSH, and therefore each prep underwent viability testing prior to uptake studies.
PBF and SRC both reduced iodide uptake in primary thyrocytes, although this effect was not
cumulative for co-transfection, perhaps an indication that NIS repression is already maximal
with either of the genes over-expressed, and therefore no addition reduction can be obtained.
To determine if these findings had a clinical relevance to a potential therapeutic strategy,
primary thyrocytes were transfected as above and treated with the TKIs. The only inhibitor
that caused a significant increase in iodide uptake was PP1. In those cells that underwent
PBF-HA transfection and subsequent treatment with PP1, iodide uptake was identical to those
that were transfected with blank vector. The potential translational implications of this are
important: by inhibiting SRC in thyroid tissue over-expressing PBF, NIS repression may be
overcome and iodide uptake restored, potentially increasing the tissue sensitivity to
radioiodine.
A novel therapeutic strategy for thyroid cancer: Final remarks and future directions
This thesis has generated data that improve the current level of understanding regarding
the role of PBF in normal thyroid physiology and in thyroid cancer. The interaction with
thyroglobulin (although as yet poorly characterised), and how this may relate to the transgenic
mouse phenotype, is the focus of further study within our group. Perhaps the most exciting
aspects of this research are the potential roles of cortactin in PBF transport and secretion, and

Chapter 9 Final Conclusions
205
the ability of SRC inhibition to increase iodide uptake in thyroid tissue over-expressing PBF.
Although further studies are required, a working hypothesis can be generated against which to
test future experiments (Figure 9.1). These will seek to further define the data described
above, using in vitro techniques such as cell surface biotinylation, invadopodia assays and
PBF mutant analysis to further probe the PBF / cortactin relationship, as well as detailed
inhibitor studies to determine the efficacy of SRC inhibitors as therapeutic modalities and
potentially progressing to clinical trials. SRC inhibitors are the subject of intensive clinical
research, and recent studies have highlighted the potential for SRC inhibitors in subsets of
thyroid cancer treatment (Chan et al. 2012). This would be the final translational step and one
which has personalised medicine at its base – by studying a patient’s thyroid tumour
following surgery, if PBF is found to be over-expressed then adjuvant SRC inhibitor
treatment could be delivered with radioiodine remnant ablation, thus increasing the efficacy of
the therapy and reducing tumour recurrence and subsequent survival.

Chapter 9 Final Conclusions
206
Figure 9.1 Hypothesis regarding the secretion and phosphorylation of PBF. A – PBF interacts with cortactin and is transported to cell membrane invadopodia, where it is secreted into the ECM (Secretory pathway). Alternatively, PBF is transported to the cell membrane where it interacts with Src (Kinase pathway). B – PBF is phosphorylated by Src at Y174 and, now activated, binds NIS or MCT8 at the cell membrane. C – PBF now internalises NIS and MCT8, thereby repressing their function.

References
207
Chapter 10 References

References
208
. Aiello, A., G. Pandini, et al. (2006). "Peroxisomal proliferator-activated receptor-gamma
agonists induce partial reversion of epithelial-mesenchymal transition in anaplastic thyroid cancer cells." Endocrinology 147(9): 4463-4475.
Ain, K. B. (1998). "Anaplastic thyroid carcinoma: behavior, biology, and therapeutic approaches." Thyroid : official journal of the American Thyroid Association 8(8): 715-726.
Aleshin, A. and R. S. Finn (2010). "SRC: a century of science brought to the clinic." Neoplasia 12(8): 599-607.
Alexander, E. K. (2008). "Approach to the patient with a cytologically indeterminate thyroid nodule." The Journal of clinical endocrinology and metabolism 93(11): 4175-4182.
Alvarez, R. H., H. M. Kantarjian, et al. (2006). "The role of Src in solid and hematologic malignancies: development of new-generation Src inhibitors." Cancer 107(8): 1918-1929.
Ambesi-Impiombato, F. S. (1986). Living, fast-growing thyroid cell strain, FRTL-5. U. S. P. Office. USA, Interthyr Research Foundation, Inc.: 25.
Anbalagan, M., K. Moroz, et al. (2012). "Subcellular localization of total and activated Src kinase in African American and Caucasian breast cancer." PLoS One 7(3): e33017.
Antico-Arciuch, V. G., M. Dima, et al. (2010). "Cross-talk between PI3K and estrogen in the mouse thyroid predisposes to the development of follicular carcinomas with a higher incidence in females." Oncogene 29(42): 5678-5686.
Artym, V. V., Y. Zhang, et al. (2006). "Dynamic interactions of cortactin and membrane type 1 matrix metalloproteinase at invadopodia: defining the stages of invadopodia formation and function." Cancer research 66(6): 3034-3043.
Barrott, J. J. and T. A. Haystead (2013). "Hsp90, an unlikely ally in the war on cancer." The FEBS journal 280(6): 1381-1396.
Beimfohr, C., S. Klugbauer, et al. (1999). "NTRK1 re-arrangement in papillary thyroid carcinomas of children after the Chernobyl reactor accident." International journal of cancer. Journal international du cancer 80(6): 842-847.
Bhaijee, F. and Y. E. Nikiforov (2011). "Molecular analysis of thyroid tumors." Endocrine pathology 22(3): 126-133.
Bisson, N., D. A. James, et al. (2011). "Selected reaction monitoring mass spectrometry reveals the dynamics of signaling through the GRB2 adaptor." Nature biotechnology 29(7): 653-658.
Bjorge, J. D., A. Jakymiw, et al. (2000). "Selected glimpses into the activation and function of Src kinase." Oncogene 19(49): 5620-5635.
Blagosklonny, M. V., P. Giannakakou, et al. (1998). "Effects of p53-expressing adenovirus on the chemosensitivity and differentiation of anaplastic thyroid cancer cells." The Journal of clinical endocrinology and metabolism 83(7): 2516-2522.
Boelaert, K., C. J. McCabe, et al. (2003). "Pituitary tumor transforming gene and fibroblast growth factor-2 expression: potential prognostic indicators in differentiated thyroid cancer." J Clin Endocrinol Metab 88(5): 2341-2347.
Boelaert, K., V. E. Smith, et al. (2007). "PTTG and PBF repress the human sodium iodide symporter." Oncogene 26(30): 4344-4356.
Bork, P., T. Doerks, et al. (1999). "Domains in plexins: links to integrins and transcription factors." Trends in biochemical sciences 24(7): 261-263.
Bos, J. L. (1989). "ras oncogenes in human cancer: a review." Cancer research 49(17): 4682-4689.

References
209
Bounacer, A., M. Schlumberger, et al. (2000). "Search for NTRK1 proto-oncogene rearrangements in human thyroid tumours originated after therapeutic radiation." British journal of cancer 82(2): 308-314.
British Association of Endocrine and Thyroid Surgeons (2009). "Third National Audit Report."
British Thyroid Association and Royal College of Physicians (2007). Guidelines for the management of thyroid cancer (Perros P, ed). Report of the Thyroid Cancer Guidelines Update Group. London.
Bryce, N. S., E. S. Clark, et al. (2005). "Cortactin promotes cell motility by enhancing lamellipodial persistence." Current biology : CB 15(14): 1276-1285.
Brzezianska, E., M. Karbownik, et al. (2006). "Molecular analysis of the RET and NTRK1 gene rearrangements in papillary thyroid carcinoma in the Polish population." Mutation research 599(1-2): 26-35.
Buchdunger, E., J. Zimmermann, et al. (1996). "Inhibition of the Abl protein-tyrosine kinase in vitro and in vivo by a 2-phenylaminopyrimidine derivative." Cancer research 56(1): 100-104.
Buday, L. and J. Downward (2007). "Roles of cortactin in tumor pathogenesis." Biochimica et biophysica acta 1775(2): 263-273.
Burikhanov, R., T. Shrestha-Bhattarai, et al. (2013). "Novel mechanism of apoptosis resistance in cancer mediated by extracellular PAR-4." Cancer research 73(2): 1011-1019.
Cancer Research UK. (2013). "UK Cancer Incidence (2010) by Country Summary." 2013, from http://info.cancerresearchuk.org/cancerstats/types/thyroid/incidence/index.htm.
Cantara, S., M. Capezzone, et al. (2010). "Impact of proto-oncogene mutation detection in cytological specimens from thyroid nodules improves the diagnostic accuracy of cytology." The Journal of clinical endocrinology and metabolism 95(3): 1365-1369.
Cao, H., J. D. Orth, et al. (2003). "Cortactin is a component of clathrin-coated pits and participates in receptor-mediated endocytosis." Molecular and cellular biology 23(6): 2162-2170.
Carta, C., S. Moretti, et al. (2006). "Genotyping of an Italian papillary thyroid carcinoma cohort revealed high prevalence of BRAF mutations, absence of RAS mutations and allowed the detection of a new mutation of BRAF oncoprotein (BRAF(V599lns))." Clinical Endocrinology 64(1): 105-109.
Ceolin, L., D. R. Siqueira, et al. (2012). "Molecular Basis of Medullary Thyroid Carcinoma: The Role of RET Polymorphisms." International journal of molecular sciences 13(1): 221-239.
Chan, C. M., X. Jing, et al. (2012). "Targeted inhibition of Src kinase with dasatinib blocks thyroid cancer growth and metastasis." Clinical cancer research : an official journal of the American Association for Cancer Research 18(13): 3580-3591.
Chen, A. Y., A. Jemal, et al. (2009). "Increasing incidence of differentiated thyroid cancer in the United States, 1988-2005." Cancer 115(16): 3801-3807.
Chien, W. and L. Pei (2000). "A novel binding factor facilitates nuclear translocation and transcriptional activation function of the pituitary tumor-transforming gene product." J Biol Chem 275(25): 19422-19427.
Cho, K. R. and M. Shih Ie (2009). "Ovarian cancer." Annual review of pathology 4: 287-313. Cho, N. L., C. I. Lin, et al. (2012). "Global tyrosine kinome profiling of human thyroid
tumors identifies Src as a promising target for invasive cancers." Biochemical and biophysical research communications 421(3): 508-513.

References
210
Chu, E. C. and A. S. Tarnawski (2004). "PTEN regulatory functions in tumor suppression and cell biology." Medical science monitor : international medical journal of experimental and clinical research 10(10): RA235-241.
Chung, C., J. Liu, et al. (2011). "Computational Refinement of Post-translational Modifications Predicted from Tandem Mass Spectrometry." Bioinformatics.
Ciampi, R. and Y. E. Nikiforov (2007). "RET/PTC rearrangements and BRAF mutations in thyroid tumorigenesis." Endocrinology 148(3): 936-941.
Ciardiello, F. (2000). "Epidermal growth factor receptor tyrosine kinase inhibitors as anticancer agents." Drugs 60 Suppl 1: 25-32; discussion 41-22.
Civiero, L. and L. Bubacco (2012). "Human leucine-rich repeat kinase 1 and 2: intersecting or unrelated functions?" Biochemical Society transactions 40(5): 1095-1101.
Clark, E. S. and A. M. Weaver (2008). "A new role for cortactin in invadopodia: regulation of protease secretion." European journal of cell biology 87(8-9): 581-590.
Clark, E. S., A. S. Whigham, et al. (2007). "Cortactin is an essential regulator of matrix metalloproteinase secretion and extracellular matrix degradation in invadopodia." Cancer research 67(9): 4227-4235.
Cocks, H. C., S. Thompson, et al. (2003). "Role and regulation of the fibroblast growth factor axis in human thyroid follicular cells." American journal of physiology. Endocrinology and metabolism 285(3): E460-469.
Cooper, D. S., G. M. Doherty, et al. (2009). "Revised American Thyroid Association management guidelines for patients with thyroid nodules and differentiated thyroid cancer." Thyroid 19(11): 1167-1214.
Davies, H., G. R. Bignell, et al. (2002). "Mutations of the BRAF gene in human cancer." Nature 417(6892): 949-954.
de Groot, J. W., T. P. Links, et al. (2006). "RET as a diagnostic and therapeutic target in sporadic and hereditary endocrine tumors." Endocr Rev 27(5): 535-560.
den Hartog, M. T., C. C. Sijmons, et al. (1995). "Importance of the content and localization of tyrosine residues for thyroxine formation within the N-terminal part of human thyroglobulin." European journal of endocrinology / European Federation of Endocrine Societies 132(5): 611-617.
Di Cosmo, C., X. H. Liao, et al. (2010). "Mice deficient in MCT8 reveal a mechanism regulating thyroid hormone secretion." The Journal of clinical investigation 120(9): 3377-3388.
Di Cunto, F., S. Imarisio, et al. (2000). "Defective neurogenesis in citron kinase knockout mice by altered cytokinesis and massive apoptosis." Neuron 28(1): 115-127.
Di Marco, E., M. Mathor, et al. (1993). "Nerve growth factor binds to normal human keratinocytes through high and low affinity receptors and stimulates their growth by a novel autocrine loop." The Journal of biological chemistry 268(30): 22838-22846.
Di Michele, M., A. Della Corte, et al. (2009). "A proteomic approach to paclitaxel chemoresistance in ovarian cancer cell lines." Biochim Biophys Acta 1794(2): 225-236.
Dobson, M. E., E. Diallo-Krou, et al. (2011). "Pioglitazone induces a proadipogenic antitumor response in mice with PAX8-PPARgamma fusion protein thyroid carcinoma." Endocrinology 152(11): 4455-4465.
Dohan, O., A. De la Vieja, et al. (2003). "The sodium/iodide Symporter (NIS): characterization, regulation, and medical significance." Endocrine reviews 24(1): 48-77.
References
211
Donghi, R., A. Longoni, et al. (1993). "Gene p53 mutations are restricted to poorly differentiated and undifferentiated carcinomas of the thyroid gland." The Journal of clinical investigation 91(4): 1753-1760.
Downard, K. M. (2006). "Ions of the interactome: the role of MS in the study of protein interactions in proteomics and structural biology." Proteomics 6(20): 5374-5384.
Duffy, B. J., Jr. and P. J. Fitzgerald (1950). "Thyroid cancer in childhood and adolescence; a report on 28 cases." Cancer 3(6): 1018-1032.
Dunn, J. T. and A. D. Dunn (1999). "The importance of thyroglobulin structure for thyroid hormone biosynthesis." Biochimie 81(5): 505-509.
Dwight, T., S. R. Thoppe, et al. (2003). "Involvement of the PAX8/peroxisome proliferator-activated receptor gamma rearrangement in follicular thyroid tumors." The Journal of clinical endocrinology and metabolism 88(9): 4440-4445.
Eggo, M. C., W. J. King, et al. (1996). "Functional human thyroid cells and their insulin-like growth factor-binding proteins: regulation by thyrotropin, cyclic 3',5' adenosine monophosphate, and growth factors." The Journal of clinical endocrinology and metabolism 81(8): 3056-3062.
Elliott, M. H., D. S. Smith, et al. (2009). "Current trends in quantitative proteomics." Journal of mass spectrometry : JMS 44(12): 1637-1660.
Fagin, J. A., K. Matsuo, et al. (1993). "High prevalence of mutations of the p53 gene in poorly differentiated human thyroid carcinomas." The Journal of clinical investigation 91(1): 179-184.
Fallah, M., E. Pukkala, et al. (2013). "Risk of thyroid cancer in first-degree relatives of patients with non-medullary thyroid cancer by histology type and age at diagnosis: a joint study from five Nordic countries." Journal of medical genetics.
Fan, Y., L. Shi, et al. (2009). "Discovery and identification of potential biomarkers of papillary thyroid carcinoma." Molecular cancer 8: 79.
Fayadat, L., P. Niccoli-Sire, et al. (1998). "Human thyroperoxidase is largely retained and rapidly degraded in the endoplasmic reticulum. Its N-glycans are required for folding and intracellular trafficking." Endocrinology 139(10): 4277-4285.
Fedele, M., D. Palmieri, et al. (2009). "Impairment of the p27kip1 function enhances thyroid carcinogenesis in TRK-T1 transgenic mice." Endocrine-related cancer 16(2): 483-490.
Fero, M. L., M. Rivkin, et al. (1996). "A syndrome of multiorgan hyperplasia with features of gigantism, tumorigenesis, and female sterility in p27(Kip1)-deficient mice." Cell 85(5): 733-744.
Ferraz, C., C. Rehfeld, et al. (2012). "Detection of PAX8/PPARG and RET/PTC rearrangements is feasible in routine air-dried fine needle aspiration smears." Thyroid : official journal of the American Thyroid Association 22(10): 1025-1030.
Franco, A. T., R. Malaguarnera, et al. (2011). "Thyrotrophin receptor signaling dependence of Braf-induced thyroid tumor initiation in mice." Proceedings of the National Academy of Sciences of the United States of America 108(4): 1615-1620.
Frasca, F., V. Vella, et al. (2013). "Thyroid Cancer Cell Resistance to Gefitinib Depends on the Constitutive Oncogenic Activation of the Erk Pathway." The Journal of clinical endocrinology and metabolism.
French, C. A., E. K. Alexander, et al. (2003). "Genetic and biological subgroups of low-stage follicular thyroid cancer." The American journal of pathology 162(4): 1053-1060.
Furukawa, K., D. Preston, et al. (2013). "Long-term trend of thyroid cancer risk among Japanese atomic-bomb survivors: 60 years after exposure." International journal of cancer. Journal international du cancer 132(5): 1222-1226.

References
212
Ganong, W. (1997). The thyroid gland. Review of medical physiology Stamford, Appleton & Lange: 296-311. Geiger, T., J. Cox, et al. (2010). "Super-SILAC mix for quantitative proteomics of human
tumor tissue." Nature methods 7(5): 383-385. Gerber, S. A., J. Rush, et al. (2003). "Absolute quantification of proteins and phosphoproteins
from cell lysates by tandem MS." Proceedings of the National Academy of Sciences of the United States of America 100(12): 6940-6945.
Giardiello, F. M., G. J. Offerhaus, et al. (1993). "Increased risk of thyroid and pancreatic carcinoma in familial adenomatous polyposis." Gut 34(10): 1394-1396.
Gorla, L., P. Mondellini, et al. (2009). "Proteomics study of medullary thyroid carcinomas expressing RET germ-line mutations: identification of new signaling elements." Molecular carcinogenesis 48(3): 220-231.
Greco, A., C. Miranda, et al. (2010). "Rearrangements of NTRK1 gene in papillary thyroid carcinoma." Molecular and cellular endocrinology 321(1): 44-49.
Gustafsson, J. O., M. K. Oehler, et al. (2010). "Citric acid antigen retrieval (CAAR) for tryptic peptide imaging directly on archived formalin-fixed paraffin-embedded tissue." J Proteome Res 9(9): 4315-4328.
Half, E., D. Bercovich, et al. (2009). "Familial adenomatous polyposis." Orphanet J Rare Dis 4: 22.
Hanke, J. H., J. P. Gardner, et al. (1996). "Discovery of a novel, potent, and Src family-selective tyrosine kinase inhibitor. Study of Lck- and FynT-dependent T cell activation." The Journal of biological chemistry 271(2): 695-701.
Hibi, Y., T. Nagaya, et al. (2004). "Is thyroid follicular cancer in Japanese caused by a specific t(2; 3)(q13; p25) translocation generating Pax8-PPAR gamma fusion mRNA?" Endocrine journal 51(3): 361-366.
Holm, L. E., H. Blomgren, et al. (1985). "Cancer risks in patients with chronic lymphocytic thyroiditis." The New England journal of medicine 312(10): 601-604.
Hou, P., M. Ji, et al. (2008). "Association of PTEN gene methylation with genetic alterations in the phosphatidylinositol 3-kinase/AKT signaling pathway in thyroid tumors." Cancer 113(9): 2440-2447.
Howlader N, N. A., Krapcho M, Neyman N, Aminou R, Altekruse SF, Kosary CL, Ruhl J, Tatalovich Z, Cho H, Mariotto A, Eisner MP, Lewis DR, Chen HS, Feuer EJ, Cronin KA (2012). SEER Cancer Statistics Review, 1975-2009 (Vintage 2009 Populations). Bethesda, MD, National Cancer Institute.
Hsueh, C., J. D. Lin, et al. (2013). "Prognostic significance of pituitary tumour-transforming gene-binding factor (PBF) expression in papillary thyroid carcinoma." Clinical Endocrinology 78(2): 303-309.
Irby, R. B., W. Mao, et al. (1999). "Activating SRC mutation in a subset of advanced human colon cancers." Nature genetics 21(2): 187-190.
Irby, R. B. and T. J. Yeatman (2000). "Role of Src expression and activation in human cancer." Oncogene 19(49): 5636-5642.
Jin, J., R. Phitayakorn, et al. (2013). "Advances in management of thyroid cancer." Current problems in surgery 50(6): 241-289.
Jinawath, N., C. Vasoontara, et al. (2010). "Oncoproteomic analysis reveals co-upregulation of RELA and STAT5 in carboplatin resistant ovarian carcinoma." PLoS One 5(6): e11198.
Kaplan, D. R., B. L. Hempstead, et al. (1991). "The trk proto-oncogene product: a signal transducing receptor for nerve growth factor." Science 252(5005): 554-558.

References
213
Kaplan, E. L., D. Mhoon, et al. (2009). "Radiation-induced thyroid cancer: the Chicago experience." Surgery 146(6): 979-985.
Kashat, L., A. K. So, et al. (2010). "Secretome-based identification and characterization of potential biomarkers in thyroid cancer." J Proteome Res 9(11): 5757-5769.
Kim, D., H. Pemberton, et al. (2005). "Pituitary tumour transforming gene (PTTG) induces genetic instability in thyroid cells." Oncogene 24(30): 4861-4866.
Kim, T. Y., W. B. Kim, et al. (2006). "The BRAF mutation is useful for prediction of clinical recurrence in low-risk patients with conventional papillary thyroid carcinoma." Clinical Endocrinology 65(3): 364-368.
Kirkbride, K. C., B. H. Sung, et al. (2011). "Cortactin: a multifunctional regulator of cellular invasiveness." Cell adhesion & migration 5(2): 187-198.
Knauf, J. A., X. Ma, et al. (2005). "Targeted expression of BRAFV600E in thyroid cells of transgenic mice results in papillary thyroid cancers that undergo dedifferentiation." Cancer research 65(10): 4238-4245.
Kogai, T., K. Taki, et al. (2006). "Enhancement of sodium/iodide symporter expression in thyroid and breast cancer." Endocr Relat Cancer 13(3): 797-826.
Korr, D., L. Toschi, et al. (2006). "LRRK1 protein kinase activity is stimulated upon binding of GTP to its Roc domain." Cellular signalling 18(6): 910-920.
Kozlov, G., A. Perreault, et al. (2004). "Insights into function of PSI domains from structure of the Met receptor PSI domain." Biochemical and biophysical research communications 321(1): 234-240.
Krol, J., I. Loedige, et al. (2010). "The widespread regulation of microRNA biogenesis, function and decay." Nature reviews. Genetics 11(9): 597-610.
Kroll, T. G., P. Sarraf, et al. (2000). "PAX8-PPARgamma1 fusion oncogene in human thyroid carcinoma [corrected]." Science 289(5483): 1357-1360.
la Cour, T., L. Kiemer, et al. (2004). "Analysis and prediction of leucine-rich nuclear export signals." Protein engineering, design & selection : PEDS 17(6): 527-536.
Lee, K. J., Y. J. Cho, et al. (2013). "How many contralateral papillary thyroid carcinomas can be missed?" World journal of surgery 37(4): 780-785.
Leeman-Neill, R. J., A. V. Brenner, et al. (2013). "RET/PTC and PAX8/PPARgamma chromosomal rearrangements in post-Chernobyl thyroid cancer and their association with iodine-131 radiation dose and other characteristics." Cancer.
Leenhardt, L., M. O. Bernier, et al. (2004). "Advances in diagnostic practices affect thyroid cancer incidence in France." European journal of endocrinology / European Federation of Endocrine Societies 150(2): 133-139.
Li, C., Y. Wang, et al. (2013). "Hepatitis B virus mRNA-mediated miR-122 inhibition upregulates PTTG1-binding protein, which promotes hepatocellular carcinoma tumor growth and cell invasion." Journal of virology 87(4): 2193-2205.
Lim, II, T. Hochman, et al. (2012). "Disparities in the initial presentation of differentiated thyroid cancer in a large public hospital and adjoining university teaching hospital." Thyroid : official journal of the American Thyroid Association 22(3): 269-274.
Liu, Y., A. Bishop, et al. (1999). "Structural basis for selective inhibition of Src family kinases by PP1." Chemistry & biology 6(9): 671-678.
Liu, Z., J. Falola, et al. (2004). "Antiproliferative effects of Src inhibition on medullary thyroid cancer." The Journal of clinical endocrinology and metabolism 89(7): 3503-3509.
Lu, Y. W. and E. K. Tan (2008). "Molecular biology changes associated with LRRK2 mutations in Parkinson's disease." Journal of neuroscience research 86(9): 1895-1901.
References
214
Madaule, P., T. Furuyashiki, et al. (2000). "Citron, a Rho target that affects contractility during cytokinesis." Microscopy research and technique 49(2): 123-126.
Malthiery, Y. and S. Lissitzky (1987). "Primary structure of human thyroglobulin deduced from the sequence of its 8448-base complementary DNA." European journal of biochemistry / FEBS 165(3): 491-498.
Manne, U., R. G. Srivastava, et al. (2005). "Recent advances in biomarkers for cancer diagnosis and treatment." Drug discovery today 10(14): 965-976.
Martucciello, G., M. Lerone, et al. (2012). "Multiple endocrine neoplasias type 2B and RET proto-oncogene." Italian journal of pediatrics 38: 9.
Mazzaferri, E. L. and S. M. Jhiang (1994). "Long-term impact of initial surgical and medical therapy on papillary and follicular thyroid cancer." Am J Med 97(5): 418-428.
McCabe, C. J., K. Boelaert, et al. (2002). "Vascular endothelial growth factor, its receptor KDR/Flk-1, and pituitary tumor transforming gene in pituitary tumors." J Clin Endocrinol Metab 87(9): 4238-4244.
McCabe, C. J., J. S. Khaira, et al. (2003). "Expression of pituitary tumour transforming gene (PTTG) and fibroblast growth factor-2 (FGF-2) in human pituitary adenomas: relationships to clinical tumour behaviour." Clinical Endocrinology 58(2): 141-150.
McGlashan, J. (2008). The thyroid gland: anatomy and physiology. Scott-Brown's Otolaryngology, Head and Neck Surgery. M. Gleeson. London, Hodder Eduction. 1: 314-326.
McLeod, D. S., A. M. Sawka, et al. (2013). "Controversies in primary treatment of low-risk papillary thyroid cancer." Lancet 381(9871): 1046-1057.
Meireles, A. M., A. Preto, et al. (2007). "Molecular and genotypic characterization of human thyroid follicular cell carcinoma-derived cell lines." Thyroid : official journal of the American Thyroid Association 17(8): 707-715.
Mihai, R., A. J. Parker, et al. (2009). "One in four patients with follicular thyroid cytology (THY3) has a thyroid carcinoma." Thyroid : official journal of the American Thyroid Association 19(1): 33-37.
Miller, E. H. and M. H. Soley (1948). "Treatment of Graves' disease with radioiodine." The American journal of medicine 4(4): 623.
Miot, F., C. Dupuy, et al. (2012). Thyroid hormone synthesis and secretion. Thyroid Disease Manager. L. E. De groot.
Mohammadi, M., S. Froum, et al. (1998). "Crystal structure of an angiogenesis inhibitor bound to the FGF receptor tyrosine kinase domain." The EMBO journal 17(20): 5896-5904.
Moretti, F., A. Farsetti, et al. (1997). "p53 re-expression inhibits proliferation and restores differentiation of human thyroid anaplastic carcinoma cells." Oncogene 14(6): 729-740.
Moulick, K., J. H. Ahn, et al. (2011). "Affinity-based proteomics reveal cancer-specific networks coordinated by Hsp90." Nature chemical biology 7(11): 818-826.
Mu, D., R. Huang, et al. (2012). "Radioiodine therapy of thyroid carcinoma following Pax-8 gene transfer." Gene therapy 19(4): 435-442.
Mueller, K. L., L. A. Hunter, et al. (2008). "Met and c-Src cooperate to compensate for loss of epidermal growth factor receptor kinase activity in breast cancer cells." Cancer research 68(9): 3314-3322.
Namba, H., M. Nakashima, et al. (2003). "Clinical implication of hot spot BRAF mutation, V599E, in papillary thyroid cancers." The Journal of clinical endocrinology and metabolism 88(9): 4393-4397.

References
215
Neu, M., D. Fischer, et al. (2005). "Recent advances in rational gene transfer vector design based on poly(ethylene imine) and its derivatives." J Gene Med 7(8): 992-1009.
Ngeow, J., J. Mester, et al. (2011). "Incidence and clinical characteristics of thyroid cancer in prospective series of individuals with Cowden and Cowden-like syndrome characterized by germline PTEN, SDH, or KLLN alterations." The Journal of clinical endocrinology and metabolism 96(12): E2063-2071.
Nikiforov, Y. E. (2002). "RET/PTC rearrangement in thyroid tumors." Endocrine pathology 13(1): 3-16.
Nikiforov, Y. E. (2004). "Genetic alterations involved in the transition from well-differentiated to poorly differentiated and anaplastic thyroid carcinomas." Endocrine pathology 15(4): 319-327.
Nikiforova, M. N., P. W. Biddinger, et al. (2002). "PAX8-PPARgamma rearrangement in thyroid tumors: RT-PCR and immunohistochemical analyses." The American journal of surgical pathology 26(8): 1016-1023.
Nikiforova, M. N., R. A. Lynch, et al. (2003). "RAS point mutations and PAX8-PPAR gamma rearrangement in thyroid tumors: evidence for distinct molecular pathways in thyroid follicular carcinoma." The Journal of clinical endocrinology and metabolism 88(5): 2318-2326.
Ohkura, T., S. Taniguchi, et al. (2004). "Detection of the novel autoantibody (anti-UACA antibody) in patients with Graves' disease." Biochem Biophys Res Commun 321(2): 432-440.
Ong, S. E., B. Blagoev, et al. (2002). "Stable isotope labeling by amino acids in cell culture, SILAC, as a simple and accurate approach to expression proteomics." Molecular & cellular proteomics : MCP 1(5): 376-386.
Paulo, J. A., L. S. Lee, et al. (2011). "Proteomic Analysis of Formalin-Fixed Paraffin-Embedded Pancreatic Tissue Using Liquid Chromatography Tandem Mass Spectrometry." Pancreas.
Pauzar, B., I. Karner, et al. (2012). "PAX8-PPARgamma oncogene in follicular thyroid tumors: RT-PCR and immunohistochemical analyses." Collegium antropologicum 36 Suppl 2: 79-82.
Pearl, L. H. and C. Prodromou (2006). "Structure and mechanism of the Hsp90 molecular chaperone machinery." Annual review of biochemistry 75: 271-294.
Petrich, T., H. J. Helmeke, et al. (2002). "Establishment of radioactive astatine and iodine uptake in cancer cell lines expressing the human sodium/iodide symporter." European journal of nuclear medicine and molecular imaging 29(7): 842-854.
Phizicky, E. M. and S. Fields (1995). "Protein-protein interactions: methods for detection and analysis." Microbiological reviews 59(1): 94-123.
Pirmohamed, M. (2010). "Acceptance of biomarker-based tests for application in clinical practice: criteria and obstacles." Clinical pharmacology and therapeutics 88(6): 862-866.
Powell, D. J., Jr., J. Russell, et al. (1998). "The RET/PTC3 oncogene: metastatic solid-type papillary carcinomas in murine thyroids." Cancer research 58(23): 5523-5528.
Pratt, M. A., M. C. Eggo, et al. (1989). "Regulation of thyroperoxidase, thyroglobulin and iodide levels in sheep thyroid cells by TSH, tumor promoters and epidermal growth factor." Biochimie 71(2): 227-235.
Preston-Martin, S., L. Bernstein, et al. (1987). "Thyroid cancer among young women related to prior thyroid disease and pregnancy history." British journal of cancer 55(2): 191-195.
References
216
Quiros, R. M., H. G. Ding, et al. (2005). "Evidence that one subset of anaplastic thyroid carcinomas are derived from papillary carcinomas due to BRAF and p53 mutations." Cancer 103(11): 2261-2268.
Rakheja, D., R. L. Boriack, et al. (2011). "Papillary thyroid carcinoma shows elevated levels of 2-hydroxyglutarate." Tumour biology : the journal of the International Society for Oncodevelopmental Biology and Medicine 32(2): 325-333.
Rao, R. S. and W. Bernd (2010). "Do N-glycoproteins have preference for specific sequons?" Bioinformation 5(5): 208-212.
Raymond, E., L. Dahan, et al. (2011). "Sunitinib malate for the treatment of pancreatic neuroendocrine tumors." The New England journal of medicine 364(6): 501-513.
RCPath (2009). Guidance on the reporting of thyroid cytology specimens. R. C. o. Pathologists.
Read, M. L., G. D. Lewy, et al. (2011). "Proto-oncogene PBF/PTTG1IP regulates thyroid cell growth and represses radioiodide treatment." Cancer research 71(19): 6153-6164.
Ren, J., X. Gao, et al. (2009). "Systematic study of protein sumoylation: Development of a site-specific predictor of SUMOsp 2.0." Proteomics 9(12): 3409-3412.
Rexer, B. N., A. J. Ham, et al. (2011). "Phosphoproteomic mass spectrometry profiling links Src family kinases to escape from HER2 tyrosine kinase inhibition." Oncogene.
Ribeiro, F. R., A. M. Meireles, et al. (2008). "Conventional and molecular cytogenetics of human non-medullary thyroid carcinoma: characterization of eight cell line models and review of the literature on clinical samples." BMC Cancer 8: 371.
Ricci, J. A. and A. E. Alfonso (2012). "Multifocal micropapillary thyroid cancer: a new indication for total thyroidectomy?" The American surgeon 78(11): 1211-1214.
Rigaut, G., A. Shevchenko, et al. (1999). "A generic protein purification method for protein complex characterization and proteome exploration." Nature biotechnology 17(10): 1030-1032.
Russell, J. P., D. J. Powell, et al. (2000). "The TRK-T1 fusion protein induces neoplastic transformation of thyroid epithelium." Oncogene 19(50): 5729-5735.
Salvatore, G., V. De Falco, et al. (2006). "BRAF is a therapeutic target in aggressive thyroid carcinoma." Clinical cancer research : an official journal of the American Association for Cancer Research 12(5): 1623-1629.
Sanchez, C., C. Lachaize, et al. (1999). "Grasping at molecular interactions and genetic networks in Drosophila melanogaster using FlyNets, an Internet database." Nucleic Acids Res 27(1): 89-94.
Santoro, M., G. Chiappetta, et al. (1996). "Development of thyroid papillary carcinomas secondary to tissue-specific expression of the RET/PTC1 oncogene in transgenic mice." Oncogene 12(8): 1821-1826.
Sapio, M. R., D. Posca, et al. (2007). "Detection of RET/PTC, TRK and BRAF mutations in preoperative diagnosis of thyroid nodules with indeterminate cytological findings." Clinical Endocrinology 66(5): 678-683.
Sattler, M., Y. B. Pride, et al. (2003). "A novel small molecule met inhibitor induces apoptosis in cells transformed by the oncogenic TPR-MET tyrosine kinase." Cancer research 63(17): 5462-5469.
Sauvonnet, N., A. Dujeancourt, et al. (2005). "Cortactin and dynamin are required for the clathrin-independent endocytosis of gammac cytokine receptor." The Journal of cell biology 168(1): 155-163.
Schaller, M. D. (2010). "Cellular functions of FAK kinases: insight into molecular mechanisms and novel functions." Journal of cell science 123(Pt 7): 1007-1013.
References
217
Scherer, W. F., J. T. Syverton, et al. (1953). "Studies on the propagation in vitro of poliomyelitis viruses. IV. Viral multiplication in a stable strain of human malignant epithelial cells (strain HeLa) derived from an epidermoid carcinoma of the cervix." The Journal of experimental medicine 97(5): 695-710.
Schuuring, E., E. Verhoeven, et al. (1993). "The product of the EMS1 gene, amplified and overexpressed in human carcinomas, is homologous to a v-src substrate and is located in cell-substratum contact sites." Molecular and cellular biology 13(5): 2891-2898.
Schweppe, R. E., A. A. Kerege, et al. (2009). "Inhibition of Src with AZD0530 reveals the Src-Focal Adhesion kinase complex as a novel therapeutic target in papillary and anaplastic thyroid cancer." The Journal of clinical endocrinology and metabolism 94(6): 2199-2203.
Shaha, A. R. (2012). "Recurrent differentiated thyroid cancer." Endocrine practice : official journal of the American College of Endocrinology and the American Association of Clinical Endocrinologists 18(4): 600-603.
Shalloway, D., P. M. Coussens, et al. (1984). "Overexpression of the c-src protein does not induce transformation of NIH 3T3 cells." Proceedings of the National Academy of Sciences of the United States of America 81(22): 7071-7075.
Sharma, N., A. Martin, et al. (2012). "Mining the proteome: the application of tandem mass spectrometry to endocrine cancer research." Endocrine-related cancer 19(4): R149-161.
Shimwell, N. J., A. Martin, et al. (2009). "Adenovirus 5 E1A is responsible for increased expression of insulin receptor substrate 4 in established adenovirus 5-transformed cell lines and interacts with IRS components activating the PI3 kinase/Akt signalling pathway." Oncogene 28(5): 686-697.
Sipos, J. A. and E. L. Mazzaferri (2010). "Thyroid cancer epidemiology and prognostic variables." Clinical oncology 22(6): 395-404.
Slack-Davis, J. K., K. H. Martin, et al. (2007). "Cellular characterization of a novel focal adhesion kinase inhibitor." The Journal of biological chemistry 282(20): 14845-14852.
Smith, V. E., M. L. Read, et al. (2012). "PTTG-binding factor (PBF) is a novel regulator of the thyroid hormone transporter MCT8." Endocrinology 153(7): 3526-3536.
Smith, V. E., M. L. Read, et al. (2009). "A novel mechanism of sodium iodide symporter repression in differentiated thyroid cancer." J Cell Sci 122(Pt 18): 3393-3402.
Sofiadis, A., A. Dinets, et al. (2010). "Proteomic study of thyroid tumors reveals frequent up-regulation of the Ca2+ -binding protein S100A6 in papillary thyroid carcinoma." Thyroid 20(10): 1067-1076.
Spiro, M. J. (1973). "Subunit heterogeneity of thyroglobulin." The Journal of biological chemistry 248(12): 4446-4460.
Srisomsap, C., P. Subhasitanont, et al. (2002). "Detection of cathepsin B up-regulation in neoplastic thyroid tissues by proteomic analysis." Proteomics 2(6): 706-712.
Stanojevic, B., R. Dzodic, et al. (2011). "Mutational and clinico-pathological analysis of papillary thyroid carcinoma in Serbia." Endocrine journal.
Steen, H. and M. Mann (2004). "The ABC's (and XYZ's) of peptide sequencing." Nat Rev Mol Cell Biol 5(9): 699-711.
Steinhagen, E., J. G. Guillem, et al. (2012). "The prevalence of thyroid cancer and benign thyroid disease in patients with familial adenomatous polyposis may be higher than previously recognized." Clinical colorectal cancer 11(4): 304-308.

References
218
Stock, M., H. Schafer, et al. (2004). "Identification of novel genes of the bone-specific transcription factor Runx2." Journal of bone and mineral research : the official journal of the American Society for Bone and Mineral Research 19(6): 959-972.
Stratford, A. L., K. Boelaert, et al. (2005). "Pituitary tumor transforming gene binding factor: a novel transforming gene in thyroid tumorigenesis." J Clin Endocrinol Metab 90(7): 4341-4349.
Stsjazhko, V. A., A. F. Tsyb, et al. (1995). "Childhood thyroid cancer since accident at Chernobyl." BMJ 310(6982): 801.
Todaro, G. J. and H. Green (1963). "Quantitative studies of the growth of mouse embryo cells in culture and their development into established lines." The Journal of cell biology 17: 299-313.
Trajkovic-Arsic, M., J. Muller, et al. (2010). "Impact of monocarboxylate transporter-8 deficiency on the hypothalamus-pituitary-thyroid axis in mice." Endocrinology 151(10): 5053-5062.
Turnell, A. S., R. J. Grand, et al. (2000). "Regulation of the 26S proteasome by adenovirus E1A." The EMBO journal 19(17): 4759-4773.
Turtoi, A., E. De Pauw, et al. (2011). "Innovative proteomics for the discovery of systemically accessible cancer biomarkers suitable for imaging and targeted therapies." The American journal of pathology 178(1): 12-18.
Verbeek, H. H., M. M. Alves, et al. (2011). "The Effects of Four Different Tyrosine Kinase Inhibitors on Medullary and Papillary Thyroid Cancer Cells." The Journal of clinical endocrinology and metabolism.
Visser, W. E., A. A. van Mullem, et al. (2011). "The thyroid hormone transporters MCT8 and MCT10 transport the affinity-label N-bromoacetyl-[(125)I]T3 but are not modified by it." Molecular and cellular endocrinology 337(1-2): 96-100.
Vlotides, G., M. Cruz-Soto, et al. (2006). "Mechanisms for growth factor-induced pituitary tumor transforming gene-1 expression in pituitary folliculostellate TtT/GF cells." Molecular endocrinology 20(12): 3321-3335.
Volante, M., I. Rapa, et al. (2009). "RAS mutations are the predominant molecular alteration in poorly differentiated thyroid carcinomas and bear prognostic impact." The Journal of clinical endocrinology and metabolism 94(12): 4735-4741.
Volkel, P., P. Le Faou, et al. (2010). "Interaction proteomics: characterization of protein complexes using tandem affinity purification-mass spectrometry." Biochem Soc Trans 38(4): 883-887.
Wang, Q., R. Chaerkady, et al. (2011). "Mutant proteins as cancer-specific biomarkers." Proceedings of the National Academy of Sciences of the United States of America 108(6): 2444-2449.
Wang, X., P. Le, et al. (2003). "Potent and selective inhibitors of the Met [hepatocyte growth factor/scatter factor (HGF/SF) receptor] tyrosine kinase block HGF/SF-induced tumor cell growth and invasion." Molecular cancer therapeutics 2(11): 1085-1092.
Ward, D. G., S. Nyangoma, et al. (2008). "Proteomic profiling of urine for the detection of colon cancer." Proteome Sci 6: 19.
Watkins, R. J. (2010). A new pathway in the induction of breast cancer. School of Clinical and Experimental Medicine. Birmingham, University of Birmingham. PhD.
Watkins, R. J., M. L. Read, et al. (2010). "Pituitary Tumor Transforming Gene Binding Factor: a New Gene in Breast Cancer." Cancer Res.
Weaver, A. M. (2008). "Cortactin in tumor invasiveness." Cancer letters 265(2): 157-166.

References
219
Weaver, A. M., A. V. Karginov, et al. (2001). "Cortactin promotes and stabilizes Arp2/3-induced actin filament network formation." Current biology : CB 11(5): 370-374.
WHO (2013). Health risk assessment from the nuclear accident after the 2011 Great East Japan earthquake and tsunami, based on a preliminary dose estimation.
Wilkin, F., V. Savonet, et al. (1996). "Identification and characterization of novel genes modulated in the thyroid of dogs treated with methimazole and propylthiouracil." The Journal of biological chemistry 271(45): 28451-28457.
Wisniewski, J. R., A. Zougman, et al. (2009). "Universal sample preparation method for proteome analysis." Nature methods 6(5): 359-362.
Wu, H. and J. T. Parsons (1993). "Cortactin, an 80/85-kilodalton pp60src substrate, is a filamentous actin-binding protein enriched in the cell cortex." The Journal of cell biology 120(6): 1417-1426.
Xing, M. (2005). "BRAF mutation in thyroid cancer." Endocrine-related cancer 12(2): 245-262.
Xing, M. (2007). "BRAF mutation in papillary thyroid cancer: pathogenic role, molecular bases, and clinical implications." Endocr Rev 28(7): 742-762.
Xing, M., R. P. Tufano, et al. (2004). "Detection of BRAF mutation on fine needle aspiration biopsy specimens: a new diagnostic tool for papillary thyroid cancer." The Journal of clinical endocrinology and metabolism 89(6): 2867-2872.
Xing, M., W. H. Westra, et al. (2005). "BRAF mutation predicts a poorer clinical prognosis for papillary thyroid cancer." The Journal of clinical endocrinology and metabolism 90(12): 6373-6379.
Yamashiro, S., G. Totsukawa, et al. (2003). "Citron kinase, a Rho-dependent kinase, induces di-phosphorylation of regulatory light chain of myosin II." Molecular biology of the cell 14(5): 1745-1756.
Yao, Z., P. Yin, et al. (2011). "Serum metabolic profiling and features of papillary thyroid carcinoma and nodular goiter." Molecular bioSystems 7(9): 2608-2614.
Yaspo, M. L., J. Aaltonen, et al. (1998). "Cloning of a novel human putative type Ia integral membrane protein mapping to 21q22.3." Genomics 49(1): 133-136.
Yeager, N., A. Klein-Szanto, et al. (2007). "Pten loss in the mouse thyroid causes goiter and follicular adenomas: insights into thyroid function and Cowden disease pathogenesis." Cancer research 67(3): 959-966.
Yip, L., M. N. Nikiforova, et al. (2009). "Optimizing surgical treatment of papillary thyroid carcinoma associated with BRAF mutation." Surgery 146(6): 1215-1223.
Yokoyama, A., R. Nomura, et al. (2011). "The C-terminal domain of the adenomatous polyposis coli (Apc) protein is involved in thyroid morphogenesis and function." Medical molecular morphology 44(4): 207-212.
Zhang, G., B. Fang, et al. (2011). "Mass spectrometry mapping of epidermal growth factor receptor phosphorylation related to oncogenic mutations and tyrosine kinase inhibitor sensitivity." Journal of proteome research 10(1): 305-319.
Zhang, L. H., B. Tian, et al. (2006). "Dominant expression of 85-kDa form of cortactin in colorectal cancer." Journal of cancer research and clinical oncology 132(2): 113-120.
Zhao, Z. S. and E. Manser (2005). "PAK and other Rho-associated kinases--effectors with surprisingly diverse mechanisms of regulation." The Biochemical journal 386(Pt 2): 201-214.

Appendix 1
220
Chapter 11 Appendix 1

Appendix 1
221
11.1 List of potential interacting partners identified by MS/MS
The following is a list of proteins identified as potential binding partners during the
MS/MS analysis in Chapter 4. All proteins with an Average Score per Peptide (ASP) less than
20 and a total number of peptides less than 4 were discarded.
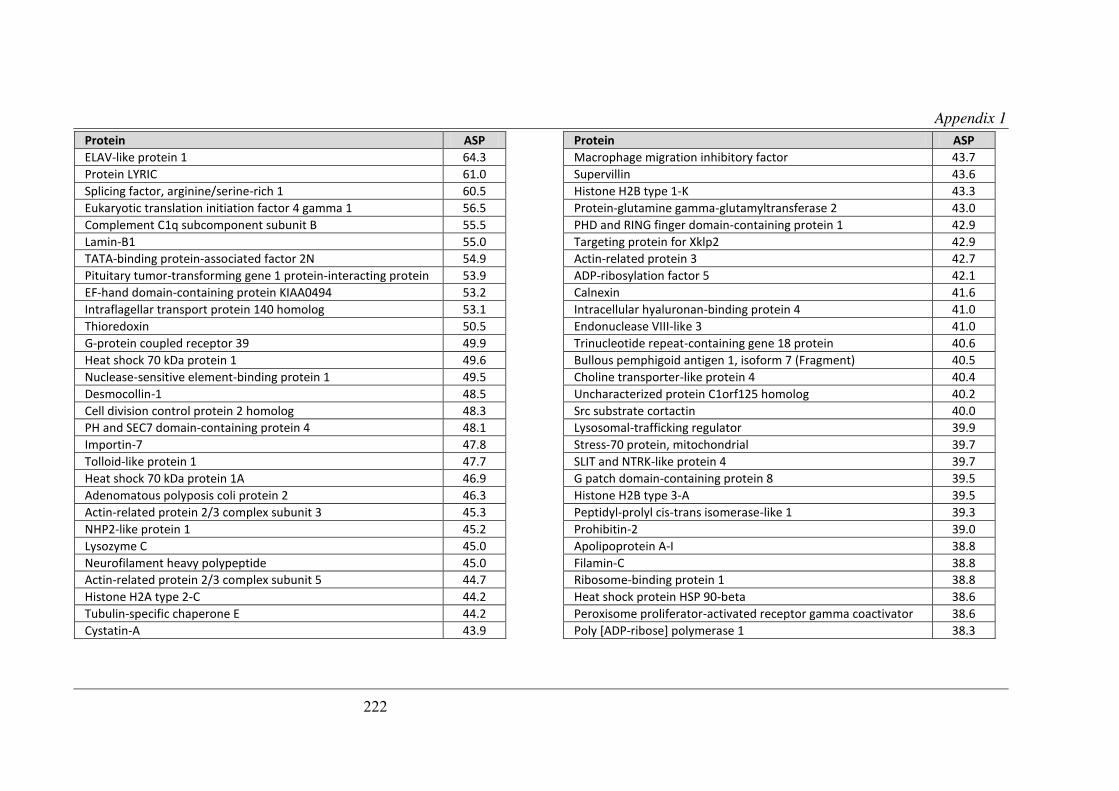
Appendix 1
222
Protein ASP
ELAV-like protein 1 64.3 Protein LYRIC 61.0 Splicing factor, arginine/serine-rich 1 60.5 Eukaryotic translation initiation factor 4 gamma 1 56.5 Complement C1q subcomponent subunit B 55.5 Lamin-B1 55.0 TATA-binding protein-associated factor 2N 54.9 Pituitary tumor-transforming gene 1 protein-interacting protein 53.9 EF-hand domain-containing protein KIAA0494 53.2 Intraflagellar transport protein 140 homolog 53.1 Thioredoxin 50.5 G-protein coupled receptor 39 49.9 Heat shock 70 kDa protein 1 49.6 Nuclease-sensitive element-binding protein 1 49.5 Desmocollin-1 48.5 Cell division control protein 2 homolog 48.3 PH and SEC7 domain-containing protein 4 48.1 Importin-7 47.8 Tolloid-like protein 1 47.7 Heat shock 70 kDa protein 1A 46.9 Adenomatous polyposis coli protein 2 46.3 Actin-related protein 2/3 complex subunit 3 45.3 NHP2-like protein 1 45.2 Lysozyme C 45.0 Neurofilament heavy polypeptide 45.0 Actin-related protein 2/3 complex subunit 5 44.7 Histone H2A type 2-C 44.2 Tubulin-specific chaperone E 44.2 Cystatin-A 43.9
Protein ASP
Macrophage migration inhibitory factor 43.7 Supervillin 43.6 Histone H2B type 1-K 43.3 Protein-glutamine gamma-glutamyltransferase 2 43.0 PHD and RING finger domain-containing protein 1 42.9 Targeting protein for Xklp2 42.9 Actin-related protein 3 42.7 ADP-ribosylation factor 5 42.1 Calnexin 41.6 Intracellular hyaluronan-binding protein 4 41.0 Endonuclease VIII-like 3 41.0 Trinucleotide repeat-containing gene 18 protein 40.6 Bullous pemphigoid antigen 1, isoform 7 (Fragment) 40.5 Choline transporter-like protein 4 40.4 Uncharacterized protein C1orf125 homolog 40.2 Src substrate cortactin 40.0 Lysosomal-trafficking regulator 39.9 Stress-70 protein, mitochondrial 39.7 SLIT and NTRK-like protein 4 39.7 G patch domain-containing protein 8 39.5 Histone H2B type 3-A 39.5 Peptidyl-prolyl cis-trans isomerase-like 1 39.3 Prohibitin-2 39.0 Apolipoprotein A-I 38.8 Filamin-C 38.8 Ribosome-binding protein 1 38.8 Heat shock protein HSP 90-beta 38.6 Peroxisome proliferator-activated receptor gamma coactivator 38.6 Poly [ADP-ribose] polymerase 1 38.3
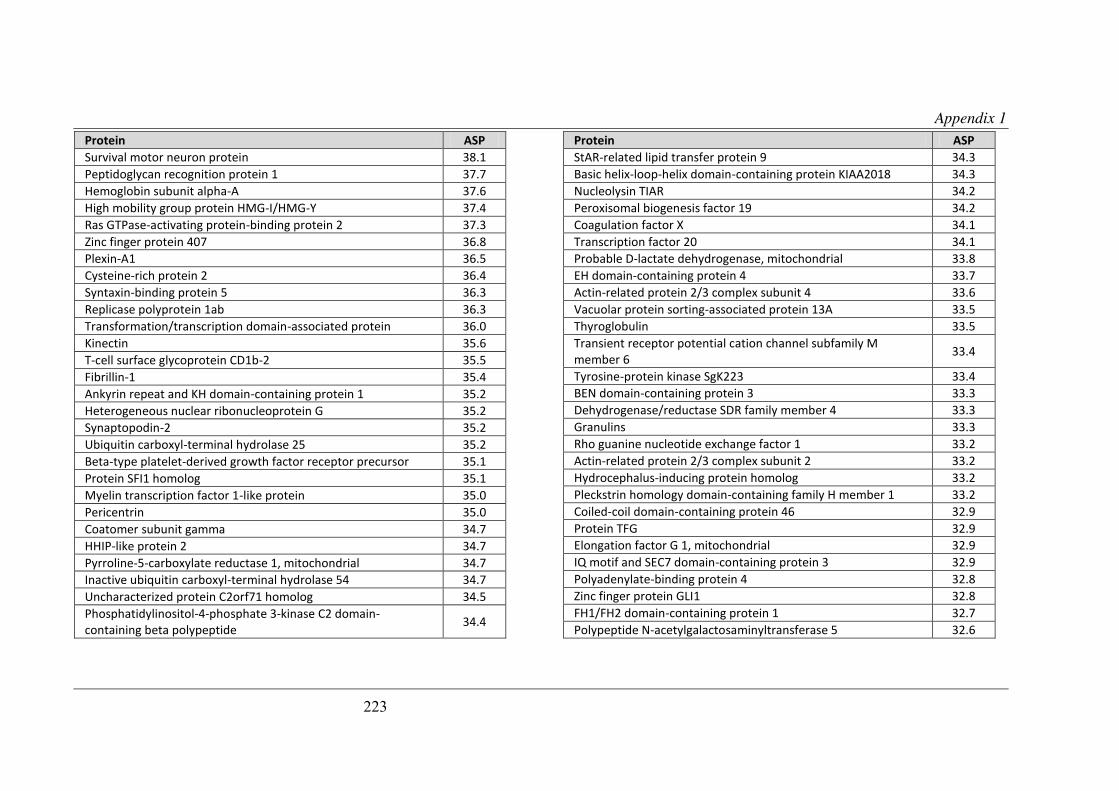
Appendix 1
223
Protein ASP
Survival motor neuron protein 38.1 Peptidoglycan recognition protein 1 37.7 Hemoglobin subunit alpha-A 37.6 High mobility group protein HMG-I/HMG-Y 37.4 Ras GTPase-activating protein-binding protein 2 37.3 Zinc finger protein 407 36.8 Plexin-A1 36.5 Cysteine-rich protein 2 36.4 Syntaxin-binding protein 5 36.3 Replicase polyprotein 1ab 36.3 Transformation/transcription domain-associated protein 36.0 Kinectin 35.6 T-cell surface glycoprotein CD1b-2 35.5 Fibrillin-1 35.4 Ankyrin repeat and KH domain-containing protein 1 35.2 Heterogeneous nuclear ribonucleoprotein G 35.2 Synaptopodin-2 35.2 Ubiquitin carboxyl-terminal hydrolase 25 35.2 Beta-type platelet-derived growth factor receptor precursor 35.1 Protein SFI1 homolog 35.1 Myelin transcription factor 1-like protein 35.0 Pericentrin 35.0 Coatomer subunit gamma 34.7 HHIP-like protein 2 34.7 Pyrroline-5-carboxylate reductase 1, mitochondrial 34.7 Inactive ubiquitin carboxyl-terminal hydrolase 54 34.7 Uncharacterized protein C2orf71 homolog 34.5 Phosphatidylinositol-4-phosphate 3-kinase C2 domain-containing beta polypeptide 34.4
Protein ASP
StAR-related lipid transfer protein 9 34.3 Basic helix-loop-helix domain-containing protein KIAA2018 34.3 Nucleolysin TIAR 34.2 Peroxisomal biogenesis factor 19 34.2 Coagulation factor X 34.1 Transcription factor 20 34.1 Probable D-lactate dehydrogenase, mitochondrial 33.8 EH domain-containing protein 4 33.7 Actin-related protein 2/3 complex subunit 4 33.6 Vacuolar protein sorting-associated protein 13A 33.5 Thyroglobulin 33.5 Transient receptor potential cation channel subfamily M member 6 33.4
Tyrosine-protein kinase SgK223 33.4 BEN domain-containing protein 3 33.3 Dehydrogenase/reductase SDR family member 4 33.3 Granulins 33.3 Rho guanine nucleotide exchange factor 1 33.2 Actin-related protein 2/3 complex subunit 2 33.2 Hydrocephalus-inducing protein homolog 33.2 Pleckstrin homology domain-containing family H member 1 33.2 Coiled-coil domain-containing protein 46 32.9 Protein TFG 32.9 Elongation factor G 1, mitochondrial 32.9 IQ motif and SEC7 domain-containing protein 3 32.9 Polyadenylate-binding protein 4 32.8 Zinc finger protein GLI1 32.8 FH1/FH2 domain-containing protein 1 32.7 Polypeptide N-acetylgalactosaminyltransferase 5 32.6

Appendix 1
224
Protein ASP
Tetratricopeptide repeat protein 30B 32.5 Fatty acid-binding protein, epidermal 32.4 Protein MICAL-2 32.4 Coiled-coil domain-containing protein 36 32.3 Transketolase-like protein 2 32.2 Glutathione S-transferase P 32.2 Cytochrome P450 20A1 32.2 Centromere protein F 32.1 FK506-binding protein 15 32.0 Multidrug resistance-associated protein 1 31.9 Proline-rich protein 11 31.9 ATP-citrate synthase 31.9 E3 ubiquitin-protein ligase HUWE1 31.9 Murinoglobulin-1 precursor 31.8 CLIP-associating protein 1 31.6 Histone H2A.V 31.6 A disintegrin and metalloproteinase with thrombospondin motifs 4 31.6
Tudor domain-containing protein 6 31.6 Schlafen family member 5 31.5 Aryl hydrocarbon receptor nuclear translocator 31.5 ADP-ribosylation factor-like protein 2-binding protein-like protein 31.4
Prolactin-inducible protein homolog 31.3 Heparin cofactor 2 31.3 ESF1 homolog 31.2 Cullin-9 31.1 Caspase-7 31.1 Latent-transforming growth factor beta-binding protein 2 31.0
Protein ASP
Antigen WC1.1 31.0 Methionine aminopeptidase 1D, mitochondrial 30.9 Hemoglobin subunit alpha-2 30.9 Integrin beta-2 30.8 TRAF-interacting protein 30.8 Zinc finger protein 766 30.8 Neurogenic differentiation factor 6 30.8 Testis-specific gene 13 protein 30.8 Multisynthetase complex auxiliary component p43 30.7 Fidgetin-like protein 1 30.7 Heterogeneous nuclear ribonucleoprotein A1 30.6 Inositol 1,4,5-trisphosphate receptor type 2 30.6 Pleckstrin homology-like domain family B member 1 30.5 Lactotransferrin precursor 30.5 Zinc finger protein 608 30.5 Histone H1.2 30.5 ATP-binding cassette sub-family A member 2 30.4 Protein KIAA0284 30.4 Transcription initiation factor TFIID subunit 3 30.3 Metastasis-associated protein MTA1 30.2 Twist-related protein 2 30.2 Interleukin-3 30.0 Thrombospondin-4 30.0 Metabotropic glutamate receptor 5 30.0 Peroxidasin homolog 30.0 Putative uncharacterized protein C12orf63 29.9 Olfactory receptor 52E2 29.9 TNFAIP3-interacting protein 3 29.8 CCAAT/enhancer-binding protein zeta 29.7
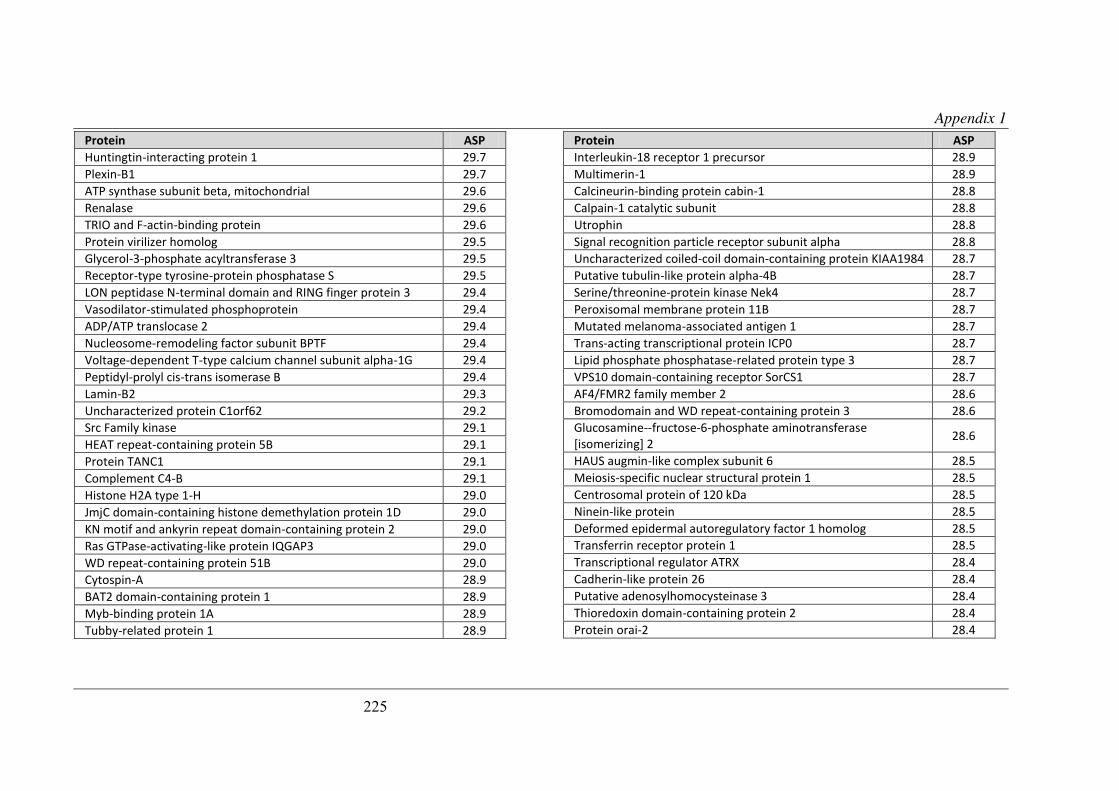
Appendix 1
225
Protein ASP
Huntingtin-interacting protein 1 29.7 Plexin-B1 29.7 ATP synthase subunit beta, mitochondrial 29.6 Renalase 29.6 TRIO and F-actin-binding protein 29.6 Protein virilizer homolog 29.5 Glycerol-3-phosphate acyltransferase 3 29.5 Receptor-type tyrosine-protein phosphatase S 29.5 LON peptidase N-terminal domain and RING finger protein 3 29.4 Vasodilator-stimulated phosphoprotein 29.4 ADP/ATP translocase 2 29.4 Nucleosome-remodeling factor subunit BPTF 29.4 Voltage-dependent T-type calcium channel subunit alpha-1G 29.4 Peptidyl-prolyl cis-trans isomerase B 29.4 Lamin-B2 29.3 Uncharacterized protein C1orf62 29.2 Src Family kinase 29.1 HEAT repeat-containing protein 5B 29.1 Protein TANC1 29.1 Complement C4-B 29.1 Histone H2A type 1-H 29.0 JmjC domain-containing histone demethylation protein 1D 29.0 KN motif and ankyrin repeat domain-containing protein 2 29.0 Ras GTPase-activating-like protein IQGAP3 29.0 WD repeat-containing protein 51B 29.0 Cytospin-A 28.9 BAT2 domain-containing protein 1 28.9 Myb-binding protein 1A 28.9 Tubby-related protein 1 28.9
Protein ASP
Interleukin-18 receptor 1 precursor 28.9 Multimerin-1 28.9 Calcineurin-binding protein cabin-1 28.8 Calpain-1 catalytic subunit 28.8 Utrophin 28.8 Signal recognition particle receptor subunit alpha 28.8 Uncharacterized coiled-coil domain-containing protein KIAA1984 28.7 Putative tubulin-like protein alpha-4B 28.7 Serine/threonine-protein kinase Nek4 28.7 Peroxisomal membrane protein 11B 28.7 Mutated melanoma-associated antigen 1 28.7 Trans-acting transcriptional protein ICP0 28.7 Lipid phosphate phosphatase-related protein type 3 28.7 VPS10 domain-containing receptor SorCS1 28.7 AF4/FMR2 family member 2 28.6 Bromodomain and WD repeat-containing protein 3 28.6 Glucosamine--fructose-6-phosphate aminotransferase [isomerizing] 2 28.6
HAUS augmin-like complex subunit 6 28.5 Meiosis-specific nuclear structural protein 1 28.5 Centrosomal protein of 120 kDa 28.5 Ninein-like protein 28.5 Deformed epidermal autoregulatory factor 1 homolog 28.5 Transferrin receptor protein 1 28.5 Transcriptional regulator ATRX 28.4 Cadherin-like protein 26 28.4 Putative adenosylhomocysteinase 3 28.4 Thioredoxin domain-containing protein 2 28.4 Protein orai-2 28.4
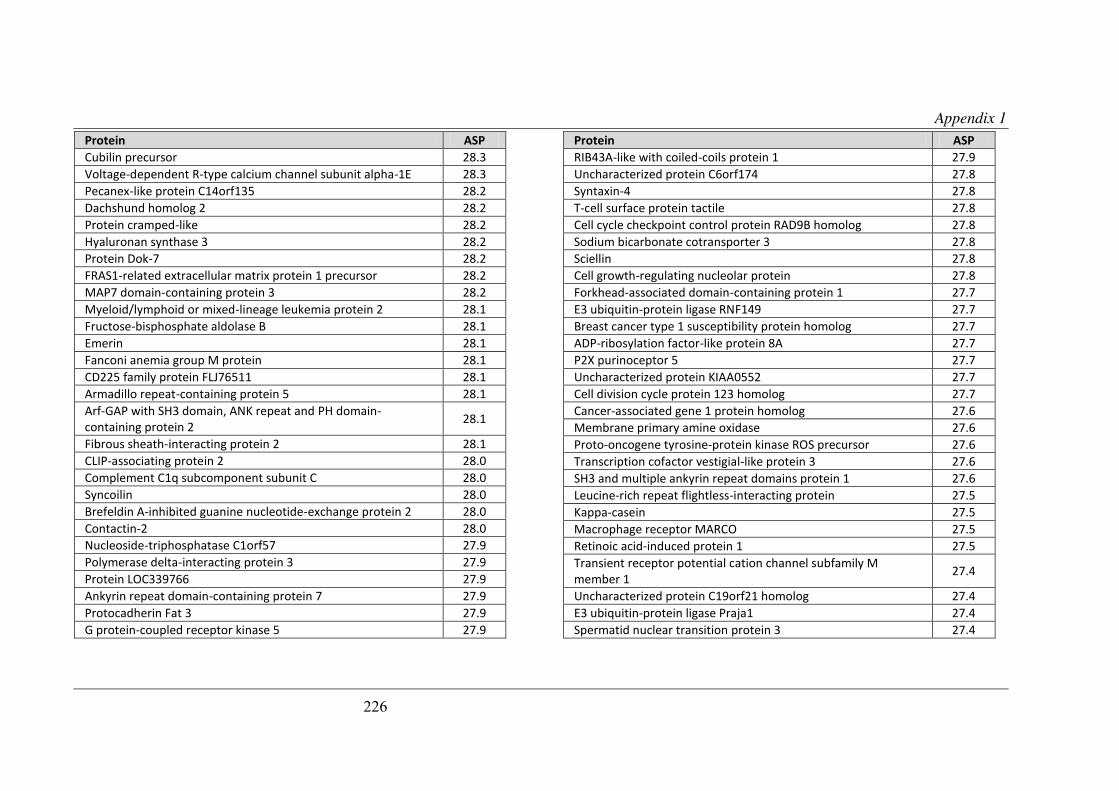
Appendix 1
226
Protein ASP
Cubilin precursor 28.3 Voltage-dependent R-type calcium channel subunit alpha-1E 28.3 Pecanex-like protein C14orf135 28.2 Dachshund homolog 2 28.2 Protein cramped-like 28.2 Hyaluronan synthase 3 28.2 Protein Dok-7 28.2 FRAS1-related extracellular matrix protein 1 precursor 28.2 MAP7 domain-containing protein 3 28.2 Myeloid/lymphoid or mixed-lineage leukemia protein 2 28.1 Fructose-bisphosphate aldolase B 28.1 Emerin 28.1 Fanconi anemia group M protein 28.1 CD225 family protein FLJ76511 28.1 Armadillo repeat-containing protein 5 28.1 Arf-GAP with SH3 domain, ANK repeat and PH domain-containing protein 2 28.1
Fibrous sheath-interacting protein 2 28.1 CLIP-associating protein 2 28.0 Complement C1q subcomponent subunit C 28.0 Syncoilin 28.0 Brefeldin A-inhibited guanine nucleotide-exchange protein 2 28.0 Contactin-2 28.0 Nucleoside-triphosphatase C1orf57 27.9 Polymerase delta-interacting protein 3 27.9 Protein LOC339766 27.9 Ankyrin repeat domain-containing protein 7 27.9 Protocadherin Fat 3 27.9 G protein-coupled receptor kinase 5 27.9
Protein ASP
RIB43A-like with coiled-coils protein 1 27.9 Uncharacterized protein C6orf174 27.8 Syntaxin-4 27.8 T-cell surface protein tactile 27.8 Cell cycle checkpoint control protein RAD9B homolog 27.8 Sodium bicarbonate cotransporter 3 27.8 Sciellin 27.8 Cell growth-regulating nucleolar protein 27.8 Forkhead-associated domain-containing protein 1 27.7 E3 ubiquitin-protein ligase RNF149 27.7 Breast cancer type 1 susceptibility protein homolog 27.7 ADP-ribosylation factor-like protein 8A 27.7 P2X purinoceptor 5 27.7 Uncharacterized protein KIAA0552 27.7 Cell division cycle protein 123 homolog 27.7 Cancer-associated gene 1 protein homolog 27.6 Membrane primary amine oxidase 27.6 Proto-oncogene tyrosine-protein kinase ROS precursor 27.6 Transcription cofactor vestigial-like protein 3 27.6 SH3 and multiple ankyrin repeat domains protein 1 27.6 Leucine-rich repeat flightless-interacting protein 27.5 Kappa-casein 27.5 Macrophage receptor MARCO 27.5 Retinoic acid-induced protein 1 27.5 Transient receptor potential cation channel subfamily M member 1 27.4
Uncharacterized protein C19orf21 homolog 27.4 E3 ubiquitin-protein ligase Praja1 27.4 Spermatid nuclear transition protein 3 27.4

Appendix 1
227
Protein ASP
SPATS2-like protein 27.3 Sodium channel protein type 11 subunit alpha 27.3 Gephyrin 27.3 Probable carboxypeptidase PM20D1 27.3 Poly [ADP-ribose] polymerase 4 27.3 Plasminogen activator inhibitor 2, macrophage 27.2 Angiopoietin-2 27.2 Plasmalemma vesicle-associated protein 27.2 Serine/threonine-protein kinase VRK2 27.2 Sodium channel protein type 10 subunit alpha 27.2 Vesicle transport through interaction with t-SNAREs homolog 1B 27.2 Probable 10-formyltetrahydrofolate dehydrogenase ALDH1L2 27.1 Protein FAM83G 27.1 Rho GTPase-activating protein 18 27.1 Sperm motility kinase 4a 27.1 Stanniocalcin-2 27.1 Phosphatidylinositol 4-kinase alpha 27.1 Toll-like receptor 5 27.1 Protein-glutamine gamma-glutamyltransferase E 27.0 Disks large homolog 4 27.0 Integrin alpha-11 27.0 Corneodesmosin 27.0 T-box transcription factor TBX22 26.9 Importin subunit alpha-6 26.9 Oxygen-regulated protein 1 26.9 Nucleoporin NUP85 26.9 Putative methyltransferase METT10D 26.8 Leiomodin-2 26.8 Uncharacterized protein C9orf102 homolog 26.8
Protein ASP
Receptor-type tyrosine-protein phosphatase delta 26.7 Katanin p60 ATPase-containing subunit A-like 1 26.7 Uncharacterized protein C1orf26 homolog 26.7 Centrosome-associated protein 350 26.7 Uncharacterized protein C6orf170 26.7 Zinc finger protein with KRAB and SCAN domains 2 26.7 Regulator of G-protein signaling 3 26.7 ATPase WRNIP1 26.7 Coiled-coil domain-containing protein 40 26.7 1-phosphatidylinositol-4,5-bisphosphate phosphodiesterase eta-2 26.7
Xylosyltransferase 1 26.6 Low-density lipoprotein receptor-related protein 2 26.6 Eosinophil peroxidase 26.6 Ubiquitin carboxyl-terminal hydrolase 29 26.6 Zinc finger protein 322A 26.6 Cholinephosphotransferase 1 26.6 Heterogeneous nuclear ribonucleoprotein A3 26.6 Angiopoietin-4 26.6 B-cell receptor CD22 26.6 EH domain-binding protein 1 26.6 Lactation elevated protein 1 26.6 Ubiquitin carboxyl-terminal hydrolase 49 26.6 Ferritin heavy chain 26.5 Phosphoglycerate mutase family member 5 26.5 FCH and double SH3 domains protein 2 26.5 Transcription factor HIVEP3 26.4 Alanine--glyoxylate aminotransferase 2-like 1 26.4 SCL-interrupting locus protein homolog 26.4

Appendix 1
228
Protein ASP
IQ and ubiquitin-like domain-containing protein 26.4 Dynamin-2 26.4 Tubulin beta-1 chain 26.4 Uncharacterized protein C3orf63 homolog 26.4 Heat shock-related 70 kDa protein 2 26.4 Bifunctional UDP-N-acetylglucosamine 2-epimerase/N-acetylmannosamine kinase 26.3
Tenascin-X 26.3 Peroxisomal acyl-coenzyme A oxidase 2 26.3 Zinc finger homeobox protein 4 26.3 Protein kinase C theta type 26.3 Histone H1t 26.3 Eukaryotic translation initiation factor 2-alpha kinase 4 26.2 Rho GTPase-activating protein 20 26.2 Protocadherin gamma-B6 26.2 Ubiquitin carboxyl-terminal hydrolase 34 26.2 B-cell receptor-associated protein 29 26.2 C4b-binding protein alpha chain 26.2 RING finger protein 31 26.2 Stonin-2 26.2 Structural maintenance of chromosomes protein 1B 26.2 Zinc finger protein 638 26.2 Prostacyclin synthase 26.2 Arginine-glutamic acid dipeptide repeats protein 26.2 Protein sidekick-2 26.2 cAMP-specific 3',5'-cyclic phosphodiesterase 4B 26.1 Dehydrogenase/reductase SDR family member on chromosome X 26.1
Peripheral-type benzodiazepine receptor-associated protein 1 26.1
Protein ASP
5'-nucleotidase domain-containing protein 3 26.1 Antigen peptide transporter 1 26.1 Proliferating cell nuclear antigen 26.0 Fibrocystin 26.0 Protein RMD5 homolog A 26.0 Desmin 26.0 Mitochondrial intermediate peptidase 26.0 Serine/threonine-protein kinase MRCK alpha 26.0 Intersectin-2 25.9 Peptidylprolyl isomerase domain and WD repeat-containing protein 1 25.9
Ankyrin repeat domain-containing protein 56 25.9 Actin filament-associated protein 1-like 1 25.9 Bestrophin-1 25.9 Coiled-coil domain-containing protein 146 25.9 Eukaryotic translation initiation factor 3 subunit E 25.9 Heterogeneous nuclear ribonucleoprotein A0 25.9 TRAF family member-associated NF-kappa-B activator 25.9 RING finger protein 113A 25.8 Probable helicase with zinc finger domain 25.8 Ankyrin-2 25.8 Multiple epidermal growth factor-like domains 8 25.7 Transmembrane protein C15orf27 25.7 Dedicator of cytokinesis protein 1 25.7 Fanconi anemia group A protein 25.7 Proto-oncogene serine/threonine-protein kinase mos 25.6 Neuron navigator 2 25.6 Pulmonary surfactant-associated protein D precursor 25.6 2',3'-cyclic-nucleotide 3'-phosphodiesterase 25.6

Appendix 1
229
Protein ASP
Phosphatase and actin regulator 4 25.6 Signal recognition particle 68 kDa protein 25.6 Rab3 GTPase-activating protein non-catalytic subunit 25.6 Cyclin-J 25.6 B-cell lymphoma 6 protein 25.5 Fatty acid-binding protein, adipocyte 25.5 Pleckstrin homology-like domain family B member 2 25.5 Alpha-enolase 25.5 Uncharacterized protein KIAA1671 25.5 Splicing factor 3B subunit 3 25.5 Pecanex-like protein 1 25.5 AT-rich interactive domain-containing protein 5A 25.4 Huntingtin 25.4 Protein QN1 homolog 25.4 ATP-binding cassette sub-family A member 3 25.4 Coiled-coil domain-containing protein 45 25.4 Ras GTPase-activating protein 3 25.4 Seminal vesicle major clotting proteins 25.4 Probable Coiled-coil domain-containing protein 8 25.4 Ubiquitin carboxyl-terminal hydrolase 4 25.4 Antigen KI-67 25.3 Protein AHNAK2 25.3 Ankyrin repeat domain-containing protein 43 25.3 Coiled-coil domain-containing protein 18 25.3 Uncharacterized protein C14orf80 homolog 25.3 Protocadherin gamma-C3 25.3 DALR anticodon-binding domain-containing protein 3 25.3 Lamina-associated polypeptide 2, isoforms alpha/zeta 25.2 Uncharacterized protein KIAA0947 25.2
Protein ASP
RUN and FYVE domain-containing protein 1 25.2 Tetratricopeptide repeat protein 3 25.2 Protein BAT2-like 25.2 Calpain-7 25.2 G2/mitotic-specific cyclin-B1 25.2 Voltage-gated potassium channel subunit beta-1 25.2 Bile acid receptor 25.1 Nuclear pore complex protein Nup205 25.1 SH3 and multiple ankyrin repeat domains protein 3 25.1 Uncharacterized protein ENSP00000382514 homolog 25.1 Probable E3 ubiquitin-protein ligase HERC1 25.1 Macrophage scavenger receptor types I and II 25.1 Proto-oncogene tyrosine-protein kinase Fes/Fps 25.1 HIRA-interacting protein 3 25.1 Nesprin-2 25.0 Transcription factor HIVEP2 25.0 Cell cycle progression protein 1 25.0 Replication initiator 1 25.0 Proto-oncogene vav 25.0 WD repeat-containing protein 64 25.0 Disintegrin and metalloproteinase domain-containing protein 28 25.0 Uncharacterized protein C15orf42 25.0 Integrator complex subunit 4 25.0 Proprotein convertase subtilisin/kexin type 7 25.0 Uncharacterized protein C14orf166B homolog 24.9 Protein argonaut 24.9 GTP-binding protein GUF1 homolog 24.9 Prominin-2 24.9 Suprabasin 24.9
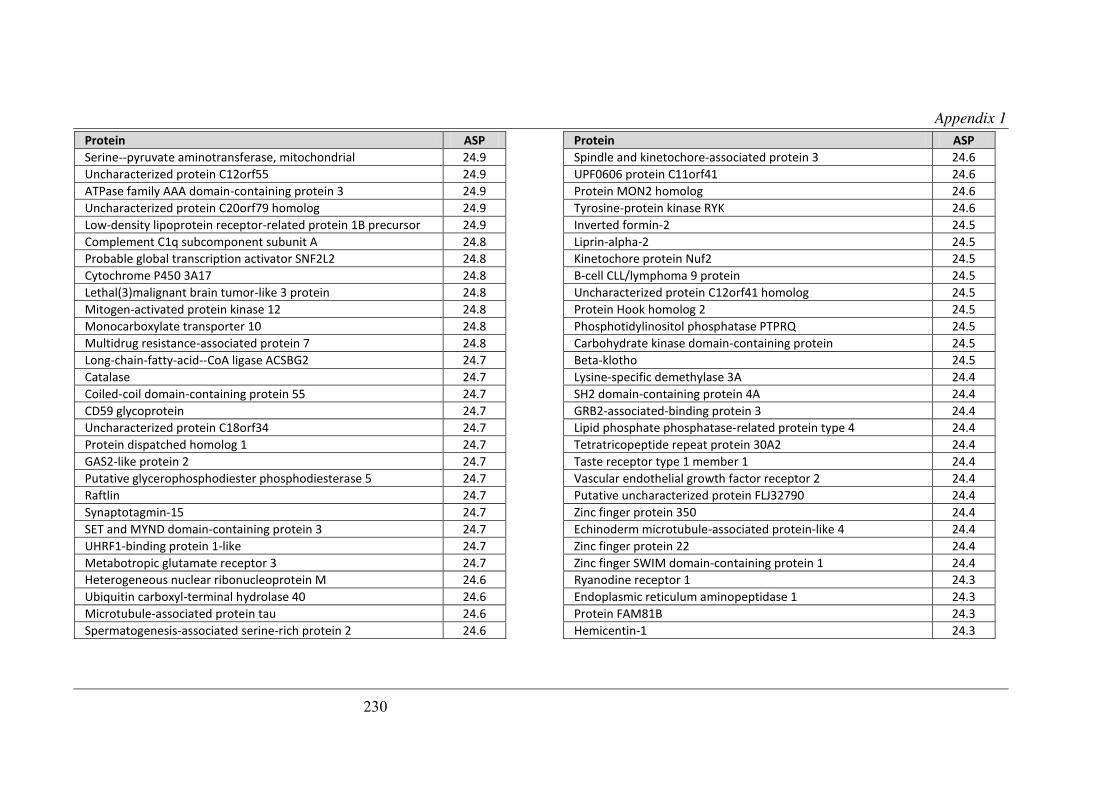
Appendix 1
230
Protein ASP
Serine--pyruvate aminotransferase, mitochondrial 24.9 Uncharacterized protein C12orf55 24.9 ATPase family AAA domain-containing protein 3 24.9 Uncharacterized protein C20orf79 homolog 24.9 Low-density lipoprotein receptor-related protein 1B precursor 24.9 Complement C1q subcomponent subunit A 24.8 Probable global transcription activator SNF2L2 24.8 Cytochrome P450 3A17 24.8 Lethal(3)malignant brain tumor-like 3 protein 24.8 Mitogen-activated protein kinase 12 24.8 Monocarboxylate transporter 10 24.8 Multidrug resistance-associated protein 7 24.8 Long-chain-fatty-acid--CoA ligase ACSBG2 24.7 Catalase 24.7 Coiled-coil domain-containing protein 55 24.7 CD59 glycoprotein 24.7 Uncharacterized protein C18orf34 24.7 Protein dispatched homolog 1 24.7 GAS2-like protein 2 24.7 Putative glycerophosphodiester phosphodiesterase 5 24.7 Raftlin 24.7 Synaptotagmin-15 24.7 SET and MYND domain-containing protein 3 24.7 UHRF1-binding protein 1-like 24.7 Metabotropic glutamate receptor 3 24.7 Heterogeneous nuclear ribonucleoprotein M 24.6 Ubiquitin carboxyl-terminal hydrolase 40 24.6 Microtubule-associated protein tau 24.6 Spermatogenesis-associated serine-rich protein 2 24.6
Protein ASP
Spindle and kinetochore-associated protein 3 24.6 UPF0606 protein C11orf41 24.6 Protein MON2 homolog 24.6 Tyrosine-protein kinase RYK 24.6 Inverted formin-2 24.5 Liprin-alpha-2 24.5 Kinetochore protein Nuf2 24.5 B-cell CLL/lymphoma 9 protein 24.5 Uncharacterized protein C12orf41 homolog 24.5 Protein Hook homolog 2 24.5 Phosphotidylinositol phosphatase PTPRQ 24.5 Carbohydrate kinase domain-containing protein 24.5 Beta-klotho 24.5 Lysine-specific demethylase 3A 24.4 SH2 domain-containing protein 4A 24.4 GRB2-associated-binding protein 3 24.4 Lipid phosphate phosphatase-related protein type 4 24.4 Tetratricopeptide repeat protein 30A2 24.4 Taste receptor type 1 member 1 24.4 Vascular endothelial growth factor receptor 2 24.4 Putative uncharacterized protein FLJ32790 24.4 Zinc finger protein 350 24.4 Echinoderm microtubule-associated protein-like 4 24.4 Zinc finger protein 22 24.4 Zinc finger SWIM domain-containing protein 1 24.4 Ryanodine receptor 1 24.3 Endoplasmic reticulum aminopeptidase 1 24.3 Protein FAM81B 24.3 Hemicentin-1 24.3

Appendix 1
231
Protein ASP
Zinc finger protein basonuclin-1 24.3 Cyclin-A1 24.3 Ran-binding protein 10 24.3 Protein asteroid homolog 1 24.3 Focal adhesion kinase 1 24.3 Caspase recruitment domain-containing protein 10 24.3 Probable serine protease HTRA3 24.3 Cytoplasmic protein NCK2 24.3 Protein C16orf88 24.2 UPF0723 protein C11orf83 homolog 24.2 Band 4.1-like protein 1 24.2 Signal transducer and activator of transcription 2 24.2 T-cell surface antigen CD2 24.2 Uncharacterized protein C14orf145 24.2 Fer-1-like protein 4 24.2 Inositol 1,4,5-trisphosphate receptor type 3 24.1 Polycystic kidney disease and receptor for egg jelly-related protein 24.1
PDZ domain-containing protein 2 24.1 Cullin-4B 24.1 Glycine cleavage system H protein, mitochondrial 24.1 Glycine receptor subunit alpha-4 24.1 Mitochondrial inner membrane protein 24.1 Potassium voltage-gated channel subfamily H member 5 24.1 Leucine-rich repeat-containing protein 7 24.1 Ligand-dependent nuclear receptor corepressor-like protein 24.1 Uncharacterized protein C12orf35 24.0 Sickle tail protein 24.0 Calpain-13 24.0
Protein ASP
Uncharacterized protein C6orf203 homolog 24.0 Septin-9 24.0 Serine palmitoyltransferase 1 24.0 Ubiquitin-conjugating enzyme E2 E2 24.0 Inner centromere protein 24.0 Sentrin-specific protease 6 24.0 Regulating synaptic membrane exocytosis protein 2 23.9 Protocadherin Fat 1 precursor 23.9 U4/U6 small nuclear ribonucleoprotein Prp3 23.9 Telomere length regulation protein TEL2 homolog 23.9 NFX1-type zinc finger-containing protein 1 23.9 Ninein 23.9 Cytokine-inducible SH2-containing protein 23.9 Tyrosine-protein phosphatase non-receptor type 20 23.9 Somatoliberin 23.9 Arf-GAP, Rho-GAP domain, ANK repeat and PH domain-containing protein 2 23.8
Rho guanine nucleotide exchange factor 10-like protein 23.8 Dihydrodipicolinate synthase-like, mitochondrial 23.8 Uncharacterized protein C15orf33 homolog 23.8 Tripartite motif-containing protein 9 23.8 Lung squamous cell carcinoma-related protein 1 23.8 A disintegrin and metalloproteinase with thrombospondin motifs 15 23.8
Protein FAM135A 23.8 Glutamate [NMDA] receptor subunit epsilon-4 23.8 RANBP2-like and GRIP domain-containing protein 4 23.8 PH and SEC7 domain-containing protein 3 23.7 Endonuclease/exonuclease/phosphatase family domain- 23.7
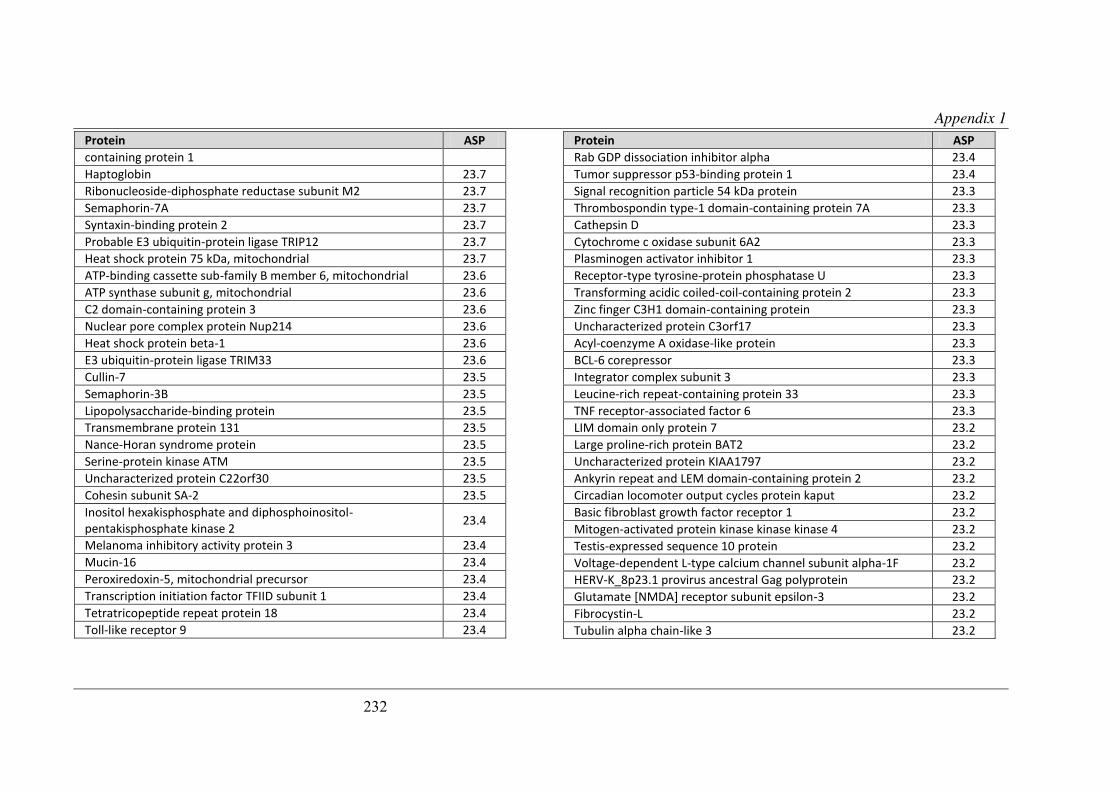
Appendix 1
232
Protein ASP
containing protein 1 Haptoglobin 23.7 Ribonucleoside-diphosphate reductase subunit M2 23.7 Semaphorin-7A 23.7 Syntaxin-binding protein 2 23.7 Probable E3 ubiquitin-protein ligase TRIP12 23.7 Heat shock protein 75 kDa, mitochondrial 23.7 ATP-binding cassette sub-family B member 6, mitochondrial 23.6 ATP synthase subunit g, mitochondrial 23.6 C2 domain-containing protein 3 23.6 Nuclear pore complex protein Nup214 23.6 Heat shock protein beta-1 23.6 E3 ubiquitin-protein ligase TRIM33 23.6 Cullin-7 23.5 Semaphorin-3B 23.5 Lipopolysaccharide-binding protein 23.5 Transmembrane protein 131 23.5 Nance-Horan syndrome protein 23.5 Serine-protein kinase ATM 23.5 Uncharacterized protein C22orf30 23.5 Cohesin subunit SA-2 23.5 Inositol hexakisphosphate and diphosphoinositol-pentakisphosphate kinase 2 23.4
Melanoma inhibitory activity protein 3 23.4 Mucin-16 23.4 Peroxiredoxin-5, mitochondrial precursor 23.4 Transcription initiation factor TFIID subunit 1 23.4 Tetratricopeptide repeat protein 18 23.4 Toll-like receptor 9 23.4
Protein ASP
Rab GDP dissociation inhibitor alpha 23.4 Tumor suppressor p53-binding protein 1 23.4 Signal recognition particle 54 kDa protein 23.3 Thrombospondin type-1 domain-containing protein 7A 23.3 Cathepsin D 23.3 Cytochrome c oxidase subunit 6A2 23.3 Plasminogen activator inhibitor 1 23.3 Receptor-type tyrosine-protein phosphatase U 23.3 Transforming acidic coiled-coil-containing protein 2 23.3 Zinc finger C3H1 domain-containing protein 23.3 Uncharacterized protein C3orf17 23.3 Acyl-coenzyme A oxidase-like protein 23.3 BCL-6 corepressor 23.3 Integrator complex subunit 3 23.3 Leucine-rich repeat-containing protein 33 23.3 TNF receptor-associated factor 6 23.3 LIM domain only protein 7 23.2 Large proline-rich protein BAT2 23.2 Uncharacterized protein KIAA1797 23.2 Ankyrin repeat and LEM domain-containing protein 2 23.2 Circadian locomoter output cycles protein kaput 23.2 Basic fibroblast growth factor receptor 1 23.2 Mitogen-activated protein kinase kinase kinase 4 23.2 Testis-expressed sequence 10 protein 23.2 Voltage-dependent L-type calcium channel subunit alpha-1F 23.2 HERV-K_8p23.1 provirus ancestral Gag polyprotein 23.2 Glutamate [NMDA] receptor subunit epsilon-3 23.2 Fibrocystin-L 23.2 Tubulin alpha chain-like 3 23.2

Appendix 1
233
Protein ASP
Transcription intermediary factor 1-beta 23.1 Alpha-protein kinase 2 23.1 Bromodomain testis-specific protein 23.1 cAMP-specific 3',5'-cyclic phosphodiesterase 4A 23.1 Interferon beta 23.1 Uncharacterized protein KIAA0467 23.1 Arachidonate 12-lipoxygenase, 12S-type 23.1 Nipped-B-like protei 23.1 Phosphoribosylformylglycinamidine synthase 23.1 Protein ALEX 23.1 Zinc finger protein 24 23.1 Tetratricopeptide repeat protein 21A 23.1 Histone H1oo 23.1 Gamma-interferon-inducible protein Ifi-16 23.1 Type I iodothyronine deiodinase 23.1 Lebercilin 23.1 ADP/ATP translocase 4 23.1 Ribosome biogenesis protein BMS1 homolog 23.1 Induced myeloid leukemia cell differentiation protein Mcl-1 homolog 23.1
Midasin 23.0 Tight junction protein ZO-2 23.0 C-myc promoter-binding protein 23.0 Trinucleotide repeat-containing gene 6B protein 23.0 Bromodomain adjacent to zinc finger domain protein 1A 23.0 Protein DERPC 23.0 Latent-transforming growth factor beta-binding protein 1 23.0 Mitogen-activated protein kinase-binding protein 1 23.0 Papilin 23.0
Protein ASP
Serine/threonine-protein kinase 36 23.0 WD repeat and FYVE domain-containing protein 3 23.0 Apolipoprotein A-IV 23.0 Histone acetyltransferase MYST4 23.0 LAS1-like protein 23.0 Proline dehydrogenase, mitochondrial 23.0 Coiled-coil domain-containing protein 60 23.0 Canalicular multispecific organic anion transporter 2 22.9 Thymidine phosphorylase 22.9 Protein CASC5 22.9 Lutropin-choriogonadotropic hormone receptor 22.9 E3 ubiquitin-protein ligase UBR4 22.9 Caspase recruitment domain-containing protein 9 22.9 Interleukin-1 receptor-associated kinase-like 2 22.9 Leukocyte cell-derived chemotaxin-2 22.9 Mucin-2 22.9 Pantothenate kinase 1 22.9 Superoxide dismutase [Cu-Zn] 22.9 LINE-1 reverse transcriptase homolog 22.9 Nucleolar protein 11 22.9 Acyl-CoA dehydrogenase family member 10 22.9 Death domain-containing protein CRADD 22.9 ERV-FRD provirus ancestral Env polyprotein 22.9 Platelet receptor Gi24 22.9 Ras-interacting protein 1 22.9 Leucine-rich repeat protein SHOC-2 22.9 Tetratricopeptide repeat protein 23-like 22.9 Small subunit processome component 20 homolog 22.9 Interferon gamma 22.9

Appendix 1
234
Protein ASP
Thioredoxin reductase 3 22.8 Galectin-1 22.8 Uncharacterized protein C1orf103 22.8 Transmembrane protein 175 22.8 Protein CREG2 22.8 Lactase-phlorizin hydrolase 22.8 Msx2-interacting protein 22.8 SNF-related serine/threonine-protein kinase 22.8 Zinc finger MYM-type protein 3 22.8 Transcription factor GATA-5 22.8 Myopalladin 22.8 Rho guanine nucleotide exchange factor 15 22.7 Myocardin 22.7 A disintegrin and metalloproteinase with thrombospondin motifs 13 22.7
Ankycorbin 22.7 Sarcoplasmic/endoplasmic reticulum calcium ATPase 3 22.7 Rho-related GTP-binding protein RhoG 22.7 Uncharacterized protein C14orf38 22.7 Low-density lipoprotein receptor-related protein 5 22.7 Transmembrane protein 41B 22.7 Zinc finger protein 280D 22.7 Arachidonate 5-lipoxygenase 22.7 E3 ubiquitin-protein ligase UBR3 22.7 Uncharacterized protein C10orf95 22.7 UPF0518 protein FAM160A2 22.7 Protein FAM44A 22.7 Kin of IRRE-like protein 1 22.7 Ly6/PLAUR domain-containing protein 3 22.7
Protein ASP
PEST proteolytic signal-containing nuclear protein 22.7 Protein SMG7 22.7 Zinc finger protein 18 22.7 Bactericidal/permeability-increasing protein-like 1 22.7 Zinc finger protein DZIP1 22.6 Protein KRBA1 22.6 Otogelin 22.6 V-type proton ATPase subunit C 2 22.6 Centrosomal protein of 170 kDa 22.6 Protein SHQ1 homolog 22.6 Dystroglycan 22.6 Glucocorticoid receptor 22.6 Protein NDRG1 22.6 2',5'-phosphodiesterase 12 22.6 Polymerase delta-interacting protein 2 22.6 Ankyrin repeat domain-containing protein 34C 22.6 Autophagy-related protein 2 homolog B 22.6 Hemoglobin subunit gamma 22.6 ADP-ribosylation factor GTPase-activating protein 3 22.6 Core histone macro-H2A.1 22.6 Phosphorylase b kinase regulatory subunit beta 22.6 SCO-spondin 22.6 Dual specificity protein kinase TTK 22.6 Structural maintenance of chromosomes protein 3 22.5 Apolipoprotein O-like 22.5 Steroid 21-hydroxylase 22.5 Zinc finger protein 227 22.5 ATP-binding cassette sub-family G member 2 22.5 Cytosolic carboxypeptidase 2 22.5

Appendix 1
235
Protein ASP
DENN domain-containing protein 4C 22.5 Leucine-rich repeat serine/threonine-protein kinase 2 22.5 NADH dehydrogenase [ubiquinone] 1 beta 22.5 Uncharacterized protein FLJ44066 22.5 Centromere protein H 22.5 Calcium-activated chloride channel regulator 4 22.5 Receptor-type tyrosine-protein phosphatase eta 22.5 WSC domain-containing protein 1 22.5 Epiplakin 22.4 GAS2-like protein 1 22.4 Protein ALO17 22.4 2,4-dienoyl-CoA reductase, mitochondrial 22.4 Protein SLC7A6OS 22.4 Troponin I, cardiac muscle 22.4 Tripartite motif-containing protein 72 22.4 GDP-L-fucose synthetase 22.4 Eukaryotic translation initiation factor 3 subunit K 22.4 Sphingosine-1-phosphate lyase 1 22.4 E3 ubiquitin-protein ligase LRSAM1 22.4 Netrin-3 22.4 Splicing factor, arginine/serine-rich 7 22.4 Zinc finger protein 106 22.4 Sucrase-isomaltase, intestinal 22.4 Arf-GAP with SH3 domain, ANK repeat and PH domain-containing protein 1 22.4
Leucine-rich repeat-containing protein 17 22.4 Suppressor of G2 allele of SKP1 homolog 22.4 Tribbles homolog 3 22.4 Alpha-1-antiproteinase 22.4
Protein ASP
Alstrom syndrome protein 1 22.3 Bromodomain adjacent to zinc finger domain protein 2A 22.3 Disintegrin and metalloproteinase domain-containing protein 5 22.3 Growth hormone receptor 22.3 Protein phosphatase inhibitor 2 22.3 Protein Shroom4 22.3 Alcohol dehydrogenase class-3 22.3 Fer-1-like protein 6 22.3 M-phase phosphoprotein 9 22.3 Pentatricopeptide repeat-containing protein 2 22.3 Solute carrier family 26 member 9 22.3 Tudor domain-containing protein 5 22.3 Glutathione S-transferase Yb-3 22.3 Nitric oxide synthase, endothelial 22.3 Beta-actin-like protein 3 22.2 Synaptonemal complex protein 1 22.2 Toll-like receptor 1 22.2 Protein FAM118B 22.2 Potassium voltage-gated channel subfamily B member 1 22.2 Zinc finger CCCH domain-containing protein 3 22.2 Synembryn-A 22.2 Tenascin-N 22.2 Contactin-6 22.2 Deoxyribonuclease gamma 22.2 Sodium/glucose cotransporter 1 22.2 Ubiquitin-conjugating enzyme E2 O 22.2 Elongation factor Ts, mitochondrial 22.2 Probable G-protein coupled receptor 156 22.2 Septin-7 22.2
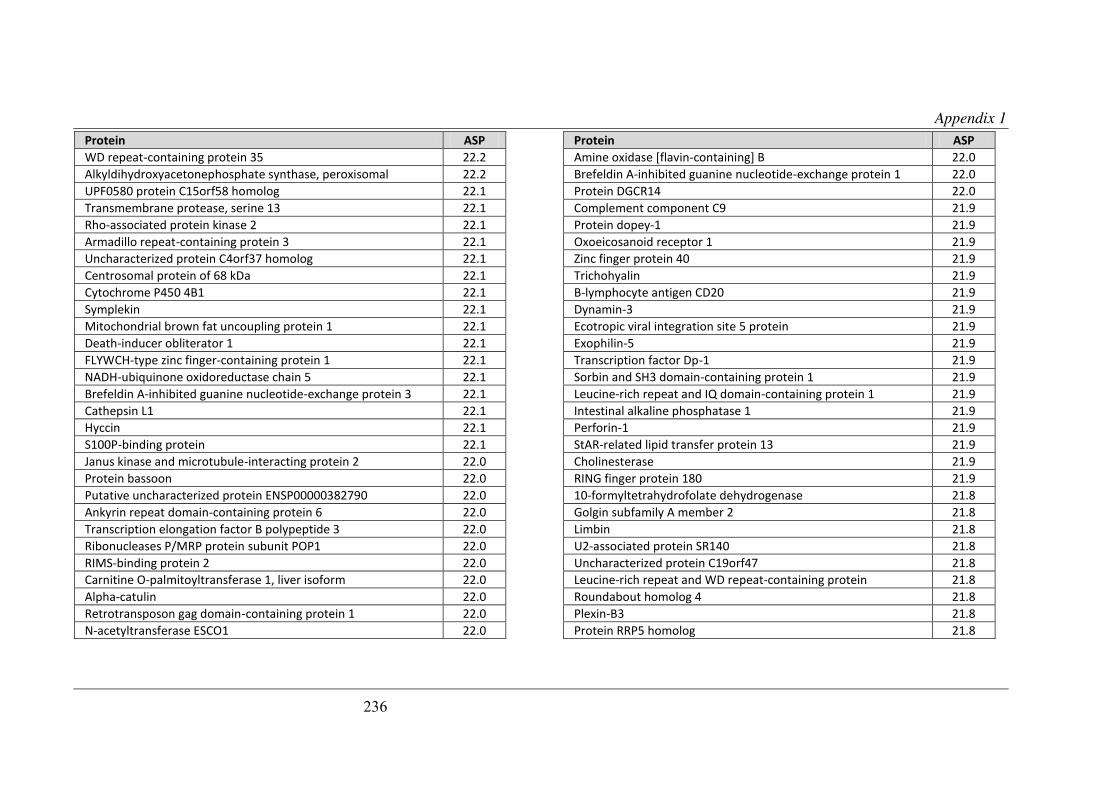
Appendix 1
236
Protein ASP
WD repeat-containing protein 35 22.2 Alkyldihydroxyacetonephosphate synthase, peroxisomal 22.2 UPF0580 protein C15orf58 homolog 22.1 Transmembrane protease, serine 13 22.1 Rho-associated protein kinase 2 22.1 Armadillo repeat-containing protein 3 22.1 Uncharacterized protein C4orf37 homolog 22.1 Centrosomal protein of 68 kDa 22.1 Cytochrome P450 4B1 22.1 Symplekin 22.1 Mitochondrial brown fat uncoupling protein 1 22.1 Death-inducer obliterator 1 22.1 FLYWCH-type zinc finger-containing protein 1 22.1 NADH-ubiquinone oxidoreductase chain 5 22.1 Brefeldin A-inhibited guanine nucleotide-exchange protein 3 22.1 Cathepsin L1 22.1 Hyccin 22.1 S100P-binding protein 22.1 Janus kinase and microtubule-interacting protein 2 22.0 Protein bassoon 22.0 Putative uncharacterized protein ENSP00000382790 22.0 Ankyrin repeat domain-containing protein 6 22.0 Transcription elongation factor B polypeptide 3 22.0 Ribonucleases P/MRP protein subunit POP1 22.0 RIMS-binding protein 2 22.0 Carnitine O-palmitoyltransferase 1, liver isoform 22.0 Alpha-catulin 22.0 Retrotransposon gag domain-containing protein 1 22.0 N-acetyltransferase ESCO1 22.0
Protein ASP
Amine oxidase [flavin-containing] B 22.0 Brefeldin A-inhibited guanine nucleotide-exchange protein 1 22.0 Protein DGCR14 22.0 Complement component C9 21.9 Protein dopey-1 21.9 Oxoeicosanoid receptor 1 21.9 Zinc finger protein 40 21.9 Trichohyalin 21.9 B-lymphocyte antigen CD20 21.9 Dynamin-3 21.9 Ecotropic viral integration site 5 protein 21.9 Exophilin-5 21.9 Transcription factor Dp-1 21.9 Sorbin and SH3 domain-containing protein 1 21.9 Leucine-rich repeat and IQ domain-containing protein 1 21.9 Intestinal alkaline phosphatase 1 21.9 Perforin-1 21.9 StAR-related lipid transfer protein 13 21.9 Cholinesterase 21.9 RING finger protein 180 21.9 10-formyltetrahydrofolate dehydrogenase 21.8 Golgin subfamily A member 2 21.8 Limbin 21.8 U2-associated protein SR140 21.8 Uncharacterized protein C19orf47 21.8 Leucine-rich repeat and WD repeat-containing protein 21.8 Roundabout homolog 4 21.8 Plexin-B3 21.8 Protein RRP5 homolog 21.8
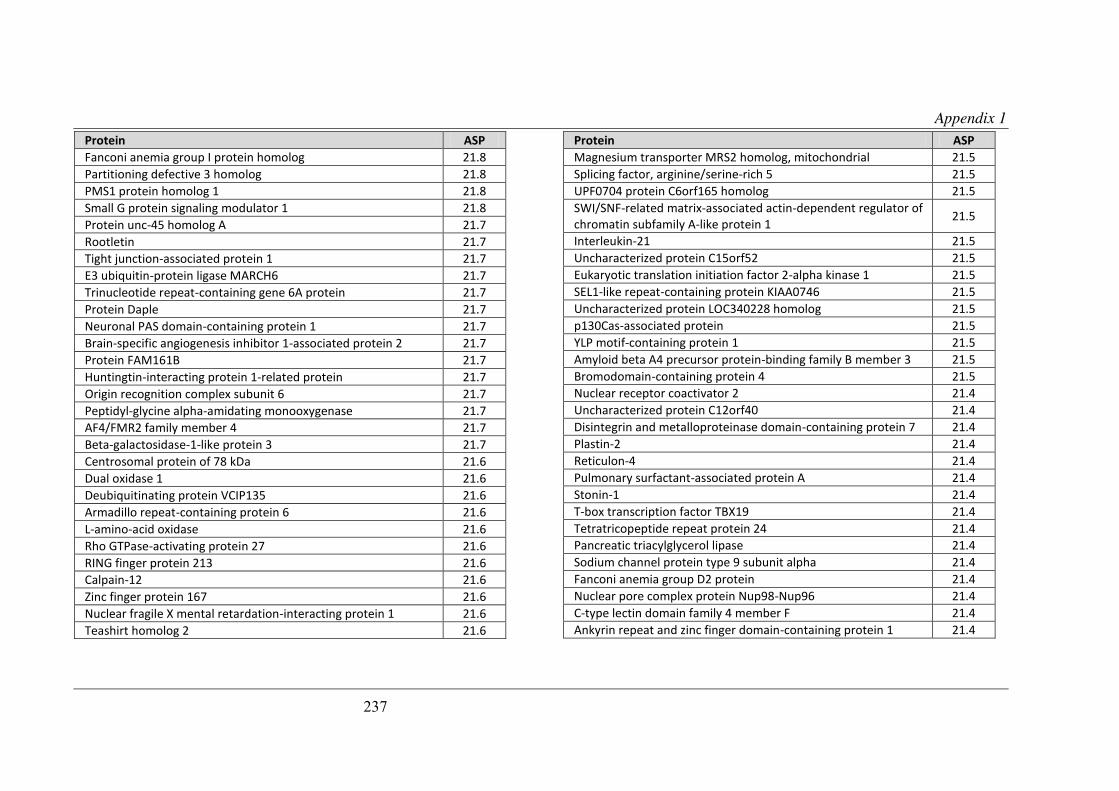
Appendix 1
237
Protein ASP
Fanconi anemia group I protein homolog 21.8 Partitioning defective 3 homolog 21.8 PMS1 protein homolog 1 21.8 Small G protein signaling modulator 1 21.8 Protein unc-45 homolog A 21.7 Rootletin 21.7 Tight junction-associated protein 1 21.7 E3 ubiquitin-protein ligase MARCH6 21.7 Trinucleotide repeat-containing gene 6A protein 21.7 Protein Daple 21.7 Neuronal PAS domain-containing protein 1 21.7 Brain-specific angiogenesis inhibitor 1-associated protein 2 21.7 Protein FAM161B 21.7 Huntingtin-interacting protein 1-related protein 21.7 Origin recognition complex subunit 6 21.7 Peptidyl-glycine alpha-amidating monooxygenase 21.7 AF4/FMR2 family member 4 21.7 Beta-galactosidase-1-like protein 3 21.7 Centrosomal protein of 78 kDa 21.6 Dual oxidase 1 21.6 Deubiquitinating protein VCIP135 21.6 Armadillo repeat-containing protein 6 21.6 L-amino-acid oxidase 21.6 Rho GTPase-activating protein 27 21.6 RING finger protein 213 21.6 Calpain-12 21.6 Zinc finger protein 167 21.6 Nuclear fragile X mental retardation-interacting protein 1 21.6 Teashirt homolog 2 21.6
Protein ASP
Magnesium transporter MRS2 homolog, mitochondrial 21.5 Splicing factor, arginine/serine-rich 5 21.5 UPF0704 protein C6orf165 homolog 21.5 SWI/SNF-related matrix-associated actin-dependent regulator of chromatin subfamily A-like protein 1 21.5
Interleukin-21 21.5 Uncharacterized protein C15orf52 21.5 Eukaryotic translation initiation factor 2-alpha kinase 1 21.5 SEL1-like repeat-containing protein KIAA0746 21.5 Uncharacterized protein LOC340228 homolog 21.5 p130Cas-associated protein 21.5 YLP motif-containing protein 1 21.5 Amyloid beta A4 precursor protein-binding family B member 3 21.5 Bromodomain-containing protein 4 21.5 Nuclear receptor coactivator 2 21.4 Uncharacterized protein C12orf40 21.4 Disintegrin and metalloproteinase domain-containing protein 7 21.4 Plastin-2 21.4 Reticulon-4 21.4 Pulmonary surfactant-associated protein A 21.4 Stonin-1 21.4 T-box transcription factor TBX19 21.4 Tetratricopeptide repeat protein 24 21.4 Pancreatic triacylglycerol lipase 21.4 Sodium channel protein type 9 subunit alpha 21.4 Fanconi anemia group D2 protein 21.4 Nuclear pore complex protein Nup98-Nup96 21.4 C-type lectin domain family 4 member F 21.4 Ankyrin repeat and zinc finger domain-containing protein 1 21.4
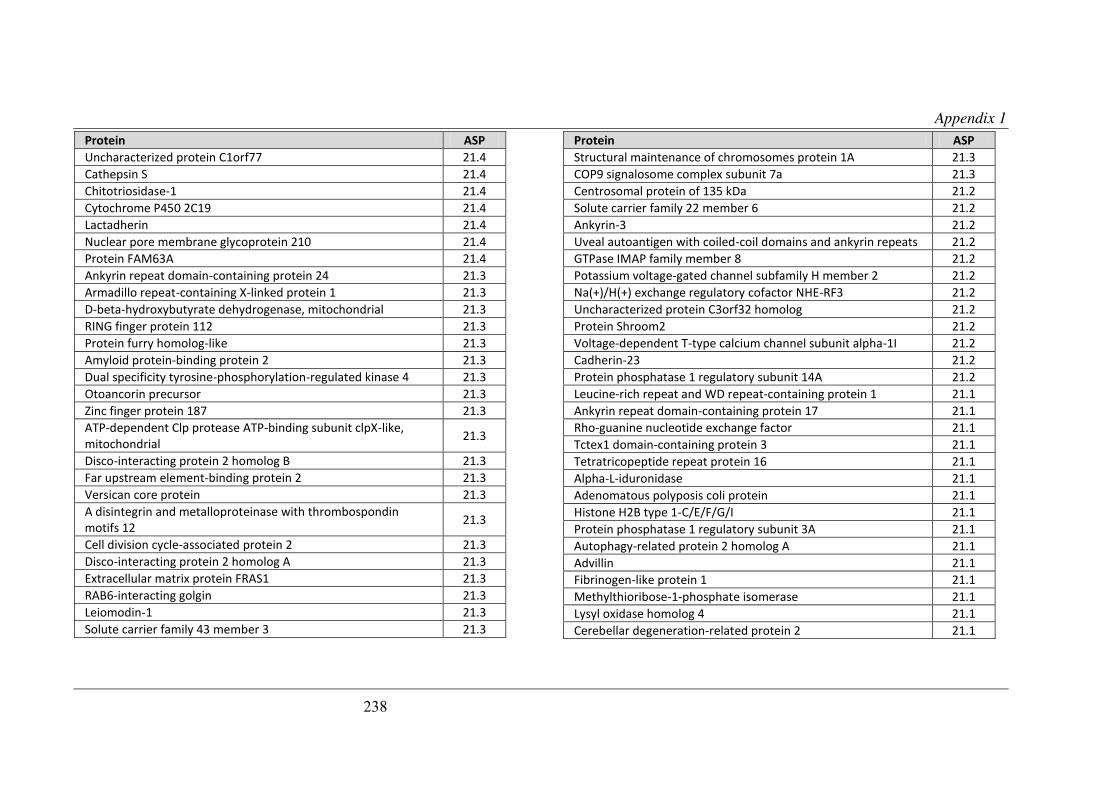
Appendix 1
238
Protein ASP
Uncharacterized protein C1orf77 21.4 Cathepsin S 21.4 Chitotriosidase-1 21.4 Cytochrome P450 2C19 21.4 Lactadherin 21.4 Nuclear pore membrane glycoprotein 210 21.4 Protein FAM63A 21.4 Ankyrin repeat domain-containing protein 24 21.3 Armadillo repeat-containing X-linked protein 1 21.3 D-beta-hydroxybutyrate dehydrogenase, mitochondrial 21.3 RING finger protein 112 21.3 Protein furry homolog-like 21.3 Amyloid protein-binding protein 2 21.3 Dual specificity tyrosine-phosphorylation-regulated kinase 4 21.3 Otoancorin precursor 21.3 Zinc finger protein 187 21.3 ATP-dependent Clp protease ATP-binding subunit clpX-like, mitochondrial 21.3
Disco-interacting protein 2 homolog B 21.3 Far upstream element-binding protein 2 21.3 Versican core protein 21.3 A disintegrin and metalloproteinase with thrombospondin motifs 12 21.3
Cell division cycle-associated protein 2 21.3 Disco-interacting protein 2 homolog A 21.3 Extracellular matrix protein FRAS1 21.3 RAB6-interacting golgin 21.3 Leiomodin-1 21.3 Solute carrier family 43 member 3 21.3
Protein ASP
Structural maintenance of chromosomes protein 1A 21.3 COP9 signalosome complex subunit 7a 21.3 Centrosomal protein of 135 kDa 21.2 Solute carrier family 22 member 6 21.2 Ankyrin-3 21.2 Uveal autoantigen with coiled-coil domains and ankyrin repeats 21.2 GTPase IMAP family member 8 21.2 Potassium voltage-gated channel subfamily H member 2 21.2 Na(+)/H(+) exchange regulatory cofactor NHE-RF3 21.2 Uncharacterized protein C3orf32 homolog 21.2 Protein Shroom2 21.2 Voltage-dependent T-type calcium channel subunit alpha-1I 21.2 Cadherin-23 21.2 Protein phosphatase 1 regulatory subunit 14A 21.2 Leucine-rich repeat and WD repeat-containing protein 1 21.1 Ankyrin repeat domain-containing protein 17 21.1 Rho-guanine nucleotide exchange factor 21.1 Tctex1 domain-containing protein 3 21.1 Tetratricopeptide repeat protein 16 21.1 Alpha-L-iduronidase 21.1 Adenomatous polyposis coli protein 21.1 Histone H2B type 1-C/E/F/G/I 21.1 Protein phosphatase 1 regulatory subunit 3A 21.1 Autophagy-related protein 2 homolog A 21.1 Advillin 21.1 Fibrinogen-like protein 1 21.1 Methylthioribose-1-phosphate isomerase 21.1 Lysyl oxidase homolog 4 21.1 Cerebellar degeneration-related protein 2 21.1

Appendix 1
239
Protein ASP
Ephrin type-A receptor 8 21.1 Serine/threonine-protein phosphatase 1 regulatory subunit 10 21.1 Tyrosine-protein kinase-protein kinase SgK269 21.1 Carboxypeptidase A5 21.1 Serine protease inhibitor Kazal-type 2 21.1 Ewing's tumor-associated antigen 1 homolog 21.0 Uncharacterized protein C6orf222 homolog 21.0 Coagulation factor VII 21.0 Calmodulin-regulated spectrin-associated protein 1-like protein 1 21.0
Centrosomal protein of 57 kDa 21.0 Tyrosine-protein phosphatase non-receptor type 2 21.0 Teneurin-1 21.0 Nicotinamide phosphoribosyltransferase 21.0 Zinc finger protein 512 21.0 Coiled-coil domain-containing protein 61 21.0 E1A-binding protein p400 21.0 Matrix-remodeling-associated protein 5 21.0 Protein SDA1 homolog 21.0 Sodium/potassium-transporting ATPase subunit alpha-2 21.0 Cytochrome c oxidase subunit 4 isoform 1 21.0 Mesoderm posterior protein 1 21.0 Mucosal pentraxin 21.0 Inhibin beta B chain 21.0 Major facilitator superfamily domain-containing protein 2 21.0 Tudor domain-containing protein 7 21.0 Calpain-3 20.9 Long palate, lung and nasal epithelium carcinoma-associated protein 3 20.9
Protein ASP
Phosphoinositide 3-kinase regulatory subunit 4 20.9 Protein phosphatase Slingshot homolog 1 20.9 Phosphatidylinositol 3,4,5-trisphosphate-dependent Rac exchanger 1 protein 20.9
Cytochrome c oxidase subunit 5A, mitochondrial 20.9 UPF0501 protein KIAA1430 homolog 20.9 Netrin-4 precursor 20.9 Vomeronasal type-1 receptor 2 20.9 Thyroid adenoma-associated protein homolog 20.9 Uncharacterized protein C12orf24 homolog 20.9 Neurobeachin-like protein 2 20.9 Rho GTPase-activating protein 23 20.9 Secernin-3 20.9 Rab3 GTPase-activating protein catalytic subunit 20.9 Glutaminase kidney isoform, mitochondrial 20.9 Proteasome subunit beta type-10 20.9 Translocation protein SEC63 homolog 20.9 Methylcrotonoyl-CoA carboxylase subunit alpha, mitochondrial 20.8 Semenogelin-2 20.8 THO complex subunit 2 20.8 Leucine-rich repeat and death domain-containing protein 20.8 Mitochondrial Rho GTPase 1 20.8 Tubulin beta-6 chain 20.8 Toll-like receptor 2 20.8 Secretory phospholipase A2 receptor 20.8 Alanine aminotransferase 1 20.8 Coiled-coil domain-containing protein 125 20.8 Hepatocyte growth factor receptor 20.8 Sterol regulatory element-binding protein 2 20.8
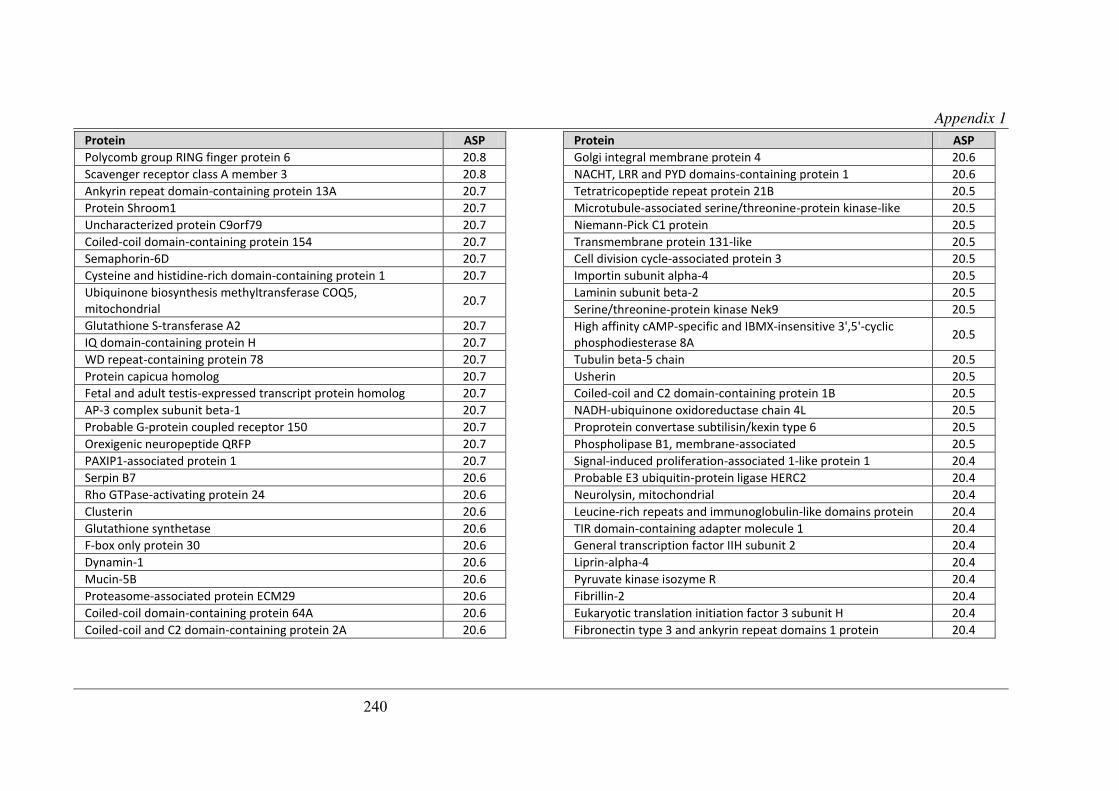
Appendix 1
240
Protein ASP
Polycomb group RING finger protein 6 20.8 Scavenger receptor class A member 3 20.8 Ankyrin repeat domain-containing protein 13A 20.7 Protein Shroom1 20.7 Uncharacterized protein C9orf79 20.7 Coiled-coil domain-containing protein 154 20.7 Semaphorin-6D 20.7 Cysteine and histidine-rich domain-containing protein 1 20.7 Ubiquinone biosynthesis methyltransferase COQ5, mitochondrial 20.7
Glutathione S-transferase A2 20.7 IQ domain-containing protein H 20.7 WD repeat-containing protein 78 20.7 Protein capicua homolog 20.7 Fetal and adult testis-expressed transcript protein homolog 20.7 AP-3 complex subunit beta-1 20.7 Probable G-protein coupled receptor 150 20.7 Orexigenic neuropeptide QRFP 20.7 PAXIP1-associated protein 1 20.7 Serpin B7 20.6 Rho GTPase-activating protein 24 20.6 Clusterin 20.6 Glutathione synthetase 20.6 F-box only protein 30 20.6 Dynamin-1 20.6 Mucin-5B 20.6 Proteasome-associated protein ECM29 20.6 Coiled-coil domain-containing protein 64A 20.6 Coiled-coil and C2 domain-containing protein 2A 20.6
Protein ASP
Golgi integral membrane protein 4 20.6 NACHT, LRR and PYD domains-containing protein 1 20.6 Tetratricopeptide repeat protein 21B 20.5 Microtubule-associated serine/threonine-protein kinase-like 20.5 Niemann-Pick C1 protein 20.5 Transmembrane protein 131-like 20.5 Cell division cycle-associated protein 3 20.5 Importin subunit alpha-4 20.5 Laminin subunit beta-2 20.5 Serine/threonine-protein kinase Nek9 20.5 High affinity cAMP-specific and IBMX-insensitive 3',5'-cyclic phosphodiesterase 8A 20.5
Tubulin beta-5 chain 20.5 Usherin 20.5 Coiled-coil and C2 domain-containing protein 1B 20.5 NADH-ubiquinone oxidoreductase chain 4L 20.5 Proprotein convertase subtilisin/kexin type 6 20.5 Phospholipase B1, membrane-associated 20.5 Signal-induced proliferation-associated 1-like protein 1 20.4 Probable E3 ubiquitin-protein ligase HERC2 20.4 Neurolysin, mitochondrial 20.4 Leucine-rich repeats and immunoglobulin-like domains protein 20.4 TIR domain-containing adapter molecule 1 20.4 General transcription factor IIH subunit 2 20.4 Liprin-alpha-4 20.4 Pyruvate kinase isozyme R 20.4 Fibrillin-2 20.4 Eukaryotic translation initiation factor 3 subunit H 20.4 Fibronectin type 3 and ankyrin repeat domains 1 protein 20.4
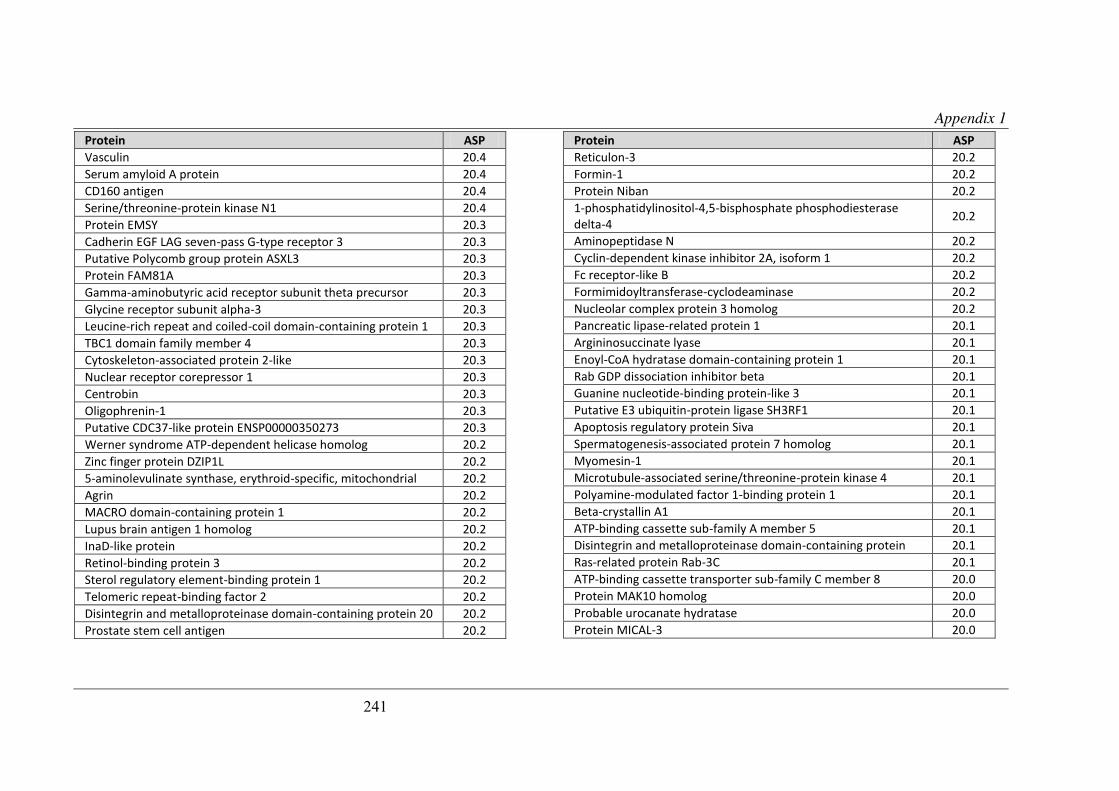
Appendix 1
241
Protein ASP
Vasculin 20.4 Serum amyloid A protein 20.4 CD160 antigen 20.4 Serine/threonine-protein kinase N1 20.4 Protein EMSY 20.3 Cadherin EGF LAG seven-pass G-type receptor 3 20.3 Putative Polycomb group protein ASXL3 20.3 Protein FAM81A 20.3 Gamma-aminobutyric acid receptor subunit theta precursor 20.3 Glycine receptor subunit alpha-3 20.3 Leucine-rich repeat and coiled-coil domain-containing protein 1 20.3 TBC1 domain family member 4 20.3 Cytoskeleton-associated protein 2-like 20.3 Nuclear receptor corepressor 1 20.3 Centrobin 20.3 Oligophrenin-1 20.3 Putative CDC37-like protein ENSP00000350273 20.3 Werner syndrome ATP-dependent helicase homolog 20.2 Zinc finger protein DZIP1L 20.2 5-aminolevulinate synthase, erythroid-specific, mitochondrial 20.2 Agrin 20.2 MACRO domain-containing protein 1 20.2 Lupus brain antigen 1 homolog 20.2 InaD-like protein 20.2 Retinol-binding protein 3 20.2 Sterol regulatory element-binding protein 1 20.2 Telomeric repeat-binding factor 2 20.2 Disintegrin and metalloproteinase domain-containing protein 20 20.2 Prostate stem cell antigen 20.2
Protein ASP
Reticulon-3 20.2 Formin-1 20.2 Protein Niban 20.2 1-phosphatidylinositol-4,5-bisphosphate phosphodiesterase delta-4 20.2
Aminopeptidase N 20.2 Cyclin-dependent kinase inhibitor 2A, isoform 1 20.2 Fc receptor-like B 20.2 Formimidoyltransferase-cyclodeaminase 20.2 Nucleolar complex protein 3 homolog 20.2 Pancreatic lipase-related protein 1 20.1 Argininosuccinate lyase 20.1 Enoyl-CoA hydratase domain-containing protein 1 20.1 Rab GDP dissociation inhibitor beta 20.1 Guanine nucleotide-binding protein-like 3 20.1 Putative E3 ubiquitin-protein ligase SH3RF1 20.1 Apoptosis regulatory protein Siva 20.1 Spermatogenesis-associated protein 7 homolog 20.1 Myomesin-1 20.1 Microtubule-associated serine/threonine-protein kinase 4 20.1 Polyamine-modulated factor 1-binding protein 1 20.1 Beta-crystallin A1 20.1 ATP-binding cassette sub-family A member 5 20.1 Disintegrin and metalloproteinase domain-containing protein 20.1 Ras-related protein Rab-3C 20.1 ATP-binding cassette transporter sub-family C member 8 20.0 Protein MAK10 homolog 20.0 Probable urocanate hydratase 20.0 Protein MICAL-3 20.0

Appendix 1
242
Protein ASP
Uncharacterized protein C10orf88 homolog 20.0 Dimethylaniline monooxygenase [N-oxide-forming] 4 20.0 Follitropin subunit beta 20.0 Solute carrier organic anion transporter family member 1B2 20.0 Paired amphipathic helix protein Sin3b 20.0 Vinculin 20.0 Eukaryotic translation initiation factor 4B 20.0 Sex-determining region Y protein 20.0 Interferon-induced very large GTPase 1 19.9 Nuclear mitotic apparatus protein 1 19.9 Coagulation factor V 19.9 Protocadherin Fat 2 19.9 Junction-mediating and -regulatory protein 19.9 Uncharacterized protein KIAA1680 19.9 Microtubule-associated protein 4 19.8 Zinc finger ZZ-type and EF-hand domain-containing protein 1 19.8 Uncharacterized protein C19orf44 homolog 19.8 Synaptonemal complex central element protein 1 19.7 Poly(ADP-ribose) glycohydrolase 19.6 Coiled-coil domain-containing protein 57 19.6 Threonine synthase-like 1 19.6 Centromere-associated protein E 19.6 E3 ubiquitin-protein ligase MARCH7 19.5 Telomere-associated protein RIF1 19.5 Stress-induced-phosphoprotein 1 19.5 Sodium/potassium-transporting ATPase subunit beta-2 19.4 Voltage-dependent L-type calcium channel subunit alpha-1C 19.4 Sulfide:quinone oxidoreductase, mitochondrial 19.4 Leukocyte receptor cluster member 1 homolog 19.3
Protein ASP
Citron Rho-interacting kinase 19.2 Afadin 19.2 Dimethylaniline monooxygenase [N-oxide-forming] 5 19.2 Nuclear autoantigenic sperm protein 19.1 Toll-like receptor 4 19.1 Cystic fibrosis transmembrane conductance regulator 19.1 EF-hand calcium-binding domain-containing protein 5 19.1 Neurogenic locus notch homolog protein 3 19.1 Fibrinogen alpha chain 19.1 Uncharacterized protein KIAA1310 homolog 19.0 Sperm flagellar protein 2 19.0 Leucine-rich repeat-containing protein 18 19.0 Methionine synthase 19.0 Uncharacterized protein C18orf19 homolog 19.0 UPF0681 protein KIAA1033 18.9 Coiled-coil domain-containing protein 54 18.9 Cytochrome b 18.8 Disco-interacting protein 2 homolog C 18.8 Disintegrin and metalloproteinase domain-containing protein 2 18.7 Amyloid beta A4 precursor protein-binding family A member 3 18.7 Nestin 18.7 Kinetochore protein NDC80 homolog 18.7 Putative COBW domain-containing protein 7 18.6 RE1-silencing transcription factor 18.6 Protein FAM65C 18.6 Hornerin 18.6 A-kinase anchor protein 9 18.5 Chromobox protein homolog 2 18.5 Talin-2 18.5

Appendix 1
243
Protein ASP
14-3-3 protein zeta/delta 18.5 Peroxiredoxin-2 18.4 Microtubule-actin cross-linking factor 1 18.4 Proteoglycan 4 18.4 Spermatogenesis-associated protein 17 18.3 Ryanodine receptor 2 18.3 Taste receptor type 1 member 2 18.3 Vacuolar protein sorting-associated protein 13B 18.3 Fatty acid synthase 18.2 Serine/threonine-protein kinase 10 18.2 Serine/threonine-protein kinase MRCK beta 18.2 Guanylate-binding protein 6 18.1 Neurogenic locus notch homolog protein 4 18.0 Serotransferrin precursor 18.0 Mucin-5AC 18.0 Mitogen-activated protein kinase kinase kinase 12 18.0 Probable methylcytosine dioxygenase TET2 17.9 Enhancer of polycomb homolog 1 17.9 Receptor-type tyrosine-protein phosphatase N2 17.9 Dedicator of cytokinesis protein 9 17.9 Uncharacterized protein FLJ44048 homolog 17.9 Uncharacterized protein KIAA1109 17.8 Gag-Pro-Pol polyprotein 17.8 NADH-ubiquinone oxidoreductase chain 2 17.8 Ankyrin repeat domain-containing protein 30A 17.8 UDP-glucose:glycoprotein glucosyltransferase 1 17.8 Capsid polyprotein 17.7 EH domain-binding protein 1-like protein 1 17.7 Cell division cycle-associated 7-like protein 17.7
Protein ASP
Acetyl-CoA carboxylase 2 17.7 Tetratricopeptide repeat protein 28 17.7 Voltage-dependent N-type calcium channel subunit alpha-1B 17.7 Tudor and KH domain-containing protein 17.7 Thrombospondin type-1 domain-containing protein 7B 17.7 Coiled-coil domain-containing protein 138 17.6 Protein disulfide-isomerase A4 17.6 UPF0474 protein C5orf41 17.6 Ankyrin repeat domain-containing protein 31 17.5 Talin-1 17.4 Protein tyrosine kinase 2 beta 17.4 Protein KIAA1881 17.4 Fibulin-7 17.4 Meiotic recombination protein REC8 homolog 17.3 Sulfotransferase 1C2 17.3 Coiled-coil alpha-helical rod protein 1 17.2 Histone deacetylase 9 17.1 Interleukin-10 17.0 Carnitine O-palmitoyltransferase 1, muscle isoform 17.0 Stabilin-1 16.9 Lebercilin-like protein 16.9 Nuclear receptor coactivator 6 16.9 Strumpellin 16.8 Intraflagellar transport protein 172 homolog 16.8 Centrosomal protein of 164 kDa 16.8 Uncharacterized protein KIAA0556 16.7 Macoilin 16.7 Cytosolic carboxypeptidase 3 16.6 Dapper homolog 2 16.6

Appendix 1
244
Protein ASP
von Willebrand factor A domain-containing protein 3A 16.6 Phosphoserine phosphatase 16.5 Apolipoprotein B-100 16.4 Synaptonemal complex protein 2 16.4 Intersectin-1 16.3 Tumor necrosis factor receptor superfamily member 8 16.1 Rho GTPase-activating protein 22 16.1 LYR motif-containing protein 1 16.0 Follicle-stimulating hormone receptor 15.9 Guanine nucleotide exchange factor VAV3 15.9 WD repeat-containing protein 62 15.9 Lipopolysaccharide-responsive and beige-like anchor protein 15.8 Retinitis pigmentosa 1-like 1 protein 15.8 Putative glycerol kinase 5 15.7 Coiled-coil domain-containing protein 74A 15.7 Transcription elongation factor SPT6 15.6 Zinc finger protein 536 15.5 USP6 N-terminal-like protein 15.5 WD repeat-containing protein 48 15.4 Vasopressin V1a receptor 14.3 Transcription factor TFIIIB component B'' homolog 14.0 WD repeat-containing protein 19 13.6 Protein unc-45 homolog B 13.6 Uncharacterized protein FLJ40521 13.0 Vascular endothelial growth factor receptor 1 12.9 Ufm1-specific protease 2 12.7 Coiled-coil domain-containing protein 52 12.3 Zinc finger CCCH domain-containing protein 13 12.2

Bibliography
245
Chapter 12 Bibliography

PTTG-Binding Factor (PBF) Is a Novel Regulator of theThyroid Hormone Transporter MCT8
V. E. Smith, M. L. Read, A. S. Turnell, N. Sharma, G. D. Lewy, J. C. W. Fong,R. I. Seed, P. Kwan, G. Ryan, H. Mehanna, S. Y. Chan, V. M. Darras,K. Boelaert, J. A. Franklyn, and C. J. McCabe
School of Clinical and Experimental Medicine (V.E.S., M.L.R., N.S., G.D.L., J.C.W.F., R.I.S., P.K., G.R.,S.Y.C., K.B., J.A.F., C.J.M.), Institute of Biomedical Research, and School of Cancer Sciences (A.S.T.),University of Birmingham, B15 2TT, United Kingdom; Institute of Head and Neck Studies and Education(H.M.), University Hospitals Coventry and Warwickshire National Health Service Trust, Coventry, CV22DX, United Kingdom; and Laboratory of Comparative Endocrinology, Animal Physiology, andNeurobiology (V.M.D.), Katholieke Universiteit Leuven, Naamsestraat 61, B-3000 Leuven, Belgium
Within the basolateral membrane of thyroid follicular epithelial cells, two transporter proteins arecentral to thyroid hormone (TH) biosynthesis and secretion. The sodium iodide symporter (NIS)delivers iodide from the bloodstream into the thyroid, and after TH biosynthesis, monocarboxylatetransporter 8 (MCT8) mediates TH secretion from the thyroid gland. Pituitary tumor-transforminggene-binding factor (PBF; PTTG1IP) is a protooncogene that is up-regulated in thyroid cancer andthat binds NIS and modulates its subcellular localization and function. We now show that PBF bindsMCT8 in vitro, eliciting a marked shift in MCT8 subcellular localization and resulting in a significantreduction in the amount of MCT8 at the plasma membrane as determined by cell surface bioti-nylation assays. Colocalization and interaction between PBF and Mct8 was also observed in vivo ina mouse model of thyroid-specific PBF overexpression driven by a bovine thyroglobulin (Tg) pro-moter (PBF-Tg). Thyroidal Mct8 mRNA and protein expression levels were similar to wild-type mice.Critically, however, PBF-Tg mice demonstrated significantly enhanced thyroidal TH accumulationand reduced TH secretion upon TSH stimulation. Importantly, Mct8-knockout mice share this phe-notype. These data show that PBF binds and alters the subcellular localization of MCT8 in vitro, withPBF overexpression leading to an accumulation of TH within the thyroid in vivo. Overall, thesestudies identify PBF as the first protein to interact with the critical TH transporter MCT8 andmodulate its function in vivo. Furthermore, alongside NIS repression, PBF may thus represent a newregulator of TH biosynthesis and secretion. (Endocrinology 153: 3526–3536, 2012)
Pituitary tumor-transforming gene (PTTG)-bindingfactor (PBF; PTTG1IP) (1) is a protooncogene impli-
cated in endocrine cancer. Widely expressed in normaltissue (1, 2), PBF is overexpressed in a number of tumorsincluding thyroid (3), pituitary (4), and breast (5). In thy-roid cancer, higher PBF expression is independently asso-ciated with early tumor recurrence (3).
The primary function of PBF remains unknown. How-ever, some functional information has been obtainedthrough its interactions with other proteins. PBF was first
identified through its interaction with the human securinPTTG and is thought to promote the nuclear translocationof PTTG in a manner dependent upon the nuclear local-ization signal at the C-terminal end of PBF (2).
More recently, we have demonstrated an interactionwith the sodium iodide symporter (NIS), an integral mem-brane glycoprotein located in the basolateral plasma mem-brane of thyroid follicular epithelial cells (6). NIS is re-sponsible for mediating iodide uptake and is consequentlyessential for thyroid hormone (TH) synthesis. Although
ISSN Print 0013-7227 ISSN Online 1945-7170Printed in U.S.A.Copyright © 2012 by The Endocrine Societydoi: 10.1210/en.2011-2030 Received November 25, 2011. Accepted April 11, 2012.First Published Online April 25, 2012
Abbreviations: GST, Glutathione-S-transferase; HA, hemagglutinin; KO, knockout; MCT8,monocarboxylate transporter 8; NIS, sodium iodide symporter; PBF, PTTG-binding factor;PTTG, pituitary tumor-transforming gene; Tg, thyroglobulin; TH, thyroid hormone; VO,vector only; WT, wild type.
T H Y R O I D - T R H - T S H
3526 endo.endojournals.org Endocrinology, July 2012, 153(7):3526–3536
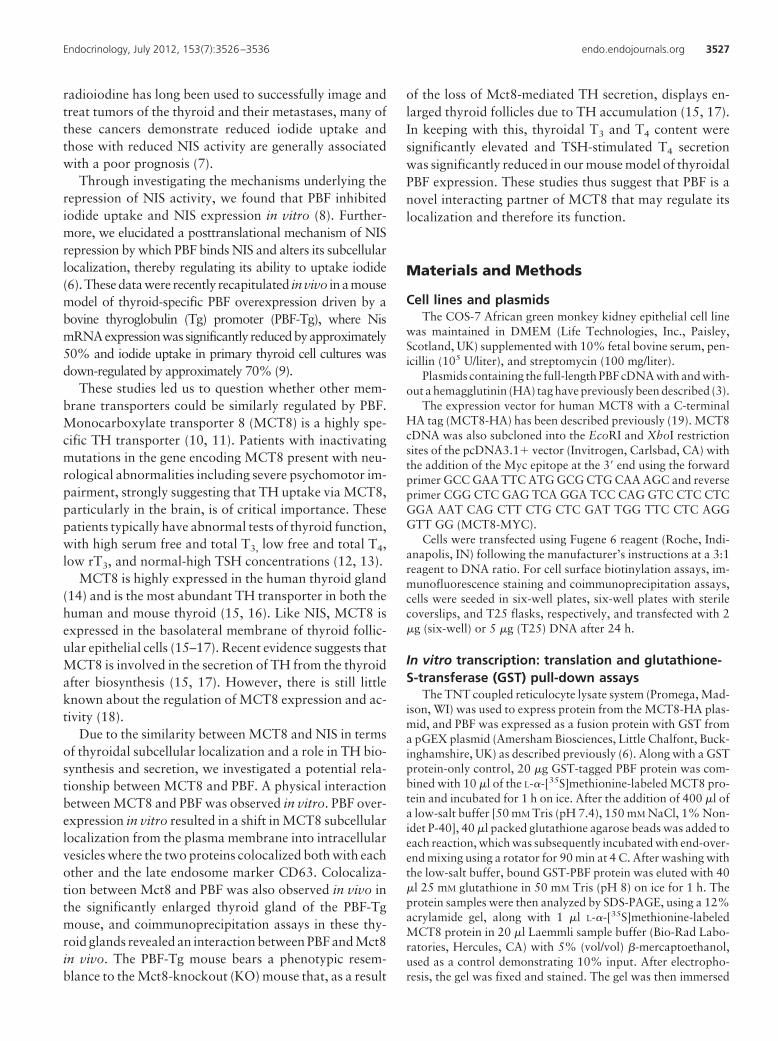
radioiodine has long been used to successfully image andtreat tumors of the thyroid and their metastases, many ofthese cancers demonstrate reduced iodide uptake andthose with reduced NIS activity are generally associatedwith a poor prognosis (7).
Through investigating the mechanisms underlying therepression of NIS activity, we found that PBF inhibitediodide uptake and NIS expression in vitro (8). Further-more, we elucidated a posttranslational mechanism of NISrepression by which PBF binds NIS and alters its subcellularlocalization, thereby regulating its ability to uptake iodide(6). These data were recently recapitulated in vivo in a mousemodel of thyroid-specific PBF overexpression driven by abovine thyroglobulin (Tg) promoter (PBF-Tg), where NismRNAexpressionwas significantly reducedbyapproximately50% and iodide uptake in primary thyroid cell cultures wasdown-regulated by approximately 70% (9).
These studies led us to question whether other mem-brane transporters could be similarly regulated by PBF.Monocarboxylate transporter 8 (MCT8) is a highly spe-cific TH transporter (10, 11). Patients with inactivatingmutations in the gene encoding MCT8 present with neu-rological abnormalities including severe psychomotor im-pairment, strongly suggesting that TH uptake via MCT8,particularly in the brain, is of critical importance. Thesepatients typically have abnormal tests of thyroid function,with high serum free and total T3, low free and total T4,low rT3, and normal-high TSH concentrations (12, 13).
MCT8 is highly expressed in the human thyroid gland(14) and is the most abundant TH transporter in both thehuman and mouse thyroid (15, 16). Like NIS, MCT8 isexpressed in the basolateral membrane of thyroid follic-ular epithelial cells (15–17). Recent evidence suggests thatMCT8 is involved in the secretion of TH from the thyroidafter biosynthesis (15, 17). However, there is still littleknown about the regulation of MCT8 expression and ac-tivity (18).
Due to the similarity between MCT8 and NIS in termsof thyroidal subcellular localization and a role in TH bio-synthesis and secretion, we investigated a potential rela-tionship between MCT8 and PBF. A physical interactionbetween MCT8 and PBF was observed in vitro. PBF over-expression in vitro resulted in a shift in MCT8 subcellularlocalization from the plasma membrane into intracellularvesicles where the two proteins colocalized both with eachother and the late endosome marker CD63. Colocaliza-tion between Mct8 and PBF was also observed in vivo inthe significantly enlarged thyroid gland of the PBF-Tgmouse, and coimmunoprecipitation assays in these thy-roid glands revealed an interaction between PBF and Mct8in vivo. The PBF-Tg mouse bears a phenotypic resem-blance to the Mct8-knockout (KO) mouse that, as a result
of the loss of Mct8-mediated TH secretion, displays en-larged thyroid follicles due to TH accumulation (15, 17).In keeping with this, thyroidal T3 and T4 content weresignificantly elevated and TSH-stimulated T4 secretionwas significantly reduced in our mouse model of thyroidalPBF expression. These studies thus suggest that PBF is anovel interacting partner of MCT8 that may regulate itslocalization and therefore its function.
Materials and Methods
Cell lines and plasmidsThe COS-7 African green monkey kidney epithelial cell line
was maintained in DMEM (Life Technologies, Inc., Paisley,Scotland, UK) supplemented with 10% fetal bovine serum, pen-icillin (105 U/liter), and streptomycin (100 mg/liter).
Plasmids containing the full-length PBF cDNA with and with-out a hemagglutinin (HA) tag have previously been described (3).
The expression vector for human MCT8 with a C-terminalHA tag (MCT8-HA) has been described previously (19). MCT8cDNA was also subcloned into the EcoRI and XhoI restrictionsites of the pcDNA3.1! vector (Invitrogen, Carlsbad, CA) withthe addition of the Myc epitope at the 3" end using the forwardprimer GCC GAA TTC ATG GCG CTG CAA AGC and reverseprimer CGG CTC GAG TCA GGA TCC CAG GTC CTC CTCGGA AAT CAG CTT CTG CTC GAT TGG TTC CTC AGGGTT GG (MCT8-MYC).
Cells were transfected using Fugene 6 reagent (Roche, Indi-anapolis, IN) following the manufacturer’s instructions at a 3:1reagent to DNA ratio. For cell surface biotinylation assays, im-munofluorescence staining and coimmunoprecipitation assays,cells were seeded in six-well plates, six-well plates with sterilecoverslips, and T25 flasks, respectively, and transfected with 2!g (six-well) or 5 !g (T25) DNA after 24 h.
In vitro transcription: translation and glutathione-S-transferase (GST) pull-down assays
The TNT coupled reticulocyte lysate system (Promega, Mad-ison, WI) was used to express protein from the MCT8-HA plas-mid, and PBF was expressed as a fusion protein with GST froma pGEX plasmid (Amersham Biosciences, Little Chalfont, Buck-inghamshire, UK) as described previously (6). Along with a GSTprotein-only control, 20 !g GST-tagged PBF protein was com-bined with 10 !l of the L-"-[35S]methionine-labeled MCT8 pro-tein and incubated for 1 h on ice. After the addition of 400 !l ofa low-salt buffer [50 mM Tris (pH 7.4), 150 mM NaCl, 1% Non-idet P-40], 40 !l packed glutathione agarose beads was added toeach reaction, which was subsequently incubated with end-over-end mixing using a rotator for 90 min at 4 C. After washing withthe low-salt buffer, bound GST-PBF protein was eluted with 40!l 25 mM glutathione in 50 mM Tris (pH 8) on ice for 1 h. Theprotein samples were then analyzed by SDS-PAGE, using a 12%acrylamide gel, along with 1 !l L-"-[35S]methionine-labeledMCT8 protein in 20 !l Laemmli sample buffer (Bio-Rad Labo-ratories, Hercules, CA) with 5% (vol/vol) #-mercaptoethanol,used as a control demonstrating 10% input. After electropho-resis, the gel was fixed and stained. The gel was then immersed
Endocrinology, July 2012, 153(7):3526–3536 endo.endojournals.org 3527

in Amplify fluorographic reagent (Amersham) to increase thesensitivity of signal detection, dried at 65 C for 2 h, and finally,exposed to autoradiographic film at #20 C.
Coimmunoprecipitation assaysCOS-7 cells in T25 flasks were transiently transfected with
MCT8-MYC and pCI-neo vector only (VO), PBF-HA andpcDNA3.1! (VO), or MCT8-MYC and PBF-HA. Cells wereharvested in 500 !l RIPA buffer [50 mM Tris-HCl (pH 7.4), 150mM NaCl, 1% vol/vol Igepal CA-630, 6 mM sodium deoxy-cholate, 1 mM EDTA] containing protease inhibitor cocktail(Sigma, Poole, Dorset, UK). After a brief sonication step, celllysates were centrifuged at 13,000 rpm for 20 min and trans-ferred to a clean microcentrifuge tube. Each lysate was incubatedwith 10 !l mouse monoclonal anti-Myc-Tag (9B11) antibody(Cell Signaling Technology, Inc., Danvers, MA) at 4 C overnightwith end-over-end rotating. After the addition of 25 !l packedbeads prepared from protein G Sepharose 4 Fast Flow (Amer-sham), the samples were incubated for another 2 h at 4 C withend-over-end rotating. Protein G Sepharose beads were centri-fuged and, after the removal of any unbound protein, washedfour times with 500 !l RIPA buffer. Bound protein was eluted in50 !l Laemmli sample buffer containing 5% (vol/vol) #-mer-captoethanol and 1% (wt/vol) sodium dodecyl sulfate at 37 C for30 min.
Proteins were separated by SDS-PAGE using a 12% acryl-amide gel and transferred to polyvinylidene difluoride mem-brane. The membrane was blocked with 5% milk in Tris-buff-ered saline containing 0.025% Tween 80, and PBF-HA proteinwas probed with mouse monoclonal anti-HA.11 antibody (Co-vance Research Products, Emeryville, CA) at a concentration of1:1000 in blocking buffer. After incubation with 650 ng/mlhorseradish peroxidase-conjugated polyclonal rabbit antimouseIg (Dako, Glostrup, Denmark) as secondary antibody, the anti-gen-antibody complexes were detected using the ECL-Pluschemiluminescence detection system (Amersham). Total proteincell lysate (20 !g) taken before the coimmunoprecipitation stepswas also separated by SDS-PAGE using 12% acrylamide gels toconfirm MCT8-MYC and PBF-HA expression. PBF-HA wasprobed in the same way as the coimmunoprecipitation samples,and MCT8-MYC was detected with mouse anti-Myc antibody ata concentration of 1:1000. #-Actin expression was assessed as aloading control for each protein.
The reciprocal experiment was performed in the same way byprecipitating PBF-HA with 10 !l rabbit polyclonal anti-HA(Y-11) antibody (Santa Cruz Biotechnology, Santa Cruz, CA)and probing for coimmunoprecipitated MCT8-MYC withmouse anti-Myc antibody.
Mouse thyroid glands were homogenized in 350 !l RIPAbuffer and centrifuged at 13,000 rpm for 10 min. Lysate waspooled from eight wild-type (WT) and six PBF-Tg thyroidglands, and protein concentration was measured using the bi-cinchoninic acid assay (Pierce, Rockford, IL). Using the methoddescribed above with an additional preclearing step consisting ofa 2-h incubation at 4 C with 100 !l protein G Sepharose 4 FastFlow/ml lysate, endogenous Mct8 was immunoprecipitated with5 !l rabbit anti-MCT8 antibody (Atlas, Stockholm, Sweden)from 0, 0.3, 0.5, and 1 mg WT and PBF-Tg protein lysate. Co-immunoprecipitation of PBF-HA was detected through Westernblotting using the mouse monoclonal anti-HA.11 antibody (Co-vance Research Products).
Immunofluorescence stainingImmunofluorescence staining using COS-7 cells was as car-
ried out as described previously (6). The following antibodieswere used: mouse monoclonal anti-HA.11 antibody (CovanceResearch Products), rabbit polyclonal anti-HA (Y-11) antibody(Santa Cruz Biotechnology), rabbit polyclonal anti-PBF anti-body [made by Eurogentec (Seraing, Belgium) for our laboratoryusing the full-length PBF protein as an epitope], and mousemonoclonal anti-CD63 antibody (kindly provided by FedorBerditchevski, School of Cancer Sciences, University of Birming-ham, Birmingham, UK).
For the preparation of frozen tissue sections, thyroid glandswere excised from WT and PBF-Tg mice and fixed in 4% form-aldehyde. After cryoprotection of the tissue using an increasingsucrose gradient (10–30%), the tissues were embedded in OCT(Thermo Fisher Scientific, Waltham, MA) and frozen on dry ice.Sections of 6 !m were prepared on a cryostat.
Before staining, the OCT was dissolved in PBS for 10 min, andtissue was permeabilized with 0.1% Triton X-100 (Sigma) for 5min. After blocking in 10% normal calf serum (NCS) for 1 h,tissues were incubated overnight at 4 C with rabbit anti-MCT8antibody (Atlas) at 1:500 in 1% BSA. Incubation with secondaryantibody Alexa Fluor 594-conjugated goat antirabbit IgG (In-vitrogen) was performed at room temperature for 1 h at 1:500 in1% BSA, with 2% NCS and Hoechst stain for nuclei (1:1000).PBF-HA was stained using mouse monoclonal anti-HA.11 an-tibody (Covance Research Products) at 1:500 and the Mouse onMouse (M.O.M.) fluorescein immunodetection kit (Vector Lab-oratories Inc., Burlingame, CA) following the manufacturer’sinstructions.
Epifluorescent microscopy was performed using a $40 ob-jective on a Zeiss Axioplan fluorescent microscope (Zeiss,Oberkochen, Germany). A Zeiss confocal LSM 510 microscopewith a $63 objective was used to perform confocal microscopy.
Cell surface biotinylationMCT8-MYC and either pCI-neo (VO) or PBF plasmids were
transiently transfected into COS-7 cells. Forty-eight hours aftertransfection, the cell surface protein isolation kit (Pierce) wasused to biotinylate and isolate membrane-associated proteins asdescribed previously (6) with some minor modifications. Briefly,cells were exposed to 2$ 1 ml EZ-Link Sulfo-NHS-SS-Biotin for25 min at 4 C followed by 2$ 2 ml 100 mM glycine for 20 minat 4 C. Cells from each of two wells of a six-well plate werecombined in 700 !l lysis buffer (1% Triton X-100 in PBS) con-taining protease inhibitor cocktail (Sigma) and vortexed every 15min for an hour on ice. The lysate was centrifuged at 13,000 $g for 15 min at 4 C, and 40 !l of the supernatant was retained aswhole-cell lysate. The remaining cell lysate was incubated withimmobilized NeutrAvidin gel overnight at 4 C with end-over-endmixing using a rotator, and after washing away unbound pro-tein, membrane proteins were eluted in 100 !l SDS-PAGE sam-ple buffer [62.5 mM Tris-HCl (pH 6.8), 3% sodium dodecylsulfate, 10% glycerol] containing 70 mM dithiothreitol for 1 h atroom temperature with end-over-end rotating.
MCT8-MYC was detected in the membrane protein andwhole-cell lysate fractions through immunoblotting. Proteinswere separated by SDS-PAGE using a 10% acrylamide gel, andMCT8 protein was probed with mouse monoclonal anti-Myc-Tag (9B11) antibody at a concentration of 1:1000, followed by
3528 Smith et al. Regulation of MCT8 by PBF Endocrinology, July 2012, 153(7):3526–3536
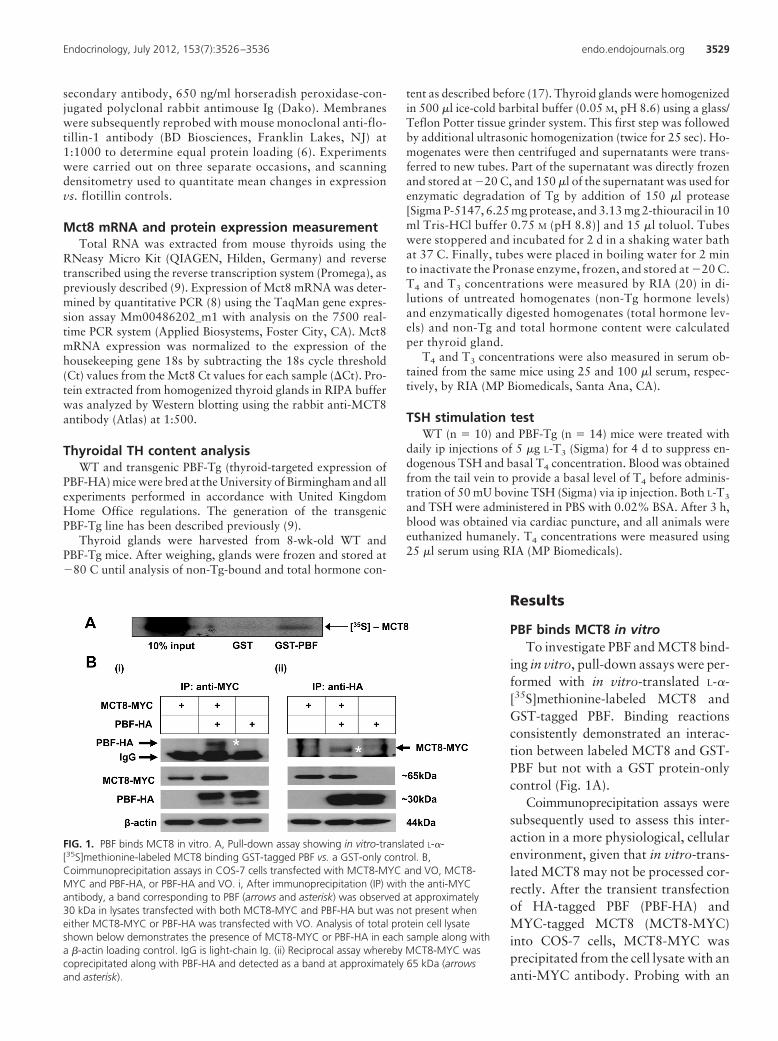
secondary antibody, 650 ng/ml horseradish peroxidase-con-jugated polyclonal rabbit antimouse Ig (Dako). Membraneswere subsequently reprobed with mouse monoclonal anti-flo-tillin-1 antibody (BD Biosciences, Franklin Lakes, NJ) at1:1000 to determine equal protein loading (6). Experimentswere carried out on three separate occasions, and scanningdensitometry used to quantitate mean changes in expressionvs. flotillin controls.
Mct8 mRNA and protein expression measurementTotal RNA was extracted from mouse thyroids using the
RNeasy Micro Kit (QIAGEN, Hilden, Germany) and reversetranscribed using the reverse transcription system (Promega), aspreviously described (9). Expression of Mct8 mRNA was deter-mined by quantitative PCR (8) using the TaqMan gene expres-sion assay Mm00486202_m1 with analysis on the 7500 real-time PCR system (Applied Biosystems, Foster City, CA). Mct8mRNA expression was normalized to the expression of thehousekeeping gene 18s by subtracting the 18s cycle threshold(Ct) values from the Mct8 Ct values for each sample (%Ct). Pro-tein extracted from homogenized thyroid glands in RIPA bufferwas analyzed by Western blotting using the rabbit anti-MCT8antibody (Atlas) at 1:500.
Thyroidal TH content analysisWT and transgenic PBF-Tg (thyroid-targeted expression of
PBF-HA) mice were bred at the University of Birmingham and allexperiments performed in accordance with United KingdomHome Office regulations. The generation of the transgenicPBF-Tg line has been described previously (9).
Thyroid glands were harvested from 8-wk-old WT andPBF-Tg mice. After weighing, glands were frozen and stored at#80 C until analysis of non-Tg-bound and total hormone con-
tent as described before (17). Thyroid glands were homogenizedin 500 !l ice-cold barbital buffer (0.05 M, pH 8.6) using a glass/Teflon Potter tissue grinder system. This first step was followedby additional ultrasonic homogenization (twice for 25 sec). Ho-mogenates were then centrifuged and supernatants were trans-ferred to new tubes. Part of the supernatant was directly frozenand stored at #20 C, and 150 !l of the supernatant was used forenzymatic degradation of Tg by addition of 150 !l protease[Sigma P-5147, 6.25 mg protease, and 3.13 mg 2-thiouracil in 10ml Tris-HCl buffer 0.75 M (pH 8.8)] and 15 !l toluol. Tubeswere stoppered and incubated for 2 d in a shaking water bathat 37 C. Finally, tubes were placed in boiling water for 2 minto inactivate the Pronase enzyme, frozen, and stored at #20 C.T4 and T3 concentrations were measured by RIA (20) in di-lutions of untreated homogenates (non-Tg hormone levels)and enzymatically digested homogenates (total hormone lev-els) and non-Tg and total hormone content were calculatedper thyroid gland.
T4 and T3 concentrations were also measured in serum ob-tained from the same mice using 25 and 100 !l serum, respec-tively, by RIA (MP Biomedicals, Santa Ana, CA).
TSH stimulation testWT (n & 10) and PBF-Tg (n & 14) mice were treated with
daily ip injections of 5 !g L-T3 (Sigma) for 4 d to suppress en-dogenous TSH and basal T4 concentration. Blood was obtainedfrom the tail vein to provide a basal level of T4 before adminis-tration of 50 mU bovine TSH (Sigma) via ip injection. Both L-T3
and TSH were administered in PBS with 0.02% BSA. After 3 h,blood was obtained via cardiac puncture, and all animals wereeuthanized humanely. T4 concentrations were measured using25 !l serum using RIA (MP Biomedicals).
Results
PBF binds MCT8 in vitroTo investigate PBF and MCT8 bind-
ing in vitro, pull-down assays were per-formed with in vitro-translated L-"-[35S]methionine-labeled MCT8 andGST-tagged PBF. Binding reactionsconsistently demonstrated an interac-tion between labeled MCT8 and GST-PBF but not with a GST protein-onlycontrol (Fig. 1A).
Coimmunoprecipitation assays weresubsequently used to assess this inter-action in a more physiological, cellularenvironment, given that in vitro-trans-lated MCT8 may not be processed cor-rectly. After the transient transfectionof HA-tagged PBF (PBF-HA) andMYC-tagged MCT8 (MCT8-MYC)into COS-7 cells, MCT8-MYC wasprecipitated from the cell lysate with ananti-MYC antibody. Probing with an
FIG. 1. PBF binds MCT8 in vitro. A, Pull-down assay showing in vitro-translated L-"-[35S]methionine-labeled MCT8 binding GST-tagged PBF vs. a GST-only control. B,Coimmunoprecipitation assays in COS-7 cells transfected with MCT8-MYC and VO, MCT8-MYC and PBF-HA, or PBF-HA and VO. i, After immunoprecipitation (IP) with the anti-MYCantibody, a band corresponding to PBF (arrows and asterisk) was observed at approximately30 kDa in lysates transfected with both MCT8-MYC and PBF-HA but was not present wheneither MCT8-MYC or PBF-HA was transfected with VO. Analysis of total protein cell lysateshown below demonstrates the presence of MCT8-MYC or PBF-HA in each sample along witha #-actin loading control. IgG is light-chain Ig. (ii) Reciprocal assay whereby MCT8-MYC wascoprecipitated along with PBF-HA and detected as a band at approximately 65 kDa (arrowsand asterisk).
Endocrinology, July 2012, 153(7):3526–3536 endo.endojournals.org 3529

anti-HA antibody after Western blotting established thatPBF-HA had coprecipitated along with MCT8-MYC (Fig.1Bi). In contrast, PBF remained undetected in controls inwhich MCT8-MYC and VO or PBF-HA and VO weretransfected (Fig. 1Bi). The reciprocal coimmunoprecipi-tation assay, in which PBF-HA was precipitated using theanti-HA antibody, confirmed coimmunoprecipitation ofMCT8-MYC after immunoblotting with the anti-MYCantibody (Fig. 1Bii). Finally, a mass spectrometry screen todetect binding partners of PBF in K1 thyroid carcinomacells also detected coimmunoprecipitation of MCT8 (datanot shown). Thus, GST pull-down assays, coimmunopre-cipitation assays, and mass spectrometry experiments alldemonstrated that PBF and MCT8 bind in vitro.
MCT8 colocalizes with PBF in vitroWe have demonstrated previously that HA-tagged
MCT8 (MCT8-HA) showed intense cell surface expres-sion after transient transfection into the pluripotent hu-man central nervous system precursor NT2 cell line andcolocalized with the plasma membrane marker CD8 (19).In the present studies, the subcellular localization of ex-ogenous MCT8-HA and PBF was analyzed using immu-nofluorescent staining in COS-7 cells, which are highlyamenable to immunofluorescent studies. As seen in NT2
cells, MCT8-HA was observed predominantly at theplasma membrane (Fig. 2A). As shown previously (6), en-dogenous PBF was expressed at relatively low levels in thenucleus, whereas the majority of PBF protein was concen-trated within intracellular vesicles in the cytoplasm (Fig.2A). When PBF was cotransfected along with MCT8-HA,there was an apparent increase in MCT8 staining withinintracellular vesicles and a concomitant reduction in mem-brane staining (Fig. 2B). Merged images demonstratedstrong colocalization between PBF and MCT8-HA, par-ticularly within vesicles (Fig. 2B).
PBF alters the subcellular localization of MCT8Given the apparent alteration in MCT8 localization,
we next investigated by quantitative means whether PBFoverexpression was associated with diminished MCT8 lo-calization at the cell membrane, where it serves as a func-tional transporter. COS-7 cells were transfected withMCT8-MYC and either VO control or PBF, and cell sur-face biotinylation assays were performed. Compared withVO treatment, there was a significant reduction in MCT8expression at the plasma membrane after PBF transfection(56 ' 7% reduction, P & 0.005, n & 3) (Fig. 3A). TotalMCT8-MYC expression was not significantly altered by
PBF overexpression compared with VO(10 ' 7% reduction, P & 0.245, n & 3)(Fig. 3B), confirming an alteration inlocalization rather than an overall re-duction in MCT8 expression. Hence,plasma membrane expression ofMCT8 was significantly reduced withPBF overexpression in COS-7 cells.
MCT8 colocalization with CD63We have previously demonstrated
colocalization of both PBF and NISwith endogenous expression of the lateendosome marker CD63, a member ofthe tetraspanin family that is com-monly associated with clathrin-depen-dent trafficking (6). Upon transfectionof PBF-HA into COS-7 cells, we againshowed a high degree of colocalizationbetween PBF and CD63 (Fig. 4A).When MCT8-HA was transfected intoCOS-7 cells, there was no apparent as-sociation between MCT8 and CD63staining (Fig. 4Bi). However, aftercotransfection of PBF, the vesicles inwhich MCT8 was now detectedshowed strong colocalization with en-dogenous CD63 (Fig. 4Bii). This sug-
FIG. 2. MCT8 and PBF localization in COS-7 cells. A, Confocal images of MCT8-HA aftercotransfection with a VO control into COS-7 cells, and endogenous PBF, both detected byimmunofluorescent analysis. MCT8-HA (green) was located predominantly within the plasmamembrane, whereas endogenous PBF (red) was found in the nucleus and within intracellularvesicles. B, Representative fluorescent immunocytochemistry experiments examining stainingof PBF (red) and MCT8-HA (green) after transient cotransfection into COS-7 cells using bothepifluorescent (i) and confocal (ii) microscopy. PBF was predominantly expressed withincytoplasmic vesicles. MCT8-HA demonstrated increased staining within intracellular vesicleswhere it strongly colocalized with PBF, as seen in yellow in the merged images. Scale bars, 20 !m.
3530 Smith et al. Regulation of MCT8 by PBF Endocrinology, July 2012, 153(7):3526–3536

gests that the vesicles in which MCT8 was observed arelate endosomes and that the mechanism by which PBFalters the subcellular localization of MCT8 may involveclathrin-dependent endocytosis.
Mct8 expression in an in vivo model of thyroidalPBF overexpression
Given that PBF binds MCT8 and alters its subcellularlocalization, we next investigated Mct8 expression andfunction in vivo in a mouse model in which HA-taggedPBF overexpression is targeted specifically to the thyroidgland (PBF-Tg) (9). Compared with WT mice, thyroidalMct8 mRNA expression was unaltered in PBF-Tg mice(mean %Ct: PBF-Tg & 10.49 ' 0.13; cf. WT & 10.35 '0.13, P & 0.482, n & 6) (Fig. 5Ai). Thyroidal Mct8 proteinexpression, as determined by Western blot analysis, wasalso similar in WT and PBF-Tg mice (0.98 ' 0.07-fold,P & 0.878, n & 8) (Fig. 5Aii). Thus, in keeping with the invitro data above, high expression of PBF in vivo did notalter Mct8 expression in the thyroid.
PBF and Mct8 colocalization and interaction in vivoTo further investigate an association between PBF and
Mct8 in vivo, frozen sections of thyroid glands taken fromPBF-Tg mice were immunofluorescently labeled using HAand MCT8 antibodies. PBF-HA and Mct8 showed intenseareas of colocalization, predominantly within the cyto-plasm of the thyroid follicular epithelial cells of thePBF-Tg mice (Fig. 5B). To determine whether these pro-
teins interact within these regions of co-localization, coimmunoprecipitationassays were performed on protein ly-sate extracted from mice thyroidglands. After the immunoprecipitationof endogenous Mct8, a band of risingintensity corresponding to PBF-HAwas detected in increasing amounts ofprotein lysate from PBF-Tg thyroidglands but not in equivalent amounts oflysate taken from WT thyroids (Fig.5C). In addition, examination of Mct8localization in the thyroid follicular ep-ithelial cells of WT mice revealed strongbasolateral membrane expression (Fig.5Di) that is in agreement with pub-lished data (15–17) and that appearedmarkedly reduced in the PBF-Tg thy-roid cells (Fig. 5Dii). Hence, PBF andMct8 colocalize and interact within thethyroid in vivo and, in keeping with ourin vitro data, there appears to be a shiftin the subcellular localization of Mct8in the presence of PBF overexpression.
Increased TH levels in the PBF-Tg thyroid glandsGiven the reduction in cell surface MCT8 expression
after PBF overexpression in vitro, we hypothesized thatincreased levels of PBF might result in diminished TH se-cretion from the thyroid. To test this, thyroidal TH con-tent was analyzed in 8-wk-old WT (n & 8) and PBF-Tg(n & 10) mice. Mean thyroid weight for these WT andPBF-Tg mice were 2.25 ' 0.12 and 5.54 ' 0.26 mg, re-spectively. Thyroidal non-Tg-bound TH content in thePBF-Tg mice was significantly higher compared with WTmice. Non-Tg-T3 content in the PBF-Tg thyroid glandswas 1.9-fold higher than in WT thyroids (11.5 ' 1.2 vs.6.2 ' 0.7 $mol/thyroid, P & 0.004) (Fig. 6Ai), and non-Tg-T4 content was increased 2.4-fold (339.5 ' 41.8 vs.144.3 ' 25.8 $mol/thyroid, P & 0.002) (Fig. 6Aii). Tg-bound T3 content was increased 1.9-fold in PBF-Tg thy-roid glands, although this was not significantly higherthan in their WT counterparts (567.8 ' 113.9 vs. 293.2 '62.7 $mol/thyroid, P & 0.100) (Fig. 6Bi). Thyroidal Tg-T4
content was 4.2-fold higher in PBF-Tg mice than in WTmice (8349.5 ' 1966.2 vs. 1968.2 ' 412.2 $mol/thyroid,P & 0.019) (Fig. 6Bii). In addition, TH concentrationswere also measured in the sera of these mice. Mean serumT3 concentrations for the WT and PBF-Tg mice were165.3 ' 8.6 and 150.1 ' 10.4 ng/dl, respectively, andserum T4 levels were 2.9 ' 0.1 and 3.6 ' 0.2 !g/dl, re-spectively. Subsequently, when the ratio of total thyroid
FIG. 3. PBF alters the subcellular localization of NIS. Cell surface biotinylation assays in COS-7cells transfected with a VO control or with human PBF. A, Representative immunoblot analysisof surface-biotinylated proteins precipitated with streptavidin-agarose beads and probed withanti-MYC antibody, which revealed MYC-tagged human MCT8 detection at around 60 kDa.Flotillin-1 was used as a marker of membrane protein expression to determine loadingbetween samples. Bottom panel, Three separate experiments were performed, with scanningdensitometry used to quantify mean differences in cell surface expression of MCT8, relative toalterations in flotillin-1 expression. B, Representative immunoblot analysis of total MCT8-MYCprotein expression with results of densitometry shown below, demonstrating no significantalteration in expression after PBF overexpression. Data are presented as mean ' SEM. **, P (0.01; ns, not significant.
Endocrinology, July 2012, 153(7):3526–3536 endo.endojournals.org 3531

TH content (picomoles per thyroid) to circulating TH con-centration (nanograms per deciliter) was assessed in eachmouse, a significantly higher ratio was observed in PBF-Tgmice compared with WT mice both for T3 (2.2-fold increase;P & 0.046) and T4 (3.2-fold increase; P & 0.029) (Supple-mentalFig.1,publishedonTheEndocrineSociety’s JournalsOnline web site at http://endo.endojournals.org).
Decreased TSH-stimulated T4 secretion from thePBF-Tg thyroid gland
To further investigate whether a reduction in Mct8function, and hence TH secretion, was at least partly re-sponsible for the accumulation in TH within the thyroidglands of PBF-Tg mice, we measured the release of T4 afterTSH stimulation. To suppress the basal serum T4 and TSHconcentrations, WT (n & 10) and PBF-Tg (n & 14) micewere treated daily with 5 !g L-T3 for 4 d before adminis-tration of 50 mU bovine TSH. After TSH stimulation, asignificant increase in serum T4 was observed in WT mice(1.59 ' 0.17 vs. 1.37 ' 0.03 !g/dl, P & 0.007) (Fig. 6Ci).In contrast, no increase in serum T4 was detected inPBF-Tg mice (1.35 ' 0.10 vs. 1.36 ' 0.05 !g/dl, P &0.629). Basal serum T4 levels were not significantly dif-ferent between WT and PBF-Tg mice (1.37 ' 0.03 vs.
1.36 ' 0.05 !g/dl, P & 0.884), whereasafter TSH administration, significantlyless serum T4 was present in PBF-Tgcompared with WT mice (1.35 ' 0.10vs. 1.59 ' 0.17 !g/dl, P & 0.013) (Fig.6Ci). Furthermore, when differences inserum T4 levels before and after TSHstimulation (%T4) were calculated foreach individual animal, there was a sig-nificant decrease in %T4 in PBF-Tgcompared with WT mice (0.00 ' 0.06vs. 0.22 ' 0.05 !g/dl, P & 0.021) (Fig.6Cii).
Taken together, these data implicatePBF as a novel interacting partner ofMCT8, which regulates MCT8 local-ization, hence altering TH secretionfrom the thyroid.
Discussion
Little is known about the regulation ofthe critical TH transporter MCT8 (18).Studies of the mouse Mct8 gene havedemonstrated cell-specific induction ofMct8 expression by retinoic acid (21),although the effect on Mct8 expressionin the thyroid remains unknown. Given
its recently discovered role in mediating TH secretion fromthe thyroid gland (15, 17), we investigated a role for PBFin MCT8 regulation.
We have previously described a posttranslationalmechanism of NIS regulation by which PBF binds NIS andmodulates its subcellular localization, thereby down-reg-ulating NIS activity (6). In the present study, we have ad-dressed the hypothesis that PBF can regulate other mem-brane transporters in addition to NIS and, throughinvestigation of a possible relationship between PBF andMCT8, we have identified a novel mode of posttransla-tional regulation for MCT8.
MCT8 was confirmed as a novel binding partner forPBF through in vitro pull-down and coimmunoprecipita-tion assays in COS-7 cells and mass spectrometry exper-iments in K1 thyroid carcinoma cells. As observed withNIS in previous experiments (6), PBF overexpression invitro resulted in an increase in MCT8 expression withinintracellular vesicles where it colocalized with PBF. Im-portantly, increased expression of PBF was accompaniedby a significant reduction in MCT8 expression at theplasma membrane, as determined through cell surface bi-otinylation assays. Thus, MCT8 and PBF colocalize and
FIG. 4. Colocalization of PBF and MCT8 with CD63 in vitro. A, Confocal images of PBF-HA,after transfection into COS-7 cells, and endogenous CD63. PBF-HA (red) and endogenousCD63 (green) colocalized within late endosomes. B, Representative confocal imagesexamining staining of MCT8-HA (red) after transient transfection into COS-7 cells andendogenous CD63 (green). i, With cotransfection of VO control, MCT8-HA waspredominantly expressed in the plasma membrane and showed no colocalization with CD63.ii, In contrast, cotransfection of PBF resulted in the appearance of MCT8-HA withinintracellular vesicles (arrows) where it strongly colocalized with CD63, as seen in yellow in themerged images. Scale bars, 20 !m.
3532 Smith et al. Regulation of MCT8 by PBF Endocrinology, July 2012, 153(7):3526–3536
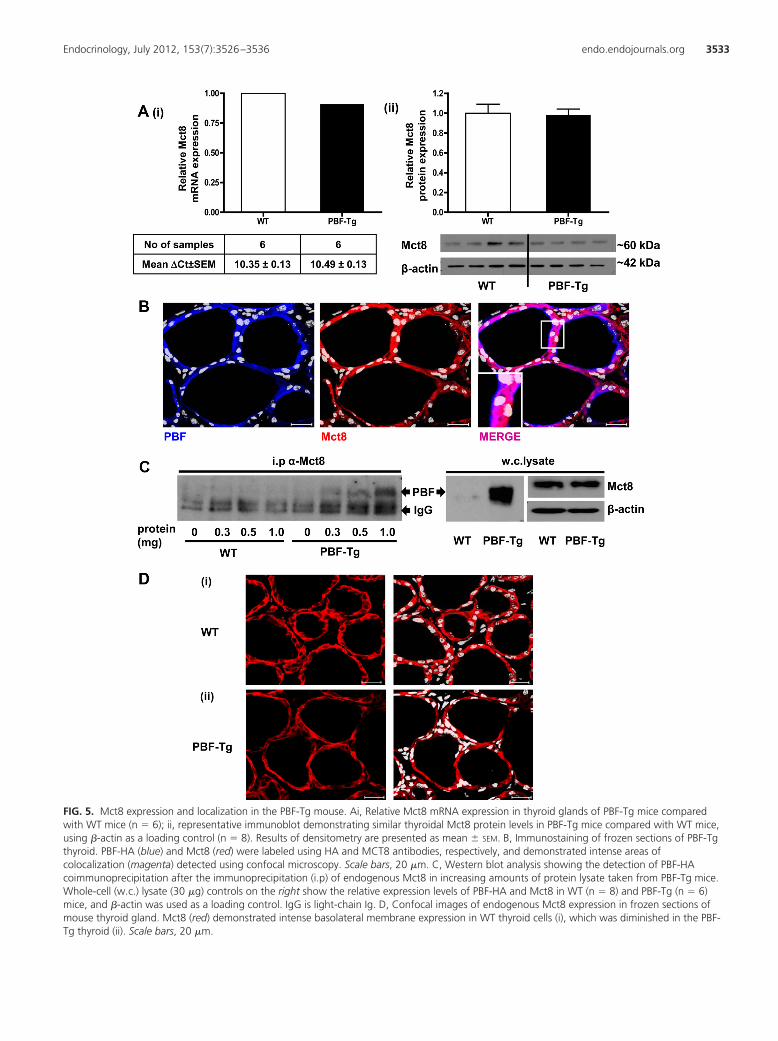
FIG. 5. Mct8 expression and localization in the PBF-Tg mouse. Ai, Relative Mct8 mRNA expression in thyroid glands of PBF-Tg mice comparedwith WT mice (n & 6); ii, representative immunoblot demonstrating similar thyroidal Mct8 protein levels in PBF-Tg mice compared with WT mice,using #-actin as a loading control (n & 8). Results of densitometry are presented as mean ' SEM. B, Immunostaining of frozen sections of PBF-Tgthyroid. PBF-HA (blue) and Mct8 (red) were labeled using HA and MCT8 antibodies, respectively, and demonstrated intense areas ofcolocalization (magenta) detected using confocal microscopy. Scale bars, 20 !m. C, Western blot analysis showing the detection of PBF-HAcoimmunoprecipitation after the immunoprecipitation (i.p) of endogenous Mct8 in increasing amounts of protein lysate taken from PBF-Tg mice.Whole-cell (w.c.) lysate (30 !g) controls on the right show the relative expression levels of PBF-HA and Mct8 in WT (n & 8) and PBF-Tg (n & 6)mice, and #-actin was used as a loading control. IgG is light-chain Ig. D, Confocal images of endogenous Mct8 expression in frozen sections ofmouse thyroid gland. Mct8 (red) demonstrated intense basolateral membrane expression in WT thyroid cells (i), which was diminished in the PBF-Tg thyroid (ii). Scale bars, 20 !m.
Endocrinology, July 2012, 153(7):3526–3536 endo.endojournals.org 3533

bind each other, and PBF is able to alter the subcellularlocalization of MCT8 in vitro. In addition, having previ-ously demonstrated that PBF and NIS are associated withendogenous expression of the late endosome markerCD63 (6), we have now shown that MCT8 is also foundin late endosomes after PBF overexpression. Thus, themechanism by which PBF internalizes both MCT8 andNIS is likely to involve clathrin-dependent endocytosis re-sulting in the enrichment of these transporters within lateendosomes.
To investigate the physiological relevance of these ob-servations, we used our recently constructed PBF-Tgtransgenic mouse model in which PBF is specifically over-expressed in the thyroid gland (9). Although Nis mRNAand protein expression was significantly repressed in the
PBF-Tg thyroid, both Mct8 mRNA andprotein expression were similar to WTmice. Although PBF does not appear toregulate Mct8 transcription, the pres-ence of a posttranslational mechanismof regulation in vivo was supportedthrough immunofluorescent studies ofPBF-Tg thyroid sections where PBF co-localized with Mct8, particularlywithin the cytoplasm of the follicularepithelial cells. Furthermore, an in vivointeraction between PBF and Mct8 wasdemonstrated within thyroid glandstaken from PBF-Tg mice, and compar-ison of Mct8 localization in thyroid fol-licular cells in PBF-Tg mice indicated adecrease in the clearly defined basolat-eral membrane expression that is seenin WT mice.
In addition to the reduced thyroidalNis expression and iodide uptake, thePBF-Tg mouse has a notable pheno-type. PBF-Tg mice have significantlyenlarged thyroid glands (with 100%penetrance) that are associated with hy-perplastic lesions (9). Interestingly,these characteristics are shared with theMct8-KO mouse (15, 16). At 14 wk ofage, the thyroid glands of Mct8-KOmice weigh around 4.1 mg comparedwith a mean thyroid weight of 2.6 mgfor WT mice (15). This 1.6-fold in-crease is comparable to the increase inPBF-Tg mean thyroid weight comparedwith WT mice of a similar age (9). Thethyroidal enlargement in the PBF-Tgand Mct8-KO mice was largely due to a
significant (1.5-fold) increase in mean follicle size accom-panied by the development of macrofollicles (9, 15–17).
The reduction in TH secretion in the Mct8-KO miceresulted in an accumulation of TH within the thyroidgland, which was both Tg and non-Tg bound (15, 17). Toassess the effect of PBF overexpression on Mct8-mediatedsecretion, TH content was measured in the PBF-Tg mice.Both Tg and non-Tg-bound TH were significantly in-creased in the PBF-Tg thyroid compared with WT mice.Furthermore, T4 secretion after TSH stimulation was sig-nificantly impaired in PBF-Tg mice compared with WTmice. Lack of TH secretion from the Mct8-KO mousethyroid gland partially contributes to the abnormal serumTH profile that reproduces the high T3 and low T4 levelsseen in human subjects with mutations in the MCT8 gene
FIG. 6. Thyroidal TH content and TSH-stimulated TH secretion in the PBF-Tg mouse.Comparison of non-Tg-bound (A) and Tg-bound (B) TH content within the thyroid glands ofWT (n & 8) and PBF-Tg (n & 10) mice. Levels of non-Tg-T3 and Tg-T3 (i) and non-Tg-T4 andTg-T4 (ii) are presented as mean ' SEM. Ci Serum T4 levels before and 3 h after theadministration of 50 mU TSH in WT (n & 10) and PBF-Tg (n & 14) mice; ii, for each individualanimal, the difference in T4 concentration before and after TSH stimulation was calculatedand expressed as %T4. Presentation of the mean ' SEM %T4 illustrates a significant reduction inT4 secretion in the PBF-Tg mice compared with WT. **, P ( 0.01; *, P ( 0.05.
3534 Smith et al. Regulation of MCT8 by PBF Endocrinology, July 2012, 153(7):3526–3536
(15, 17). In contrast, despite the strikingly enlarged thy-roid, PBF-Tg mice have normal serum TSH and circulatingTH concentrations (9). There are a number of differencesbetween the PBF-Tg and Mct8-KO mice that could ex-plain the variation in serum TH profile. In the Mct8 totalKO mouse, there would be no TH secretion via Mct8whatsoever, whereas PBF overexpression is likely to onlypartially prevent Mct8-mediated secretion. Furthermore,the loss of Mct8 in the peripheral tissues and the subse-quent alteration of deiodinase activity are known to sig-nificantly contribute to the abnormal TH profile of theMct8-KO mouse (22–24), but Mct8 would still be fullyfunctional within these tissues in the PBF-Tg mouse. PBFmay also regulate the activity of other transporters such asMct10, another TH transporter expressed in both mouseand human thyroid glands (14, 17).
In addition, although iodide uptake is normal in theMct8-KO mouse (17), the reduction in Nis expression andiodide uptake in the PBF-Tg mouse adds further complex-ity (9). It might be expected that the reduction in Nis ac-tivity would result in diminished TH synthesis. However,although serum TSH concentrations are normal, the thy-roid glands are significantly enlarged and appear to fullycompensate for this lack of iodide uptake, with mainte-nance of normal serum TH concentrations. One potentialmechanism for this may be the reported increase in TSHreceptor expression (9), which may result in increased sen-sitivity to TSH. Importantly, the ratio of total thyroidalTH to total circulating TH is significantly increased in thePBF-Tg mouse, further suggesting that TH secretion isperturbed. Future studies will endeavor to elucidate thecontributionof reducedTHsecretionviaMct8 to theover-all thyroid phenotype of the PBF-Tg mouse.
Overall, the present studies have identified a mecha-nism of posttranslational regulation of MCT8 by whichPBF binds and alters its subcellular localization in vitro,with PBF overexpression resulting in a reduction in THsecretion and an accumulation of TH within the thyroidgland in vivo. These data add to the recent increase in ourunderstanding of the final stages of TH synthesis and se-cretion and highlight PBF as an important regulator of thisprocess.
Acknowledgments
We thank Dr. Josh Rappoport (School of Biosciences, Universityof Birmingham, Birmingham, UK) and Dr. Sally James (Univer-sity of York, York, UK) for their technical expertise and adviceand Dr. Fedor Berditchevski (School of Cancer Sciences, Uni-versity of Birmingham, UK) for the kind provision of antibodies.
Address all correspondence and requests for reprints to:Prof. C. J. McCabe, School of Clinical and Experimental Med-icine, Institute for Biomedical Research, University of Bir-mingham, Birmingham, B15 2TT, United Kingdom. E-mail:[email protected].
This work was supported by the Medical Research Counciland the Get-A-Head Charity.
Disclosure Summary: The authors have nothing to disclose.
References
1. Yaspo ML, Aaltonen J, Horelli-Kuitunen N, Peltonen L, Lehrach H1998 Cloning of a novel human putative type Ia integral membraneprotein mapping to 21q22.3. Genomics 49:133–136
2. Chien W, Pei L 2000 A novel binding factor facilitates nuclear trans-location and transcriptional activation function of the pituitary tu-mor-transforming gene product. J Biol Chem 275:19422–19427
3. Stratford AL, Boelaert K, Tannahill LA, Kim DS, Warfield A, EggoMC, Gittoes NJ, Young LS, Franklyn JA, McCabe CJ 2005 Pituitarytumor transforming gene binding factor: a novel transforming genein thyroid tumorigenesis. J Clin Endocrinol Metab 90:4341–4349
4. McCabe CJ, Khaira JS, Boelaert K, Heaney AP, Tannahill LA, Hus-sain S, Mitchell R, Olliff J, Sheppard MC, Franklyn JA, Gittoes NJ2003 Expression of pituitary tumour transforming gene (PTTG) andfibroblast growth factor-2 (FGF-2) in human pituitary adenomas:relationships to clinical tumour behaviour. Clin Endocrinol (Oxf)58:141–150
5. Watkins RJ, Read ML, Smith VE, Sharma N, Reynolds GM, BuckleyL, Doig C, Campbell MJ, Lewy G, Eggo MC, Loubiere LS, FranklynJA, Boelaert K, McCabe CJ 2010 Pituitary tumor transforming genebinding factor: a new gene in breast cancer. Cancer Res 70:3739–3749
6. Smith VE, Read ML, Turnell AS, Watkins RJ, Watkinson JC, LewyGD, Fong JC, James SR, Eggo MC, Boelaert K, Franklyn JA, Mc-Cabe CJ 2009 A novel mechanism of sodium iodide symporter re-pression in differentiated thyroid cancer. J Cell Sci 122:3393–3402
7. Smith VE, Franklyn JA, McCabe CJ 2011 Expression and functionof the novel proto-oncogene PBF in thyroid cancer: a new target foraugmenting radioiodine uptake. J Endocrinol 210:157–163
8. Boelaert K, Smith VE, Stratford AL, Kogai T, Tannahill LA, Wat-kinson JC, Eggo MC, Franklyn JA, McCabe CJ 2007 PTTG and PBFrepress the human sodium iodide symporter. Oncogene 26:4344–4356
9. Read ML, Lewy GD, Fong JC, Sharma N, Seed RI, Smith VE, Gen-tilin E, Warfield A, Eggo MC, Knauf JA, Leadbeater WE, WatkinsonJC, Franklyn JA, Boelaert K, McCabe CJ 2011 Proto-oncogene PBF/PTTG1IP regulates thyroid cell growth and represses radioiodidetreatment. Cancer Res 71:6153–6164
10. Friesema EC, Ganguly S, Abdalla A, Manning Fox JE, Halestrap AP,Visser TJ 2003 Identification of monocarboxylate transporter 8 asa specific thyroid hormone transporter. J Biol Chem 278:40128–40135
11. Friesema EC, Kuiper GG, Jansen J, Visser TJ, Kester MH 2006Thyroid hormone transport by the human monocarboxylate trans-porter 8 and its rate-limiting role in intracellular metabolism. MolEndocrinol 20:2761–2772
12. Friesema EC, Grueters A, Biebermann H, Krude H, von Moers A,Reeser M, Barrett TG, Mancilla EE, Svensson J, Kester MH, KuiperGG, Balkassmi S, Uitterlinden AG, Koehrle J, Rodien P, HalestrapAP, Visser TJ 2004 Association between mutations in a thyroidhormone transporter and severe X-linked psychomotor retardation.Lancet 364:1435–1437
13. Dumitrescu AM, Liao XH, Best TB, Brockmann K, Refetoff S 2004
Endocrinology, July 2012, 153(7):3526–3536 endo.endojournals.org 3535
A novel syndrome combining thyroid and neurological abnormal-ities is associated with mutations in a monocarboxylate transportergene. Am J Hum Genet 74:168–175
14. Nishimura M, Naito S 2008 Tissue-specific mRNA expression pro-files of human solute carrier transporter superfamilies. Drug MetabPharmacokinet 23:22–44
15. Di Cosmo C, Liao XH, Dumitrescu AM, Philp NJ, Weiss RE, Refet-off S 2010 Mice deficient in MCT8 reveal a mechanism regulatingthyroid hormone secretion. J Clin Invest 120:3377–3388
16. Wirth EK, Sheu SY, Chiu-Ugalde J, Sapin R, Klein MO, Mossbrug-ger I, Quintanilla-Martinez L, de Angelis MH, Krude H, Riebel T,Rothe K, Köhrle J, Schmid KW, Schweizer U, Grüters A 2011 Mono-carboxylate transporter 8 deficiency: altered thyroid morphologyand persistent high triiodothyronine/thyroxine ratio after thyroid-ectomy. Eur J Endocrinol 165:555–561
17. Trajkovic-Arsic M, Müller J, Darras VM, Groba C, Lee S, Weih D,Bauer K, Visser TJ, Heuer H 2010 Impact of monocarboxylatetransporter-8 deficiency on the hypothalamus-pituitary-thyroidaxis in mice. Endocrinology 151:5053–5062
18. Visser WE, Friesema EC, Visser TJ 2011 Thyroid hormone trans-porters: the knowns and the unknowns. Mol Endocrinol 25:1–14
19. James SR, Franklyn JA, Reaves BJ, Smith VE, Chan SY, Barrett TG,
Kilby MD, McCabe CJ 2009 Monocarboxylate transporter 8 inneuronal cell growth. Endocrinology 150:1961–1969
20. Darras VM, Huybrechts LM, Berghman L, Kühn ER, Decuypere E1990 Ontogeny of the effect of purified chicken growth hormone onthe liver 5" monodeiodination activity in the chicken: reversal of theactivity after hatching. Gen Comp Endocrinol 77:212–220
21. Kogai T, Liu YY, Richter LL, Mody K, Kagechika H, Brent GA 2010Retinoic acid induces expression of the thyroid hormone trans-porter, monocarboxylate transporter 8 (Mct8). J Biol Chem 285:27279–27288
22. Dumitrescu AM, Liao XH, Weiss RE, Millen K, Refetoff S 2006Tissue-specific thyroid hormone deprivation and excess in mono-carboxylate transporter (mct) 8-deficient mice. Endocrinology 147:4036–4043
23. Trajkovic M, Visser TJ, Mittag J, Horn S, Lukas J, Darras VM,Raivich G, Bauer K, Heuer H 2007 Abnormal thyroid hormonemetabolism in mice lacking the monocarboxylate transporter 8.J Clin Invest 117:627–635
24. Trajkovic-Arsic M, Visser TJ, Darras VM, Friesema EC, Schlott B,Mittag J, Bauer K, Heuer H 2010 Consequences of monocarboxy-late transporter 8 deficiency for renal transport and metabolism ofthyroid hormones in mice. Endocrinology 151:802–809
Learn more about The Endocrine Society’s timely resources on Translational Research and Medicine.
http://www.endo-society.org/translational
3536 Smith et al. Regulation of MCT8 by PBF Endocrinology, July 2012, 153(7):3526–3536