novel approach for selecting the best predictor for identifying the
TRANSCRIPT

Novel approach for selecting the best predictorfor identifying the binding sites in DNAbinding proteinsR. Nagarajan1, Shandar Ahmad2 and M. Michael Gromiha1,*
1Department of Biotechnology, Indian Institute of Technology Madras, Chennai 600036, India and2National Institute of Biomedical Innovation, Osaka, Japan
Received April 17, 2013; Revised May 20, 2013; Accepted May 25, 2013
ABSTRACT
Protein–DNA complexes play vital roles in manycellular processes by the interactions of aminoacids with DNA. Several computational methodshave been developed for predicting the interactingresidues in DNA-binding proteins using sequenceand/or structural information. These methodsshowed different levels of accuracies, which maydepend on the choice of data sets used in training,the feature sets selected for developing a predictivemodel, the ability of the models to capture informa-tion useful for prediction or a combination of thesefactors. In many cases, different methods are likelyto produce similar results, whereas in others,the predictors may return contradictory predictions.In this situation, a priori estimates of predictionperformance applicable to the system beinginvestigated would be helpful for biologists tochoose the best method for designing their experi-ments. In this work, we have constructed unbiased,stringent and diverse data sets for DNA-bindingproteins based on various biologically relevant con-siderations: (i) seven structural classes, (ii) 86 folds,(iii) 106 superfamilies, (iv) 194 families, (v) 15 bindingmotifs, (vi) single/double-stranded DNA, (vii) DNAconformation (A, B, Z, etc.), (viii) three functionsand (ix) disordered regions. These data sets wereculled as non-redundant with sequence identitiesof 25 and 40% and used to evaluate the performanceof 11 different methods in which online services orstandalone programs are available. We observedthat the best performing methods for each ofthe data sets showed significant biases toward thedata sets selected for their benchmark. Our analysisrevealed important data set features, which could
be used to estimate these context-specific biasesand hence suggest the best method to be used fora given problem. We have developed a web server,which considers these features on demand anddisplays the best method that the investigatorshould use. The web server is freely available athttp://www.biotech.iitm.ac.in/DNA-protein/. Further,we have grouped the methods based on their com-plexity and analyzed the performance. The infor-mation gained in this work could be effectivelyused to select the best method for designingexperiments.
INTRODUCTION
Protein–DNA interactions play vital roles in several bio-logical processes, including gene regulation, DNA repair,DNA replication and DNA packaging. The knowledgeabout DNA-binding residues and binding specificitywould help to understand the recognition mechanism ofprotein–DNA complexes. The availability of experimentaldata on binding specificity (1) and 3D structures ofprotein–DNA complexes (2) encouraged researchers toreveal important factors for understanding protein–DNA recognition. The analysis has been focused ondifferent directions such as amino acid properties, conser-vation of residues, contribution of non-covalent inter-actions and conformational changes of DNA (3–26).The importance of hydrogen bonds, electrostatic, hydro-phobic and van der Waals interactions along with weakinteractions including cation-p has been stressed byseveral investigators in the field (12,14,19,24,27–32). Thecontributions of energetic terms along with physical andchemical features have been used to understand therecognition mechanism of protein–DNA complexes.Furthermore, knowledge-based statistical potentials havebeen derived using atomic contacts between protein and
*To whom correspondence should be addressed. Tel: +91 44 2257 4138; Fax: +91 44 2257 4102; Email: [email protected]
7606–7614 Nucleic Acids Research, 2013, Vol. 41, No. 16 Published online 20 June 2013doi:10.1093/nar/gkt544
� The Author(s) 2013. Published by Oxford University Press.This is an Open Access article distributed under the terms of the Creative Commons Attribution Non-Commercial License (http://creativecommons.org/licenses/by-nc/3.0/), which permits non-commercial re-use, distribution, and reproduction in any medium, provided the original work is properly cited. For commercialre-use, please contact [email protected]
Downloaded from https://academic.oup.com/nar/article-abstract/41/16/7606/2411037by gueston 12 February 2018

DNA, and these potentials have been used to predict thebinding specificity of protein–DNA complexes (33,34).Gromiha et al. (2004) combined both inter and intra-molecular interactions for understanding the recognitionmechanism.
On the other hand, owing to the exponential increase inthe gap between the available sequences and structures ofDNA-binding proteins in Uniprot (35) and Protein DataBank (2), several methods have been proposed to identifythe binding site residues just from amino acid sequences.These methods are based on amino acid frequency,evolutionary profile, sequence conservation, predictedsecondary structure and solvent accessibility, electrostaticpotential, hydrophobicity, position-specific scoring matrixby using various machine learning methods such assupport vector machine, neural network, Naıve Bayesclassifier and random forest (33,36–51). Careful inspectionof these methods revealed the fact that they are applicableto specific types of proteins, and the performance of eachmethod varies drastically in the range of 20–90%. Thissituation leads confusions to the biologists for selectingthe best method to identify the binding sites for designingtheir experiments. Hence, it is essential and important toreveal the applications and predictive ability of existingpredictors to specific data sets based on various propertiesof the query protein.
In this work, we have systematically categorized theprotein–DNA complexes into several groups based onthe structure of the protein, structure of the DNA,binding motif and function. The complexes in eachcategory have been divided into several sub-categoriesusing known annotations in structural and functionaldatabases. On the other hand, we have collected all theprediction servers, which have either online services oravailable standalone programs. We have developed neces-sary in-house programs to analyze the results obtainedwith each method using nine types of data sets. Wenoticed that no method is uniformly predicting thebinding sites at high accuracy in all the data sets. This isapplicable to the most recently developed methods withtuned parameters, efficient techniques and large data set aswell as the earliest methods reported in the literature. Wehave related the performance of each method with differ-ent data sets and revealed the correspondence betweenthem. These results would help the biologists to selectthe best method to design their experiments rather thanchoosing any specific method arbitrarily or a combinationof methods. In addition, the present study explores thenecessity of refining/developing bioinformatics tools toimprove the performance in specific categories of DNA-binding proteins. Specific examples for the best and worstperformance of methods in selected categories of data setswill be discussed.
MATERIALS AND METHODS
Data sets
We have collected all the protein–DNA complexes (2317entries) deposited in Protein Data Bank (last accessedon 16 May 2012). These complexes were classified into
four broader categories based on (i) protein structure,(ii) DNA structure, (iii) binding motif and (iv) proteinfunction as described later in the text. All the data setshave been culled with the sequence identities of <25 and40%. We obtained similar results, and the data with thecutoff of <25% sequence identity are presented in thisarticle.
Classification based on protein structure
We have used the SCOP database (52) for structuralclassification of proteins based on their structuralclasses, folding types, superfamilies and families. Ourfinal data set contains 260 protein chains from sevenclasses, 86 folds, 106 superfamilies and 194 families withthe sequence identity of <25%.Further, we have identified the disordered regions by
comparing the structures of proteins in free and complexforms and analyzed the performance of different methodsin disordered regions.
Classification based on DNA structure
We have classified the protein–DNA complexes based onDNA structure on two aspects: (i) DNA conformationsuch as A, B, Z, RH and U and (ii) type of DNA (singlestranded, double stranded and palindrome and doublestranded and non-palindrome). The conformation ofDNA has been obtained from Nucleic acid database(NDB) (53). The databases PDB, NDB and PDIdb (54)have been used to get the information on double/single-stranded DNA and palindrome/non-palindrome DNA.The final data set contains 283 and 301 protein chainsbased on DNA conformation and type, respectively.
Motif-based classification
The binding motif is considered to be an important factorfor identifying the binding sites (55). Hence, we classifiedthe protein–DNA complexes based on their bindingmotifs, and the major ones are helix-turn-helix, b-barreland b-ribbon. We obtained the motif information fromdifferent databases such as ProNuc (56), PDIdb (54) andBiomolecules gallery (http://gibk26.bio.kyutech.ac.jp/jouhou/image/dna-protein/all/all.html). The final data setcontains 69 chains from 15 motifs. We noticed that severalcomplexes are listed under enzymes, which are consideredin the classification based on functions.
Functional classification of protein–DNA complexes
We have classified the protein–DNA complexes based ontheir functions such as enzymes, regulatory proteins andstructural proteins. The functional information hasbeen obtained from NDB. The final data set contains126 enzymes, 149 regulatory proteins and 19 structuralproteins with the sequence identity of <25%.
Methods for predicting the binding sites in DNA-bindingproteins
We have collected all the available methods for predictingthe binding sites in DNA-binding proteins fromamino acid sequence, which have either online services
Nucleic Acids Research, 2013, Vol. 41, No. 16 7607
Downloaded from https://academic.oup.com/nar/article-abstract/41/16/7606/2411037by gueston 12 February 2018

or available standalone programs (57). The methods areBindN (39), BindN+(47), BindN-RF (46), DBS-Pred (37),DBS-PSSM (38), DNABindR (49), DP-Bind with threecategories, binary, BLOSUM and PSSM encoding (48),metaDBSite (51) and NAPS (50). The details about thename, features, technique, reference and link for themethods used in the present work are listed inSupplementary Table S1. These methods used differentdata sets and accuracies reported by the authors are inthe range of 70–80%.
Identification of DNA-binding residues
Several criteria have been proposed to identify the DNA-binding sites such as the distance between contactingatoms in protein and DNA (37), reduction in solvent ac-cessibility on binding (58) and interaction energy betweenprotein and DNA (21). Most of the prediction methodsanalyzed in this work used the distance based criteria foridentifying the binding sites. In this approach, a residue ina DNA-binding protein is identified as binding if thedistance between any of its heavy atoms and a heavyatom in DNA is �3.5 A. We have identified the bindingsites using the same conditions in all the consideredprotein–DNA complexes.
Assessing the performance of prediction methods
We have assessed the performance of different methodsusing the measures, sensitivity, specificity, accuracy andMatthews correlation coefficient (MCC). Sensitivityshows the correct prediction of DNA-binding residues,specificity reveals the ability of excluding non-binding resi-dues and accuracy provides the overall performance (59).
Sensitivity ¼ TP= TP+FNð Þ ð1Þ
Specificity ¼ TN= TN+FPð Þ ð2Þ
Accuracy1 ¼ TP+TNð Þ= TP+TN+FP+FNð Þ ð3Þ
Accuracy2 ¼ sensitivity+specificityð Þ=2 ð4Þ
MCC ¼TP� TN� FP� FN
ffiffiffiffiffiffiffiffiffiffiffiffiffiffiffiffiffiffiffiffiffiffiffiffiffiffiffiffiffiffiffiffiffiffiffiffiffiffiffiffiffiffiffiffiffiffiffiffiffiffiffiffiffiffiffiffiffiffiffiffiffiffiffiffiffiffiffiffiffiffiffiffiffiffiffiffiffiffiffiðTP+FPÞðTP+FNÞðTN+FPÞðTN+FNÞ
p ð5Þ
In these equations, TP (binding residues predicted asbinding), TN (non-binding residues predicted as nonbinding), FP (non-binding residues predicted as binding)
and FN (binding residues predicted as non binding) rep-resent, true positives, true negatives, false positives andfalse negatives, respectively.
RESULTS AND DISCUSSIONS
We have assessed the performance of all the availablemethods in different sets of data as described in the‘Materials and Methods’ section.
Structural classes
Protein–DNA complexes have been classified into sevenstructural classes such as all-a, all-b, a+b, a/b, multi-domain, coiled coil and small proteins. The accuraciesobtained with all the 11 considered methods in thesedata sets are presented in Table 1. From Table 1, wenoticed that the performance of a method depends onthe structural class. Most of the methods predict well inall-a proteins where as the performance is poor in all-bclass of proteins. This trend is similar to protein secondarystructure prediction that all-a class proteins are better pre-dicted than all-b class proteins (60). The binding sites incoiled coil proteins are predicted well in most of themethods. The comparison of different methods showedthat BindN-RF has the best performance in all-a andall-b proteins. The sensitivity of BindN-RF and DP-Bind_BLOSUM is <60%, although the overall accuraciesof these methods are more than metaDBSite. Further,none of the method showed the sensitivity of more than59% in multi-domain proteins. This might be due to thesize of the protein, and the binding site residues are <2%.Hence, we have separated domains in these proteins usingSBASE (61) and predicted the binding sites in DNA-binding domain. We observed that the methods DP-Bind_PSSM and NAPS could predict the binding siteswith >60% sensitivity, specificity and accuracy. Further,we have evaluated the performance of different methodsusing MCC, and the results are presented inSupplementary Table S2. We noticed that the trend issimilar to that reported using the measure, accuracy.
Folds, superfamilies and families
The classification of protein–DNA complexes based ontheir structures showed that they are distributed in 86 dif-ferent folding types, 106 superfamilies and 194 families. We
Table 1. Prediction accuracy of binding sites in different classes
Methods Average Accuracy all-a all-b a+b a/b Coiled coil Multidomain Small proteins
BindN 64.2 (74.9) 66.2 (76.3) 62.1 (74.6) 60.3 (74.8) 62.2 (79.6) 75.1 (73.2) 61.3 (79.7) 62.4 (66.5)BindN+ 71.1 (82.8) 76.2 (83.8) 66.0 (83.7) 67.9 (81.9) 66.5 (85.8) 88.4 (86.9) 65.5 (87.3) 66.9 (70.2)BindN-RF 71.9 (82.3) 76.4 (83.7) 68.0 (82.7) 68.4 (82.8) 67.8 (84.8) 88.1 (86.5) 65.8 (86.6) 68.5 (69.2)DBS-Pred 64.3 (72.6) 64.2 (73.0) 62.6 (71.6) 62.0 (71.7) 63.1 (75.4) 74.4 (73.6) 59.8 (76.4) 63.6 (66.5)DBS-PSSM 70.2 (78.5) 73.2 (80.2) 65.5 (78.2) 65.8 (76.5) 67.1 (83.3) 87.4 (81.6) 65.3 (87.0) 67.3 (62.3)DP-Bind_Binary 66.9 (68.0) 68.1 68.6) 63.5 (65.8) 63.1 (67.2) 66.3 (70.6) 79.8 (70.4) 62.0 (70.7) 65.4 (62.9)DP-Bind_BLOSUM 66.1 (67.8) 69.2 (69.5) 63.2 (66.3) 62.8 (67.8) 66.3 (71.5) 75.6 (66.6) 61.1 (70.5) 65.0 (62.4)DP-Bind_PSSM 72.1 (76.4) 73.7 (78.4) 67.9 (75.3) 69.6 (76.6) 70.4 (80.5) 88.1 (84.6) 69.9 (79.4) 64.8 (56.8)DNABindR 68.0 (71.9) 70.1 (72.9) 62.6 (68.1) 65.2 (71.0) 66.2 (75.2) 82.9 (77.3) 64.2 (77.1) 64.4 (61.7)metaDBSite 69.9 (72.3) 72.0 (74.1) 66.9 (70.2) 67.2 (71.5) 69.2 (76.6) 82.0 (74.0) 65.4 (76.6) 66.5 (62.9)NAPS 63.6 (65.1) 64.6 (64.8) 58.8 (61.3) 59.4 (62.5) 57.6 (66.9) 80.6 (75.0) 62.5 (67.9) 61.6 (57.6)
Accuracies obtained with Equation (3) are given in parentheses. The highest accuracy in each class is shown in bold.
7608 Nucleic Acids Research, 2013, Vol. 41, No. 16
Downloaded from https://academic.oup.com/nar/article-abstract/41/16/7606/2411037by gueston 12 February 2018

have analyzed the performance of all the 11 predictionmethods in all folds, superfamilies and families, and thesummarized results are presented in Figure 1 andSupplementary Table S3. DP-Bind_PSSM showed thebest performance in >20% of the folds/superfamilies.However, the accuracy of this method is <60% in 13 ofthe 86 considered folds. BindN-RF scored the highestrank in the classification of families. Methods such asDBS-PSSM and BindN+ predicted the binding siteswith topmost accuracy in 10–20% of the considered 186DNA-binding proteins. Interestingly, one of the earliestprediction methods DBS-Pred (37) also showed the bestperformance in four folds, four superfamiles and threefamilies. These results showed that the prediction methodsare complimenting each other in different types of DNA-binding proteins. It is essential to reveal the best method inspecific type of proteins for practical applications.
We have systematically analyzed the correspondencebetween the structure of the complex and prediction per-formance, and the methods showing highest and lowestaccuracies for identifying the binding sites in 86 folds,106 superfamilies and 194 families are listed inSupplementary Table S4. Few typical examples for thebest and worst predicted folds along with their perform-ances are presented in Table 2. BindN+, DBS-Pred andDP-Bind_PSSM showed the best performance in profilin-like, tetracyclin repressor-like and transcription factor IIAtypes of folds, respectively. The predicted accuracies are>90% based on the average between sensitivity and spe-cificity. On the other hand, other methods showed a poorperformance in these folds with the accuracy in the rangeof 50–70%. Further, the accuracies of several folds are<70%, and three typical examples are listed in Table 2.The best method showed the accuracy of 57% inRetrovirus zinc finger-like domain fold. The sensitivityand specificity are 70.2 and 43.0%, respectively. Inaddition, PUA domain-like and HLH-like folds showedthe accuracy of 61.1 and 61.2%, respectively. These resultsindicate the requirement of methods to be applicable tofolds in which the binding sites are poorly predicted.
The best predicted superfamilies and their performanceare included in Table 2. We observed that pheromonebinding and dimeric a+b barrel are predicted with theaccuracy of >90% where as the lowest accuracies are 65and 47%, respectively. The binding sites in eukaryotictranscription factors are predicted well with all themethods, and the highest and lowest accuracies are 94and 72%, respectively. The worst predicted superfamilesare chromo-domain-like, immunoglobulin and RNase A-line with the highest accuracy of �60% (Table 2).Interestingly, the binding site residues in chromo-domainsuperfamily are predicted with high specificity, whereasother two superfamilies identify the binding residueswith high sensitivity. This suggests that the interfaceresidues in these domains may consist of a small numberof residues with strong binding signal, which remain un-changed across the family, whereas there are otherresidues, which show diversity, and their binding is notdirectly predicted from sequence features alone.We observed similar tendency in the classification of
families. BindN-RF predicted the binding sites in AraCtype transcriptional activator with the accuracy of99.5%; the sensitivity and specificity are 100 and 99%,respectively. The binding sites in CopG and Z-DNA-binding domain are predicted with >90% accuracy byBindN and DBS-PSSM, respectively.This analysis revealed that although newly developed
methods included several features, fine tuning of param-eters and large data set, which showed excellent perform-ance over other methods, simpler methods reported earlierthan others may outperform more complex methods onsome systems, and hence their availability should be madeuse of predictions.
Disordered regions
We have analyzed the performance of different methods indisordered regions of 73 protein chains. The results arepresented in Table 3. We observed that the methods,BindN-RF and DP-Bind_PSSM, which showed highaccuracy in different structures classes (Table 1), have
Figure 1. Performance of DNA-binding site prediction methods in various folds, superfamilies and families.
Nucleic Acids Research, 2013, Vol. 41, No. 16 7609
Downloaded from https://academic.oup.com/nar/article-abstract/41/16/7606/2411037by gueston 12 February 2018

less sensitivity and specificity, respectively in disorderedregions. The overall accuracy also reduced to 62%. Onthe other hand, DBS-Pred maintained the accuracy of61% for disordered regions. The accuracy obtained withdifferent methods given in Table 3 showed the necessity ofdeveloping new methods for predicting the binding sites indisordered regions.
Motifs
We have grouped the protein–DNA complexes into 15different motifs, which have the representation of 1–30
complexes. The best performance of each method in allthe motifs is shown in Supplementary Table S5. In thisTable, we have also included the number of motifs, sensi-tivity, specificity and accuracy. We noticed that BindN+performed the best in alpha/beta, beta sheet and helix-loop-helix motifs. On the other hand, the performanceis poor in Zalpha motif. BindN-RF showed the best per-formance in 9 of the 15 considered motifs. DBS-PSSM isranked as the first in the ribbon-helix-helix and Zalphamotifs.
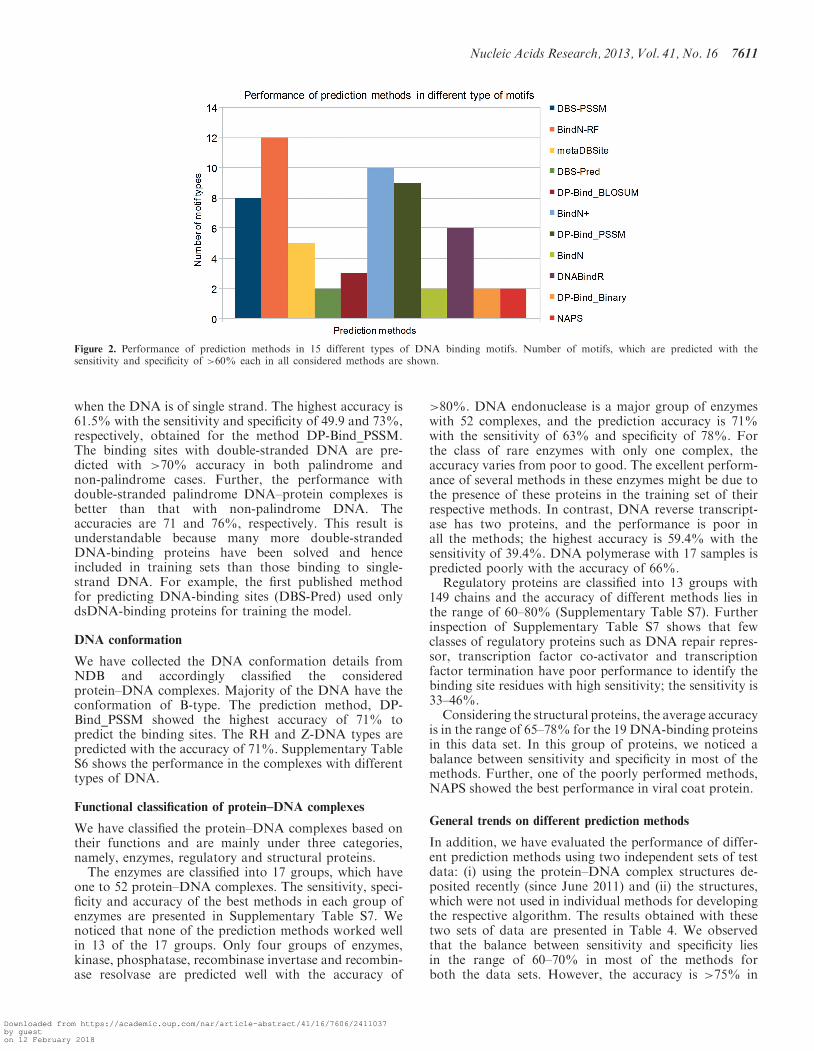
We have analyzed the performance of each method inall these motifs with the condition that the sensitivityand specificity are >60%, and the results are shown inFigure 2. We observed that all the methods performedwell at least 2 of the 15 considered motifs. BindN-RFshowed the best performances in 12 of 15 motifsfollowed by BindN+ (10/15). DBS-PSSM, DNABindRand metaDBSite showed the sensitivity and specificity of>70% in 5–8 motifs.
Type of DNA
We have classified the protein–DNA complexes based onthree types of DNA such as single-stranded, double-stranded and palindrome, and double-stranded andnon-palindrome DNA. We observed that the performanceis poor for all the methods to predict the binding sites
Table 2. Typical examples of best and worst predicted folds, superfamilies and families
Fold/Superfamily/Family Method Sensitivity Specificity Accuracy1 Accuracy2 MCC Lowest Accuracy MCC
Fold
Profilin-like (1) BindN+ 100.0 96.4 96.6 98.2 0.32 64.5 (DP-Bind_BLOSUM) 0.20Tetracyclin repressor-like,
C terminal domain (2)DP-Bind_PSSM 96.2 89.6 89.8 92.9 0.28 51.1 (DP-Bind_BLOSUM) 0.20
Transcription factorIIA(TFIIA), beta-barreldomain (2)
DBS-Pred 100.0 80.4 82.0 90.2 0.16 67.9 (NAPS) 0.13
HLH-like (1) BindN+ 40.0 82.4 72.7 61.2 0.38 49.6 (NAPS) 0.16PUA domain-like (1) DNABindR 75.0 47.3 51.0 61.1 0.21 54.4 (NAPS) 0.13Retrovirus zinc finger -like
domains (2)DP-Bind_PSSM 70.2 43.0 54.7 56.6 0.29 46.5 (DNABindR) 0.22
Superfamily
Pheromone-binding,quourm-sensingtranscription factors (1)
BindN+ 100.0 96.4 96.6 98.2 0.31 64.5 (DP-Bind_BLOSUM) 0.20
Dimeric alpha+betabarrel (1)
BindN-RF 87.5 96.4 95.9 92.0 0.34 47.3 (DBS-Pred) 0.17
DNA-binding domain-eukaryotic transcriptionfactors (1)
DBS-PSSM 100.0 88.5 90.5 94.3 0.28 72.3 (DBS-Pred) 0.20
Chromo domain-like (1) DBS-Pred 27.8 73.9 60.9 50.8 0.20 42.2 (NAPS) 0.14Immunoglobin (3) DBS-PSSM 77.8 60.0 60.4 68.9 0.29 37.4 (NAPS) 0.13RNase A-like (1) DP-Bind_PSSM 71.4 47.0 48.4 59.2 0.29 34.9 (BindN) 0.18
Family
AraC type transcriptionalactivator (1)
BindN-RF 100.0 99.0 99.1 99.5 0.32 65.9 (DBS-Pred) 0.19
CopG-like (1) BindN 100.0 81.1 83.7 90.5 0.22 78.1 (BindN-RF) 0.20Z-DNA binding
domain (1)DBS-PSSM 100.0 81.1 82.5 90.6 0.26 47.4 (DP-Bind_Binary) 0.19
T7 RNA polymerase (1) DP-Bind_PSSM 50.0 88.0 86.2 69.0 0.28 58.5 (NAPS) 0.13RecA protein-like
(ATPase-domain) (1)BindN-RF 33.3 87.7 86.5 60.5 0.33 44.1 (DNABindR) 0.23
SRA domain-like (1) DNABindR 75.0 47.3 51.0 61.1 0.23 54.4 (NAPS) 0.13
The worst predicted folds/superfamilies/families are shown in italics.
Table 3. Prediction performance of binding sites in disordered
regions
Method Sensitivity Specificity Accuracy1 Accuracy2 MCC
DBS-Pred 61.3 60.7 60.8 61.0 0.17BindN 55.5 67.5 65.2 61.5 0.19BindN+ 61.3 64.6 64.0 63.0 0.21BindN-RF 55.5 68.3 65.9 61.9 0.19DP-Bind_Binary 78.1 48.4 54.0 63.3 0.21DP-Bind_BLOSUM 73.0 50.3 54.5 61.6 0.18DP-Bind_PSSM 65.7 56.4 60.6 61.0 0.20NAPS 59.1 58.9 58.9 59.0 0.14DNABindR 75.9 51.9 56.4 63.9 0.22metaDBSite 73.0 56.0 59.2 64.5 0.23DBS-PSSM 65.0 61.1 61.8 63.0 0.20
7610 Nucleic Acids Research, 2013, Vol. 41, No. 16
Downloaded from https://academic.oup.com/nar/article-abstract/41/16/7606/2411037by gueston 12 February 2018
when the DNA is of single strand. The highest accuracy is61.5% with the sensitivity and specificity of 49.9 and 73%,respectively, obtained for the method DP-Bind_PSSM.The binding sites with double-stranded DNA are pre-dicted with >70% accuracy in both palindrome andnon-palindrome cases. Further, the performance withdouble-stranded palindrome DNA–protein complexes isbetter than that with non-palindrome DNA. Theaccuracies are 71 and 76%, respectively. This result isunderstandable because many more double-strandedDNA-binding proteins have been solved and henceincluded in training sets than those binding to single-strand DNA. For example, the first published methodfor predicting DNA-binding sites (DBS-Pred) used onlydsDNA-binding proteins for training the model.
DNA conformation
We have collected the DNA conformation details fromNDB and accordingly classified the consideredprotein–DNA complexes. Majority of the DNA have theconformation of B-type. The prediction method, DP-Bind_PSSM showed the highest accuracy of 71% topredict the binding sites. The RH and Z-DNA types arepredicted with the accuracy of 71%. Supplementary TableS6 shows the performance in the complexes with differenttypes of DNA.
Functional classification of protein–DNA complexes
We have classified the protein–DNA complexes based ontheir functions and are mainly under three categories,namely, enzymes, regulatory and structural proteins.
The enzymes are classified into 17 groups, which haveone to 52 protein–DNA complexes. The sensitivity, speci-ficity and accuracy of the best methods in each group ofenzymes are presented in Supplementary Table S7. Wenoticed that none of the prediction methods worked wellin 13 of the 17 groups. Only four groups of enzymes,kinase, phosphatase, recombinase invertase and recombin-ase resolvase are predicted well with the accuracy of
>80%. DNA endonuclease is a major group of enzymeswith 52 complexes, and the prediction accuracy is 71%with the sensitivity of 63% and specificity of 78%. Forthe class of rare enzymes with only one complex, theaccuracy varies from poor to good. The excellent perform-ance of several methods in these enzymes might be due tothe presence of these proteins in the training set of theirrespective methods. In contrast, DNA reverse transcript-ase has two proteins, and the performance is poor inall the methods; the highest accuracy is 59.4% with thesensitivity of 39.4%. DNA polymerase with 17 samples ispredicted poorly with the accuracy of 66%.Regulatory proteins are classified into 13 groups with
149 chains and the accuracy of different methods lies inthe range of 60–80% (Supplementary Table S7). Furtherinspection of Supplementary Table S7 shows that fewclasses of regulatory proteins such as DNA repair repres-sor, transcription factor co-activator and transcriptionfactor termination have poor performance to identify thebinding site residues with high sensitivity; the sensitivity is33–46%.Considering the structural proteins, the average accuracy
is in the range of 65–78% for the 19 DNA-binding proteinsin this data set. In this group of proteins, we noticed abalance between sensitivity and specificity in most of themethods. Further, one of the poorly performed methods,NAPS showed the best performance in viral coat protein.
General trends on different prediction methods
In addition, we have evaluated the performance of differ-ent prediction methods using two independent sets of testdata: (i) using the protein–DNA complex structures de-posited recently (since June 2011) and (ii) the structures,which were not used in individual methods for developingthe respective algorithm. The results obtained with thesetwo sets of data are presented in Table 4. We observedthat the balance between sensitivity and specificity liesin the range of 60–70% in most of the methods forboth the data sets. However, the accuracy is >75% in
Figure 2. Performance of prediction methods in 15 different types of DNA binding motifs. Number of motifs, which are predicted with thesensitivity and specificity of >60% each in all considered methods are shown.
Nucleic Acids Research, 2013, Vol. 41, No. 16 7611
Downloaded from https://academic.oup.com/nar/article-abstract/41/16/7606/2411037by gueston 12 February 2018
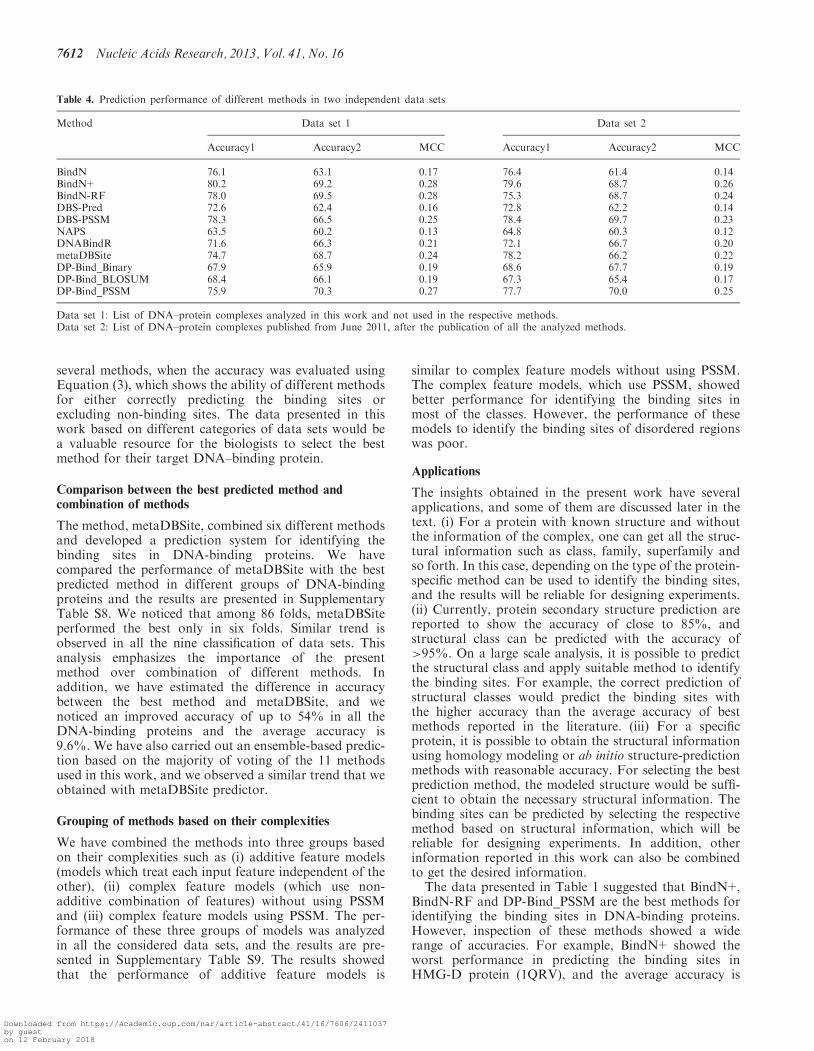
several methods, when the accuracy was evaluated usingEquation (3), which shows the ability of different methodsfor either correctly predicting the binding sites orexcluding non-binding sites. The data presented in thiswork based on different categories of data sets would bea valuable resource for the biologists to select the bestmethod for their target DNA–binding protein.
Comparison between the best predicted method andcombination of methods
The method, metaDBSite, combined six different methodsand developed a prediction system for identifying thebinding sites in DNA-binding proteins. We havecompared the performance of metaDBSite with the bestpredicted method in different groups of DNA-bindingproteins and the results are presented in SupplementaryTable S8. We noticed that among 86 folds, metaDBSiteperformed the best only in six folds. Similar trend isobserved in all the nine classification of data sets. Thisanalysis emphasizes the importance of the presentmethod over combination of different methods. Inaddition, we have estimated the difference in accuracybetween the best method and metaDBSite, and wenoticed an improved accuracy of up to 54% in all theDNA-binding proteins and the average accuracy is9.6%. We have also carried out an ensemble-based predic-tion based on the majority of voting of the 11 methodsused in this work, and we observed a similar trend that weobtained with metaDBSite predictor.
Grouping of methods based on their complexities
We have combined the methods into three groups basedon their complexities such as (i) additive feature models(models which treat each input feature independent of theother), (ii) complex feature models (which use non-additive combination of features) without using PSSMand (iii) complex feature models using PSSM. The per-formance of these three groups of models was analyzedin all the considered data sets, and the results are pre-sented in Supplementary Table S9. The results showedthat the performance of additive feature models is
similar to complex feature models without using PSSM.The complex feature models, which use PSSM, showedbetter performance for identifying the binding sites inmost of the classes. However, the performance of thesemodels to identify the binding sites of disordered regionswas poor.
Applications
The insights obtained in the present work have severalapplications, and some of them are discussed later in thetext. (i) For a protein with known structure and withoutthe information of the complex, one can get all the struc-tural information such as class, family, superfamily andso forth. In this case, depending on the type of the protein-specific method can be used to identify the binding sites,and the results will be reliable for designing experiments.(ii) Currently, protein secondary structure prediction arereported to show the accuracy of close to 85%, andstructural class can be predicted with the accuracy of>95%. On a large scale analysis, it is possible to predictthe structural class and apply suitable method to identifythe binding sites. For example, the correct prediction ofstructural classes would predict the binding sites withthe higher accuracy than the average accuracy of bestmethods reported in the literature. (iii) For a specificprotein, it is possible to obtain the structural informationusing homology modeling or ab initio structure-predictionmethods with reasonable accuracy. For selecting the bestprediction method, the modeled structure would be suffi-cient to obtain the necessary structural information. Thebinding sites can be predicted by selecting the respectivemethod based on structural information, which will bereliable for designing experiments. In addition, otherinformation reported in this work can also be combinedto get the desired information.
The data presented in Table 1 suggested that BindN+,BindN-RF and DP-Bind_PSSM are the best methods foridentifying the binding sites in DNA-binding proteins.However, inspection of these methods showed a widerange of accuracies. For example, BindN+ showed theworst performance in predicting the binding sites inHMG-D protein (1QRV), and the average accuracy is
Table 4. Prediction performance of different methods in two independent data sets
Method Data set 1 Data set 2
Accuracy1 Accuracy2 MCC Accuracy1 Accuracy2 MCC
BindN 76.1 63.1 0.17 76.4 61.4 0.14BindN+ 80.2 69.2 0.28 79.6 68.7 0.26BindN-RF 78.0 69.5 0.28 75.3 68.7 0.24DBS-Pred 72.6 62.4 0.16 72.8 62.2 0.14DBS-PSSM 78.3 66.5 0.25 78.4 69.7 0.23NAPS 63.5 60.2 0.13 64.8 60.3 0.12DNABindR 71.6 66.3 0.21 72.1 66.7 0.20metaDBSite 74.7 68.7 0.24 78.2 66.2 0.22DP-Bind_Binary 67.9 65.9 0.19 68.6 67.7 0.19DP-Bind_BLOSUM 68.4 66.1 0.19 67.3 65.4 0.17DP-Bind_PSSM 75.9 70.3 0.27 77.7 70.0 0.25
Data set 1: List of DNA–protein complexes analyzed in this work and not used in the respective methods.Data set 2: List of DNA–protein complexes published from June 2011, after the publication of all the analyzed methods.
7612 Nucleic Acids Research, 2013, Vol. 41, No. 16
Downloaded from https://academic.oup.com/nar/article-abstract/41/16/7606/2411037by gueston 12 February 2018

35%. On the other hand, BindN-RF showed the bestperformance with an accuracy of 87% in this protein.BindN-RF showed an accuracy of 67% in T4 phagebeta-glucosyltransferase (1M5R), whereas DNABindRperformed well with an accuracy of 85%. The accuracyis 31% in centromere-binding protein using DP-Bind_PSSM, and BindN-RF could predict with the highestaccuracy of 55%, which requires further improvement.These data demonstrated the necessity of selectingmethods for efficient prediction and the requirement ofimprovements in specific proteins.
Online tool for the correspondence between protein/DNAtype and the best method
We have developed a web server to provide the bestmethod for any type of protein/DNA-based on its class,fold, family, superfamily, motif, function, single/double-stranded DNA and DNA conformation. It takes the struc-tural/function information of protein/DNA and displaysthe best method in the output. The web server is freelyavailable at http://www.biotech.iitm.ac.in/DNA-protein/.
CONCLUSIONS
Selecting the best method for identifying the binding sitesin DNA-binding proteins is one of the immediate require-ments for biologists to design experiments. We have ad-dressed this problem by carefully analyzing the availableprediction methods using nine different types of data setsbased on structural information, motifs, DNA types andfunctional information. The one-to-one correspondencebetween the subclass of DNA-binding proteins and best/worst prediction method are given for all the studied datasets. These information would be highly valuable to selectthe best method for understanding the recognition mech-anism for specific proteins as well as massive analysis withlarge data sets.
SUPPLEMENTARY DATA
Supplementary Data are available at NAR Online:Supplementary Tables 1–9.
ACKNOWLEDGEMENTS
The authors thank the reviewers for their constructivecomments. The authors wish to thank Professor SandorPongor for helpful discussions. R.N. and M.M.G. thankthe Bioinformatics facility of Department ofBiotechnology and Indian Institute of TechnologyMadras for computational facilities. We thank OxfordUniversity Press for partially waiving the publicationcharges.
FUNDING
DST grant, Government of India [SR/SO/BB-0036/2011]and an ICGEB short-term visiting fellowship (toM.M.G.). Funding for open access charge: Departmentof Science and Technology, Government of India
research grant (partial); Oxford University Press (partialwaiver).
Conflict of interest statement. None declared.
REFERENCES
1. Prabakaran,P., An,J., Gromiha,M.M., Selvaraj,S., Uedaira,H.,Kono,H. and Sarai,A. (2001) Thermodynamic database forprotein-nucleic acid interactions (ProNIT). Bioinformatics, 17,1027–1034.
2. Berman,H.M., Kleywegt,G.J., Nakamura,H. and Markley,J.L.(2012) The protein data bank at 40: reflecting on the past toprepare for the future. Structure, 20, 391–396.
3. Sarai,A. and Kono,H. (2005) Protein-DNA recognition patternsand predictions. Annu. Rev. Biophys. Biomol. Struct., 34, 379–398.
4. Hogan,M.E. and Austin,R.H. (1987) Importance of DNAstiffness in protein-DNA binding specificity. Nature, 329, 263–266.
5. Gromiha,M.M., Munteanu,M.G., Simon,I. and Pongor,S. (1997)The role of DNA bending in Cro protein-DNA interactions.Biophys. Chem., 69, 153–160.
6. Olson,W.K., Gorin,A.A., Lu,X.J., Hock,L.M. and Zhurkin,V.B.(1998) DNA sequence-dependent deformability deduced fromprotein-DNA crystal complexes. Proc. Natl Acad. Sci. USA, 95,11163–11168.
7. Gromiha,M.M. (2005) Influence of DNA stiffness in protein-DNA recognition. J. Biotechnol., 117, 137–145.
8. Mandel-Gutfreund,Y. and Margalit,H. (1998) Quantitativeparameters for amino acid-base interaction: implications forprediction of protein-DNA binding sites. Nucleic Acids Res., 26,2306–2312.
9. Mandel-Gutfreund,Y., Margalit,H., Jernigan,R.L. andZhurkin,V.B. (1998) A role for CH·O interactions in protein-DNA recognition. J. Mol. Biol., 277, 1129–1140.
10. Nadassy,K., Wodak,S.J. and Janin,J. (1999) Structural features ofprotein-nucleic acid recognition sites. Biochemistry, 38, 1999–2017.
11. Jones,S., van Heyningen,P., Berman,H.M. and Thornton,J.M.(1999) Protein-DNA interactions: a structural analysis. J. Mol.Biol., 287, 877–896.
12. Jayaram,B., McConnell,K., Dixit,S.B., Das,A. and Beveridge,D.L.(2002) Free-energy component analysis of 40 protein-DNAcomplexes: a consensus view on the thermodynamics of bindingat the molecular level. J. Comput. Chem., 23, 1–14.
13. Gromiha,M.M., Siebers,J.G., Selvaraj,S., Kono,H. and Sarai,A.(2004) Intermolecular and intramolecular readout mechanisms inprotein-DNA recognition. J. Mol. Biol., 337, 285–294.
14. Lejeune,D., Delsaux,N., Charloteaux,B., Thomas,A. andBrasseur,R. (2005) Protein-nucleic acid recognition: statisticalanalysis of atomic interactions and influence of DNA structure.Proteins, 61, 258–271.
15. Yamasaki,S., Terada,T., Kono,H., Shimizu,K. and Sarai,A. (2012)A new method for evaluating the specificity of indirect readout inprotein-DNA recognition. Nucleic Acids Res., 40, e129.
16. Bouvier,B., Zakrzewska,K. and Lavery,R. (2011) Protein-DNArecognition triggered by a DNA conformational switch. Angew.Chem. Int. Ed. Engl., 50, 6516–6518.
17. Fuxreiter,M., Simon,I. and Bondos,S. (2011) Dynamicprotein-DNA recognition: beyond what can be seen. TrendsBiochem. Sci., 36, 415–423.
18. Kolomeisky,A.B. (2011) Physics of protein-DNA interactions:mechanisms of facilitated target search. Phys. Chem. Chem. Phys.,13, 2088–2095.
19. Zou,X., Ma,W., Solov’yov,I.A., Chipot,C. and Schulten,K. (2011)Recognition of methylated DNA through methyl-CpG bindingdomain proteins. Nucleic Acids Res., 40, 2747–2758.
20. Zahran,M., Daidone,I., Smith,J.C. and Imhof,P. (2010)Mechanism of DNA recognition by the restriction enzymeEcoRV. J. Mol. Biol., 401, 415–432.
21. Gromiha,M.M. and Fukui,K. (2011) Scoring function basedapproach for locating binding sites and understanding therecognition mechanism of protein-DNA complexes. J. Chem. Inf.Model., 51, 721–729.
Nucleic Acids Research, 2013, Vol. 41, No. 16 7613
Downloaded from https://academic.oup.com/nar/article-abstract/41/16/7606/2411037by gueston 12 February 2018

22. Ahmad,S., Keskin,O., Sarai,A. and Nussinov,R. (2008)Protein-DNA interactions: structural, thermodynamic andclustering patterns of conserved residues in DNA-bindingproteins. Nucleic Acids Res., 36, 5922–5932.
23. Rohs,R., West,S.M., Sosinsky,A., Liu,P., Mann,R.S. andHonig,B. (2009) The role of DNA shape in protein-DNArecognition. Nature, 461, 1248–1253.
24. Zhou,P., Tian,P., Ren,Y., Zou,J. and Shang,Z. (2010) Systemicclassification and analysis of themes in protein-DNA recognition.J. Chem. Inf. Model., 50, 1476–1488.
25. Pabo,C.O. and Nekludova,L. (2000) Geometric analysis andcomparison of protein-DNA interfaces: why is there no simplecode for recognition? J. Mol. Biol., 301, 597–624.
26. Prabakaran,P., Siebers,J.G., Ahmad,S., Gromiha,M.M.,Singarayan,M.G. and Sarai,A. (2006) Classification ofprotein-DNA complexes based on structural descriptors.Structure, 14, 1355–1367.
27. Cherstvy,A.G. (2011) Electrostatic interactions in biologicalDNA-related systems. Phys. Chem. Chem. Phys., 13, 9942–9968.
28. Mirny,L.A. and Gelfand,M.S. (2002) Structural analysis ofconserved base pairs in protein-DNA complexes. Nucleic AcidsRes., 30, 1704–1711.
29. Oda,M. and Nakamura,H. (2000) Thermodynamic and kineticanalyses for understanding sequence-specific DNA recognition.Genes Cell, 5, 319–326.
30. Wintjens,R., Lievin,J., Rooman,M. and Buisine,E. (2000)Contribution of cation-pi interactions to the stability ofprotein-DNA complexes. J. Mol. Biol., 302, 395–410.
31. Rooman,M., Lievin,J., Buisine,E. and Wintjens,R. (2002)Cation-pi/H-bond stair motifs at protein-DNA interfaces. J. Mol.Biol., 319, 67–76.
32. Gromiha,M.M., Santhosh,C. and Suwa,W. (2004) Influence ofCation-pi Interactions in Protein-DNA Complexes. Polymer, 45,633–639.
33. Kono,H. and Sarai,A. (1999) Structure-based prediction of DNAtarget sites by regulatory proteins. Proteins, 35, 114–131.
34. Donald,J.E., Chen,W.W. and Shakhnovich,E.I. (2007) Energeticsof protein-DNA interactions. Nucleic Acids Res., 35, 1039–1047.
35. The UniProt Consortium. (2012) Reorganizing the protein spaceat the Universal Protein Resource (UniProt). Nucleic Acids Res.,40, D71–D75.
36. Breiman,L. (2001) Random forests. Mach. Learn., 45, 5–32.37. Ahmad,S., Gromiha,M.M. and Sarai,A. (2004) Analysis and
Prediction of DNA-binding proteins and their binding residuesbased on composition, sequence and structure information.Bioinformatics, 20, 477–486.
38. Ahmad,S. and Sarai,A. (2005) PSSM based prediction ofDNA-binding sites in proteins. BMC Bioinformatics, 6, 33.
39. Wang,L. and Brown,S.J. (2006) BindN: a web-based tool forefficient prediction of DNA and RNA binding sites in amino acidsequences. Nucleic Acids Res., 34, W243–W248.
40. Kuznetsov,I.B., Gou,Z., Li,R. and Hwang,S. (2006) Usingevolutionary and structural information to predict DNA-bindingsites on DNA-binding proteins. Proteins, 64, 19–27.
41. Ofran,Y., Mysore,V. and Rost,B. (2007) Prediction ofDNA-binding residues from sequence. Bioinformatics, 23,i347–i353.
42. Ho,S.Y., Yu,F.C., Chang,C.Y. and Huang,H.L. (2007) Design ofaccurate predictors for DNA-binding sites in proteins usinghybrid SVM-PSSM method. Biosystems, 90, 234–241.
43. Bhardwaj,N. and Lu,H. (2007) Residue-level prediction ofDNA-binding sites and its application on DNA-binding proteinpredictions. FEBS Lett., 581, 1058–1066.
44. Wu,J., Liu,H., Duan,X., Ding,Y., Wu,H., Bai,Y. and Sun,X.(2009) Prediction of DNA-binding residues in proteins fromamino acid sequences using a random forest model with a hybridfeature. Bioinformatics, 25, 30–35.
45. Xu,B., Yang,Y., Liang,H. and Zhou,Y. (2009) An all-atomknowledge-based energy function for protein-DNA threading,docking decoy, discrimination, and prediction of transcription-factor binding profiles. Proteins, 76, 718–730.
46. Wang,L., Yang,M.Q. and Yang,J.Y. (2009) Prediction ofDNA-binding residues from protein sequence information usingrandom forests. BMC Genomics, 10, S1.
47. Wang,L., Huang,C., Yang,M.Q. and Yang,J.Y. (2010) BindN+for accurate prediction of DNA and RNA-binding residues fromprotein sequence features. BMC Systems Biol., 4, S3.
48. Hwang,S., Gou,Z. and Kuznetsov,I.B. (2007) DP-Bind: a webserver for sequence-based prediction of DNA-binding residues inDNA-binding proteins. Bioinformatics, 23, 634–636.
49. Yan,C., Terribilini,M., Wu,F., Jernigan,R., Dobbs,D. andHonavar,V. (2006) Predicting DNA-binding sites of proteins fromamino acid sequence. BMC Bioinformatics, 7, 262.
50. Carson,M.B., Langlois,R. and Lu,H. (2010) NAPS: a residue-levelnucleic acid-binding prediction server. Nucleic Acids Res., 38,W431–W435.
51. Si,J., Zhang,Z., Lin,B., Schroeder,M. and Huang,B. (2011)metaDBSite: a meta approach to improve protein DNA-bindingsite prediction. BMC Syst. Biol., 5, S7.
52. Murzin,A.G., Brenner,S.E., Hubbard,T. and Chothia,C. (1995)SCOP: a structural classification of proteins database for theinvestigation of sequences and structures. J. Mol. Biol., 247,536–540.
53. Berman,H.M., Olson,W.K., Beveridge,D.L., Westbrook,J.,Gelbin,A., Demeny,T., Hsieh,S.-H., Srinivasan,A.R. andSchneider,B. (1992) The Nucleic Acid Database: AComprehensive Relational Database of Three-DimensionalStructures of Nucleic Acids. Biophys. J., 63, 751–759.
54. Norambuena,T. and Melo,F. (2010) The Protein-DNA Interfacedatabase. BMC Bioinformatics, 11, 262.
55. Shanahan,H.P., Garcia,M.A., Jones,S. and Thornton,J.M. (2004)Identifying DNA-binding proteins using structural motifs and theelectrostatic potential. Nucleic Acids Res., 32, 4732–4741.
56. Bourne,P.E. and Desai,N. (1987) PRONUC: a software packagefor the analysis of protein and nucleic acid sequences. ComputMethods Programs Biomed., 24, 27–36.
57. Gromiha,M.M. and Nagarajan,R. (2013) Computationalapproaches for predicting the binding sites and understanding therecognition mechanism of protein-DNA complexes. Adv. Prot.Chem. Str. Biol., 91, 65–99.
58. Tjong,H. and Zhou,H.-X. (2007) DISPLAR: an accurate methodfor predicting DNA-binding sites on protein surfaces. NucleicAcids Res., 35, 1465–1477.
59. Gromiha,M.M. (2010) Protein Bioinformatics: From Sequence toFunction. Elsevier Publishers, New Delhi.
60. Gromiha,M.M. and Selvaraj,S. (1998) Protein secondary structureprediction in different structural classes. Protein Eng., 11,249–251.
61. Murvai,J., Vlahovicek,K. and Pongor,S. (2000) A simpleprobabilistic scoring method for protein domain identification.Bioinformtics, 16, 1155–1156.
7614 Nucleic Acids Research, 2013, Vol. 41, No. 16
Downloaded from https://academic.oup.com/nar/article-abstract/41/16/7606/2411037by gueston 12 February 2018