novel adsorbents for acid gas treatment in process streams
TRANSCRIPT

Novel Adsorbents for Acid Gas Treatment in
Process Streams
by
Sabereh Rezaei
A thesis submitted in partial fulfillment of the requirements for the degree of
Doctor of Philosophy
in
Chemical Engineering
Department of Chemical and Materials Engineering
University of Alberta
©Sabereh Rezaei, 2015

ii
Abstract
The objective of this dissertation was to find novel adsorbents addressing
problems associated with acid gases. They are the most common contaminants in
multiple aspects of petroleum processing and combustion gas clean up, which
reduce the efficiency of petroleum refining and product quality. This refers to any
gas stream containing significant amount of acidic gases such as hydrogen sulfide
(H2S) or carbon dioxide (CO2).
Engelhard Titanosilicate-2 (ETS-2) has shown to be a promising substrate to load
active metal sites for deep H2S removal (to sub-ppm levels) for gas purification
applications at room temperature. Because of the high external surface area and
the cation exchange capacity of ETS-2, active sites can be highly dispersed and
very accessible to H2S molecules making it a novel support material for active
metal sites. Copper supported ETS-2 has been found to be a superior H2S
scavenger, outperforming the Ag, Ca, and Zn exchanged ETS-2 and a fully
developed commercial H2S adsorbent (BASF). A dynamic model based on the
rigorous mass balance equations applied to the fixed-bed has analyzed H2S
column breakthrough experiments. Temperature-programmed desorption tests
provided insight on the material characterization as well as on the relative
magnitudes of the H2S-material interactions. Sorption capacity of ETS-2 for Cu2+
ions from aqueous solution through the batch technique was also investigated. It

iii
was experimentally shown that ion exchange is the major removal mechanism and
up to 99% copper removal was achieved.
Low energy input regenerable moisture removal from CO2 streams, which would
be generated from a post-combustion capture (PCC) system, has been also
studied. A desired desiccant for CO2 drying should have a high moisture capacity
at low partial pressure and high selectivity to provide through drying. It also needs
to be economically efficient by being regenerable with waste heat and humid air.
Engelhard Titanosilicate-10 (ETS-10) materials have been shown to reserve all of
these characteristics. Ca-ETS-10 showed the highest moisture capacity for a
temperature swing of 30-70 °C and a CO2 feed stream of 50–100% relative
humidity compared to that of commercial silica and 4A zeolite.

iv
Preface
Chapter 3 of this thesis, with minor modification, is published in Ind. Eng. Chem.
Res. 2012, 51, 12430−12434; coauthored by Sabereh Rezaei, Aida Tavana, James
A. Sawada, Lan Wu, Abu S.M. Junaid and Steven M. Kuznicki. I was responsible
for the data collection and analysis as well as the manuscript composition and
edit. Aida Tavana assisted with the data collection, analysis and the first draft of
the manuscript. James A. Sawada assisted with the manuscript edits. Lan Wu
assisted with the synthesis part. Abu S.M. Junaid assisted with the data analysis.
Steven M. Kuznicki was the supervisory author and was involved with concept
formation.
Chapter 4 of this thesis, with minor modification, is published in Chem. Eng. Sci.
2015, 123, 444–449; coauthored by Sabereh Rezaei, Maria Ophelia D. Jarligo,
Lan Wu and Steven M. Kuznicki. I was responsible for the data collection and
analysis as well as the manuscript composition and edits. Maria Ophelia D.
Jarligo contributed with the manuscript edits. Lan Wu assisted with the synthesis
part. Steven M. Kuznicki was the supervisory author and was involved with
concept formation.
Chapter 5 and 6 of this thesis are being prepared for submission for publication.
Chapter 5 is coauthored by Sabereh Rezaei, Adolfo M. Avila and Steven M.

v
Kuznicki. I was responsible for the data collection, analysis and modeling as well
as the manuscript composition. Adolfo M. Avila contributed in the modeling part
manuscript composition. Steven M. Kuznicki was the supervisory author and was
involved with concept formation. Chapter 6 is coauthored by Sabereh Rezaei and
Steven M. Kuznicki. I was responsible for the data collection, analysis and the
manuscript composition. Steven M. Kuznicki was the supervisory author and was
involved with concept formation.
Chapter 7 of this thesis, with minor modification, is published in Sep. Purif.
Technol. 120 (2013) 354–361; collaborated by Brenden Tanchuk and James A.
Sawada, Sabereh Rezaei and Steven M. Kuznicki. The whole set up was designed
by the first three authors for the first time. Brenden Tanchuk (Msc in Chemical
Engineering) was responsible for building the set up and commissioning tests
under James A. Sawada (Lab Manager University of Alberta) supervision and
help. I was responsible for adsorption synthesis and adsorption experiments. The
first three authors had equal contributions in the data interpretation part. Steven
M. Kuznicki was the supervisory author and was involved with concept
formation.

vi
To my beloved parents and my dear brother
for their incessant love and support

vii
Acknowledgements
First and above all I would like to express my wholehearted gratitude to God, the
Almighty, for his countless mercy and showers of blessings in every aspect of my
life. It is very hard to escape the feeling of God’s existence in the science that is
studied and learned.
I would like to express my sincere appreciation to my supervisor Prof. Steven
Kuznicki, for his inspiring guidance, encouragement and support during my
studies at the University of Alberta. Being in a big research group under his
supervision enabled me to collaborate with different people.
I would also like to thank my dissertation committee, Prof. Rajender Gupta, Dr.
Zaher Hashisho, Prof. William McCaffrey, Dr. Larry Unsworth and Prof. Michael
Tsapatsis, for their valuable time and helpful comments.
My PhD oral defense was not possible without the kind assistance of Artin Afaqan
when the session had conflict with my TA sessions.
I give especial thanks to Dr. Adolfo Avila for his support, inspiring guidance and
valuable time he devoted to my research. My journey would not have been what it
was without him.

viii
Weizhu An (The Lab’s Mom) for her assistance and valuable advices, Dr. James
Sawada for his guidance and valuable comments and Dr. Maria Ophelia Jarligo
for her support and follow ups. Dr. Tanya Kuznicki and Albana Zeko, for their
assistance in technical writing and manuscript development and Dr. Amy
Dambrowitz, for her kindness in talking with me whenever I faced challenges at
school. Lan Wu, Tong Qiu, and the rest of my research group (current and
former) for their general contributions and perspectives.
Dr. Arvind Rajendran and Dr. Abolfazl Noorjahan for their guidance regarding
the chemisorption part and breakthrough modeling respectively.
Marion Pritchard and Lily Laser, at administration section of the department,
Kevin Heidebrecht, at purchasing & facilities administration, Dimitre Karpuzov,
at Alberta Centre for Surface Engineering and Science, Les Dean, at the
department instrument shop, Paul Concepcion, at the National Institute for
Nanotechnolgy and Chen Guangcheng at Earth & Atmospheric Sciences for their
kind and valuable help and support during these years.
Leila Zargarzadeh for sharing a very helpful template Word file and Maedeh
Roodpeyma for her kind and valuable comments, and above all for our
memorable friendship.
All my wonderful friends especially Maryam Kahjehpour, Marzie Derakhshesh,
Fatemeh Eslami and Neda Afsham. I am honoured of their amazing friendship
and extraordinary supports.

ix
And a very special thank you to my family. Words cannot express how grateful I
am to my beloved mother, Zahra, and father, Mohammad Javad, for all of the
sacrifices that they have made on my behalf. I am really proud of them and I will
never forget the values they have taught me. I am forever indebted to them for
their endless patience and encouragement. I am also grateful to my dear brother,
Mohammad Hosein, who has always supported and encouraged me. My program
was a collaborative effort with my family's love, constant prayers and support far
away from home.
Finally financial support from Helmholtz Alberta Initiative (S.M.K.) is gratefully
acknowledged.
Sabereh Rezaei
March 2015

x
Table of Contents
1. Introduction ............................................................................................. 1
1.1. Synopsis ...................................................................................................... 1
1.2. The Necessity of Acid gas Removal ............................................................... 2
1.2.1. Hydrogen sulfide removal ................................................................................ 5
1.2.2. Drying of CO2 Streams ...................................................................................... 7
1.3. Framework of the Study ............................................................................. 11
1.4. References ................................................................................................. 12
2. Literature background ............................................................................ 20
2.1. Summary ................................................................................................... 20
2.2. The concept and fundamentals of adsorption ............................................. 21
2.2.1. Adsorption forces ........................................................................................... 22
2.2.2. Dissociative chemisorption ............................................................................ 25
2.2.3. Potential energy curve ................................................................................... 25
2.3. Adsorption equilibrium .............................................................................. 27
2.4. Adsorption Kinetics .................................................................................... 34
2.5. Adsorption Dynamics ................................................................................. 38
2.5.1. Pressure drop ................................................................................................. 40
2.6. Chemical active surfaces ............................................................................ 40
2.6.1. Shrink core model .......................................................................................... 42
2.6.2. Deactivation of active sites on the solid surface ............................................ 46
xi
2.7. Adsorption techniques for acid gas removal ............................................... 47
2.7.1. H2S dissociation on metal activated surfaces ................................................. 47
2.7.2. Effective regenerable moisture removal ........................................................ 48
2.8. Conclusions................................................................................................ 51
2.9. References ................................................................................................. 51
3. A novel copper-exchanged titanosilicate adsorbent for low temperature
H2S removal .................................................................................................. 56
3.1. Summary ................................................................................................... 56
3.2. Introduction .............................................................................................. 57
3.3. Materials and Methods .............................................................................. 60
3.3.1. Adsorbent preparation ................................................................................... 60
3.3.2. Adsorption experiments ................................................................................. 61
3.3.3. Characterization tests .................................................................................... 62
3.4. Results and discussion ................................................................................ 64
3.4.1. Characterization of Cu-ETS-2 before H2S exposure ........................................ 64
3.4.2. Adsorption tests ............................................................................................. 71
3.5. Conclusions................................................................................................ 75
3.6. References ................................................................................................. 76
4. Breakthrough Performances of Metal-Exchanged Nanotitanate ETS-2
Adsorbents for Room Temperature Desulfurization ....................................... 78
4.1. Summary ................................................................................................... 78
4.2. Introduction .............................................................................................. 79
4.3. Experimental ............................................................................................. 81

xii
4.3.1. Preparation of the precursor ......................................................................... 81
4.4. Adsorption tests ........................................................................................ 82
4.4.1. Microstructure characterization .................................................................... 83
4.5. Results ....................................................................................................... 84
4.5.1. H2S breakthrough performance ..................................................................... 84
4.5.2. Phase formation and morphology ................................................................. 85
4.6. Discussion .................................................................................................. 91
4.7. Conclusions................................................................................................ 95
4.8. References ................................................................................................. 96
5. Chemisorption of H2S on Copper-ETS-2 packed-column: experiment and
modeling ....................................................................................................... 99
5.1. Summary ................................................................................................... 99
5.2. Introduction ............................................................................................ 100
5.3. Experimental ........................................................................................... 102
5.3.1. Materials ...................................................................................................... 102
5.3.2. Adsorption tests ........................................................................................... 102
5.4. Mass transport model for the H2S breakthrough simulation ...................... 105
5.4.1. System modeling .......................................................................................... 105
5.4.2. Numerical resolution .................................................................................... 109
5.4.3. Mass balance for the breakthrough / desorption dynamics ........................ 109
5.5. Results and discussion .............................................................................. 111
5.5.1. H2S breakthrough concentration profiles on Copper-ETS-2 ........................ 111
5.5.2. Desorption experiments of H2S on spent Cu-ETS-2 ...................................... 117
xiii
5.6. Conclusions.............................................................................................. 120
5.7. References ............................................................................................... 120
6. Adsorption Behaviour of Cu(II) onto Nano-titanate ETS-2 ...................... 126
6.1. Summary ................................................................................................. 126
6.2. Introduction ............................................................................................ 127
6.3. Experimental ........................................................................................... 129
6.3.1. ETS-2 adsorbent ........................................................................................... 129
6.3.2. Characterization tests .................................................................................. 129
6.3.3. Batch adsorption experiments ..................................................................... 130
6.4. Results and Discussion ............................................................................. 131
6.4.1. Characterization of ETS-2 adsorbent and spent sample .............................. 131
6.4.2. Effect of pH ................................................................................................... 138
6.4.3. Mechanism of Cu ions adsorption ................................................................ 140
6.5. Conclusions.............................................................................................. 141
6.6. References ............................................................................................... 141
7. Low Temperature Regenerable ETS-10 Titanosilicate Desiccants for Carbon
Dioxide Drying ............................................................................................. 145
7.1. Summary ................................................................................................. 145
7.2. Introduction ............................................................................................ 146
7.3. Materials and Methods ............................................................................ 149
7.3.1. Adsorbent Preparation ................................................................................. 149
7.3.2. Characterization tests .................................................................................. 151
7.3.3. Experimental Apparatus ............................................................................... 152

xiv
7.3.4. Breakthrough experiments .......................................................................... 156
7.4. Results and Discussion ............................................................................. 157
7.4.1. Characterization of the adsorbent samples ................................................. 157
7.4.2. Moisture Breakthrough Capacities............................................................... 161
7.4.3. CO2 Recovery ................................................................................................ 166
7.5. Conclusions.............................................................................................. 168
7.6. References ............................................................................................... 168
8. Conclusions and Recommendations ...................................................... 173
8.1. General Conclusions ................................................................................. 173
8.2. Recommendations for future work ........................................................... 175
8.3. References ............................................................................................... 176
Bibliography ……………..…………………………………………………………………………………………177
Appendix A ………………….………………………………………………….……………………………………203

xv
List of Tables
Table 2- 1 Typical characteristics of physical and chemical adsorbents [6, 14]. .........................24
Table 2- 2 Quantum-chemical calculations of the thermodynamic parameters of the sequential
stages of the catalytic hydrogen sulfide decomposition at room temperature [36, 38]. ...49
Table 3- 1 Elemental ratios derived from EDX analysis results for Cu-ETS-2………………………..……66
Table 3- 2 TEM/SAED survey of Cu-ETS-2 samples activated at different temperatures. ...........69
Table 3- 3 Specific surface area of ETS-2, Cu-ETS-2 and commercial samples ............................70
Table 3- 4 Cu-ETS-2, Cu-ETS-4 and Cu-ETS-10 breakthrough capacities and copper utilizations .72
Table 3- 5 Cu-ETS-2 versus commercial samples ........................................................................74
Table 4- 1 External surface area of different ion-exchanged forms of ETS-2 and a commercial
sample R3-11G……………………………………………………………………………………………………………………….87
Table 4- 2 Elemental analysis derived from EDX results for different adsorbents. .....................88
Table 5- 1 Packed-bed properties and operation conditions………………………………………………….104
Table 5- 2 Henry’s law constant at different temperatures. .................................................... 114
Table 5- 3 Kinetics and deactivation parameters of Cu-ETS-2 at 25°C, 100°C and 250°C........... 114
Table 6- 1 Elemental composition of ETS-2 obtained by EDX…………………………………………..…….133
Table 6- 2 Quantification results by XPS on ETS-2. ................................................................... 136
Table 6- 3 Concentration (ppm) of different ions during the copper exchange process ........... 137
Table 6- 4 The content of different elements in Cu-ETS-2 by EDX ............................................ 137
Table 7- 1 Atomic ratios of various ETS-10 samples calculated from EDX results…………………..159
Table 7- 2 Surface areas and pore volumes of the adsorbent samples .................................... 160
Table 7- 3 Moisture breakthrough capacities of the tested adsorbents at different CO2 feed
stream humidities .......................................................................................................... 161
xvi
List of Figures
Figure 1- 1 Challenges of this research are highlighted ..............................................................10
Figure 2- 1 Typical potential energy curve for a dissociative chemisorption of a diatomic
molecule [8]. .............................................................................................................................26
Figure 2- 2 The adsorption isotherms classification [21]. ...........................................................32
Figure 2- 3 A schematic for the adsorptive molecules on a solid surface at different pressure. .33
Figure 2- 4 Contact of a fluid phase and a porous adsorbent showing some of the possible
mechanism [23]. ..............................................................................................................35
Figure 2- 5 Boundary layer around the surface of an adsorbent pellet. .....................................37
Figure 2- 6 Schematic image of a preloaded adsorbent. ............................................................41
Figure 2- 7 Shrinking unreacted-core model [29]. ......................................................................42
Figure 2- 8 Regions of mass transfer–limited and reaction–limited reactions [31]. ...................46
Figure 2- 9 Adsorption equilibrium isotherms for moisture on three commercial adsorbents:
pelletized 4A zeolite (solid line), silica gel (dashed line), and a typical activated alumina
(dot dashed line) [6]. ........................................................................................................50
Figure 3- 1 TEM images of ETS-2 (a) and Cu-ETS-2 (b) ................................................................66
Figure 3- 2 XRD patterns of ETS-2 and as-prepared Cu-ETS-2 .....................................................67
Figure 3- 3 XRD patterns of Cu-ETS-2 activated at different temperatures ................................68
Figure 3- 4 Comparison of the breakthrough times for 50 mg of Cu-ETS-2 and commercial H2S
adsorbents .......................................................................................................................73
Figure 3- 5 Breakthrough capacity of Cu-ETS-2 activated at different temperatures..................75
Figure 4- 1 H2S breakthrough profiles of different tested adsorbents. .......................................85
Figure 4- 2 XRD patterns for different ion exchanged forms of ETS-2. .......................................86
Figure 4- 3 SEM images for: a) Na-ETS-2 and b) Cu, Ag, Zn and Ca-ETS-2. ..................................89

xvii
Figure 4- 4 Metal dispersion on Cu, Ag, Zn and Ca-ETS-2. L- secondary electron images and R-
corresponding elemental maps. .......................................................................................90
Figure 4- 5 High-resolution SEM image of Cu-ETS-2 and Ag-ETS-2..............................................92
Figure 4- 6 High-resolution SEM image of Ca-ETS-2. ..................................................................93
Figure 4- 7 EDX line scan through a tetragonal particle on Ca-ETS-2. .........................................93
Figure 4- 8 SEM results for Cu-ETS-2 samples before (left hand side) and after (Right hand side)
H2S treatment at room temperature. ...............................................................................95
Figure 5- 1 Schematic flow diagram of test apparatus. ............................................................ 103
Figure 5- 2 H2S breakthrough curves for Cu-ETS-2 at 25°C, 150°C and 250°C. ........................... 111
Figure 5- 3 The experimental data have been fitted by the chemisorption model at 25°C (a),
150°C (b) and 250°C (c). .................................................................................................. 113
Figure 5- 4 Sensitivity analysis for kinetic parameter (K) within 30% error of the optimized
value. ............................................................................................................................. 115
Figure 5- 5 Sensitivity analysis for deactivation parameter (kd) within 30% error of the
optimized value. ............................................................................................................ 116
Figure 5- 6 Sensitivity analysis for deactivation parameter (kH) within 70% error of the
optimized value. ............................................................................................................ 117
Figure 5- 7 Temperature program desorption curve of H2S under He with the heating rate of
10°C/min. ....................................................................................................................... 118
Figure 6- 1 TGA Curve of ETS-2 (ramp 10 °C/min under air). .................................................... 132
Figure 6- 2 Ti 2p photoemission signal of ETS-2. ...................................................................... 134
Figure 6- 3 O 1s photoemission signal of ETS-2. ....................................................................... 135
Figure 6- 4 Effect of pH on the Cu removal capacity of ETS-2 at room temperature and initial
Cu2+ concentration 54 mg/L and 1 hour contact time. .................................................... 139
Figure 7- 1 Picture of the experimental apparatus. ................................................................. 153
Figure 7- 2 Schematics of process flow diagram of experimental setup. .................................. 154

xviii
Figure 7- 3 shows the XRD patterns for Na-, Ca-, and Ca/H-ETS-10 .......................................... 158
Figure 7- 4 Moisture breakthrough capacity for different adsorbents at 30° C using different
regeneration air sources with a 100% RH CO2 feed stream. ........................................... 163
Figure 7- 5 Water adsorption isotherms for (a) Silica gel-Grade Davidson GD 40 [7], (b) Zeolite
4A Bayer [44], and (c) Ca-ETS-10 [40]. ............................................................................ 165
Figure A- 1 The axial temperature profile within the tube furnace at 500°C. ........................... 203
Figure A- 2 Breakthrough profile for Ca-ETS-10 and Activated alumina – four adsorption
desorption cycles ........................................................................................................... 207

xix
Nomenclature
𝑎 Deactivation rate term
𝑎′ Molar area (surface area per mole of adsorbate)
𝐴 Surface area
𝑏 Langmuir equilibrium constant
𝑐 Concentration in fluid phase
𝑑𝑝 Particle diameter
𝐷𝐿 Axial dispersion coefficient
𝐷 Molecular diffusivity
𝐸𝑎𝑐𝑡 Activation energy
𝐸𝑎𝑑𝑠 Adsorption energy
𝐸𝑑𝑖𝑠𝑠 Dissociation energy
𝐹 Molar flow
𝐾 Kinetic parameter
𝑘𝑑 Deactivation constant

xx
𝑘𝑓 Mass transfer coefficient
𝑘𝐻 Henry’s constant
𝑘𝑟 Reaction rate constant
𝐿 Adsorbent bed length
𝑚
value of 𝑛 for full monolayer coverage (the
saturation value)
𝑛
Number of moles of adsorbate per unit mass of
adsorbent
𝑁 Specific amount of adsorbate during the
breakthrough experiment
𝑁′ Specific amount of adsorbate during the
desorption time
𝑁𝑧 The molar flux in 𝑧 direction
P Gas-phase pressure
𝑑𝑃 Pressure drop
𝑞 Concentration in solid phase
𝑅 Universal gas constant

xxi
𝑆 Entropy
𝑇 Temperature
𝑡 Time
𝑢𝑠 Superficial velocity
𝑉 Volume
𝑤 Adsorbent weight
𝑥 Adsorbate mole fraction
𝑦 Gas-phase mole fraction
𝑧 Distance
𝑍 Compressibility factor
Greek Letters
ε Void fraction
𝛿 Mass transfer boundary layer thickness
𝛽 Heating rate
θ Surface coverage
𝜌 Density

xxii
𝜇 Viscosity
𝛱 Spreading pressure, adsorbed phase
𝜑 Energy of the adsorption system
𝜇′ Chemical potential
𝑣 Intrinsic fluid velocity
𝛾 Parameter for deactivation rate equation
𝜆 Parameter for deactivation rate equation
Abbreviations and Acronyms
BE Binding energy
BET Brunauer–Emmett–Teller
EDX Energy Dispersive X-Ray analysis
eV Electronvolt
FPD Flame photometric detector
GC Gas chromatograph
ICP Binding energy
MFC Mass flow controller

xxiii
𝑀𝑤 Molecular weight
ODE Ordinary differential equations
PCC Post combustion capture
PDE Partial differential equations
PE Potential energy
ppm Parts per million
𝑅𝑒 Reynolds number
𝑆𝑐 Schmidt number
SEM Scanning electron microscopy
𝑆ℎ Sherwood number
TEG Triethyleneglycol
TEM Transmission electron microscopy
TGA Thermogravimetric analysis
XRD X-ray diffraction
XPS X-rad photoelectron spectroscopy

xxiv
Subscript and superscript
𝑏 Bed
𝑔 Gas phase
𝑖 Species 𝑖
𝑜 Initial value
𝑝 Particle
𝑠𝑎𝑡 Saturation value

1
1. Introduction
1.1. Synopsis
The world's economy is relatively energy intensive and is strongly influenced by
the prices of oil or fossil fuels such as petroleum and natural gas. Over the years,
progressive interests have been focused on finding alternative energy sources to
reduce reliance on fossil based energy. However, up to now petroleum still remains
a primary source. According to the US Energy Information Administration (EIA)
estimate for 2014, the world consumes 87.421 million barrels of oil each day [1].
Associated with the production of petroleum are contaminants, which are harmful
to both oil processing and the environment. Therefore with the humongous
volumetric demand for oil consumption there is a great necessity to address these
contaminants.
One of the most common contaminants in petroleum production is acid gas. This
refers to any gas stream containing significant amount of acidic gases such as
hydrogen sulfide (H2S) or carbon dioxide (CO2) [2]. It is often found in fossil fuels.
For instance a gas stream from one oil well in Canada has been reported to contain
90% of H2S while others may have contents in tens of percent range [3]. In natural

2
gas the concentrations vary in a wide range from parts per million to 50 volume
percent and higher, depending on the nature of the rock formation from which it
comes [4]. H2S threshold for natural gas is usually considered 4 ppmv under
standard temperature and pressure [2, 5] however differs by country, agency or
application.
1.2. The Necessity of Acid gas Removal
Hydrogen sulfide is a common contaminant that must be addressed in multiple
aspects of petrochemical processing and combustion gas clean up [6]. This is
especially important for high sulfur hydrocarbons such as Alberta’s substantial oil
sands resource as well (4% [7]). Gasification and use of natural gas in advanced
power generation approaches also requires removal of contaminations such as
sulfur. Crude oil and coal have up to 6 wt.% sulfur content depending on their
sources [8].
During the combustion of natural gas or when H2S is oxidized in air, sulfur dioxide
(SO2) is generated which reacts with water and produce acid rain which is harmful
to the environment. In addition, acid rain can increase the rate of corrosion of
important metallic structures such as bridges. Sulfur levels higher than 3 ppm can
cause corrosion in the pipelines used for transporting natural gas and reduce the
plant’s lifetime in general [9].
3
During coal gasification processes H2S is released making the resulting syngas the
main product of gasification for electric power generation impure. Even at trace
levels (sub ppm level), H2S degrades the performance of many inorganic
membranes that could be used to enhance the separation processes related to syngas
and causes corrosion of gas turbines and pipelines. Thus the produced syngas
should be scavenged completely before being applied in further processes [10].
Nickel and alumina catalysts used in steam reforming processes also get poisoned
by H2S.
Fuel cells, the promising candidates for electrical power generation also gets
affected by H2S when their hydrogen fuel is not cleaned up. The processed natural
gas meets the environmental regulations, but the remaining H2S content is still
problematic for fuel cell applications. Since even at 0.1-1 ppm H2S poison the
anode catalyst of fuel cells. Thus acid gas removal plants such as gas sweetening
and desulphurization plants are essential and are one of the major parts of industrial
gas processing and transportation [11]. The design and development of adsorbents
that remove H2S from the gaseous streams up to sub ppm levels for different
applications are therefore the main focus of this research.
Meanwhile, finding a solution for the generation of pure carbon dioxide streams
produced from the combustion of natural gas or gasified coal, bitumen, biomass
(syngas) for storage and compression is highly required [12]. Pure carbon dioxide
generation is desirable primarily since it reduces the compression costs and
eliminates other liquefaction and associated storage problems. One of the most

4
problematic issues associated with producing a pure CO2 stream is moisture
contamination since the presence of water in the CO2 stream causes corrosion as
well as difficulty with its separation from other combustion products. Water vapor
that combines with CO2 makes carbonic acid, which corrodes process equipment
and piping. In addition at the high pressures required for pipeline distribution or for
deep well injection gas hydrates may be created.
Although processes as to how water vapor is removed from CO2 gas stream have
not reported in many explorations, an effective thoroughly drying (below 10 ppmv)
of CO2 gas stream would prevent those issues. Therefore, carbon dioxide streams
must be thoroughly dried before underground storage.
To sum up, acid gases must be removed or separated from the mixture of gases
prior to use or distribution to reduce piping and equipment corrosion during
transportation and maintenance problems in the pipelines, prevent atmospheric
pollution and meet environmental standards [13, 14]. All gasification processes
include an acid gas clean up step, regardless of the feedstock used or the ultimate
use of the synthesis gas produced [11]. However in applications where the gasifier
product is going to be a chemical feedstock, complete removal (sub ppm level) of
carbon dioxide and sulfur species is required.
Given the importance of acid gas removal, the focus of this thesis is to develop new
adsorbents to: first, reduce the H2S to sub ppm levels; second, drying CO2 streams
thoroughly with a desiccant being able to regenerate with low energy input. This
will be crucial to the future of the chemical processing industry and should be
5
viewed as an avenue for the discovery of next-generation adsorptive gas
purification technologies.
1.2.1. Hydrogen sulfide removal
There has been continuous research and development of new methods and
adsorbents in past decades for H2S removal. Current available techniques for H2S
removal are absorption in liquids (such as alkanolamines, ammonia solutions, and
alkaline salt solutions) and solid supported amines, the Claus process, and
adsorption by activated carbon (AC) or metal oxides [8, 15].
Absorption in liquids can reduce H2S concentration from percentage to ppm levels
readily. However the challenging problem is to remove the last traces of H2S from
the process stream, which is the focus of this work. On the other hand, this method
can experience operating difficulties such as high solvent losses, failure to meet
sweet gas specification, foaming, corrosion, fouling of equipment and
contamination of the solution [3]. Although the Claus process, which is the most
significant gas desulfurizing process, has high efficiency of 94% - 97% and a
relatively small ecological impact when coupled with a tail-gas treatment unit, the
H2S levels in this method cannot be reduced to ppm levels due to the equilibrium
limitation of the reaction in the process [8].
Activated carbon, although it has high specific surface area and porous structure, its
virgin form is not considered a good candidate for H2S removal due to its low
capacity [10]. However, it has been reported that its capacity for H2S removal can
6
be improved to about 10 times by impregnation with copper or potassium
hydroxide [16].
Reactive removal of H2S is common when the gas stream must be polished down
to sub-ppm levels [14]. Much of the previously reported work on reactive
sequestration of H2S has focused on using different forms of supported and
unsupported metal oxides and mixed metal oxides, in efforts to improve the
adsorbents capacity, thermal stability, and utilization. High dispersion of active
sites can noticeably enhance the reaction between metal compounds and H2S
molecules [17]. The high surface area supports include zeolites [18-20], carbon
sorbents [21, 22], SBA-15 and other mesoporous material supports [14, 19, 23-27].
The first and focal part of this research has been contributed to further improve the
capacity and utilization of supported metal/metal oxide adsorbents for deep H2S
removal (to sub-ppm levels) for gas purification applications at different
temperature ranges.
Engelhard Titanosilicate-2 (ETS-2) has been synthesized and used as a
novel substrate material to load active ions for H2S scavenging systems for the first
time. ETS-2 has high external surface area and cation exchange capacity, which
allow active ions to be highly dispersed and accessible to H2S molecules [14]. It
has been exchanged with different metal ions, Cu+2, Ag+, Zn2+, Ca2+. Room
temperature H2S removal capacity of the samples including the commercial sample
shows Cu-ETS-2 has the highest capacity.

7
Several studies have been dedicated to the development of H2S sorbents and
measurements of the breakthrough curves, however the column dynamics are still
poorly understood and differ for many of the sorbents studied. Much progress has
been made for the column dynamics and interactions of gases with physisorbents
without any chemical reaction included [28-32]. Less attention has been paid to the
investigation of the adsorbent by a dynamic model, which considers both
chemisorption of H2S molecules on the surface and deactivation of the solid.
Deactivation models [33, 34] were reported to be quite successful in predicting the
reaction rates of such gas-solid non-catalytic reactions. However they have been
used for the pseudo-steady state condition [34-40] in which the dynamic of the
system is only considered in the activity term implicitly.
Part of this work is focused on better understanding of the transport
phenomena occurring during the adsorption of ppm level H2S on a copper-ETS-2
packed bed column. A continuum mechanics-based model was developed to
support the analysis of experimental data obtained from dynamic column
breakthrough tests. The model includes the chemical reaction term, which is
affected by the deactivation of the solid phase. Temperature-programmed
desorption (TPD) [41] experiments of H2S on Cu-ETS-2 provided a further insight
of the different H2S-material interaction energy levels.
1.2.2. Drying of CO2 Streams
Numerous researches have been done on the high levels of CO2 emissions and their

8
direct effect on global warming and climate change in the last decade. Since the
global production of CO2 is projected to increase from 30 billion tons in 2008 to
43.2 billion tons by 2035 [42], various methods have been proposed to mitigate the
environmental effect of rising CO2 emissions. An appealing design is post
combustion capture (PCC), which uses an adsorptive separation process to
selectively remove and concentrate CO2 from the combustion gas stream. The
concentrated CO2 is then compressed and permanently separated preventing
significant volumes of CO2 from releasing to the atmosphere. The combustion
process may be modified to run on pure oxygen and/or through a turbine in an
integrated gasification combined (IGC) cycle [43-45] to improve the efficiency of
the separation. Through IGC systems a combustion stream with a high
concentration of CO2 is generated however such advantages come at increased cost
and added process complexity.
Different types of adsorbents with a high selectivity for CO2 over other
atmospheric gases including zeolites [46-50], metal oxides [51-56], and solid-
supported amines [57-61] have been investigated for recovering CO2. Despite
different characteristics of these materials, they all co-adsorb water to some extent
which will be desorbed with the CO2. But the moisture content needs to be
reduced to trace levels prior to compression of the carbon dioxide streams to meet
the requirements for underground carbon sequestration [62], and to prevent the
formation of CO2 hydrates [63].

9
An ideal desiccant for drying CO2 streams should have a high water capacity at low
moisture partial pressure and need low energy input for regeneration as well as
high selectivity toward water over CO2.
Liquid absorption drying systems such as triethylene glycol (TEG) are not good
candidates for PCC/CO2 sequestration due to the thermal input required in the
reboiler (200°C) and the poor selectivity of the liquid [64, 65]. Zeolite temperature
swing adsorption (TSA) drying systems used for drying natural gas have high
moisture selectivity can generate gas streams having very low dew points, but
similar to TEG systems, they require a regeneration step at temperatures greater
than 200°C [66].
Silica gel desiccants, on the other hand can be regenerated at temperatures as low
as 100°C, but the water adsorption capacity of silica gel decreases linearly with
concentration [48]. The latter causes the adsorbent to have little capacity at trace
levels of moisture and reduces the amount of the bed used for adsorption.
Engelhard Titanosilicate 10 (ETS-10) is a large-pored, titanium silicate molecular
sieve include a mixture of silicon oxide tetrahedra and titanium oxide octahedral
[67, 68]. The specific structure of ETS-10 combines the chemically passive
characteristics of silica gel with the ion exchange capability of zeolite molecular
sieves. Thus it displays a unique adsorption behaviour since it retains a high
moisture capacity at low partial pressures at ambient temperatures, but rapidly loses
moisture capacity as temperature increases [69].

10
ETS-10 has previously been identified as an air desiccant [69], though its use for
drying CO2 streams has not been investigated.
The last part of this research project will focus on the CO2 drying performance of
different forms of ETS-10 and compares them to commercial silica and zeolite 4A
adsorbents.
Separation issues and challenges to be addressed by this thesis are highlighted in
Figure 1-1.
Figure 1- 1 Challenges of this research are highlighted

11
1.3. Framework of the Study
A concise review of available literatures on adsorption fundamentals including
physisorption versus chemisorption concept, adsorption equilibrium, kinetics and
adsorption dynamics are presented in chapter 2.
A novel Cu-based adsorbent is introduced and preparation using a high surface area
titanosilicate (ETS-2) in chapter 3. It was tested for low concentrations H2S
removal at room temperature and its capacity and copper utilization was compared
to a fully developed commercial H2S adsorbents as well as Cu exchanged ETS-4
and 10. The effect of activation temperature on Cu-ETS-2 properties was
investigated as well.
Breakthrough performances of metal-exchanged nanotitanate ETS-2 adsorbents for
room temperature desulfurization are reported in chapter 4. A description of
various applied characterization techniques for the morphology, structure and
chemical properties of the synthesized adsorbents are discussed as well.
Chemisorption of H2S on copper-ETS-2 is investigated in chapter 5. Adsorption
test conditions followed by the mechanism of H2S adsorption on Cu-ETS-2 are also
presented. In this chapter, H2S column breakthrough experiments are analyzed by a
proposed model based on the rigorous mass balance equations for the fluid and
solid phases. The model also includes the chemical reaction term, which is affected
by the deactivation of the solid phase.

12
Chapter 6 discusses the Cu ions removal of from aqueous solutions by nanotitanate
ETS-2. Different characterization tests such as XPS, EDX and ICP as well as
copper removal tests at different solution PH have been conducted to study the
adsorption mechanism.
Chapter 7 focuses on the modification of a molecular sieve as a low temperature
regenerable desiccant that requires low thermal input, to be used in the process of
drying CO2 streams. Different ion exchanged forms of ETS-10 were used as
desiccants for CO2 drying. The manner in which the moisture capacity declines
with temperature makes ETS-10 intensely suited toward low energy input CO2
drying.
Finally in chapter 8, the conclusions and highlights of the major discoveries of the
present study and recommendations for future studies are presented.
1.4. References
[1] Short-Term Energy Outlook,
Available: http://www.eia.gov/forecasts/steo/report/global_oil.cfm. (Accessed on
Jan. 20th, 2015).
[2] NaturalGas. Available: http://naturalgas.org. (Accessed on Jan. 16th, 2015).
[3] F. Ullmann, Ullmann's Encyclopedia of Industrial Chemistry. [Electronic
Resource]. New York]; 7th ed, 2010.

13
[4] Gas Sweetening,
Available:http://msdssearch.dow.com/PublishedLiteratureDOWCOM/dh_0039/090
1b803800391f8.pdf?filepath=gastreating/pdfs/noreg/170-
01395.pdf&fromPage=GetDoc. (Accessed on Jan. 20th, 2015).
[5] Fundamentals of Stack Gas Dispersion.
Available: http://www.air-dispersion.com/default.htm. (Accessed on Jan. 10th,
2015).
[6] Y. Elsayed, M. Seredych, A. Dallas and T. J. Bandosz, "Desulfurization of air
at high and low H2S concentrations," Chem. Eng. J., vol. 155, pp. 594-602, 2009.
[7] Canada's Oilsands and Heavy Oil Deposits.
Available: www.energy.gov.ab.ca/oilsands/pdfs/rpt_chops_app1.pdf. (Accessed on
Jan. 20th, 2015).
[8] D. Stirling, The Sulfur Problem [Electronic Resource] : Cleaning Up Industrial
Feedstocks / Diane Stirling. Cambridge, UK : Royal Society of Chemistry, 2000.
[9] T. Baird, P. J. Denny, R. Hoyle, F. Mcmonagle, D. Stirling and J. Tweedy,
"Modified Zinc-Oxide Absorbents for Low-Temperature Gas Desulfurization,”
Journal of the Chemical Society-Faraday Transactions, vol. 88, pp. 3375-3382,
1992.
[10] S. K. Gangwal, "Chapter 11: Desulfurization for Fuel Cells," Fuel Cells:
Technologies for Fuel Processing, pp. 317-360, 2011.
[11] Chemical Solvent-Based Processes for Acid Gas Removal in Gasification
Application.
Available:http://msdssearch.dow.com/PublishedLiteratureDOWCOM/dh_003a/090
1b8038003a89e.pdf?filepath=gastreating/pdfs/noreg/170-
01406.pdf&fromPage=GetDoc. (Accessed on Jan. 17th, 2015).
[12] B. Tanchuk, J. A. Sawada, S. Rezaei and S. M. Kuznicki, "Adsorptive drying
of CO2 using low grade heat and humid, ambient air," Separation and Purification
Technology, vol. 120, pp. 354-361, 2013.
[13] B. D. Bhide, A. Voskericyan and S. A. Stern, "Hybrid processes for the
removal of acid gases from natural gas," J. Membr. Sci., vol. 140, pp. 27-49,
1998.

14
[14] S. Rezaei, A. Tavana, J. A. Sawada, L. Wu, A. S. M. Junaid and S. M.
Kuznicki, "Novel Copper-Exchanged Titanosilicate Adsorbent for Low
Temperature H2S Removal," Ind Eng Chem Res, vol. 51, pp. 12430-12434, 2012.
[15] Q. Xue and Y. Liu, "Removal of minor concentration of H2S on MDEA-
modified SBA-15 for gas purification," Journal of Industrial and Engineering
Chemistry, vol. 18, pp. 169-173, 2012.
[16] C. Huang, C. Chen and S. Chu, "Effect of moisture on H2S adsorption by
copper impregnated activated carbon," J. Hazard. Mater., vol. 136, pp. 866-873,
2006.
[17] D. Jiang, L. Su, L. Ma, N. Yao, X. Xu, H. Tang and X. Li, "Cu-Zn-Al mixed
metal oxides derived from hydroxycarbonate precursors for H2S removal at low
temperature," Appl. Surf. Sci., vol. 256, pp. 3216-3223, 2010.
[18] D. Melo, J. de Souza, M. Melo, A. Martinelli, G. Cachima and J. Cunha,
"Evaluation of the zinox and zeolite materials as adsorbents to remove H2S from
natural gas," Colloid Surf. A-Physicochem. Eng. Asp., vol. 272, pp. 32-36, 2006.
[19] D. Crespo, G. Qi, Y. Wang, F. H. Yang and R. T. Yang, "Superior sorbent for
natural gas desulfurization," Ind Eng Chem Res, vol. 47, pp. 1238-1244, 2008.
[20] P. Kumar, C. Sung, O. Muraza, M. Cococcioni, S. Al Hashimi, A. McCormick
and M. Tsapatsis, "H2S adsorption by Ag and Cu ion exchanged
faujasites," Microporous Mesoporous Mat., vol. 146, pp. 127-133, 2011.
[21] D. Nguyen-Thanh and T. Bandosz, "Activated carbons with metal containing
bentonite binders as adsorbents of hydrogen sulfide," Carbon, vol. 43, pp. 359-
367, 2005.
[22] F. Li, J. Wei, Y. Yang, G. H. Yang and T. Lei, "Preparation of Sorbent Loaded
with Nano-CuO for Room Temperature to Remove of Hydrogen Sulfide," Applied
Mechanics and Materials, vol. 475, pp. 1329-1333, 2014.
[23] P. Dhage, A. Samokhvalov, D. Repala, E. C. Duin, M. Bowman and B. J.
Tatarchuk, "Copper-Promoted ZnO/SiO2 Regenerable Sorbents for the Room
Temperature Removal of H2S from Reformate Gas Streams," Ind Eng Chem Res,
vol. 49, pp. 8388-8396, 2010.
[24] Q. Xue and Y. Liu, "Removal of minor concentration of H2S on MDEA-
modified SBA-15 for gas purification," J. Ind. Eng. Chem., vol. 18, pp. 169-173,
2012.

15
[25] M. Hussain, N. Abbas, D. Fino and N. Russo, "Novel mesoporous silica
supported ZnO adsorbents for the desulphurization of biogas at low
temperatures," Chem. Eng. J., vol. 188, pp. 222-232, 2012.
[26] X. Wang, T. Sun, J. Yang, L. Zhao and J. Jia, "Low-temperature H2S removal
from gas streams with SBA-15 supported ZnO nanoparticles," Chem. Eng. J., vol.
142, pp. 48-55, 2008.
[27] D. Montes, E. Tocuyo, E. Gonzaĺez, D. Rodriǵuez, R. Solano, R. Atencio, M.
A. Ramos and A. Moronta, "Reactive H2S chemisorption on mesoporous silica
molecular sieve-supported CuO or ZnO," Microporous and Mesoporous
Materials, vol. 168, pp. 111-120, 2013.
[28] S. Guntuka, S. Farooq and A. Rajendran, "A- and B-Site substituted
lanthanum cobaltite perovskite as high temperature oxygen sorbent. 2. Column
dynamics study," Ind Eng Chem Res, vol. 47, pp. 163-170, 2008.
[29] Y. Xiao, S. Wang, D. Wu and Q. Yuan, "Experimental and simulation study of
hydrogen sulfide adsorption on impregnated activated carbon under anaerobic
conditions," J. Hazard. Mater., vol. 153, pp. 1193-1200, 2008.
[30] S. N. Nobar and S. Farooq, "Experimental and modeling study of adsorption
and diffusion of gases in Cu-BTC," Chemical Engineering Science, pp. 801, 2012.
[31] R. Haghpanah, A. Rajendran, S. Farooq, I. A. Karimi and M. Amanullah,
"Discrete Equilibrium Data from Dynamic Column Breakthrough
Experiments," Ind Eng Chem Res, vol. 51, pp. 14834-14844, 2012.
[32] K. B. Lee, A. Verdooren, H. S. Caram and S. Sircar, "Chemisorption of carbon
dioxide on potassium-carbonate-promoted hydrotalcite," Journal of Colloid &
Interface Science, vol. 308, pp. 30-39, 2007.
[33] N. Yaşyerli, T. Doǧu, G. Doǧu and i. Ar, "Deactivation model for textural
effects of kinetics of gas-solid noncatalytic reactions “char gasification with
CO2”," Chemical Engineering Science, vol. 51, pp. 2523-2528, 1996.
[34] S. Yasyerli, G. Dogu, I. Ar and T. Dogu, "Breakthrough Analysis of H 2 S
Removal on Cu-V-Mo, Cu-V, and Cu-Mo Mixed Oxides," Chem. Eng. Commun.,
vol. 190, pp. 1055, 2003.
[35] Y. Suyadal, M. Erol and H. Oguz, "Deactivation model for the adsorption of
trichloroethylene vapor on an activated carbon bed," Ind Eng Chem Res, vol. 39,
pp. 724-730, 2000.

16
[36] S. Yasyerli, G. Dogu, I. Ar and T. Dogu, "Activities of copper oxide and Cu-V
and Cu-Mo mixed oxides for H2S removal in the presence and absence of
hydrogen and predictions of a deactivation model," Ind Eng Chem Res, vol. 40, pp.
5206-5214, 2001.
[37] S. Yasyerli, I. Ar, G. Dogu and T. Dogu, "Removal of hydrogen sulfide by
clinoptilolite in a fixed bed adsorber," Chem. Eng. Process, vol. 41, pp. 785-792,
2002.
[38] T. Kopac and S. Kocabas, "Deactivation models for sulfur dioxide adsorption
on silica gel," Adv. Environ. Res., vol. 8, pp. 417-424, 2004.
[39] H. F. Garces, H. M. Galindo, L. J. Garces, J. Hunt, A. Morey and S. L. Suib,
"Low temperature H2S dry-desulfurization with zinc oxide," Microporous
Mesoporous Mat., vol. 127, pp. 190-197, 2010.
[40] T. Ko and H. Hsueh, "Removal of Hydrogen Sulfide by Iron-Rich Soil:
Application of the Deactivation Kinetic Model for Fitting Breakthrough
Curve," Aerosol Air Qual. Res., vol. 12, pp. 1355-1361, 2012.
[41] K. J. Leary, J. N. Michaels and A. M. Stacy, "Temperature-programmed
desorption: Multisite and subsurface diffusion models," AICHE J., vol. 34, pp.
263, 02, 1988.
[42] International Energy Outlook 2011. Available:
http://large.stanford.edu/courses/2011/ph240/nagasawa2/docs/0484-2011.pdf.
(Accessed on Jan. 20th, 2015).
[43] C. Cormos, A. Padurean and P. S. Agachi, "GHGT-10: Technical evaluations
of carbon capture options for power generation from coal and biomass based on
integrated gasification combined cycle scheme," Energy Procedia, vol. 4, pp.
1861-1868, 2011.
[44] Y. Hu, H. Li and J. Yan, "Integration of Evaporative Gas Turbine with Oxy-
Fuel Combustion for Carbon Dioxide Capture," International Journal of Green
Energy, vol. 7, pp. 615-631, 2010.
[45] A. Kather and S. Kownatzki, "Assessment of the different parameters
affecting the CO2 purity from coal fired oxyfuel process," International Journal of
Greenhouse Gas Control, vol. 5, pp. S204-S209, 2011.
[46] C. O. Areán and M. R. Delgado, "Variable-temperature FT-IR studies on the
thermodynamics of carbon dioxide adsorption on a faujasite-type H-Y
zeolite," Appl. Surf. Sci., vol. 256, pp. 5259-5262, 2010.

17
[47] Z. Liu, C. A. Grande, P. Li, J. Yu and A. E. Rodrigues, "Adsorption and
Desorption of Carbon Dioxide and Nitrogen on Zeolite 5A," Separation Science &
Technology, vol. 46, pp. 434-451, 02, 2011.
[48] Y. Wang and M. D. Levan, "Adsorption Equilibrium of Carbon Dioxide and
Water Vapor on Zeolites 5A and 13X and Silica Gel: Pure
Components," J. Chem. Eng. Data, vol. 54, pp. 2839-2844, 2009.
[49] Z. Zhao, X. Cui, J. Ma and R. Li, "Adsorption of carbon dioxide on alkali-
modified zeolite 13X adsorbents," International Journal of Greenhouse Gas
Control, vol. 1, pp. 355-359, 2007.
[50] A. Zukal, J. Mayerová and M. Kubu, "Adsorption of Carbon Dioxide on High-
Silica Zeolites with Different Framework Topology," Topics in Catalysis, vol. 53,
pp. 1361-1366, 11, 2010.
[51] J. Baltrusaitis, J. Schuttlefield, E. Zeitler and V. H. Grassian, "Carbon dioxide
adsorption on oxide nanoparticle surfaces," Chem. Eng. J., vol. 170, pp. 471-481,
2011.
[52] P. H. Chang, Y. P. Chang, S. Y. Chen, C. T. Yu and Y. P. Chyou, "Ca-Rich
Ca-Al-Oxide, High-Temperature-Stable Sorbents Prepared from Hydrotalcite
Precursors: Synthesis, Characterization, and CO2 Capture
Capacity," Chemsuschem, vol. 4, pp. 1844-1851, 2011.
[53] G. S. Grasa and J. C. Abanades, "CO2 capture capacity of CaO in long series
of carbonation/calcination cycles," Ind Eng Chem Res, vol. 45, pp. 8846-8851,
2006.
[54] H. Lu, P. G. Smirniotis, F. O. Ernst and S. E. Pratsinis, "Nanostructured Ca-
based sorbents with high CO2 uptake efficiency," Chemical Engineering Science,
vol. 64, pp. 1936-1943, 2009.
[55] G. Ramis, G. Busca and V. Lorenzelli, "Low-Temperature Co-2 Adsorption
on Metal-Oxides - Spectroscopic Characterization of some Weakly Adsorbed
Species," Mater. Chem. Phys., vol. 29, pp. 425-435, 1991.
[56] S. P. Wang, S. L. Yan, X. B. Ma and J. L. Gong, "Recent advances in capture
of carbon dioxide using alkali-metal-based oxides," Energy & Environmental
Science, vol. 4, pp. 3805-3819, 2011.
[57] B. Arstad, H. Fjellvag, K. O. Kongshaug, O. Swang and R. Blom, "Amine
functionalised metal organic frameworks (MOFs) as adsorbents for carbon
dioxide," Adsorption, pp. 755, 2008.

18
[58] F. Chang, K. Chao, H. Cheng and C. Tan, "Adsorption of CO2 onto amine-
grafted mesoporous silicas," Separation and Purification Technology, vol. 70, pp.
87-95, 2009.
[59] R. Chatti, A. K. Bansiwal, J. A. Thote, V. Kumar, P. Jadhav, S. K. Lokhande,
R. B. Biniwale, N. K. Labhsetwar and S. S. Rayalu, "Amine loaded zeolites for
carbon dioxide capture: Amine loading and adsorption studies," Microporous and
Mesoporous Materials, vol. 121, pp. 84-89, 2009.
[60] C. Knöfel, J. Descarpentries, A. Benzaouia, V. Zeleňák, S. Mornet, P. L.
Llewellyn and V. Hornebecq, "Functionalised micro-/mesoporous silica for the
adsorption of carbon dioxide," Microporous and Mesoporous Materials, vol. 99,
pp. 79-85, 2007.
[61] O. G. Nik, B. Nohair and S. Kaliaguine, "Aminosilanes grafting on FAU/EMT
zeolite: Effect on CO2 adsorptive properties," Microporous and Mesoporous
Materials, vol. 143, pp. 221-229, 2011.
[62] L. Marini, Geological Sequestration of Carbon Dioxide. [Electronic
Resource] : Thermodynamics, Kinetics, and Reaction Path Modeling. Amsterdam ;
Oxford : Elsevier, 2007.
[63] A. Y. Manakov, Y. A. Dyadin, A. G. Ogienko, A. V. Kurnosov, E. Y. Aladko,
E. G. Larionov, F. V. Zhurko, V. I. Voronin, I. F. Berger, S. V. Goryainov, A. Y.
Lihacheva and A. I. Ancharov, "Phase Diagram and High-Pressure Boundary of
Hydrate Formation in the Carbon Dioxide-Water System," J. Phys. Chem. B, vol.
113, pp. 7257-7262, 2009.
[64] V. Hernandez-Valencia, M. W. Hlavinka, J. A. Bullin and I. N. C. Bryan,
"Design glycol units for maximum efficiency," Research & Eng., pp. 310-317,
1992.
[65] O. Aschenbrenner and P. Styring, "Comparative study of solvent properties for
carbon dioxide absorption," Energy & Environmental Science, vol. 3, pp. 1106-
1113, 2010.
[66] D. W. Breck, Zeolite Molecular Sieves: Structure, Chemistry, and Use. New
York, Wiley, 1974.
[67] M. W. Anderson, O. Terasaki, T. Ohsuna, A. Philippou, S. P. MacKay, A.
Ferreira, J. Rocha and S. Lidin, "Structure of the microporous titanosilicate ETS-
10," Nature, pp. 347, 1994.
[68] S. M. Kuznicki, "Large-pored crystalline titanium molecular sieve zeolites,",
19910430; 1991.

19
[69] S. M. Kuznicki, K. A. Thrush and H. M. Garfinkel, "Use of crystalline
molecular sieves containing charged octahedral sites in cyclic desiccating
processes,", 1993.

20
2. Literature background
2.1. Summary
Adsorption is a process in which gas or liquid molecules/atoms adhere to the
surface of a certain solid known as an adsorbent. It is known as a fundamental
separation technique in chemical and petrochemical industries and has been studied
and improved by many researchers in the past decades [1, 2]. Not only it has been
widely employed for removal of low-concentration impurities and pollutants from
fluid streams, it is also the major part of chromatography and catalytic-reaction
processes [3]. Most industrially important reactions are catalytic and 90% of
chemicals are produced through a heterogeneously catalyzed process where the
surface reaction occurs between the two key steps of adsorption of reactant and
desorption of product species [3, 4]. Various technologies have been developed and
still developing to improve adsorption mechanism and reach an efficient and
desired separation. These improvements include adsorption design and process
cycle development and optimization, manipulation of the structure and chemistry
of the adsorbent to provide greater attractive forces for specific applications (e.g.
by adjusting the size of the pores, to control access to the adsorbent surface on the

21
basis of molecular size) as well as discoveries of new, porous, high-surface area
adsorbent materials (e.g. molecular sieve zeolites) [5]. Commercial adsorbents can
be classified by their natural structure (amorphous or crystalline1), by the nature of
their surfaces (polar, nonpolar, or intermediate), by the sizes of their pores
(micropores, mesopores, and macropores), or by their chemical composition.
Besides physical properties such as particle size, density, void fraction, etc. are key
factors. Deactivation of the adsorbents during the extended usage by reaction with
impurities, reaction of adsorbates, or thermal damage is important to consider. All
of these factors are important in the selection of the best adsorbent for any specific
application [5].
Following the brief discussion on the importance of adsorption technique is the
theory of adsorption as well as its equilibrium, kinetics and dynamics, which are
explained in this chapter. The mechanism of hydrogen sulfide adsorption on
metal/metal oxide surfaces and study of regenerable desiccants, which are the focal
points of this thesis, will be addressed at the end of the chapter.
2.2. The concept and fundamentals of adsorption
Adsorption is a surface phenomenon in which the outer or the topmost boundary of
1 Properties and applications of amorphous and crystalline adsorbents are tabulated
in [6].

22
the solid adsorbent attracts molecules from a fluid phase. Due to the asymmetric
nature of the surface (or imbalanced forces of intermolecular interaction), the
outermost bonds are unsaturated [6] and interaction forces, reprehensive of the bulk
properties, change abruptly. The surface then becomes capable of attracting
particles from the gas phase with a specific reactivity. As a result of interacting
forces between the particles from the fluid phase and surface of the solid phase, the
potential energy (PE)2 of the adsorbing molecule close to the solid surface reduces
and fluid particles tend to concentrate in the interphase boundary. Adsorbed
molecules/ atoms create a film of condensed phase on the adsorbent with higher
molecular density compared to the fluid phase called adsorbate.
2.2.1. Adsorption forces
The strength of the surface bonding depends on the nature of the adsorbent and the
adsorbing fluid and can be any where between van-der-Waals (<50 kJ/mole) to
metallic and ionic bonds (>50 kJ/mole) [7]. Depending on the strength of the
interaction forces, adsorption can be classified to physisorption (physical
adsorption) and chemisorption (chemical adsorption) [1, 8].
Physisorption is the most common form of adsorption where adsorbate molecules
are attached to the solid surface by relatively weak interactions known as van der
Waals forces [6, 9]. Since physisorption is governed by week electrostatic forces
(dipole or quadrupole interactions), molecules remain intact and can be easily freed
2 Explained in section 2.2.3

23
by heating or dropping the system pressure [6, 10]. The structure and texture of the
adsorbent is also unaffected.
Chemisorption, on the other hand, happens when a chemical interaction occurs
between the fluid and the solid surface and /or by a chemical reaction occurring at
the exposed surface [3, 6, 11]. Unlike physical adsorption, which occurs on all
surfaces at a favorable range of physical conditions (i.e. temperature and pressure),
chemisorption takes place only on certain active sites. The adsorbate molecules
split into atoms, radicals, or ions, which create a chemical bond with the adsorption
site and form a surface compound. The chemical bond involves transferring of
electrons between the adsorbate and solid substrate and a substantial rearrangement
of electron density. These strong chemical interactions can be either the extreme of
virtually ionic (complete electron replacement) or covalent character (sharing
electrons) [12]. Not only much higher amount of energy is required to reverse a
chemical adsorption (compared to physisorption) because of the strong bonding,
even a sufficient amount of energy may only carry away the surface compound
[13].
Table 2-1 summarizes the typical characteristics of physical and chemical
adsorptions. As it is mentioned in this table chemisorption is a monolayer process
in which adsorbate molecules need direct contact with the active surface, but
physisorption has the potential of forming multiple layers of adsorbed molecules
under proper conditions.

24
Table 2- 1 Typical characteristics of physical and chemical adsorbents [6, 14].
Chemisorption Physisorption
Temperature Range (over
which adsorption occurs)
Virtually unlimited
(but a given molecule may
effectively adsorb only over a
small range)
Near or below the condensation
point of the gas
(e.g. Xe < 100 K, CO2 < 200 K)
Adsorption Enthalpy
Wide range
(related to the chemical bond
strength) - typically 40 - 800 kJ
mol-1
Related to factors like molecular
mass and polarity - typically 5-40
kJ mol-1 (similar to heat of
liquefaction)
Nature of Adsorption Often dissociative May be
irreversible Non-dissociative Reversible
Saturation Uptake Limited to one monolayer Multilayer uptake possible
Adsorption Kinetics
Very variable
Often an activated process
Fast
Non-activated process
Material Specificity
(variation between
substrates of different
chemical composition)
Substantial variation between
materials
Slight dependence upon substrate
composition
Physisorption and chemisorption processes may happen simultaneously on a
sample [13]; e.g. physisorption may occur on inactive sites of a heterogeneous
adsorbent while chemisorption occurs on active sites, or a layer of physisorbed
25
molecules can be on top of an underlying chemisorbed layer and vice versa.
Besides the same surface can display physisorption at one temperature and
chemisorption at elevated temperatures. This is possible from the fact that
physisorption weakens rapidly with temperature elevation however chemisorption
gets improved at high temperature due to the activation energy required for the
strong interactions.
2.2.2. Dissociative chemisorption
Chemisorption of diatomic molecules on adsorbent surfaces (such as hydrogen on
copper surfaces [15]) usually occur through a rearrangement of the electronic
configuration followed by the dissociation of the molecule into two atoms [4]; new
adsorbate species. The absorbed molecule known as a precursor state diffuses
across the surface to the chemisorption sites where the molecular bond is broken in
favor of new bonds to the surface. The energy to overcome the activation potential
of dissociation usually provided by the translational energy and vibrational energy
[15].
2.2.3. Potential energy curve
Potential energy curve displays the variation of the energy 𝜑(𝑧) of a adsorption
system versus the distance of an adsorbing molecule from the surface (z). As a
molecule approaches the surface feels the attraction to the surface, which
eventually leads to a fundamental interaction. Upcoming very close to the surface,
it feels the strong repulsive forces due to the electron density overlap, which cause

26
a rapid increase in the potential energy of the system.
Physisorption and chemisorption potential energy curves (Curve (a) and (b) in
Figure 2.1 respectively) are qualitatively similar. However, physical forces make a
shallow minimum in the PE curve at a relatively large distance from the solid
surface (typically z > 3 Å) before the rapid increase in the total energy occurs [16].
As it can be seen in Figure 2-1 the potential energy diagram corresponding to
dissociative chemisorption (curve (c)) can be explained as the combination of the
potential for the physisorption of an un-dissociated molecule (curve (a)) and the
chemisorption potential of two dissociated atomic specious (curve (b)) [8].
Figure 2- 1 Typical potential energy curve for a dissociative chemisorption of a diatomic
molecule [8].
A substantial amount of energy is required for the dissociation of a diatomic

27
molecule equidistant (far) from an adsorbent surface3. Figure 2-1- curve (b) in
shows two monatomic species after well separated from each other. When they
approach the surface (z decreases) their electronic structures get perturbed and they
both form chemical bonds with the surface (a deep chemisorption PE minimum).
However the dissociation energy (𝐸𝑑𝑖𝑠𝑠) to break diatomic bond is very big.
Alternatively the diatomic molecule is attracted to the surface through a
physisorbate state, known as the precursor-mediated before bond dissociation [8].
Then electrons transfer from the surface to this molecule cause strong molecular
bond and dissociation of the diatomic molecule to two monatomic species, which
gets chemisorbed to the surface with total adsorption energy of 𝐸𝑎𝑑𝑠 (Figure 2-1
curve (c)).
Dissociative chemisorption is an activated process in which a molecule needs to
overcome the energy barrier of 𝐸𝑎𝑐𝑡, which is lower than the dissociation energy
(𝐸𝑑𝑖𝑠𝑠). This clearly shows why this mechanism is favorable in practice.
2.3. Adsorption equilibrium
An adsorbed molecule can leave the surface when it receives energy equal to or
greater than the energy of adsorption. This phenomenon is the reverse of adsorption
and is called desorption. When the number of molecules attracted by the surface
3 e.g. 𝐸𝑑𝑖𝑠𝑠 for H2 is reported 435 kJ mol-1 or 4.5 eV [16].

28
and staying there is equal to the number of molecules that are leaving the surface
the system is at equilibrium [8].
The scientific basis for adsorption is the thermodynamics of adsorbent-adsorbate at
equilibrium [1]. Thermodynamic description of adsorption equilibrium, applicable
to physical adsorption and chemisorption, employs the Gibbs/Duhem equation [17]
for the adsorbate as following [3]:
𝑆𝑑𝑇 − 𝑎′𝑑Π +∑𝑥𝑖𝑑𝜇𝑖′
𝑖
= 0 (2 − 1)
where 𝑎′ is the molar area (surface area per mole of adsorbate) and 𝑥𝑖 is adsorbate
mole fractions. Π is the spreading pressure, which is the two-dimensional analog of
pressure [3].
Considering the equilibrium condition at a constant temperature and ideal gas
condition for the gas phase lead to the Gibbs adsorption isotherm as follows:
−𝑎′
𝑅𝑇𝑑Π + 𝑑ln𝑃 +∑𝑥𝑖𝑑ln𝑦𝑖
𝑖
= 0 (2 − 2)
where 𝑦𝑖 and 𝑃 are gas-phase mole fraction and pressure respectively.
Experimental data for pure-gas adsorption are reported as number of moles of
adsorbate per unit mass of adsorbent (𝑛) at equilibrium as a function of 𝑃 at
constant temperature. Each set of data is known as equilibrium adsorption isotherm
and gives information of how much material will be uptaken for a specific gas on a

29
particular solid adsorbent. There are two main methods to collect adsorption
equilibrium data: volumetric and gravimetric method methods. The former is based
on mass balance using two volume - calibrated vessels (manifold and sample
holder). Monitoring of the pressure and the temperature, combined with an
equation of state are required. The later method monitors the weight change of the
adsorbent sample in a closed system on a balance. The uptake amount for a given
adsorbent is a decisive parameter, since a high uptake usually means a desired/ high
adsorbent efficiency. The respective uptake is often called adsorption capacity and
characterized by the adsorption isotherm [7].
The adsorption isotherm can be correlated by an analytical relation between 𝑛 and
𝑃 consistent with equation (2 − 2). Considering the compressibility-factor analog
for an adsorbate as 𝑍 = 𝜋𝑎′ 𝑅𝑇⁄ , integration of equation (2 − 2) from 𝑛 = 0 and
𝑃 = 0 to 𝑛 = 𝑛 and 𝑃 = 𝑃 for a pure chemical species yields to the following
general relation between 𝑛 and 𝑃
𝑛 = 𝑘𝐻𝑃 𝑒𝑥𝑝[∫ (1 − 𝑍)𝑑𝑛
𝑛+ 1 − 𝑍
𝑛
0
] (2 − 3)
𝑍 can be represented by an equation of state for the adsorbate, however the
simplest such equation is the ideal-gas analog, 𝑍 = 1, the Henry's law for
adsorption 𝑛 = 𝑘𝐻𝑃 is achieved and 𝑘𝐻 is the Henry’s constant.
The ideal-lattice-gas equation [3] is an equation of state, which is developed
specifically for an adsorbate under the assumption that the surface of the adsorbate

30
is a two-dimensional lattice of energetically equivalent sites. Each adsorbent site
may bind an adsorbate molecule and the bound molecules do not interact with each
other. Therefore this model is therefore limited to one layer adsorption (monolayer
coverage). Using this equation of state gives the wide known Langmuir isotherm as
follows [3]:
𝑛 =𝑘𝐻𝑏
′𝑃
𝑏′ + 𝑃 (2 − 4)
where 𝑏′ = 𝑚 𝑘𝐻⁄ and 𝑚 is the value of 𝑛 for full monolayer coverage (the
saturation value). When 𝑃 ⟶ 0, Henry law fulfills and at the other extreme, when
𝑃 ⟶ ∞, 𝑛 approaches 𝑚.
Equation (2-4) can be written in terms of surface coverage 𝜃, i.e., the fraction of
occupied sites per available sites on the solid surface. Number of sites in
monolayer adsorption is also represented as the fraction of surface sites occupied
𝜃 = 𝑛 𝑚⁄ (0 < θ < 1).
𝜃 =𝑏𝑃1+𝑏𝑃
(2 − 5)
where 𝑏 is the Langmuir constant [18].
However, Langmuir isotherm’s original derivation assumed elementary processes
for adsorption and desorption and have rates at equilibrium [4]. Since Langmuir
isotherm is written based on assumptions at low surface coverage, it fits well to 𝑛
vs. 𝑃 data as 𝜃 ⟶ 0 and as 𝑛 ⟶ 0. However the assumptions become unrealistic
31
at higher surface coverage and the Langmuir isotherm may provide an approximate
overall fit to 𝑛 vs. 𝑃 data.
Foo K.Y. et al. presented other isotherm models such as Freundlich, BET, Toth,
etc. [12, 19]. Freundlich equation is the earliest 2-parameter empirical model,
which is not restricted to the formation of monolayer [4, 19]. Brunauer–Emmett–
Teller (BET) [20] isotherm is based on the theory of multilayer adsorption and is
most widely applied in the gas–solid equilibrium systems. Toth equation [3] is an
empirical extension of the Langmuir isotherm with three parameters for adsorption
on heterogeneous adsorbents. Sites are energetically different in heterogeneous
adsorbents. Molecules prefer to adsorb onto sites of high energy, but as adsorption
progresses, molecules then adsorb onto sites of decreasing interaction energy.
Masel R. I. [4] derived the Langmuir isotherm expression for the case of
dissociative adsorption.
The shape of the adsorption isotherm provides immediate information about how
the adsorption process proceeds over a given surface and about the chemical and
physical properties of the catalyst material. Most of the behavior seen during the
adsorption of gases on solids can be classified into five general isotherms types
[21], depending on the nature of the catalyst and the kind of interaction [7]. Figure
2-2 present these five types.
Type I describes a typical Langmuir isotherm, which is for the adsorption on
microporous (micropore diameters < 2 nm [5, 12]) solids. It is not only observed
for the adsorption of chemically active gases on metal surfaces but for non-polar

32
gases (e.g. methane, nitrogen) on zeolites. The more rectangular isotherms have
larger Langmuir constants, which reflect stronger affinity for the adsorbate
molecules within the micropores. Type II describes a BET adsorption mechanism
such as adsorption of water vapor on γ-Al2O3, which includes condensation [7].
Type III is typical of polar molecules (e.g. H2O or methanol) adsorption on a
hydrophobic/ non-polar surface (e.g. like charcoal). It is begins rather repulsive
interactions leading to a reduced uptake, while at high pressure, ongoing adsorption
get facilitated due to capillary condensation in mesopores (micropore diameters
between 2 and 50 nm [5, 12]).
Figure 2- 2 The adsorption isotherms classification [21].
Type IV and Type V are similar to Type II and Type III, with the exception that
they have finite limits as pressure reaches saturation pressure due to the finite pore
volume of porous solids (capillary condensation effects) [7]. A schematic for the
adsorptive molecules in type IV, which also includes type I, and II, is given in

33
Figure 2-3.
Figure 2- 3 A schematic for the adsorptive molecules on a solid surface at different
pressure.
As it is illustrated in Figure 2-3 at very low gas pressures, relatively few molecules
are adsorbed, and only a fraction of the adsorbent surface is occupied. As the gas
pressure increases isothermally, surface coverage increases. Near the monolayer
capacity all surface sites become covered, and higher pressures cannot increase the
occupancy anymore. With further increase in pressure multilayer adsorption may
take place. However it is also possible that multilayer adsorption happens on one
part of a porous surface while vacant sites still remain on another part [7].
Monolayer or multilayer adsorption can be an experimental method to distinct
between physisorption and chemisorption. However, for permanent gases above
their critical temperature the isotherm is Type I and monolayer. In chemisorption
the activation energy for adsorption of the first monolayer is much stronger than
34
the one for the second and subsequent layers. In physisorption, on the other hand,
the activation energy for adsorption of the first layer is comparable to the heat of
condensation of the next layers [7, 8].
2.4. Adsorption Kinetics
Once chemisorption is referred to a chemical reaction, it is associated with an
activated energy, which can be expressed by the Arrhenius rate law [6]. However
kinetics are more complex than this in practice. Indeed the activation energy
usually varies with surface coverage due to the energetic heterogeneity or
interphase interactions. Therefore more precise formulations have been proposed
for the adsorption rate representation (Elovich equation [6]). Physisorption, on the
other hand, is a process in which the rate is controlled by mass transfer resistance.
Figure 2-4 shows the contact between a porous adsorbent and a fluid phase with
different resistances in the mass transfer; external film resistance and intraparticle
diffusion resistance. Depending on the adsorption conditions, any one of these
resistances may be dominant or a combination of them determines the overall rate
of mass transfer.

35
Figure 2- 4 Contact of a fluid phase and a porous adsorbent showing some of the possible
mechanism [23].
External film resistance is based on the concept where fluid passing over the
surface of an adsorbent particle develops a boundary layer in which the velocity
parallel to the surface changed rapidly over a very short distance. Mixing occurs in
the bulk stream but not very close to the surface. The adsorbing molecules diffuse
through a stagnant boundary layer. If the thickness of the boundary layer (𝛿) is

36
small compared to the radius of curvature of the adsorbent particle, then the
problem can be solved in one dimension as shown in Figure 2-5. Using the Fick's
Law, the molar flux of component 𝑖 in 𝑧 direction is [22]:
𝑁𝑧𝑖 = −𝐷𝑖𝑑𝑐𝑖𝑑𝑧 (2 − 6)
Where 𝐷𝑖 is diffusivity of component 𝑖 in the fluid phase.
Due to the mass conservation the flux of 𝑖 must be constant through the stagnant
film. With the boundary condition depicted in Figure 2-5 the molar flux of 𝑖
through the film can be simply written as:
𝑁𝑧𝑖 = −𝐷𝑖𝛿 (𝑐𝑖 − 𝑐𝑖
𝑠) = −𝑘𝑓 (𝑐𝑖 − 𝑐𝑖𝑠) (2 − 7)
Since the magnitude of 𝛿 is unknown, the mass-transfer coefficient (𝑘𝑓) is
normally used.
𝑘𝑓 is usually calculated from the following empirical correlation (applicable to a
wide range of conditions [24])
𝑆ℎ =𝑘𝑓𝑑𝑝
𝐷𝑖= 2.0 + 0.6𝑆𝑐1 3⁄ 𝑅𝑒1 2⁄ 0 < 𝑅𝑒 < 200 (2 − 8)
The dimensionless groups Sherwood (𝑆ℎ), Reynolds (𝑅𝑒) and Schmidt (𝑆𝑐) are
defined as follows:
𝑆ℎ =𝑘𝑓𝑑𝑝
𝐷𝑖 (2 − 9)

37
𝑅𝑒 =𝜌𝑔𝑢𝑠𝑑𝑝
𝜇𝑔 (2 − 10)
𝑆𝑐 =𝜇𝑔
𝜌𝑔𝐷𝑖 (2 − 11)
Figure 2- 5 Boundary layer around the surface of an adsorbent pellet.
Intraparticle diffusion resistance includes macropore and micropore diffusion
resistances.
Macropore diffusion can be explained by different mechanisms such as bulk

38
molecular diffusion (dominant in liquid systems), Knudsen diffusion, surface
diffusion, and Poiseuille flow.
Knudsen diffusion is dominant when adsorbing molecules collide with the pore
wall more frequently than themselves. This happens when the pore diameter is
smaller than the mean free path of adsorbing molecules. The mean free path
changes inversely with pressure. At atmospheric pressure in pores of less than
about 10 nm diameter Knudsen diffusion is dominant [6].
Micropore diffusion occurs in very small pores where the pore diameter is not
much bigger than the molecular diameter. Under this condition the diffusing
molecule is not able to escape from the force field of the pore wall, then steric
effects and the effects of non-uniformity in the potential field are dominant.
Poiseuille flow, which is defined as a flow through the pore under the influence of
the pressure gradient, is not usually dominant since most of the time pressure
gradients are kept small enough [6].
2.5. Adsorption Dynamics
A good understanding of the dynamic behaviour of the adsorption processes is
necessary for the process design and optimization. A dynamic model, which
predicts the outlet concentration for any defined change in the system, can

39
generally be represented by the axial dispersed plug flow model. According to a
mass balance for an element of the column the basic differential equation
governing the dynamic behavior is as follows [6, 23]:
𝜕𝑐𝑖𝜕𝑡+ ∇. (𝑐𝑖𝑢𝑠 ) = ∇. (𝐷𝐿∇𝑐𝑖) + 𝑟𝑖 (2 − 12)
which represents the accumulation for specious 𝑖 is either due to the flux (in-out)
across the volume boundary by convection and dispersion or by the consumption
through the chemical reaction.
Since for the adsorption systems two phases exist it may be necessary to
distinguish between the conditions in the fluid and on the adsorbent surface.
The overall rate of mass transfer for component 𝑖 over a solid particle is governed
by a mass transfer rate expression, which must satisfy the boundary conditions
imposed by the equilibrium isotherm, and it must be thermodynamically consistent
so that the mass transfer rate be zero at equilibrium. The simplest case is the
famous linear driving force expression [25, 26].
When a chemical reaction also occurs on the solid surface, the consideration of the
heterogeneous reaction concept is required. This will be addressed in section 2.6.
Since both the equilibrium concentration and the rate coefficients are temperature
dependent, when the system is non-isothermal and heat effects are important an
energy balance is required and all equations are coupled.

40
2.5.1. Pressure drop
The prediction of pressure drop in an adsorbent bed is important since when
pressure drop is high adsorbent may be fluidized or the excessive force may crush
the particles [5]. The most commonly used pressure drop equations are those
calculate pressure drop based on Darcy’s law [27]:
𝑑𝑃
𝑑𝑧= 150 (1 − 휀𝑏)
2𝜇𝑔𝑣 휀𝑏2𝑑𝑝2⁄ (2 − 13)
2.6. Chemical active surfaces
Since in adsorption the uptake amount is highly dependent on the fluid phase
concentration, removal of a trace impurity is a crucial issue. An effective technique
is to preload the adsorbent with a reactant to enhance the adsorption interactions
through a chemisorption and strong bonding (see Figure 2-6). Although
physisorption has been used extensively in industry, a number of commercially
significant processes employ chemisorption for gas purification. Chemisorption is
an important step, the adsorbed molecule forming an intermediate surface
compound that is more receptive to chemical reaction [28].
Obviously the higher external surface area of the adsorbent provide higher contact
and the higher performance is achieved.

41
Some examples include:
Desulfurization. An old method for removal of sulfur compounds involves
contacting gases containing H2S with metal oxides loaded on a various type of
molecular sieves to adsorb the sulfur in the form of metal sulfide [5].
Mercury Removal. Trace amounts of mercury can be removed from industrial
gases, down to low concentrations using activated carbon adsorbent containing
sulfur, and allowing reactions involving the formation of mercuric sulfide to adsorb
mercury from the gas [5].
Figure 2- 6 Schematic image of a preloaded adsorbent.
For a heterogeneous non-catalytic reaction system in which a gas contacts a solid
and reacts with it, the modification of the kinetic expressions resulting from the
mass transfer between phases as well as the contacting patterns of the reacting
phases should be considered [29].

42
2.6.1. Shrink core model
The shrinking unreacted core model is a simple mathematical representation of the
rate equation, which approximates the reaction progress closely to what really takes
place for a wide variety of situations [29, 30].
In this model reaction occurs first at the outer layer of the particle and then moves
into the solid. Thus and, at any time there exists an unreacted core of material
which shrinks in size during reaction (Figure 2-7).
Figure 2- 7 Shrinking unreacted-core model [29].
43
The rate expression for the gaseous reactant 𝑖 includes the combination the
following resistances [29]:
I. Diffusion of gaseous reactant 𝑖 through the gas film surrounding the particle to
the surface of the solid.
II. Penetration and diffusion of 𝑖 through a surface solid layer to the surface of the
unreacted core.
III. Reaction of gaseous 𝑖 with solid at this reaction surface.
However for the small adsorbent particles considered in this thesis the second
resistance is smaller than the other two and step I and III are rate-controlling.
When the resistance of the gas film controls no gaseous reactant is present at the
particle surface; thus, the concentration driving force, 𝑐𝑖 − 𝑐𝑖𝑠, becomes 𝑐𝑖, and is
constant at all times during reaction of the particle. On the other hand when
chemical reaction controls, the progress of the reaction is proportional to the gas
phase concentration of spacious 𝑖, which is available on the solid surface [29].
In the situations where the combined effects of the tow resistances are important,
two limiting cases of diffusion and reaction on a sphere adsorbent particle are
considered. On a stationary interface, molar flux of component 𝑖 equals the rate of
reaction. For a simple first-order reaction, the kinetics depend on the surface rate
constant, 𝑘𝑟, and the concentration of 𝑖 at the surface 𝑐𝑖𝑠:
𝑘𝑓 (𝑐𝑖 − 𝑐𝑖𝑠) = −𝑟𝑖
𝑠 = 𝑘𝑟 𝑐𝑖𝑠 (2 − 14)

44
Thus
−𝑟𝑖𝑠 =
𝑘𝑟𝑘𝑓𝑐𝑖
𝑘𝑓 + 𝑘𝑟 (2 − 15)
When reaction is rapid (𝑘𝑟 ≫ 𝑘𝑓), the rate of mass transfer to the surface limits the
overall rate of reaction. Under these circumstances:
−𝑟𝑖𝑠 ≈ 𝑘𝑓𝑐𝑖 (2 − 16)
To increase 𝑟𝑖𝑠 (the rate of reaction per unit surface area of solid sphere), 𝑐𝑖 and/or
𝑘𝑓 need to be increased.
According to equation (2-8), 𝑘𝑓 rises for an increase in gas velocity and for smaller
particles. For Stockes regime (𝑅𝑒 ≪ 1), equation (2-8) reduces to
𝑘𝑓 =2𝐷𝑖𝑑𝑝 (2 − 17)
When 𝑅𝑒 and 𝑆𝑐 are sufficiently large that the number 2 in equation (2-8) be
negligible with respect to the second term on the right hand side[31]:
𝑘𝑓 = 0.6𝐷𝑖𝑑𝑝𝑆𝑐1 3⁄ 𝑅𝑒1 2⁄ (2 − 18)
𝑘𝑓 = 0.6𝐷𝑖2 3⁄
(𝜇𝑔 𝜌𝑔⁄ )1 6⁄𝑢𝑠1 2⁄
𝑑𝑝1 2⁄
𝑘𝑓 = 0.6(𝑇𝑒𝑟𝑚𝐼)(𝑇𝑒𝑟𝑚𝐼𝐼) (2 − 19)

45
Term I is a function of the physical properties (𝐷𝑖 , 𝜇𝑔 𝜌𝑔⁄ ), which depend on
temperature and pressure only. Diffusivity always increases with increasing
temperature for both gas and liquid systems however; the kinematic viscosity
(𝜇𝑔 𝜌𝑔⁄ ) increases rapidly with temperature for gases and decreases exponentially
with temperature for liquids. Term II is a function of flow conditions and particle
size. Thus, to increase 𝑘𝑓 and 𝑘𝑓consequently, we need to either increase the
velocity of the fluid phase or decrease the particle size.
On the other hand when reaction is slow (𝑘𝑟 ≪ 𝑘𝑓), the rate of reaction on the
surface limits the overall rate of reaction. Under these circumstances:
−𝑟𝑖𝑠 ≈ 𝑘𝑟𝑐𝑖 (2 − 20)
In this case the reaction rate is independent of the velocity of the fluid and for the
solid sphere considered here, independent of particle size [31].
Figure 2-8 shows the change in reaction rate with Term II in equation (2-19). At
low velocities the mass transfer boundary layer thickness is large and diffusion
limits the reaction. At high velocities, the boundary layer thickness is smaller, and
the mass transfer across the boundary layer no longer limits the rate of reaction.
Also for a given velocity, reaction-limiting conditions can be achieved by using
very small particles. However, with decreasing the particle size, the greater the
pressures drop in a packed bed is gained.

46
Figure 2- 8 Regions of mass transfer–limited and reaction–limited reactions [31].
2.6.2. Deactivation of active sites on the solid surface
Activity of the solid reactant can occur in the following ways: i) The reactant may
produce a side product which deposits on and deactivates the surface. ii) The
reaction product may decompose or react further to produce a material that later
deposits on and degrades the surface. iii) An impurity in the feed may deposit on
and deactivate the surface. iv) Pore mouth blocking by deposited solid, v) Thermal
degradation, etc [29, 32].
The change in number of working active sites with the reaction extent is
represented by the variation of an activity term for the solid pellet at any time as
follows [29, 33]:
𝑎 =𝑟𝑖𝑟𝑖𝑜 (2 − 21)

47
where 𝑟𝑖𝑜is rate of reaction for specious 𝑖 on fresh pellet. In general rate of
deactivation may be written as:
𝑑𝑎
𝑑𝑡= −𝑘𝑑𝑐𝑖
𝛾𝑎𝜆 (2 − 21)
where 𝑘𝑑 is the deactivation constant. The simplest case is when 𝛾 = 0 𝑜𝑟 1 and
𝛾 = 1 [34].
The deactivation rate term is introduced into the rate expression and takes into
account the changes in surface area, pore volume, and activity of the solid reactant
due to the reaction [35].
2.7. Adsorption techniques for acid gas removal
2.7.1. H2S dissociation on metal activated surfaces
It has been shown that transition-metal ions [36-41], metal oxides [42] and TiO2
surface [43] enhance H2S adsorption by facilitating its dissociation to HS- and S-
ions. HS- may further react with metal oxide and form sulfide products [44]:
𝐻2𝑆(𝑎𝑑𝑠) + 2(∗) → 𝐻+(∗) + 𝐻𝑆−(∗) (2 − 22)
𝐻𝑆−(∗) + 𝑀𝑂 → 𝑀𝑆 + 𝑂𝐻−(∗) (2 − 23)
where M is transition-metal.

48
Thus the initiation steps in the dissociation mechanism proceed as follows [36-38,
40]: i) Molecular adsorption of hydrogen sulfide on solid surface, ii) Dissociative
chemisorption of adsorbed H2S to HS- and S- ions.
These steps occur spontaneously at room temperature and continue by second
hydrogen separation on metal surfaces. The corresponding thermodynamic
parameters for every stage energy profile of the sequence of the entire events are
listed in Table 2-2. It shows the first three reactions are the stoichiometric reaction
and occur spontaneously at room temperature. The overall reaction occurs at a low
temperature with a complete conversion and selectivity for the hydrogen sulfide
[36, 38].
2.7.2. Effective regenerable moisture removal
A solid desiccant is simply an adsorbent, which has a high affinity and capacity for
moisture removal. The main requirements for an efficient desiccant are a highly
polar surface and a high specific area. The most commonly used desiccants are
silica gel, activated alumina, and the aluminum rich zeolites (4A or 13X) [6]. Since
the moisture isotherms for these materials have different shapes (Figure 2-9), they
have been used for different particular applications.

49
Table 2- 2 Quantum-chemical calculations of the thermodynamic parameters of the
sequential stages of the catalytic hydrogen sulfide decomposition at room temperature [36,
38].
Stage Reaction ∆𝐻298 ∆𝑆298 ∆𝐺298
I Molecular adsorption:
2𝑀 + 2𝐻2𝑆(𝑔) → 2𝑀 − 2𝐻2𝑆(𝑎𝑑𝑠) -12.7 -39.6 -0.9
II
Dissociative chemisorption:
2𝑀 − 2𝐻2𝑆(𝑎𝑑𝑠) → 2𝑀 − 𝑆𝐻(𝑎𝑑𝑠) + 2𝐻(𝑎𝑑𝑠) -16.0 2.2 -16.6
III The removal of the first hydrogen molecule:
2𝑀 − 𝑆𝐻(𝑎𝑑𝑠) + 2𝐻(𝑎𝑑𝑠) → 2𝑀 − (𝜓 − 𝑆2)(𝑎𝑑𝑠) + 2𝐻(𝑎𝑑𝑠) + 𝐻2(𝑔) -0.2 -21.9 6.3
IV The removal of the second hydrogen molecule:
2𝑀 − (𝜓𝑆2)(𝑎𝑑𝑠) + 2𝐻(𝑎𝑑𝑠) → 2𝑀 − (𝜓 − 𝑆2)(𝑎𝑑𝑠) + 𝐻2(𝑔) 25.5 35.1 15.0
V Recombination:
2𝑀 − (𝜓𝑆2)(𝑎𝑑𝑠) → 2𝑀 + (1 4⁄ )𝑆8(𝑎𝑑𝑠)
Overall catalytic reaction:
2𝐻2𝑆(𝑔) → 2𝐻2(𝑔) + (1 4⁄ )𝑆8(𝑎𝑑𝑠)
Gas-phase reaction:
2𝐻2𝑆(𝑔) → 2𝐻2(𝑔) + (1 4⁄ )𝑆8(𝑔)
-19.6
-23.0
15.8
-29.0
-53.2
10.3
-11.0
-7.2
18.9

50
Figure 2- 9 Adsorption equilibrium isotherms for moisture on three commercial
adsorbents: pelletized 4A zeolite (solid line), silica gel (dashed line), and a typical
activated alumina (dot dashed line) [6].
The rectangular form of the moisture isotherm on zeolites shows their high affinity
and high capacity at low moisture partial pressure.
The major disadvantage of zeolite desiccants is that a high temperature is required
for regeneration, which makes their use uneconomic when temperatures are
typically greater than 200 °C [45]. An effective regenerable desiccant is a desirable
adsorbent capable of two things: substantially drying a gas stream at relatively low
water concentration (classical molecular sieve zeolites); and reactivating under
mild conditions (amorphous gel-type desiccants). Titanosilicate desiccants can
potentially provide a high degree of drying with regeneration at much lower
temperatures and energy inputs than other desiccants [46].
51
2.8. Conclusions
Adsorption capacity of an adsorbent for a particular adsorbing molecule is highly
dependent on the interaction between adsorbent and adsorbate molecules.
Chemisorption is known as a brand of adsorption with strong interaction. Loading
active compounds on high surface area substrates take the advantage of both
chemisorption and high accessibility of the sites. The adsorption process also needs
to be optimized to use the separation potential of the adsorption system efficiently.
Development of novel adsorbents as well as process technologies is then growing
in recent years and still crucial to the chemical processing industry.
2.9. References
[1] R. T. Yang, Gas Separation by Adsorption Processes. Boston : Butterworths,
1987.
[2] T. E. Whyte, C. M. Yon and E. H. Wagener, Industrial Gas Separations.
Washington, D.C. : American Chemical Society, 1983.
[3] J. M. Smith and H. C. Van Ness, Introduction to Chemical Engineering
Thermodynamics. New York, McGraw-Hill, 2d ed, 1959.
[4] R. I. Masel, Principles of Adsorption and Reaction on Solid Surfaces. New
York : Wiley, 1996.
[5] "Adsorption, Gas Separation," Kirk-Othmer Encyclopedia of Chemical
Technology, pp. 617, 2007.

52
[6] "Adsorption" Kirk-Othmer Encyclopedia of Chemical Technology, pp. 582,
2007.
[7] Modern Methods in Heterogeneous Catalysis Research. Available:
http://www.fhi-
berlin.mpg.de/acnew/department/pages/teaching/pages/teaching__wintersemester_
_2010_2011/klaus_christmann__adsorption__101105.pdf. (Accessed on Jan. 8th,
2015).
[8] Z. Renju, "Desorption of gases from graphitic and porous carbon
surfaces," 2004.
[9] C. N. Satterfield, Mass Transfer in Heterogeneous Catalysis. Malabar, Fla. : R.
E. Krieger Pub. Co.,1981.
[10] R. T. Yang, Adsorbents : Fundamentals and Applications. Hoboken, N.J.:
Wiley-Interscience, 2003.
[11] J. R. Schrieffer and R. Gomer, "Induced covalent bond mechanism of
chemisorption," Surf Sci, vol. 25, pp. 315-320, 1971.
[12] D. W. Breck, Zeolite Molecular Sieves: Structure, Chemistry, and Use. New
York, Wiley, 1974.
[13] Chemisorption.
Available:
http://www.micromeritics.com/Repository/Files/Chemisorption_Poster.pdf.
(Accessed on Jan. 20th, 2015).
[14] The Surface Analysis Forum.
Available: http://www.uksaf.org/home.html. (Accessed on Jan. 16th, 2015).
[15] C. T. Rettner, D. J. Auerbach, J. C. Tully and A. W. Kleyn, "Chemical
dynamics at the gas-surface interface," J. Phys. Chem., vol. 100, pp. 13021-
13033, 1996.
[16] An Introduction to Surface Chemistry.
Available: http://www.chem.qmul.ac.uk/surfaces/scc/. (Accessed on Jan. 20th,
2015).
[17] A. L. Myers, "Thermodynamics of adsorption in porous materials," AICHE J.,
vol. 48, pp. 145-160, 2002.

53
[18] I. Langmuir, "The Adsorption of Gases on Plane Surfaces of Glass, Mica And
Platinum," J. Am. Chem. Soc., vol. 40, pp. 1361-1403, 1918.
[19] K. Y. Foo and B. H. Hameed, "Insights into the modeling of adsorption
isotherm systems," Chem. Eng. J., pp. 2, 2010.
[20] S. Brunauer, P. H. Emmett and E. Teller, "Adsorption of Gases in
Multimolecular Layers," J. Am. Chem. Soc., vol. 60, pp. 309-319, 1938.
[21] The Adsorption of Gases and Vapors, Volume I.
Available: https://archive.org/details/adsorptionofgase031704mbp. (Accessed on
Jan. 10th, 2015).
[22] M. E. Davis and R. J. Davis, Fundamentals of Chemical Reaction
Engineering. [Electronic Resource]. Boston : McGraw-Hill, International ed, 2003.
[23] H. A. Jakobsen, "Fixed Bed Reactors," Department of Chemical Engineering
Norwegian University of Science and Technology, 2011.
[24] N. Wakao and T. Funazkri, "Effect of fluid dispersion coefficients on particle-
to-fluid mass transfer coefficients in packed beds: Correlation of sherwood
numbers," Chemical Engineering Science, vol. 33, pp. 1375-1384, 1978.
[25] S. N. Nobar and S. Farooq, "Experimental and modeling study of adsorption
and diffusion of gases in Cu-BTC," Chemical Engineering Science, pp. 801, 2012.
[26] R. Haghpanah, A. Rajendran, S. Farooq, I. A. Karimi and M. Amanullah,
"Discrete Equilibrium Data from Dynamic Column Breakthrough
Experiments," Ind Eng Chem Res, vol. 51, pp. 14834-14844, 2012.
[27] R. Haghpanah, A. Majumder, R. Nilam, A. Rajendran, S. Farooq, I. A. Karimi
and M. Amanullah, "Multiobjective Optimization of a Four-Step Adsorption
Process for Postcombustion CO2 Capture Via Finite Volume Simulation," Ind Eng
Chem Res, vol. 52, pp. 4249-4265, 2013.
[28] Introduction to Chemical Adsorption Analytical Techniques and their
Applications to Catalysis.
Available:
http://www.micromeritics.com/repository/files/intro_to_chemical_adsorption.pdf.
(Accessed on Jan. 20th, 2015).
[29] O. Levenspiel, Chemical Reaction Engineering; an Introduction to the Design
of Chemical Reactors. New York, Wiley, 1962.

54
[30] "A grain size distribution model for non-catalytic gas-solid
reactions," 20140118, 1993.
[31] H. S. Fogler, Elements of Chemical Reaction Engineering. Upper Saddle
River, NJ : Prentice Hall PTR, 4th ed, 2006.
[32] C. H. Bartholomew, "Mechanisms of catalyst deactivation," Applied Catalysis
A: General, vol. 212, pp. 17-60, 2001.
[33] N. Yaşyerli, T. Doǧu, G. Doǧu and i. Ar, "Deactivation model for textural
effects of kinetics of gas-solid noncatalytic reactions “char gasification with
CO2”," Chemical Engineering Science, vol. 51, pp. 2523-2528, 6, 1996.
[34] S. Yasyerli, G. Dogu, I. Ar and T. Dogu, "Activities of copper oxide and Cu-V
and Cu-Mo mixed oxides for H2S removal in the presence and absence of
hydrogen and predictions of a deactivation model," Ind Eng Chem Res, vol. 40, pp.
5206-5214, 2001.
[35] H. F. Garces, H. M. Galindo, L. J. Garces, J. Hunt, A. Morey and S. L. Suib,
"Low temperature H2S dry-desulfurization with zinc oxide," Microporous
Mesoporous Mat., vol. 127, pp. 190-197, 2010.
[36] A. N. Startsev, I. I. Zakharov, O. V. Voroshina, A. V. Pashigreva and V. N.
Parmon, "Low-temperature decomposition of hydrogen sulfide under the
conditions of conjugate chemisorption and catalysis," Doklady Physical
Chemistry, vol. 399, pp. 283-286, 2004.
[37] Y. M. Choi, C. Compson, M. C. Lin and M. Liu, "A mechanistic study of H2S
decomposition on Ni- and Cu-based anode surfaces in a solid oxide fuel
cell," Chemical Physics Letters, vol. 421, pp. 179-183, 2006.
[38] I. I. Zakharov, A. N. Startsev, O. V. Voroshina, A. V. Pashigreva, N. A.
Chashkova and V. N. Parmon, "The molecular mechanism of low-temperature
decomposition of hydrogen sulfide under conjugated chemisorption-catalysis
conditions," Russian Journal of Physical Chemistry A, vol. 80, pp. 1403-1410,
2006.
[39] D. R. Alfonso, "First-principles studies of H2S adsorption and dissociation on
metal surfaces," Surf Sci, vol. 602, pp. 2758-2768, 2008.
[40] Q. L. Tang, S. R. Zhang and Y. P. Liang, "Influence of Step Defects on the
H2S Splitting on Copper Surfaces from First-Principles Microkinetic
Modeling," Journal of Physical Chemistry C, vol. 116, pp. 20321-20331, 2012.
55
[41] S. H. Chen, S. Q. Sun, B. J. Lian, Y. F. Ma, Y. G. Yan and S. Q. Hu, "The
adsorption and dissociation of H2S on Cu(100) surface: A DTF study," Surf Sci,
vol. 620, pp. 51-58, 2014.
[42] J. A. Rodriguez, S. Chaturvedi, M. Kuhn and J. Hrbek, "Reaction of H2S and
S2 with metal/oxide surfaces: band-gap size and chemical reactivity," J Phys
Chem B, pp. 5511, 1998.
[43] A. Fahmi, J. Ahdjoudj and C. Minot, "A theoretical study of H2S and MeSH
adsorption on TiO2," Surf Sci, vol. 352–354, pp. 529-533, 1996.
[44] J. Sun, S. Modi, K. Liu, R. Lesieur and J. Buglass, "Kinetics of zinc oxide
sulfidation for packed-bed desulfurizer modeling," Energy Fuels, vol. 21, pp.
1863-1871, 2007.
[45] B. Tanchuk, J. A. Sawada, S. Rezaei and S. M. Kuznicki, "Adsorptive drying
of CO2 using low grade heat and humid, ambient air," Separation and Purification
Technology, vol. 120, pp. 354-361, 2013.
[46] S. M. Kuznicki, K. A. Thrush and H. M. Garfinkel, "Use of crystalline
molecular sieves containing charged octahedral sites in cyclic desiccating
processes" WO1993000152 A1, 1993.
56
3. A novel copper-exchanged
titanosilicate adsorbent for low
temperature H2S removal
3.1. Summary
The H2S removal capacity of copper loaded on a number of titanosilicate supports
was investigated. Copper supported on Engelhard Titanosilicate-2 (Cu-ETS-2) has
been found to be a superior H2S scavenger for maintaining H2S levels below 0.5
ppm because of its high cation exchange capacity and copper dispersion. Cu-ETS-2
demonstrated higher utilization at room temperature when compared to fully
developed commercial H2S adsorbents. In addition it was found that the adsorption
capacity of Cu-ETS-2 is maintained over a wide range of activation temperatures.

57
3.2. Introduction
Hydrogen sulfide (H2S) is a common contaminant in hydrocarbon process streams.
In addition to being found in the process streams of coal gasification plants,
wastewater treatment plants and petrochemical plants, it is present in natural
sources such as hot springs, volcano gases and natural gas. This odorous, colorless,
toxic gas is corrosive and poisonous, and has a negative impact on pipelines and
catalysis, and ceramic membranes used in syngas separations. Even at levels as low
as 3 ppm, severe pipeline corrosion is predicted in the presence of H2S [1]. Nickel
or alumina catalysts, used in steam reforming processes are poisoned by the trace
amounts of H2S in natural gas. PEM fuel cells have anode Pt catalysts that are
susceptible to H2S at even lower levels (0.1-1 ppm), which requires the incoming
hydrogen gas to be essentially free of H2S [2].
Conventional techniques for H2S removal are absorption in liquids (alkaloamines,
ammonia solutions, and alkaline salt solutions), solid supported amines, the Claus
Process, and by reaction on activated carbon or metal oxides [3, 4]. Reactive
removal of H2S is common when the gas stream must be polished down to sub-
ppm levels.
Much of the previously reported work on reactive sequestration of H2S has focused
on using different forms of supported and unsupported metal oxides and mixed
metal oxides, in efforts to improve the adsorbents capacity, thermal stability, and
utilization.

58
Westmoreland et al. have conducted a thermodynamic survey of 28 elements of the
periodic table and found that Fe, Zn, Mo, Mn, V, Ca, Sr, Ba, Co, Cu and W oxides
are all possible candidates for high temperature desulfurization [5]. The study was
focused on selecting materials that would be functional at temperatures between
360°C and 1560°C.
A great deal of effort has been applied to enhancing the adsorptive performance of
metal oxides through heteroatom doping. Ayala et al. used zinc ferrite for the
desulfurization of coal gases at 538°C [6]. Mixed oxides of copper with Cr, Ce, Al,
Mg, Mn, Ti and Fe were also investigated and it was found that CuO-Cr2O3 and
Cu-CeO2 were the most efficient desulfurization adsorbents at 650°C [7].
In order to further enhance the utilization of the active metals, a higher degree of
metal dispersion is required. Active chemicals (metals/metal oxides) can be loaded
on different supports such as Al2O3, TiO2, SiO2, and zeolites in order to gain more
surface areas and improve structural stability.
Tzu-Hsing Ko et al. compared adsorption capacities of Mn, Fe, Cu, Co, Ce and Zn
supported on γ-Al2O3 for H2S removal in syngas at 500°C-700 °C and found that
100% utilization was achieved using copper and manganese [8]. Gasper-Galvin et
al. studied copper, molybdenum and manganese supported on SP-115 zeolite for
desulfurization purposes and observed an increase in the mechanical strength of the
adsorbents [9]. Copper supported on SiO2 and natural zeolite (major phases
consisting of mordenite and clinoptilolite) was also investigated and compared to
pure copper oxide by Kyotani et al. This study showed almost the same

59
breakthrough capacities for copper supported on SiO2 (15 wt.% copper) and zeolite
(20 wt.% copper) as of that for pure copper oxide [10].
Less attention has been paid to H2S removal from gas streams at room temperature.
H2S removal at room temperature is useful when the gas stream’s temperature is
low and in applications such as on-board fuel processing of proton exchange
membrane fuel cells. A comparative study of different metal oxides (Ag, Cu, Zn,
Co, Ni, Ca, Mn and Sn) has been conducted by Mei Xue et al. which showed that
the hydrous CuO has the highest H2S uptake capacity using 10 ppm H2S in N2 at
room temperature [11]. Yang et al. doped ZnO/SiO2 with eight different transition
metals and compared the H2S capacities with ZnO/SiO2 at room temperature. It
was shown that copper doped ZnO/SiO2 had the highest H2S capacity which was
double that of ZnO/SiO2 [12]. Baird et al. also demonstrated that copper and cobalt
dopants enhance the sulfur removal capacity of ZnO at room temperature [1].
At low temperatures H2S can only react with the first monolayer of metal oxides1,
thus selecting the most reactive metals and applying them to supports that yield the
highest surface areas can significantly enhance utilization at these temperatures.
Based on the superior H2S adsorption performance of Cu-based compounds at
room temperature, a novel Cu-based adsorbent was prepared using a non-porous,
high surface area titanosilicate as the support (Cu-ETS-2). Titanosilicate-2 (ETS-2)
has a high surface area and a high cation exchange capacity making it a suitable
support to allow Cu ions a high degree of accessibility toward H2S.

60
This novel adsorbent was tested for the adsorption of low concentrations of H2S at
room temperature and the copper utilization was compared to commercial, low
temperature H2S adsorbents as well as copper-exchanged Engelhard Titanosilicate-
4 (ETS-4) and Engelhard Titanosilicate-10 (ETS-10). The effect of activation
temperature on the H2S capacity of Cu-ETS-2 was also investigated.
3.3. Materials and Methods
3.3.1. Adsorbent preparation
ETS-2, ETS-4 and ETS-10 were hydrothermally synthesized as cited in the
literature [13]. The method for ETS synthesis includes the addition of sources of
silica, sources of titanium, and sources of alkalinity such as sodium and/or
potassium hydroxide and water. Sources of potassium fluoride can be used
optionally to improve the solubility of a solid titanium source. Sodium silicate
(28.7% SiO2, 8.9% Na2O) was the source of silica in ETS-2, ETS-4 and ETS-10.
The source of titanium for ETS-2 was solid Ti2O3, while solubilized TiCl3 was
used in ETS-4 and ETS-10 synthesis.
For the ion exchange experiments a quantity of the as-synthesized powdered
material was mixed with a copper nitrate salt solution. The weight proportion of
adsorbent (ETS-2/4/10) to salt and water was 1:2:10. The salt was first dissolved in

61
the quantity of water then the adsorbent was added and the mixture agitated to
create a slurry. The vessel containing the slurry was then placed in an oven at 80°C
for approximately 18 hours. Afterward, the exchanged samples were filtered and
washed with de-ionized water and dried at 80°C overnight. Adsorbent granules
were generated by mixing the Cu-exchanged powder with Ludox HS-40 colloidal
silica (10:4 wt/wt ratio). The relatively dry mixture was placed in a cylindrical
mold (2.54 cm diameter) and compressed in an axial press to a pressure of 6 metric
tons for about 1 minute. The disk formed at this step was crushed and sieved to
obtain 20-50 mesh particles.
Prior to analysis, samples were activated in air by heating them in a muffle furnace
at a rate of ~4° /min and an isothermal dwell of 2 hrs.
Commercial samples of R3-11G (36 wt.% CuO), R3-12 (40 wt.% ZnO and 40
wt.% CuO), Zinc Oxide (100 wt.% ZnO) were provided by BASF Chemical
Company and were sieved to 20-50 mesh particles and used as received.
3.3.2. Adsorption experiments
A sample of 50 mg of the pelletized adsorbent was packed between plugs of glass
wool in a stainless steel column of 4 cm length and 0.38 cm inside diameter. The
adsorbent was exposed to a continuous flow of 100 ml/min of the 10 ppm H2S
(balance N2) mixture. The flow rate was controlled by needle valves and was
measured using a bubble flow meter. The outlet of the bed was connected to a Gas
Chromatograph (GC) equipped with MXT-1 column (60 m length, 0.53 mm ID)
62
provided by Restek and a FPD detector. The H2S concentration was monitored
continuously during the experiments at 4 min intervals. The breakthrough point
was determined when an H2S concentration of 0.5 ppm was measured at the outlet
of the bed. The FPD detector from SRI is specified to be able to detect H2S at 200
ppb. In our experiments, the typical baseline signal was 5 counts. The area of the
integrated peak increased to 55 counts at 10 ppm H2S at the outlet. This suggests
our detection limit is in line with the instrument specification.
3.3.3. Characterization tests
3.3.3.1. Surface area measurements
The specific surface area of the samples was determined by N2 adsorption using an
Autosorb-1 volumetric system from Quantachrome Instruments. The surface area
of the adsorbent was calculated using the BET method. Since ETS-2 material is not
microporous but is composed of platelets having an exposed surface, multilayer
adsorption can occur and the BET theory is best applied for the surface area
measurements. A t-plot calculation was done to measure the proportion of
micropores in the material.
3.3.3.2. Powder X-ray diffraction (XRD) analysis
The crystalline structures of the adsorbents were examined by XRD measurements
using a Rigaku Geigerflex Model 2173 diffractometer equipped with a cobalt
63
and a graphite monochromator for filtering
the K-beta wavelengths.
3.3.3.3. Transmission electron microscopy (TEM)
The image and selected area electron diffraction (SAED) of Cu-ETS-2 and ETS-2
particles were investigated by a JEOL 2010 and JEOL 2100 with Lab6 filament
transmission electron microscopes (TEM), respectively. Samples in powder form
were dispersed in methanol in an ultrasonic bath for 10 minutes. One or two drops
of each of these suspensions were then placed on a Carbon Type B, Au grid (300
mesh) and dried prior to analysis.
3.3.3.4. Energy dispersive X-ray spectroscopy (EDX)
The point specific elemental analysis of Cu-ETS-2 particles was done with EDX,
which was attached to TEM instrument used in this study.
3.3.3.5. Atomic absorption spectrophotometry (AAS)
Atomic absorption spectrophotometry was performed for investigating the copper
content (wt. %) in Cu-ETS-2, Cu-ETS-4 and Cu-ETS-10. A quantity of material
was weighed using a balance with 0.1 mg resolution. Nitric acid was then added to
the sample to extract the copper species and build-up 10 millilitres of solution. The
copper concentration in the solution was measured with VARIAN 220FS atomic
absorption spectrophotometer afterward.

64
3.4. Results and discussion
3.4.1. Characterization of Cu-ETS-2 before H2S exposure
TEM analysis of the ETS-2 and Cu-ETS-2 samples identified a substantial
amorphous component in both ETS-2 and Cu-ETS-2 (Figure 3-1). Card-like
components are also seen in the TEM images, which are assigned to an impurity
phase. The SAED patterns confirm that only the card-like phase is crystalline.
The TEM images of Cu-ETS-2 (Figure 3-1-b) indicate that the copper exchange
process does not change the morphology of ETS-2 (Figure 3-1-a) and the XRD
patterns (Figure 3-2) likewise indicate that the structure of the sample is unaffected
by the ion exchange process. The low-intensity peaks present in the powder XRD
patterns suggest a minor fraction of crystalline impurity is present and the
broadening of those peaks further suggest that the crystal sizes should be on the
nano-meter scale. The XRD data of Cu-ETS-2 also confirms the high atomic
dispersion of copper ions in the ETS-2 structure, since no diffraction peaks for
copper compounds are detected.
Point specific elemental analysis of Cu-ETS-2 particles was collected by EDX
attached to TEM instrument and the results were used to determine on which
component the exchanged copper resided. The ratios of sodium to titanium and
copper to titanium of each component in the Cu-ETS-2 TEM results are
summarized in Table 3-1. The crystalline component of the exchanged sample
65
contains predominately sodium ions. Due to the low copper content, the impurity
phase (with the card-like morphology) will not measurably contribute to the H2S
capacity of the sample. The amorphous component, however, displays the hallmark
ion exchange characteristics of the nano-titanate and has a significantly higher
copper content compared to the crystalline component. Table 3-1 also shows that
copper to titanium ratio in the amorphous component is almost 10 times higher
than the one for the crystalline component, making the amorphous component
principally responsible for H2S adsorption.
The XRD and TEM results suggest that the samples studied contain predominately
x-ray amorphous ETS-2 and contain a minor portion of inactive, crystalline
impurity.

66
Figure 3- 1 TEM images of ETS-2 (a) and Cu-ETS-2 (b)
Table 3- 1 Elemental ratios derived from EDX analysis results for Cu-ETS-2
Elemental Ratios crystalline impurity amorphous component
Cu : Ti 0.02 0.21
Na : Ti 0.15 0.05

67
Figure 3- 2 XRD patterns of ETS-2 and as-prepared Cu-ETS-2
The XRD patterns for samples of Cu-ETS-2 exposed to different activation
temperatures are shown in Figure 3-3.
The patterns in Figure 3-3 show that Cu-ETS-2 undergoes a phase change at higher
activation temperatures. The XRD pattern of Cu-ETS-2 activated at 700°C shows
reflections for anatase (TiO2) and copper oxide (CuO). The intensities of the XRD
reflections suggest a bulk conversion where the amorphous phase in Cu-ETS-2
gradually changes at temperatures in excess of 400°C.

68
Figure 3- 3 XRD patterns of Cu-ETS-2 activated at different temperatures
A TEM/SAED survey of these samples agreed with the XRD results and showed
that the previously amorphous regions gradually change to crystalline material
although their morphology did not change significantly. The card-like components
maintain their structure and morphology up to 700 °C after which they are no
longer observed in the samples (Table 3-2).

69
Table 3- 2 TEM/SAED survey of Cu-ETS-2 samples activated at different temperatures.
Activation
temperature
Diffraction pattern of
impurity phase (card-like phase)
Structure
Diffraction pattern of
amorphous phase
Structure
25 °C
Single crystal
Amorphous
100°C
Single crystal Amorphous
200°C Single crystal Amorphous
300°C Single crystal Amorphous
400°C Crystalline Amorphous
500°C Crystalline Crystalline
600°C
Crystalline Crystalline
700°C No card- like phase NA
Crystalline

70
The thermal stability of ETS-4 and ETS-10 has been reported in the literature.
Naderi et al. investigated the thermal stability of ETS-4 by studying the XRD
patterns of the sample activated at different temperatures in air [14]. The authors
showed that a partial loss of crystallinity is observed at temperatures ≥ 200°C. The
complete collapse of the crystalline structure was observed at 500°C. Thus copper
exchanged ETS-4 will not be stable at temperatures higher than 200°C. However,
ETS-10 is stable at a wider temperature range, up to 550°C [15]. Another study
also showed that copper exchanged ETS-10 is stable up to 550°C [16].
Surface area measurements were collected for ETS-2, as-prepared Cu-ETS-2, and
the commercial H2S adsorbent samples (Table 3-3). Given that Cu-ETS-2 is
predominantly non-crystalline, its surface area must be derived from the external
surface of very finely divided platelets that make up the material.
Table 3- 3 Specific surface area of ETS-2, Cu-ETS-2 and commercial samples
Sample Specific surface area (m2/g)
ETS-2 230
Cu-ETS-2 187
R3-11Ga 152
R3-12b 118
ZnO 28
a 36 wt.% CuO. b 40 wt.% CuO + 40 wt.% ZnO.

71
The t-plot calculation for ETS-2 indicates that the micropore volume and area are
equal to 0 cc/g and 0 m2/g, respectively. This result confirms that ETS-2 is not a
microporous material.
3.4.2. Adsorption tests
3.4.2.1. H2S breakthrough capacities of Cu-ETS-2 versus Cu-ETS-4 and
Cu-ETS-10
Comparison of the H2S breakthrough capacities on the range of supports (Cu-ETS-
2, Cu-ETS-4 and Cu-ETS-10) is given in Table 3-4. All breakthrough experiments
were carried out on an equivalent mass of adsorbent under the same test conditions.
The H2S capacity was defined as the time it took to measure an outlet concentration
of 0.5 ppm H2S. The copper utilization was calculated by converting the
breakthrough time to moles of H2S, and then dividing that value by the moles of
copper on the adsorbent sample, as measured by atomic adsorption. The blue-green
Cu-ETS-2 granules were converted to dark olive green after H2S exposure.
The low copper utilization in Cu-ETS-4 can be explained by a pore blockage effect.
In crystalline materials with very small pores and channels in their structure the
copper sites nearest the external surface of the crystals react first. When the H2S
reacts to form copper sulfide the occluded sulfur partially blocks the pore openings,
impeding gas access to the rest of the crystal [10]. The high copper utilization of
Cu-ETS-10 was anticipated since ETS-10 has a larger pore diameter that will allow

72
the gas passage even if the channel is partially blocked. The atomic dispersion of
copper in the microporous framework allows for complete utilization of the metal.
Table 3- 4 Cu-ETS-2, Cu-ETS-4 and Cu-ETS-10 breakthrough capacities and copper
utilizations
Adsorbenta
H2S breakthrough
capacity
(mg H2S/g of
adsorbent)
Copper loading
wt.%
% Copper
utilization
Cu-ETS-2 47 12.5 71
Cu-ETS-4 11 4.8 44
Cu-ETS-10 45 8.4 98
a All adsorbents were activated at 100°C.
Unlike Cu-ETS-4 and Cu-ETS-10, which have crystalline microporous
frameworks, Cu-ETS-2 is composed of finely divided platelets. The nano-sized
platelets provide the material with its relatively high external surface area. The
substantial, but incomplete, copper utilization for Cu-ETS-2 may be due to
inconsistencies in the sample structure that may not allow some of the exchanged
copper ions to react with H2S, or may be the result of active copper sites being
blinded due to copper sulfide formation on the surface of the particles.

73
3.4.2.2. H2S breakthrough capacity of Cu-ETS-2 versus commercial
adsorbents
Cu-ETS-2, activated at 100°C, demonstrated superior H2S breakthrough capacity
per gram compared to the ZnO and R3-12 (40 wt.% ZnO + 40 wt.% CuO)
commercial adsorbents. The breakthrough times presented in Figure 3-4 show that,
under the specified test conditions, Cu-ETS-2 is capable of maintaining a column
outlet concentration of H2S of less than 0.5 ppm for ~27 hours. The only
commercial sample with longer breakthrough time is R3-11G sample (36 wt.%
CuO).
Figure 3- 4 Comparison of the breakthrough times for 50 mg of Cu-ETS-2 and commercial
H2S adsorbents
Table 3-5 shows that, despite having the highest capacity, R3-11G suffers from low
utilization of copper species (41 wt.%). This is likely due to the dense copper
sulfide phase formed during the sulfidation, which blinds the particle to further
reaction with H2S [10]. The data also shows that Cu-ETS-2 has the highest

74
utilization amongst all the samples. The significant improvement in Cu utilization
in Cu-ETS-2 compared to the rest of the samples is caused by an increase in the
degree of dispersion of active species on the ETS-2 support via ion-exchange.
Table 3- 5 Cu-ETS-2 versus commercial samples
Adsorbent
Loading wt.% % Utilization
Copper Zinc
Cu-ETS-2 12.5 - 71
R3-11G 29 - 41
R3-12 32 32 6.5
ZnO - 80 0.8
3.4.2.3. Effect of activation temperature on H2S capacity of Cu-ETS-2
In order to investigate the effect of activation temperature on H2S breakthrough
capacity of Cu-ETS-2, H2S adsorption tests were conducted for samples activated
at different temperatures.
Figure 3-5 shows that the H2S capacity of Cu-ETS-2 remains relatively unchanged
after the material has been exposed to temperatures of up to 500°C. The decrease in
capacity after 500 °C correlates with an increase in the intensity of anatase

75
reflections seen in the XRD patterns (Figure 3-3) and is assigned to a re-
crystallization event which renders Cu-ETS-2 inactive toward H2S.
Figure 3- 5 Breakthrough capacity of Cu-ETS-2 activated at different temperatures
3.5. Conclusions
The data collected demonstrates that, at room temperature, Cu-ETS-2 is an H2S
adsorbent with a high gravimetric H2S capacity and high copper utilization. This
adsorbent maintains its capacity over a wide range of activation temperatures. The
copper utilization in Cu-ETS-2 is higher than that of highly developed commercial

76
samples due to its high surface area and the degree of copper dispersion in ETS-2.
The non-porous nature of the ETS-2 structure takes advantage of the ion exchange
characteristics of microporous frameworks.
3.6. References
[1] T. Baird, P. J. Denny, R. Hoyle, F. Mcmonagle, D. Stirling and J. Tweedy,
"Modified Zinc-Oxide Absorbents for Low-Temperature Gas Desulfurization,”
Journal of the Chemical Society-Faraday Transactions, vol. 88, pp. 3375-3382,
1992.
[2] D. A. Berry, D. Shekhawat and J. J. Spivey, Fuel Cells. [Electronic Resource] :
Technologies for Fuel Processing. Amsterdam ; Boston : Elsevier, 2011.
[3] D. Stirling, The Sulfur Problem [Electronic Resource] : Cleaning Up Industrial
Feedstocks / Diane Stirling. Cambridge, UK : Royal Society of Chemistry, 2000.
[4] Q. Xue and Y. Liu, "Removal of minor concentration of H2S on MDEA-
modified SBA-15 for gas purification," Journal of Industrial and Engineering
Chemistry, vol. 18, pp. 169-173, 2012.
[5] Westmoreland P.R. , Harrison D.P., " Evaluation of candidate solids for high-
temperature desulfurization of low-Btu gases," Environmental Science and
Technology, vol. 10, pp. 659, 1976.
[6] R. E. AYALA and D. W. MARSH, "Characterization and Long-Range
Reactivity of Zinc Ferrite in High-Temperature Desulfurization Processes," Ind
Eng Chem Res, vol. 30, pp. 55-60, 1991.
[7] J. Abbasian, A. H. Hill, J. R. Wangerow, M. Flytzani-Stephanopoulos, L. Bo
and C. Patel, "Development of novel copper-based sorbents for hot-gas cleanup.
[Quarterly] technical report, 1992.
[8] T. Ko, H. Chu and L. Chaung, "The sorption of hydrogen sulfide from hot
syngas by metal oxides over supports," Chemosphere, vol. 58, pp. 467-474, 2005.

77
[9] Gasper-Galvin L. D., Atimtay A. T., Gupta R. P., " Zeolite-Supported Metal
Oxide Sorbents for Hot-Gas Desulfurization," Ind. Eng. Chem. Res., vol. 37,
pp. 4157, 1998.
[10] T. Kyotani, H. Kawashima, A. Tomita, A. Palmer and E. Furimsky, "Full
paper: Removal of H2S from hot gas in the presence of Cu-containing
sorbents," Fuel, vol. 68, pp. 74-79, 1989.
[11] M. Xue, R. Chitrakar, K. Sakane and K. Ooi, "Screening of adsorbents for
removal of H2S at room temperature," Green Chem., vol. 5, pp. 529-534, 2003.
[12] H. Yang and B. Tatarchuk, "Novel-doped zinc oxide sorbents for low
temperature regenerable desulfurization applications," AICHE J., 2010.
[13] S. M. Kuznicki, "Large-pored crystalline titanium molecular sieve zeolites,",
19910430; 19910430, 1991.
[14] M. Naderi and M. W. Anderson, "Phase transformation of microporous
titanosilicate ETS-4 into narsarsukite," Zeolites, vol. 17, pp. 437-443, 1996.
[15] M. W. Anderson, O. Terasaki, T. Ohsuna, P. Malley, A. Philippou, S. P.
Mackay, A. Ferreira, J. Rocha and S. Lidin, "Microporous Titanosilicate Ets-10 - a
Structural Survey," Philosophical Magazine B-Physic of Condensed Matter
Statistical Mechanics Electronic Optical and Magnetic Properties, vol. 71, pp. 813-
841, 1995.
[16] A. Gervasini, C. Picciau and A. Auroux, "Characterization of copper-
exchanged ZSM-5 and ETS-10 catalysts with low and high degrees of
exchange," Microporous and Mesoporous Materials, vol. 35, pp. 457-469, 2000.

78
4. Breakthrough Performances of Metal-
Exchanged Nanotitanate ETS-2
Adsorbents for Room Temperature
Desulfurization
4.1. Summary
Engelhard Titanosilicate-2 (ETS-2) has shown to be a promising substrate to load
active sites for deep H2S removal (to sub-ppm levels) for gas purification
applications at room temperature. Because of the high external surface area and the
cation exchange capacity of ETS-2, active sites can be highly dispersed and very
accessible to H2S molecules making it a novel support material for metal-oxide
H2S adsorbents. In this paper, we report the room temperature H2S breakthrough
performances of ETS-2 metal exchanged with Ag, Ca, Cu and Zn in comparison to
a fully developed commercial H2S adsorbent (R3-11G, 36 wt% CuO, BASF). The
results indicate the following trend for H2S uptake capacities at room temperature:
Cu-ETS-2>Ag-ETS-2>Zn-ETS-2≈R3-11G>Ca-ETS-2≈Na-ETS-2. Cu exchanged
ETS-2 displays the highest H2S capacity of 29.7 mg H2S/g adsorbent compared to
the other investigated materials, making it the most promising metal-exchanged
ETS-2 for room temperature desulfurization.

79
4.2. Introduction
Hydrogen sulfide (H2S) is one of the major contaminants in various industrial gas
streams that cause a number of negative effects such as corrosion of the pipelines,
generation of harmful environmental emissions, etc. Its removal is therefore
extremely necessary [1-4]. Even at very low concentrations (<1 ppm) H2S has
detrimental effects on many industrial catalysts (such as those used in reforming
processes and fuel cells) and ceramic membranes (used in syngas separations) [5-
7]. In addition, during the combustion process of biogas it causes corrosion in
thermal or thermo-catalytic conversion devices [4] as well as resulting in other
environmental hazards like acid rain [3, 8].
To improve the separation efficiency and for particular applications (e.g. natural
gas sweetening and refining desulfurization of fuel cell system products) there is an
increasing requirement for gas purification and H2S scavenging at low temperatures
(<200 °C). In particular, H2S removal at room temperature for such applications is
essential since both reforming and fuel cell catalysts are susceptible to H2S at levels
as low as 0.1-1 ppm [4, 7]. Among the currently used methods for H2S removal, the
adsorptive technique is the simplest and the most efficient and cost effective at low
concentration and temperature [4, 9-11]. It is capable of reducing sulfur
concentration in the process streams to sub ppm levels [7].
Adsorption processes using various metal and mixed metal oxides have been
studied for room temperature [8, 12] and relatively low temperature (<400 °C)

80
desulfurization [13-15], focusing more on high surface area pure zinc oxide or
mixed with other metal-oxides[3, 8, 12-15]. From the differences in the intrinsic
reactivity of metal oxides with H2S by thermodynamic driving force ZnO, CuO,
Ag2O and CaO have shown favorable sulfidation at room temperature [8, 12].
High dispersion of reactive sites can considerably enhance the reaction between
metal compounds and H2S molecules [3]. An approach for improving
desulfurization capacity at room temperature is to load reactive sites on high
surface area supports, which include zeolites [16-18], carbon sorbents [19, 20],
SBA-15 and other mesoporous material supports [17, 21-24]. Cu-ZnO/SiO2 and Cu
supported titanosilicate have been studied for adsorptive removal of H2S at room
temperature as well [7, 25].
To further improve the capacity and utilization of supported metal-oxide
adsorbents, Engelhard Titanosilicate-2 (ETS-2) is used as a novel substrate material
to load active ions for deep H2S removal (to sub-ppm levels) for gas purification
applications at room temperature. ETS-2 has high external surface area and cation
exchange capacity, which allow active ions to be highly dispersed and accessible to
H2S molecules [7].
In the present investigation we have exchanged Na-ETS-2 (native form) with metal
ions Cu+2, Ag+, Zn2+, Ca2+. Their H2S adsorption and room temperature H2S
removal capacities were then determined and compared to that of a commercial
sample. Different characterization techniques such as X-ray diffraction, scanning
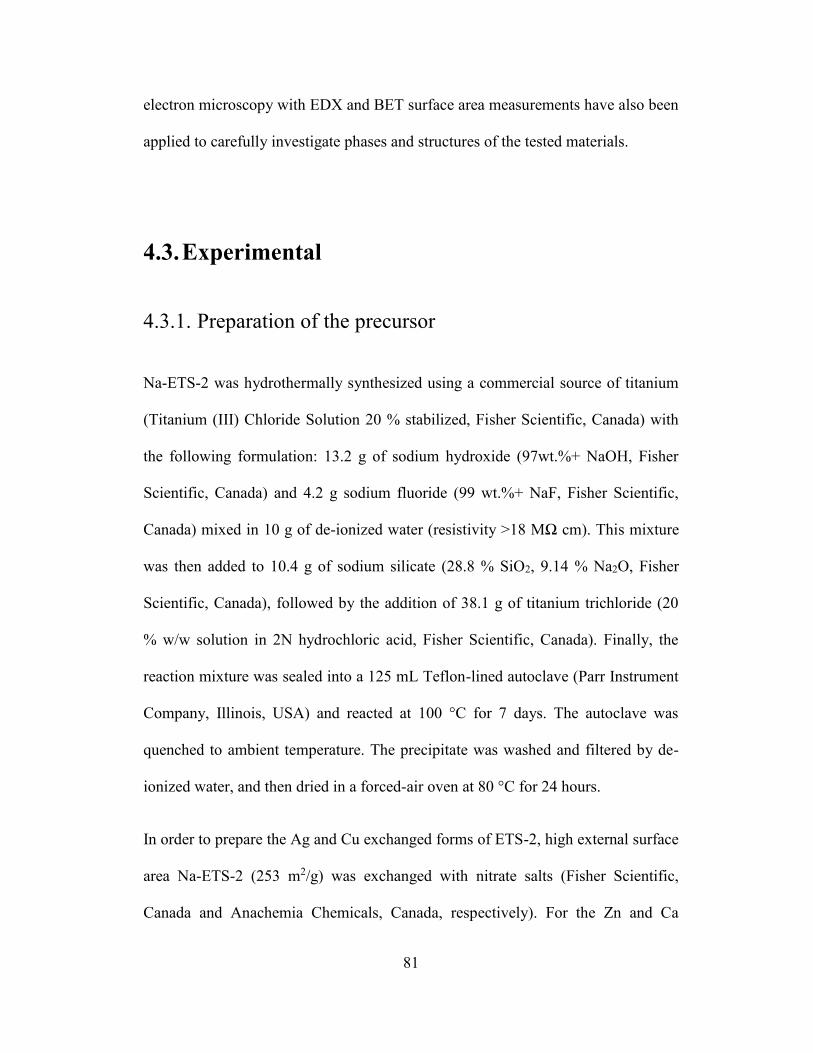
81
electron microscopy with EDX and BET surface area measurements have also been
applied to carefully investigate phases and structures of the tested materials.
4.3. Experimental
4.3.1. Preparation of the precursor
Na-ETS-2 was hydrothermally synthesized using a commercial source of titanium
(Titanium (III) Chloride Solution 20 % stabilized, Fisher Scientific, Canada) with
the following formulation: 13.2 g of sodium hydroxide (97wt.%+ NaOH, Fisher
Scientific, Canada) and 4.2 g sodium fluoride (99 wt.%+ NaF, Fisher Scientific,
Canada) mixed in 10 g of de-ionized water (resistivity >18 MΩ cm). This mixture
was then added to 10.4 g of sodium silicate (28.8 % SiO2, 9.14 % Na2O, Fisher
Scientific, Canada), followed by the addition of 38.1 g of titanium trichloride (20
% w/w solution in 2N hydrochloric acid, Fisher Scientific, Canada). Finally, the
reaction mixture was sealed into a 125 mL Teflon-lined autoclave (Parr Instrument
Company, Illinois, USA) and reacted at 100 °C for 7 days. The autoclave was
quenched to ambient temperature. The precipitate was washed and filtered by de-
ionized water, and then dried in a forced-air oven at 80 °C for 24 hours.
In order to prepare the Ag and Cu exchanged forms of ETS-2, high external surface
area Na-ETS-2 (253 m2/g) was exchanged with nitrate salts (Fisher Scientific,
Canada and Anachemia Chemicals, Canada, respectively). For the Zn and Ca

82
exchanged forms, Na-ETS-2 was exchanged with the chloride salts (Fisher
Scientific, Canada). The ion exchange procedure was done by mixing a quantity of
as synthesized ETS-2 with the salt dissolved in deionized water (weight proportion
1:2:10). Obtained slurry was kept in an oven at 80 °C for approximately 18 h
following by filtering and washing with deionized water and dried at 80 °C
overnight. The exchanged powders were pressed into binderless pellets, which
were then crushed and sieved to 1.19 mm to 0.595 mm (No. 16 to 30 mesh)
fraction for use in the H2S removal test experiments. The commercial sample R3-
11G (BASF, New Jersey, USA) was also sieved to obtain the same particle size.
4.4. Adsorption tests
A sample of 30 mg of each adsorbent was packed between plugs of glass wool in a
stainless steel column of 3.8 mm (inner diameter). A certified gas mixture 10 ppm
H2S in He (Praxair, Canada) was passed through the column at a continuous flow
of 100 mL/min. The feed flow rate was controlled with a mass flow controller
(MFC, Alicat Scientific, Arizona, USA). The outlet concentration of the bed
recorded at 7 min intervals was monitored using a gas chromatograph (GC)
equipped with MXT-1 column 60 m in length and 0.53 mm inner diameter (Restek,
Bellefonte, USA) and a flame photometric detector (FPD, SRI Instruments,
Canada). The FPD detector is specified to be able to detect H2S at 200 ppb.

83
The H2S breakthrough capacity of each adsorbent (𝑞(𝑡)) was calculated by using
the H2S concentration in the inlet gas (𝑐𝑜), the gas flow rates (𝐹𝑖𝑛 and 𝐹𝑜𝑢𝑡, inlet and
outlet respectively), bed volume (𝑉𝑏), column void fraction (휀𝑏), breakthrough time
(𝑡∞), mass of adsorbent (𝑤), H2S molecular weight (𝑀𝑤) and is reported as (mg H2S)
/ (g adsorbent) through the following equation:
𝑀𝑤
𝑤∫ (𝐹𝑖𝑛 − 𝐹𝑜𝑢𝑡)𝑑𝑡𝑡∞
0
= 𝑞(𝑡) + 𝑐𝑜 𝑉𝑏 휀𝑏 𝑀𝑤
𝑤 (4 − 1)
Reproducibility was confirmed by repeating the breakthrough experiments at least
twice and the testing system error was considered by averaging the measurements
for each sample.
4.4.1. Microstructure characterization
The X-ray diffraction (XRD) was conducted to observe the material structures of
the tested samples using a Rigaku Geigerflex 2173 (Rigaku Corporation, Tokyo,
Japan) with a vertical goniometer. The elemental analysis of the adsorbents was
performed using a Zeiss EVO MA 15 (Zeiss, Goettingen, Germany) equipped with
a Bruker Silicon Drift Detector for Energy Dispersive X-Ray analysis (EDX). The
BET specific surface area data was collected by an ASAP 2020 instrument
(Micromeritics Instrument Corporation). Scanning electron microscopy was
performed using a high resolution Hitachi S-5500 Series SEM (Hitachi, Japan)
equipped with EDX.

84
4.5. Results
4.5.1. H2S breakthrough performance
Figure 4-1 demonstrates the H2S breakthrough capacities for all adsorbents using
equation 4-1. Blank correction is neglected due to the prompt H2S response
obtained from the empty column tested with the glass wool. Negligible H2S
removal capacity of the base material Na-ETS-2 confirms that it does not have any
role in H2S removal and has been chosen properly as an inactive substrate to only
expose active metal sites toward H2S molecules. The data also show that among
different exchanged forms of ETS-2, Cu exchanged ETS-2 has the highest H2S
removal capacity followed by Ag-ETS-2. The latter’s performance is slightly
higher than the commercial R3-11G which has almost the same capacity as Zn-
ETS-2. Ca exchanged ETS-2 shows minor H2S uptake capacity under the current
experimental conditions.

85
Figure 4- 1 H2S breakthrough profiles of different tested adsorbents.
4.5.2. Phase formation and morphology
While the sulfidation of CuO, Ag2O, ZnO and CaO is thermodynamically favorable
at room temperature, it is noticeably different for each oxide (ΔG298, -132.35
kJ/mol, -233.02 kJ/mol, -81.96 kJ/mol, -70.40 kJ/mol, HSC thermodynamic
software). H2S removal capacity of the studied samples does not follow the same
trend of the metal oxide affinities to reaction with H2S. This simply indicates that
several other factors may influence the H2S removal capacity of a metal-exchanged
form of ETS-2 (see discussion in section 4.6).

86
Figure 4-2 shows the XRD patterns of the native and the different metal exchanged
forms of ETS-2. The native form is cryptocrystalline as evidenced by low broad
peaks in the XRD profile, which are characteristic of nano particles of anatase [25].
It can be seen that no significant crystalline peaks are visible for the rest of the
samples, indicating that Na-ETS-2 structure is able to accommodate Ag, Ca, Cu
and Zn during the ion exchange process without having any significant effect on its
nano structure.
Figure 4- 2 XRD patterns for different ion exchanged forms of ETS-2.

87
Previously we have found that for Cu-ETS-2 at high temperature above 500°C
structural changes occur [7]. In the presence of H2S, structural changes start to
occur from 350 °C. However, the removal capacity still shows promising values up
to 650 °C after which sintering progresses leading to loss of copper adsorption sites
[25].
The external surface areas of all the tested adsorbents are given in Table 4-1.
Results show that besides Ag-ETS-2, all samples have very high surface area.
Table 4- 1 External surface area of different ion-exchanged forms of ETS-2 and a
commercial sample R3-11G.
Adsorbent BET surface area (m2/g)
Cu-ETS-2 250
Ag-ETS-2 173
Zn-ETS-2 297
Ca-ETS-2 293
R3-11G 264
Metal content of the samples have been determined through energy dispersive x-
ray Spectroscopy (EDX). Results are given in Table 4-2. From the EDX results it
can be seen that Ag-ETS-2 has very high Ag content. The metal loading for Cu and
Zn are similar while Ca-ETS-2 has the lowest metal content.

88
Table 4- 2 Elemental analysis derived from EDX results for different adsorbents.
Adsorbent Ion Norm. wt%
Cu-ETS-2 Cu 13.2
Ag-ETS-2 Ag 39.0
Zn-ETS-2 Zn 14.3
Ca-ETS-2 Ca 8.1
R3-11G4 Cu 28.5
Based on the SEM images presented in Figure 4-3 the copper exchange process
seems to enlarge the dendritic structure on the surface of ETS-2 while the particle
morphology remains the same. Zn-ETS-2 also shows close morphology to the un-
exchanged substrate material ETS-2. The Ag and Ca exchange processes change
the physical structure of ETS-2 significantly. The particles have become highly
agglomerated.
Figure 4-4 shows the metal dispersion on Cu-ETS-2, Ag-ETS-2, Zn-ETS-2 and Ca-
ETS-2 samples. Metal sites are well dispersed on ETS-2 and exposed to H2S
molecules.
4 MDS provided by BASF
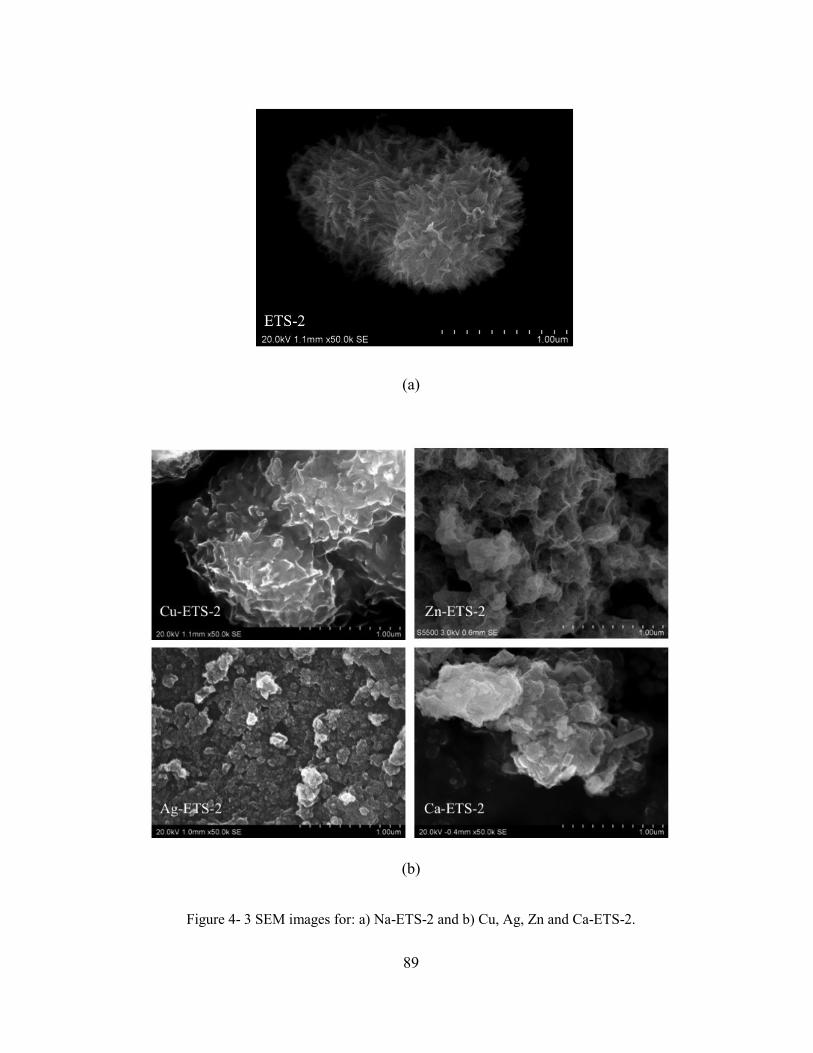
89
(a)
(b)
Figure 4- 3 SEM images for: a) Na-ETS-2 and b) Cu, Ag, Zn and Ca-ETS-2.

90
Figure 4- 4 Metal dispersion on Cu, Ag, Zn and Ca-ETS-2. L- secondary electron images
and R- corresponding elemental maps.

91
4.6. Discussion
Several factors may influence the room temperature breakthrough performance of
metal-oxide adsorbents. Among them are physical structure, external surface area
and both number and affinity of the adsorption sites [3]. The high metal content
(Table 4-2) of Ag-ETS-2 but rather low H2S removal capacity could be attributed
to its low surface area (Table 4-1). In addition, a lot of the Ag molecules are not in
their active form for reaction with H2S. A high resolution SEM image of this
sample in Figure 4-5 clearly shows the presence of inactive sites of metallic silver
dots on Ag-ETS-2.
From Figure 4-4 it can be seen that silver is well dispersed on Ag-ETS-2 as the
other metal ions on other samples. Ag-ETS-2 compared to other adsorbents form
highly agglomerated particles as shown in Figure 4-3. This also explains the lower
surface area of Ag-ETS-2 compared to the other samples presented in Table 4-1.
Agglomeration changes some physical properties like surface area and the
adsorption capacity tends to decrease with increasing agglomeration [22].

92
Figure 4- 5 High-resolution SEM image of Cu-ETS-2 and Ag-ETS-2.
The formation of some tetragonal particles can be observed in the Ca-ETS-2
morphology (Figure 4-6). Figure 4-7 shows an EDX line scan through a tetragonal
particle indicated by an arrow in Figure 4-6.

93
Figure 4- 6 High-resolution SEM image of Ca-ETS-2.
Figure 4- 7 EDX line scan through a tetragonal particle on Ca-ETS-2.

94
It can be seen that these particles are Ti-rich with very low Ca loading. This means
that these particles can be considered as inactive sites for the purpose of this study.
This observation is in good agreement with the low metal content in Ca-ETS-2
reported in Table 4-2. The low affinity of CaO for the reaction with H2S in section
4.5.2 in addition to low metal loading compared to the other samples could
probably cause the negligible H2S removal capacity of Ca-ETS-2.
Among tested adsorbents, Cu-ETS-2 and Zn-ETS-2 show similar physical
structures and amount of metal loading as well as surface area while their H2S
removal capacities are more different. Another factor, which strongly influences
their breakthrough performances, is their thermodynamic property at room
temperature. CuO is thermodynamically favorable for sulfidation than ZnO as
indicated by their previously mentioned ΔGs. Moreover the sulfidation of ZnO
requires more rearrangement of the anions than CuO, which results in slower rate
of the lattice diffusion of the anions, or exchange of dissociated parts of H2S with
the lattice oxide [3].
High resolution SEM results for Cu-ETS-2 and spent sample (after H2S
adsorption) are given in Figure 4-8. It can be seen how surface structure is changed
after H2S adsorption when agglomerated particles are formed.

95
Figure 4- 8 SEM results for Cu-ETS-2 samples before (left hand side) and after (Right
hand side) H2S treatment at room temperature.
4.7. Conclusions
High surface area and cation exchange capacity nanotitanate ETS-2 was used as
support material and cation-exchanged with Ag, Ca, Cu and Zn for potential
adsorbents of sub-ppm levels of H2S at room temperature. Breakthrough
experimental results show that Cu-ETS-2 has the most promising performance as
adsorbent material outperforming even the commercial sample. It has a high sulfur
adsorption capacity of 29.7 mg H2S/g adsorbent. Lower H2S removal capacities for
silver, zinc and calcium samples can be attributed to the presence of inactive sites
such as metallic silver dots and the rigidity of physical structure of the material
which lower thermodynamically favorable sulfidation reactions.

96
4.8. References
[1] S. Yasyerli, G. Dogu, I. Ar and T. Dogu, "Dynamic analysis of removal and
selective oxidation of H2S to elemental sulfur over Cu-V and Cu-V-Mo mixed
oxides in a fixed bed reactor," Chemical Engineering Science, vol. 59, pp. 4001-
4009, 2004.
[2] Y. Elsayed, M. Seredych, A. Dallas and T. J. Bandosz, "Desulfurization of air
at high and low H2S concentrations," Chem. Eng. J., vol. 155, pp. 594-602, 2009.
[3] D. Jiang, L. Su, L. Ma, N. Yao, X. Xu, H. Tang and X. Li, "Cu-Zn-Al mixed
metal oxides derived from hydroxycarbonate precursors for H2S removal at low
temperature," Appl. Surf. Sci., vol. 256, pp. 3216-3223, 2010.
[4] S. P. Hernández, M. Chiappero, N. Russo and D. Fino, "A novel ZnO-based
adsorbent for biogas purification in H2 production systems," Chem. Eng. J., vol.
176–177, pp. 272-279, 2011.
[5] D. A. Bhandari, N. Bessho and W. J. Koros, "Dual layer hollow fiber sorbents
for trace H2S removal from gas streams," Chemical Engineering Science, vol. 94,
pp. 256-264, 2013.
[6] G. Monteleone, M. De Francesco, S. Galli, M. Marchetti and V. Naticchioni,
"Deep H2S removal from biogas for molten carbonate fuel cell (MCFC)
systems," Chem. Eng. J., vol. 173, pp. 407-414, 2011.
[7] S. Rezaei, A. Tavana, J. A. Sawada, L. Wu, A. S. M. Junaid and S. M.
Kuznicki, "Novel Copper-Exchanged Titanosilicate Adsorbent for Low
Temperature H2S Removal," Ind Eng Chem Res, vol. 51, pp. 12430-12434, 2012.
[8] M. Xue, R. Chitrakar, K. Sakane and K. Ooi, "Screening of adsorbents for
removal of H2S at room temperature," Green Chem., vol. 5, pp. 529-534, 2003.
[9] L. Zhou, M. Yu, L. Zhong and Y. Zhou, "Feasibility study on pressure swing
sorption for removing H2S from natural gas," Chemical Engineering Science, vol.
59, pp. 2401-2406, 2004.
[10] F. Gholampour and S. Yeganegi, "Molecular simulation study on the
adsorption and separation of acidic gases in a model nanoporous
carbon," Chemical Engineering Science, vol. 117, pp. 426-435, 2014.

97
[11] S. Velu, X. Ma and C. Song, "Zeolite-based adsorbents for desulfurization of
jet fuel by selective adsorption," in ACS Division of Fuel Chemistry, Preprints,
2002, pp. 447-448.
[12] C. L. Carnes and K. J. Klabunde, "Unique chemical reactivities of
nanocrystalline metal oxides toward hydrogen sulfide," Chemistry of Materials,
vol. 14, pp. 1806-1811, 2002.
[13] T. Baird, K. Campbell, P. Holliman, R. Hoyle, M. Huxam, D. Stirling, B.
Williams and M. Morris, "Cobalt-zinc oxide absorbents for low temperature gas
desulfurisation," J. Mater. Chem., vol. 9, pp. 599-605,1999.
[14] C. Babé, M. Tayakout-Fayolle, C. Geantet, M. Vrinat, G. Bergeret, T. Huard
and D. Bazer-Bachi, "Crystallite size effect in the sulfidation of ZnO by H2S:
Geometric and kinetic modelling of the transformation," Chemical Engineering
Science, vol. 82, pp. 73-83, 2012.
[15] A. Moezzi, A. M. McDonagh and M. B. Cortie, "Zinc oxide particles:
Synthesis, properties and applications," Chem. Eng. J., vol. 185–186, pp. 1-22,
2012.
[16] D. Melo, J. de Souza, M. Melo, A. Martinelli, G. Cachima and J. Cunha,
"Evaluation of the zinox and zeolite materials as adsorbents to remove H2S from
natural gas," Colloid Surf. A-Physicochem. Eng. Asp., vol. 272, pp. 32-36, 2006.
[17] D. Crespo, G. Qi, Y. Wang, F. H. Yang and R. T. Yang, "Superior sorbent for
natural gas desulfurization," Ind Eng Chem Res, vol. 47, pp. 1238-1244, 2008.
[18] P. Kumar, C. Sung, O. Muraza, M. Cococcioni, S. Al Hashimi, A. McCormick
and M. Tsapatsis, "H2S adsorption by Ag and Cu ion exchanged
faujasites," Microporous Mesoporous Mat., vol. 146, pp. 127-133, 2011.
[19] D. Nguyen-Thanh and T. Bandosz, "Activated carbons with metal containing
bentonite binders as adsorbents of hydrogen sulfide," Carbon, vol. 43, pp. 359-
367, 2005.
[20] F. Li, J. Wei, Y. Yang, G. H. Yang and T. Lei, "Preparation of Sorbent Loaded
with Nano-CuO for Room Temperature to Remove of Hydrogen Sulfide," Applied
Mechanics and Materials, vol. 475, pp. 1329-1333, 2014.
[21] Q. Xue and Y. Liu, "Removal of minor concentration of H2S on MDEA-
modified SBA-15 for gas purification," J. Ind. Eng. Chem., vol. 18, pp. 169-173,
2012.

98
[22] M. Hussain, N. Abbas, D. Fino and N. Russo, "Novel mesoporous silica
supported ZnO adsorbents for the desulphurization of biogas at low
temperatures," Chem. Eng. J., vol. 188, pp. 222-232, 2012.
[23] X. Wang, T. Sun, J. Yang, L. Zhao and J. Jia, "Low-temperature H2S removal
from gas streams with SBA-15 supported ZnO nanoparticles," Chem. Eng. J.,
vol. 142, pp. 48-55, 2008.
[24] D. Montes, E. Tocuyo, E. Gonzaĺez, D. Rodriǵuez, R. Solano, R. Atencio, M.
A. Ramos and A. Moronta, "Reactive H2S chemisorption on mesoporous silica
molecular sieve-supported CuO or ZnO," Microporous and Mesoporous
Materials, vol. 168, pp. 111-120, 2013.
[25] P. Dhage, A. Samokhvalov, D. Repala, E. C. Duin, M. Bowman and B. J.
Tatarchuk, "Copper-Promoted ZnO/SiO2 Regenerable Sorbents for the Room
Temperature Removal of H2S from Reformate Gas Streams," Ind Eng Chem Res,
vol. 49, pp. 8388-8396, 2010.

99
5. Chemisorption of H2S on Copper-ETS-
2 packed-column: experiment and
modeling
5.1. Summary
Copper supported on Engelhard Titanosilicate-2 (ETS-2) has been shown to be a
promising adsorbent for deep H2S removal (to sub-ppm levels) for gas purification
applications at room temperature. Because of the high external surface area and the
cation exchange capacity of ETS-2, Cu ions are highly dispersed and very
accessible to H2S molecules. In this study, H2S column breakthrough experiments
are analyzed by a dynamic model based on the rigorous mass balance equations
applied to the fixed-bed. The proposed model also includes the chemical reaction
term, which is affected by the deactivation of the solid phase. Temperature-
programmed desorption tests provided insight on the material characterization as
well as on the relative magnitudes of the H2S-material interactions.
100
5.2. Introduction
Sulfidation reactions between metal oxides and H2S have been widely
applied in the industrial H2S removal plants in wide range of working temperatures
[1-6]. At room temperature high surface area materials such as zeolites [7-9],
carbon sorbents [10, 11], mesoporous and silica material [8, 12-15] are frequently
used as supports to load metal/metal oxides and improve H2S uptake by high
dispersion of active sites. Recently, a unique titanosilicate material has been
synthesized and loaded active sites for deep H2S removal (to sub-ppm levels) for
gas purification applications at room temperature [16, 17]. Cu-ETS-2 displayed the
most promising adsorbent in comparison to a fully developed commercial H2S
adsorbent and other tested metal-exchanged ETS-2. Also, Cu-ETS-2 has the
chemical environment favorable for decomposition of H2S. Since it has been
shown that a transition-metal ion [18-23], metal oxides [24] and TiO2 surface [25]
enhance H2S adsorption by facilitating its dissociation to HS- and S- ions, which
may further react and form sulfide products [26].
Although several studies have been dedicated to the development of H2S
sorbents at low temperatures and measurements of the breakthrough curves, the
column dynamics are still poorly understood and differ for many of the sorbents
studied. Much progress has been made for the column dynamics and interactions of
gases with physisorbents without any chemical reaction included [27-30] and less
attention to chemisorption and surface reactions [31]. Less attention has been paid

101
to the investigation of the adsorbent by a dynamic model, which considers both
chemisorption of H2S molecules on the surface and deactivation of the solid.
In general, textural variations of solid reactants, changes in active surface
area, reactivity of the solid and formation of a dense product layer over the solid
reactant cause a significant decrease in activity of the solid reactant during reaction
[32, 33]. Deactivation models [34, 35] were reported to be quite successful in
predicting the reaction rates of such gas-solid non-catalytic reactions. However it
has been used for the pseudo-steady state condition [36-42] in which the dynamic
of the system is only considered in the activity term implicitly.
The objective of this work is to gain a better understanding of the transport
phenomena occurring during the adsorption of ppm level H2S on a copper-ETS-2
packed bed column. Breakthrough adsorption experiments at room and higher
temperatures up to 250°C were performed. A continuum mechanics-based model
was developed to support the analysis of experimental data obtained from dynamic
column breakthrough tests. The model includes the chemical reaction term, which
is affected by the deactivation of the solid phase. Temperature-programmed
desorption (TPD) [43, 44] experiments of H2S on Cu-ETS-2 provided a further
insight of the different H2S-material interaction energy levels.

102
5.3. Experimental
5.3.1. Materials
Synthesis of ETS-2 and the ion exchange procedure to make the copper
exchanged ETS-2 were followed as explained previously [17]. The final solid
powder was pressed into a binderless dense disk and then was crushed and sieved
with the 0.297 mm to 0.595 mm (No. 30 to 50 mesh) fraction for use in the column
dynamic sulfidation test experiments.
5.3.2. Adsorption tests
A process flow diagram of the experimental setup for the H2S breakthrough
tests is included as Figure 5-1. The adsorption experiment was carried out by
flowing a certified H2S + He gas mixture (Praxair) of known composition (10 ppm
H2S) through the packed bed at different temperatures. The feed gas inlet flow rate
was set up at 100 sccm by using a mass flow controller (MFC, scaled for 0-700
cc/min gas flows, Alicat Scientific). Packed-bed properties and test conditions are
given in Table 5-1.

103
Figure 5- 1 Schematic flow diagram of test apparatus.
The bed exit gas stream was sent to a gas chromatograph (GC) equipped
with MXT-1 column (Restek) and a FPD detector to determine the H2S
concentration [16]. The H2S mole fraction, 𝑦(𝑡), in the column exit was recorded
as a function of time until the effluent gas H2S composition approached the column
inlet 𝑦𝑖𝑛 (H2S breakthrough profiles). Blank correction is neglected due to the
prompt H2S response for the empty column including glass wool.
The spent column was then purged by flowing inert He (purity: 99.995%,
Praxair) through it and simultaneously was heated at the rate (𝛽=10°C/min) up to
500 °C in order to facilitate the desorption of H2S molecules. Then it was cooled
down to near-ambient temperature. For the temperature program, the packed

104
column was heated externally with a tube furnace5 (Barnstead Thermolyne-21100)
attached with 4836-Temperature controller (Parr Instrument Company, USA).
Another K-type thermocouple was also inserted inside the tubes to monitor the
temperature at the column exit.
Table 5- 1 Packed-bed properties and operation conditions
Packed bed
Bed Length [𝑐𝑚] 𝐿𝑏 = 0.24
Adsorbent Weight [𝑚𝑔] 𝑤 = 30
Bed internal diameter [𝑐𝑚] 𝑑𝑏 = 0.38
Bed void fraction 휀𝑏 = 0.37
Packed bed density [𝑔 𝑐𝑚3⁄ ] 𝜌𝑏 = 1.1
Operation condition
Temperature [°𝐶] 𝑇=25,150 1nd 250
Pressure [ 𝑘𝑃𝑎] 𝑃 = 101.3
Gas flowrate [𝑠𝑡𝑎𝑛𝑑𝑎𝑟𝑑6 𝑐𝑚3 𝑚𝑖𝑛⁄ ] 𝑄 = 100
5 Tube furnace axial temperature profile is given in the appendix. 6 25°𝐶 and 101.3 𝑘𝑃𝑎
105
The entire tubing from H2S cylinder to GC was made of Sulfinert tubes
(Restek) to prevent any sulfidation on the tubing. Flow rate of the GC exit gas was
measured using a bubble flow meter. In order to assure safe lab experiments, the
whole experimental set-up was located inside the fume hood.
5.4. Mass transport model for the H2S breakthrough
simulation
5.4.1. System modeling
For the modeling of the experimental results of diluted H2S flowing through a
packed bed column of copper-ETS-2 adsorbent material, a reasonable number of
decisions were made as explained below
1) One dimensional model. Concentration gradient along the axial direction of the
bed is only considered.
2) Negligible axial dispersion effects.
3) Ideal gas law is valid in a gas stream of very low concentration of H2S in He (10
ppm) at ambient condition.
4) No heat effects are considered. Heat effects associated with adsorption and
reaction can be considered negligible in a dilute adsorption regime.
5) The pressure drop along the bed is negligible. The pressure drop calculated
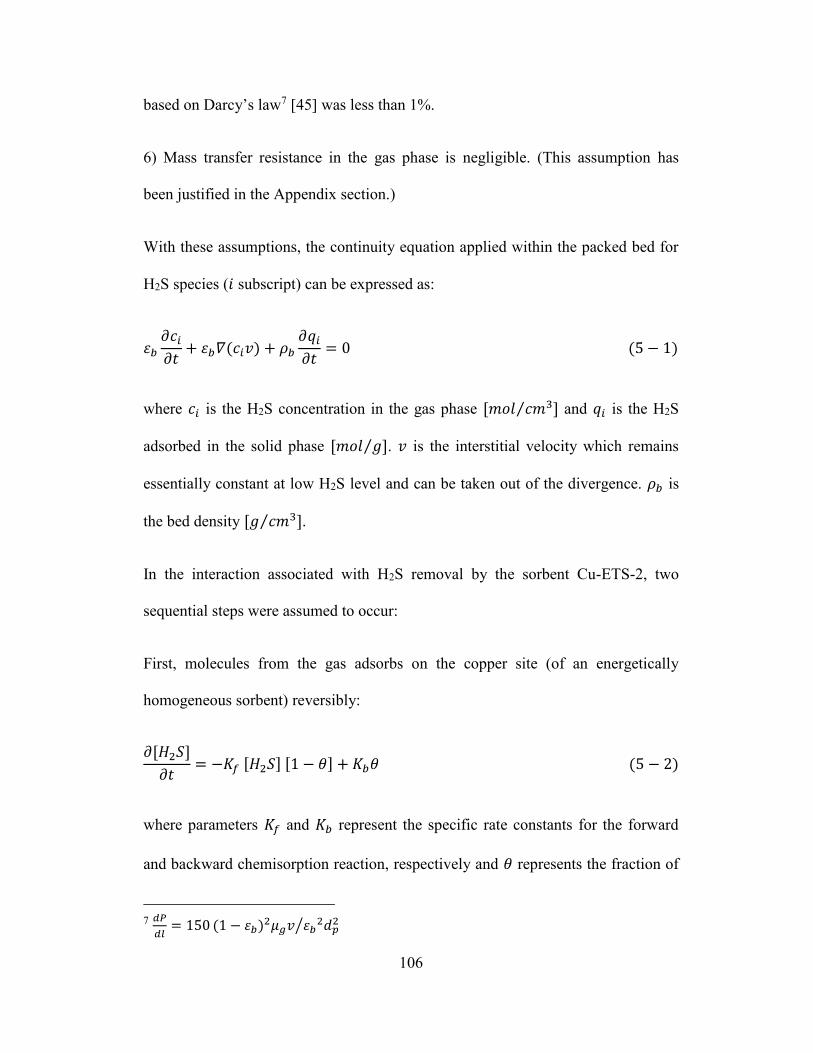
106
based on Darcy’s law7 [45] was less than 1%.
6) Mass transfer resistance in the gas phase is negligible. (This assumption has
been justified in the Appendix section.)
With these assumptions, the continuity equation applied within the packed bed for
H2S species (𝑖 subscript) can be expressed as:
휀𝑏𝜕𝑐𝑖𝜕𝑡+ 휀𝑏𝛻(𝑐𝑖𝑣) + 𝜌𝑏
𝜕𝑞𝑖𝜕𝑡= 0 (5 − 1)
where 𝑐𝑖 is the H2S concentration in the gas phase [𝑚𝑜𝑙 𝑐𝑚3⁄ ] and 𝑞𝑖 is the H2S
adsorbed in the solid phase [𝑚𝑜𝑙 𝑔⁄ ]. 𝑣 is the interstitial velocity which remains
essentially constant at low H2S level and can be taken out of the divergence. 𝜌𝑏 is
the bed density [𝑔 𝑐𝑚3⁄ ].
In the interaction associated with H2S removal by the sorbent Cu-ETS-2, two
sequential steps were assumed to occur:
First, molecules from the gas adsorbs on the copper site (of an energetically
homogeneous sorbent) reversibly:
𝜕[𝐻2𝑆]
𝜕𝑡= −𝐾𝑓 [𝐻2𝑆] [1 − 𝜃] + 𝐾𝑏𝜃 (5 − 2)
where parameters 𝐾𝑓 and 𝐾𝑏 represent the specific rate constants for the forward
and backward chemisorption reaction, respectively and 𝜃 represents the fraction of
7 𝑑𝑃
𝑑𝑙= 150 (1 − 휀𝑏)
2𝜇𝑔𝑣 휀𝑏2𝑑𝑝2⁄

107
the sorption sites on the chemisorbent that are occupied by the chemisorbed H2S
molecules at time 𝑡 (𝜃 = 𝑞𝑖 𝑞𝑖𝑠𝑎𝑡⁄ ). At equilibrium the reaction kinetic rate for the
first step is equal to zero, which describes the Langmuirian mechanism of
chemisorption [31]:
𝜃 =𝑏 𝑐𝑖
1 + 𝑏 𝑐𝑖 (5 − 3)
where 𝑏 is the ratio of the specific rate constants for the forward and backward
chemisorption reactions. When there is no H2S concentration gradient in the gas
phase, the H2S concentration in the vicinity of the solid phase (close to the
interphase) is equal to the H2S concentration in the bulk gas phase (𝑐𝑖).
At low H2S concentrations, the Langmuir isotherm model equation (5-2) is in the
linear form of Henry’s equilibrium as follows:
𝑞𝑖 = 𝑘𝐻 𝑐𝑖 (5 − 4)
And equation (1) can be rewritten as:
(휀𝑏 + 𝜌𝑏𝑘𝐻)𝜕𝑐𝑖𝜕𝑡+ 휀𝑏𝑣
𝜕𝑐𝑖𝜕𝑧= 0 (5 − 5)
The second step is sulfidation reaction of the chemisorbed H2S particles on the
surface. The consumption of H2S molecules due to surface reactions in the
adsorbed phase is then presented in the following kinetic expression:
𝑟i = −𝑘𝑟𝑞𝑖 𝑎 (5 − 6)

108
where 𝑘𝑟 is the kinetic rate constant.
When chemical reaction is an effective step, equation (5-1) or (5-5) is in the form
of:
(휀𝑏 + 𝜌𝑏𝑘𝐻)𝜕𝑐𝑖𝜕𝑡+ 휀𝑏𝑣
𝜕𝑐𝑖𝜕𝑧= 𝜌𝑏𝑟i (5 − 7)
This equation means that any change in the H2S concentration is associated with
the convective mass transport along the bed and the surface interactions in the
adsorbed phase.
Equation (5-6) considers a deactivation rate term 𝑎 that takes into account the
change in the surface area and activity of the solid reactant because of the
decomposed H2S on the surface or further potential of the sulfidation reaction [31,
32]. Then the overall effect of all these factors on the kinetic rate is expressed by
the variation of an activity term introduced into the rate expression.
In this work change of surface activity and solid reactant consumption with time is
considered proportional to the activity and species concentration as follows [33,
34]:
𝑑𝑎
𝑑𝑡= − 𝑘𝑑 𝑐𝑖 𝑎 (5 − 8)
where 𝑘𝑑 is the deactivation constant. Using equation (5-4), (5-6), (5-7) the
problem to solve is defined through the following PDE equation with the
corresponding initial and boundary conditions:

109
(휀𝑏 + 𝑘𝐻)𝜕𝑐𝑖𝜕𝑡+ 휀𝑏𝑣
𝜕𝑐𝑖𝜕𝑧= −𝜌𝑏 𝐾 𝑐𝑖 𝑎 (5 − 9)
@ 𝑡 = 0 𝑐𝑖 = 0 𝑓𝑜𝑟 𝑎𝑙𝑙 𝑧
𝑧 = 0 𝑐𝑖 = 𝑐𝑖𝑜 𝑓𝑜𝑟 𝑡 > 0
where 𝐾 is defined as a kinetics parameter which includes the product of the
reaction rate and henry constants. 𝑐𝑖𝑜 represents the H2S concentration in the
column inlet.
5.4.2. Numerical resolution
A numerical method is used to replace the spatial derivative with an algebraic
approximation. This effectively removes the derivatives from the partial differential
equation (5-9) and the model has been converted to a system of approximating
ordinary differential equations (ODEs). Then equation (5-8) and (5-9) can be
integrated simultaneously by standard and well-established numerical algorithms
for initial value ODEs (ode15s in MATLAB_R2013a). Then an optimization
function (fminsearch) is used to minimize the error between the breakthrough
model and the experimental breakthrough curves.
5.4.3. Mass balance for the breakthrough / desorption
dynamics
The H2S bed capacity at sufficient long time for the breakthrough (𝑁𝑖(𝑡), mol/g)
was calculated considering the following mass balance in the column with
integration between 0 and 𝑡
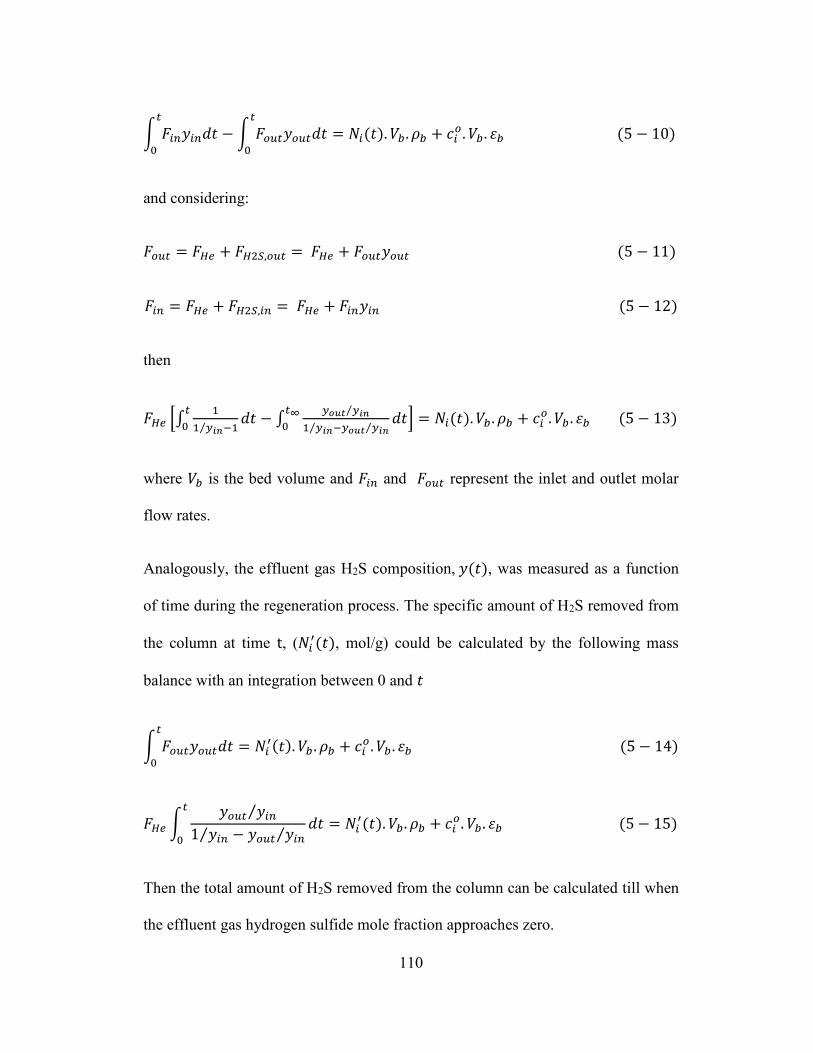
110
∫ 𝐹𝑖𝑛𝑦𝑖𝑛𝑑𝑡𝑡
0
−∫ 𝐹𝑜𝑢𝑡𝑦𝑜𝑢𝑡𝑑𝑡𝑡
0
= 𝑁𝑖(𝑡). 𝑉𝑏. 𝜌𝑏 + 𝑐𝑖𝑜 . 𝑉𝑏. 휀𝑏 (5 − 10)
and considering:
𝐹𝑜𝑢𝑡 = 𝐹𝐻𝑒 + 𝐹𝐻2𝑆,𝑜𝑢𝑡 = 𝐹𝐻𝑒 + 𝐹𝑜𝑢𝑡𝑦𝑜𝑢𝑡 (5 − 11)
𝐹𝑖𝑛 = 𝐹𝐻𝑒 + 𝐹𝐻2𝑆,𝑖𝑛 = 𝐹𝐻𝑒 + 𝐹𝑖𝑛𝑦𝑖𝑛 (5 − 12)
then
𝐹𝐻𝑒 [∫1
1 𝑦𝑖𝑛⁄ −1𝑑𝑡
𝑡
0− ∫
𝑦𝑜𝑢𝑡 𝑦𝑖𝑛⁄
1 𝑦𝑖𝑛⁄ −𝑦𝑜𝑢𝑡 𝑦𝑖𝑛⁄𝑑𝑡
𝑡∞
0] = 𝑁𝑖(𝑡). 𝑉𝑏 . 𝜌𝑏 + 𝑐𝑖
𝑜 . 𝑉𝑏 . 휀𝑏 (5 − 13)
where 𝑉𝑏 is the bed volume and 𝐹𝑖𝑛 and 𝐹𝑜𝑢𝑡 represent the inlet and outlet molar
flow rates.
Analogously, the effluent gas H2S composition, 𝑦(𝑡), was measured as a function
of time during the regeneration process. The specific amount of H2S removed from
the column at time t, (𝑁𝑖′(𝑡), mol/g) could be calculated by the following mass
balance with an integration between 0 and 𝑡
∫ 𝐹𝑜𝑢𝑡𝑦𝑜𝑢𝑡𝑑𝑡𝑡
0
= 𝑁𝑖′(𝑡). 𝑉𝑏 . 𝜌𝑏 + 𝑐𝑖
𝑜 . 𝑉𝑏 . 휀𝑏 (5 − 14)
𝐹𝐻𝑒∫𝑦𝑜𝑢𝑡 𝑦𝑖𝑛⁄
1 𝑦𝑖𝑛⁄ − 𝑦𝑜𝑢𝑡 𝑦𝑖𝑛⁄𝑑𝑡
𝑡
0
= 𝑁𝑖′(𝑡). 𝑉𝑏. 𝜌𝑏 + 𝑐𝑖
𝑜 . 𝑉𝑏. 휀𝑏 (5 − 15)
Then the total amount of H2S removed from the column can be calculated till when
the effluent gas hydrogen sulfide mole fraction approaches zero.

111
5.5. Results and discussion
5.5.1. H2S breakthrough concentration profiles on Copper-
ETS-2
The H2S breakthrough experiment results at different temperatures (25, 100 and
250°C) are given in Figure 5-2, it shows that breakthrough times are longer as the
column temperature increases.
Figure 5- 2 H2S breakthrough curves for Cu-ETS-2 at 25°C, 150°C and 250°C.
The experimental data have been fitted by the chemisorption model in diluted
conditions presented in equation (5-5). Fitting curves are shown together with
0
1
2
3
4
5
0 500 1000 1500 2000 2500
Bed
ex
it H
2S
conc.
(ppm
)
Time (min)
25C
150C
250C

112
experimental data in Figure 5-3 and the fit parameters are given in Table 5-2 show
that Henry chemisorption constant increases with an increase in the temperature,
which is indicating a temperature activated process. The magnitude of the
interaction between the H2S molecule and the copper sites associated with the
parameter 𝑘𝐻 increased as the bed temperature increased.
(a)

113
(b)
(c)
Figure 5- 3 The experimental data have been fitted by the chemisorption model at 25°C
(a), 150°C (b) and 250°C (c).

114
Table 5- 2 Henry’s law constant at different temperatures.
Temperature [°C] 𝑘𝐻 ∗ 10−6[𝑚𝑙 𝑜𝑓 𝑔𝑎𝑠 𝑔 𝑜𝑓 𝑠𝑜𝑙𝑖𝑑⁄ ]
25 5.37
150 9.67
250 19.52
The experimental data could be fitted as well by the proposed model in
equation (5-9). This model includes the reaction rate term. Model parameters are
given in Table 5-3. As temperature increases from 25°C to 250°C, kinetic
parameter increases, this is in good agreement with the breakthrough capacity trend
at these temperatures. Cu-ETS-2 has higher affinity/interaction for H2S removal at
higher temperature, which is a sign of chemisorption processes.
Table 5- 3 Kinetics and deactivation parameters of Cu-ETS-2 at 25°C, 100°C and 250°C.
Temperatures [°C] 𝐾 ∗ 10−4 [𝑚𝑙
𝑚𝑖𝑛. 𝑔] 𝑘𝑑 ∗ 10
4
25 3.17 6.45
150 5.2 6.22
250 5.65 3.18

115
Besides, deactivation parameter (𝑘𝑑) follows an expected trend; at 25°C
with the lowest H2S removal capacity, Cu-ETS-2 has the lowest 𝑘𝑑 which means
the adsorbent deactivates faster at this temperature. Thus when adsorption capacity
is higher, adsorbent deactivates slower (higher 𝑘𝑑).
A sensitivity analysis has been undertaken for the proposed model to check which
parameter is more effective. Figure 5-4 and 5-5 display the change for H2S
breakthrough curves for kinetic and deactivation parameters within 30% error of
the optimized value. As it can be seen these two parameters do not have minor
effect on the outlet concentration.
Figure 5- 4 Sensitivity analysis for kinetic parameter (𝐾) within 30% error of the
optimized value (green line); experimental data (dashed line).

116
Figure 5- 5 Sensitivity analysis for deactivation parameter (𝑘𝑑) within 30% error of the
optimized value (green line); experimental data (dashed line).
The same study is done for the henry constant. Figure 5-6 shows even within 70%
error deviation from the optimized value, equation (5-9) is not sensitive to the 𝑘𝐻
value for the reaction model. Unlike Figure 5-4 and 5-5 all curves in Figure 5-6 are
overlaid. Thus a fair assumption for a steady state solid phase can be considered to
have equation (5-9) simplified as follows:
휀𝑏𝜕𝑐𝑖𝜕𝑡+ 휀𝑏𝑣
𝜕𝑐𝑖𝜕𝑧= −𝜌𝑏 𝐾 𝑐𝑖 𝑎 (5 − 16)
The simulation result for equation (5-16) gives the same parameters (𝐾 and 𝑘𝑑)
presented in Table 5-3. This is in good agreement with the sensitivity analysis

117
outcome that 𝑘𝐻 is not an effective parameter in the model and three parameter
model (equation (5-9)) can be reduced to equation (5-16).
Figure 5- 6 Sensitivity analysis for deactivation parameter (𝑘𝐻) within 70% error of the
optimized value; experimental data (dashed line).
5.5.2. Desorption experiments of H2S on spent Cu-ETS-2
Figure 5-7 show the temperature program desorption curve at 10°C/min and
a maximum temperature of 500°C. The maximum temperature is selected in the
way to prevent H2S decomposition. Since it has been reported that Hydrogen
sulfide decomposition is a highly endothermic process (ΔH298 = 20.25 kcal/mol) at
temperature below 527°C and its total conversion does not exceed 1.5–2 % [46].

118
Figure 5- 7 Temperature program desorption curve of H2S under He with the heating rate
of 10°C/min.
As temperature increases, H2S molecules get desorbed at different
temperatures. This indicates that there are adsorption sites with different interaction
energies on the surface of Cu-ETS-2 [47]. The small peak below 150°C can be
most probably assigned to low energy interaction sites which can be associated
with physisorption sites on the solid.
It has been shown that at room temperature, H2S adsorption is accompanied by
dissociation on metallic Cu and copper oxide and mainly interacts with the metal
centers of the oxides [24], which proceeds by two stepwise reactions [18-20, 22]:

119
Cu + H2S𝑔Molecular adsorption→ Cu − SH2 ads
Dissociative adsorption→ (Cu − SH)ads + Hads
These steps occur spontaneously and continue by second hydrogen separation and
further metal sufide formation step [26].
TiO2 surface, on the other hand promotes H2S dissociation according to the large
Bronsted acid-base reaction [25].
Thus at room temperature H2S strongly adsorbs and dissociative on the Cu-ETS-2
surface; mostly on metal active sites or very little on the titanate substrate.
H2S molecules chemisorbed on copper sites requires more energy for desorption
and they start to desorb at higher temperature than 150°C. The presence of
consecutive peaks as the desorption temperature increases from 150 up to 500°C
suggests that copper sites on the surface provide different energy interactions and
chemisorption is a key interaction in the process.
The amount of adsorbed H2S obtained from the desorption curve (Figure 5-7)
through equation (5-15) is 5.69 𝑚𝑔 𝐻2𝑆 𝑔 𝑎𝑑𝑠𝑜𝑟𝑏𝑒𝑛𝑡⁄ . However the amount of
adsorbed H2S molecules using the equation (5-13), which is 80.45
𝑚𝑔 𝐻2𝑆 𝑔 𝑎𝑑𝑠𝑜𝑟𝑏𝑒𝑛𝑡⁄ . In order to monitor the desorbed H2S molecules more
precisely desorption heating rate was decreased from 10 to 2°𝐶/𝑚𝑖𝑛. The amount
of adsorbed H2S obtained from equation (5-15) is 27.2 𝑚𝑔 𝐻2𝑆 𝑔 𝑎𝑑𝑠𝑜𝑟𝑏𝑒𝑛𝑡⁄

120
which is still much less than the one calculated from the breakthrough curve by
equation (5-13). This difference can be explained by longer desorption time
required at 500°C or higher desorption temperature. However the most probable
reason can be regarding the fraction that cannot be desorbed with helium because
of sulfidation reaction.
5.6. Conclusions
Diluted H2S breakthrough experiments through a packed bed of Cu-ETS-2
adsorbent were modeled applying the continuity equation to the system by taken
into account the characteristics of the adsorbent material. The increase of the H2S
breakthrough times as the experiment temperature increased can be explained by
the growing chemisorption interaction as temperature rose from 25 to 250°C. This
was also consistent with the temperature programmed desorption experiments
which showed desorption peaks of larger magnitudes at temperatures higher than
200°C. A fixed bed model with reaction was able to fit the experimental data as
well and it could partially explain the breakthrough profiles behavior through the
increasing reaction kinetics with temperature.
5.7. References
[1] T. Baird, K. Campbell, P. Holliman, R. Hoyle, M. Huxam, D. Stirling, B.
Williams and M. Morris, "Cobalt-zinc oxide absorbents for low temperature gas
desulfurisation," J. Mater. Chem., vol. 9, pp. 599-605, 1999.

121
[2] C. Babé, M. Tayakout-Fayolle, C. Geantet, M. Vrinat, G. Bergeret, T. Huard
and D. Bazer-Bachi, "Crystallite size effect in the sulfidation of ZnO by H2S:
Geometric and kinetic modelling of the transformation," Chemical Engineering
Science, vol. 82, pp. 73-83, 2012.
[3] A. Moezzi, A. M. McDonagh and M. B. Cortie, "Zinc oxide particles:
Synthesis, properties and applications," Chem. Eng. J., vol. 185–186, pp. 1-22,
2012.
[4] M. Xue, R. Chitrakar, K. Sakane and K. Ooi, "Screening of adsorbents for
removal of H2S at room temperature," Green Chem., vol. 5, pp. 529-534, 2003.
[5] C. L. Carnes and K. J. Klabunde, "Unique chemical reactivities of
nanocrystalline metal oxides toward hydrogen sulfide," Chemistry of Materials,
vol. 14, pp. 1806-1811, 2002.
[6] Westmoreland P.R. , Harrison D.P., " Evaluation of candidate solids for high-
temperature desulfurization of low-Btu gases," Environmental Science and
Technology, vol. 10, pp. 659, 1976.
[7] D. Melo, J. de Souza, M. Melo, A. Martinelli, G. Cachima and J. Cunha,
"Evaluation of the zinox and zeolite materials as adsorbents to remove H2S from
natural gas," Colloid Surf. A-Physicochem. Eng. Asp., vol. 272, pp. 32-36, 2006.
[8] D. Crespo, G. Qi, Y. Wang, F. H. Yang and R. T. Yang, "Superior sorbent for
natural gas desulfurization," Ind Eng Chem Res, vol. 47, pp. 1238-1244, 2008.
[9] P. Kumar, C. Sung, O. Muraza, M. Cococcioni, S. Al Hashimi, A. McCormick
and M. Tsapatsis, "H2S adsorption by Ag and Cu ion exchanged
faujasites," Microporous Mesoporous Mat., vol. 146, pp. 127-133, 2011.
[10] D. Nguyen-Thanh and T. Bandosz, "Activated carbons with metal containing
bentonite binders as adsorbents of hydrogen sulfide," Carbon, vol. 43, pp. 359-
367, 2005.
[11] F. Li, J. Wei, Y. Yang, G. H. Yang and T. Lei, "Preparation of Sorbent Loaded
with Nano-CuO for Room Temperature to Remove of Hydrogen Sulfide," Applied
Mechanics and Materials, vol. 475, pp. 1329-1333, 2014.
[12] Q. Xue and Y. Liu, "Removal of minor concentration of H2S on MDEA-
modified SBA-15 for gas purification," J. Ind. Eng. Chem., vol. 18, pp. 169-173,
2012.

122
[13] M. Hussain, N. Abbas, D. Fino and N. Russo, "Novel mesoporous silica
supported ZnO adsorbents for the desulphurization of biogas at low
temperatures," Chem. Eng. J., vol. 188, pp. 222-232, 2012.
[14] X. Wang, T. Sun, J. Yang, L. Zhao and J. Jia, "Low-temperature H2S removal
from gas streams with SBA-15 supported ZnO nanoparticles," Chem. Eng. J.,
vol. 142, pp. 48-55, 2008.
[15] D. Montes, E. Tocuyo, E. Gonzaĺez, D. Rodriǵuez, R. Solano, R. Atencio, M.
A. Ramos and A. Moronta, "Reactive H2S chemisorption on mesoporous silica
molecular sieve-supported CuO or ZnO," Microporous and Mesoporous
Materials, vol. 168, pp. 111-120, 2013.
[16] S. Rezaei, A. Tavana, J. A. Sawada, L. Wu, A. S. M. Junaid and S. M.
Kuznicki, "Novel Copper-Exchanged Titanosilicate Adsorbent for Low
Temperature H2S Removal," Ind Eng Chem Res, vol. 51, pp. 12430-12434, 2012.
[17] S. Rezaei, M. O. D. Jarligo, L. Wu and S. M. Kuznicki, "Breakthrough
performances of metal-exchanged nanotitanate ETS-2 adsorbents for room
temperature desulfurization," Chemical Engineering Science, vol. 123, pp. 444-
449, 2015.
[18] A. N. Startsev, I. I. Zakharov, O. V. Voroshina, A. V. Pashigreva and V. N.
Parmon, "Low-temperature decomposition of hydrogen sulfide under the
conditions of conjugate chemisorption and catalysis," Doklady Physical
Chemistry, vol. 399, pp. 283-286, 2004.
[19] Y. M. Choi, C. Compson, M. C. Lin and M. Liu, "A mechanistic study of H2S
decomposition on Ni- and Cu-based anode surfaces in a solid oxide fuel
cell," Chemical Physics Letters, vol. 421, pp. 179-183, 2006.
[20] I. I. Zakharov, A. N. Startsev, O. V. Voroshina, A. V. Pashigreva, N. A.
Chashkova and V. N. Parmon, "The molecular mechanism of low-temperature
decomposition of hydrogen sulfide under conjugated chemisorption-catalysis
conditions," Russian Journal of Physical Chemistry A, vol. 80, pp. 1403-1410,
2006.
[21] D. R. Alfonso, "First-principles studies of H2S adsorption and dissociation on
metal surfaces," Surf Sci, vol. 602, pp. 2758-2768, 2008.
[22] Q. L. Tang, S. R. Zhang and Y. P. Liang, "Influence of Step Defects on the
H2S Splitting on Copper Surfaces from First-Principles Microkinetic
Modeling," Journal of Physical Chemistry C, vol. 116, pp. 20321-20331, 2012.

123
[23] S. H. Chen, S. Q. Sun, B. J. Lian, Y. F. Ma, Y. G. Yan and S. Q. Hu, "The
adsorption and dissociation of H2S on Cu(100) surface: A DTF study," Surf Sci,
vol. 620, pp. 51-58, 2014.
[24] J. A. Rodriguez, S. Chaturvedi, M. Kuhn and J. Hrbek, "Reaction of H2S and
S2 with metal/oxide surfaces: band-gap size and chemical reactivity," J Phys
Chem B, pp. 5511, 1998.
[25] A. Fahmi, J. Ahdjoudj and C. Minot, "A theoretical study of H2S and MeSH
adsorption on TiO2," Surf Sci, vol. 352–354, pp. 529-533, 1996.
[26] J. Sun, S. Modi, K. Liu, R. Lesieur and J. Buglass, "Kinetics of zinc oxide
sulfidation for packed-bed desulfurizer modeling," Energy Fuels, vol. 21, pp.
1863-1871, 2007.
[27] S. Guntuka, S. Farooq and A. Rajendran, "A- and B-Site substituted
lanthanum cobaltite perovskite as high temperature oxygen sorbent. 2. Column
dynamics study," Ind Eng Chem Res, vol. 47, pp. 163-170, 2008.
[28] Y. Xiao, S. Wang, D. Wu and Q. Yuan, "Experimental and simulation study of
hydrogen sulfide adsorption on impregnated activated carbon under anaerobic
conditions," J. Hazard. Mater., vol. 153, pp. 1193-1200, 2008.
[29] S. N. Nobar and S. Farooq, "Experimental and modeling study of adsorption
and diffusion of gases in Cu-BTC," Chemical Engineering Science, pp. 801, 2012.
[30] R. Haghpanah, A. Rajendran, S. Farooq, I. A. Karimi and M. Amanullah,
"Discrete Equilibrium Data from Dynamic Column Breakthrough
Experiments," Ind Eng Chem Res, vol. 51, pp. 14834-14844, 2012.
[31] K. B. Lee, A. Verdooren, H. S. Caram and S. Sircar, "Chemisorption of carbon
dioxide on potassium-carbonate-promoted hydrotalcite," Journal of Colloid &
Interface Science, vol. 308, pp. 30-39, 04, 2007.
[32] O. Levenspiel, Chemical Reaction Engineering; an Introduction to the Design
of Chemical Reactors. New York, Wiley, 1962.
[33] C. H. Bartholomew, "Mechanisms of catalyst deactivation," Applied Catalysis
A: General, vol. 212, pp. 17-60, 2001.
[34] T. Doǧu, "The Importance of Pore Structure and Diffusion in the Kinetics of
Gas-Solid Non-catalytic Reactions: Reaction of Calcined Limestone with
SO2," The Chemical Engineering Journal, vol. 21, pp. 213-222, 1981.
124
[35] N. Yaşyerli, T. Doǧu, G. Doǧu and i. Ar, "Deactivation model for textural
effects of kinetics of gas-solid noncatalytic reactions “char gasification with
CO2”," Chemical Engineering Science, vol. 51, pp. 2523-2528, 6, 1996.
[36] Y. Suyadal, M. Erol and H. Oguz, "Deactivation model for the adsorption of
trichloroethylene vapor on an activated carbon bed," Ind Eng Chem Res, vol. 39,
pp. 724-730, 2000.
[37] S. Yasyerli, G. Dogu, I. Ar and T. Dogu, "Activities of copper oxide and Cu-V
and Cu-Mo mixed oxides for H2S removal in the presence and absence of
hydrogen and predictions of a deactivation model," Ind Eng Chem Res, vol. 40, pp.
5206-5214, 2001.
[38] S. Yasyerli, I. Ar, G. Dogu and T. Dogu, "Removal of hydrogen sulfide by
clinoptilolite in a fixed bed adsorber," Chem. Eng. Process, vol. 41, pp. 785-792,
2002.
[39] S. Yasyerli, G. Dogu, I. Ar and T. Dogu, "Breakthrough Analysis of H 2 S
Removal on Cu-V-Mo, Cu-V, and Cu-Mo Mixed Oxides," Chem. Eng. Commun.,
vol. 190, pp. 1055, 05, 2003.
[40] T. Kopac and S. Kocabas, "Deactivation models for sulfur dioxide adsorption
on silica gel," Adv. Environ. Res., vol. 8, pp. 417-424, 2004.
[41] H. F. Garces, H. M. Galindo, L. J. Garces, J. Hunt, A. Morey and S. L. Suib,
"Low temperature H2S dry-desulfurization with zinc oxide," Microporous
Mesoporous Mat., vol. 127, pp. 190-197, 2010.
[42] T. Ko and H. Hsueh, "Removal of Hydrogen Sulfide by Iron-Rich Soil:
Application of the Deactivation Kinetic Model for Fitting Breakthrough
Curve," Aerosol Air Qual. Res., vol. 12, pp. 1355-1361, DEC, 2012.
[43] K. J. Leary, J. N. Michaels and A. M. Stacy, "Temperature-programmed
desorption: Multisite and subsurface diffusion models," AICHE J., vol. 34, pp.
263, 02, 1988.
[44] A.M. de Jong and J.W. Niemantsverdriet, "Thermal desorption analysis:
Comparative test of ten commonly applied procedures," Surface Science vol. 233
pp. 355-365, 1990.
[45] R. Haghpanah, A. Majumder, R. Nilam, A. Rajendran, S. Farooq, I. A. Karimi
and M. Amanullah, "Multiobjective Optimization of a Four-Step Adsorption
Process for Postcombustion CO2 Capture Via Finite Volume Simulation," Ind Eng
Chem Res, vol. 52, pp. 4249-4265, 2013.

125
[46] A. Startsev, O. Kruglyakova, Y. Chesalov, S. Ruzankin, E. Kravtsov, T.
Larina and E. Paukshtis, "Low Temperature Catalytic Decomposition of Hydrogen
Sulfide into Hydrogen and Diatomic Gaseous Sulfur," Topics in Catalysis, vol. 56,
pp. 969-980, 08, 2013.
[47] K. J. Leary, J. N. Michaels and A. M. Stacy, "Temperature-programmed
desorption: Multisite and subsurface diffusion models," AICHE J., vol. 34, pp.
263, 02, 1988.

126
6. Adsorption Behaviour of Cu(II) onto
Nano-titanate ETS-2
6.1. Summary
In this work copper (II) removal from aqueous solution by nanotitanate ETS-2
through the batch technique is investigated. The paper focused on the
characterization and sorption properties of ETS-2. Structure and chemical
properties of ETS-2 sorbent and aqueous solution are studied by means of different
characterization tests (TGA, XRD, XPS, EDX, ICP). Copper adsorption capacity
increased in the pH range of 2 to 7 and the maximum uptake of Cu2+ by ETS-2
occurred at a pH of 7 with an adsorption maximum of 99% copper removal.
The mechanism for removing Cu2+ ions from aqueous solution onto ETS-2 surfaces
were also examined. It was experimentally concluded that ETS-2 possesses ion-
exchange properties and copper removal happens through the cation exchange
mechanism.

127
6.2. Introduction
The problem of discharged heavy metal pollutants to the environment with
the huge increase in the industrial activities is a major concern due to their
minatory hazards to the life on land as well as in water [1-3]. Water contamination
by metal ions is growing environmental issues since the toxicity of metal pollution
is slow but long lasting plus such ions are non-biodegradable8 [4, 5].
Copper is one of the hazardous heavy metals, which is widely used in
various industries such as power transmission, plumbing and refining [6, 7] and is
frequently released to the surface water in different component forms and
concentrations [1]. Human intake of excessively large doses of copper leads to
severe mucosal irritation, widespread capillary damage, central nervous problems,
hepatic, renal and liver damage, gastrointestinal irritation and depression [8].
Many techniques such as chemical precipitation, electrochemical treatment, solvent
extraction, ion exchange, membrane technology and adsorption have been
conventionally employed for the removal of heavy metal ions [6, 9]. Among them
ion exchange and adsorption is one of the most popular methods has been thought a
simple efficient and cost-effective feasible method [3, 10, 11]. It has been then
8 remains contaminated for a long-term.

128
widely used in industrial wastewater treatment processes for the removal of
effluents of heavy metal ions [10].
The application of adsorption technology using different adsorbents including
activated carbons and graphene oxide [1, 12, 13], titanate nanotubes [12],
mesoporous silica and silica gel [9, 14, 15], synthesized zeolitic materials and
membranes [16-18] and different types of ion exchange resins [10] has become the
most effective technologies for the removal of heavy metals. However many of the
above adsorbents such as widely studied activated carbon and ion exchange resins
suffer from high cost and are difficult to establish at an industrial scale [12, 16].
Thus many researchers have been encouraged to look for low cost materials for
heavy metal removal in the past decay [2, 5, 12, 19, 20].
ETS-2 is a nanotitanate characterized by a high specific surface area [21, 22],
which may offer a special environment for the removal of heavy metal ions. In the
present study, the potential of ETS-2 as an adsorbent for the removal of copper ions
form aqueous solution is examined. Different characterization tests have been
carried out to investigate the sorption characteristics of ETS-2 for the removal of
Cu(II) from its aqueous solution. Change in the pH of solution was also studied to
study the loading of competing proton ions onto ETS-2.

129
6.3. Experimental
6.3.1. ETS-2 adsorbent
Na-ETS-2 (ETS-2) was synthesized using a hydrothermal process using a
commercial source of titanium (Titanium (III) chloride solution 20% stabilized,
Fisher Scientific, Canada) following the same procedure explained in [22].
6.3.2. Characterization tests
6.3.2.1. Thermogravimetric Analysis
TGA was also carried out using Q500 thermogravimetric analyzer (TA
Instruments) from an ambient temperature to 1000 °C, with airflow and a ramp rate
of 10 °C/min.
6.3.2.2. Energy Dispersive X-ray Spectroscopy
EDX measurements were conducted on a Zeiss EVO MA 15LaB6 filament
scanning electron microscope. The data were acquired with a peltier-cooled
10 mm2 Bruker Quantax 200 Silicon drift detector with 123eV resolution.
6.3.2.3. X-ray photoelectron spectroscopy measurement
The XPS measurements were performed on AXIS 165 spectrometer (Kratos
Analytical). The base pressure in the analytical chamber was lower than 3e-8 Pa.
Monochromatic Al Kα source (hν = 1486.6 eV) was used at a power of 210 W.
The analysis spot was 400 by 700 um. The resolution of the instrument is 0.55 eV
for Ag 3d and 0.70 eV for Au 4f peaks.

130
6.3.2.4. Inductively coupled plasma measurement
ICP tests have been done using Perkin Elmer’s Elan 6000 with ICP RF power of
1300 W; Dual Detector mode. Subtract blank was done after internal standard
correction. Measurement units were cps (counts per second); Auto lens on; 4 points
calibration curves (0, 0.25, 0.50, 1.00 ppm for Na, Ca, Mg, Fe, K & P; 0, 0.005,
0.010, 0.020 ppm for rest elements). Typical count rates for 10 ppb Pb is obtained
between 150000 cps to 200000 cps. Bi, Sc and In are used as internal standards.
6.3.3. Batch adsorption experiments
In order to study the heavy metal removal characteristics of ETS-2 sample, Cu2+
solution was prepared from copper nitrate (Cu(NO3)2.2.5.H2O, MW: 232.59,
Anachemia, Chemicals) . Copper removal experiment was done by immersing 0.1
g as-synthesized ETS-2 in the 100mL of Cu(II) ions aqueous solutions with the
desired concentrations (54 mg/L) at room temperature. The initial pH value of the
solution was adjusted with NaOH (0.1N) or HCl (0.1N) solution to the desired
value. The pH measurements were performed with an AB 15+ pH meter (Fisher
Scientific accumet). After 1 hour contact time the solid phase was filtered and the
Cu2+ concentration for the filtrated solution was determined by ICP/OES
spectroscopy.
The copper adsorption capacity (metal uptake) of ETS-2 was easily calculated
according to the mass balance and from the following equation:
𝑞 = (𝑐𝑜 − 𝑐)𝑉 𝑤⁄ (6 − 1)
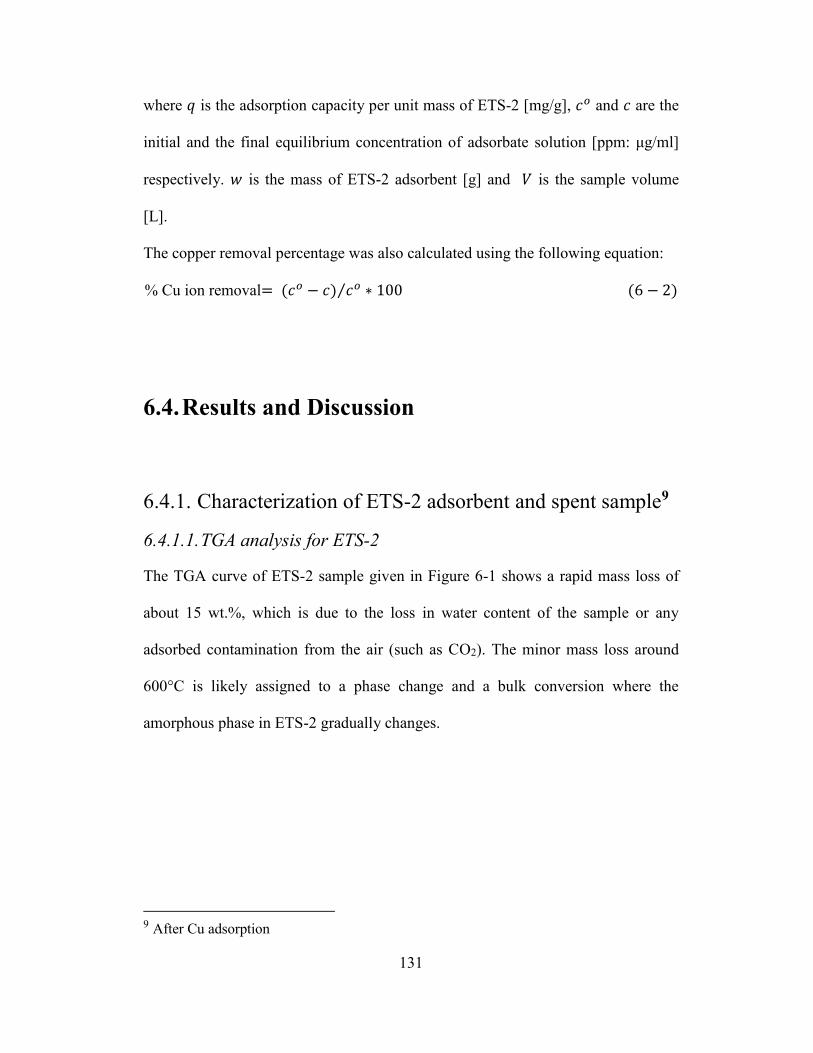
131
where 𝑞 is the adsorption capacity per unit mass of ETS-2 [mg/g], 𝑐𝑜 and 𝑐 are the
initial and the final equilibrium concentration of adsorbate solution [ppm: μg/ml]
respectively. 𝑤 is the mass of ETS-2 adsorbent [g] and 𝑉 is the sample volume
[L].
The copper removal percentage was also calculated using the following equation:
% Cu ion removal= (𝑐𝑜 − 𝑐) 𝑐𝑜⁄ ∗ 100 (6 − 2)
6.4. Results and Discussion
6.4.1. Characterization of ETS-2 adsorbent and spent sample9
6.4.1.1. TGA analysis for ETS-2
The TGA curve of ETS-2 sample given in Figure 6-1 shows a rapid mass loss of
about 15 wt.%, which is due to the loss in water content of the sample or any
adsorbed contamination from the air (such as CO2). The minor mass loss around
600°C is likely assigned to a phase change and a bulk conversion where the
amorphous phase in ETS-2 gradually changes.
9 After Cu adsorption

132
Figure 6- 1 TGA Curve of ETS-2 (ramp 10 °C/min under air).
6.4.1.2. EDX analysis for ETS-2
EDX spectra were performed by point specific elemental analysis of a
compressed ETS-2 disc and results are summarized in Table 6-1. Na:Ti atomic
ratio (1:3) was then calculated by averaging a set of these numbers.
6.4.1.3. Binding energy data for ETS-2
The X-ray photoelectron spectroscopy lines of ETS-2 sample have been
shifted to higher energies because of surface charging effects. Therefore all binding
energies obtained from high-resolution XPS spectra, were calibrated using the
assigned value of C 1s peak (284.6eV) as the internal standard. Figure 6-2 shows
84
86
88
90
92
94
96
98
100
0 200 400 600 800 1000
Wei
gh
t (%
)
Temperature (C)

133
Ti 2p photoemission signal of ETS-2 sample. The two main peaks, at 458.3eV and
464.0eV binding energies are good match with the Ti 2p3/2 and Ti 2p1/2 of Ti+4,
respectively [23].
Table 6- 1 Elemental composition of ETS-2 obtained by EDX.
Element Atomic conc. at % Mass conc. %
Na 8.45 7.92
O 66.19 43.19
Ti 24.53 47.90
Si 0.78 0.90
Ca 0.05 0.09
Figure 6-3 shows O (1s) spectra of ETS-2 sample. The peaks at 529.79eV
corresponded to that of the Ti–O in which the valence of Ti is +4 [23]. The binding
energy at 531.79eV is about 0.2eV different than the attributed to OH- groups. The
splitting of the O (1s) line at this binding energy is not due to residual sodium
hydroxide, but due to the existence of Na+-O-Ti bonds [24].
The surface composition is about Na:Ti = 1:1 by measuring the area of the Na (1s)
and Ti (2p) peaks (Table 6-2), which is more than the ratio value (1:3) from Table
6-1. This is because ETS-2 like other sodium titanates [23, 24] has numerous Na+–
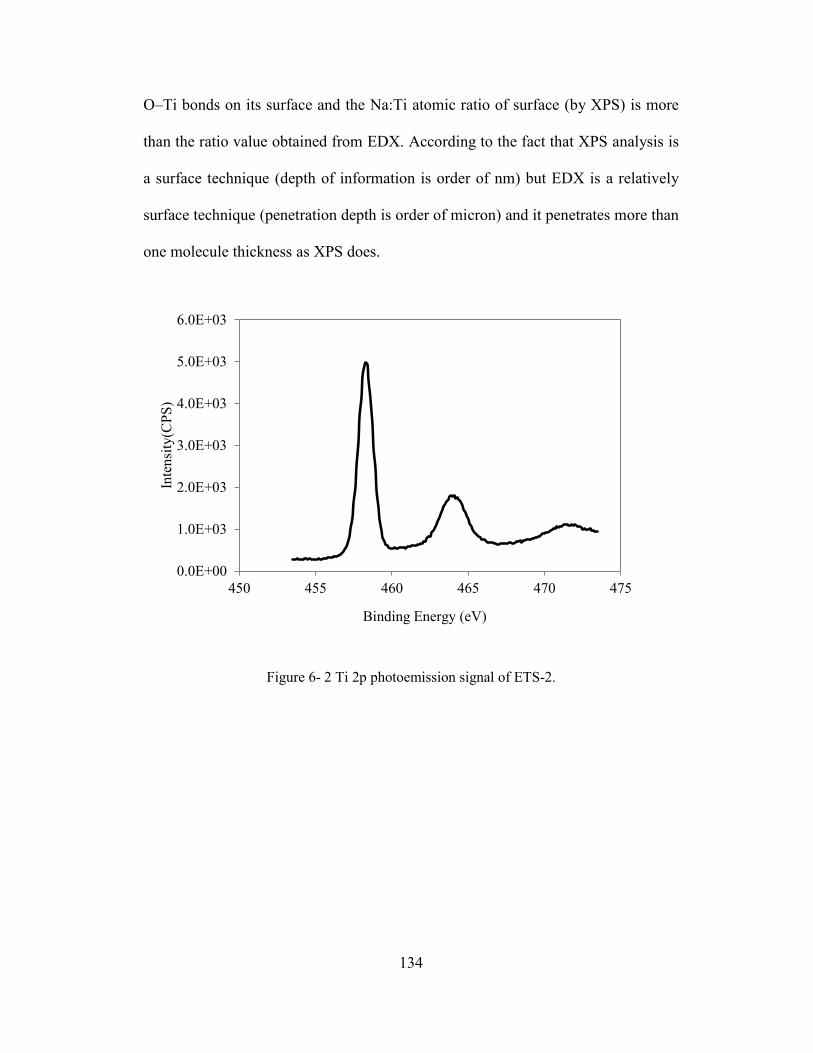
134
O–Ti bonds on its surface and the Na:Ti atomic ratio of surface (by XPS) is more
than the ratio value obtained from EDX. According to the fact that XPS analysis is
a surface technique (depth of information is order of nm) but EDX is a relatively
surface technique (penetration depth is order of micron) and it penetrates more than
one molecule thickness as XPS does.
Figure 6- 2 Ti 2p photoemission signal of ETS-2.
0.0E+00
1.0E+03
2.0E+03
3.0E+03
4.0E+03
5.0E+03
6.0E+03
450 455 460 465 470 475
Inte
nsi
ty(C
PS
)
Binding Energy (eV)

135
Figure 6- 3 O 1s photoemission signal of ETS-2.
Results from XPS and EDX are in good agreement with what is reported earlier
based on the XRD results that surface of ETS-2 have been converted to sodium
titanate and the bulk is TiO2 [25].
6.4.1.4. Chemical property changes for spent ETS-2
Inductively coupled plasma mass spectrometry (ICP-MS) was performed to
determine the chemical composition of the aqueous solution before and after
copper removal. Results are given in Table 6-3.
0.0E+00
1.0E+03
2.0E+03
3.0E+03
4.0E+03
5.0E+03
6.0E+03
7.0E+03
8.0E+03
526 528 530 532 534 536 538
Inte
nsi
ty(C
PS
)
Binding Energy (eV)
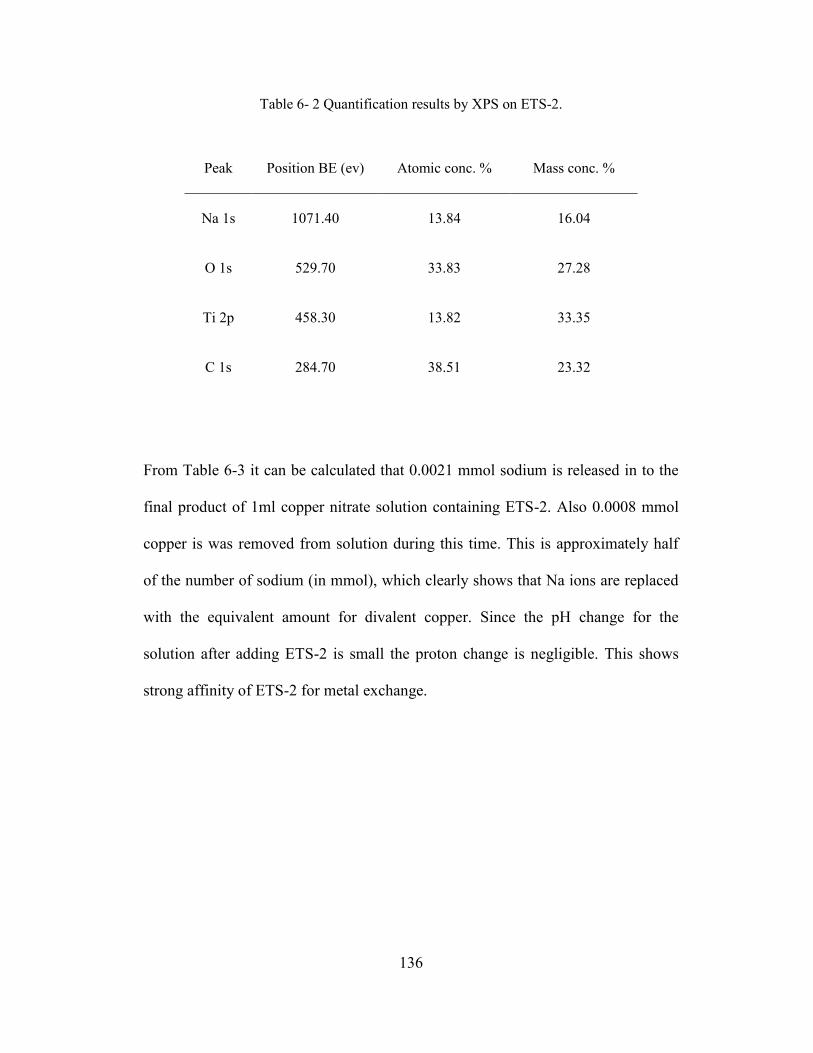
136
Table 6- 2 Quantification results by XPS on ETS-2.
Peak Position BE (ev) Atomic conc. % Mass conc. %
Na 1s 1071.40 13.84 16.04
O 1s 529.70 33.83 27.28
Ti 2p 458.30 13.82 33.35
C 1s 284.70 38.51 23.32
From Table 6-3 it can be calculated that 0.0021 mmol sodium is released in to the
final product of 1ml copper nitrate solution containing ETS-2. Also 0.0008 mmol
copper is was removed from solution during this time. This is approximately half
of the number of sodium (in mmol), which clearly shows that Na ions are replaced
with the equivalent amount for divalent copper. Since the pH change for the
solution after adding ETS-2 is small the proton change is negligible. This shows
strong affinity of ETS-2 for metal exchange.

137
Table 6- 3 Concentration (ppm) of different ions during the copper exchange process
Sample Ti Cu Na Si
±0.00006 ±0.00003 ±0.005 ±0.005
Cu(NO3)
2 Below detection limit 54.1 3.33 Below detection limit
Cu(NO3)
2 + ETS-2 2.22 1.67 50.9 8.72
Table 6- 4 The content of different elements in Cu-ETS-2 by EDX
Element Atomic conc. at % Mass conc. %
Na 0.12 0.10
O 67.51 40.04
Ti 26.08 46.29
Cu 5.29 12.47
Si 0.86 0.89
Ca 0.14 0.21
Point specific elemental analysis has been done for a compressed Cu-ETS-2
disc and results are given in Table 6-4. Results in Table 6-1 and 6-4 show that
Na:Ti of ETS-2 sample dropped dramatically after copper removal process (0.34 to
138
0.0046). Besides, Cu:Ti atomic ratio of Cu-ETS-2 (0.20) is close to the half of what
it is for the ratio of Na:Ti (0.34) on ETS-2.
The amount of sodium ions released to the aqueous solution during the
copper removal process can be calculated through a mass balance for the solid
phase, from the ICP results (Table 6-3). Results show that 0.0766 g sodium was
removed from the solid phase after copper removal. Since ICP is a volumetric
technique, which detects all sodium amounts, this number is the total amount of
sodium ions removed from solid phase. This is also very close to the same value
obtained from EDX results, 0.0792 g, showing that all displaced sodium ions could
be detected by EDX analysis.
Therefore, copper removal occurs on the surface of ETS-2, the sodium titanate
layer. Unlike XPS, EDX can detect the whole titanate layer and may go even
deeper to the titanium dioxide core. That is another reason for why EDX detects
more Ti than XPS and the Na:Ti ratio from the tests differ.
6.4.2. Effect of pH
Figure 6-4 displays the effect of pH on the adsorption of Cu2+ ions onto ETS-2
sample. As it can be seen the heavy metal ion removal by ETS-2 adsorbent is
significantly affected by the pH value of the aqueous solution at strongly acidic
medium (pH=2).
This indicates that during the process H3O+ ions are competing with copper ions for
the sorption sites. Therefore, at very low pH when the number of H3O+ ions is very

139
high, removal of copper ions is less favorable than higher PH. However in the
previous section (6.4.1.3) that number of sodium ions release to the solution was
two times of the adsorbed copper ions, PH was higher than 2 (PH=5.16). And it
was in good agreement with the valences of the two ions.
Figure 6- 4 Effect of pH on the Cu removal capacity of ETS-2 at room temperature and
initial Cu2+ concentration 54 mg/L and 1 hour contact time.
With a further increase in pH (to 7) the copper removal capacity increased
noticeably. This happens due to the fact that there is less competing ion (proton) in
the system. Besides, the copper ions in the aqueous solution are the forms of Cu2+,
Cu(OH)+ and Cu2(OH)2+2 at pH around 5, which is favorable for the Cu2+
adsorption [14]. Precipitation of the metal hydroxide on the surface also appears at
higher pH values [12, 14].
0.00
20.00
40.00
60.00
80.00
100.00
120.00
0 1 2 3 4 5 6 7 8
Cu R
emoval
(%
)
PH
140
At PH around 5 it has been seen that after adding ETS-2 the pH of the aqueous
solution increases slightly, which means that very few H3O+ ions adsorb on ETS-2.
Thus the small pH change after adding the ETS-2 sorbent shows that in the
competition between copper and H3O+, copper is more successful to sit in sodium
place.
6.4.3. Mechanism of Cu ions adsorption
Activated carbon is often used as an adsorbent for the heavy metal ions removal
from wastewater [12]. The impregnation mechanism proposed by [26] show that
copper ions are deposited in the form of Cu(OH)2 on activated carbon.
Unlike activated carbon, data presented in this work clearly show that ion exchange
is the dominant removal mechanism for Cu2+ removal by ETS-2. Hence, dissolved
copper ions are displaced with sodium ions from ETS-2 structure and are not
impregnated onto the external-surface of ETS-2 substrate in the form of Cu(OH)2
and become part of the ETS-2; known as Cu-ETS-2.
Cu(OH)2 has a very high solubility in ammonium hydroxide (NH4OH). Thus
adding NH4OH to the solution during the copper removal process is a good
indicator if any impregnated Cu(OH)2 forms on ETS-2 surface. Results from EDX
analysis implies that the amount of copper on Cu-ETS-2 sample is not decreased
after NH4OH, which is another evidence for the ion exchange mechanism and there
is more affinity for copper than proton to seat in Na place in ETS-2 structure.

141
6.5. Conclusions
The potential of ETS-2 as an adsorbent for the removal of copper ions from
aqueous solutions is investigated. ETS-2 showed high copper capacity (over 98%
removal) showing the high affinity of ion exchange ETS-2 for copper removal.
With an adjustment for the pH of the solution, uptake of Cu ions improves sharply
up to 99% removal at pH=6.7. The results indicate the potential application of
ETS-2 for effluent heavy metal treatment in industries and also provide strong
experimental evidences to support the ion exchange mechanism proposed.
6.6. References
[1] S. Rengaraj, Y. Kim, C. K. Joo, K. H. Choi and J. H. Yi, "Batch adsorptive
removal of copper ions in aqueous solutions by ion exchange resins: 1200H and
IRN97H," Korean Journal of Chemical Engineering, vol. 21, pp. 187-194, 2004.
[2] S. R. Shukla and R. S. Pai, "Adsorption of Cu(II), Ni(II) and Zn(II) on dye
loaded groundnut shells and sawdust," Separation & Purification Technology, vol.
43, pp. 1-8, 2005.
[3] A. K. Meena, K. Kadirvelu, G. K. Mishra, C. Rajagopal and P. N. Nagar,
"Adsorptive removal of heavy metals from aqueous solution by treated sawdust
(Acacia arabica)," J. Hazard. Mater., vol. 150, pp. 604-611, 2008.
[4] S. R. Shukla and R. S. Pai, "Adsorption of Cu(II), Ni(II) and Zn(II) on modified
jute fibres," Bioresour. Technol., vol. 96, pp. 1430-1438, 2005.
[5] K. G. Bhattacharyya and S. S. Gupta, "Adsorptive Accumulation of Cd(II),
Co(II), Cu(II), Pb(II) and Ni(II) Ions from Water onto Kaolinite: Influence of Acid
Activation," Adsorption Science & Technology, vol. 27, pp. 47-68, 02, 2009.

142
[6] X. Sun, X. Huang, X. Liao and B. Shi, "Adsorptive removal of Cu(II) from
aqueous solutions using collagen-tannin resin," J. Hazard. Mater., vol. 186, pp.
1058-1063, 2011.
[7] B. Singha and S. K. Das, "Adsorptive removal of Cu(II) from aqueous solution
and industrial effluent using natural/agricultural wastes," Colloids and Surfaces B:
Biointerfaces, pp. 97, 2013.
[8] T. S. Anirudhan and P. G. Radhakrishnan, "Adsorptive Removal and Recovery
of U(VI), Cu(II), Zn(II), and Co(II) from Water and Industry
Effluents," Bioremediation J., vol. 15, pp. 39-56, 2011.
[9] H. Dumrul, A. N. Kursunlu, O. Kocyigit, E. Guler and S. Ertul, "Adsorptive
removal of Cu(II) and Ni(II) ions from aqueous media by chemical immobilization
of three different aldehydes," Desalination, vol. 271, pp. 92-99, 2011.
[10] S. Kocaoba, "Comparison of Amberlite IR 120 and dolomite's performances
for removal of heavy metals," J. Hazard. Mater., vol. 147, pp. 488-496, 2007.
[11] S. R. Popuri, Y. Vijaya, V. M. Boddu and K. Abburi, "Adsorptive removal of
copper and nickel ions from water using chitosan coated PVC
beads," Bioresour. Technol., vol. 100, pp. 194-199, 2009.
[12] S. Liu, C. Lee, H. Chen, C. Wang and L. Juang, "Application of titanate
nanotubes for Cu(II) ions adsorptive removal from aqueous
solution," Chem. Eng. J., vol. 147, pp. 188-193, 2009.
[13] R. Sitko, E. Turek, B. Zawisza, E. Malicka, E. Talik, J. Heimann, A. Gagor, B.
Feist and R. Wrzalik, "Adsorption of divalent metal ions from aqueous solutions
using graphene oxide," Dalton Transactions, vol. 42, pp. 5682-5689, 2013.
[14] X. Xue and F. Li, "Removal of Cu(II) from aqueous solution by adsorption
onto functionalized SBA-16 mesoporous silica," Microporous and Mesoporous
Materials, vol. 116, pp. 116-122, 2008.
[15] A. Shahbazi, H. Younesi and A. Badiei, "Functionalized SBA-15 mesoporous
silica by melamine-based dendrimer amines for adsorptive characteristics of Pb(II),
Cu(II) and Cd(II) heavy metal ions in batch and fixed bed
column," Chem. Eng. J., vol. 168, pp. 505-518, 2011.
[16] B. A. Shah, C. B. Mistry and A. V. Shah, "Sequestration of Cu(II) and Ni(II)
from wastewater by synthesized zeolitic materials: Equilibrium, kinetics and
column dynamics," Chem. Eng. J., vol. 220, pp. 172-184, 2013.

143
[17] W. Jiang, X. Chen, B. Pan, Q. Zhang, L. Teng, Y. Chen and L. Liu, "Spherical
polystyrene-supported chitosan thin film of fast kinetics and high capacity for
copper removal," J. Hazard. Mater., vol. 276, pp. 295-301, 2014.
[18] S. Zarghami, T. Mohammadi and M. Kazemimoghadam, "Adsorption
Behavior of Cu(II) Ions on Crosslinked Chitosan/Polyvinyl Alcohol Ion Imprinted
Membrane," Journal of Dispersion Science & Technology, vol. 36, pp. 190-195,
02, 2015.
[19] A. Çimen, A. Bilgiç, A. N. Kursunlu, I. H. Gübbük and H. I. Uçan,
"Adsorptive removal of Co(II), Ni(II), and Cu(II) ions from aqueous media using
chemically modified sporopollenin of Lycopodium clavatum as novel
biosorbent," Desalination & Water Treatment, vol. 52, pp. 4837, 07, 2014.
[20] N. S. Randhawa, N. N. Das and R. K. Jana, "Adsorptive remediation of Cu(II)
and Cd(II) contaminated wate using manganese nodule leaching
residue," Desalination & Water Treatment, vol. 52, pp. 4197-4211, 06, 2014.
[21] S. Rezaei, A. Tavana, J. A. Sawada, L. Wu, A. S. M. Junaid and S. M.
Kuznicki, "Novel Copper-Exchanged Titanosilicate Adsorbent for Low
Temperature H2S Removal," Ind Eng Chem Res, vol. 51, pp. 12430-12434, 2012.
[22] S. Rezaei, M. O. D. Jarligo, L. Wu and S. M. Kuznicki, "Breakthrough
performances of metal-exchanged nanotitanate ETS-2 adsorbents for room
temperature desulfurization," Chemical Engineering Science, vol. 123, pp. 444-
449, 2015.
[23] X. Meng, D. Wang, J. Liu and S. Zhang, "Preparation and characterization of
sodium titanate nanowires from brookite nanocrystallites," Mater. Res. Bull., vol.
39, pp. 2163-2170, 2004.
[24] R. A. Zárate, S. Fuentes, J. P. Wiff, V. M. Fuenzalida and A. L. Cabrera,
"Chemical composition and phase identification of sodium titanate nanostructures
grown from titania by hydrothermal processing," Journal of Physics and
Chemistry of Solids, vol. 68, pp. 628-637, 2007.
[25] F. Yazdanbakhsh, M. Blasing, J. A. Sawada, S. Rezaei, M. Muller, S.
Baumann and S. M. Kuznicki, "Copper Exchanged Nanotitanate for High
Temperature H2S Adsorption," Industrial and Engineering Chemistry Research,
vol. 53, pp. 11734-11739, 2014.
[26] C. Huang, C. Chen and S. Chu, "Effect of moisture on H2S adsorption by
copper impregnated activated carbon," J. Hazard. Mater., vol. 136, pp. 866-873,
2006.

144

145
7. Low Temperature Regenerable ETS-10
Titanosilicate Desiccants for Carbon
Dioxide Drying
7.1. Summary
Moisture removal from CO2 is an interesting alternative to liquid absorbers for
post-combustion capture (PCC) systems. The purified CO2 stream from a PCC
system has high moisture content and, due to equipment corrosion issues and the
risk of hydrate formation, the CO2 stream must be thoroughly dried prior to being
compressed. This chapter reports the first study on solid adsorbent selection for
CO2 using low-grade heat and ambient air as a regeneration gas. Water adsorption
performances for different adsorbents have been investigated for the desiccation of
a pure CO2 stream. Considering the little value of the CO2 product gas for
sequestration, the drying process should require no supporting process operations
and should consume little additional energy. In addition, due to the costs and
complexity of separating and purifying CO2 from a flue gas stream, the drying
process should keep as much CO2 as possible for the compression stage. A desired
desiccant for CO2 drying should have a high moisture capacity and selectivity as
well as being regenerable with waste heat and humid air.

146
The CO2 drying performance of different forms of ETS-10 were compared to that
of commercial silica and 4A zeolite. Results show that Ca-ETS-10 have the highest
moisture capacity for a temperature swing of 30-70 °C and a CO2 feed stream of
50–100% relative humidity. All desiccants tested had a CO2 recovery greater than
95% because of their intrinsic selectivity for water over CO2.
7.2. Introduction
There has been increased attention on the high levels of CO2 emissions and their
direct effect on global warming and climate change in the last decade. Since the
global production of CO2 is projected to increase from 30 billion tons in 2008 to
43.2 billion tons by 2035 [1], various methods have been proposed to mitigate the
environmental effect of rising CO2 emissions. An appealing design is post
combustion capture (PCC), which uses an adsorptive separation process to
selectively remove and concentrate CO2 from the combustion gas stream. The
concentrated CO2 is then compressed and permanently separated preventing
significant volumes of CO2 from releasing to the atmosphere. The combustion
process may be modified to run on pure oxygen and/or through a turbine in an
integrated gasification combined (IGC) cycle [2-4] to improve the efficiency of the
separation. Through IGC systems a combustion stream with a high concentration of
CO2 is generated however such advantages come at increased cost and added
process complexity.
147
Different types of adsorbents with a high selectivity for CO2 over other
atmospheric gases including zeolites [5-9], metal oxides [10-15], and solid-
supported amines [16-20] have been investigated for recovering CO2. Despite
different characteristics of these materials, they all co-adsorb water to some extent
which will be desorbed with the CO2. But the moisture content needs to be
reduced to trace levels prior to compression of the carbon dioxide streams to meet
the requirements for underground carbon sequestration [21], and to prevent the
formation of CO2 hydrates [22].
A desired desiccant would noticeably have a high water capacity at low partial
pressure and would demonstrate a large difference in moisture capacity over a
narrow temperature swing. Besides for the CO2 streams the adsorbents’ selectivity
toward water over CO2 is also important to lend the main stream gas losses and
cause a high CO2 recovery. The extra cost and complexity related to improving
CO2 capture have to be met with process efficiency at the drying stage, since losses
at the drying stage will affect the overall efficiency of the PCC system.
Liquid absorption drying systems are known as a mature technology, however they
are unsuitable for PCC/CO2 sequestration since the thermal input required in the
reboiler and the poor selectivity of the liquid. A famous example is
triethyleneglycol (TEG) drying system which need a regeneration temperature of
200°C to remove the adsorbed moisture [23] and is limited to generating gas
streams having a dew point of about -40 °C which may not outfit all compression
and sequestration requirements. Besides, TEG has a significant absorption capacity
for CO2 [24], which reduces the CO2 recovery.

148
Temperature swing adsorption (TSA) drying systems, with zeolites as desiccants,
have been used for drying of natural gas. They are capable of generating gas
streams having very low dew points, but zeolites require a regeneration step at
temperatures more than 200°C [25]. The moisture selectivity and capacity of
zeolite molecular sieves are extremely high, then it would be expected that the CO2
losses from a conventional TSA system would be minimal. But generating high-
grade heat to regenerate the zeolite desiccant through the combustion of fossil fuels
is not economically and environmentally reasonable for PCC because the product
gas has limited or no value.
Silica gel desiccants on the other hand can be regenerated at temperatures as low as
100°C, which allows the use of low-grade waste heat streams as a regeneration
source. However its water adsorption capacity decreases linearly with
concentration [7] which causes little adsorption capacity at trace levels of moisture.
Engelhard Titanosilicate 10 (ETS-10) is a large-pored, titanium silicate molecular
sieve composed of a mixture of tetrahedral silicon oxide and octahedral titanium
oxide [26, 27]. The porous structure of ETS-10 is composed of a network of
connected 7.6 Å by 4.9 Å channels formed by 12 membered rings [26] which are
composed entirely of silica tetrahedral that give the molecular sieve a chemical
stability. This is typically reserved for highly dealuminated zeolites. The
orthogonal titania chains maintain a net negative charge which is balanced by
cationic counter ions. Therefore ETS-10 combines the ion exchange capability of
zeolite molecular sieves with the chemically passive characteristics of silica gel.
The combination of these unique properties, made ETS-10 as a template for

149
precious metal nanodots [28, 29], quantum wires [30, 31], hydrocarbon separations
[32, 33], an additive to improve the conductivity of PEM fuel cell membranes [34,
35], and a continuous membrane itself [36-39].
Although ETS-10 has previously been identified as a desiccant material for air
[40], its use for drying CO2 streams has not been investigated. Even as an air
desiccant, no breakthrough test was conducted and its ability as a regenerable
desiccant was explored through isotherm study. It was shown that the adsorption
behavior of ETS-10 is unique due to the high moisture capacity at low partial
pressures at ambient temperatures, but rapid loses in moisture capacity at elevated
temperatures [40].
This chapter describes the CO2 drying performance of different ion exchanged
forms of ETS-10 (Na-, Ca- and Ca/H-ETS-10) and compares them to commercial
silica and zeolite 4A adsorbents. The drying capacity of each adsorbent was
compared at 50%-100% relative humidity (RH) under specific bed regeneration
time and temperature, air flow, and adsorption temperature.
7.3. Materials and Methods
7.3.1. Adsorbent Preparation
The ETS-10 (or Na-ETS-10) sample was synthesized hydrothermally using a
previously published technique [27]. Synthesis gels were prepared by mixing 50 g
sodium silicate solution (28.7% SiO2, 8.9% Na2O, Fisher), 3.2 g of sodium
hydroxide beads (Fisher), 3.8 g of KF (anhydrous, Fisher), and 16.3 g of TiCl3
150
solution (20%, Fisher). The pH of the mixture was changed from about pH 12 to
10.1 by adding hydrochloric acid (1M, Fisher). The mixture was then stirred for
one hour and then reacted in a sealed, Teflon lined 125 mL autoclave (PARR
Instruments) at 200°C for 72 hours. The post-reaction material was then washed
with de-ionized water and filtered, then dried in an 80°C oven.
The Ca2+ exchanged ETS-10 was carried out by mixing the synthesized powder
with a CaCl2 solution. The ion exchange mixture was prepared by adding 30 g
CaCl2·2H2O (Fisher) to 150 g of de-ionized water, stirring to dissolve the calcium
chloride, then adding 15 g of Na-ETS-10 powder. The mixture was then agitated
and placed in a sealed vessel in an oven at 80°C under static conditions for 4 hrs.
After this the powder was again washed with de-ionized water and filtered, then
dried at 80°C.
The mixed calcium/hydrogen exchange ETS-10 was carried out by dissolving 4 g
of CaCl2·2H2O in 150 g of de-ionized water and then adding 15 g of Na-ETS-10.
The mixture was placed in an oven under static conditions at 80°C overnight in a
sealed container. The sample was then filtered and dried at 80°C for two hours. The
sample was then dispersed in 150 g of de-ionized water. The pH of the sample was
lowered to 2 by adding HCl (1M, Fisher). The sample was stirred overnight at
room temperature. It was then washed with deionized water, filtered, and dried in
an oven at 80°C.
151
Zeolite 4A (Dessican Inc.) sample consisted of 4 to 2 mm beads. Grace Davison
Grade 40 (lot #908) silica gel with a particle size range from 3.36 to 1.68 mm
(No.6 to No.12 mesh) was used in this study
ETS-10 sample powders were pressed into binderless dense pellets. These pellets,
along with the zeolite 4A and silica beads were crushed and sieved with the 1.19
mm to 0.595 mm fraction for use in the CO2 drying experiments.
7.3.2. Characterization tests
X-ray diffraction (XRD) was used to verify the identities of and to gain qualitative
information on the crystal structures of the adsorbents used in this study. A Rigaku
Ultima IV with Co tube (38kV, 38mA) with an average Kα wavelength of 1.7902
Å equipped with a D/Tex detector with a Fe filter was used for all XRD
characterization. XRD patterns obtained were compared to data from the
International Center for Diffraction Data-Powder Diffraction File (ICDD-PDF)
using JADE 9.1, along with visual comparisons to existing standards and literature
to verify sample identity and purity.
Gas adsorption isotherms, surface area, and pore volume measurements were
carried out using a Micrometrics ASAP 2020C volumetric physisorption system.
Nitrogen at -196°C was used as the probe molecule. Samples were outgassed at
200 °C overnight at a pressure of 0.4 Pa.

152
7.3.3. Experimental Apparatus
Figure 7-1 and 7-2 display the picture of the drying set up and the process flow
diagram for the experimental setup respectively. To control the input stream
humidity, the inlet stream coming from the CO2 cylinder (Praxair) was split and
pasted through two mass flow controllers (MFC) (Alicat Scientific scaled for 0 to
500 cc/min gas flows at 25°C and 101.325 kPa mass reference conditions). The
flow from the first MFC bubbled through a 300 mL liquid contactor partially filled
with de-ionized water (to prevent liquid water from being carried over) to saturate
with moisture. The second stream from the second MFC run directly to a 50 mL
accumulator mixed in the accumulator with the moisture saturated gas streams.
Different gas moisture contents from 0 to 100% RH was achieved by adjusting the
flowrate of the two MFCs. Moisture blending were calibrated using the outlet
humidity from the accumulator being recorded at various blending levels using a
Traceable Humidity Meter (Fisher Scientific).
The exit CO2 stream from the accumulator entered at the top of the adsorbent bed
and flowed vertically downward through it. The adsorbent bed was made of a
borosilicate glass tube with an inner diameter of 10.7 mm. The pressure at the inlet
and outlet of the bed was monitored by a pair of 0-15 psia pressure transducers
(PX209- Omega Environmental). The temperatures at the both ends of the bed
were also measured using two K-type thermocouples (HGKMQSS -Omega
Environmental). In order to maintain a stable temperature for humidification and to

153
prevent condensation all equipment in contact with moist CO2 was kept inside an
oven (Fisher Isotemp) at 30°C.
Figure 7- 1 Picture of the experimental apparatus.

154
Figure 7- 2 Schematics of process flow diagram of experimental setup.
The outlet of the desiccant bed was plumbed to a dew point meter, which assessed
the amount of moisture remaining in the gas stream. The sensor used was a XDT
transmitter (COSA Xentaur) with a high capacitance Al2O3 XTR-100 sensor
element capable of measuring dew points from -100°C to 20°C (0.013 ppmv to
23080 ppmv). To keep the column working at atmospheric pressure and also
recording the product flow rate, the product flow rate was measured by a MC mass

155
flow/backpressure controller (Alicat Scientific). A vacuum pump downstream
could be used to create a pressure differential for smoother operation of the
backpressure controller, however this was not typically required.
The three-way valves around the bed were actuated, shifting the system from
adsorption to desorption mode to regenerate the bed. A third MFC (Alicat
Scientific) was used to control the flow of regeneration air. The regeneration air
source was either building-supplied compressed air or ambient air (compressed and
delivered via a diaphragm pump KNF Neuberger) using a three-way valve. The
ambient air humidity was measured by a portable temperature/humidity meter (HH-
314A - Omega Environmental). The regeneration air flowed from the third MFC
and then was heated to 70°C by a heating cord (HTC-120- Omega Environmental)
wrapped around the tubing before sweeping through the adsorbent bed. It pasted
the adsorbent bed upward to make a counter current with the wet gas stream in the
adsorption phase. During this time the adsorbent bed was wrapped with a heating
cord (HTC-030 - Omega Environmental) and was heated up to 70°C. Then the
regeneration air was run through another portable temperature/humidity meter
(HH-314A - Omega Environmental) humidity of the and finally was vented to the
room.
After the regeneration step the bed was cooled down and at the same time the dew
point sensor was blown down with dry nitrogen stream (Praxair) to remove the
adsorbed moisture. After the bed had cooled and the dew point sensor level had
been reduced to below -65°C, another adsorption cycle would be begun. Each
cycle started with a desorption step, followed by cool down step, ending with an

156
adsorption step. Adsorption, regeneration /desorption, and cool-down/ sensor purge
stages of the cycle operation are depicted in different colors in Figure 7-2.
The entire experiment was controlled and data collected through a Labview
program (Les Dean, Instrument shop, Department of Chemical and Materials
Engineering, University of Alberta).
7.3.4. Breakthrough experiments
CO2 drying performances for five different adsorbents including silica gel, zeolite
4A, Na-ETS-10, Ca-ETS-10, and Ca/H-ETS-10 were studied at moisture contents
of 50, 75, and 100 % RH. The moisture adsorption conditions were adjusted at
30°C (near-ambient condition) and a CO2 flow rate of 500 sccm. For the bed
regeneration conditions were set at a bed temperature of 70°C, with ambient room
air used at a flow rate of 500 sccm and one hour for the regeneration time. The low
regeneration temperature was selected to compare the performance of the
adsorbents using low-grade heat for regeneration, such as the waste heat available
from the low-pressure steam of a power plant. Reproducibility of the data was
checked through replicate runs for each set of experimental conditions.

157
7.4. Results and Discussion
7.4.1. Characterization of the adsorbent samples
Figure 7-3 displays the XRD patterns for Na-, Ca-, and Ca/H-ETS-10. All patterns
are very similar, which shows the ion exchange procedures do not change the ETS-
10 crystal structure significantly. As it can be seen all major peaks are
characteristic of ETS-10, except for the peak at 2θ = 35° which is likely identified
as being characteristic of ETS-4, a typical by-product of ETS-10 synthesis.
EDX point analysis has been conducted on the ion-exchanged ETS-10 desiccant
samples and data are shown in Table 7-1.
The amount of Na+K decreased significantly after Ca and Ca/H exchanges,
indicating that the Na+ and K+ ions are being displaced by the Ca2+ and H+ ions.
However the K+ ions are exchanged proportionally less than the Na+, which can be
explained by the stronger affinity of K+ ions for their sites in the lattice, compared
to Na+. Anderson et al. proposed that some of the K+ ions are locked within the
cages of the structure and therefore unavailable for exchange, while the Na+ ions
are more exposed and can be displaced more easily [41].
The cation to titanium (Na:Ti, Ca:Ti) can be used to determine the degree of the ion
exchange procedure. As expected Na:Ti ratio in the Ca-ETS-10 decreases
significantly. However, in order to balance the net negative charge of the TiO62-
octahedral in the framework, a net 2+ charge is required. This might be done by the
presence of H+ in addition to K+ and Na+ in the as-synthesized Na-ETS-10.
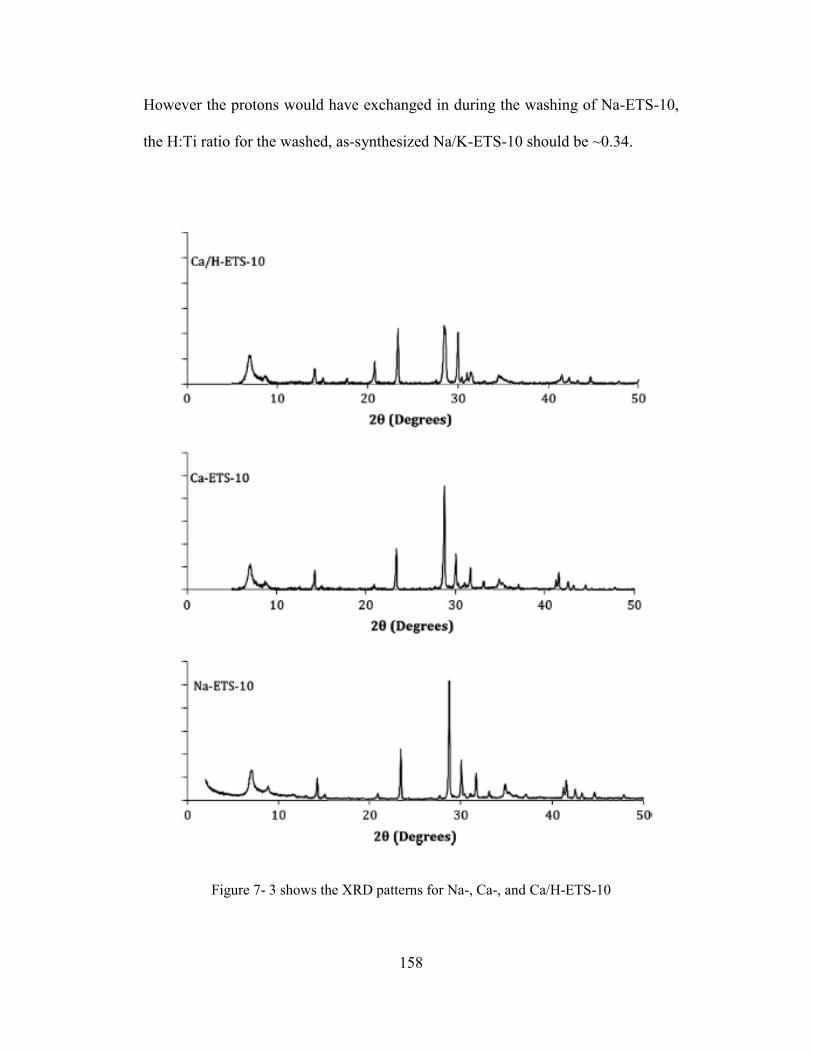
158
However the protons would have exchanged in during the washing of Na-ETS-10,
the H:Ti ratio for the washed, as-synthesized Na/K-ETS-10 should be ~0.34.
Figure 7- 3 shows the XRD patterns for Na-, Ca-, and Ca/H-ETS-10

159
For Ca-ETS-10, as expected, the H:Ti ratio drops (to ~0.15) because protons like
other monovalent cations are exchanged for Ca2+. Ca/H-ETS-10 shows the H:Ti
ratio of ~0.87, which suggest that the ion affinity of ETS-10 follows the trend of
Ca2+ > H+ > Na+ / K+. This is also shown by literature reports that ETS-10 has a
strong affinity for divalent cations and for protons [30, 42, 43].
Table 7- 1 Atomic ratios of various ETS-10 samples calculated from EDX results
Adsorbent Atomic Ratios with 95% Confidence Intervals Total Charge:Ti
Si:Ti Na:Ti Ca:Ti K:Ti
Na-ETS-10 A 3.73±0.32 1.30±0.15 - 0.38±0.03 1.68±0.15
Na-ETS-10 B 3.75±0.32 1.22±0.15 - 0.42±0.03 1.64±0.15
Na-ETS-10 C 3.79±0.32 1.25±0.15 - 0.40±0.03 1.65±0.15
Ca-ETS-10 A 3.26±0.28 0.49±0.07 0.55±0.04 0.24±0.02 1.83±0.11
Ca-ETS-10 B 3.02±0.28 0.26±0.02 0.61±0.05 0.37±0.06 1.85±0.12
Ca-ETS-10 C 3.85±0.37 0.50±0.07 0.58±0.05 0.22±0.02 1.88±0.12
Ca/H-ETS-10 A 3.96±0.37 0.23±0.02 0.35±0.03 0.18±0.03 1.11±0.07
Ca/H-ETS-10 B 3.12±0.28 0.27±0.02 0.35±0.03 0.17±0.03 1.14±0.07
Ca/H-ETS-10 C 3.85±0.36 0.26±0.02 0.37±0.03 0.13±0.03 1.13±0.07

160
Nitrogen adsorption isotherms were used for the pore volume and surface areas
determination of the tested adsorbents. Results are given in Table 7-2 except for
zeolite 4A since it will not adsorb nitrogen at -196°C. BET and Langmuir methods
have been used for surface area calculation of the silica gel sample and ETS-10
samples respectively. And the deBoer t-plots method was used to determine the
pore volume, micropore and external surface areas. The surface areas and pore
volumes of the ETS-10 samples are very close since ion exchange is not expected
to affect these properties.
Table 7- 2 Surface areas and pore volumes of the adsorbent samples
Adsorbent
Total Surface
Area (m2/g)
Micropore
Volume (cc/g)
Micropore Area
(m2/g)
External Surface
Area (m2/g)
Silica Gel
677.9±9.8
0.0854
171.5
506.4
Na-ETS-10 389.8±0.5 0.1327 341.6 48.85
Ca-ETS-10 380.1±0.1 0.1214 336.4 43.7
Ca/H-ETS-10 392.7±0.2 0.1249 348.2 44.4
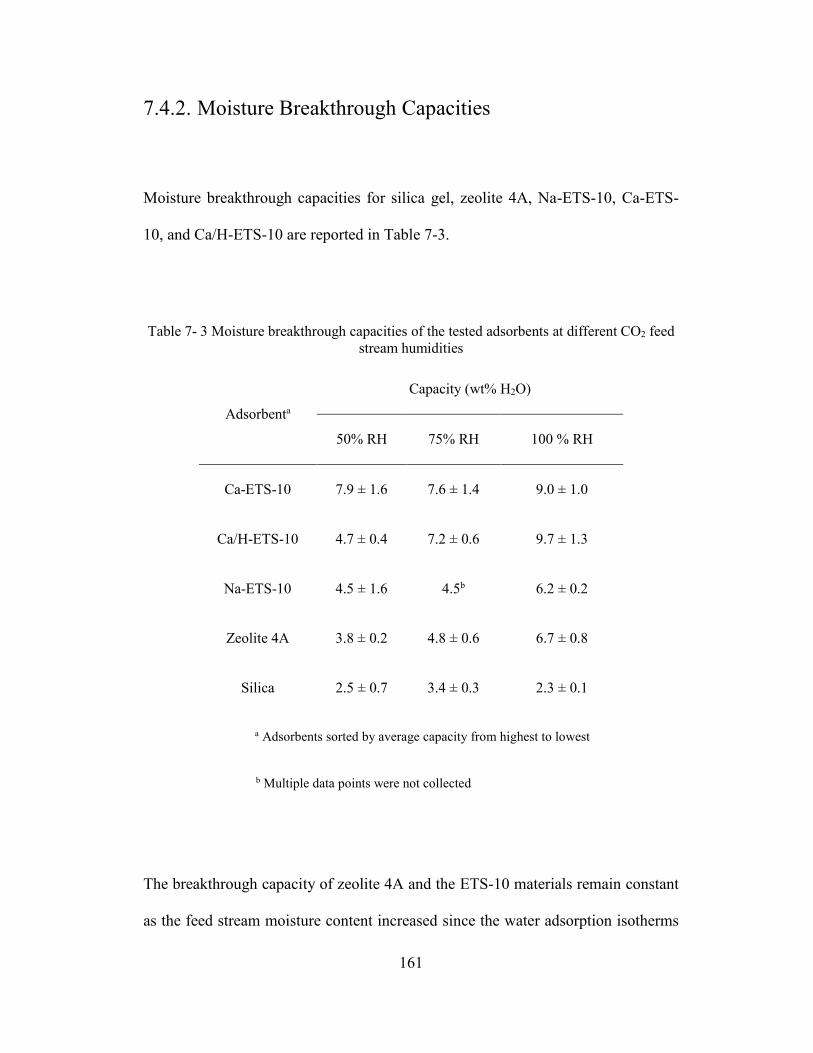
161
7.4.2. Moisture Breakthrough Capacities
Moisture breakthrough capacities for silica gel, zeolite 4A, Na-ETS-10, Ca-ETS-
10, and Ca/H-ETS-10 are reported in Table 7-3.
Table 7- 3 Moisture breakthrough capacities of the tested adsorbents at different CO2 feed
stream humidities
Adsorbenta
Capacity (wt% H2O)
50% RH 75% RH 100 % RH
Ca-ETS-10 7.9 ± 1.6 7.6 ± 1.4 9.0 ± 1.0
Ca/H-ETS-10 4.7 ± 0.4 7.2 ± 0.6 9.7 ± 1.3
Na-ETS-10 4.5 ± 1.6 4.5b 6.2 ± 0.2
Zeolite 4A 3.8 ± 0.2 4.8 ± 0.6 6.7 ± 0.8
Silica 2.5 ± 0.7 3.4 ± 0.3 2.3 ± 0.1
a Adsorbents sorted by average capacity from highest to lowest
b Multiple data points were not collected
The breakthrough capacity of zeolite 4A and the ETS-10 materials remain constant
as the feed stream moisture content increased since the water adsorption isotherms

162
for these adsorbents show an essentially constant equilibrium water capacity at the
humidity range investigated.
At 30°C the 50%-100% RH range the feed stream moisture level is not low enough
to have moved out of the rectangular region of the adsorption isotherm. And, thus,
this moisture level corresponds to the rectangular region of these isotherms. This
can be also attributed to the fact that for zeolite 4A, Na-ETS-10, and Ca/H-ETS-10,
the bed length is not long enough for the mass transfer front to fully develop,
leading to the breakthrough before any portion of the bed is fully saturated.
The variability in the data presented in Table 7-3 is likely due to the change in the
humidity of the ambient air used for the regeneration. Since the data sets with a
larger variability in moisture capacity measurements had a higher degree of
variability in the recorded ambient air humidity.
Increasing moisture in the regeneration gas associates with a decrease in bed
moisture capacity, as shown for Ca-ETS-10 at 75% RH in Figure 7-4. The presence
of moisture in the regenerating air stream limits the amount of water desorbed from
the water-saturated bed by maintaining an elevated partial pressure of moisture.
Figure 8-5 shows the effect of regeneration air stream humidity on bed moisture
capacity for silica gel, zeolite 4A and Ca-ETS-10 using a feed stream humidity of
100% RH CO2 and one hour regeneration time. The building compressed air had a
measured humidity of 46 ppmv while the ambient air humidity was from 3100
ppmv to 4100 ppmv. For all adsorbent beds, the moisture capacity was lower when
using ambient air for regeneration. Results show the regeneration stream humidity

163
significantly affects Silica gel. The difference in the 4A bed loses is almost 50% of
its capacity, which is well outside of the test-to-test variability for this sample,
while the results for the Ca-ETS-10 may be considered within the error.
Figure 7- 4 Moisture breakthrough capacity for different adsorbents at 30° C using
different regeneration air sources with a 100% RH CO2 feed stream.
The difference in bed capacity under humid and dry regeneration air can be
understood by comparing the isotherms for the various materials. The water
adsorption isotherms for silica gel, 4A, and Ca-ETS-10 are shown in Figure 7-5. It
can be seen that silica gel has a linear response to moisture concentration across a
range of temperatures and it has little water capacity at low partial pressure.
Adsorption capacity at low moisture partial pressure is limited by the presence of
humidity in the regeneration gas stream. This residual moisture loading as well as
0
0.02
0.04
0.06
0.08
0.1
0.12
0.14
0.16
Ca-ETS-10 Zeolite 4A Silica Gel
Cap
acit
y (
g H
2O
/g d
esic
can
t)
Compressed Ambient Air
Dried Compressed Air

164
low moisture capacity at low partial pressures will significantly drop the adsorption
capacity of the silica gel and explains the difference seen in the silica gel
experiments (Figure 7-5 (a)). Zeolite 4A shows a rectangular adsorption isotherm
which is typical of aluminosilicate zeolites. 4A is saturated at relatively low levels
of humidity and the adsorption capacity results in a much smaller swing capacity
over the range of temperatures selected (Figure 7-5 (b)). Figure 7-5 (c) shows the
water adsorption isotherms for Ca-ETS-10, which is fundamentally different than
the one for silica gel and 4A. The rectangularity of the isotherm at ambient
temperature confirms a high moisture capacity at low partial pressure however this
rectangularity collapses at elevated temperatures. Since the adsorption profile for
Ca-ETS-10 falls as a function of temperature, a larger swing capacity over a narrow
temperature window is acceptable even when humid air is used as the regeneration
gas.
(a)

165
(b)
(c)
Figure 7- 5 Water adsorption isotherms for (a) Silica gel-Grade Davidson GD 40 [7], (b)
Zeolite 4A Bayer [44], and (c) Ca-ETS-10 [40].
Comparing the breakthrough capacities per unit volume of adsorbent basis (g H2O
adsorbed per cc adsorbent) is relevant because the adsorbent bed volume is a major
factor in determining the capital cost of an adsorptive gas separation unit. In this
manner Ca-ETS-10 has the highest capacity for both 50% RH (0.0582 g/cc) and

166
75% RH (0.0564 g/cc) CO2 feed streams. For the 50% RH CO2 feed this is
noticeably higher than Na-ETS-10 (0.0335 g/cc), the second highest capacity
adsorbent, and higher than the capacity of zeolite 4A (0.0311 g/cc). For the 75%
RH CO2 feed Ca/H-ETS-10 breakthrough capacity (0.0493 g/cc) is close to that of
Ca-ETS-10. The capacity of zeolite 4A (0.0390 g/cc) is still noticeably lower than
the one for Ca-ETS-10 and Ca/H-ETS-10. At 100% RH CO2 feed stream, Ca/H-
ETS-10 (0.0671 g/cc) and Ca-ETS-10 (0.0666 g/cc) have approximately the same
breakthrough capacity, higher than that of the other adsorbents.
The consistently low breakthrough capacity of silica gel can be explained by its
relatively low affinity for moisture compared to the other adsorbents. This gives it
a low equilibrium capacity at low inlet moisture levels, allowing ppm levels of
moisture to easily breakthrough.
The breakthrough capacity of zeolite 4A has a similar trend to that of Na-ETS-10
and Ca/H-ETS-10. The breakthrough capacity of Ca/H-ETS-10 increased the most
with the increasing feed stream humidity, followed by zeolite 4A. The increasing
moisture content less affects na-ETS-10.
7.4.3. CO2 Recovery
The recovery of the product (the amount of produced target gas / the
amount of target gas fed to the system) is an important performance parameter in
separations processes. In these breakthrough experiments the dry CO2 exiting the

167
system can be considered the product stream. The CO2 percent recoveries for the
various breakthrough experiments are shown in Table 8-4. It can be seen that for all
adsorbents, the recovery was greater than 95%. This was expected due to the high
selectivity these materials have for water over most other gases and vapour. The
high selectivity of the adsorbents for water over CO2 leads to the high recovery for
the process.
Table 8-4. CO2 percent recovery at moisture breakthrough for various adsorbents
at 50, 75 and 100 % RH CO2 feed streams
Adsorbent
Percent Recovery at CO2 Feed Stream Humidities
50% RH 75% RH 100 % RH
Ca-ETS-10 99.1±0.6 98.1±0.9 97.4±0.4
Ca/H-ETS-10 97.9±0.1 98.1±0.2 97.5±0.6
Na-ETS-10 98.2±1.3 96.9±1.2 96.1±0.5
Zeolite 4A 97.4±0.2 98.5±2.5 96.6±0.6
Silica 95.8±1.1 95.4±0.1 95.5±0.9
Ca-ETS-10 was then presented as a potential air desiccant to Parker Hannifin
Corporation (NJ, US). Moisture breakthrough tests for Ca-ETS-2 compared to that
of commercial Activated alumina (Parker Hannifin Corpora as the reference
desiccant) show higher moisture breakthrough time. Four adsorption-desorption
cyclic tests show less capacity loss for Ca-ETS-10 compare to the one for
Activated Alumina. Results are given in Appendix section.

168
7.5. Conclusions
This work has focused on drying a humid CO2 stream, which would be generated
from a PCC system. It has been shown that ETS-10 is a promising desiccant for
drying CO2 to trace levels of moisture. Ca-ETS-10 had the highest breakthrough
capacity of the desiccants examined under the specified test conditions and a swing
regeneration temperature as low as 70°C using humid, ambient air. The relative
insensitivity of ETS-10 towards humidity in the regeneration stream eliminates the
need for a separate regeneration air drying step which further diminishes the energy
requirements of the system. The ability to regenerate with humid, ambient air and
low grade waste heat, as well as high CO2 recovery, makes ETS-10-based
adsorptive drying an attractive alternative to solvent-based absorptive drying.
7.6. References
[1] International Energy Outlook 2011.
Available: http://large.stanford.edu/courses/2011/ph240/nagasawa2/docs/0484-
2011.pdf. (Accessed on Dec. 20th, 2015).
[2] C. Cormos, A. Padurean and P. S. Agachi, "GHGT-10: Technical evaluations of
carbon capture options for power generation from coal and biomass based on
integrated gasification combined cycle scheme," Energy Procedia, vol. 4, pp.
1861-1868, 2011.
[3] Y. Hu, H. Li and J. Yan, "Integration of Evaporative Gas Turbine with Oxy-
Fuel Combustion for Carbon Dioxide Capture," International Journal of Green
Energy, vol. 7, pp. 615-631, 2010.
[4] A. Kather and S. Kownatzki, "Assessment of the different parameters affecting
the CO2 purity from coal fired oxyfuel process," International Journal of
Greenhouse Gas Control, vol. 5, pp. S204-S209, 2011.

169
[5] C. O. Areán and M. R. Delgado, "Variable-temperature FT-IR studies on the
thermodynamics of carbon dioxide adsorption on a faujasite-type H-Y
zeolite," Appl. Surf. Sci., vol. 256, pp. 5259-5262, 2010.
[6] Z. Liu, C. A. Grande, P. Li, J. Yu and A. E. Rodrigues, "Adsorption and
Desorption of Carbon Dioxide and Nitrogen on Zeolite 5A," Separation Science &
Technology, vol. 46, pp. 434-451, 02, 2011.
[7] Y. Wang and M. D. Levan, "Adsorption Equilibrium of Carbon Dioxide and
Water Vapor on Zeolites 5A and 13X and Silica Gel: Pure
Components," J. Chem. Eng. Data, vol. 54, pp. 2839-2844, 2009.
[8] Z. Zhao, X. Cui, J. Ma and R. Li, "Adsorption of carbon dioxide on alkali-
modified zeolite 13X adsorbents," International Journal of Greenhouse Gas
Control, vol. 1, pp. 355-359, 2007.
[9] A. Zukal, J. Mayerová and M. Kubu, "Adsorption of Carbon Dioxide on High-
Silica Zeolites with Different Framework Topology," Topics in Catalysis, vol. 53,
pp. 1361-1366, 11, 2010.
[10] J. Baltrusaitis, J. Schuttlefield, E. Zeitler and V. H. Grassian, "Carbon dioxide
adsorption on oxide nanoparticle surfaces," Chem. Eng. J., vol. 170, pp. 471-481,
2011.
[11] P. H. Chang, Y. P. Chang, S. Y. Chen, C. T. Yu and Y. P. Chyou, "Ca-Rich
Ca-Al-Oxide, High-Temperature-Stable Sorbents Prepared from Hydrotalcite
Precursors: Synthesis, Characterization, and CO2 Capture
Capacity," Chemsuschem, vol. 4, pp. 1844-1851, 2011.
[12] G. S. Grasa and J. C. Abanades, "CO2 capture capacity of CaO in long series
of carbonation/calcination cycles," Ind Eng Chem Res, vol. 45, pp. 8846-8851,
2006.
[13] H. Lu, P. G. Smirniotis, F. O. Ernst and S. E. Pratsinis, "Nanostructured Ca-
based sorbents with high CO2 uptake efficiency," Chemical Engineering Science,
vol. 64, pp. 1936-1943, 2009.
[14] G. Ramis, G. Busca and V. Lorenzelli, "Low-Temperature CO2 Adsorption on
Metal-Oxides - Spectroscopic Characterization of some Weakly Adsorbed
Species," Mater. Chem. Phys., vol. 29, pp. 425-435, 1991.
[15] S. P. Wang, S. L. Yan, X. B. Ma and J. L. Gong, "Recent advances in capture
of carbon dioxide using alkali-metal-based oxides," Energy & Environmental
Science, vol. 4, pp. 3805-3819, 2011.

170
[16] B. Arstad, H. Fjellvag, K. O. Kongshaug, O. Swang and R. Blom, "Amine
functionalised metal organic frameworks (MOFs) as adsorbents for carbon
dioxide," Adsorption, pp. 755, 2008.
[17] F. Chang, K. Chao, H. Cheng and C. Tan, "Adsorption of CO2 onto amine-
grafted mesoporous silicas," Separation and Purification Technology, vol. 70, pp.
87-95, 2009.
[18] R. Chatti, A. K. Bansiwal, J. A. Thote, V. Kumar, P. Jadhav, S. K. Lokhande,
R. B. Biniwale, N. K. Labhsetwar and S. S. Rayalu, "Amine loaded zeolites for
carbon dioxide capture: Amine loading and adsorption studies," Microporous and
Mesoporous Materials, vol. 121, pp. 84-89, 2009.
[19] C. Knöfel, J. Descarpentries, A. Benzaouia, V. Zeleňák, S. Mornet, P. L.
Llewellyn and V. Hornebecq, "Functionalised micro-/mesoporous silica for the
adsorption of carbon dioxide," Microporous and Mesoporous Materials, vol. 99,
pp. 79-85, 2007.
[20] O. G. Nik, B. Nohair and S. Kaliaguine, "Aminosilanes grafting on FAU/EMT
zeolite: Effect on CO2 adsorptive properties," Microporous and Mesoporous
Materials, vol. 143, pp. 221-229, 2011.
[21] L. Marini, Geological Sequestration of Carbon Dioxide. [Electronic
Resource] : Thermodynamics, Kinetics, and Reaction Path Modeling. Amsterdam ;
Oxford : Elsevier, 2007.
[22] A. Y. Manakov, Y. A. Dyadin, A. G. Ogienko, A. V. Kurnosov, E. Y. Aladko,
E. G. Larionov, F. V. Zhurko, V. I. Voronin, I. F. Berger, S. V. Goryainov, A. Y.
Lihacheva and A. I. Ancharov, "Phase Diagram and High-Pressure Boundary of
Hydrate Formation in the Carbon Dioxide-Water System," J Phys Chem B, vol.
113, pp. 7257-7262, 2009.
[23] V. Hernandez-Valencia, M. W. Hlavinka, J. A. Bullin and I. N. C. Bryan,
"Design glycol units for maximum efficiency," Research & Eng., pp. 310-317,
1992.
[24] O. Aschenbrenner and P. Styring, "Comparative study of solvent properties
for carbon dioxide absorption," Energy & Environmental Science, vol. 3, pp. 1106-
1113, 2010.
[25] D. W. Breck, Zeolite Molecular Sieves: Structure, Chemistry, and Use. New
York, Wiley, 1974.

171
[26] M. W. Anderson, O. Terasaki, T. Ohsuna, A. Philippou, S. P. MacKay, A.
Ferreira, J. Rocha and S. Lidin, "Structure of the microporous titanosilicate ETS-
10," Nature, pp. 347, 1994.
[27] S. M. Kuznicki, "Large-pored crystalline titanium molecular sieve zeolites,"
US 5011591, 1991.
[28] C. Lin, M. Danaie, D. Mitlin and S. M. Kuznicki, "Palladium Nanoparticles
Formed on Titanium Silicate ETS-10," Journal of Nanoscience and
Nanotechnology, vol. 11, pp. 2537-2539, 2011.
[29] M. Shi, C. Lin, L. Wu, C. Holt, D. Mitlin and S. M. Kuznicki, "Nanosilver
Particle Formation on a High Surface Area Titanate," Journal of Nanoscience and
Nanotechnology, vol. 10, pp. 8448-8451, 2010.
[30] N. C. Jeong, Y. J. Lee, J. H. Park, H. Lim, C. H. Shin, H. Cheong and K. B.
Yoon, "New Insights into ETS-10 and Titanate Quantum Wire: A Comprehensive
Characterization," J. Am. Chem. Soc., vol. 131, pp. 13080-13092, 2009.
[31] B. Yilmaz, J. Warzywoda and A. Sacco, "Spectroscopic characterization of the
quantum wires in titanosilicates ETS-4 and ETS-10," Nanotechnology, vol. 17, pp.
4092-4099, 2006.
[32] A. Anson, Y. Wang, C. C. H. Lin, T. M. Kuznicki and S. M. Kuznicki,
"Adsorption of ethane and ethylene on modified ETS-10," Chemical Engineering
Science, vol. 63, pp. 4171-4175, 2008.
[33] M. Shi, C. C. H. Lin, T. M. Kuznicki, Z. Hashisho and S. M. Kuznicki,
"Separation of a binary mixture of ethylene and ethane by adsorption on Na-ETS-
10," Chemical Engineering Science, vol. 65, pp. 3494-3498, 2010.
[34] A. Eguizábal, J. Lemus, M. Urbiztondo, O. Garrido, J. Soler, J. A. Blazquez
and M. P. Pina, "Novel hybrid membranes based on polybenzimidazole and ETS-
10 titanosilicate type material for high temperature proton exchange membrane fuel
cells: A comprehensive study on dense and porous systems," J. Power Sources,
vol. 196, pp. 8994-9007, 2011.
[35] T. Sancho, J. Soler and M. P. Pina, "Conductivity in zeolite-polymer
composite membranes for PEMFCs," J. Power Sources, pp. 92, 2007.
[36] Z. Lin, J. Rocha, A. Navajas, C. Téllez, J. Coronas and J. Santamari´a,
"Synthesis and characterisation of titanosilicate ETS-10
membranes," Microporous and Mesoporous Materials, vol. 67, pp. 79-86, 2004.

172
[37] H. Jeong, J. Krohn, K. Sujaoti and M. Tsapatsis, "Oriented molecular sieve
membrane by heteroepitaxial growth," J. Am. Chem. Soc., 2002.
[38] I. Tiscornia, I. Kumakiri, R. Bredesen, C. Téllez and J. Coronas, "Microporous
titanosilicate ETS-10 membrane for high pressure CO2 separation," Separation
and Purification Technology, vol. 73, pp. 8-12, 2010.
[39] A. Nalaparaju, Z. Q. Hu, X. S. Zhao and J. W. Jiang, "Exchange of heavy
metal ions in titanosilicate Na-ETS-10 membrane from molecular dynamics
simulations," J. Membr. Sci., vol. 335, pp. 89-95, 2009.
[40] S. M. Kuznicki, K. A. Thrush and H. M. Garfinkel, "Use of crystalline
molecular sieves containing charged octahedral sites in cyclic desiccating
processes" WO1993000152 A1, 1993.
[41] M. Anderson W., J. Agger R., D. Luigi, A. Baggaley K. and J. Rocha, "Cation
sites in ETS-10: 23Na 3Q MAS NMR and lattice energy minimisation
calculations," Physical Chemistry Chemical Physics (PCCP), vol. 1, pp. 2287,
1999.
[42] E. D. Camarinha, P. F. Lito, B. M. Antunes, M. Otero, Z. Lin, J. Rocha, E.
Pereira, A. C. Duarte and C. M. Silva, "Cadmium(II) removal from aqueous
solution using microporous titanosilicate ETS-10," Chem. Eng. J., vol. 155, pp.
108-114, 2009.
[43] L. Lv, G. Tsoi and X. S. Zhao, "Uptake equilibria and mechanisms of heavy
metal ions on microporous titanosilicate ETS-10," Ind Eng Chem Res, vol. 43, pp.
7900-7906, 2004.
[44] A. Gorbach, M. Stegmaier and G. Eigenberger, "Measurement and modeling
of water vapor adsorption on zeolite 4A-equilibria and kinetics," Adsorption-
Journal of the International Adsorption Society, vol. 10, pp. 29-46, 2004.

173
8. Conclusions and Recommendations
8.1. General Conclusions
This dissertation was focused on low temperature (up to 250°C) removal of
hydrogen sulfide to sub-ppm levels of H2S. The data collected during this research
demonstrate that, at room temperature, copper supported on Engelhard
Titanosilicate-2 (Cu-ETS-2) is an H2S adsorbent with a high gravimetric adsorption
capacity. Cu-ETS-2 adsorbent maintains its capacity over a wide range of
activation temperatures. The copper utilization in Cu-ETS-2 is higher than that of
highly developed commercial samples due to high surface area and the degree of
copper dispersion in ETS-2.
Room temperature H2S breakthrough experimental results showed that Cu-
ETS-2 has the best performance among Ag, Ca, and Zn -ETS-2 and that of a fully
developed commercial H2S adsorbent (BASF). Several characterization tests (i.e.
XRD, EDX, SEM and Surface area measurements) have been conducted to explain
the difference in adsorption capacities. Lower H2S removal capacities for silver,

174
zinc and calcium samples can be attributed to the presence of inactive sites such as
metallic silver dots and the rigidity of physical structure of the material.
Diluted H2S breakthrough experiments through a Cu-ETS-2 packed bed
were modeled applying the continuity equation to the system. The improvement of
the H2S breakthrough times as the experiment temperature increased can be
explained by the growing chemisorption interaction as temperature rose from 25 to
250°C. This was also in good agreement with the temperature programmed
desorption experiments which showed desorption peaks of larger magnitudes at
temperatures higher than 200°C. A fixed bed model with reaction was able to fit
the experimental data as well and it could explain the breakthrough profiles
behaviour through the increasing reaction kinetics with temperature.
Copper ions removal from aqueous solutions by ETS-2 was also studied.
ETS-2 showed high copper capacity, which is associated with high affinity of ion
exchange ETS-2. By adjusting the PH of the solution, uptake of Cu ions improved
sharply up to 89% removal at PH=4.5. It is therefore concluded that ETS-2 is a
promising adsorbent for the efficient removal of copper from water and wastewater
through ion exchange mechanism.
Finally, low energy input regenerable drying a humid CO2 stream was
studied. The purified CO2 stream from a post-combustion capture (PCC) system
has high moisture content, which causes equipment corrosion and increases the risk
of hydrate formation. Therefore, the CO2 stream must be thoroughly dried prior to
being compressed. It has been shown that ETS-10 has a high selectivity of moisture

175
over CO2 and is a promising desiccant for drying CO2 to trace levels of moisture.
Ca exchanged ETS-10 had the highest breakthrough capacity of the desiccants
examined under the specified test conditions using a swing regeneration
temperature as low as 70°C with humid, ambient air.
8.2. Recommendations for future work
Nanotitanate ETS-2 has been identified as the best support for active metal loading
due to its great characteristics such as high external surface area and cation
exchange affinity. For the first part of this work (low temperature H2S removal)
ETS-2 has been loaded with different active metals such as Cu, Zn, Ag and Ca.
Among them Cu-ETS-2 showed the best uptake capacity. All the tests have been
done for dry H2S stream, however it has been hypothesized that ETS-2 samples are
a potential H2S removal adsorbent for wet streams. This postulated because ETS-2
structure is mainly nonporous which is ideal for pore mouth blockage by moisture.
The next step will then be to investigate how to apply Cu-ETS-2 to practical H2S
separation systems where moisture exists.
In chapter 5 the proposed model includes the kinetic parameter, which predicts the
breakthrough curve well. Running H2S sorption isotherms on Cu-ETS-2 is worth to
calculate the henry constant and compare with what is estimated from the proposed

176
model. Also desorption tests at different heating rates are suggested to be able to
calculate the desorption energy through Redhead’s peak maximum method [1].
H2S adsorption-regeneration cycles through oxidation of the sulfidated adsorbent
are recommended as well.
ETS-2 showed potential copper removal capacity in chapter 6. It is recommended
to conduct the experiments at different concentration of copper solution to produce
the sorption isotherms. Experimental data can be fitted by different isotherm
models such as Langmuir and Freundlich. Kinetic study is also recommended for
copper removal tests at different temperatures.
Since copper removal capacity of ETS-2 improved with PH increase, higher H2S
removal capacity is expected using Cu-ETS-2 prepared at PH=4.5.
ETS-10 desiccants introduced and employed as low energy input regenerable
moisture removal adsorbents for CO2 streams in chapter 7. Preliminary tests have
been conducted for air-drying applications when through drying are required. It is
highly recommended to pursue air-drying studies using ETS-10 adsorbent.
8.3. References
[1] A.M. de Jong and J.W. Niemantsverdriet, "Thermal desorption analysis:
Comparative test of ten commonly applied procedures," Surface Science vol. 233
pp. 355-365, 1990.

177
Bibliography
A. Anson, Y. Wang, C. C. H. Lin, T. M. Kuznicki and S. M. Kuznicki, "Adsorption
of ethane and ethylene on modified ETS-10," Chemical Engineering Science, vol.
63, pp. 4171-4175, 2008.
A. Çimen, A. Bilgiç, A. N. Kursunlu, I. H. Gübbük and H. I. Uçan, "Adsorptive
removal of Co(II), Ni(II), and Cu(II) ions from aqueous media using chemically
modified sporopollenin of Lycopodium clavatum as novel biosorbent,"
Desalination & Water Treatment, vol. 52, pp. 4837, 2014.
A. Eguizábal, J. Lemus, M. Urbiztondo, O. Garrido, J. Soler, J. A. Blazquez and M.
P. Pina, "Novel hybrid membranes based on polybenzimidazole and ETS-10
titanosilicate type material for high temperature proton exchange membrane fuel
cells: A comprehensive study on dense and porous systems," J. Power Sources,
vol. 196, pp. 8994-9007, 2011.
A. Fahmi, J. Ahdjoudj and C. Minot, "A theoretical study of H2S and MeSH
adsorption on TiO2," Surf Sci, vol. 352–354, pp. 529-533, 1996.
A. Gervasini, C. Picciau and A. Auroux, "Characterization of copper-exchanged
ZSM-5 and ETS-10 catalysts with low and high degrees of exchange,"
Microporous and Mesoporous Materials, vol. 35, pp. 457-469, 2000.
178
A. Gorbach, M. Stegmaier and G. Eigenberger, "Measurement and modeling of
water vapor adsorption on zeolite 4A-equilibria and kinetics," Adsorption-Journal
of the International Adsorption Society, vol. 10, pp. 29-46, 2004.
A. K. Meena, K. Kadirvelu, G. K. Mishra, C. Rajagopal and P. N. Nagar,
"Adsorptive removal of heavy metals from aqueous solution by treated sawdust
(Acacia arabica)," J. Hazard. Mater., vol. 150, pp. 604-611, 2008.
A. Kather and S. Kownatzki, "Assessment of the different parameters affecting the
CO2 purity from coal fired oxyfuel process," International Journal of Greenhouse
Gas Control, vol. 5, pp. S204-S209, 2011.
A. L. Myers, "Thermodynamics of adsorption in porous materials," AICHE J., vol.
48, pp. 145-160, 2002.
A. Moezzi, A. M. McDonagh and M. B. Cortie, "Zinc oxide particles: Synthesis,
properties and applications," Chem. Eng. J., vol. 185–186, pp. 1-22, 2012.
A. N. Startsev, I. I. Zakharov, O. V. Voroshina, A. V. Pashigreva and V. N.
Parmon, "Low-temperature decomposition of hydrogen sulfide under the
conditions of conjugate chemisorption and catalysis," Doklady Physical
Chemistry, vol. 399, pp. 283-286, 2004.
A. Nalaparaju, Z. Q. Hu, X. S. Zhao and J. W. Jiang, "Exchange of heavy metal
ions in titanosilicate Na-ETS-10 membrane from molecular dynamics simulations,"
J. Membr. Sci., vol. 335, pp. 89-95, 2009.

179
A. Startsev, O. Kruglyakova, Y. Chesalov, S. Ruzankin, E. Kravtsov, T. Larina and
E. Paukshtis, "Low Temperature Catalytic Decomposition of Hydrogen Sulfide into
Hydrogen and Diatomic Gaseous Sulfur," Topics in Catalysis, vol. 56, pp. 969-
980, 2013.
A. Shahbazi, H. Younesi and A. Badiei, "Functionalized SBA-15 mesoporous silica
by melamine-based dendrimer amines for adsorptive characteristics of Pb(II),
Cu(II) and Cd(II) heavy metal ions in batch and fixed bed column," Chem. Eng.
J., vol. 168, pp. 505-518, 2011.
A. Y. Manakov, Y. A. Dyadin, A. G. Ogienko, A. V. Kurnosov, E. Y. Aladko, E.
G. Larionov, F. V. Zhurko, V. I. Voronin, I. F. Berger, S. V. Goryainov, A. Y.
Lihacheva and A. I. Ancharov, "Phase Diagram and High-Pressure Boundary of
Hydrate Formation in the Carbon Dioxide-Water System," J Phys Chem B, vol.
113, pp. 7257-7262, 2009.
A. Zukal, J. Mayerová and M. Kubu, "Adsorption of Carbon Dioxide on High-
Silica Zeolites with Different Framework Topology," Topics in Catalysis, vol. 53,
pp. 1361-1366, 2010.
"Adsorption, Gas Separation," Kirk-Othmer Encyclopedia of Chemical
Technology, pp. 617, 2007.
"Adsorption," Kirk-Othmer Encyclopedia of Chemical Technology, pp. 582, 2007.

180
A.B.M. Heesink, W. Prins, and W.P.M. van Swaaij, "A grain size distribution
model for non-catalytic gas-solid reactions," The Chemical Engineering Journal
and the Biochemical Engineering Journal, vol. 53, pp. 25-37, 1993.
An Introduction to Surface Chemistry.
Available: http://www.chem.qmul.ac.uk/surfaces/scc/. (Accessed on Jan. 20th,
2015).
B. Arstad, H. Fjellvag, K. O. Kongshaug, O. Swang and R. Blom, "Amine
functionalised metal organic frameworks (MOFs) as adsorbents for carbon
dioxide," Adsorption, pp. 755, 2008.
B. A. Shah, C. B. Mistry and A. V. Shah, "Sequestration of Cu(II) and Ni(II) from
wastewater by synthesized zeolitic materials: Equilibrium, kinetics and column
dynamics," Chem. Eng. J., vol. 220, pp. 172-184, 2013.
B. D. Bhide, A. Voskericyan and S. A. Stern, "Hybrid processes for the removal of
acid gases from natural gas," J. Membr. Sci., vol. 140, pp. 27-49, 1998.
B. Singha and S. K. Das, "Adsorptive removal of Cu(II) from aqueous solution and
industrial effluent using natural/agricultural wastes," Colloids and Surfaces B:
Biointerfaces, pp. 97, 2013.
B. Tanchuk, J. A. Sawada, S. Rezaei and S. M. Kuznicki, "Adsorptive drying of
CO2 using low grade heat and humid, ambient air," Separation and Purification
Technology, vol. 120, pp. 354-361, 2013.

181
B. Yilmaz, J. Warzywoda and A. Sacco, "Spectroscopic characterization of the
quantum wires in titanosilicates ETS-4 and ETS-10," Nanotechnology, vol. 17, pp.
4092-4099, 2006.
C. Babé, M. Tayakout-Fayolle, C. Geantet, M. Vrinat, G. Bergeret, T. Huard and
D. Bazer-Bachi, "Crystallite size effect in the sulfidation of ZnO by H2S:
Geometric and kinetic modelling of the transformation," Chemical Engineering
Science, vol. 82, pp. 73-83, 2012.
C. Cormos, A. Padurean and P. S. Agachi, "GHGT-10: Technical evaluations of
carbon capture options for power generation from coal and biomass based on
integrated gasification combined cycle scheme," Energy Procedia, vol. 4, pp.
1861-1868, 2011.
C. H. Bartholomew, "Mechanisms of catalyst deactivation," Applied Catalysis A:
General, vol. 212, pp. 17-60, 2001.
C. Huang, C. Chen and S. Chu, "Effect of moisture on H2S adsorption by copper
impregnated activated carbon," J. Hazard. Mater., vol. 136, pp. 866-873, 2006.
C. Knöfel, J. Descarpentries, A. Benzaouia, V. Zeleňák, S. Mornet, P. L. Llewellyn
and V. Hornebecq, "Functionalised micro-/mesoporous silica for the adsorption of
carbon dioxide," Microporous and Mesoporous Materials, vol. 99, pp. 79-85,
2007.

182
C. L. Carnes and K. J. Klabunde, "Unique chemical reactivities of nanocrystalline
metal oxides toward hydrogen sulfide," Chemistry of Materials, vol. 14, pp. 1806-
1811, 2002.
C. Lin, M. Danaie, D. Mitlin and S. M. Kuznicki, "Palladium Nanoparticles
Formed on Titanium Silicate ETS-10," Journal of Nanoscience and
Nanotechnology, vol. 11, pp. 2537-2539, 2011.
C. N. Satterfield, Mass Transfer in Heterogeneous Catalysis. Malabar, Fla. : R. E.
Krieger Pub. Co., 1981.
C. O. Areán and M. R. Delgado, "Variable-temperature FT-IR studies on the
thermodynamics of carbon dioxide adsorption on a faujasite-type H-Y zeolite,"
Appl. Surf. Sci., vol. 256, pp. 5259-5262, 2010.
C. T. Rettner, D. J. Auerbach, J. C. Tully and A. W. Kleyn, "Chemical dynamics at
the gas-surface interface," J. Phys. Chem., vol. 100, pp. 13021-13033, 1996.
Canada's Oilsands and Heavy Oil Deposits.
Available: www.energy.gov.ab.ca/oilsands/pdfs/rpt_chops_app1.pdf. (Accessed on
Jan. 20th, 2015).
Chemical Solvent-Based Processes for Acid Gas Removal in Gasification
Application.

183
Available:
http://msdssearch.dow.com/PublishedLiteratureDOWCOM/dh_003a/0901b803800
3a89e.pdf?filepath=gastreating/pdfs/noreg/170-01406.pdf&fromPage=GetDoc.
(Accessed on Jan. 17th, 2015).
Chemisorption.
Available:http://www.micromeritics.com/Repository/Files/Chemisorption_Poster.p
df. (Accessed on Jan. 20th, 2015).
D. A. Berry, D. Shekhawat and J. J. Spivey, Fuel Cells. [Electronic Resource] :
Technologies for Fuel Processing. Amsterdam ; Boston : Elsevier, 2011.
D. A. Bhandari, N. Bessho and W. J. Koros, "Dual layer hollow fiber sorbents for
trace H2S removal from gas streams," Chemical Engineering Science, vol. 94, pp.
256-264, 2013.
D. Crespo, G. Qi, Y. Wang, F. H. Yang and R. T. Yang, "Superior sorbent for
natural gas desulfurization," Ind Eng Chem Res, vol. 47, pp. 1238-1244, 2008.
D. Jiang, L. Su, L. Ma, N. Yao, X. Xu, H. Tang and X. Li, "Cu-Zn-Al mixed metal
oxides derived from hydroxycarbonate precursors for H2S removal at low
temperature," Appl. Surf. Sci., vol. 256, pp. 3216-3223, 2010.
D. Melo, J. de Souza, M. Melo, A. Martinelli, G. Cachima and J. Cunha,
"Evaluation of the zinox and zeolite materials as adsorbents to remove H2S from
natural gas," Colloid Surf. A-Physicochem. Eng. Asp., vol. 272, pp. 32-36, 2006.

184
D. Montes, E. Tocuyo, E. Gonzaĺez, D. Rodriǵuez, R. Solano, R. Atencio, M. A.
Ramos and A. Moronta, "Reactive H2S chemisorption on mesoporous silica
molecular sieve-supported CuO or ZnO," Microporous and Mesoporous Materials,
vol. 168, pp. 111-120, 2013.
D. Nguyen-Thanh and T. Bandosz, "Activated carbons with metal containing
bentonite binders as adsorbents of hydrogen sulfide," Carbon, vol. 43, pp. 359-
367, 2005.
D. R. Alfonso, "First-principles studies of H2S adsorption and dissociation on
metal surfaces," Surf Sci, vol. 602, pp. 2758-2768, 2008.
D. Stirling, The Sulfur Problem [Electronic Resource] : Cleaning Up Industrial
Feedstocks / Diane Stirling. Cambridge, UK : Royal Society of Chemistry, 2000.
D. W. Breck, Zeolite Molecular Sieves: Structure, Chemistry, and Use. New York,
Wiley, 1974.
E. D. Camarinha, P. F. Lito, B. M. Antunes, M. Otero, Z. Lin, J. Rocha, E. Pereira,
A. C. Duarte and C. M. Silva, "Cadmium(II) removal from aqueous solution using
microporous titanosilicate ETS-10," Chem. Eng. J., vol. 155, pp. 108-114, 2009.
F. Chang, K. Chao, H. Cheng and C. Tan, "Adsorption of CO2 onto amine-grafted
mesoporous silicas," Separation and Purification Technology, vol. 70, pp. 87-95,
2009.

185
F. Gholampour and S. Yeganegi, "Molecular simulation study on the adsorption
and separation of acidic gases in a model nanoporous carbon," Chemical
Engineering Science, vol. 117, pp. 426-435, 2014.
F. Li, J. Wei, Y. Yang, G. H. Yang and T. Lei, "Preparation of Sorbent Loaded
with Nano-CuO for Room Temperature to Remove of Hydrogen Sulfide," Applied
Mechanics and Materials, vol. 475, pp. 1329-1333, 2014.
F. Ullmann, Ullmann's Encyclopedia of Industrial Chemistry. [Electronic
Resource]. New York] : Wiley, 7th ed., 2010.
F. Yazdanbakhsh, M. Blasing, J. A. Sawada, S. Rezaei, M. Muller, S. Baumann
and S. M. Kuznicki, "Copper Exchanged Nanotitanate for High Temperature H2S
Adsorption," Industrial and Engineering Chemistry Research, vol. 53, pp. 11734-
11739, 2014.
Fundamentals of Stack Gas Dispersion.
Available: http://www.air-dispersion.com/default.htm. (Accessed on Jan. 10th,
2015).
G. Monteleone, M. De Francesco, S. Galli, M. Marchetti and V. Naticchioni, "Deep
H2S removal from biogas for molten carbonate fuel cell (MCFC) systems," Chem.
Eng. J., vol. 173, pp. 407-414, 2011.
G. Ramis, G. Busca and V. Lorenzelli, "Low-Temperature Co2 Adsorption on
Metal-Oxides - Spectroscopic Characterization of some Weakly Adsorbed
Species," Mater. Chem. Phys., vol. 29, pp. 425-435, 1991.
186
G. S. Grasa and J. C. Abanades, "CO2 capture capacity of CaO in long series of
carbonation/calcination cycles," Ind Eng Chem Res, vol. 45, pp. 8846-8851, 2006.
L. D. Gasper-Galvin, A. T. Atimtay, R. P. Gupta, " Zeolite-Supported Metal Oxide
Sorbents for Hot-Gas Desulfurization," Ind. Eng. Chem. Res., vol. 37, pp. 4157,
1998.
Gas Sweetening, Available:
http://msdssearch.dow.com/PublishedLiteratureDOWCOM/dh_0039/0901b803800
391f8.pdf?filepath=gastreating/pdfs/noreg/170 01395.pdf&fromPage=GetDoc.
(Accessed on Jan. 20th, 2015).
H. A. Jakobsen, "Fixed Bed Reactors," Department of Chemical Engineering
Norwegian University of Science and Technology, 2011.
H. Dumrul, A. N. Kursunlu, O. Kocyigit, E. Guler and S. Ertul, "Adsorptive
removal of Cu(II) and Ni(II) ions from aqueous media by chemical immobilization
of three different aldehydes," Desalination, vol. 271, pp. 92-99, 2011.
H. F. Garces, H. M. Galindo, L. J. Garces, J. Hunt, A. Morey and S. L. Suib, "Low
temperature H2S dry-desulfurization with zinc oxide," Microporous Mesoporous
Mat., vol. 127, pp. 190-197, 2010.
H. Jeong, J. Krohn, K. Sujaoti and M. Tsapatsis, "Oriented molecular sieve
membrane by heteroepitaxial growth," J. Am. Chem. Soc., 2002.

187
H. Lu, P. G. Smirniotis, F. O. Ernst and S. E. Pratsinis, "Nanostructured Ca-based
sorbents with high CO2 uptake efficiency," Chemical Engineering Science, vol.
64, pp. 1936-1943, 2009.
H. S. Fogler, Elements of Chemical Reaction Engineering. Upper Saddle River,
NJ: Prentice Hall PTR, 4th ed., 2006.
H. Yang and B. Tatarchuk, "Novel-doped zinc oxide sorbents for low temperature
regenerable desulfurization applications," AICHE J., 2010.
I. I. Zakharov, A. N. Startsev, O. V. Voroshina, A. V. Pashigreva, N. A. Chashkova
and V. N. Parmon, "The molecular mechanism of low-temperature decomposition
of hydrogen sulfide under conjugated chemisorption-catalysis conditions," Russian
Journal of Physical Chemistry A, vol. 80, pp. 1403-1410, 2006.
I. Langmuir, "The Adsorption of Gases on Plane Surfaces of Glass, Mica and
Platinum," J. Am. Chem. Soc., vol. 40, pp. 1361-1403, 1918.
I. Tiscornia, I. Kumakiri, R. Bredesen, C. Téllez and J. Coronas, "Microporous
titanosilicate ETS-10 membrane for high pressure CO2 separation," Separation
and Purification Technology, vol. 73, pp. 8-12, 2010.
International Energy Outlook 2011.
Available: http://large.stanford.edu/courses/2011/ph240/nagasawa2/docs/0484-
2011.pdf. (Accessed on Jan. 20th, 2015).
Introduction to Chemical Adsorption Analytical Techniques and their Applications
to Catalysis.

188
Available:
http://www.micromeritics.com/repository/files/intro_to_chemical_adsorption.pdf.
(Accessed on Jan. 20th, 2015).
J. A. Rodriguez, S. Chaturvedi, M. Kuhn and J. Hrbek, "Reaction of H2S and S2
with metal/oxide surfaces: band-gap size and chemical reactivity," J Phys Chem B,
pp. 5511, 1998.
J. Abbasian, A. H. Hill, J. R. Wangerow, M. Flytzani-Stephanopoulos, L. Bo and
C. Patel, "Development of novel copper-based sorbents for hot-gas cleanup,"
[Quarterly] technical report, 1992.
J. Baltrusaitis, J. Schuttlefield, E. Zeitler and V. H. Grassian, "Carbon dioxide
adsorption on oxide nanoparticle surfaces," Chem. Eng. J., vol. 170, pp. 471-481,
2011.
J. M. Smith and H. C. Van Ness, Introduction to Chemical Engineering
Thermodynamics. New York, McGraw-Hill, 1959; 2d ed., 1959.
J. R. Schrieffer and R. Gomer, "Induced covalent bond mechanism of
chemisorption," Surf Sci, vol. 25, pp. 315-320, 1971.
J. Sun, S. Modi, K. Liu, R. Lesieur and J. Buglass, "Kinetics of zinc oxide
sulfidation for packed-bed desulfurizer modeling," Energy Fuels, vol. 21, pp.
1863-1871, 2007.

189
K. B. Lee, A. Verdooren, H. S. Caram and S. Sircar, "Chemisorption of carbon
dioxide on potassium-carbonate-promoted hydrotalcite," Journal of Colloid &
Interface Science, vol. 308, pp. 30-39, 2007.
K. G. Bhattacharyya and S. S. Gupta, "Adsorptive Accumulation of Cd(II), Co(II),
Cu(II), Pb(II) and Ni(II) Ions from Water onto Kaolinite: Influence of Acid
Activation," Adsorption Science & Technology, vol. 27, pp. 47-68, 2009.
K. J. Leary, J. N. Michaels and A. M. Stacy, "Temperature-programmed
desorption: Multisite and subsurface diffusion models," AICHE J., vol. 34, pp. 263,
1988.
K. Y. Foo and B. H. Hameed, "Insights into the modeling of adsorption isotherm
systems," Chem. Eng. J., pp. 2, 2010.
L. Lv, G. Tsoi and X. S. Zhao, "Uptake equilibria and mechanisms of heavy metal
ions on microporous titanosilicate ETS-10," Ind Eng Chem Res, vol. 43, pp. 7900-
7906, 2004.
L. Marini, Geological Sequestration of Carbon Dioxide. [Electronic Resource] :
Thermodynamics, Kinetics, and Reaction Path Modeling. Amsterdam; Oxford:
Elsevier, 2007.
L. Zhou, M. Yu, L. Zhong and Y. Zhou, "Feasibility study on pressure swing
sorption for removing H2S from natural gas," Chemical Engineering Science, vol.
59, pp. 2401-2406, 2004.

190
M. Anderson W., J. Agger R., D. Luigi, A. Baggaley K. and J. Rocha, "Cation sites
in ETS-10: 23Na 3Q MAS NMR and lattice energy minimisation calculations,"
Physical Chemistry Chemical Physics (PCCP), vol. 1, pp. 2287, 1999.
M. E. Davis and R. J. Davis, Fundamentals of Chemical Reaction Engineering.
[Electronic Resource]. Boston: McGraw-Hill, International ed., 2003.
M. Hussain, N. Abbas, D. Fino and N. Russo, "Novel mesoporous silica supported
ZnO adsorbents for the desulphurization of biogas at low temperatures," Chem.
Eng. J., vol. 188, pp. 222-232, 2012.
M. Naderi and M. W. Anderson, "Phase transformation of microporous
titanosilicate ETS-4 into narsarsukite," Zeolites, vol. 17, pp. 437-443, 1996.
M. Shi, C. C. H. Lin, T. M. Kuznicki, Z. Hashisho and S. M. Kuznicki, "Separation
of a binary mixture of ethylene and ethane by adsorption on Na-ETS-10,"
Chemical Engineering Science, vol. 65, pp. 3494-3498, 2010.
M. Shi, C. Lin, L. Wu, C. Holt, D. Mitlin and S. M. Kuznicki, "Nanosilver Particle
Formation on a High Surface Area Titanate," Journal of Nanoscience and
Nanotechnology, vol. 10, pp. 8448-8451, 2010.
M. W. Anderson, O. Terasaki, T. Ohsuna, P. Malley, A. Philippou, S. P. Mackay,
A. Ferreira, J. Rocha and S. Lidin, "Microporous Titanosilicate Ets-10 - a
Structural Survey," Philosophical Magazine B-Physic of Condensed Matter

191
Statistical Mechanics Electronic Optical and Magnetic Properties, vol. 71, pp. 813-
841, 1995.
M. W. Anderson, O. Terasaki, T. Ohsuna, A. Philippou, S. P. MacKay, A. Ferreira,
J. Rocha and S. Lidin, "Structure of the microporous titanosilicate ETS-10,"
Nature, pp. 347, 1994.
M. Xue, R. Chitrakar, K. Sakane and K. Ooi, "Screening of adsorbents for removal
of H2S at room temperature," Green Chem., vol. 5, pp. 529-534, 2003.
Modern Methods in Heterogeneous Catalysis Research .
Available:http://www.fhi-
berlin.mpg.de/acnew/department/pages/teaching/pages/teaching__wintersemester_
_2010_2011/klaus_christmann__adsorption__101105.pdf. (Accessed on Jan. 8th,
2015).
N. C. Jeong, Y. J. Lee, J. H. Park, H. Lim, C. H. Shin, H. Cheong and K. B. Yoon,
"New Insights into ETS-10 and Titanate Quantum Wire: A Comprehensive
Characterization," J. Am. Chem. Soc., vol. 131, pp. 13080-13092, 2009.
N. S. Randhawa, N. N. Das and R. K. Jana, "Adsorptive remediation of Cu(II) and
Cd(II) contaminated wate using manganese nodule leaching residue," Desalination
& Water Treatment, vol. 52, pp. 4197-4211, 2014.
N. Wakao and T. Funazkri, "Effect of fluid dispersion coefficients on particle-to-
fluid mass transfer coefficients in packed beds: Correlation of sherwood numbers,"
Chemical Engineering Science, vol. 33, pp. 1375-1384, 1978.

192
N. Yaşyerli, T. Doǧu, G. Doǧu and i. Ar, "Deactivation model for textural effects
of kinetics of gas-solid noncatalytic reactions “char gasification with CO2”,"
Chemical Engineering Science, vol. 51, pp. 2523-2528, 1996.
NaturalGas. Available: http://naturalgas.org. (Accessed on Jan. 16th, 2015).
O. Aschenbrenner and P. Styring, "Comparative study of solvent properties for
carbon dioxide absorption," Energy & Environmental Science, vol. 3, pp. 1106-
1113, 2010.
O. G. Nik, B. Nohair and S. Kaliaguine, "Aminosilanes grafting on FAU/EMT
zeolite: Effect on CO2 adsorptive properties," Microporous and Mesoporous
Materials, vol. 143, pp. 221-229, 2011.
O. Levenspiel, Chemical Reaction Engineering; an Introduction to the Design of
Chemical Reactors. New York, Wiley, 1962.
P. Dhage, A. Samokhvalov, D. Repala, E. C. Duin, M. Bowman and B. J.
Tatarchuk, "Copper-Promoted ZnO/SiO2 Regenerable Sorbents for the Room
Temperature Removal of H2S from Reformate Gas Streams," Ind Eng Chem Res,
vol. 49, pp. 8388-8396, 2010.
P. H. Chang, Y. P. Chang, S. Y. Chen, C. T. Yu and Y. P. Chyou, "Ca-Rich Ca-Al-
Oxide, High-Temperature-Stable Sorbents Prepared from Hydrotalcite Precursors:
Synthesis, Characterization, and CO2 Capture Capacity," Chemsuschem, vol. 4, pp.
1844-1851, 2011.
193
P. Kumar, C. Sung, O. Muraza, M. Cococcioni, S. Al Hashimi, A. McCormick and
M. Tsapatsis, "H2S adsorption by Ag and Cu ion exchanged faujasites,"
Microporous Mesoporous Mat., vol. 146, pp. 127-133, 2011.
Q. L. Tang, S. R. Zhang and Y. P. Liang, "Influence of Step Defects on the H2S
Splitting on Copper Surfaces from First-Principles Microkinetic Modeling,"
Journal of Physical Chemistry C, vol. 116, pp. 20321-20331, 2012.
Q. Xue and Y. Liu, "Removal of minor concentration of H2S on MDEA-modified
SBA-15 for gas purification," J. Ind. Eng. Chem., vol. 18, pp. 169-173, 2012.
R. A. Zárate, S. Fuentes, J. P. Wiff, V. M. Fuenzalida and A. L. Cabrera,
"Chemical composition and phase identification of sodium titanate nanostructures
grown from titania by hydrothermal processing," Journal of Physics and Chemistry
of Solids, vol. 68, pp. 628-637, 2007.
R. Chatti, A. K. Bansiwal, J. A. Thote, V. Kumar, P. Jadhav, S. K. Lokhande, R. B.
Biniwale, N. K. Labhsetwar and S. S. Rayalu, "Amine loaded zeolites for carbon
dioxide capture: Amine loading and adsorption studies," Microporous and
Mesoporous Materials, vol. 121, pp. 84-89, 2009.
R. E. Ayala and D. W. Marsh, "Characterization and Long-Range Reactivity of
Zinc Ferrite in High-Temperature Desulfurization Processes," Ind Eng Chem Res,
vol. 30, pp. 55-60, 1991.

194
R. Haghpanah, A. Majumder, R. Nilam, A. Rajendran, S. Farooq, I. A. Karimi and
M. Amanullah, "Multiobjective Optimization of a Four-Step Adsorption Process
for Postcombustion CO2 Capture Via Finite Volume Simulation," Ind Eng Chem
Res, vol. 52, pp. 4249-4265, 2013.
R. Haghpanah, A. Rajendran, S. Farooq, I. A. Karimi and M. Amanullah, "Discrete
Equilibrium Data from Dynamic Column Breakthrough Experiments," Ind Eng
Chem Res, vol. 51, pp. 14834-14844, 2012.
R. I. Masel, Principles of Adsorption and Reaction on Solid Surfaces. New York :
Wiley, 1996.
R. Sitko, E. Turek, B. Zawisza, E. Malicka, E. Talik, J. Heimann, A. Gagor, B.
Feist and R. Wrzalik, "Adsorption of divalent metal ions from aqueous solutions
using graphene oxide," Dalton Transactions, vol. 42, pp. 5682-5689, 2013.
R. T. Yang, Adsorbents : Fundamentals and Applications. Hoboken, N.J. : Wiley-
Interscience, 2003.
R. T. Yang, Gas Separation by Adsorption Processes. Boston: Butterworths, 1987.
S. Brunauer, P. H. Emmett and E. Teller, "Adsorption of Gases in Multimolecular
Layers," J. Am. Chem. Soc., vol. 60, pp. 309-319, 1938.
S. Guntuka, S. Farooq and A. Rajendran, "A- and B-Site substituted lanthanum
cobaltite perovskite as high temperature oxygen sorbent. 2. Column dynamics
study," Ind Eng Chem Res, vol. 47, pp. 163-170, 2008.

195
S. H. Chen, S. Q. Sun, B. J. Lian, Y. F. Ma, Y. G. Yan and S. Q. Hu, "The
adsorption and dissociation of H2S on Cu(100) surface: A DTF study," Surf Sci,
vol. 620, pp. 51-58, 2014.
S. K. Gangwal, "Chapter 11: Desulfurization for Fuel Cells," Fuel Cells:
Technologies for Fuel Processing, pp. 317-360, 2011.
S. Kocaoba, "Comparison of Amberlite IR 120 and dolomite's performances for
removal of heavy metals," J. Hazard. Mater., vol. 147, pp. 488-496, 2007.
S. Liu, C. Lee, H. Chen, C. Wang and L. Juang, "Application of titanate nanotubes
for Cu(II) ions adsorptive removal from aqueous solution," Chem. Eng. J., vol.
147, pp. 188-193, 2009.
S. M. Kuznicki, K. A. Thrush and H. M. Garfinkel, "Use of crystalline molecular
sieves containing charged octahedral sites in cyclic desiccating processes,"
WO1993000152 A1, 1993.
S. M. Kuznicki, "Large-pored crystalline titanium molecular sieve zeolites",
19910430, 1991.
S. N. Nobar and S. Farooq, "Experimental and modeling study of adsorption and
diffusion of gases in Cu-BTC," Chemical Engineering Science, pp. 801, 2012.
S. P. Hernández, M. Chiappero, N. Russo and D. Fino, "A novel ZnO-based
adsorbent for biogas purification in H2 production systems," Chem. Eng. J., vol.
176–177, pp. 272-279, 2011.

196
S. P. Wang, S. L. Yan, X. B. Ma and J. L. Gong, "Recent advances in capture of
carbon dioxide using alkali-metal-based oxides," Energy & Environmental Science,
vol. 4, pp. 3805-3819, 2011.
S. R. Popuri, Y. Vijaya, V. M. Boddu and K. Abburi, "Adsorptive removal of
copper and nickel ions from water using chitosan coated PVC beads," Bioresour.
Technol., vol. 100, pp. 194-199, 2009.
S. R. Shukla and R. S. Pai, "Adsorption of Cu(II), Ni(II) and Zn(II) on dye loaded
groundnut shells and sawdust," Separation & Purification Technology, vol. 43, pp.
1-8, 2005.
S. R. Shukla and R. S. Pai, "Adsorption of Cu(II), Ni(II) and Zn(II) on modified
jute fibres," Bioresour. Technol., vol. 96, pp. 1430-1438, 2005.
S. Rezaei, A. Tavana, J. A. Sawada, L. Wu, A. S. M. Junaid and S. M. Kuznicki,
"Novel Copper-Exchanged Titanosilicate Adsorbent for Low Temperature H2S
Removal," Ind Eng Chem Res, vol. 51, pp. 12430-12434, 2012.
S. Rezaei, M. O. D. Jarligo, L. Wu and S. M. Kuznicki, "Breakthrough
performances of metal-exchanged nanotitanate ETS-2 adsorbents for room
temperature desulfurization," Chemical Engineering Science, vol. 123, pp. 444-
449, 2015.
197
S. Rengaraj, Y. Kim, C. K. Joo, K. H. Choi and J. H. Yi, "Batch adsorptive
removal of copper ions in aqueous solutions by ion exchange resins: 1200H and
IRN97H," Korean Journal of Chemical Engineering, vol. 21, pp. 187-194, 2004.
S. Velu, X. Ma and C. Song, "Zeolite-based adsorbents for desulfurization of jet
fuel by selective adsorption," in ACS Division of Fuel Chemistry, Preprints, pp.
447-448, 2002.
S. Yasyerli, G. Dogu, I. Ar and T. Dogu, "Activities of copper oxide and Cu-V and
Cu-Mo mixed oxides for H2S removal in the presence and absence of hydrogen
and predictions of a deactivation model," Ind Eng Chem Res, vol. 40, pp. 5206-
5214, 2001.
S. Yasyerli, G. Dogu, I. Ar and T. Dogu, "Breakthrough Analysis of H2S Removal
on Cu-V-Mo, Cu-V, and Cu-Mo Mixed Oxides," Chem. Eng. Commun., vol. 190,
pp. 1055, 2003.
S. Yasyerli, G. Dogu, I. Ar and T. Dogu, "Dynamic analysis of removal and
selective oxidation of H2S to elemental sulfur over Cu-V and Cu-V-Mo mixed
oxides in a fixed bed reactor," Chemical Engineering Science, vol. 59, pp. 4001-
4009, 2004.
S. Yasyerli, I. Ar, G. Dogu and T. Dogu, "Removal of hydrogen sulfide by
clinoptilolite in a fixed bed adsorber," Chem. Eng. Process, vol. 41, pp. 785-792,
2002.

198
S. Zarghami, T. Mohammadi and M. Kazemimoghadam, "Adsorption Behavior of
Cu(II) Ions on Crosslinked Chitosan/Polyvinyl Alcohol Ion Imprinted Membrane,"
Journal of Dispersion Science & Technology, vol. 36, pp. 190-195, 2015.
Short-Term Energy Outlook, Available:
http://www.eia.gov/forecasts/steo/report/global_oil.cfm. (Accessed on Jan. 20th,
2015).
T. Baird, K. Campbell, P. Holliman, R. Hoyle, M. Huxam, D. Stirling, B. Williams
and M. Morris, "Cobalt-zinc oxide absorbents for low temperature gas
desulfurisation," J. Mater. Chem., vol. 9, pp. 599-605, 1999.
T. Baird, P. J. Denny, R. Hoyle, F. Mcmonagle, D. Stirling and J. Tweedy,
"Modified Zinc-Oxide Absorbents for Low-Temperature Gas Desulfurization,”
Journal of the Chemical Society-Faraday Transactions, vol. 88, pp. 3375-3382,
1992.
T. Doǧu, "The Importance of Pore Structure and Diffusion in the Kinetics of Gas-
Solid Non-catalytic Reactions: Reaction of Calcined Limestone with SO2," The
Chemical Engineering Journal, vol. 21, pp. 213-222, 1981.
T. E. Whyte, C. M. Yon and E. H. Wagener, Industrial Gas Separations.
Washington, D.C. : American Chemical Society, 1983.
T. Ko, H. Chu and L. Chaung, "The sorption of hydrogen sulfide from hot syngas
by metal oxides over supports," Chemosphere, vol. 58, pp. 467-474, 2005.

199
T. Ko and H. Hsueh, "Removal of Hydrogen Sulfide by Iron-Rich Soil: Application
of the Deactivation Kinetic Model for Fitting Breakthrough Curve," Aerosol Air
Qual. Res., vol. 12, pp. 1355-1361, 2012.
T. Kopac and S. Kocabas, "Deactivation models for sulfur dioxide adsorption on
silica gel," Adv. Environ. Res., vol. 8, pp. 417-424, 2004.
T. Kyotani, H. Kawashima, A. Tomita, A. Palmer and E. Furimsky, "Removal of
H2S from hot gas in the presence of Cu-containing sorbents," Fuel, vol. 68, pp. 74-
79, 1989.
T. S. Anirudhan and P. G. Radhakrishnan, "Adsorptive Removal and Recovery of
U(VI), Cu(II), Zn(II), and Co(II) from Water and Industry Effluents,"
Bioremediation J., vol. 15, pp. 39-56, 2011.
T. Sancho, J. Soler and M. P. Pina, "Conductivity in zeolite-polymer composite
membranes for PEMFCs," J. Power Sources, pp. 92, 2007.
The Adsorption of Gases and Vapors, Volume I. Available:
https://archive.org/details/adsorptionofgase031704mbp. (Accessed on Jan. 10th,
2015).
The Surface Analysis Forum. Available: http://www.uksaf.org/home.html.
(Accessed on Jan. 16th, 2015).
200
A.M. de Jong and J.W. Niemantsverdriet, "Thermal desorption analysis:
Comparative test of ten commonly applied procedures," Surface Science vol. 233
pp. 355-365, 1990.
V. Hernandez-Valencia, M. W. Hlavinka, J. A. Bullin and I. N. C. Bryan, "Design
glycol units for maximum efficiency," Research & Eng., pp. 310-317, 1992.
W. Jiang, X. Chen, B. Pan, Q. Zhang, L. Teng, Y. Chen and L. Liu, "Spherical
polystyrene-supported chitosan thin film of fast kinetics and high capacity for
copper removal," J. Hazard. Mater., vol. 276, pp. 295-301, 2014.
P.R. Westmoreland, D.P. Harrison, " Evaluation of candidate solids for high-
temperature desulfurization of low-Btu gases" Environmental Science and
Technology, vol. 10, pp. 659, 1976.
X. Meng, D. Wang, J. Liu and S. Zhang, "Preparation and characterization of
sodium titanate nanowires from brookite nanocrystallites," Mater. Res. Bull., vol.
39, pp. 2163-2170, 2004.
X. Sun, X. Huang, X. Liao and B. Shi, "Adsorptive removal of Cu(II) from
aqueous solutions using collagen-tannin resin," J. Hazard. Mater., vol. 186, pp.
1058-1063, 2011.
X. Wang, T. Sun, J. Yang, L. Zhao and J. Jia, "Low-temperature H2S removal from
gas streams with SBA-15 supported ZnO nanoparticles," Chem. Eng. J., vol. 142,
pp. 48-55, 2008.

201
X. Xue and F. Li, "Removal of Cu(II) from aqueous solution by adsorption onto
functionalized SBA-16 mesoporous silica," Microporous and Mesoporous
Materials, vol. 116, pp. 116-122, 2008.
Y. Elsayed, M. Seredych, A. Dallas and T. J. Bandosz, "Desulfurization of air at
high and low H2S concentrations," Chem. Eng. J., vol. 155, pp. 594-602, 2009.
Y. Hu, H. Li and J. Yan, "Integration of Evaporative Gas Turbine with Oxy-Fuel
Combustion for Carbon Dioxide Capture," International Journal of Green Energy,
vol. 7, pp. 615-631, 2010.
Y. M. Choi, C. Compson, M. C. Lin and M. Liu, "A mechanistic study of H2S
decomposition on Ni- and Cu-based anode surfaces in a solid oxide fuel cell,"
Chemical Physics Letters, vol. 421, pp. 179-183, 2006.
Y. Suyadal, M. Erol and H. Oguz, "Deactivation model for the adsorption of
trichloroethylene vapor on an activated carbon bed," Ind Eng Chem Res, vol. 39,
pp. 724-730, 2000.
Y. Wang and M. D. Levan, "Adsorption Equilibrium of Carbon Dioxide and Water
Vapor on Zeolites 5A and 13X and Silica Gel: Pure Components," J. Chem. Eng.
Data, vol. 54, pp. 2839-2844, 2009.
Y. Xiao, S. Wang, D. Wu and Q. Yuan, "Experimental and simulation study of
hydrogen sulfide adsorption on impregnated activated carbon under anaerobic
conditions," J. Hazard. Mater., vol. 153, pp. 1193-1200, 2008.

202
Z. Lin, J. Rocha, A. Navajas, C. Téllez, J. Coronas and J. Santamari´a, "Synthesis
and characterisation of titanosilicate ETS-10 membranes," Microporous and
Mesoporous Materials, vol. 67, pp. 79-86, 2004.
Z. Liu, C. A. Grande, P. Li, J. Yu and A. E. Rodrigues, "Adsorption and
Desorption of Carbon Dioxide and Nitrogen on Zeolite 5A," Separation Science &
Technology, vol. 46, pp. 434-451, 2011.
Z. Renju, "Desorption of gases from graphitic and porous carbon surfaces," 2004.
Z. Zhao, X. Cui, J. Ma and R. Li, "Adsorption of carbon dioxide on alkali-modified
zeolite 13X adsorbents," International Journal of Greenhouse Gas Control, vol. 1,
pp. 355-359, 2007.

203
Appendix A
A.1. Axial temperature profile within the tube
furnace (section 5.2.2)
The axial temperature profile within the tube furnace was evaluated for a set point
temperature of 500C. The blank column was located within the furnace zone at
500°C to find the best area align the tube for the set point temperature without
significant variation.
Figure A- 1 The axial temperature profile within the tube furnace at 500°C.
0
2
4
6
8
10
12
14
0 100 200 300 400 500
Tube
furn
ace
lenght
from
the
bott
om
(cm
)
Temperature reader (C)
area good to useFurnace sensor at
this point

204
The green zone depicted in Figure A-1 was selected for the adsorbent bed to be
installed.
A.2. Justification for assumption 6 in section 5.3.1
When there is a concentration gradient in the gas phase, for a ∆𝑉 volume of the
bed, diffusive transport across a boundary layer in the vicinity of solid phase is equal
to the rate of surface reaction. Thus the molar flux from the bulk gas at H2S
concentration of 𝑐𝑖 to the surface of a spherical particle of diameter 𝑑𝑝at
concentration 𝑐𝑖𝑠is given by:
𝐾𝑐𝑖𝑠∆𝑉 =
𝐷𝑖𝛿𝐴𝑝(𝑐𝑖 − 𝑐𝑖
𝑠) (𝐴 − 1)
Where 𝐷𝑖 is H2S diffusivity in the boundary layer and can be calculated using
Chapman-Enskog equation [1] with Lennard-Jones potential parameters from [2].
The calculated diffusivity of H2S in He (𝐷𝑖) at 25°C is 0.626 cm2/s.
𝛿 and 𝐴𝑝 in equation (𝐴 − 1) are boundary layer thickness and particles surface
area respectively.
With a rearrangement in equation (𝐴 − 1):
𝑐𝑖 − 𝑐𝑖𝑠
𝑐𝑖𝑠 =
𝐾
𝐷𝑖 𝛿⁄
∆𝑉
𝐴𝑝 (𝐴 − 2)
where for a spherical particle of diameter 𝑑𝑝

205
𝐴𝑝
∆𝑉=𝑉𝑝
∆𝑉
𝐴𝑝
𝑉𝑝= (1 − 휀)
6
𝑑𝑝 (𝐴 − 3)
Using equation (𝐴 − 1) and (𝐴 − 3), we will have
𝑐𝑖 − 𝑐𝑖𝑠
𝑐𝑖𝑠 =
𝛿𝐷𝑖1
𝐾𝑑𝑝 6(1 − 휀)⁄
(𝐴 − 4)
The last equation represents the ratio of diffusivity resistance to the kinetic
resistance. It can give an idea whether the system is diffusion controlled or kinetic
controlled.
There are different relations in the literature to calculate the boundary layer
thickness for different conditions, an empirical relation for Re < 10 is proposed by
Ranz and Marshall as follows [3]:
𝑘𝑓 =𝐷𝑖𝛿= 4.0 + 1.21
(𝑑𝑝𝑈)2 3⁄
𝐷𝑖
1 2⁄𝐷𝑖𝑑𝑝 (𝐴 − 5)
Using equation (𝐴 − 5), 𝛿 = 6.94𝑒−3 𝑐𝑚 at 25°C. Thus with the results of section
5.4.1 one can have an estimation of the diffusivity resistance compared to the
kinetic resistance. The calculated ratio from equation (𝐴 − 4) at room temperature
is 0.1, which confirms that the system is controlled by the kinetic rate rather than
diffusion rate.
206
A.3. Cyclic air-drying experiments
ETS-10 has previously been patented as a desiccant material for air. However its
dynamic adsorption behaviour (breakthrough study) has not been done for air
stream. During this study air-drying performance of Ca exchanged forms of ETS-
10 and compares them to a commercial Activated alumina adsorbents (from Parker
Hannifin Corporation). A wet air stream was dried using a single packed-bed
column. The moisture breakthrough time was recorded at trace moisture
breakthrough for both desiccants.
The breakthrough experiments used the CO2 drying testing stand changed and
using an air flow rate of 500 sccm as a feed stream. The adsorption temperature
was kept constant at 38°C to maintain a controllable, near-ambient condition. The
bed regeneration conditions were set at a bed temperature of 85°C (asked by Parker
Hannifin Corporation for real industrial practice), with ambient room air used at a
flow rate of 500 sccm. The regeneration time was set to one hour. The regeneration
temperature was selected to compare the performance of the adsorbents using low-
grade heat for regeneration, such as the waste heat available from the low-pressure
steam of a power plant. The performance of each adsorbent was assessed using a
air inlet feed having a moisture content of 100 % RH. Data points were collected
once every 5 sec throughout the experiments. Four adsorption desorption cycles
have been conducted under mentioned condition. Replicate runs were performed
for each set of experimental conditions.

207
A breakthrough profile for Ca-ETS-10 and Activated alumina are shown in
Figure A-2 as an example of the typical breakthrough profile, which was seen in all
experiments for all adsorbents. For both desiccants breakthrough capacity drops
after first cycle, however it remains unchanged for the rest three cycles.
Figure A- 2 Breakthrough profile for Ca-ETS-10 and Activated alumina – four adsorption
desorption cycles
The breakthrough times for 200 ppm moisture in the outlet stream of first and forth
cycles are given in Table A-1. Higher moisture breakthrough capacity and less
capacity loss after four adsorption desorption cycles for Ca-ETS-10 compare to
Activated alumina, make Ca-ETS-10 a promising adsorbent for low energy input
air drying.

208
Table A- 1 Breakthrough times for 200 ppm moisture in the outlet.
Desiccant
Breakthrough time (min)
1st cycle 4th cycle
Activated alumina 12 17.5
Ca-ETS-10 21 25
A.4. References
[1] R. B. Bird, W. E. Stewart and E. N. Lightfoot, Transport Phenomena. New
York: J. Wiley international ed, 2002.
[2] J. S. Gulliver, Introduction to Chemical Transport in the Environment.
Cambridge Univ Pr; Cambridge Univ Pr, 100 Brook Hill Dr, West Nyack, NY,
10994-2133, 2012.
[3] C. M. Hooijmans, S. Geraats, J. Potters and K. Luyben, "Experimental-
Determination of the Mass-Transfer Boundary-Layer Around a Spherical
Biocatalyst Particle," Chemical Engineering Journal and The Biochemical
Engineering Journal, vol. 44, pp. B41-B46, 1990.