nova bioprofile flex® nova biopro˜le flex® … · in the development of mammalian cell procesess...
TRANSCRIPT

1
Nova BioPro�le FLEX®Automated Analyzer
Publications and Presentations
No. 325 Rev. 8/09/2012
Cell Culture Monitoring Via an Auto-Sampler and an IntegratedMulti-Functional Off-Line AnalyzerGenentech Inc. Oceanside, CA, USA
Genentech Inc. South San Francisco, CA, USA
Facilitating Multisite Bioprocess Transfer: Multi-Instrument and Multi-Platform Comparability and Long Term Stability of Nova Biomedical’s
BioProfile® Chemistry and Gas AnalyzersNova biomedical, Waltham, MA, USA
PAT Tools for Accelerated Process Development and Improvement: Application to Cells on Microcarriers with Continuous Control of Metabolites Concentrations Using Nova Biomedical Flex Sampling and Analysis System
USP, Sanofi Pasteur, Lyon, France
Performance Evaluation of an Automated Bioreactor Sampling System for Mammalian Cell Cultivation\
BioTherapeutics Pharm Sci, Pfizer Inc, St. Louis, MO, USA
Consolidated Single Analyzer Measurement of Key Cell Culture Constituentsin the Development of Mammalian Cell Procesess
Massachusetts Institute of Technology, Cambridge, MA, USA
Nova BioProfile FLEX®Automated Analyzer
ANALYTICAL STUDIES
2
Table of Contents
Cell Culture Monitoring Via an Auto-Sampler and an IntegratedMulti-Functional Off-Line Analyzer........................................................................... 3Gayle E. Derfus and Daniel Abramzon, Meg Tung, David Chang, Robert Kiss, Ashraf AmanullahGenentech Inc.
Facilitating Multisite Bioprocess Transfer: Multi-Instrument and Multi-Platform Comparability and Long Term Stability of Nova Biomedical’s BioProfile® Chemistry and Gas Analyzers.............................................................. 15Matthew McRae, John McHale, Scott Granger, Brian Goulart, Elizabeth Kilcoyne, Roystein Bulman, Nova Biomedical, Waltham, MA, USA
PAT Tools for Accelerated Process Development and Improvement: Application to Cells on Microcarriers with Continuous Control of Metabolites Concentrations Using Nova Biomedical Flex Sampling and Analysis System................................................................................................ 27Eric Calvosa, Jean-Marc Guillaume, Bioprocessing R&D, USP, Sanofi Pasteur, Lyon. Cosette Deyirmendjian, Roystein Bulman, Andrei Malic, Nova Biomedical Europe
Performance Evaluation of an Automated Bioreactor Sampling System for Mammalian Cell Cultivation..................................................................................... 31Kavi Mehta, Erwin Y. Yu, Susan CasnochaBioTherapeutics Pharm Sci, Pfizer Inc, St. Louis, MO 63017
Consolidated Single Analyzer Measurement of Key Cell Culture Constituentsin the Development of Mammalian Cell Proceses................................................. 37Carissa M. Moore and Jean-François P. Hamel Department of Chemical EngineeringMassachusetts Institute of Technology, Cambridge, MA 02139

3
Table of Contents
Cell Culture Monitoring Via an Auto-Sampler and an IntegratedMulti-Functional Off-Line Analyzer........................................................................... 3Gayle E. Derfus and Daniel Abramzon, Meg Tung, David Chang, Robert Kiss, Ashraf AmanullahGenentech Inc.
Facilitating Multisite Bioprocess Transfer: Multi-Instrument and Multi-Platform Comparability and Long Term Stability of Nova Biomedical’s BioProfile® Chemistry and Gas Analyzers.............................................................. 15Matthew McRae, John McHale, Scott Granger, Brian Goulart, Elizabeth Kilcoyne, Roystein Bulman, Nova Biomedical, Waltham, MA, USA
PAT Tools for Accelerated Process Development and Improvement: Application to Cells on Microcarriers with Continuous Control of Metabolites Concentrations Using Nova Biomedical Flex Sampling and Analysis System................................................................................................ 27Eric Calvosa, Jean-Marc Guillaume, Bioprocessing R&D, USP, Sanofi Pasteur, Lyon. Cosette Deyirmendjian, Roystein Bulman, Andrei Malic, Nova Biomedical Europe
Performance Evaluation of an Automated Bioreactor Sampling System for Mammalian Cell Cultivation..................................................................................... 31Kavi Mehta, Erwin Y. Yu, Susan CasnochaBioTherapeutics Pharm Sci, Pfizer Inc, St. Louis, MO 63017
Consolidated Single Analyzer Measurement of Key Cell Culture Constituentsin the Development of Mammalian Cell Proceses................................................. 37Carissa M. Moore and Jean-François P. Hamel Department of Chemical EngineeringMassachusetts Institute of Technology, Cambridge, MA 02139
Study PresentationBioTechnology Progress, 2010, Vol. 26, No. 1, P. 284-292
Cell Culture Monitoring Via an Auto-Sampler and an IntegratedMulti-Functional Off-Line Analyzer
Gayle E. Derfus and Daniel Abramzon, Meg Tung, David Chang, Robert Kiss, Ashraf Amanullah
Genentech Inc.
This report describes the successful use of a novel integrated multi-functional analyzer and automated sampling system for mammalian cell culture bioprocess monitoring. The results suggest that the system has the potential to dramatically reduce the manual labor and associated errors involved in monitoring mammalian cell bioprocesses, without altering the quality of the data collected. The extensive testing across multiple instruments, multiple laboratory sites, and multiple operators gives a sound indication of the performance to be expected in a typical bioprocess development setting where many bioreactors are maintained. The automation of cell culture bioprocess monitoring will allow for more robust, operator- independent processes, with the potential for feedback control, resulting in increased efficiency, process understanding and process reproducibility while at the same time reducing the resources required to operate the cultures.

4
5
Cell Culture Monitoring Via an Auto-Sampler and an IntegratedMulti-Functional Off-Line Analyzer
Gayle E. Derfus and Daniel AbramzonGenentech Inc., Oceanside Process Research & Development, 1 Antibody Way, Oceanside, CA 92056
Meg TungGenentech Inc., Process Research & Development, Late Stage Cell Culture, 1 DNA Way, South San Francisco, CA 94080
David ChangGenentech Inc., Oceanside Process Research & Development, 1 Antibody Way, Oceanside, CA 92056
Robert KissGenentech Inc., Process Research & Development, Late Stage Cell Culture, 1 DNA Way, South San Francisco, CA 94080
Ashraf AmanullahGenentech Inc., Oceanside Process Research & Development, 1 Antibody Way, Oceanside, CA 92056
DOI 10.1002/btpr.303Published online November 13, 2009 in Wiley InterScience (www.interscience.wiley.com).
Mammalian cell-based bioprocesses are used extensively for production of therapeuticproteins. Off-line monitoring of such cultivations via manual sampling is often labor-inten-sive and can introduce operator-dependent error into the process. An integrated multi-func-tional off-line analyzer, the BioProfile FLEX (NOVA Biomedical, Waltham MA) has beendeveloped, which combines the functionality of three off-line analyzers (a cell counter, anosmometer, and a gas/electrolyte & nutrient/metabolite bio-profile analyzer) into one device.In addition, a novel automated sampling system has also been developed that allows the Bio-Profile FLEX to automatically analyze the culture conditions in as many as ten bioreactors.This is the first report on the development and function of this integrated analyzer and anauto-sampler prototype for monitoring of mammalian cell cultures. Evaluation of the Bio-Profile FLEX was conducted in two separate laboratories and involved two BioProfile FLEXanalyzers and two sets of reference analyzers (Nova BioProfile 400, Beckman-Coulter Vi-Cell AS, and Advanced Instruments Osmometer 3900), 13 CHO cell lines and over 20 opera-tors. In general, BioProfile FLEX measurements were equivalent to those obtained using ref-erence analyzers, and the auto-sampler did not alter the samples it provided to theBioProfile FLEX. These results suggest that the system has the potential to dramaticallyreduce the manual labor involved in monitoring mammalian cell bioprocesses without alter-ing the quality of the data obtained, and integration with a bioreactor control systemwill allow feedback control of parameters previously available only for off-line monitoring.VVC 2009 American Institute of Chemical Engineers Biotechnol. Prog., 26: 284–292, 2010Keywords: mammalian cell culture, process monitoring, BioProfile flex, auto-sampler,chinese hamster ovary
Introduction
Bioprocesses based on mammalian cell culture are usedextensively for industrial production of therapeutic proteins.Cell culture monitoring is essential for the development,optimization, and control of highly productive and robustprocesses. Some culture parameters such as pH, dissolvedoxygen, and temperature, can be monitored using in situ sen-sors, which has allowed the implementation of automatedfeedback control of these parameters. With the ability tocontrol these aspects of cell culture microenvironment, re-
producible, scalable, and robust bioprocesses can beimplemented.
Other important culture parameters, however, are still typi-cally monitored via manual sampling and several off-line ana-lyzers. Some of these parameters are used to trigger in-processactions, such as the addition of a feed in response to an off-line nutrient concentration reading. Other parameters, such ascell viability, dissolved gases, nutrients, osmolality, and cellu-lar by-products, are tracked as metrics of culture reproducibil-ity. Thus this information is important both for bioprocessimplementation and for understanding the impact of cultureconditions on performance, productivity, and product quality.
Off-line monitoring of these important parameters islabor-intensive due to the manual nature of collecting
Correspondence concerning this article should be addressed to G. E.Derfus at [email protected].
284 VVC 2009 American Institute of Chemical Engineers

6
samples, presenting them to several analyzers, and enteringdata. This large number of manual steps introduces operator-dependent variability and error into the process. In addition,each sample taken manually requires an at-risk breach of thesterility barrier, which can increase the probability of culturecontamination.
With the goals of reducing the manual labor involved inbioprocess monitoring and improving data reliability, variousnew online and at-line monitoring tools have been developedover the last decade.1,2 Many of these advances have beensuccessfully applied to cell culture systems, including opticaldensity3 and capacitance4 probes for monitoring cell density;near infrared spectroscopy (NIR) for monitoring variouscell culture constituents5–8; flow injection analysis (FIA) forsample delivery to offline analyzers9,10; online high perform-ance liquid chromatography (HPLC) for monitoring aminoacid and other metabolite concentrations11,12 or productformation13; and automated samplers connected to off-lineanalyzers such as HPLC for at-line monitoring.14 AlthoughNIR technology could, in theory, preclude the need for off-line and at-line culture analyses, significant challengesremain for the successful industrial application of thetechnology for cell culture monitoring. These include estab-lishment of robust calibration and data analysis methodsthat can be implemented routinely by nonexpert operators aswell as development of biomass quantification methods formammalian cells as previously shown for microbialcultures.15,16
Thus the need remains for conventional off-line cell cul-ture monitoring. A recent advancement in off-line cell cul-ture monitoring was the introduction of integrated analyzertechnology. The BioProfile FLEX (Nova Biomedical, Inc.,Waltham, Massachusetts) combines the functionality of threeoff-line analyzers (a bio-profile analyzer, a cell counter, anosmometer) into one device. The analyzer design is modularin nature, including gas/electrolyte, nutrient/metabolite, celldensity/viability, and osmometer modules (shown in Fig-ure 1B). An IgG module is also available, but was not testedhere. The gas/electrolyte and nutrient/metabolite modules useion-selective electrode potentiometry, amperometry, and en-zymatic reaction-dependent biosensors. The cell density/via-bility module was designed by Nova Biomedical to countcells and assess viability based on the traditional trypan blueexclusion method. Briefly, the module first mixes the cell-containing sample with trypan blue, and the mixture is incu-bated so that dead cells absorb the trypan blue. The samplethen settles on the translucent bottom of a flow cell. Theflow cell is moved past a fixed 10� microscope objectiveusing a precision motion control system, with high resolutionimages obtained at 40 locations. Cell counts and viability arequantified by image processing based on user-defined con-straints such as live/dead cell brightness and average cellsizes. The osmometer module is a freezing point osmometermodel manufactured by Advanced Instruments specificallyfor this application. Table 1 shows the analytes measured byeach module, and BioProfile FLEX analytical ranges foreach analyte are published by Nova Biomedical. Each mod-ule can be selected individually, and if all modules areselected the BioProfile FLEX requires 1 mL sample volumeand 7.5 min to run the analyzes. Results and user input areexported electronically in spreadsheet format.
Although the integrated analyzer and its electronic dataoutput streamline some of the manual labor involved in cellculture monitoring, a new automated sampling system has
been designed specifically for sample output to the BioProfileFLEX (Nova Biomedical) that could eliminate manual sam-pling altogether. The system consists of a switching pumpingmodule (SPM) designed to fit directly underneath the BioPro-file FLEX, up to 10 reactor valve modules (RVM) placed ad-jacent to the bioreactors, as well as containers for cleaningsolution, saline flush, and waste collection (Figure 1). Thebioreactor, RVM, and SPM are connected via 1 mm inner di-ameter (0.8 mL/m hold-up volume) stainless steel lines oflengths configured to fit a given bioreactor arrangement. Thestainless steel lines are connected to the SPM and RVMusing compression fittings. The line connecting the RVM and
Figure 1. (A) BioProfile FLEX and automated sampling sys-tem configured for a 1 L bioreactor on a bench top.(B) Inside of BioProfile FLEX, showing three of thefour analytical modules. Cell density module islocated behind osmometer and is therefore not visi-ble. (C) Schematic of fluid flow paths through sys-tem. Sample flows from bioreactor to RVM (ReactorValve Module) to SPM (Switching Pumping Module)to BioProfile FLEX. Waste flows from BioProfileFLEX to SPM to waste container (w). Cleaning solu-tion (c) and saline flush (f) flow from respective con-tainers to SPM manifolds to RVM fluidics, and thenfollow the same path as the sample through the sys-tem to waste.
Biotechnol. Prog., 2010, Vol. 26, No. 1 285
7
the bioreactor extends through the head-plate to the bottom ofthe bioreactor, with a very small (�1 mL) dead volume in theline.
The SPM drives all fluid movement within the auto-sam-pler system via a single 5 mL syringe pump, and each RVMserves to protect the sterility of one bioreactor. The directionand location of fluid flow is determined by the opening andclosing of various valves throughout the system. The SPMcontains 10 sample inlet ports (one for each RVM). To pull asample from a given bioreactor, the SPM inlet port valveopens and the pump is activated to draw a vacuum against atwo-way valve within the RVM. The RVM valve opens onlywhen the pressure gradient, determined by a built-in pressuresensor, is such that flow will be out of the bioreactor. After apredetermined sample volume flows from the bioreactor tothe SPM, both valves close, preventing any further fluidexchange with the bioreactor. The sample is then pumped toa holding coil inside the SPM, and in-line air detectors (onelocated at the outlet of the RVM, and another at the inlet ofthe SPM) are used to ensure that the desired sample volumehas been obtained and pressure has stabilized before the SPMdelivers a portion of the sample to the BioProfile FLEX. Fol-lowing sample aspiration by the BioProfile FLEX, all remain-ing sample is pumped to a single waste container placed nextto the SPM. The SPM then pumps an alcohol-based cleaningsolution through the entire sample flow path, followed by sa-line flush solution, in preparation for the next sample.
The culture volume required for automated samplingdepends on the length of the stainless steel lines connectingthe RVM and SPM, and is determined such that the first por-tion of the sample plug acts as a prime of the line, and theBioProfile FLEX takes 1 mL for analysis from the end ofthe sample plug. The auto-sampler adds roughly 3 min to thetotal sample time per reactor. For 10 bioreactors, the entiresystem occupies roughly 0.7 m2 of lab bench space (Fig-ure 1A). Once the system is installed (SPM, RVMs in place,performed by the vendor), the only set-up required for eachculture run is connecting each bioreactor to its RVM, pri-ming the bioreactor-RVM line, and setting the automatedsampling schedule. Maintenance of the system includesreplacing flush and cleaning fluid supplies and emptyingwaste containers during culture runs, and cleaning the bio-reactor-RVM connection lines between cultures.
The objectives of this work were twofold. The first was toevaluate the performance of the BioProfile FLEX in terms of(i) equivalence of its measurements to those of currently uti-lized instruments, and (ii) inter-instrument reproducibilityamong three separate BioProfile FLEX analyzers. The sec-
ond was to assess the function of a prototype auto-samplerin terms of (i) reliability of communication between theauto-sampler and the BioProfile FLEX, (ii) maintenance ofculture sterility, and (iii) equivalence of BioProfile FLEXmeasurements from automated and manual samples.
Materials and Methods
For the BioProfile FLEX evaluation, industrial suspension-adapted Chinese Hamster Ovary (CHO) cell lines from Gen-entech Inc. were cultivated. The cell lines were derived froma dihydrofolate reductase minus (dhfr-) CHO host,17 and ge-netically engineered to secrete IgG1 recombinant proteins ofinterest using a dhfr/methotrexate selection method similarto that described previously.18 Cells were maintained in pro-prietary medium adapted from DMEM and Ham’s F 12media. Cultivations were carried out in 2-L bioreactors con-trolled by a DeltaV based BioNet system (Broadley-James,Irvine, CA) or by digital control units (Sartorius, Edgewood,NY). The bioreactors (Applikon Inc., Foster City, CA) wereequipped with calibrated dissolved oxygen, pH, and tempera-ture probes. Temperature control was achieved via a heatingblanket. Dissolved oxygen was controlled on-line throughsparging with air and/or oxygen, and pH was controlledthrough additions of CO2 or 1 M Na2CO3. Cultures weremonitored over the course of 12–14 days via daily samples(9 mL) extracted manually from the reactor via a sampleport containing a one-way check valve and a syringe attach-ment valve. A portion of each sample was presented to oneor more off-line analyzers, as described later in detail foreach specific study.
BioProfile FLEX versus reference analyzers
The performance of the BioProfile FLEX was assessed bycomparing BioProfile FLEX measurements to those of theinstruments currently utilized for cell culture monitoring,using cell culture samples obtained as described earlier. Thecurrently utilized instruments, herein referred to as referenceanalyzers, include a bio-profile analyzer that employs ion-selective electrode potentiometry, amperometry, and enzy-matic reaction-dependent biosensors (BioProfile 400, NovaBiomedical, Inc., Waltham, Massachusetts), a trypan blueexclusion and digital imaging based cell counter (Vi-CellAS, Beckman Coulter, Inc., Fullerton, California), and freez-ing point osmometer (Model 3900, Advanced Instruments,Inc., Norwood, Massachusetts). The analytes measured byeach instrument are shown in Table 1.
Table 1. Analytes Measured by Each BioProfile Flex module, and the Reference Analyzers Used for Comparison for Each Analyte
FLEX module Analyte Symbol Units Reference analyzer
Gas, Electrolyte pH pH pH units Nova BioProfile 400Partial pressure oxygen pO2 mmHgPartial pressure carbon dioxide pCO2 mmHgAmmonium ion NHþ
4 mMPotassium ion Kþ mMSodium ion Naþ mMCalcium ion Caþþ mM NA
Nutrient, Metabolite Glucose gluc g/L Nova BioProfile 400Lactate lac g/LGlutamine gln mMGlutamate glu mM
Cell Density Viable cell density vcd 1e5 cells/mL Beckman-Coulter Vi-Cell ASViability viab %Live cell diameter diam lm
Osmometer Osmolality osmo mOsm/kg Advanced Instruments 3900
286 Biotechnol. Prog., 2010, Vol. 26, No. 1
8
For this study, a cell culture sample consisted of a single9 mL draw from a bioreactor via a syringe, presented to theBioProfile 400 (�0.8 mL) and BioProfile FLEX (�1 mL)directly from the syringe, and to the Vi-Cell AS (�1 mL)and Osmometer 3900 (�200 lL) in tray mode. Care wastaken to minimize the elapsed time between presentation ofsample to the BioProfile 400 and BioProfile FLEX to mini-mize effects of off-gassing and cellular metabolism betweenmeasurements. This study was conducted in two separatelaboratories, and involved two BioProfile FLEX analyzerswith the original software version (upgrades have since beenreleased), two sets of reference analyzers, 13 CHO cell linesand over 20 operators. Each operator obtained samples of asingle cell type (from his/her cultures ongoing for other stud-ies), and presented them to a single set of analyzers.
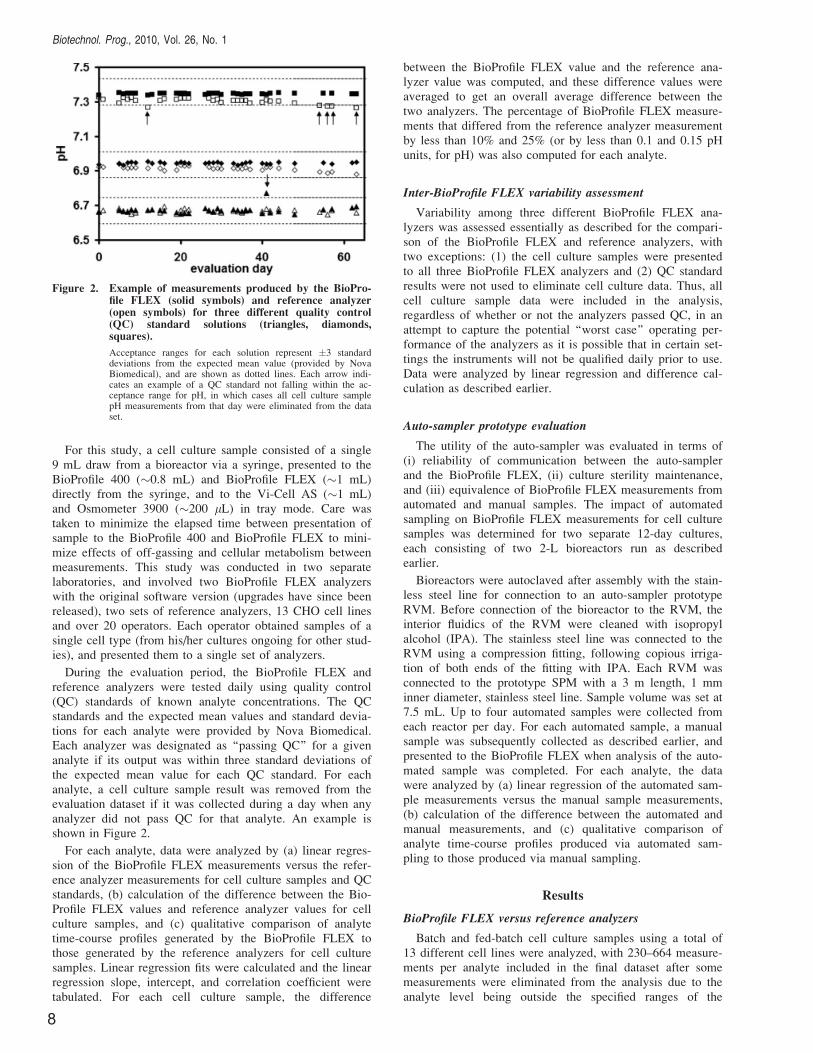
During the evaluation period, the BioProfile FLEX andreference analyzers were tested daily using quality control(QC) standards of known analyte concentrations. The QCstandards and the expected mean values and standard devia-tions for each analyte were provided by Nova Biomedical.Each analyzer was designated as ‘‘passing QC’’ for a givenanalyte if its output was within three standard deviations ofthe expected mean value for each QC standard. For eachanalyte, a cell culture sample result was removed from theevaluation dataset if it was collected during a day when anyanalyzer did not pass QC for that analyte. An example isshown in Figure 2.
For each analyte, data were analyzed by (a) linear regres-sion of the BioProfile FLEX measurements versus the refer-ence analyzer measurements for cell culture samples and QCstandards, (b) calculation of the difference between the Bio-Profile FLEX values and reference analyzer values for cellculture samples, and (c) qualitative comparison of analytetime-course profiles generated by the BioProfile FLEX tothose generated by the reference analyzers for cell culturesamples. Linear regression fits were calculated and the linearregression slope, intercept, and correlation coefficient weretabulated. For each cell culture sample, the difference
between the BioProfile FLEX value and the reference ana-lyzer value was computed, and these difference values wereaveraged to get an overall average difference between thetwo analyzers. The percentage of BioProfile FLEX measure-ments that differed from the reference analyzer measurementby less than 10% and 25% (or by less than 0.1 and 0.15 pHunits, for pH) was also computed for each analyte.
Inter-BioProfile FLEX variability assessment
Variability among three different BioProfile FLEX ana-lyzers was assessed essentially as described for the compari-son of the BioProfile FLEX and reference analyzers, withtwo exceptions: (1) the cell culture samples were presentedto all three BioProfile FLEX analyzers and (2) QC standardresults were not used to eliminate cell culture data. Thus, allcell culture sample data were included in the analysis,regardless of whether or not the analyzers passed QC, in anattempt to capture the potential ‘‘worst case’’ operating per-formance of the analyzers as it is possible that in certain set-tings the instruments will not be qualified daily prior to use.Data were analyzed by linear regression and difference cal-culation as described earlier.
Auto-sampler prototype evaluation
The utility of the auto-sampler was evaluated in terms of(i) reliability of communication between the auto-samplerand the BioProfile FLEX, (ii) culture sterility maintenance,and (iii) equivalence of BioProfile FLEX measurements fromautomated and manual samples. The impact of automatedsampling on BioProfile FLEX measurements for cell culturesamples was determined for two separate 12-day cultures,each consisting of two 2-L bioreactors run as describedearlier.
Bioreactors were autoclaved after assembly with the stain-less steel line for connection to an auto-sampler prototypeRVM. Before connection of the bioreactor to the RVM, theinterior fluidics of the RVM were cleaned with isopropylalcohol (IPA). The stainless steel line was connected to theRVM using a compression fitting, following copious irriga-tion of both ends of the fitting with IPA. Each RVM wasconnected to the prototype SPM with a 3 m length, 1 mminner diameter, stainless steel line. Sample volume was set at7.5 mL. Up to four automated samples were collected fromeach reactor per day. For each automated sample, a manualsample was subsequently collected as described earlier, andpresented to the BioProfile FLEX when analysis of the auto-mated sample was completed. For each analyte, the datawere analyzed by (a) linear regression of the automated sam-ple measurements versus the manual sample measurements,(b) calculation of the difference between the automated andmanual measurements, and (c) qualitative comparison ofanalyte time-course profiles produced via automated sam-pling to those produced via manual sampling.
Results
BioProfile FLEX versus reference analyzers
Batch and fed-batch cell culture samples using a total of13 different cell lines were analyzed, with 230–664 measure-ments per analyte included in the final dataset after somemeasurements were eliminated from the analysis due to theanalyte level being outside the specified ranges of the
Figure 2. Example of measurements produced by the BioPro-file FLEX (solid symbols) and reference analyzer(open symbols) for three different quality control(QC) standard solutions (triangles, diamonds,squares).
Acceptance ranges for each solution represent �3 standarddeviations from the expected mean value (provided by NovaBiomedical), and are shown as dotted lines. Each arrow indi-cates an example of a QC standard not falling within the ac-ceptance range for pH, in which cases all cell culture samplepH measurements from that day were eliminated from the dataset.
Biotechnol. Prog., 2010, Vol. 26, No. 1 287
9
analyzers, or due to an analyzer not passing QC for that ana-lyte. In general, the BioProfile FLEX measurements wereequivalent to those from the reference analyzers (Table 2),and exceptions are discussed later. Assessed by linear regres-sion analysis, the BioProfile FLEX measurements werenearly identical (slopes and R2 values within 10% of 1.0,low intercept values relative to the data range) to those ofthe reference analyzers for QC samples of all analytes exceptglutamate, for which the slope was higher than expected, at1.28. Similarly, for cell culture samples many analytesshowed linear regression slopes and R2 values within 15% of1.0. These include key process parameters such as pH andglucose, and others such as sodium, ammonium, lactate, andosmolality. For live cell diameter, a consistent offset wasobserved between the BioProfile FLEX and the reference an-alyzer (BioProfile FLEX values were 3.5 lm higher). Forglucose and lactate, overall offsets between the BioProfileFLEX and the reference analyzer were 0.5 g/L and 0.3 g/Lrespectively, although subsequent experiments have demon-strated that this offset is variable for both analytes, rangingfrom �0.4 to 0.6 g/L for glucose, and 0 to 0.3 g/L for lactate(data not shown).
In this study, BioProfile FLEX NHþ4 measurements were
consistently 1 mM lower than those of the reference ana-lyzers. However, the BioProfile FLEX software was subse-quently modified, resulting in elimination of this offset, butat the same time introducing a variable linear regressionslope, with values between 1.15 and 1.30 (data not shown).For dissolved oxygen and (pO2) carbon dioxide (pCO2), thelinear regression slopes were slightly different than expected,at 0.6 and 1.2, respectively. Subsequent experiments havedemonstrated that the linear regression slope between thetwo instruments for pCO2 can range from 1.0 to 1.4, andthat the slope for cell culture samples can be predicted fromthe slope for QC samples run during the same time periodfor any BioProfile FLEX-reference analyzer pair. This slope,in turn, depends on maintenance of the sensors on both ana-lyzers (data not shown).
For viable cell density measurements, correlation wasgood for the overall data set (R2 ¼ 0.99, slope ¼ 0.86)including all 13 CHO cell lines, and the overall offset was2.2e5 cells/mL over the range of 0–100e5 cells/mL. How-ever, it should be noted that cell count parameters on theBioProfile FLEX must be optimized to achieve results simi-lar to those of the reference analyzer. In addition, for certaincell lines the two instruments did not agree well under theoptimized parameters used in the study. Further optimizationof the cell count parameters could result in better BioProfileFLEX-reference analyzer agreement for a larger number ofcell lines.
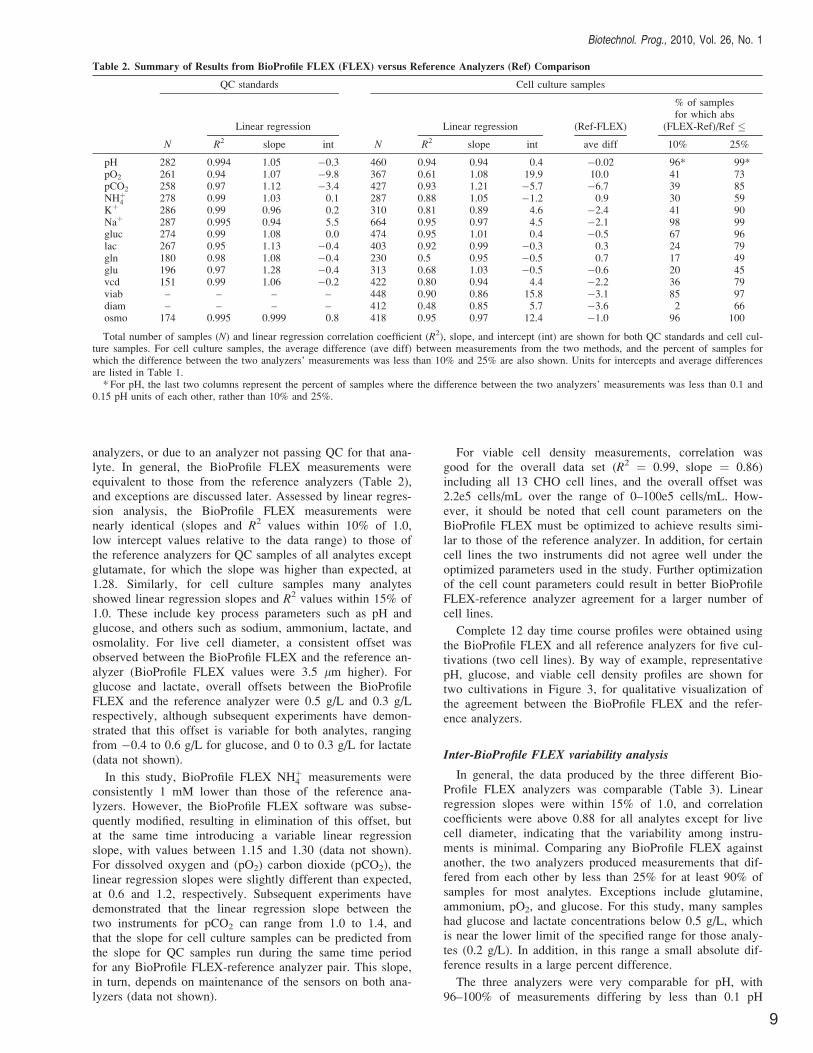
Complete 12 day time course profiles were obtained usingthe BioProfile FLEX and all reference analyzers for five cul-tivations (two cell lines). By way of example, representativepH, glucose, and viable cell density profiles are shown fortwo cultivations in Figure 3, for qualitative visualization ofthe agreement between the BioProfile FLEX and the refer-ence analyzers.
Inter-BioProfile FLEX variability analysis
In general, the data produced by the three different Bio-Profile FLEX analyzers was comparable (Table 3). Linearregression slopes were within 15% of 1.0, and correlationcoefficients were above 0.88 for all analytes except for livecell diameter, indicating that the variability among instru-ments is minimal. Comparing any BioProfile FLEX againstanother, the two analyzers produced measurements that dif-fered from each other by less than 25% for at least 90% ofsamples for most analytes. Exceptions include glutamine,ammonium, pO2, and glucose. For this study, many sampleshad glucose and lactate concentrations below 0.5 g/L, whichis near the lower limit of the specified range for those analy-tes (0.2 g/L). In addition, in this range a small absolute dif-ference results in a large percent difference.
The three analyzers were very comparable for pH, with96–100% of measurements differing by less than 0.1 pH
Table 2. Summary of Results from BioProfile FLEX (FLEX) versus Reference Analyzers (Ref) Comparison
QC standards Cell culture samples
N
Linear regression
N
Linear regression (Ref-FLEX)
% of samplesfor which abs
(FLEX-Ref)/Ref �R2 slope int R2 slope int ave diff 10% 25%
pH 282 0.994 1.05 �0.3 460 0.94 0.94 0.4 �0.02 96* 99*pO2 261 0.94 1.07 �9.8 367 0.61 1.08 19.9 10.0 41 73pCO2 258 0.97 1.12 �3.4 427 0.93 1.21 �5.7 �6.7 39 85NHþ
4 278 0.99 1.03 0.1 287 0.88 1.05 �1.2 0.9 30 59Kþ 286 0.99 0.96 0.2 310 0.81 0.89 4.6 �2.4 41 90Naþ 287 0.995 0.94 5.5 664 0.95 0.97 4.5 �2.1 98 99gluc 274 0.99 1.08 0.0 474 0.95 1.01 0.4 �0.5 67 96lac 267 0.95 1.13 �0.4 403 0.92 0.99 �0.3 0.3 24 79gln 180 0.98 1.08 �0.4 230 0.5 0.95 �0.5 0.7 17 49glu 196 0.97 1.28 �0.4 313 0.68 1.03 �0.5 �0.6 20 45vcd 151 0.99 1.06 �0.2 422 0.80 0.94 4.4 �2.2 36 79viab – – – – 448 0.90 0.86 15.8 �3.1 85 97diam – – – – 412 0.48 0.85 5.7 �3.6 2 66osmo 174 0.995 0.999 0.8 418 0.95 0.97 12.4 �1.0 96 100
Total number of samples (N) and linear regression correlation coefficient (R2), slope, and intercept (int) are shown for both QC standards and cell cul-ture samples. For cell culture samples, the average difference (ave diff) between measurements from the two methods, and the percent of samples forwhich the difference between the two analyzers’ measurements was less than 10% and 25% are also shown. Units for intercepts and average differencesare listed in Table 1.* For pH, the last two columns represent the percent of samples where the difference between the two analyzers’ measurements was less than 0.1 and
0.15 pH units of each other, rather than 10% and 25%.
288 Biotechnol. Prog., 2010, Vol. 26, No. 1
10
units for any two analyzers. Because of a laboratory supplystock limitation, a glutamine membrane was not availablefor FLEX 1 during this experiment, and as such the sectionof Table 3 comparing FLEX 1 and FLEX 3 do not show glu-tamine data. Representative time course culture profilesobtained using all three BioProfile FLEX analyzers areshown for two cultivations in Figure 4.
Auto-sampler prototype evaluation
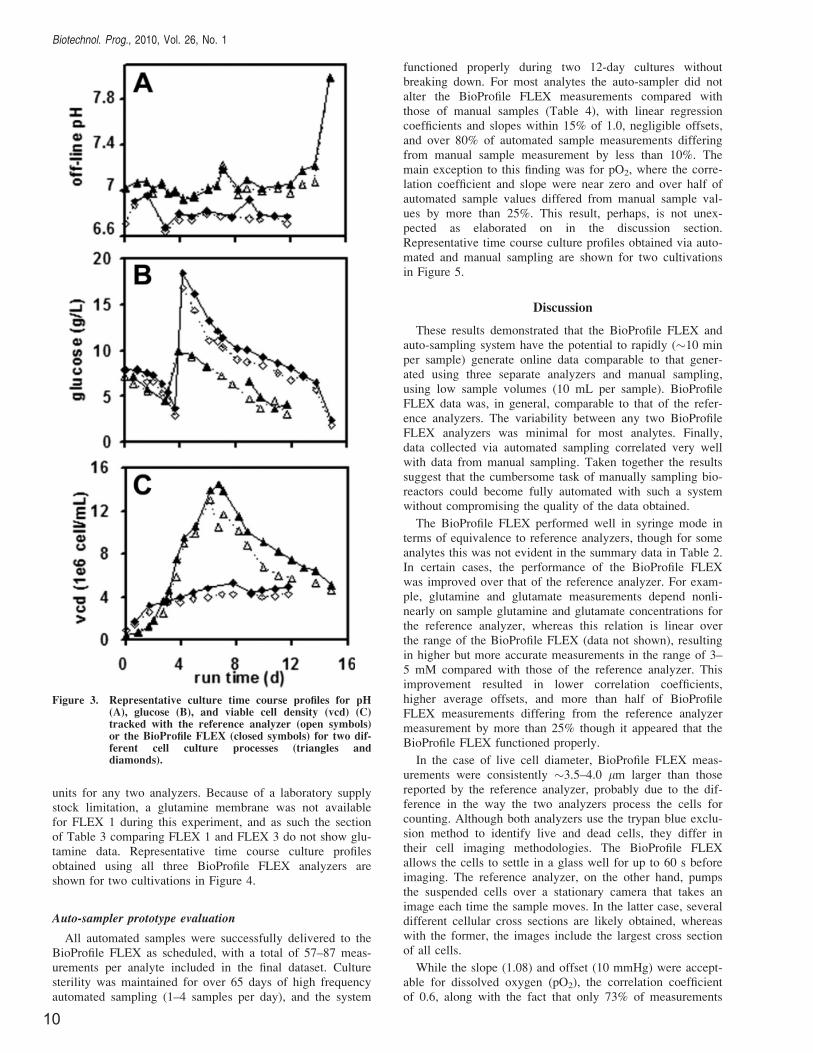
All automated samples were successfully delivered to theBioProfile FLEX as scheduled, with a total of 57–87 meas-urements per analyte included in the final dataset. Culturesterility was maintained for over 65 days of high frequencyautomated sampling (1–4 samples per day), and the system
functioned properly during two 12-day cultures withoutbreaking down. For most analytes the auto-sampler did notalter the BioProfile FLEX measurements compared withthose of manual samples (Table 4), with linear regressioncoefficients and slopes within 15% of 1.0, negligible offsets,and over 80% of automated sample measurements differingfrom manual sample measurement by less than 10%. Themain exception to this finding was for pO2, where the corre-lation coefficient and slope were near zero and over half ofautomated sample values differed from manual sample val-ues by more than 25%. This result, perhaps, is not unex-pected as elaborated on in the discussion section.Representative time course culture profiles obtained via auto-mated and manual sampling are shown for two cultivationsin Figure 5.
Discussion
These results demonstrated that the BioProfile FLEX andauto-sampling system have the potential to rapidly (�10 minper sample) generate online data comparable to that gener-ated using three separate analyzers and manual sampling,using low sample volumes (10 mL per sample). BioProfileFLEX data was, in general, comparable to that of the refer-ence analyzers. The variability between any two BioProfileFLEX analyzers was minimal for most analytes. Finally,data collected via automated sampling correlated very wellwith data from manual sampling. Taken together the resultssuggest that the cumbersome task of manually sampling bio-reactors could become fully automated with such a systemwithout compromising the quality of the data obtained.
The BioProfile FLEX performed well in syringe mode interms of equivalence to reference analyzers, though for someanalytes this was not evident in the summary data in Table 2.In certain cases, the performance of the BioProfile FLEXwas improved over that of the reference analyzer. For exam-ple, glutamine and glutamate measurements depend nonli-nearly on sample glutamine and glutamate concentrations forthe reference analyzer, whereas this relation is linear overthe range of the BioProfile FLEX (data not shown), resultingin higher but more accurate measurements in the range of 3–5 mM compared with those of the reference analyzer. Thisimprovement resulted in lower correlation coefficients,higher average offsets, and more than half of BioProfileFLEX measurements differing from the reference analyzermeasurement by more than 25% though it appeared that theBioProfile FLEX functioned properly.
In the case of live cell diameter, BioProfile FLEX meas-urements were consistently �3.5–4.0 lm larger than thosereported by the reference analyzer, probably due to the dif-ference in the way the two analyzers process the cells forcounting. Although both analyzers use the trypan blue exclu-sion method to identify live and dead cells, they differ intheir cell imaging methodologies. The BioProfile FLEXallows the cells to settle in a glass well for up to 60 s beforeimaging. The reference analyzer, on the other hand, pumpsthe suspended cells over a stationary camera that takes animage each time the sample moves. In the latter case, severaldifferent cellular cross sections are likely obtained, whereaswith the former, the images include the largest cross sectionof all cells.
While the slope (1.08) and offset (10 mmHg) were accept-able for dissolved oxygen (pO2), the correlation coefficientof 0.6, along with the fact that only 73% of measurements
Figure 3. Representative culture time course profiles for pH(A), glucose (B), and viable cell density (vcd) (C)tracked with the reference analyzer (open symbols)or the BioProfile FLEX (closed symbols) for two dif-ferent cell culture processes (triangles anddiamonds).
Biotechnol. Prog., 2010, Vol. 26, No. 1 289

11
differed from the reference analyzer measurement by lessthan 25%, indicate a relatively large degree of variability forthis analyte. This variability is likely due to gas entrainment,off-gassing, or cellular metabolism in the sample during op-erator manipulation or during the time between presentationto the BioProfile FLEX and the reference analyzer. This hy-pothesis is supported by the good correlation between theBioProfile FLEX and the BioProfile 400 for QC standardsamples (R2, slope of 0.94, 1.07 respectively).
For other analytes, the original data set showed unexpect-edly high linear regression slopes (NHþ
4 and pCO2) or non-negligible inter-analyzer offsets (glucose and lactate) in theBioProfile FLEX versus reference analyzer study. Subse-quent studies, however, suggested that these slopes and off-
sets are not inherent to every BioProfile FLEX-referenceanalyzer pair, but instead represent variability in the relativeperformance between two analyzers. Subsequent experimentsalso suggested that two analyzers’ relative performance forcell culture samples could be predicted by the relative per-formance of QC standards on those two analyzers. Thus thevariability described here could be eliminated by maintainingthe analyzers such that QC measurements are at the meanexpected value for these analytes. It is important to under-stand and consider these potential performance relationshipswhen transferring a process between sites using the BioPro-file FLEX and sites utilizing other analyzers.
In general the inter-BioProfile FLEX variability was mini-mal for most parameters. One exception was for analytes in
Table 3. Summary of Results for Culture Samples Presented to Three Different BioProfile FLEX analyzers (FLEX 1, FLEX 2, FLEX 3)
FLEX 1 vs. FLEX 3 FLEX 2 vs. FLEX 3
N
Linear regression
% of samples forwhich (FLEX1-
FLEX3)/FLEX1 �
N
Linear regression
% of samples forwhich (FLEX2-
FLEX3)/FLEX2 �
slope int R2 10% 25% slope Int R2 10% 25%
pH 57 0.99 0.1 0.96 96* 98* 114 0.97 0.2 0.99 100* 100*pO2 51 0.96 �3.2 0.88 39 69 99 0.95 3.4 0.93 42 70pCO2 60 0.92 0.4 0.96 60 97 114 1.04 �2.3 0.99 88 97NHþ
4 5 1.11 0.6 0.99 86 88 101 0.97 �0.1 0.99 88 100Kþ 51 0.96 0.8 0.97 94 100 101 1.02 �0.3 0.99 99 100Naþ 57 1.01 0.4 0.998 100 100 114 0.99 1.1 0.999 100 100gluc 63 1.1 �0.3 0.96 21 71 109 1.07 �0.1 0.99 41 74lac 64 1.1 0.1 0.99 64 92 110 0.98 0.1 0.99 74 95gln – – – – – – 103 1.01 0.0 0.99 53 85glu 76 1.1 �0.3 0.96 56 92 115 1.07 �0.1 0.99 81 98vcd 65 0.93 0.4 0.93 65 98 111 0.99 0.7 0.93 69 98viab 65 0.98 1.6 0.97 94 100 111 0.95 5.3 0.96 95 99diam 65 0.88 1.5 0.86 91 100 111 1.03 �1.7 0.85 82 100osmo 33 0.98 11.4 0.95 97 100 48 1.05 �9.9 0.95 98 100
For each pair of analyzers, the total number of samples (N); linear regression correlation coefficient (R2), slope, and intercept (int); and the percent ofsamples for which the difference between the two analyzers’ measurements was less than 10% and 25% are shown. Units for intercepts and differencesare listed in Table 1.* For pH, the last two columns represent the percent of samples where the difference between the two analyzers’ measurements was less than 0.1 and
0.15 pH units, rather than 10% and 25%. Flex 1 versus FLEX 2 comparison not shown for brevity.
Figure 4. Cell culture profiles for glucose (A), lactate (B), ammonium (C), pH (D), pCO2 (E), osmolality (F), viable cell density (vcd)(G), viability (H), and glutamate (I) tracked via three separate BioProfile FLEX analyzers (triangles vs. diamonds vs.squares) for two different cell culture processes (open vs. closed symbols).
290 Biotechnol. Prog., 2010, Vol. 26, No. 1
12
the nutrient/metabolite module, where the percentage of sam-ples where the two analyzers’ results were within 10% ofeach other was lower than expected (ranging from 21 to81% for the various analytes and analyzer pairs, Table 3),due to the absolute value of most measurements being lowrelative to the analytical range. For example, for 92% ofsamples, the absolute difference between two analyzers’ glu-cose results were less than 1.5 g/L when comparing any twoBioProfile FLEX analyzers. Similarly, for 99.6% of samplesthe absolute difference between two BioProfile FLEX ana-lyzers’ lactate results was less than 0.5 g/L. In both cases,the absolute differences observed would not affect the out-
come of a typical cell culture process. It is noted that thedata from the BioProfile FLEX versus reference analyzerstudy represent the proper function of all analyzers due tocareful tracking of QC standards and, at the same time, highoperator-related variability due to a large number of opera-tors contributing to the study. In contrast, the results fromthe inter-BioProfile FLEX variability study represent poten-tially higher analyzer-related variability due to inclusion ofall cell culture samples regardless of QC results, but less op-erator-related variability as this portion of the study was con-ducted by only three operators.
The integration of three analyzers into one eliminatessome manual labor associated with cell culture monitoring,and also allows for integrated electronic data transfer,increasing efficiency and accuracy of data tracking and thepotential for feedback control based on BioProfile FLEX out-put. An even greater increase in efficiency is realized whenthe BioProfile FLEX is connected to the cell cultures via theautomated sampling system. For example, current samplingpractices in a process development setting require roughly0.2 h of manual labor per reactor per day including dataentry time. Assuming 500 two-week cultivations per yearsampled twice daily, automating the sampling process couldsave 2,800 h of manual labor per year.
The auto-sampler prototype performed as expected, withexcellent correlation between measurements from automatedand manual samples for all analytes except pO2, most likelydue to culture metabolism or air leakage into the RVM and/or manual sample syringe. Although further efforts directedat improving these methods could result in better agreementin pO2 measurements, the information is not typically con-sidered crucial off-line information. Total volume extractedfrom the bioreactor per sample, �5–10 mL, was equivalentto the volume required for manual sampling with the exist-ing configuration (9 mL including prime). Currently theauto-sampler system does not include a fraction collectingmodule, meaning that manual samples would still need to becollected in situations where, for example, packed cell
Table 4. Summary of Results from Automated versus ManualSampling Method Comparison
N
Linear regression
ave diff
% of samplesfor which(auto-man)/man �
R2 slope int 10% 25%
pH 85 0.93 0.94 0.4 0.0 98* 100*pO2 84 0.00 0.02 48 �3.8 19 49pCO2 82 0.99 1.05 1.8 �6.9 82 99NHþ
4 86 1.00 1.00 0.0 0.0 100 100Kþ 87 0.98 0.99 0.2 0.0 100 100Naþ 86 1.00 0.99 0.7 0.1 100 100gluc 77 0.99 1.00 0.0 0.0 95 100lac 57 1.00 0.99 0.0 0.0 81 97gln 57 0.96 0.93 0.1 0.0 86 98glu 78 0.94 0.94 0.3 0.0 81 99vcd 86 0.98 0.97 0.1 0.1 80 100viab 87 0.98 0.94 5.8 0.2 100 100osmo 81 0.86 0.84 0.5 10 93 100
The total number of samples (N); linear regression correlation coeffi-cient (R2), slope, and intercept (int); the average difference betweenautomated and manual measurements (ave diff), and the percent of sam-ples for which the difference between the two sampling methods’ meas-urements was less than 10% and 25% are shown. Units for interceptsand differences are listed in Table 1.* For pH, the last two columns represent the percent of samples where
the difference between automated and manual measurements was lessthan 0.1 and 0.15 pH units, rather than 10% and 25%.
Figure 5. Cell culture profiles for glucose (A), lactate (B), ammonium (C), pH (D), pCO2 (E), osmolality (F), viable cell density (vcd)(G), viability (H), and cell size (I) tracked via automated sampling (open symbols) or manual sampling (closed symbols), fortwo different cell culture processes (triangles vs. diamonds).
Biotechnol. Prog., 2010, Vol. 26, No. 1 291

13
volume measurements or sample retains are required. Never-theless, the excellent performance of the prototype in termsof sterility maintenance, scheduling reliability and sample fi-delity indicate that the system has the potential to be a veryrobust commercial product.
The integrated sampling and analysis system represents abreakthrough for cell culture monitoring, in that many im-portant culture parameters can be measured from a singleautomated sampling event without repeated risk of sterilitybreach. This is in contrast with other automated monitoringsystems, which often monitor only one or two parame-ters,10,14 require complex computational analysis or calibra-tion/validation for each new culture system,19 or areincompatible with aseptic conditions.20 This suggests that thesystem tested here has the potential for widespread imple-mentation in an industrial setting although, due to the com-plexity of the system, the long term robustness of the systemshould first be evaluated.
Conclusions
This report describes the successful use of a novel inte-grated multi-functional analyzer and automated sampling sys-tem for mammalian cell culture bioprocess monitoring. Theresults suggest that the system has the potential to dramati-cally reduce the manual labor and associated errors involvedin monitoring mammalian cell bioprocesses, without alteringthe quality of the data collected. The extensive testing acrossmultiple instruments, multiple laboratory sites, and multipleoperators gives a sound indication of the performance to beexpected in a typical bioprocess development setting wheremany bioreactors are maintained. The automation of cell cul-ture bioprocess monitoring will allow for more robust, opera-tor-independent processes, with the potential for feedbackcontrol, resulting in increased efficiency, process understand-ing and process reproducibility while at the same time reduc-ing the resources required to operate the cultures.
Acknowledgments
Genentech: Leo Castaneda, Cary Opel, Melissa Mun, EarlyStage Cell Culture, Late Stage Cell Culture, Oceanside ProcessR&D, Oceanside MSAT; Nova Biomedical: John Balsavich,Jeff Chien, Bob Fox, Bob Grosholz, Lyle Peshek, Jim Richards,Jonathan Scott, Sanju Sharma, Mike Steilen.
Literature Cited
1. Harms P, Kostov Y, Rao G. Bioprocess monitoring. Curr OpinBiotechnol. 2002;13:124–127.
2. Schugerl K. Progress in monitoring, modeling and control ofbioprocesses during the last 20 years. J Biotechnol. 2001;85:149–173.
3. Konstantinov KB, Pambuyan R, Matanguihan R, Yoshida T,Purusich CM, Hu WS. On-line monitoring of hybridoma cellgrowth using a laser turbidity sensor. Biotechnol Bioeng.1992;40:1337–1342.
4. Zeiser A, Bedard C, Voyer R, Jardin B, Tom R, Kamen AA.On-line monitoring of the progress of infection in Sf-9 insectcell cultures using relative permittivity measurements. Biotech-nol Bioeng. 1999;63:122–126.
5. Yano THM. Prediction of the concentration of several constitu-ents in mouse-mouse hybridoma culture by near infrared spec-troscopy. J Ferment Bioeng. 1994;77:659–662.
6. Chung H, Arnold MA, Rhiel M, Murhammer DW. Simultane-ous measurement of glucose and glutamine in aqueous solutionsby near infrared spectroscopy. Appl Biochem Biotechnol.1995;50:109–125.
7. Riley MR, Crider HM, Nite ME, Garcia RA, Woo J, Wegge RM.Simultaneous measurement of 19 components in serum-contain-ing animal cell culture media by fourier transform near-infraredspectroscopy. Biotechnol Prog. 2001;17:376–378.
8. Riley MR, Okeson CD, Frazier BL. Rapid calibration of near-infrared spectroscopic measurements of mammalian cell cultiva-tions. Biotechnol Prog. 1999;15:1133–1134.
9. Myerhoff METM, Palsson BO. Simultaneous enzymatic/elec-trochemical determination of glucose and L-glutamine in hy-bridoma media by flow injection analysis. Biotechnol Bioeng.1993;41:964–969.
10. Stoll TSR, Von Stockar PA, Marison IW. Development of anon-line control system for the cultivation of animal cells in ahollow-fiber reactor using flow injection analysis and a visualprogramming language. J Biotechnol. 1996;51:37–48.
11. Larson TM, Gawlitzek M, Evans H, Albers U, Cacia J. Chemo-metric evaluation of on-line high-pressure liquid chromatogra-phy in mammalian cell cultures: analysis of amino acids andglucose. Biotechnol Bioeng. 2002;77:553–563.
12. Kurokawa H, Park YS, Iijima S, Kobayashi T. Growth charac-teristics in fed-batch culture of hybridoma cells with control ofglucose and glutamine concentrations. Biotechnol Bioeng.1994;44:95–103.
13. Ozturk SS, Thrift JC, Blackie JD, Naveh D. Real-time monitor-ing of protein secretion in mammalian cell fermentation: Mea-surement of monoclonal antibodies using a computer-controlledHPLC system (BioCad/RPM). Biotechnol Bioeng. 1995;48:201–206.
14. Braganza MRE, Huang Y-M, Molony M. On-line amino acidanalysis from a small scale CHO cell bioreactor. Periodical[Online]. 2007.
15. Vaidyanathan S, Arnold SA, Matheson L, Mohan P, Mcneil B,Harvey LM. Assessment of near-infrared spectral informationfor rapid monitoring of bioprocess quality. Biotechnol Bioeng.2001;74:376–388.
16. Navratil M, Norberg A, Lembren L, Mandenius CF. On-linemulti-analyzer monitoring of biomass, glucose and acetate forgrowth rate control of a Vibrio cholerae fed-batch cultivation.J Biotechnol. 2005;115:67–79.
17. Urlaub G, Chasin LA. Isolation of Chinese hamster cell mutantsdeficient in dihydrofolate reductase activity. Proc Natl Acad SciUSA. 1980;77:4216–4220.
18. Kaufman RJ, Sharp PA. Amplification and expression ofsequences cotransfected with a modular dihydrofolate reductasecomplementary dna gene. J Mol Biol. 1982;159:601–621.
19. Schugerl K. Which requirements do flow injection analyzer/bio-sensor systems have to meet for controlling the bioprocess.J Biotechnol. 1996;31:241–256.
20. Clementschitsch F, Bayer K. Improvement of bioprocess moni-toring: development of novel concepts. Microb Cell Fact.2006;5:19.
Manuscript received Feb. 26, 2009, and revision received June 5, 2009.
292 Biotechnol. Prog., 2010, Vol. 26, No. 1

14
15
Poster PresentationBioProcess International Europe, Prague 2012
Facilitating Multisite Bioprocess Transfer: Multi-Instrument and Multi-Platform Comparability and Long Term Stability of
Nova Biomedical’s BioProfile® Chemistry and Gas Analyzers
Matthew McRae, John McHale, Scott Granger, Brian Goulart, Elizabeth Kilcoyne, Roystein Bulman, Nova Biomedical, Waltham, MA 02454
In this study, the BioProfile analyzers have proven to be extremely robust and reliable, while providing high quality data that cell culture scientists and engineers demand. The results of this study show a high level of comparability between the BioProfile analyzers, not only among the same analyzers but across platforms. In addition, comparability was also demonstrated between both the new and aged analyzers, providing evidence of the long-term robustness and the quality of data that can be generated from the BioProfile analyzers. Nova Biomedical’s BioProfile analyzers provide the tools to facilitate multisite bioprocess transfer in the Biopharmaceutical industry. As a result of data generated in this study and proof of comparability between BioProfile® systems, this Biopharmaceutical company has fully integrated Nova’s analyzers for use in their cell culture development and manufacturing. The data presented proved complete comparability of results across multiple sites.

16

17
Facilitating Multisite Bioprocess Transfer: Multi-Instrument and Multi-Platform Comparability and Long Term Stability of Nova Biomedical’s BioProfile® Chemistry and Gas Analyzers
Matthew McRae, John McHale, Scott Granger, Brian Goulart, Elizabeth Kilcoyne, Roystein Bulman
Nova Biomedical 200 Prospect Street Waltham, MA 02454
Abstract
The Biopharmaceutical industry has grown exponentially and more companies are now operating in a global market with sites thousands of miles apart. The need is now even greater for robust bioprocess monitoring solutions that can provide consistent instrument-to-instrument results.
The seamless transfer of information across multiple sites relies heavily on the comparability of process data from various technologies, ensuring effective monitoring and control of critical process parameters. This study provides data supporting comparability of the BioProfile® (Nova Biomedical, Waltham, MA) chemistry and gas analyzers across several development and manufacturing sites in the United States. In addition, the long-term performance stability of the BioProfile systems was also tested. Five BioProfile FLEX and four BioProfile 100 Plus analyzers were used to determine linearity, precision, accuracy, and instrument-to- instrument comparability. The age of the instruments used for this study ranged from new to over 8 years old, with several hundred samples to over 20,000 samples run on a given analyzer.
The results of this study show a high level of comparability between the BioProfile® analyzers. In addition, comparability was also demonstrated between both the new and aged analyzers, providing evidence of the long-term robustness and the quality of data that can be generated from the BioProfile analyzers. Nova Biomedical’s BioProfile analyzers provide the tools to facilitate multisite bioprocess transfer in the Biopharmaceutical industry.
Introduction
Nova Biomedical’s BioProfile line of chemistry, gas, and cell density analyzers are used extensively in the Biopharmaceutical industry. Uses include cell line optimization, media development, process development, bioreactor characterization, and commercial product process monitoring. With the ability to measure pH and gases, nutrients and metabolites, electrolytes, osmolality, IgG, phosphate, and cell density and viability, the array of cell culture analytical systems available by Nova Biomedical provide single-system solutions for almost any cell culture application.
Development and commercial manufacturing facilities have grown from just a few to over several hundred small-scale bioreactors with manufacturing capacities in the hundreds of thousands of liters. It is nearly impossible to utilize the same analytical devices in manufacturing suites that were used in the development of a process. It is imperative that scientists and engineers feel confident that comparable results can be achieved between multiple analytical systems across parallel development labs and up through commercial manufacturing suites. Furthermore, manufacturing campaigns are run months to years after a process has been developed, requiring robust analytical technologies that scientists and engineers can rely on.
This study was performed in partnership with one of the largest Biopharmaceutical companies in the United States, with global sites in over thirty countries. In order to guarantee success with the manufacture of their product lines, absolute comparability of their analytical devices is necessary. Having tested a number of other analyzers, the customer acknowledged Nova Biomedical’s analytical technologies as the only devices available on the market today that can provide robust solutions for their laboratories and manufacturing suites. In addition, Nova provides the quality control of reagents and consumables as well as the technical resources capable of providing support and services facilitating technology transfer.
After the final site expansion, the strategic initiative was given to globally standardize their cell culture analytical devices. As part of this initiative, Nova’s Applications Support Organization drafted and executed this cross-site correlation study with the goal of providing robustness data, linearity and precision data, and ultimately the interchangeability of equipment.
18
Material & Methods
System Configuration and Initial Setup
Prior to running any samples, the BioProfile 100 Plus and BioProfile FLEX analyzers were inspected for proper system function, maintenance needs, and up-to-date software versions. All consumables were inspected to ensure that no sensor or tubing was out of date or past expiration. Replacement of any consumables past expiration was performed. A review of the error logs on the BioProfile FLEX and the BioProfile 100 Plus also showed that there had been no significant hardware related errors on the systems. Reagent pack status was also inspected. To eliminate reagent packs as a source of variability, all reagent packs with less than 50% remaining fluid were replaced. This would ensure that the same reagents were used throughout this multi-day study.
Quality Control Verification
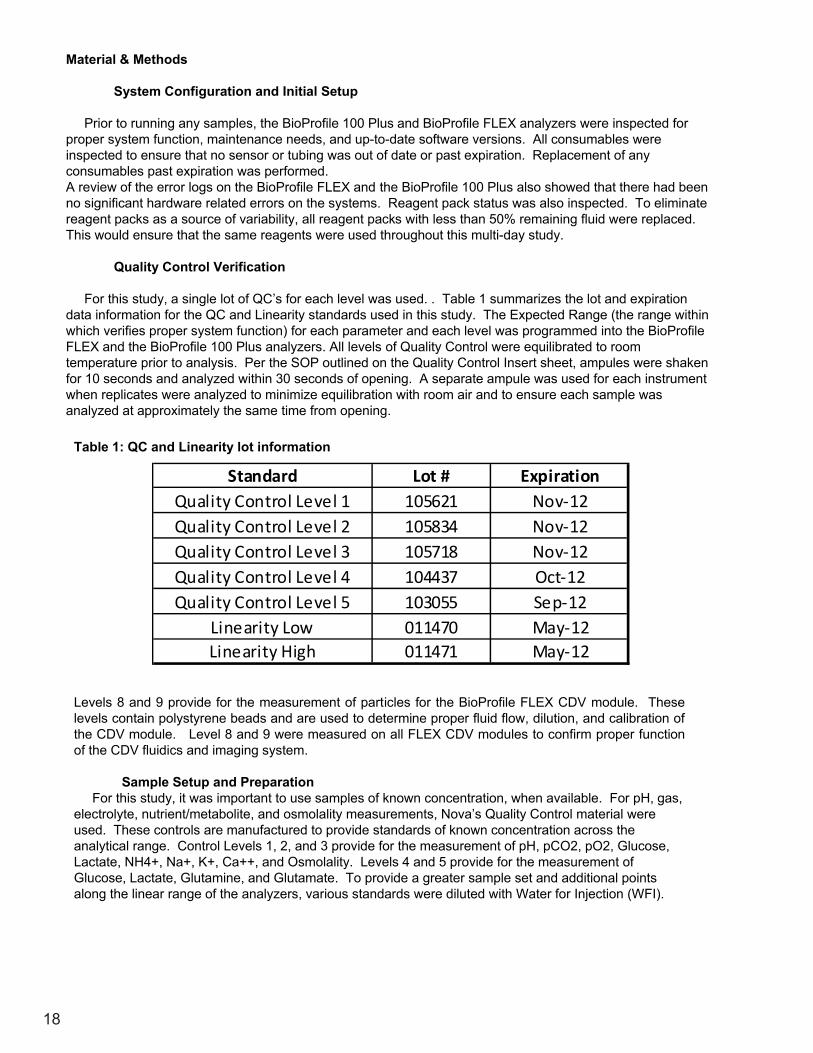
For this study, a single lot of QC’s for each level was used. . Table 1 summarizes the lot and expiration data information for the QC and Linearity standards used in this study. The Expected Range (the range within which verifies proper system function) for each parameter and each level was programmed into the BioProfile FLEX and the BioProfile 100 Plus analyzers. All levels of Quality Control were equilibrated to room temperature prior to analysis. Per the SOP outlined on the Quality Control Insert sheet, ampules were shaken for 10 seconds and analyzed within 30 seconds of opening. A separate ampule was used for each instrument when replicates were analyzed to minimize equilibration with room air and to ensure each sample was analyzed at approximately the same time from opening.
Table 1: QC and Linearity lot information
Levels 8 and 9 provide for the measurement of particles for the BioProfile FLEX CDV module. These levels contain polystyrene beads and are used to determine proper fluid flow, dilution, and calibration of the CDV module. Level 8 and 9 were measured on all FLEX CDV modules to confirm proper function of the CDV fluidics and imaging system.
Sample Setup and PreparationFor this study, it was important to use samples of known concentration, when available. For pH, gas,
electrolyte, nutrient/metabolite, and osmolality measurements, Nova’s Quality Control material were used. These controls are manufactured to provide standards of known concentration across the analytical range. Control Levels 1, 2, and 3 provide for the measurement of pH, pCO2, pO2, Glucose, Lactate, NH4+, Na+, K+, Ca++, and Osmolality. Levels 4 and 5 provide for the measurement of Glucose, Lactate, Glutamine, and Glutamate. To provide a greater sample set and additional points along the linear range of the analyzers, various standards were diluted with Water for Injection (WFI).
Standard Lot # ExpirationQuality Control Level 1 105621 Nov‐12Quality Control Level 2 105834 Nov‐12Quality Control Level 3 105718 Nov‐12Quality Control Level 4 104437 Oct‐12Quality Control Level 5 103055 Sep‐12
Linearity Low 011470 May‐12Linearity High 011471 May‐12
19
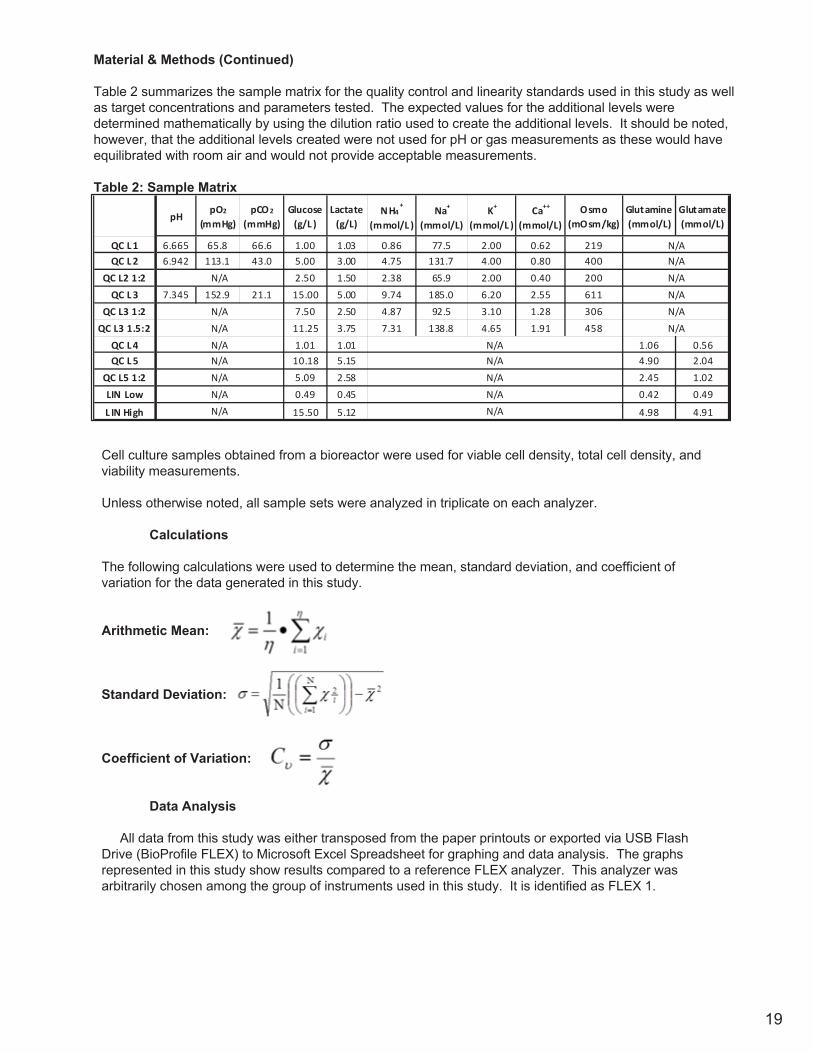
Cell culture samples obtained from a bioreactor were used for viable cell density, total cell density, and viability measurements.
Unless otherwise noted, all sample sets were analyzed in triplicate on each analyzer.
Calculations
The following calculations were used to determine the mean, standard deviation, and coefficient of variation for the data generated in this study.
Arithmetic Mean:
Standard Deviation:
Coefficient of Variation:
Data Analysis
All data from this study was either transposed from the paper printouts or exported via USB Flash Drive (BioProfile FLEX) to Microsoft Excel Spreadsheet for graphing and data analysis. The graphs represented in this study show results compared to a reference FLEX analyzer. This analyzer was arbitrarily chosen among the group of instruments used in this study. It is identified as FLEX 1.
Material & Methods (Continued)
Table 2 summarizes the sample matrix for the quality control and linearity standards used in this study as well as target concentrations and parameters tested. The expected values for the additional levels were determined mathematically by using the dilution ratio used to create the additional levels. It should be noted, however, that the additional levels created were not used for pH or gas measurements as these would have equilibrated with room air and would not provide acceptable measurements.
Table 2: Sample Matrix
pHpO2
(mmHg)pCO2
(mmHg)Glucose (g/L )
Lactate (g/L)
NH4+
(mmol/L )Na+
(mmol/L)K+
(mmol/L )Ca++
(mmol/L)Osmo
(mOsm/kg)Glutamine (mmol/L)
Glutamate (mmol/L)
QC L1 6.665 65.8 66.6 1.00 1.03 0.86 77.5 2.00 0.62 219QC L2 6.942 113.1 43.0 5.00 3.00 4.75 131.7 4.00 0.80 400
QC L2 1:2 2.50 1.50 2.38 65.9 2.00 0.40 200QC L3 7.345 152.9 21.1 15.00 5.00 9.74 185.0 6.20 2.55 611
QC L3 1:2 7.50 2.50 4.87 92.5 3.10 1.28 306QC L3 1.5:2 11.25 3.75 7.31 138.8 4.65 1.91 458
QC L4 1.01 1.01 1.06 0.56QC L5 10.18 5.15 4.90 2.04
QC L5 1:2 5.09 2.58 2.45 1.02LIN Low 0.49 0.45 0.42 0.49
L IN High 15.50 5.12 4.98 4.91
N/A
N/AN/A
N/A
N/AN/AN/AN/AN/A
N/AN/AN/AN/AN/A
N/AN/AN/AN/AN/A
20
Results
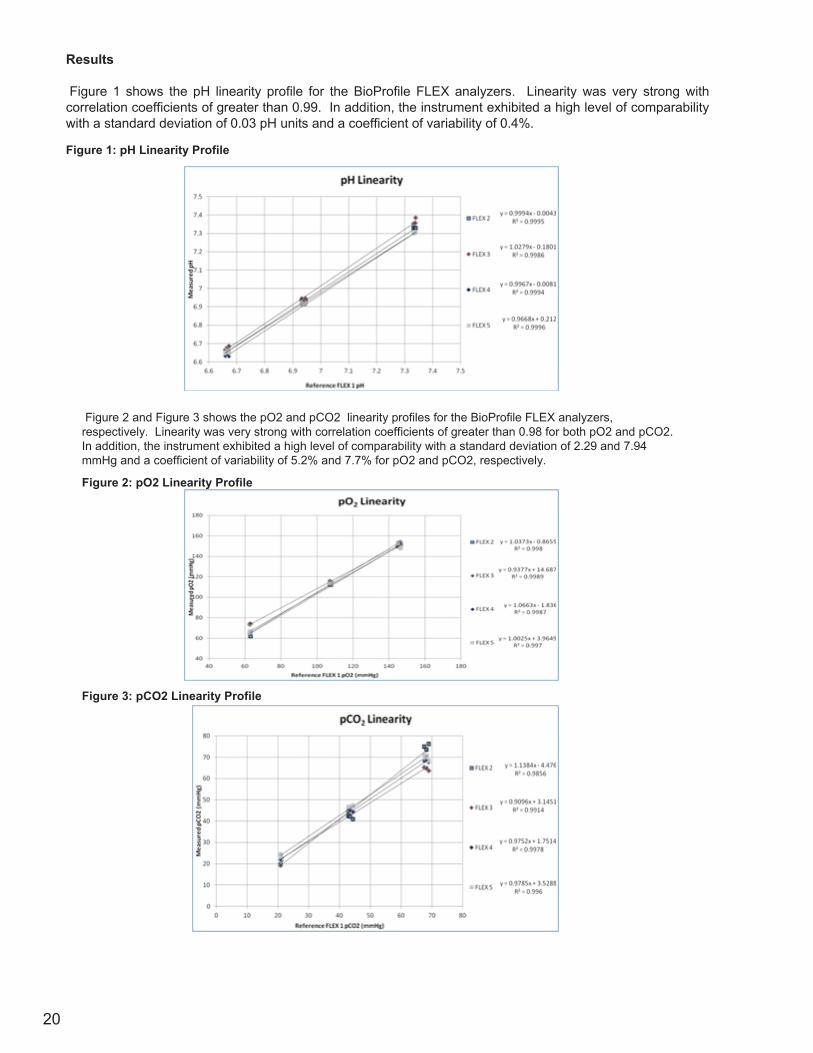
Figure 1 shows the pH linearity profile for the BioProfile FLEX analyzers. Linearity was very strong with correlation coefficients of greater than 0.99. In addition, the instrument exhibited a high level of comparability with a standard deviation of 0.03 pH units and a coefficient of variability of 0.4%.
Figure 1: pH Linearity Profile
Figure 2 and Figure 3 shows the pO2 and pCO2 linearity profiles for the BioProfile FLEX analyzers, respectively. Linearity was very strong with correlation coefficients of greater than 0.98 for both pO2 and pCO2. In addition, the instrument exhibited a high level of comparability with a standard deviation of 2.29 and 7.94 mmHg and a coefficient of variability of 5.2% and 7.7% for pO2 and pCO2, respectively.
Figure 2: pO2 Linearity Profile
Figure 3: pCO2 Linearity Profile

21
Results
Figure 4 and Figure 5 show the glucose and lactate linearity profiles for the BioProfile analyzers, respectively. Linearity was very strong with correlation coefficients of greater than 0.99 for both glucose and lactate. In addition, the instrument exhibited a high level of comparability with a standard deviation of 0.11 and 0.06 g/L and a coefficient of variability of 4.9% and 2.9% for glucose and lactate, respectively.
Figure 4: Glucose Linearity Profile
Figure 5: Lactate Linearity Profile
Figure 6 and Figure 7 show the glutamine and glutamate linearity profiles for the BioProfile analyzers, respectively. Linearity was strong with correlation coefficients of greater than 0.97 for both glutamine and glutamate. In addition, the instrument exhibited a high level of comparability with a standard deviation of 0.13 and 0.07 mmol/L and a coefficient of variability of 6.0% and 5.2% for glutamine and glutamate, respectively.
It should be noted that the linearity and variability for glutamine are not as strong for as the other parameters tested. Though the samples were controlled in the best possible manner (samples stored on ice prior to analysis), the instability of glutamine often results in unusually high variability in large experiments such as this.

22
Results
Figure 6: Glucose Linearity Profile
Figure 7: Lactate Linearity Profile
Figure 8 shows the osmolality linearity profile for the BioProfile FLEX analyzers. Linearity was very strong with correlation coefficients of greater than 0.999. In addition, the instrument exhibited a high level of comparability with a standard deviation of 2.99 mOsm/kg pH units and a coefficient of variability of 1.0%.
Figure 8: Osmolality Linearity Profile
23
Results
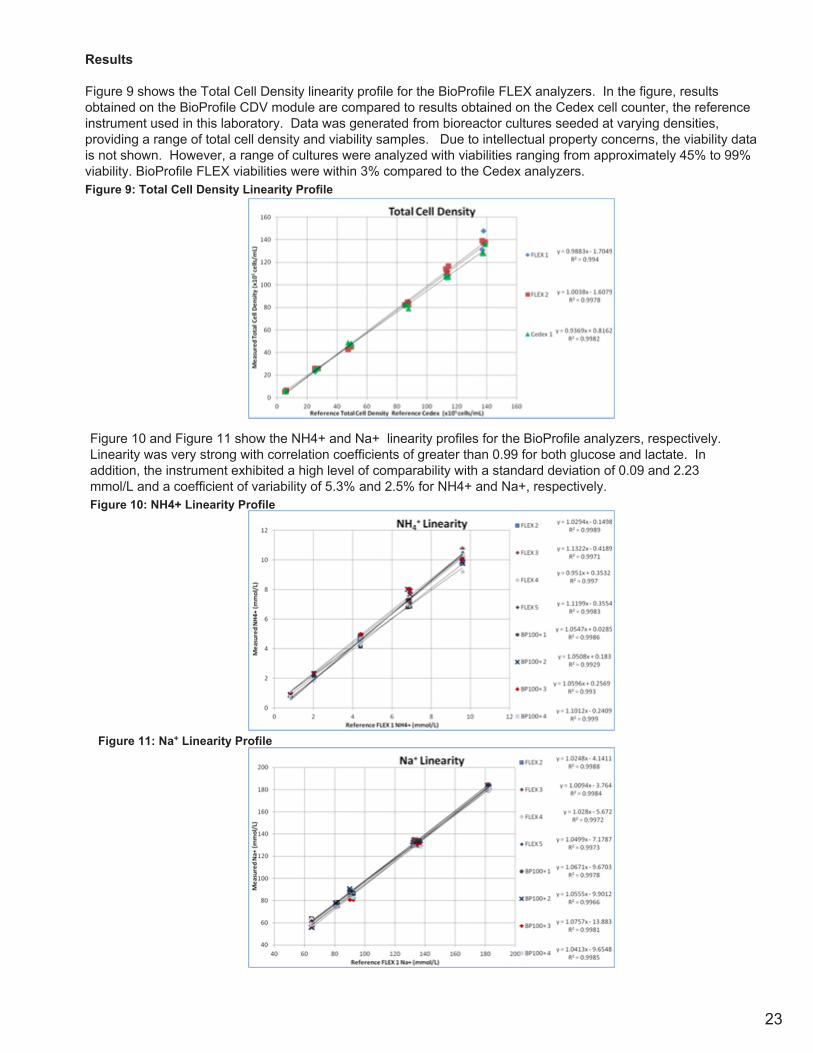
Figure 9 shows the Total Cell Density linearity profile for the BioProfile FLEX analyzers. In the figure, results obtained on the BioProfile CDV module are compared to results obtained on the Cedex cell counter, the reference instrument used in this laboratory. Data was generated from bioreactor cultures seeded at varying densities, providing a range of total cell density and viability samples. Due to intellectual property concerns, the viability data is not shown. However, a range of cultures were analyzed with viabilities ranging from approximately 45% to 99% viability. BioProfile FLEX viabilities were within 3% compared to the Cedex analyzers.Figure 9: Total Cell Density Linearity Profile
Figure 10 and Figure 11 show the NH4+ and Na+ linearity profiles for the BioProfile analyzers, respectively. Linearity was very strong with correlation coefficients of greater than 0.99 for both glucose and lactate. In addition, the instrument exhibited a high level of comparability with a standard deviation of 0.09 and 2.23 mmol/L and a coefficient of variability of 5.3% and 2.5% for NH4+ and Na+, respectively. Figure 10: NH4+ Linearity Profile
Figure 11: Na+ Linearity Profile
24
Results
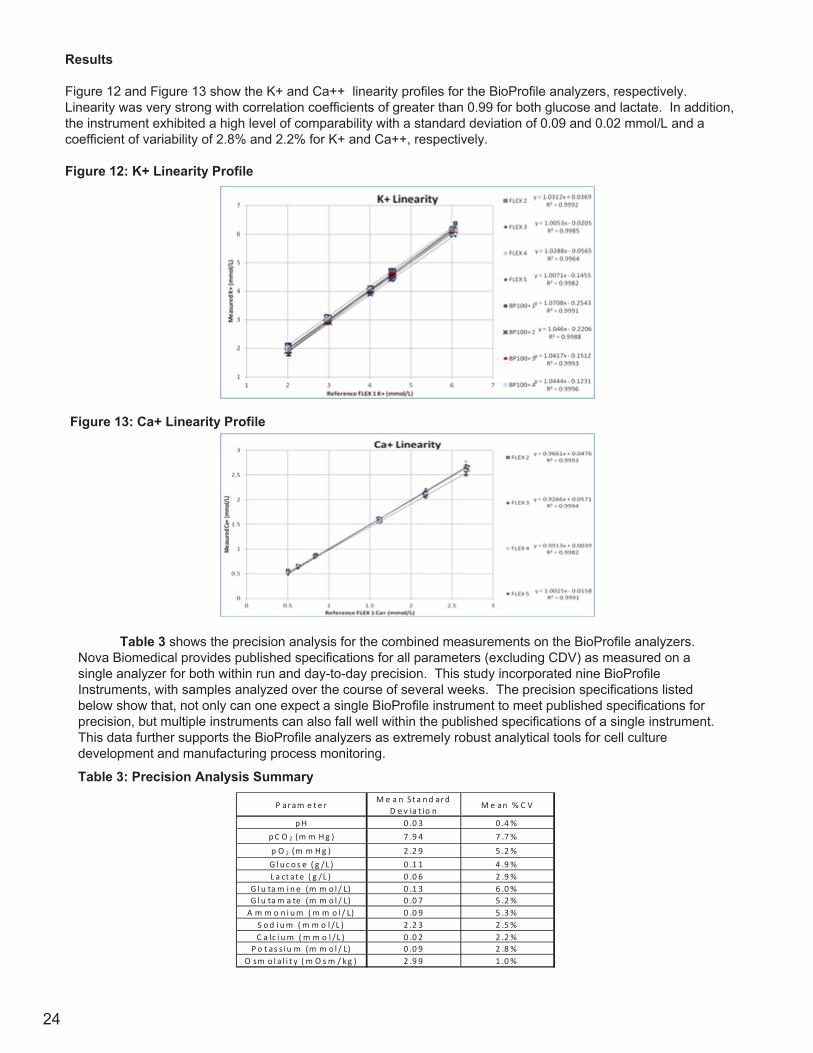
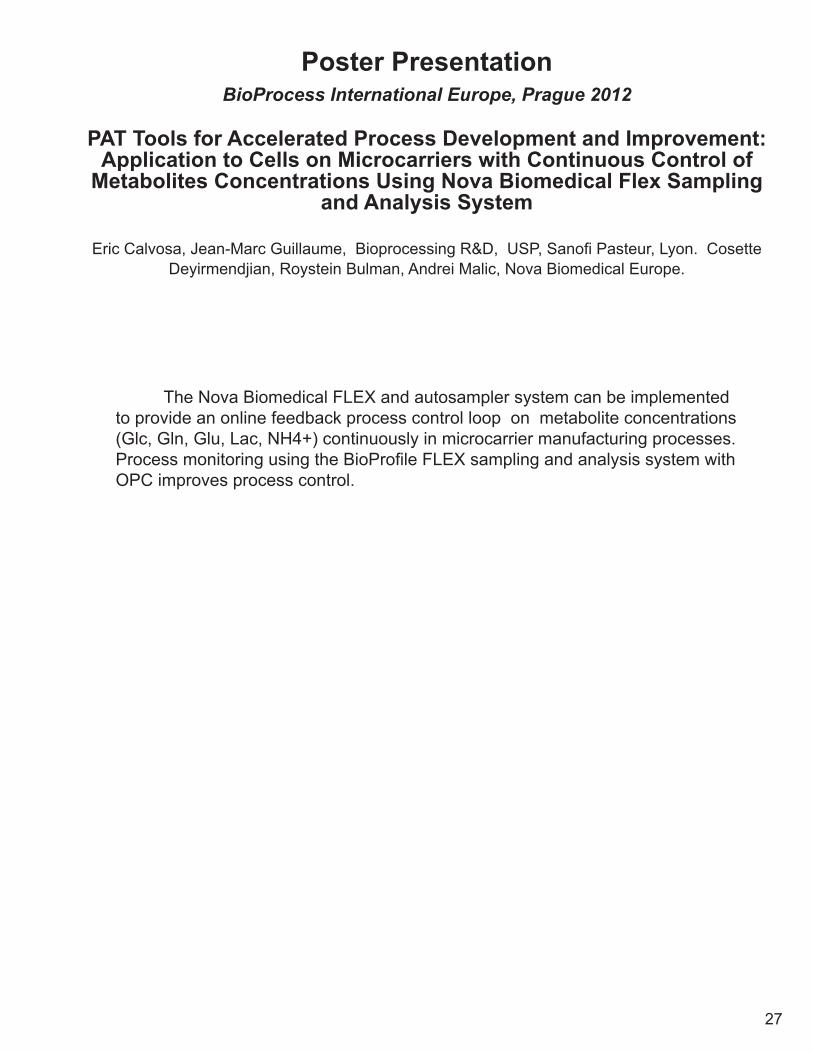
Figure 12 and Figure 13 show the K+ and Ca++ linearity profiles for the BioProfile analyzers, respectively. Linearity was very strong with correlation coefficients of greater than 0.99 for both glucose and lactate. In addition, the instrument exhibited a high level of comparability with a standard deviation of 0.09 and 0.02 mmol/L and a coefficient of variability of 2.8% and 2.2% for K+ and Ca++, respectively.
Figure 12: K+ Linearity Profile
Figure 13: Ca+ Linearity Profile
Table 3 shows the precision analysis for the combined measurements on the BioProfile analyzers. Nova Biomedical provides published specifications for all parameters (excluding CDV) as measured on a single analyzer for both within run and day-to-day precision. This study incorporated nine BioProfile Instruments, with samples analyzed over the course of several weeks. The precision specifications listed below show that, not only can one expect a single BioProfile instrument to meet published specifications for precision, but multiple instruments can also fall well within the published specifications of a single instrument. This data further supports the BioProfile analyzers as extremely robust analytical tools for cell culture development and manufacturing process monitoring.
Table 3: Precision Analysis Summary
P aram e t e rM e a n St a nd ard
D e v ia t io nM e an % C V
pH 0 .0 3 0 .4%pC O 2 (m m Hg ) 7 .9 4 7 .7%p O 2 (m m Hg ) 2 .2 9 5 .2%G l u c o s e ( g /L ) 0 .1 1 4 .9%L a ct at e ( g /L ) 0 .0 6 2 .9%
G l u tam i ne (m m o l / L) 0 .1 3 6 .0%G l u tam a te (m m o l / L) 0 .0 7 5 .2%A m m o n i um ( m m o l / L) 0 .0 9 5 .3%
S od i um ( m m o l /L ) 2 .2 3 2 .5%C a lc i um ( m m o l /L ) 0 .0 2 2 .2%
Po t as si u m (m m o l / L) 0 .0 9 2 .8%O sm o l al i t y ( m O sm / kg ) 2 .9 9 1 .0%

25
Summary
In this study, the BioProfile analyzers have proven to be extremely robust and reliable, while providing high quality data that cell culture scientists and engineers demand.
The results of this study show a high level of comparability between the BioProfile analyzers, not only among the same analyzers but across platforms. In addition, comparability was also demonstrated between both the new and aged analyzers, providing evidence of the long-term robustness and the quality of data can be generated from the BioProfile analyzers. Nova Biomedical’s BioProfile analyzers provide the tools to facilitate multisite bioprocess transfer in the Biopharmaceutical industry.
As a result of data generated in this study and proof of comparability between BioProfile® systems, this Biopharmaceutical company has fully integrated Nova’s analyzers for use in their cell culture development and manufacturing. The data presented proved complete comparability of results across multiple sites.

26
27
Poster PresentationBioProcess International Europe, Prague 2012
PAT Tools for Accelerated Process Development and Improvement: Application to Cells on Microcarriers with Continuous Control of
Metabolites Concentrations Using Nova Biomedical Flex Sampling and Analysis System
Eric Calvosa, Jean-Marc Guillaume, Bioprocessing R&D, USP, Sanofi Pasteur, Lyon. Cosette Deyirmendjian, Roystein Bulman, Andrei Malic, Nova Biomedical Europe.
The Nova Biomedical FLEX and autosampler system can be implemented to provide an online feedback process control loop on metabolite concentrations (Glc, Gln, Glu, Lac, NH4+) continuously in microcarrier manufacturing processes.Process monitoring using the BioProfile FLEX sampling and analysis system with OPC improves process control.

28
291
I Vero Cell Kinetics
II Virus Infected Cells
Figure: Sartorius Bioreactor connected by OPC to the Nova sampling and analysis system
Materials :‐ Vero cell line in serum free medium culture‐Microcarrier : cytodex 1 at 3 g/L‐Medium added continuously by Ismatec pump‐ Nova Biomedical FLEX and online autosampler‐ FISP® Sampling Probes with porosity at 0.2 and 20 µm
Methods :Vero cells were expanded in serum free medium on cytodex 1. A fed‐batch process was applied with continuous injection of media with different glucose and glutamine concentration to control metabolism.
Specific OPC from Nova Biomedical was connected to the MFCS controller from Sartorius to control and track glutamine and glucose concentration. Three conditions were established. The first condition was without regulation of metabolites. The second condition was a Vero cell culture with OPC control, and the last condition was virus productivity with continuous feedback control in response to the monitoring of metabolite consumption kinetics with the Nova Biomedical analysis system.
PAT Tools for accelerated process development and improvement: Application to cells on microcarriers with continuous control of metabolites concentrations using
Nova Biomedical FLEX sampling and analysis systemEric Calvosa, Jean-Marc Guillaume, Bioprocessing R&D, USP, Sanofi Pasteur, Lyon. Cosette Deyirmendjian, Roystein Bulman,
Andrei Malic, Nova Biomedical Europe. BioProcess International, Prague 2012
Conclusion: The Nova Biomedical FLEX and autosampler system can be implemented to provide an online feedback process control loop on metabolite concentrations (Glc, Gln, Glu, Lac, NH4+) continuously in microcarrier manufacturing processes.
Summary
Materials and Methods
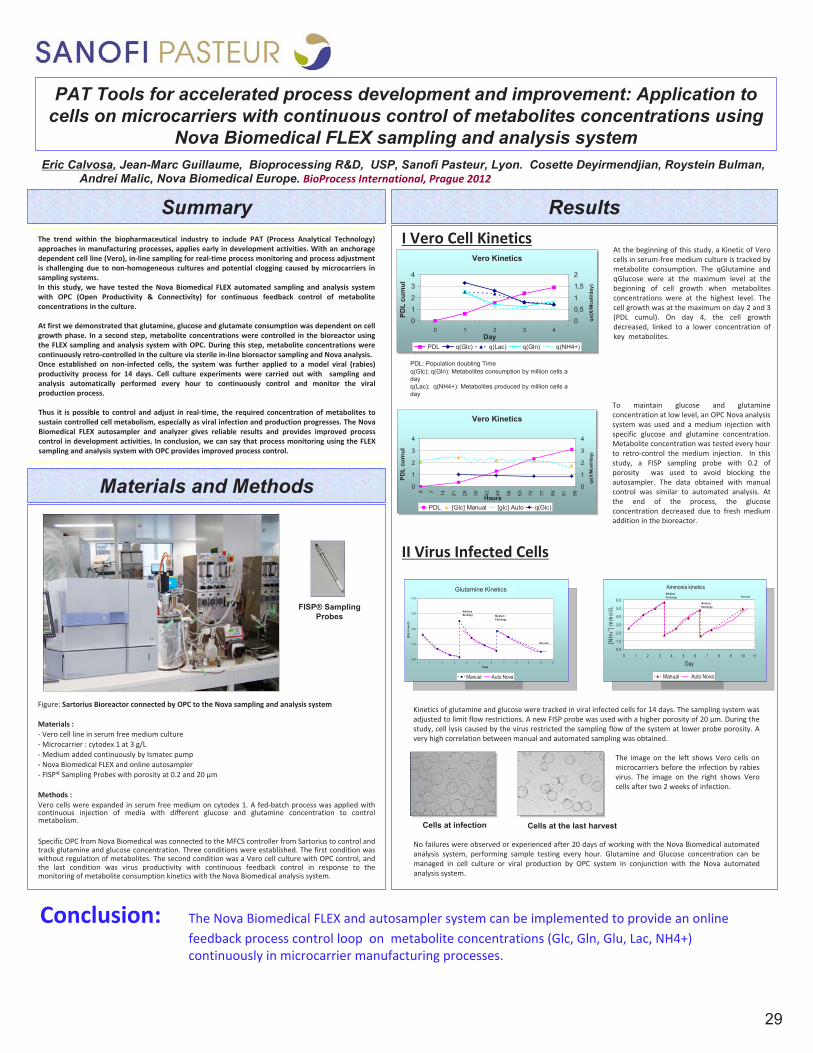
ResultsThe trend within the biopharmaceutical industry to include PAT (Process Analytical Technology) approaches in manufacturing processes, applies early in development activities. With an anchorage dependent cell line (Vero), in‐line sampling for real‐time process monitoring and process adjustment is challenging due to non‐homogeneous cultures and potential clogging caused by microcarriers in sampling systems.In this study, we have tested the Nova Biomedical FLEX automated sampling and analysis system with OPC (Open Productivity & Connectivity) for continuous feedback control of metabolite concentrations in the culture.
At first we demonstrated that glutamine, glucose and glutamate consumption was dependent on cell growth phase. In a second step, metabolite concentrations were controlled in the bioreactor using the FLEX sampling and analysis system with OPC. During this step, metabolite concentrations were continuously retro‐controlled in the culture via sterile in‐line bioreactor sampling and Nova analysis.Once established on non‐infected cells, the system was further applied to a model viral (rabies) productivity process for 14 days. Cell culture experiments were carried out with sampling and analysis automatically performed every hour to continuously control and monitor the viral production process.
Thus it is possible to control and adjust in real‐time, the required concentration of metabolites to sustain controlled cell metabolism, especially as viral infection and production progresses. The Nova Biomedical FLEX autosampler and analyzer gives reliable results and provides improved process control in development activities. In conclusion, we can say that process monitoring using the FLEX sampling and analysis system with OPC provides improved process control.
FISP® Sampling Probes
At the beginning of this study, a Kinetic of Vero cells in serum‐free medium culture is tracked by metabolite consumption. The qGlutamine and qGlucose were at the maximum level at the beginning of cell growth when metabolites concentrations were at the highest level. The cell growth was at the maximum on day 2 and 3 (PDL cumul). On day 4, the cell growth decreased, linked to a lower concentration of key metabolites.
PDL: Population doubling Timeq(Glc); q(Gln): Metabolites consumption by million cells a day q(Lac); q(NH4+): Metabolites produced by million cells a day
To maintain glucose and glutamine concentration at low level, an OPC Nova analysis system was used and a medium injection with specific glucose and glutamine concentration. Metabolite concentration was tested every hour to retro‐control the medium injection. In this study, a FISP sampling probe with 0.2 of porosity was used to avoid blocking the autosampler. The data obtained with manual control was similar to automated analysis. At the end of the process, the glucose concentration decreased due to fresh medium addition in the bioreactor.
Kinetics of glutamine and glucose were tracked in viral infected cells for 14 days. The sampling system was adjusted to limit flow restrictions. A new FISP probe was used with a higher porosity of 20 µm. During the study, cell lysis caused by the virus restricted the sampling flow of the system at lower probe porosity. A very high correlation between manual and automated sampling was obtained.
The image on the left shows Vero cells on microcarriers before the infection by rabies virus. The image on the right shows Vero cells after two 2 weeks of infection.
No failures were observed or experienced after 20 days of working with the Nova Biomedical automated analysis system, performing sample testing every hour. Glutamine and Glucose concentration can be managed in cell culture or viral production by OPC system in conjunction with the Nova automated analysis system.
Cells at infection Cells at the last harvest
Glutamin kinetics
0.00
1.00
2.00
3.00
4.00
0 1 2 3 4 5 6 7 8 9 10 11
Days
[Gln
] mm
ol/L
Manual Auto Nova
Medium Exchange
A
Medium Exchange
Harvest
Glutamin kinetics
0.00
1.00
2.00
3.00
4.00
0 1 2 3 4 5 6 7 8 9 10 11
Days
[Gln
] mm
ol/L
Manual Auto Nova
Medium Exchange
A
Medium Exchange
Harvest
Ammonia kinetics
0.0
1.0
2.0
3.0
4.0
5.0
6.0
0 1 2 3 4 5 6 7 8 9 10 11
Day
[NH
4+ ] mm
ol/L
Manual Auto Nova
A
HarvestMedium Exchange
Medium Exchange
Ammonia kinetics
0.0
1.0
2.0
3.0
4.0
5.0
6.0
0 1 2 3 4 5 6 7 8 9 10 11
Day
[NH
4+ ] mm
ol/L
Manual Auto Nova
A
HarvestMedium Exchange
Medium Exchange
Vero Kinetics
0
1
2
3
4
0 7 14 21 28 35 42 49 56 63 70 77 84 91 98Hours
PDL
cum
ul
0
1
2
3
4
qx(X
/Mce
ll/da
y)
PDL [Glc] Manual [glc] Auto q(Glc)
Vero Kinetics
0
1
2
3
4
0 7 14 21 28 35 42 49 56 63 70 77 84 91 98Hours
PDL
cum
ul
0
1
2
3
4
qx(X
/Mce
ll/da
y)
PDL [Glc] Manual [glc] Auto q(Glc)
Vero Kinetics
012
34
0 1 2 3 4Day
PDL
cum
ul
00,51
1,52
qx(X
/Mce
ll/da
y)
PDL q(Glc) q(Lac) q(Gln) q(NH4+)
Vero Kinetics
012
34
0 1 2 3 4Day
PDL
cum
ul
00,51
1,52
qx(X
/Mce
ll/da
y)
PDL q(Glc) q(Lac) q(Gln) q(NH4+)
Glutamine Kinetics

30
31
Poster PresentationIBC, Carlsbad CA, 2010
Performance Evaluation of an Automated Bioreactor Sampling System for Mammalian Cell Cultivation
Kavi Mehta, Erwin Y. Yu, Susan Casnocha
BioTherapeutics Pharm Sci, Pfizer Inc, St. Louis, MO 63017
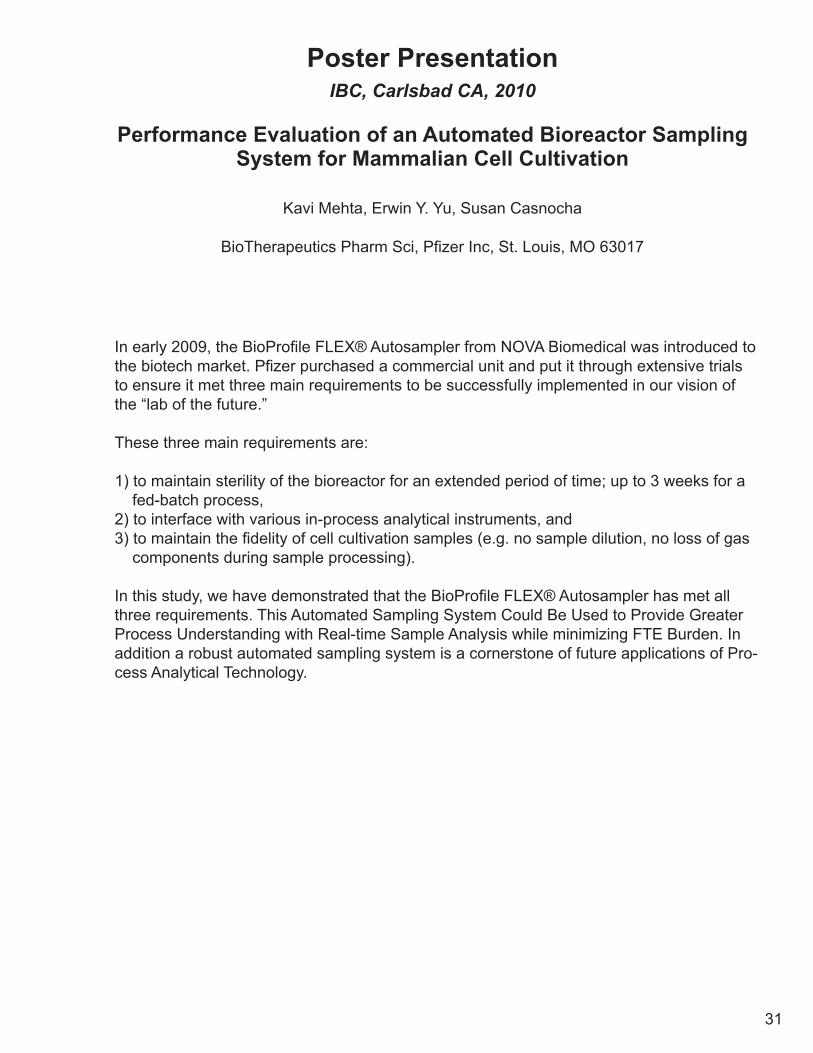
In early 2009, the BioProfile FLEX® Autosampler from NOVA Biomedical was introduced to the biotech market. Pfizer purchased a commercial unit and put it through extensive trials to ensure it met three main requirements to be successfully implemented in our vision of the “lab of the future.”
These three main requirements are:
1) to maintain sterility of the bioreactor for an extended period of time; up to 3 weeks for a fed-batch process, 2) to interface with various in-process analytical instruments, and 3) to maintain the fidelity of cell cultivation samples (e.g. no sample dilution, no loss of gas components during sample processing).
In this study, we have demonstrated that the BioProfile FLEX® Autosampler has met all three requirements. This Automated Sampling System Could Be Used to Provide Greater Process Understanding with Real-time Sample Analysis while minimizing FTE Burden. In addition a robust automated sampling system is a cornerstone of future applications of Pro-cess Analytical Technology.

32
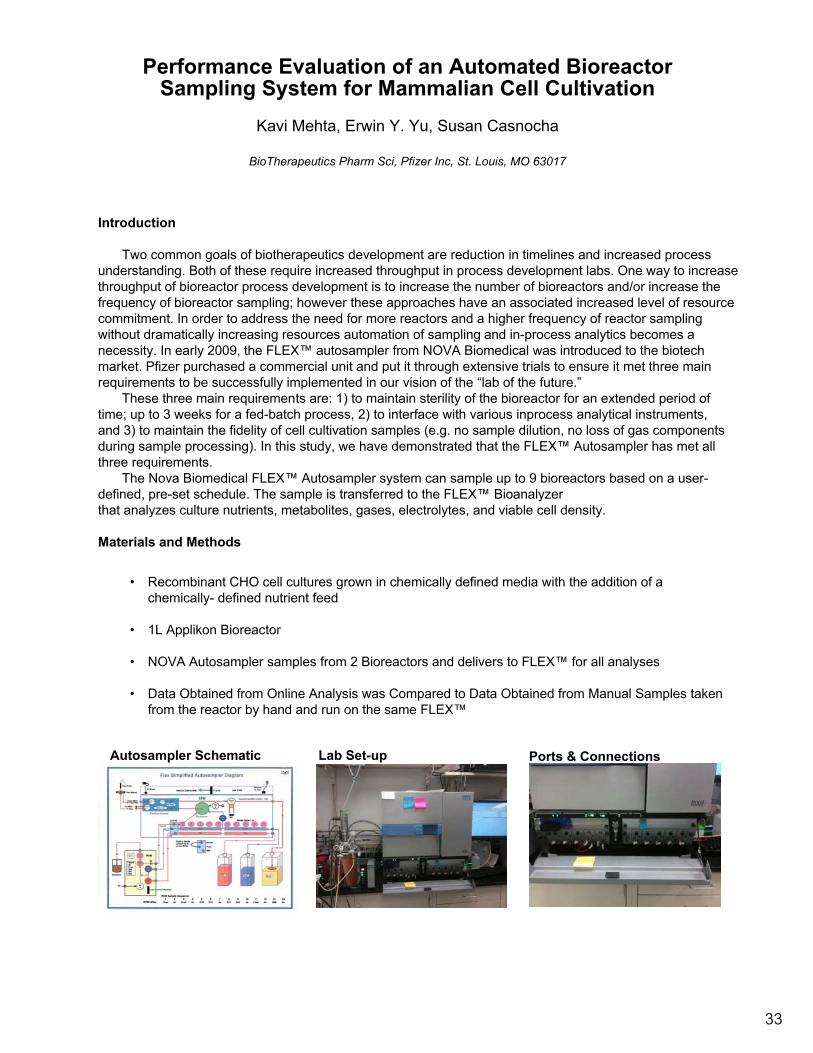
33
Performance Evaluation of an Automated Bioreactor Sampling System for Mammalian Cell Cultivation
Kavi Mehta, Erwin Y. Yu, Susan Casnocha
BioTherapeutics Pharm Sci, Pfizer Inc, St. Louis, MO 63017
Introduction
Two common goals of biotherapeutics development are reduction in timelines and increased process understanding. Both of these require increased throughput in process development labs. One way to increase throughput of bioreactor process development is to increase the number of bioreactors and/or increase the frequency of bioreactor sampling; however these approaches have an associated increased level of resource commitment. In order to address the need for more reactors and a higher frequency of reactor sampling without dramatically increasing resources automation of sampling and in-process analytics becomes a necessity. In early 2009, the FLEX™ autosampler from NOVA Biomedical was introduced to the biotech market. Pfizer purchased a commercial unit and put it through extensive trials to ensure it met three main requirements to be successfully implemented in our vision of the “lab of the future.”
These three main requirements are: 1) to maintain sterility of the bioreactor for an extended period of time; up to 3 weeks for a fed-batch process, 2) to interface with various inprocess analytical instruments, and 3) to maintain the fidelity of cell cultivation samples (e.g. no sample dilution, no loss of gas components during sample processing). In this study, we have demonstrated that the FLEX™ Autosampler has met all three requirements.
The Nova Biomedical FLEX™ Autosampler system can sample up to 9 bioreactors based on a user-defined, pre-set schedule. The sample is transferred to the FLEX™ Bioanalyzerthat analyzes culture nutrients, metabolites, gases, electrolytes, and viable cell density.
Materials and Methods
• Recombinant CHO cell cultures grown in chemically defined media with the addition of a chemically- defined nutrient feed
• 1L Applikon Bioreactor
• NOVA Autosampler samples from 2 Bioreactors and delivers to FLEX™ for all analyses
• Data Obtained from Online Analysis was Compared to Data Obtained from Manual Samples taken from the reactor by hand and run on the same FLEX™
Autosampler Schematic Lab Set-up Ports & Connections
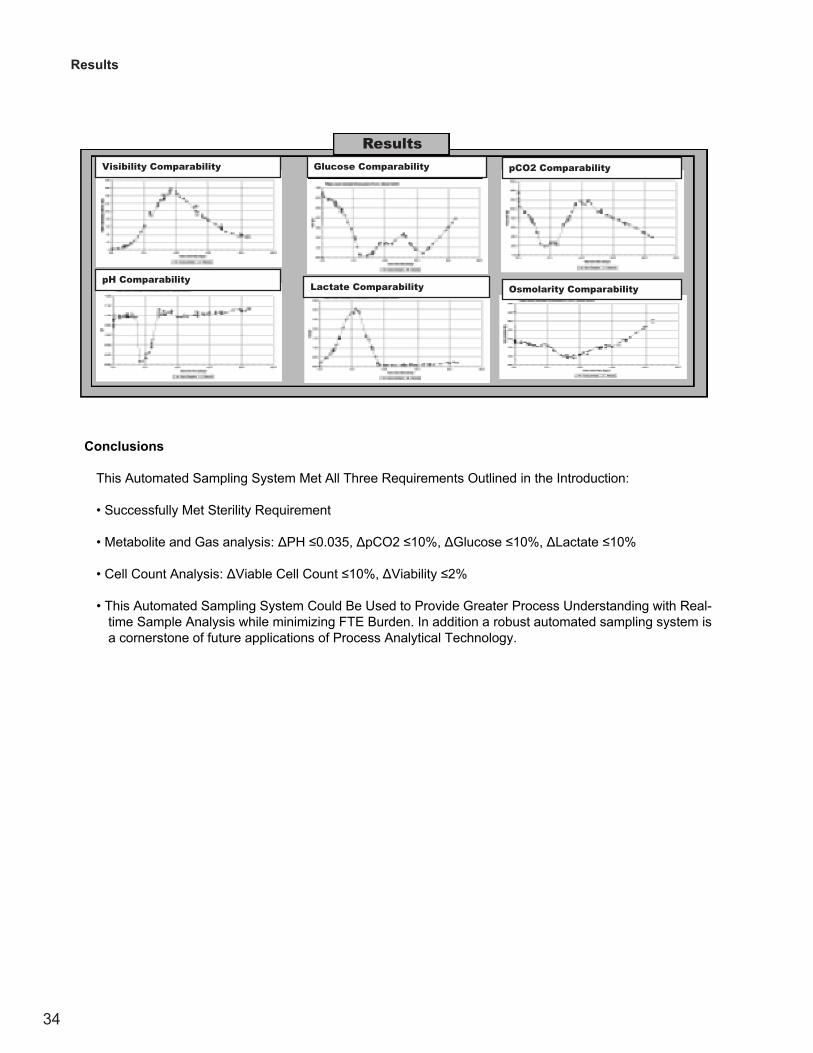
34
Conclusions
This Automated Sampling System Met All Three Requirements Outlined in the Introduction:
• Successfully Met Sterility Requirement
• Metabolite and Gas analysis: ∆PH ≤0.035, ∆pCO2 ≤10%, ∆Glucose ≤10%, ∆Lactate ≤10%
• Cell Count Analysis: ∆Viable Cell Count ≤10%, ∆Viability ≤2%
• This Automated Sampling System Could Be Used to Provide Greater Process Understanding with Real-time Sample Analysis while minimizing FTE Burden. In addition a robust automated sampling system is a cornerstone of future applications of Process Analytical Technology.
Results
Visibility Comparability
pH Comparability
Glucose Comparability
Lactate Comparability
pCO2 Comparability
Osmolarity Comparability
Results
35
Poster PresentationBioProcess International Conference, San Fransisco CA, 2006
Consolidated Single Analyzer Measurement of Key Cell Culture Constituents in the Development of Mammalian Cell Processes
Carissa M. Moore and Jean-François P. Hamel
Department of Chemical EngineeringMassachusetts Institute of Technology, Cambridge, MA 02139
The goal of this study was to evaluate the results produced by one fully integrated instrument (BioProfile FLEX) in comparison to other established and separate analyzers. The BioProfile FLEX instrument successfully processed cell culture samples and measured cell concentration, cell viability, and osmolality in addition to nutrient and metabolite concentrations. BioProfile FLEX uses an improved sample dilution system which is different from BioProfile 400. This difference can account for some degree of variance between the measurements of the two instruments. The integrity of the nutrient and metabolite measurements was maintained in BioProfile FLEX as compared to BioProfile 400, with R2 values for pH, ammonium, glutamine, and glucose ranging from 0.99 – 0.94.

36

37
Consolidated Single Analyzer Measurement of Key Cell Culture Constituents in the Development of
Mammalian Cell ProcessesCarissa M. Moore and Jean-François P. Hamel
Department of Chemical EngineeringMassachusetts Institute of Technology, Cambridge, MA 02139
Background
In a typical cell culture process for making therapeutics, cultures need to be closely monitored for their viability, genetic stability, production potential, and for potential contamination. It is essential that the levels of key nutrients and metabolites as well as cell concentration be known. This allows the operator to maintain the culture appropriately, by using the correct feeding strategy and being aware of the changes in the culture and cell metabolism during the process. Typically, when cell culture samples are taken, they must be analyzed for cell concentration, nutrient and metabolite concentrations, and osmolality on separate instruments. This process is time consuming, requires multiple sample transfers, and can make data collection cumbersome. Nova BioProfile® FLEX simplifies this complex monitoring system by allowing all of these analyses to occur and data to be collected in one place.
The BioProfile FLEX instrument under study incorporates a Cell Density and Viability analyzer along with a Freezing Point Osmometer and a Chemistry analyzer. For Cell Density and Viability measurements, BioProfile FLEX uses an automated Trypan Blue dye exclusion assay similar to that used by current technologies, such as the CEDEX cell counter. One major difference between the CEDEX and BioProfile FLEX is the method of sample positioning. In the BioProfile FLEX analyzer, the sample is allowed to settle on a slide and the flowcell is then moved from one position to the next as the camera in the Image Processing System takes one image at each position and processes the result. Conversely, in the CEDEX, the flowcell is stationary while the sample is passed by the camera as images are taken. This difference allows BioProfile FLEX to have more precise focus and display clearer images. BioProfile FLEX contains an Advanced Instruments Freezing Point Osmometer, which is essentially equivalent to their model 210 Osmometer. However, BioProfile FLEX incorporates a 20-sample tray that results in less frequent operator maintenance because the sample tubes need only to be changed every 20 samples rather than be prepared for each sample. Also, the Osmometersample is pipetted directly into the sample tube avoiding themanual step in the 210.
When incorporating multiple modules into a single analyzer, it is important that the time sequence for sample analysis take into account both time sensitive tests and efficiency. BioProfile FLEX accomplishes this by measuring gases and electrolytes first, followed by cell density, osmolality, and finally, nutrients and metabolites.
Objectives
The goal of this research is to evaluate the results produced by one fully integrated instrument (BioProfile FLEX) in comparison to other established and separate analyzers. The study uses samples from CHO cells, hybridoma cells, and cancer cells to compare the performance of BioProfile FLEX to a chemistry analyzer (Nova BioProfile 400), an automated cell counter (CEDEX), and an Osmometer (Advanced Instruments 210). Use of these instruments and cell lines allows Bio- Profile FLEX to be evaluated for a number of important parameters including such as pH, ammonium, glutamine, glucose, cell concentration and viability, and osmolality. This study will test the validity of BioProfile FLEX’s cell concentration and osmolalityanalysis and determine if these typically separate analyzers can successfully be incorporated with nutrient and metabolite analysis while maintaining the integrity of all measurements. This comparison will be done using alinear regression of the data from BioProfile FLEX compared to the corresponding data from individual reference analyzers. Only samples taken when the instruments meet quality control specifications and that are within the instruments’ range will be included.
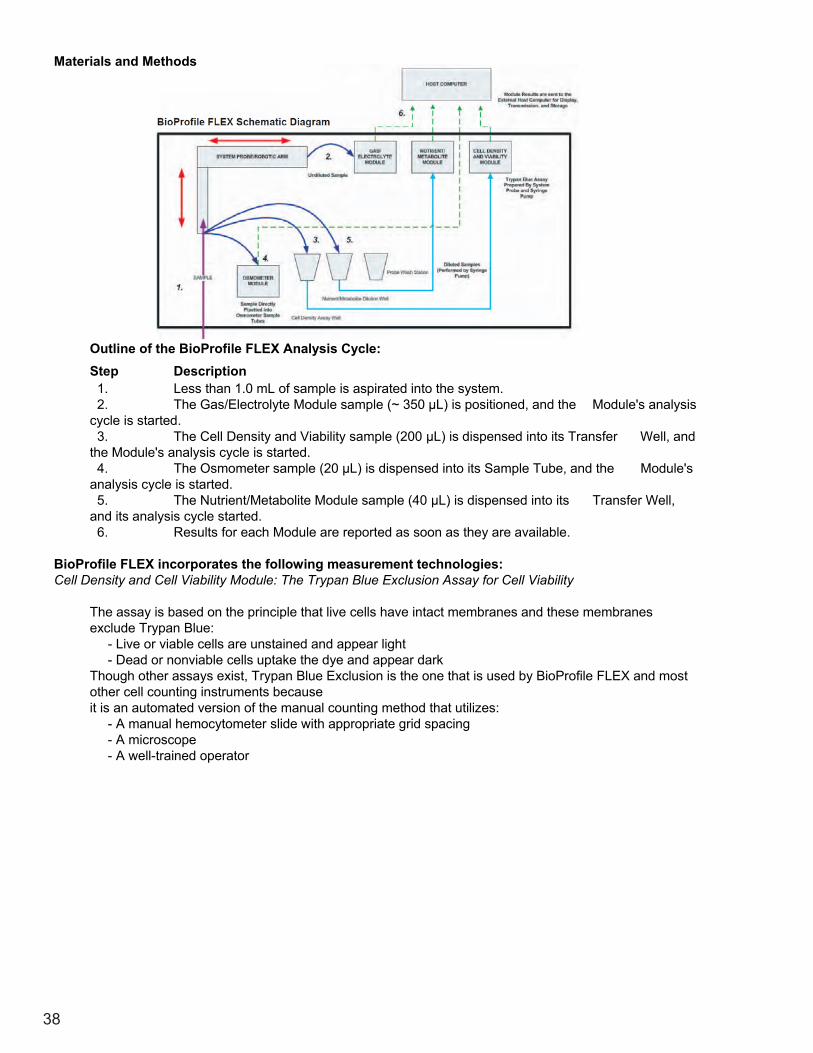
38
Materials and Methods
Outline of the BioProfile FLEX Analysis Cycle:Step Description1. Less than 1.0 mL of sample is aspirated into the system.2. The Gas/Electrolyte Module sample (~ 350 μL) is positioned, and the Module's analysis
cycle is started.3. The Cell Density and Viability sample (200 μL) is dispensed into its Transfer Well, and
the Module's analysis cycle is started.4. The Osmometer sample (20 μL) is dispensed into its Sample Tube, and the Module's
analysis cycle is started.5. The Nutrient/Metabolite Module sample (40 μL) is dispensed into its Transfer Well,
and its analysis cycle started.6. Results for each Module are reported as soon as they are available.
BioProfile FLEX incorporates the following measurement technologies:Cell Density and Cell Viability Module: The Trypan Blue Exclusion Assay for Cell Viability
The assay is based on the principle that live cells have intact membranes and these membranes exclude Trypan Blue:
- Live or viable cells are unstained and appear light- Dead or nonviable cells uptake the dye and appear dark
Though other assays exist, Trypan Blue Exclusion is the one that is used by BioProfile FLEX and most other cell counting instruments becauseit is an automated version of the manual counting method that utilizes:
- A manual hemocytometer slide with appropriate grid spacing- A microscope- A well-trained operator
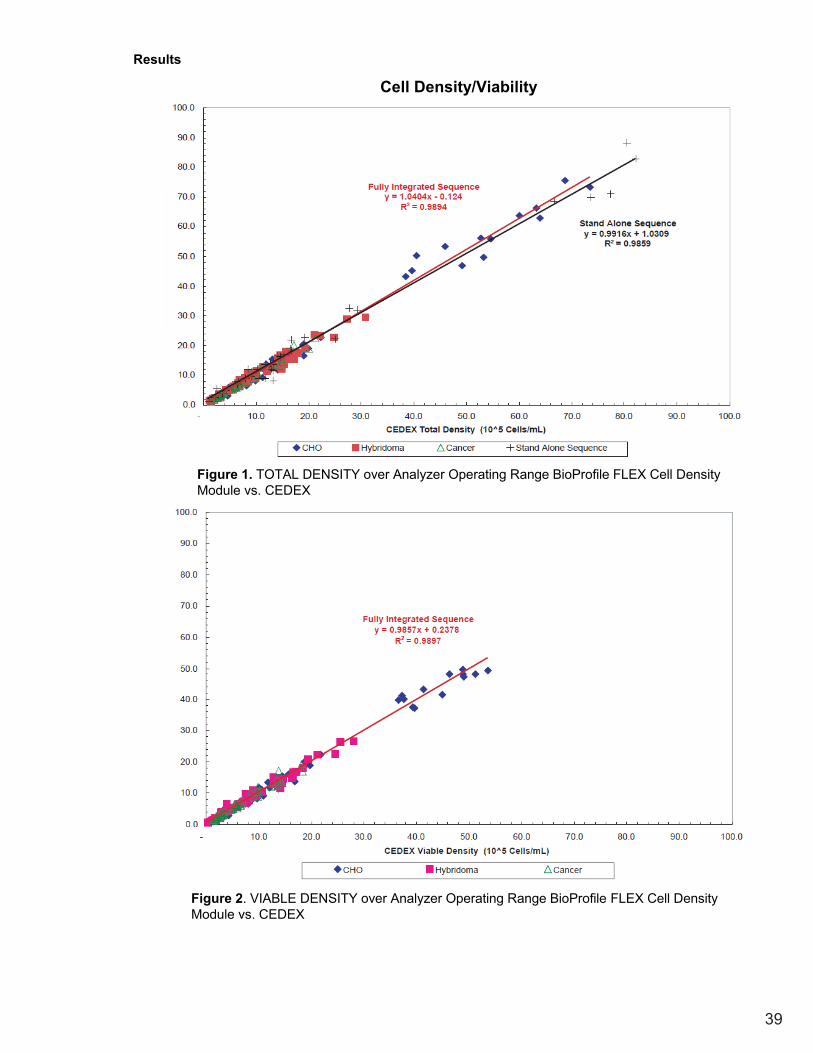
39
Results
Cell Density/Viability
Figure 1. TOTAL DENSITY over Analyzer Operating Range BioProfile FLEX Cell Density Module vs. CEDEX
Figure 2. VIABLE DENSITY over Analyzer Operating Range BioProfile FLEX Cell Density Module vs. CEDEX
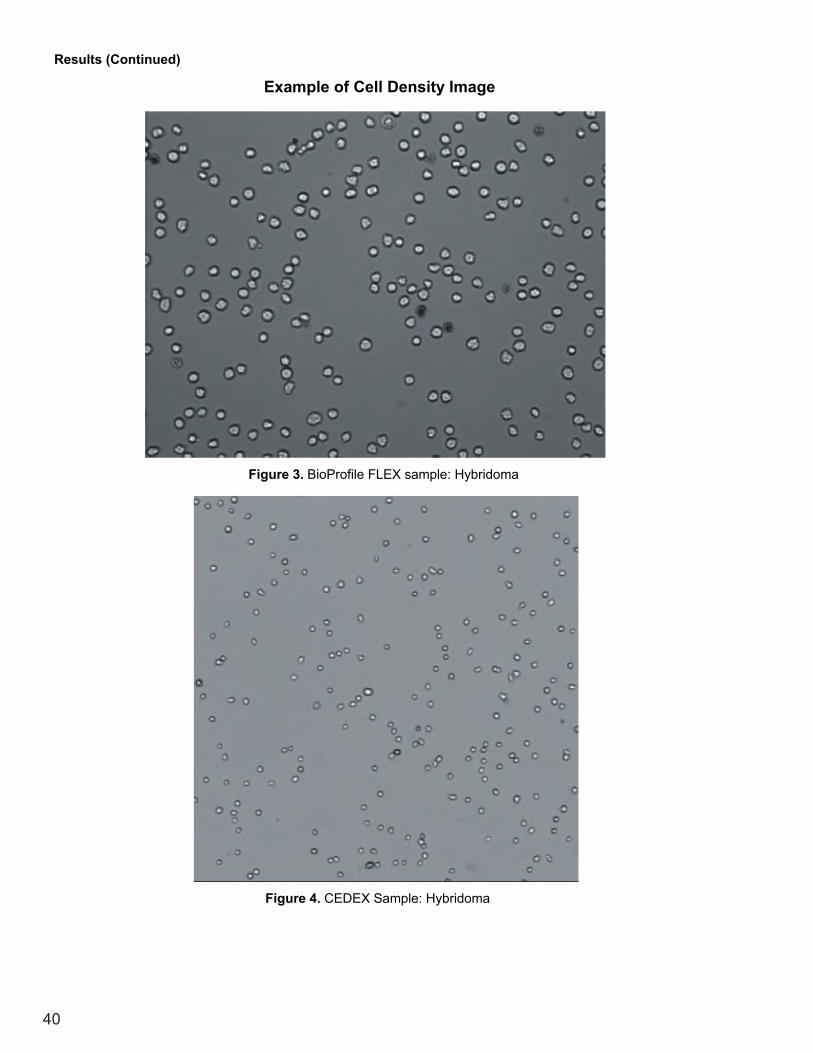
40
Results (Continued)
Example of Cell Density Image
Figure 3. BioProfile FLEX sample: Hybridoma
Figure 4. CEDEX Sample: Hybridoma

41
Results (Continued)
Osmolality
Figure 5. OSMOLALITY over Evaluation Range BioProfile FLEX Osmometer Module vs. Advanced Instruments 210
Figure 6. OSMOLALITY over Anticipated Cell Culture Range BioProfile FLEX OsmometerPerformance vs. Advanced Instruments 210
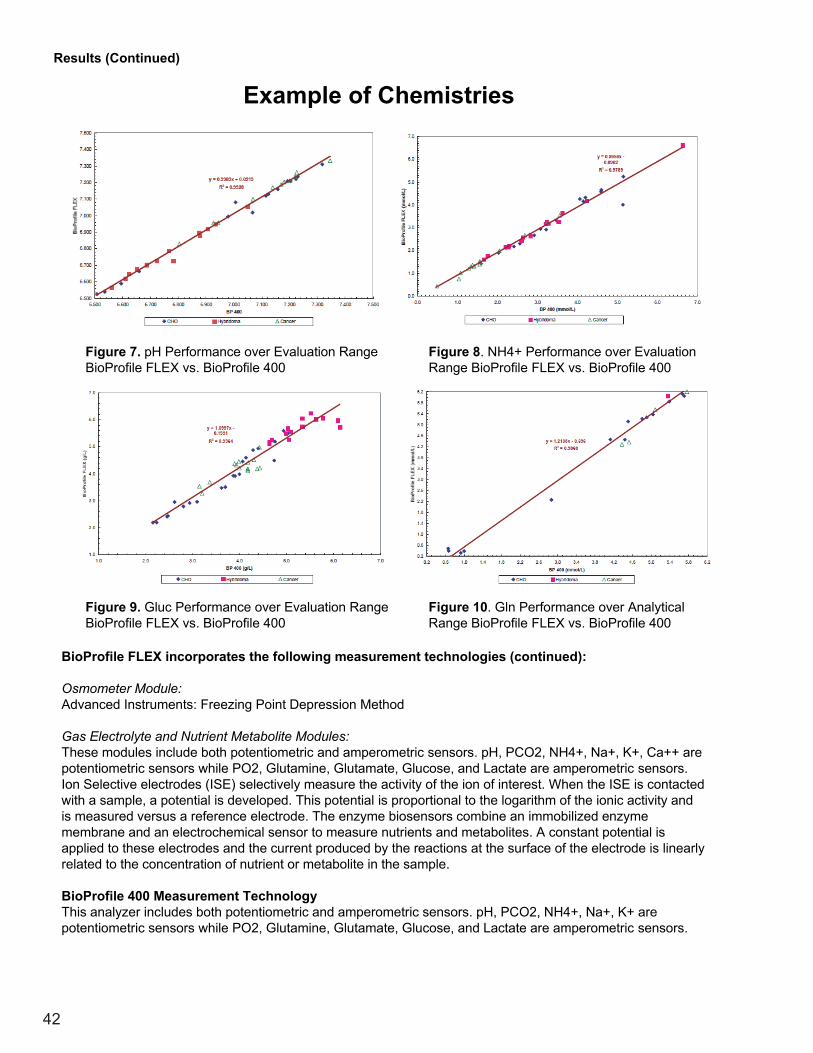
42
Results (Continued)
Example of Chemistries
Figure 7. pH Performance over Evaluation RangeBioProfile FLEX vs. BioProfile 400
Figure 8. NH4+ Performance over Evaluation Range BioProfile FLEX vs. BioProfile 400
Figure 9. Gluc Performance over Evaluation RangeBioProfile FLEX vs. BioProfile 400
Figure 10. Gln Performance over Analytical Range BioProfile FLEX vs. BioProfile 400
BioProfile FLEX incorporates the following measurement technologies (continued):
Osmometer Module:Advanced Instruments: Freezing Point Depression Method
Gas Electrolyte and Nutrient Metabolite Modules:These modules include both potentiometric and amperometric sensors. pH, PCO2, NH4+, Na+, K+, Ca++ are potentiometric sensors while PO2, Glutamine, Glutamate, Glucose, and Lactate are amperometric sensors. Ion Selective electrodes (ISE) selectively measure the activity of the ion of interest. When the ISE is contacted with a sample, a potential is developed. This potential is proportional to the logarithm of the ionic activity and is measured versus a reference electrode. The enzyme biosensors combine an immobilized enzyme membrane and an electrochemical sensor to measure nutrients and metabolites. A constant potential is applied to these electrodes and the current produced by the reactions at the surface of the electrode is linearly related to the concentration of nutrient or metabolite in the sample.
BioProfile 400 Measurement TechnologyThis analyzer includes both potentiometric and amperometric sensors. pH, PCO2, NH4+, Na+, K+ are potentiometric sensors while PO2, Glutamine, Glutamate, Glucose, and Lactate are amperometric sensors.
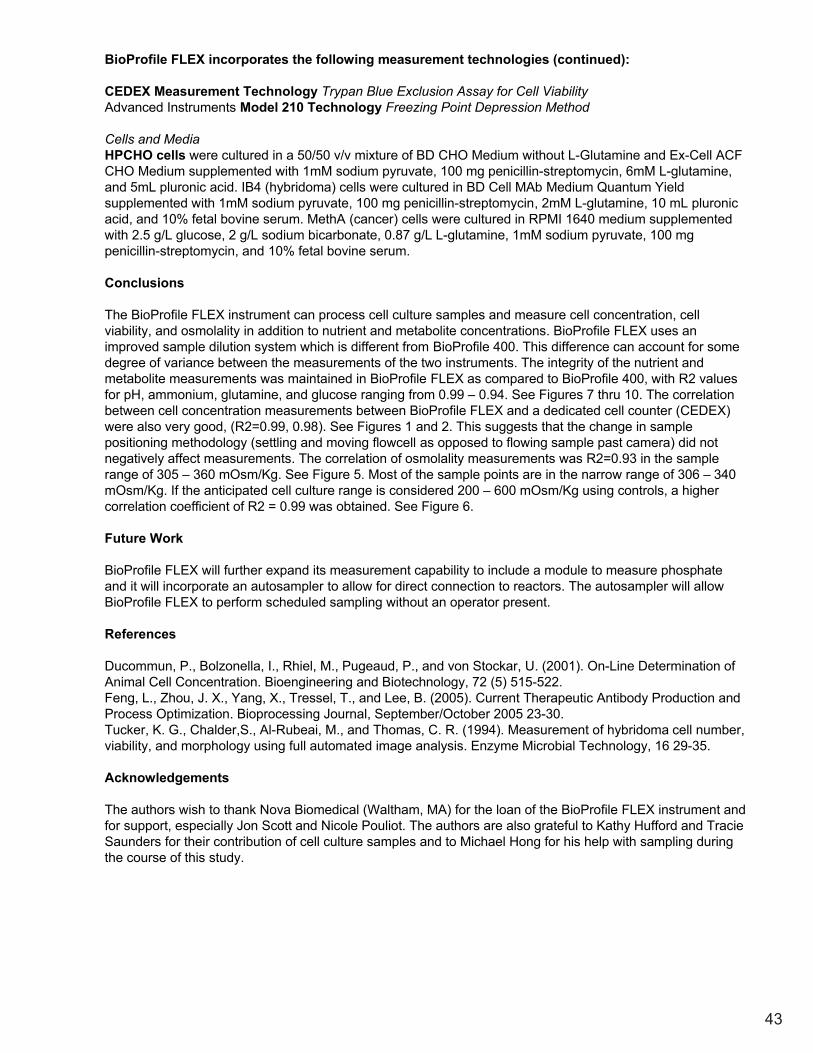
43
BioProfile FLEX incorporates the following measurement technologies (continued):
CEDEX Measurement Technology Trypan Blue Exclusion Assay for Cell ViabilityAdvanced Instruments Model 210 Technology Freezing Point Depression Method
Cells and MediaHPCHO cells were cultured in a 50/50 v/v mixture of BD CHO Medium without L-Glutamine and Ex-Cell ACF CHO Medium supplemented with 1mM sodium pyruvate, 100 mg penicillin-streptomycin, 6mM L-glutamine, and 5mL pluronic acid. IB4 (hybridoma) cells were cultured in BD Cell MAb Medium Quantum Yield supplemented with 1mM sodium pyruvate, 100 mg penicillin-streptomycin, 2mM L-glutamine, 10 mL pluronicacid, and 10% fetal bovine serum. MethA (cancer) cells were cultured in RPMI 1640 medium supplemented with 2.5 g/L glucose, 2 g/L sodium bicarbonate, 0.87 g/L L-glutamine, 1mM sodium pyruvate, 100 mg penicillin-streptomycin, and 10% fetal bovine serum.
Conclusions
The BioProfile FLEX instrument can process cell culture samples and measure cell concentration, cell viability, and osmolality in addition to nutrient and metabolite concentrations. BioProfile FLEX uses an improved sample dilution system which is different from BioProfile 400. This difference can account for some degree of variance between the measurements of the two instruments. The integrity of the nutrient and metabolite measurements was maintained in BioProfile FLEX as compared to BioProfile 400, with R2 values for pH, ammonium, glutamine, and glucose ranging from 0.99 – 0.94. See Figures 7 thru 10. The correlation between cell concentration measurements between BioProfile FLEX and a dedicated cell counter (CEDEX) were also very good, (R2=0.99, 0.98). See Figures 1 and 2. This suggests that the change in sample positioning methodology (settling and moving flowcell as opposed to flowing sample past camera) did not negatively affect measurements. The correlation of osmolality measurements was R2=0.93 in the sample range of 305 – 360 mOsm/Kg. See Figure 5. Most of the sample points are in the narrow range of 306 – 340 mOsm/Kg. If the anticipated cell culture range is considered 200 – 600 mOsm/Kg using controls, a higher correlation coefficient of R2 = 0.99 was obtained. See Figure 6.
Future Work
BioProfile FLEX will further expand its measurement capability to include a module to measure phosphate and it will incorporate an autosampler to allow for direct connection to reactors. The autosampler will allow BioProfile FLEX to perform scheduled sampling without an operator present.
References
Ducommun, P., Bolzonella, I., Rhiel, M., Pugeaud, P., and von Stockar, U. (2001). On-Line Determination of Animal Cell Concentration. Bioengineering and Biotechnology, 72 (5) 515-522.Feng, L., Zhou, J. X., Yang, X., Tressel, T., and Lee, B. (2005). Current Therapeutic Antibody Production and Process Optimization. Bioprocessing Journal, September/October 2005 23-30.Tucker, K. G., Chalder,S., Al-Rubeai, M., and Thomas, C. R. (1994). Measurement of hybridoma cell number, viability, and morphology using full automated image analysis. Enzyme Microbial Technology, 16 29-35.
Acknowledgements
The authors wish to thank Nova Biomedical (Waltham, MA) for the loan of the BioProfile FLEX instrument and for support, especially Jon Scott and Nicole Pouliot. The authors are also grateful to Kathy Hufford and Tracie Saunders for their contribution of cell culture samples and to Michael Hong for his help with sampling during the course of this study.