nov 7, 2016 week’s higlights bullseye report the ... · bel aub 2go sm apc smph abs bloom bdo aev...
TRANSCRIPT
Bullseye ReportWeekly Overview
Authored by:Juanis G. BarredoVP; Chief Technical AnalystCOL Financial Group Inc.(632) [email protected]
Disclaimer: All opinions and estimates constitute the judgment of COL’s Equity Research Dept as of
the date of the report and are subject to change without notice. The report is for informational
purposes only and is not intended as an offer or solicitation for purchase or sale of a security.
Philippine Equity Research
Nov 7, 2016
WEEK’S HIGLIGHTS• The Philippines’ PSEi lost 177-pts for the week breaking its
October lows but is nearing oversold levels
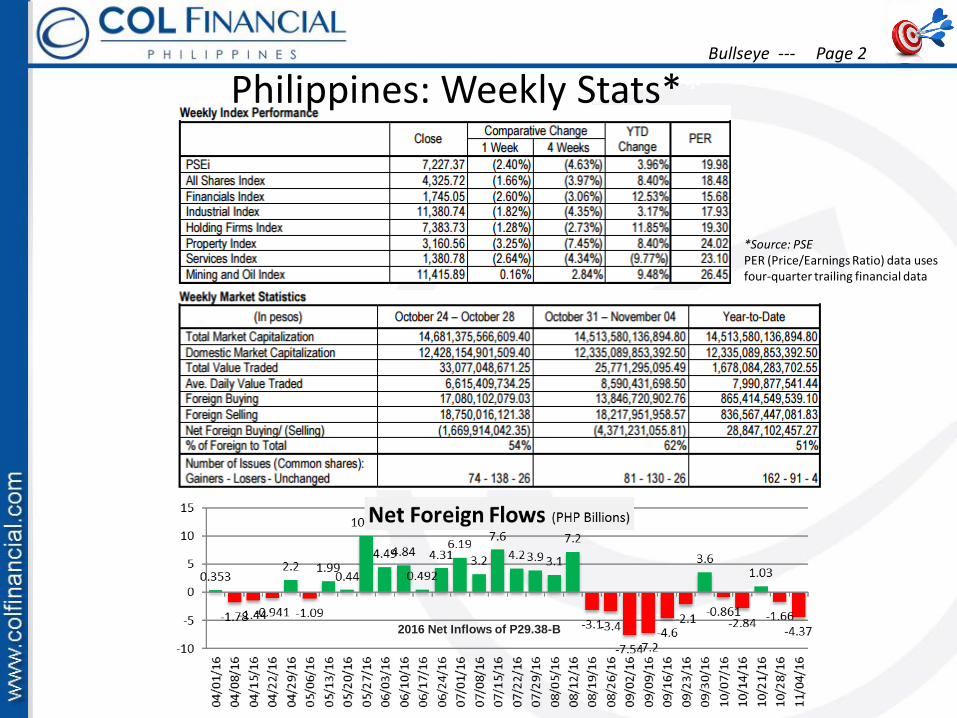
• Average Daily Value Turnover Improved to P8.5-B from P6.6-B the week previous
• Net foreign flows were negative showing outflows of P4.3-B from P1.6-B the previous week
• The PSEi (at 7,227) lost 177-pts and broke its October lows of 7,312 but it did fall to oversold levels. This oversold condition provided for some selling respite on Friday but such rebounds may be fickle until some sort of catalyst or reversal pattern can solidify its base. As such di expect more corrective volatility to be shown into the short term as the market attempt to find support near its Fibonacci zones of 50% and 61.8% (7,100 and 6860 respectively). If a rally can be managed in – it may try to recoup closer to short term averages (watch its 16 or 32-day MAs). Also be prepared for what US elections may have in store for investors
• US indices were weaker last week after breaking a key support structure. The Nasdaq led the decline after investors became edgy over the new email issues that surfaced against presidential contender Clinton. The vote is on the 8th and global investors may wait to see who comes out as a winner if this close fight.
Focus ItemsHighlight Page
Philippines : Weekly Stats 2
Philippines : PSEi & Peso 3
Tech Map: Some key stocks and trend calls 4
US and Europe: In review 5
Asia: In review 6
Currencies & Commodities: In review 7
Issue Prev Wk Last Wk Wk Chg Wk Chg % YTD %
Philippines 7,405 7,227 (177.43) (2.40) 3.96
Peso-$ 48.33 48.48 0.150 0.31 8.41
MSCI Phils 35.22 34.52 (0.70) (1.99) 2.31
PLDT US 31.62 30.58 (1.040) (3.29) (26.72)
DJIA 18,161 17,888 (272.91) (1.50) 2.66
SP500 2,126 2,085 (41.23) (1.94) 2.02
Nasdaq 5,190 5,046 (143.73) (2.77) 0.78
England 6,996 6,693 (303.00) (4.33) 7.22
Nikkei 17,446 16,905 (541.05) (3.10) (11.18)
Hong Kong 22,955 22,643 (312.19) (1.36) 3.32
China 3,104 3,125 21.05 0.68 (11.69)
US 30yr Bond 161.29 162.49 1.20 0.74 6.36
10-Yr Yield 18.45 17.83 (0.620) (3.36) (21.42)
Dollar Indx 98.34 97.09 (1.25) (1.27) (1.68)
Gold 1,276.80 1,304.50 27.70 2.17 23.01
Oil 48.7 44.07 (4.63) (9.51) 18.88
CRB Index** 189.21 182.50 (6.71) (3.55) 3.53
Philippines: Weekly Stats**Bullseye --- Page 2
*Source: PSEPER (Price/Earnings Ratio) data uses four-quarter trailing financial data
2016 Net Inflows of P29.38-B

Philippines: PSEi & PesoBullseye --- Page 3
Recommendation: Sell, preferably into a rally
Support: 7,100 – 6,860 Resistance: 7,781 – 7,800
• The PSEi fell 177-pts for the week as its proceeds with its corrective wave (Elliot’s C-wave)
• Prices have fallen below its 260-day (52-wk) moving average and recasts its declining trend
•Daily reads do show it to be closer to oversold reads and it has neared next support of 7,100 - these may cause some rally hiccups… but weekly reads still show corrective bias which may rallies temporary
•Until a new reversal pattern can be created to halt this reactive tug, we continue to expect corrective volatility to remain
Recommendation: Hold the Dollar
Support: 47.90 - 47.30 Resistance: 48.90 – 49.10
• The Peso-$ (at P48.48) was little weaker despite the Dollar index correcting –this still shows pressure on the PHP
• Weekly MACD readings still shows an upward (devaluating) bias and may allow only for a reduced revaluation if at all
• Look to hold the Dollar so long as the P-$ support holds
• Support for the P-$ stands at 47.90 then 47.30
•We continue to watch for resistance as its sits between 48.90 - 49.10
Tech Map
BEL AUB 2GO SM APC SMPH ABSBLOOM BDO AEV SMC AR TA ACHLCM CIC ANI TECH BHI UNI AGI
PLC DAVIN AP* CEB VLL ALIRFM DMPL AT COAL X ANS
FDC CHIB CROWN BPIFNI CHP DD CAL
MWC CNPF EW EDCSCC COSCO FGEN EEISTI CPG FLI ELI
UBP DIZ FPH GLODMC GERI HOUSEDNL GTCAP ICTEMP HVN LPZ
FOOD ION NOWIMI IS PGOLDLR^ JFC RLCMA JGS ROCK
MARC LC RRHIMCP^ LTG SGIMPI MAXS SSI
MWIDE MBT TAPETNI MEG TEL
NIKL MER URCOV MRC VITA
PCOR* MRSGIPIP^ OREPNB PHAPNX PSEPX PSPC
PXP RWMRCB SBSSLI SECB
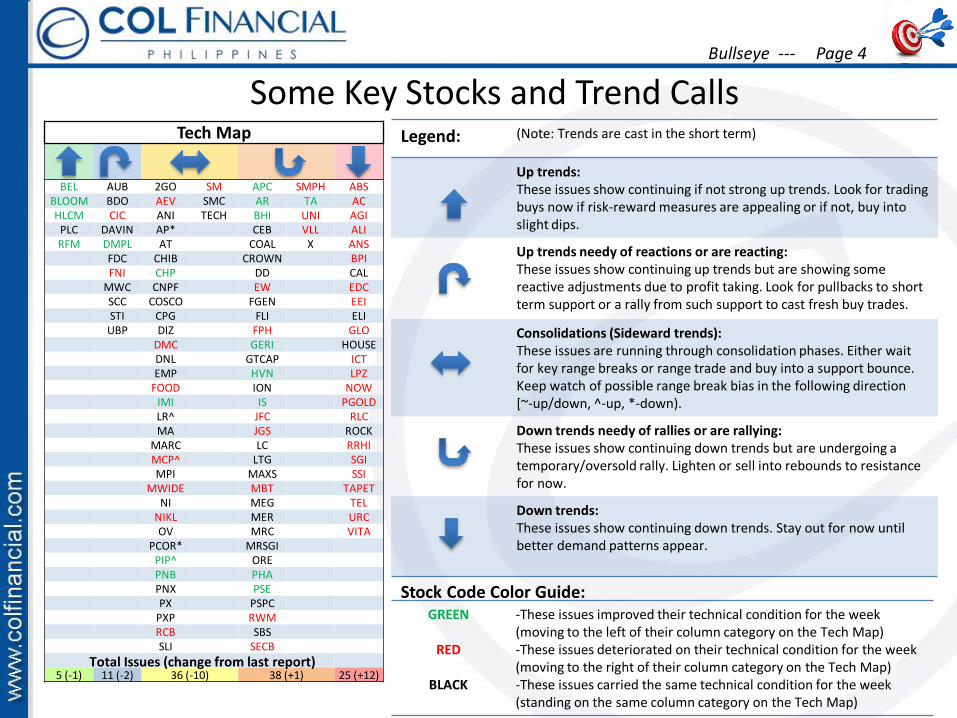
5 (-1) 11 (-2) 36 (-10) 38 (+1) 25 (+12)
Some Key Stocks and Trend CallsBullseye --- Page 4
GREEN
RED
BLACK
-These issues improved their technical condition for the week (moving to the left of their column category on the Tech Map)-These issues deteriorated on their technical condition for the week (moving to the right of their column category on the Tech Map)-These issues carried the same technical condition for the week (standing on the same column category on the Tech Map)
Legend: (Note: Trends are cast in the short term)
Up trends:These issues show continuing if not strong up trends. Look for trading buys now if risk-reward measures are appealing or if not, buy into slight dips.
Up trends needy of reactions or are reacting:These issues show continuing up trends but are showing some reactive adjustments due to profit taking. Look for pullbacks to short term support or a rally from such support to cast fresh buy trades.
Consolidations (Sideward trends):These issues are running through consolidation phases. Either wait for key range breaks or range trade and buy into a support bounce. Keep watch of possible range break bias in the following direction [~-up/down, ^-up, *-down).
Down trends needy of rallies or are rallying:These issues show continuing down trends but are undergoing a temporary/oversold rally. Lighten or sell into rebounds to resistance for now.
Down trends:These issues show continuing down trends. Stay out for now until better demand patterns appear.
Stock Code Color Guide:
Total Issues (change from last report)
US and European MarketsBullseye --- Page 5
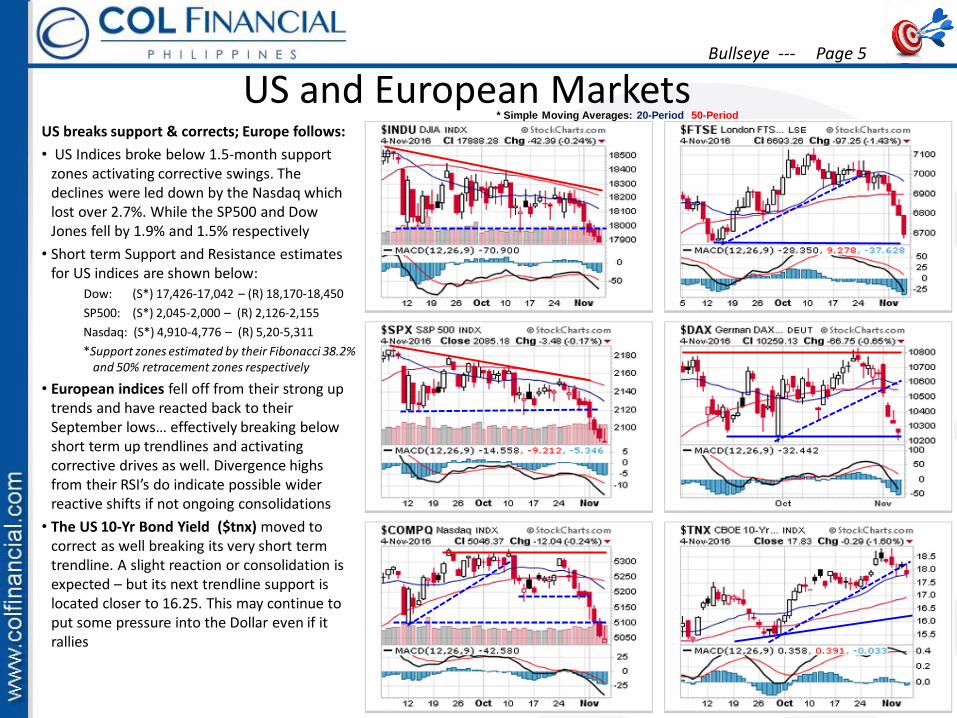
US breaks support & corrects; Europe follows:
• US Indices broke below 1.5-month support zones activating corrective swings. The declines were led down by the Nasdaq which lost over 2.7%. While the SP500 and Dow Jones fell by 1.9% and 1.5% respectively
• Short term Support and Resistance estimates for US indices are shown below:
Dow: (S*) 17,426-17,042 – (R) 18,170-18,450
SP500: (S*) 2,045-2,000 – (R) 2,126-2,155
Nasdaq: (S*) 4,910-4,776 – (R) 5,20-5,311
*Support zones estimated by their Fibonacci 38.2% and 50% retracement zones respectively
• European indices fell off from their strong up trends and have reacted back to their September lows… effectively breaking below short term up trendlines and activating corrective drives as well. Divergence highs from their RSI’s do indicate possible wider reactive shifts if not ongoing consolidations
• The US 10-Yr Bond Yield ($tnx) moved to correct as well breaking its very short term trendline. A slight reaction or consolidation is expected – but its next trendline support is located closer to 16.25. This may continue to put some pressure into the Dollar even if it rallies
* Simple Moving Averages: 20-Period 50-Period
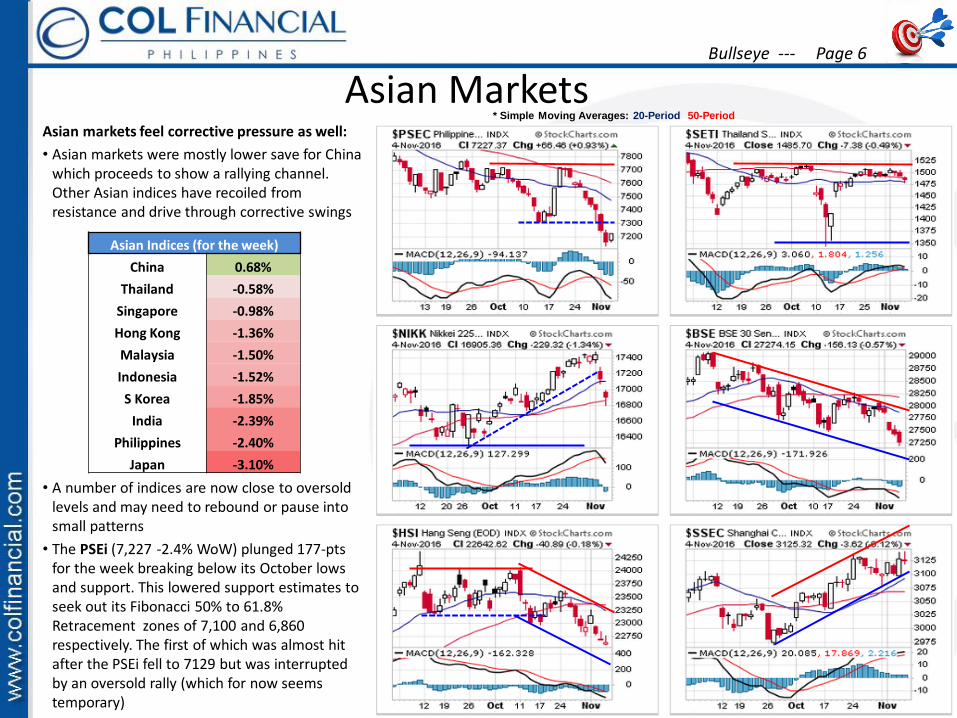
Asian MarketsAsian markets feel corrective pressure as well:
• Asian markets were mostly lower save for China which proceeds to show a rallying channel. Other Asian indices have recoiled from resistance and drive through corrective swings
• A number of indices are now close to oversold levels and may need to rebound or pause into small patterns
• The PSEi (7,227 -2.4% WoW) plunged 177-pts for the week breaking below its October lows and support. This lowered support estimates to seek out its Fibonacci 50% to 61.8% Retracement zones of 7,100 and 6,860 respectively. The first of which was almost hit after the PSEi fell to 7129 but was interrupted by an oversold rally (which for now seems temporary)
Bullseye --- Page 6
* Simple Moving Averages: 20-Period 50-Period
Asian Indices (for the week)
China 0.68%
Thailand -0.58%
Singapore -0.98%
Hong Kong -1.36%
Malaysia -1.50%
Indonesia -1.52%
S Korea -1.85%
India -2.39%
Philippines -2.40%
Japan -3.10%

Currencies & CommoditiesDollar corrects, lifting Metals but not Oil:
• The US Dollar index (97.09 -1.28% WoW) was lower for the week after recently breaking its short term up trendline. A pullback towards support is expected (Sup 97.00-95.50 / Res 98.12 – 99.09)
• The Euro index (111.35 +1.36% WoW) rose for the week as the Dollar weakened. Its may attempt to show a rebound to next resistance (Sup 109.80-108.51/ Res 111.71-112.50)
• The Yen index (96.96 +1.53% WoW) [$¥103.11] was little stronger for the week after bouncing off from the lower end of a slightly reactive channel. A sideways move is still likely with some downside bias (Sup 95.00-93.07 / Res 97.69-99.30)
• Gold ($1,304.50 +2.17% WoW) was higher after recently bouncing off oversold levels, and now lifted by a corrective Dollar… but a corrective trendline at resistance remains open. (Sup 1,275-1,231 /Res 1,310-1,322)
• Copper ($2.265 +3.26 WoW) proceeded to rally after breaking over its medium term down trendline looking for next major resistance. But it is overbought (Sup 2.20-2.18 /Res 2.29 -2.32)
• Oil ($44.07 -9.51% WoW) fell hard for the week after breaking its short term up trendline below $47. A corrective swing to next support is expected but it nears oversold levels. (Sup 43.06 -42.28/ Res 47.00-48.60)
Bullseye --- Page 7
* Simple Moving Averages: 20-Period 50-Period