nouvelle présentation powerpoint - gtt · united states or any other jurisdiction. it includes...
TRANSCRIPT

Investor Presentation
October 2016

2
This document is strictly confidential. Any unauthorised access to, appropriation of,
copying, modification, use or disclosure thereof, in whole or in part, by any means, for
any purpose, infringes GTT’s rights. This document is part of GTT’s proprietary know-
how and may contain trade secrets protected worldwide by TRIPS and EU Directives
against their unlawful acquisition, use and disclosure. It is also protected by Copyright
law. The production, offering or placing on the market of, the importation, export or
storage of goods or services using GTT’s trade secrets or know-how is subject to GTT’s
prior written consent. Any violation of these obligations may give rise to civil or criminal
liability. © GTT, 2010-2016
Disclaimer

3
Disclaimer
This presentation does not contain or constitute an offer of securities for sale or an invitation or inducement to invest in securities in France, the
United States or any other jurisdiction.
It includes only summary information and does not purport to be comprehensive. No representation, warranty or undertaking, express or
implied, is made as to, and no reliance should be placed on, the accuracy, completeness or correctness of the information or opinions contained
in this presentation. None of GTT or any of its affiliates, directors, officers and employees shall bear any liability (in negligence or otherwise) for
any loss arising from any use of this presentation or its contents.
The market data and certain industry forecasts included in this presentation were obtained from internal surveys, estimates, reports and studies,
where appropriate, as well as external market research, including Poten & Partners, Wood Mackenzie and Clarkson Research Services Limited,
publicly available information and industry publications. GTT, its affiliates, shareholders, directors, officers, advisors and employees have not
independently verified the accuracy of any such market data and industry forecasts and make no representations or warranties in relation
thereto. Such data and forecasts are included herein for information purposes only. Where referenced, as regards the information and data
contained in this presentation provided by Clarksons Research and taken from Clarksons Research’s database and other sources, Clarksons
Research has advised that: (i) some information in the databases is derived from estimates or subjective judgments; (ii) the information in the
databases of other maritime data collection agencies may differ from the information in Clarksons Research database; (iii) while Clarksons
Research has taken reasonable care in the compilation of the statistical and graphical information and believes it to be accurate and correct,
data compilation is subject to limited audit and validation procedures.
Any forward-looking statements contained herein are based on current GTT’s expectations, beliefs, objectives, assumptions and projections
regarding present and future business strategies and the distribution environment in which GTT operates, and any other matters that are not
historical fact. Forward-looking statements are not guarantees of future performances and are subject to various risks, uncertainties and other
factors, many of which are difficult to predict and generally beyond the control of GTT and its shareholders. Actual results, performance or
achievements, or industry results or other events, could materially differ from those expressed in, or implied or projected by, these forward-
looking statements. For a detailed description of these risks and uncertainties, please refer to the section “Risk Factors” of the Document de
Référence (“Registration Document”) registered by GTT with the Autorité des Marchés Financiers (“AMF”) under No. R.16-028 on April 27,
2016 and the half-yearly financial report released on July 21, 2016, which are available on the AMF’s website at www.amf-france.org and on
GTT’s website at www.gtt.fr.
The forward-looking statements contained in this presentation are made as at the date of this presentation, unless another time is specified in
relation to them. GTT disclaims any intent or obligation to update any forward-looking statements contained in this presentation.

4
Agenda
1. Key figures
2. Strategy and activity update
4. Financials
5. Outlook
Appendices

5
Key figures 1
6
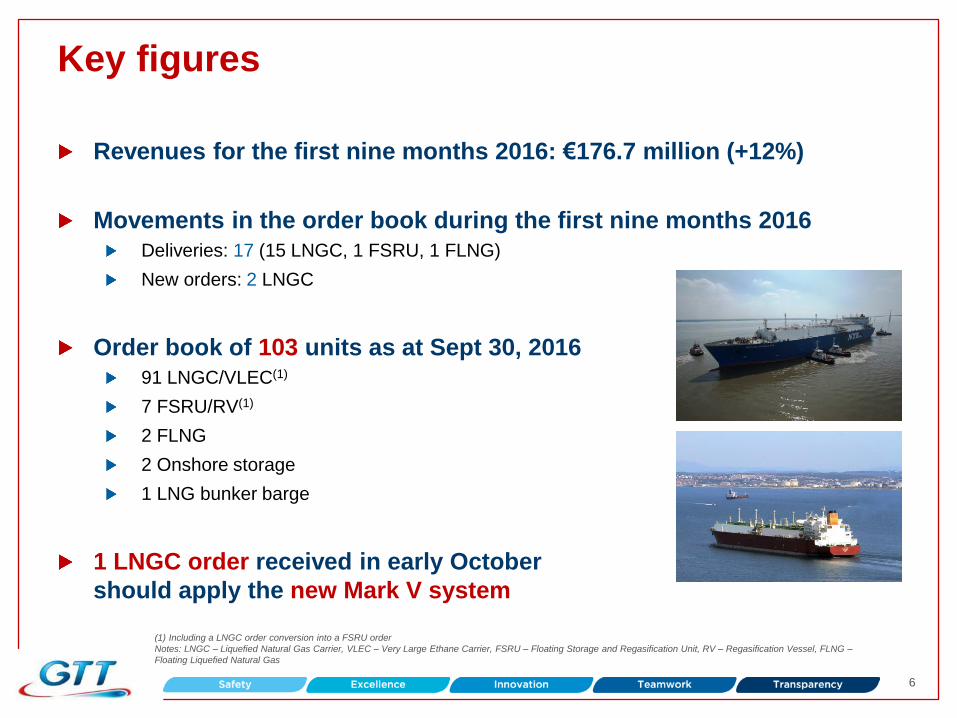
Key figures
Revenues for the first nine months 2016: €176.7 million (+12%)
Movements in the order book during the first nine months 2016
Deliveries: 17 (15 LNGC, 1 FSRU, 1 FLNG)
New orders: 2 LNGC
Order book of 103 units as at Sept 30, 2016
91 LNGC/VLEC(1)
7 FSRU/RV(1)
2 FLNG
2 Onshore storage
1 LNG bunker barge
1 LNGC order received in early October
should apply the new Mark V system
(1) Including a LNGC order conversion into a FSRU order
Notes: LNGC – Liquefied Natural Gas Carrier, VLEC – Very Large Ethane Carrier, FSRU – Floating Storage and Regasification Unit, RV – Regasification Vessel, FLNG –
Floating Liquefied Natural Gas

7
Strategy and activity update 2
8
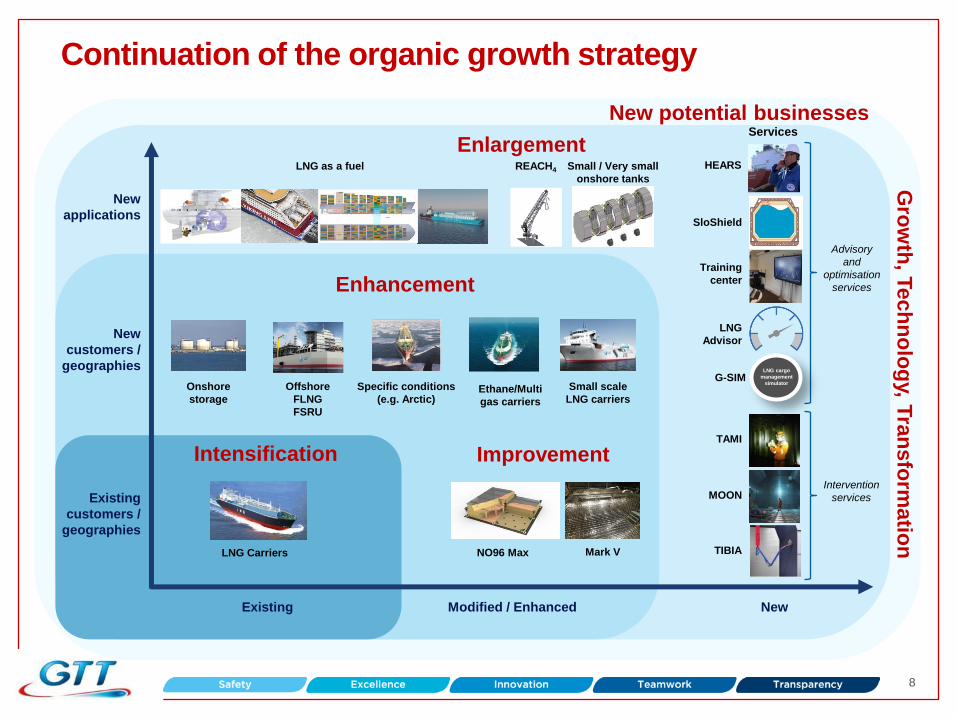
Continuation of the organic growth strategy
Existing Modified / Enhanced New
Existing
customers /
geographies
New
customers /
geographies
New
applications
Enlargement
LNG Carriers
Intensification
Services
Improvement
Enhancement
Specific conditions
(e.g. Arctic)
Small scale
LNG carriers
Offshore
FLNG
FSRU
Onshore
storage Ethane/Multi
gas carriers
SloShield
Training
center
LNG as a fuel REACH4
TIBIA
MOON
TAMI
HEARS
Advisory
and
optimisation
services
Intervention
services
Small / Very small
onshore tanks
New potential businesses
Gro
wth
, Tech
no
log
y, Tra
nsfo
rmatio
n
LNG
Advisor
LNG cargo
management
simulator G-SIM
Mark V NO96 Max

9
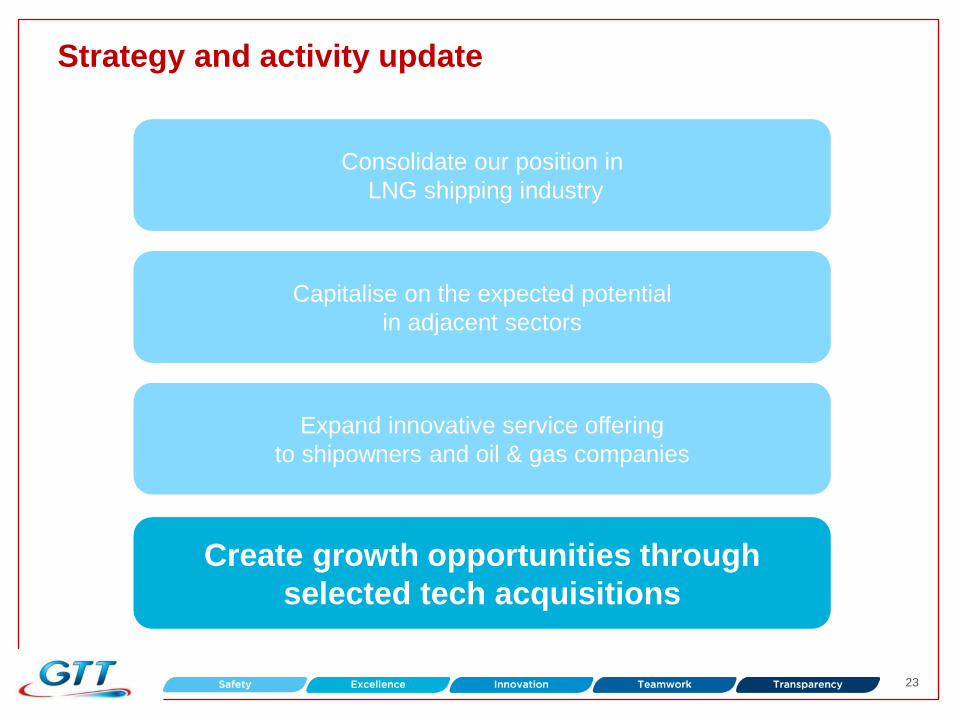
Strategy and activity update
Capitalise on the expected potential
in adjacent sectors
Consolidate our position in
LNG shipping industry
Expand innovative service offering
to shipowners and oil & gas companies
Create growth opportunities through
selected tech acquisitions

10
0
50
100
150
200
250
300
350
400
450
America
Asia Pacific
Africa
Middle East
Europe
Demand
Market drivers: a strong anticipated LNG demand
Additional LNG supply needed from 2022-2023 Existing projects: insufficient to meet demand
60 Mtpa
Mtpa
2016-2026 CAGR for LNG
demand: +5.0%
0
50
100
150
200
250
300
350
400
450
Underconstructionprojects
Existing projects
Demand
Mtpa
Source: Wood Mackenzie Q3 2016
Majority of US
projects
11
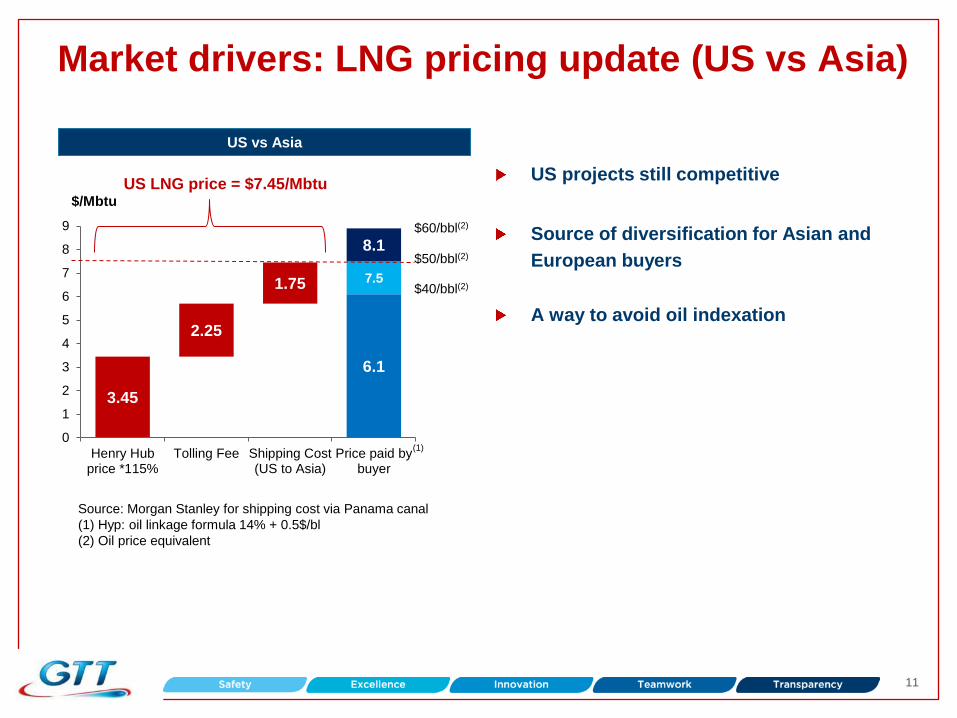
US LNG price = $7.45/Mbtu
6.1
3.45
2.25
1.75 7.5
8.1
0
1
2
3
4
5
6
7
8
9
Henry Hubprice *115%
Tolling Fee Shipping Cost(US to Asia)
Price paid bybuyer
Market drivers: LNG pricing update (US vs Asia)
$40/bbl(2)
$50/bbl(2)
$60/bbl(2)
Source: Morgan Stanley for shipping cost via Panama canal
(1) Hyp: oil linkage formula 14% + 0.5$/bl
(2) Oil price equivalent
(1)
$/Mbtu
US projects still competitive
Source of diversification for Asian and
European buyers
A way to avoid oil indexation
US vs Asia

12
Charter rates have picked-up since the beginning of H2 2016
Source: Clarkson
$/day
Charter rates evolution for 160,000 cbm LNGC
Increase of the charter rates during the
2016 summer: trend to be confirmed
0
20.000
40.000
60.000
80.000
100.000
120.000
140.000
160.000
De
c-1
0
Apr-
11
Aug-1
1
De
c-1
1
Apr-
12
Aug-1
2
De
c-1
2
Apr-
13
Aug-1
3
De
c-1
3
Apr-
14
Aug-1
4
De
c-1
4
Apr-
15
Aug-1
5
De
c-1
5
Apr-
16
Aug-1
6
13
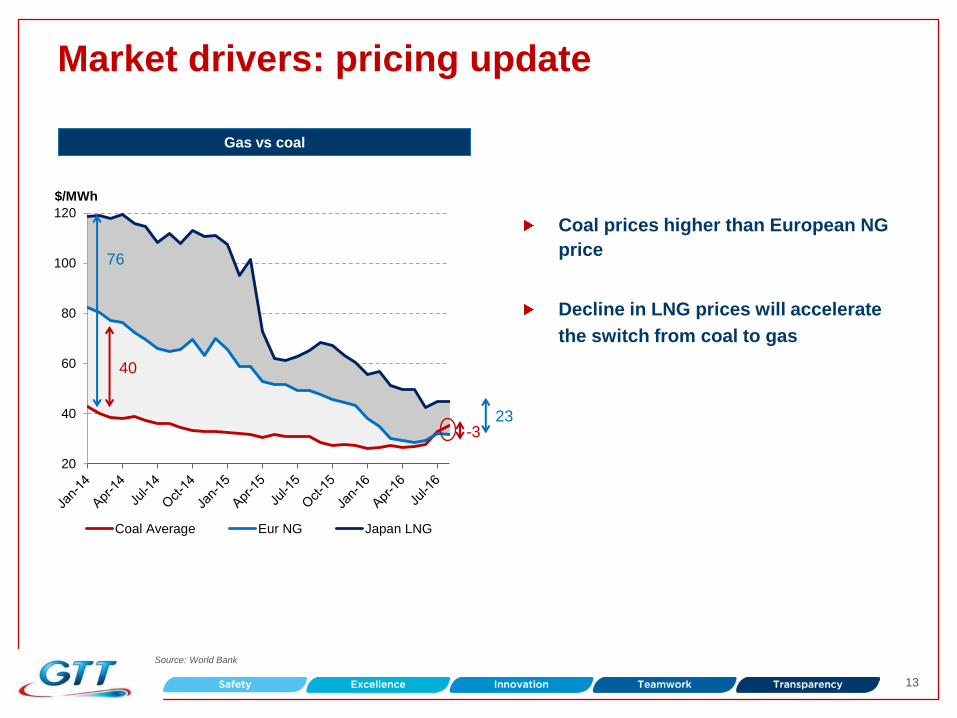
Market drivers: pricing update
20
40
60
80
100
120
$/MWh
Coal Average Eur NG Japan LNG
76
23
40
Source: World Bank
-3
Gas vs coal
Coal prices higher than European NG
price
Decline in LNG prices will accelerate
the switch from coal to gas
14
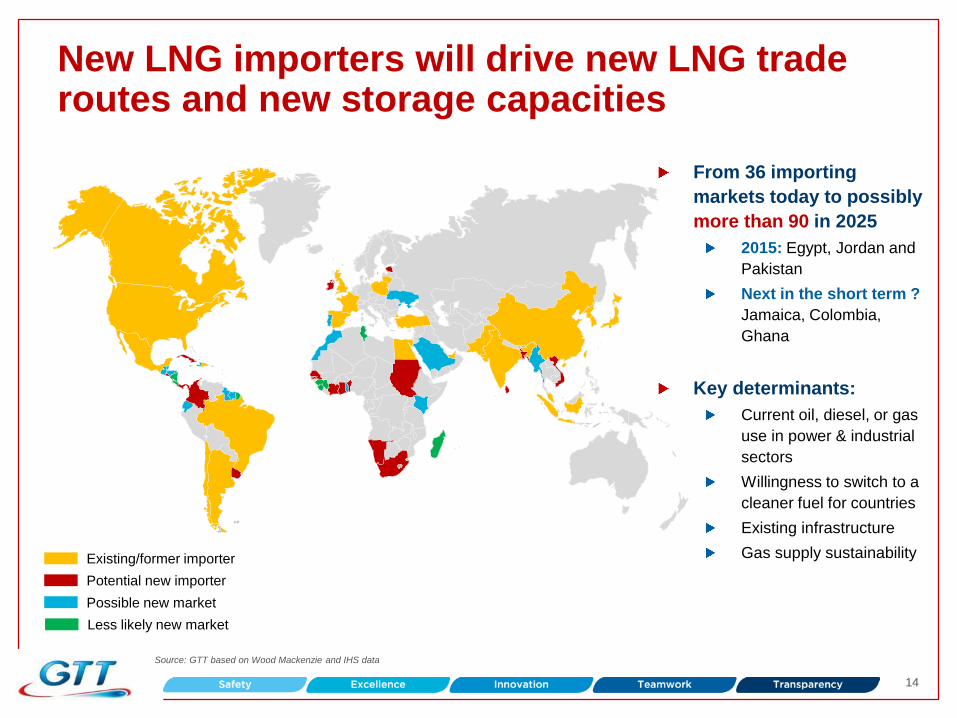
New LNG importers will drive new LNG trade routes and new storage capacities
Existing/former importer
Potential new importer
Possible new market
Less likely new market
Source: GTT based on Wood Mackenzie and IHS data
From 36 importing
markets today to possibly
more than 90 in 2025
2015: Egypt, Jordan and
Pakistan
Next in the short term ?
Jamaica, Colombia,
Ghana
Key determinants:
Current oil, diesel, or gas
use in power & industrial
sectors
Willingness to switch to a
cleaner fuel for countries
Existing infrastructure
Gas supply sustainability

15
Strategy and activity update: LNG Carriers
Main drivers LNGC: our core business
Vessel equipped for transporting LNG
Existing fleet: 406 units(1)
In order: 85 units
21 construction shipyards under license
GTT order estimates over 2016-2025:
270 -280 units
85.6%
% sales(3)
9M 2016
(1) As of Sept 30, 2016. Excludes vessel orders below 30,000 m3
(2) Source Wood Mackenzie
(3) Including ethane carriers
Natural gas demand expected to increase
by 5%(2) over 2016-2026
Natural gas exports are increasing
Share of LNG is still small, but increasing
Need for additional liquefaction capacity
from 2022
New trade routes support demand for LNG
carriers

16
Strategy and activity update: other applications
FLNG
Floating unit which ensure treatment of gas,
liquefy and store it
Existing fleet: 1
In order: 2 units
GTT order estimates over 2016-2025: 7-13 units
FSRU
Stationary vessel capable of loading LNG,
storing and re-gasifying it
Existing fleet: 24 FSRU
In order: 7 units
GTT order estimates over 2016-2025: 25-35 units
Onshore storage
Tank installed next to LNG loading or unloading
terminals
Existing GTT tanks: 34
In order: 2 units
GTT order estimates over 2016-2025: 10-15 units
The new
frontier of
the LNG
world
The solution
for emerging
countries
A proven
containment
storage
solution
0.9 % 8.1%
0.1 %
% sales
9M 2016 % sales
9M 2016
% sales
9M 2016

17
Strategy and activity update
Capitalise on the expected potential
in adjacent sectors
Consolidate our position in
LNG shipping industry
Expand innovative service offering
to shipowners and oil & gas companies
Create growth opportunities through
selected tech acquisitions
18
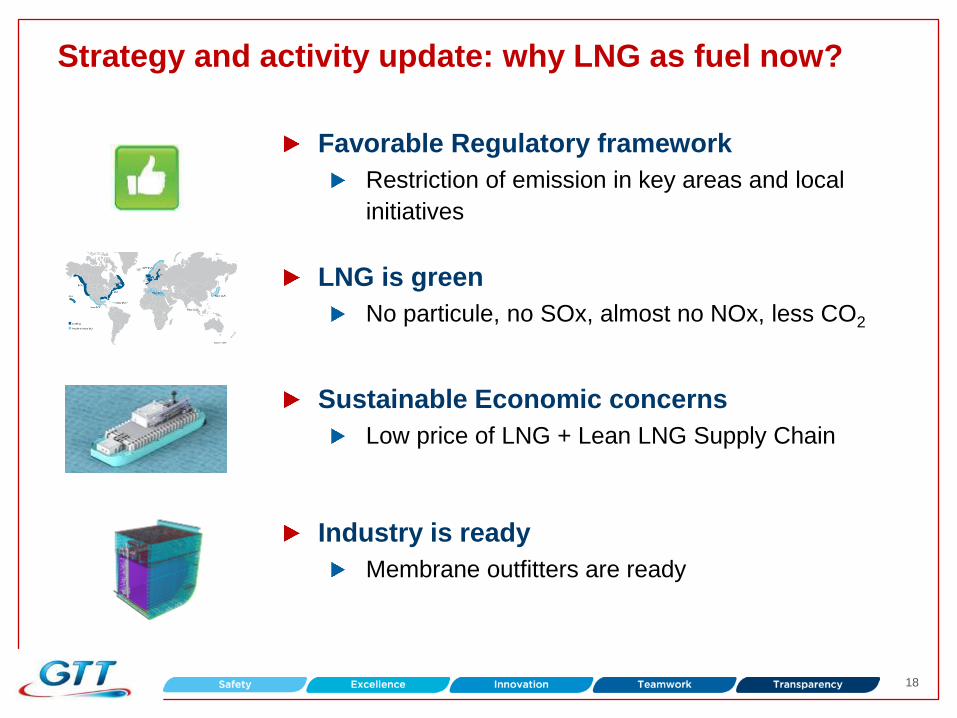
Strategy and activity update: why LNG as fuel now?
LNG is green
No particule, no SOx, almost no NOx, less CO2 Source : DNV
Localisation géographique des zones soufre (ECA)
Favorable Regulatory framework
Restriction of emission in key areas and local
initiatives
Sustainable Economic concerns
Low price of LNG + Lean LNG Supply Chain
Industry is ready
Membrane outfitters are ready
19
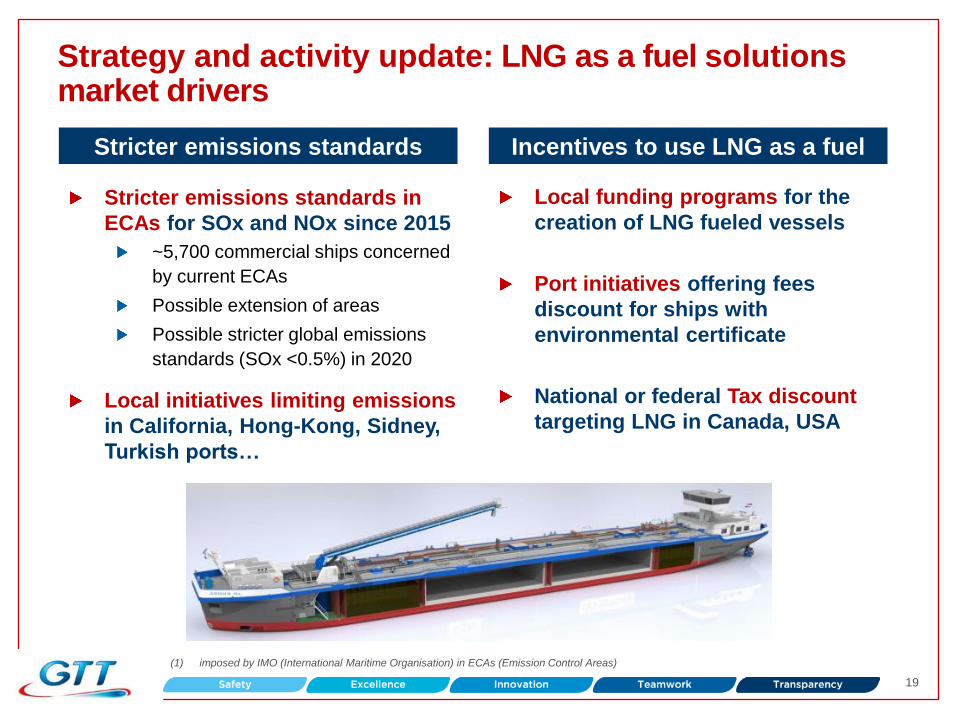
Strategy and activity update: LNG as a fuel solutions market drivers
Stricter emissions standards
Stricter emissions standards in
ECAs for SOx and NOx since 2015
~5,700 commercial ships concerned
by current ECAs
Possible extension of areas
Possible stricter global emissions
standards (SOx <0.5%) in 2020
Local initiatives limiting emissions
in California, Hong-Kong, Sidney,
Turkish ports…
(1) imposed by IMO (International Maritime Organisation) in ECAs (Emission Control Areas)
Incentives to use LNG as a fuel
Local funding programs for the
creation of LNG fueled vessels
Port initiatives offering fees
discount for ships with
environmental certificate
National or federal Tax discount
targeting LNG in Canada, USA
20
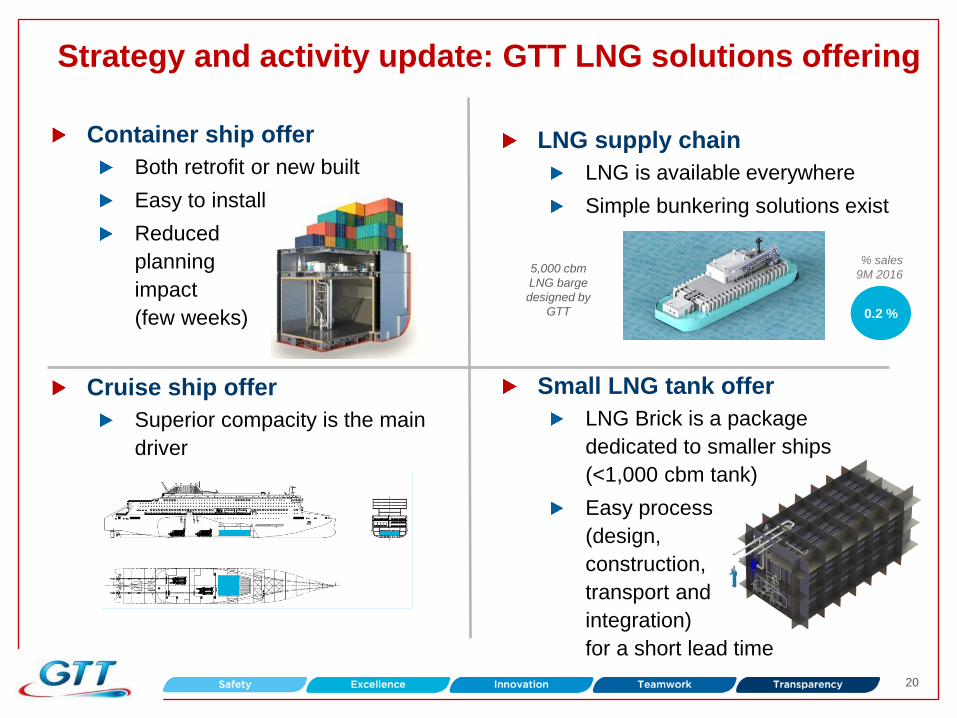
Strategy and activity update: GTT LNG solutions offering
Container ship offer
Both retrofit or new built
Easy to install
Reduced
planning
impact
(few weeks)
Cruise ship offer
Superior compacity is the main
driver
LNG supply chain
LNG is available everywhere
Simple bunkering solutions exist
Small LNG tank offer
LNG Brick is a package
dedicated to smaller ships
(<1,000 cbm tank)
Easy process
(design,
construction,
transport and
integration)
for a short lead time
5,000 cbm
LNG barge
designed by
GTT 0.2 %
% sales
9M 2016

21
Strategy and activity update
Capitalise on the expected potential
in adjacent sectors
Consolidate our position in
LNG shipping industry
Expand innovative service offering
to shipowners and oil & gas companies
Create growth opportunities through
selected tech acquisitions

22
Strategy and activity Update: expand innovative services
GTT ON SITE
Technical assistance
maintenance & repair
TAMI
Thermal camera
for secondary membrane inspection
TIBIA
Inspection tool
for FLNG inspection
MOON
MOtorized
BalloON
for primary
membrane inspection
SUPPLIERS’ APPROVAL
Materials quality
TRAINING
Training tool
for LNGC
crew members
SLOSHIELD
Sloshing
prediction &
monitoring
system
HEARS
Hotline Emergency
Assistance &
Response
Service LNG Advisor
Boil-off Gas
monitoring
system
STUDIES
PRE-PROJECT
Vessel modification
feasibility studies
front end engineering
Advisory and optimisation services Intervention services
Test Software Large range of services to support ship-
owners and oil & gas companies
G-SIM
LNG cargo
management
simulator
5.1%
% sales
9M 2016
23
Strategy and activity update
Capitalise on the expected potential
in adjacent sectors
Consolidate our position in
LNG shipping industry
Expand innovative service offering
to shipowners and oil & gas companies
Create growth opportunities through
selected tech acquisitions
24
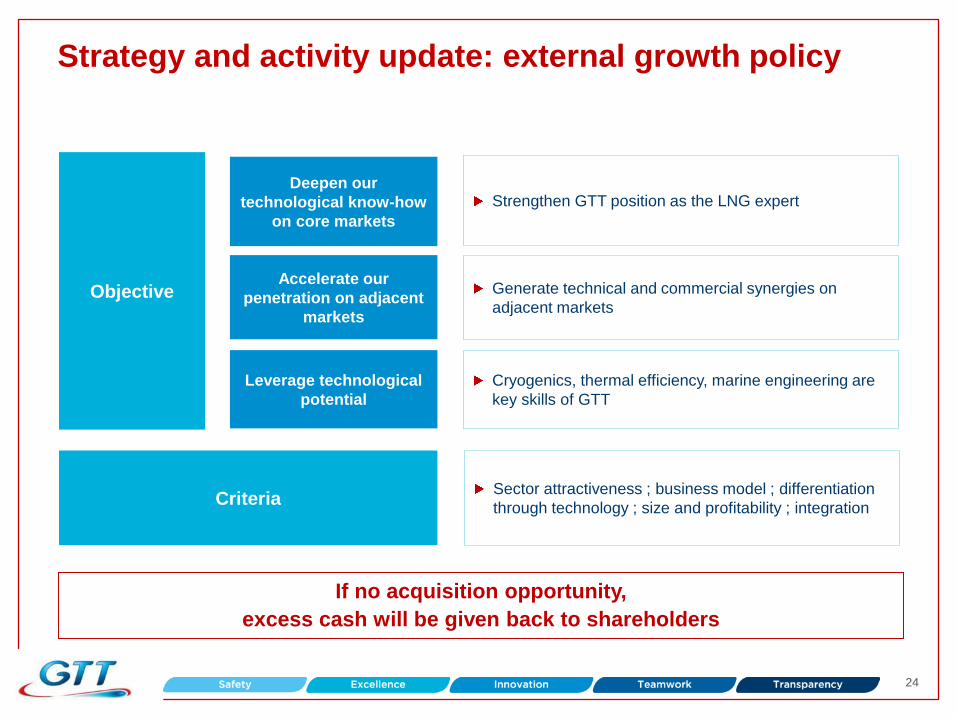
Objective
Strengthen GTT position as the LNG expert
Criteria
Deepen our
technological know-how
on core markets
Accelerate our
penetration on adjacent
markets
Cryogenics, thermal efficiency, marine engineering are
key skills of GTT
Strategy and activity update: external growth policy
Leverage technological
potential
Generate technical and commercial synergies on
adjacent markets
Sector attractiveness ; business model ; differentiation
through technology ; size and profitability ; integration
If no acquisition opportunity,
excess cash will be given back to shareholders

25
Financials 3

26
H1 2016 financial performance
Key highlights Summary financials
(1) Defined as EBIT + the depreciation charge on assets under IFRS
(2) Defined as December 31 working capital – June 30 working capital
(3) Defined as trade and other receivables + other current assets – trade and other payables – other current liabilities
(2)
Increase in revenues (+11.4%)
Revenues derived from royalties (+15.2%)
Increase of 19.5% in royalties coming from
LNG and ethane carriers, and 25.5% from
FSRU
Despite time lap in shipbuilding milestones
Decrease of 32% for revenues from services due to a
comparatively high first half 2015 (studies)
Strong margins
Increase of 11.6% to 11.8% in EBITDA, EBIT and
net income thanks to
Limited costs
Flexibility of the business model
EBITDA, EBIT and net margins stand at a high level
Cash Flow
Increase of 9% due to growth of EBITDA
Negative change in working capital, mainly due to
construction milestones and payments, and the
decrease in new orders since the end of 2015
High cash position of €59.6 M despite the €50.4 M
dividend payment in H1 2016
And financial investments of €19.9 M
In € M H1 2015 H1 2016 Change
Total Revenues 104.9 116.9 +11.4%
EBITDA(1) 66.0 73.7 +11.8%
Margin (%) 62.9% 63.1%
Operating Income 64.6 72.1 +11.7%
Margin (%) 61.5% 61.7%
Net income 54.2 60.5 +11.6%
Margin (%) 51.7% 51.8%
Cash Flow 65.0 70.9 +9.0%
Change in Working
Capital(2) (10.1) (30.5) nm
Capex (3.8) (1.3) -65.8%
Dividend paid 43.0 50.4 +17.2%
in € M 30/06/2015 30/06/2016
Cash Position 52.4 59.6 nm
Working Capital
Requirement(3) (3.5) 15.8 nm
27
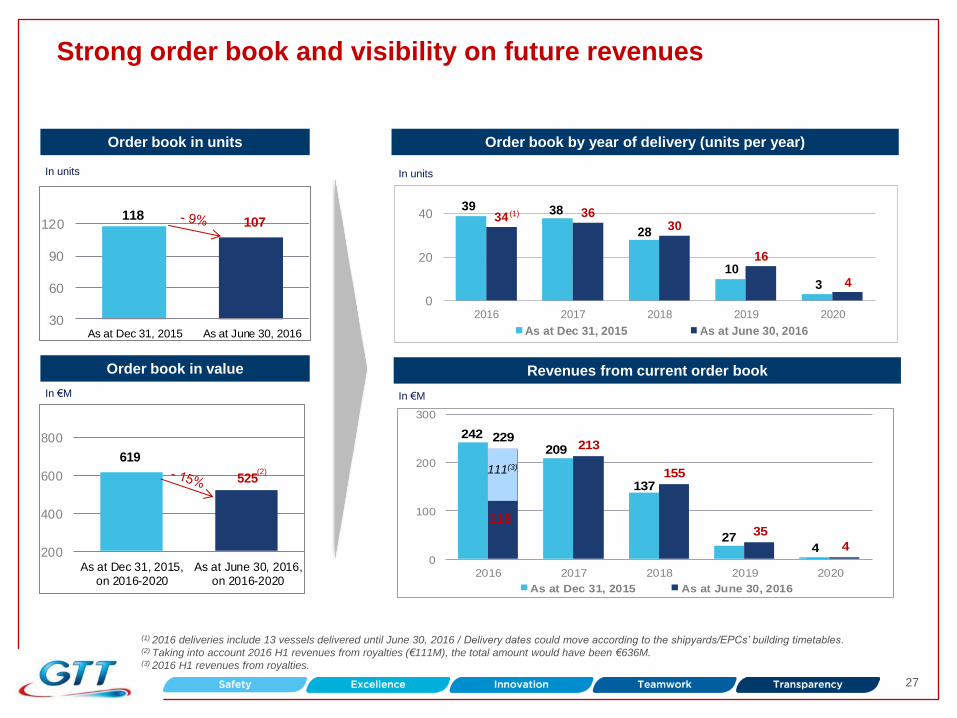
619
525
200
400
600
800
As at Dec 31, 2015,on 2016-2020
As at June 30, 2016,on 2016-2020
242
209
137
274
229213
155
35
40
100
200
300
2016 2017 2018 2019 2020
As at Dec 31, 2015 As at June 30, 2016
39 38
28
10
3
34 3630
16
4
0
20
40
2016 2017 2018 2019 2020
As at Dec 31, 2015 As at June 30, 2016
Revenues from current order book
Order book in units
In €M
118107
30
60
90
120
As at Dec 31, 2015 As at June 30, 2016
Order book by year of delivery (units per year)
Strong order book and visibility on future revenues
Order book in value
In €M
In units In units
(1) 2016 deliveries include 13 vessels delivered until June 30, 2016 / Delivery dates could move according to the shipyards/EPCs’ building timetables.
(2) Taking into account 2016 H1 revenues from royalties (€111M), the total amount would have been €636M. (3) 2016 H1 revenues from royalties.
118
111(3)
(1)
(2)

28
Staff
Costs46%
External
Costs27%
Other
Costs8%
(1) Excl. depreciation and amortization, provisions and other operating income/expenses (mainly investment/ R&D subsidies)
(2) Excl. Subcontracting Test and Studies
A cost base offering a high operating leverage
GTT operational costs(1) Cost flexibility
Operational costs decreased from 42% of
sales to 39% of sales on the period
Stability in staff expenses
Compensation between subcontracting test and
studies and travel expenditures / other external
costs (fees)
Cost flexibility sources:
c.20% of staff with non permanent contracts (as
of June 30, 2016)
Subcontracting linked to level of activity
Profit sharing based on profit and activity
criteria
GTT H1 2016 costs by nature
Subcontracting
Test and Studies
19%
(2)
In € M H1 2015 H1 2016 Change
(%)
Salaries and Social
Charges (17.1) (17.5) +2.3%
Share-based payments (0.8) (0.5) -40.7%
Profit Sharing (3.0) (3.0) -0.8%
Total Staff Costs (20.9) (21.0) +0.4%
% costs 47% 46%
Subcontracted Test
and Studies (10.3) (8.7) -15.9%
Rental and Insurance (2.5) (2.6) +4.8%
Travel Expenditures
(3.7) (4.4) +18.7%
Other External Costs (3.6) (5.0) +39.3%
Total External
Costs (20.1) (20.7) +2.9%
% costs 46% 45%
Other Costs (3.0) (3.8) +25.4%
Total Costs (44.0) (45.5) +3.3%
% sales (42%) (39%)
29
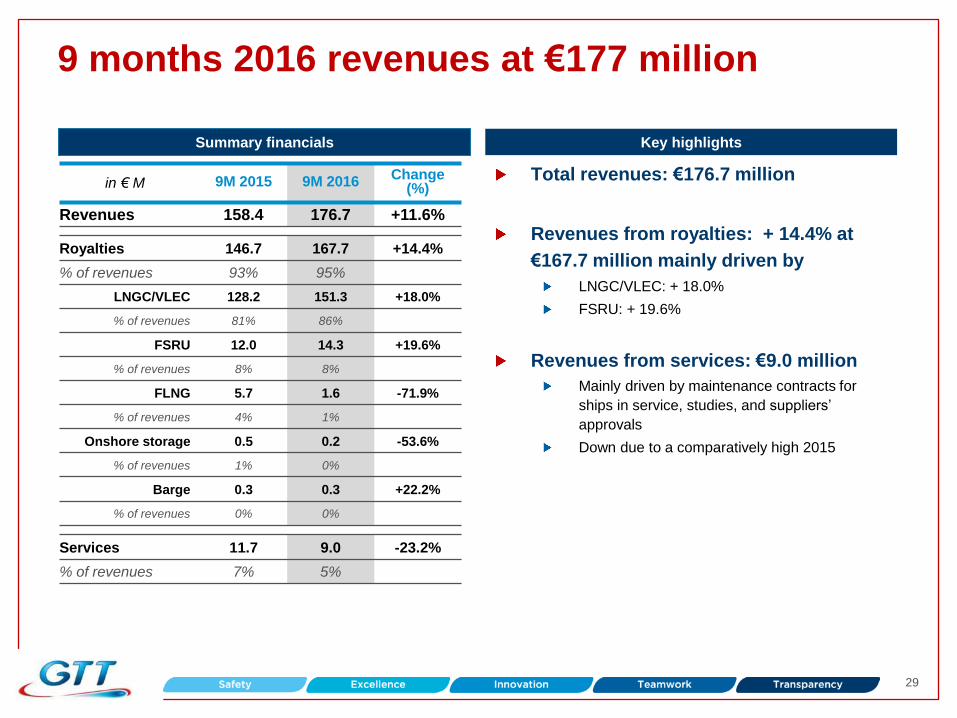
9 months 2016 revenues at €177 million
Total revenues: €176.7 million
Revenues from royalties: + 14.4% at
€167.7 million mainly driven by
LNGC/VLEC: + 18.0%
FSRU: + 19.6%
Revenues from services: €9.0 million
Mainly driven by maintenance contracts for
ships in service, studies, and suppliers’
approvals
Down due to a comparatively high 2015
Summary financials Key highlights
in € M 9M 2015 9M 2016 Change
(%)
Revenues 158.4 176.7 +11.6%
Royalties 146.7 167.7 +14.4%
% of revenues 93% 95%
LNGC/VLEC 128.2 151.3 +18.0%
% of revenues 81% 86%
FSRU 12.0 14.3 +19.6%
% of revenues 8% 8%
FLNG 5.7 1.6 -71.9%
% of revenues 4% 1%
Onshore storage 0.5 0.2 -53.6%
% of revenues 1% 0%
Barge 0.3 0.3 +22.2%
% of revenues 0% 0%
Services 11.7 9.0 -23.2%
% of revenues 7% 5%

30
Outlook 6
31
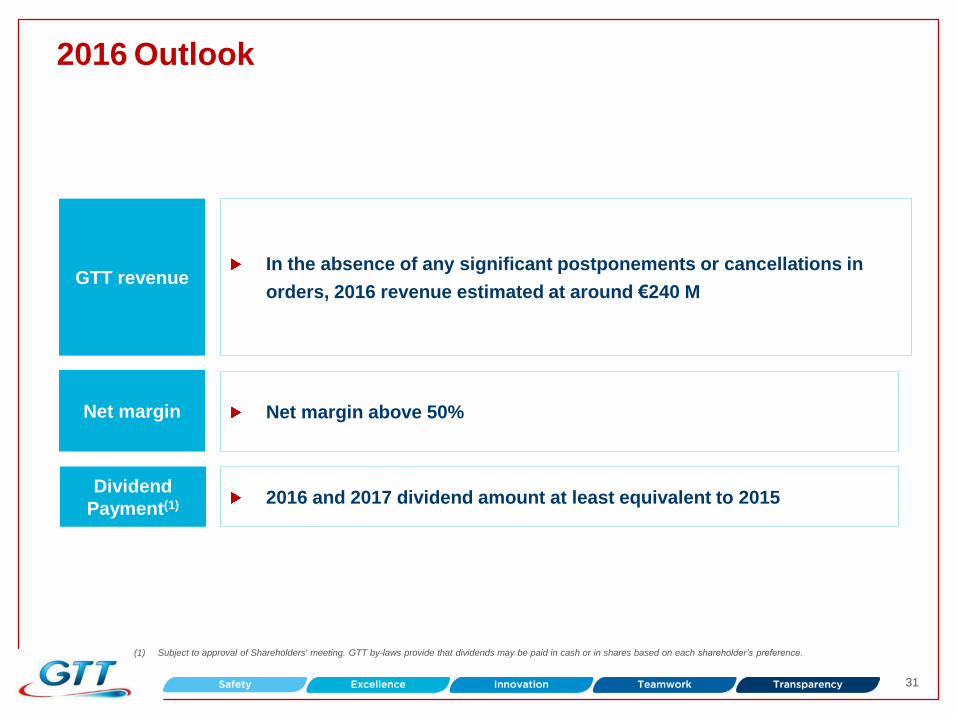
2016 Outlook
GTT revenue In the absence of any significant postponements or cancellations in
orders, 2016 revenue estimated at around €240 M
Dividend
Payment(1) 2016 and 2017 dividend amount at least equivalent to 2015
Net margin Net margin above 50%
(1) Subject to approval of Shareholders' meeting. GTT by-laws provide that dividends may be paid in cash or in shares based on each shareholder’s preference.

32
Appendices

33
Appendix 1: GTT, a French engineering company, global leader in liquefied gas containment systems
Company overview Key figures
Profile
Leading engineering company
Expert in liquefied gas containment
systems
More than 50-year track record
Activities
Designs and licenses membrane
technologies for containment of
liquefied gas during shipping or
onshore and offshore storage
Provides design studies, construction
assistance and innovative services
in € million FY 2014 FY 2015
Total Revenues 226.8 226.5
Royalties
Services
216.4
10.4
209.3
17.2
Net Income 115.4 117.2
Net margin (%) 50.9% 51.8%
As at December 2015
378 employees
Executives: 69%

34
Conrad 1%
Daewoo 48%
Hudong-Zhonghua
10%
Hyundai 16%
Imabari 3%
Samsung 22%
Appendix 2: breakdown of order book as at Sept 30, 2016
Strong order book of 103 units
91 LNGC/VLEC(1)
7 FSRU/RV(1)
1 LNG bunker barge
2 FLNG
2 Onshore storage
Deliveries: 17 (15 LNGC, 1 FSRU, 1 FLNG)
New orders: 2 LNGC
9M 2016 movements in the order book
Notes: LNGC – Liquefied Natural Gas Carrier, VLEC – Very Large Ethane Carrier, FSRU – Floating Storage and Regasification Unit, RV – Regasification Vessel, FLNG – Floating
Liquefied Natural Gas
(1) Including a LNGC order conversion into a FSRU order
(2) As at Dec. 31, 2015 / Excluding onshore storage
(3) As at Sept. 30, 2016 / Excluding onshore storage
(4) Hyundai Group includes Hyundai Heavy Industries and Hyundai Samho Heavy Industries orders
Diversified shipowners(3)
(4)
6 shipyard clients(3) Balanced geographical breakdown(2)
Algeria 2% Australia
14% Bahrain
1% Colombia
1% Malaysia
5% Nigeria
1%
Russia West 11%
United States 30%
Uruguay 1%
Various countries
18%
Non affected 16%
Teekay LNG 13%
Maran Gas Maritime
9%
BP Shipping
6%
China Shipping
LNG 6%
Reliance 6%
Teekay LNG / China
LNG 6%
GasLog 5% BW Gas
4%
SK Shipping
4%
Yamal Trade
4%
Other (1-3% each) 37%

35
Appendix 3: a streamlined group and organisation
* Member of the executive committee
GT
T G
rou
p
Philippe Berterottière* Chairman and Chief Executive
Officer
GT
T S
A o
rgan
isati
on
Lélia Ghilini*
General Counsel
Jacques Danton
LNG as fuel
~16 employees
Julien Burdeau*
Innovation
~100 employees
David Colson*
Commercial
~27 employees
Karim Chapot*
Technical
~175 employees
Cécile Arson*
Finance &
Administration
~37 employees
Isabelle Delattre*
Human
Resources
~7 employees
Julien Burdeau* Chief Operating Officer
GTT North America GTT Training Cryovision GTT SEA PTE Ltd Cryometrics

36
Appendix 4: Capital structure
Since March 31, 2016
Stabilised capital structure
37
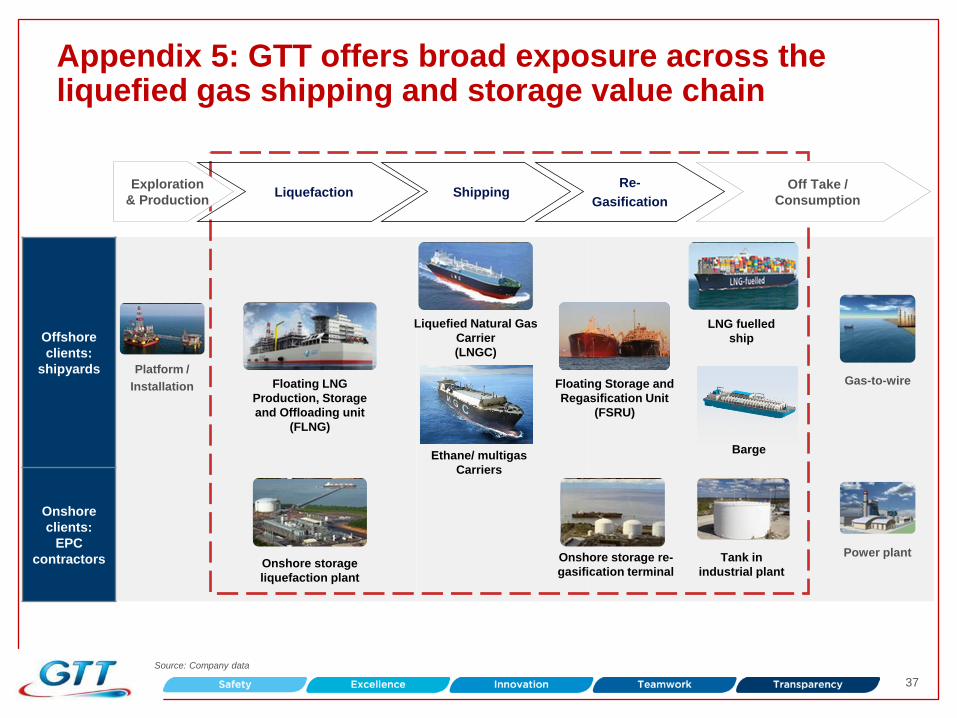
Appendix 5: GTT offers broad exposure across the liquefied gas shipping and storage value chain
Offshore
clients:
shipyards
Onshore
clients:
EPC
contractors
Source: Company data
Exploration
& Production Liquefaction Shipping
Off Take /
Consumption
Re-
Gasification
Onshore storage
liquefaction plant
Onshore storage re-
gasification terminal
Floating LNG
Production, Storage
and Offloading unit
(FLNG)
Liquefied Natural Gas
Carrier
(LNGC)
Floating Storage and
Regasification Unit
(FSRU)
LNG fuelled
ship
Gas-to-wire
Power plant
Platform /
Installation
Tank in
industrial plant
Ethane/ multigas
Carriers
Barge
38
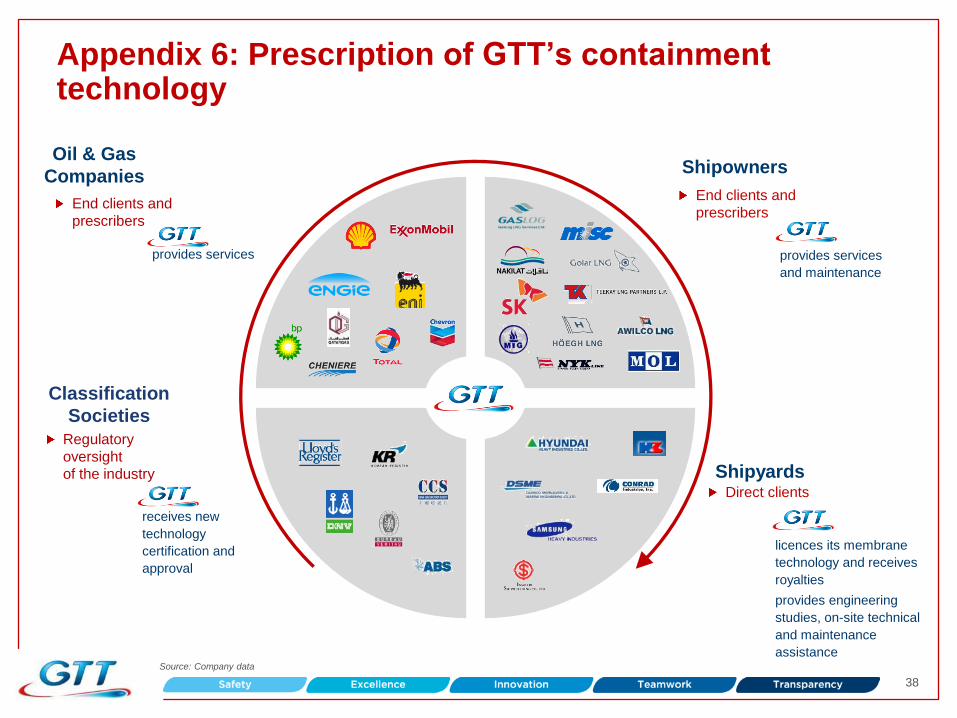
End clients and
prescribers
Appendix 6: Prescription of GTT’s containment technology
Source: Company data
licences its membrane
technology and receives
royalties
provides engineering
studies, on-site technical
and maintenance
assistance
receives new
technology
certification and
approval
provides services
provides services
and maintenance
Oil & Gas
Companies Shipowners
Classification
Societies
Shipyards Direct clients
End clients and
prescribers
Regulatory
oversight
of the industry

39
Appendix 7: GTT membrane technologies
NO 96
Primary Invar
membrane
Primary
insulation box
Secondary Invar
membrane
Inner hull
Secondary
insulation box
Invar
tongue
Coupler
Composite secondary membrane (Triplex)
Inner
hull
Metallic insert
Top bridge
pad
Primary stainless steel
membrane
Corner
panel
Hard wood
key
Resin ropes Insulation panel
Mark III
Back Plywood
Secondary insulation layer (RPUF)
Primary insulation
layer (RPUF)
Top plywood

40
Mark V (BOR (1) of 0.07%)
Two cooperation agreements with
Samsung and Hyundai
General Approval from 2 classification
societies
NO96 Max (BOR (1) of 0.09%)
Cooperation agreement with Daewoo
AIP from main classification societies
Development of Mark FIT for LNG as
fuel
Appendix 8: innovation is key
Recently developed technologies
represent more than 80% of the
order book as at Sept 30, 2016
R&D and innovation 2015 key
figures:
116 employees
€21 M of operating expenses
900+ patents
Diversified technologies New technologies going forward
(1) Boil off rate per day
Multi-gas 6%
Mark III Flex 28%
NO96-L-03 3%
NO96 GW 44%
NO96 11%
Mark III 8%
41
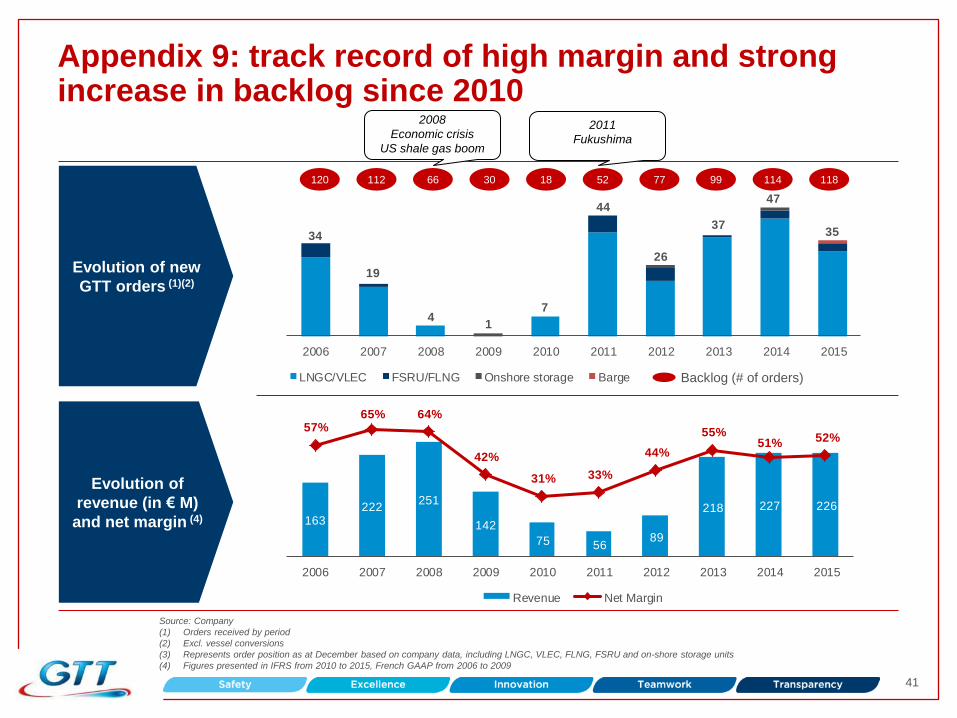
Evolution of new
GTT orders (1)(2)
163222
251
142
75 5689
218 227 226
57%65% 64%
42%
31% 33%
44%
55%51% 52%
2006 2007 2008 2009 2010 2011 2012 2013 2014 2015
Revenue Net Margin
34
19
41
7
44
26
37
47
35
2006 2007 2008 2009 2010 2011 2012 2013 2014 2015
LNGC/VLEC FSRU/FLNG Onshore storage Barge
Source: Company
(1) Orders received by period
(2) Excl. vessel conversions
(3) Represents order position as at December based on company data, including LNGC, VLEC, FLNG, FSRU and on-shore storage units
(4) Figures presented in IFRS from 2010 to 2015, French GAAP from 2006 to 2009
Evolution of
revenue (in € M)
and net margin (4)
99 120 112 66 30 18 52 77
Backlog (# of orders)
Appendix 9: track record of high margin and strong increase in backlog since 2010
114 118
2008
Economic crisis
US shale gas boom
2011
Fukushima
42
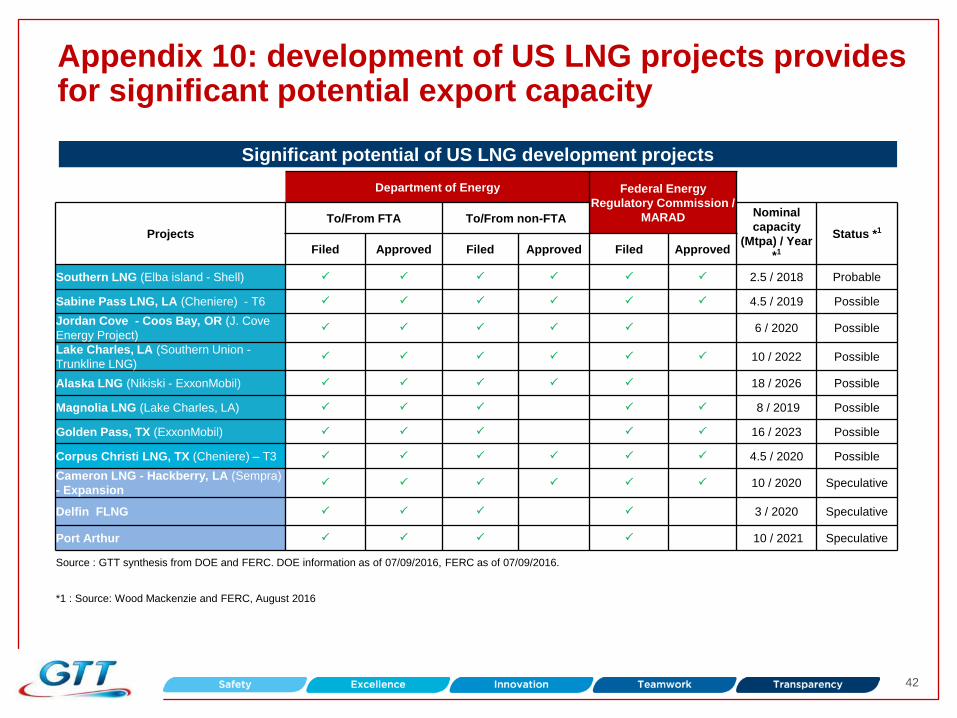
Significant potential of US LNG development projects
Department of Energy Federal Energy
Regulatory Commission /
MARAD
Projects
To/From FTA To/From non-FTA Nominal
capacity
(Mtpa) / Year
*1
Status *1
Filed Approved Filed Approved Filed Approved
Southern LNG (Elba island - Shell) P P P P P P 2.5 / 2018 Probable
Sabine Pass LNG, LA (Cheniere) - T6 P P P P P P 4.5 / 2019 Possible
Jordan Cove - Coos Bay, OR (J. Cove
Energy Project) P P P P P 6 / 2020 Possible
Lake Charles, LA (Southern Union -
Trunkline LNG) P P P P P P 10 / 2022 Possible
Alaska LNG (Nikiski - ExxonMobil) P P P P P 18 / 2026 Possible
Magnolia LNG (Lake Charles, LA) P P P P P 8 / 2019 Possible
Golden Pass, TX (ExxonMobil) P P P P P 16 / 2023 Possible
Corpus Christi LNG, TX (Cheniere) – T3 P P P P P P 4.5 / 2020 Possible
Cameron LNG - Hackberry, LA (Sempra)
- Expansion P P P P P P 10 / 2020 Speculative
Delfin FLNG P P P P 3 / 2020 Speculative
Port Arthur P P P P 10 / 2021 Speculative
Source : GTT synthesis from DOE and FERC. DOE information as of 07/09/2016, FERC as of 07/09/2016.
*1 : Source: Wood Mackenzie and FERC, August 2016
Appendix 10: development of US LNG projects provides for significant potential export capacity

43
Appendix 11: illustrative LNGC revenue recognition summary
2015 key statistics Illustrative revenue /cash recognition
Source: Company
2%4%
38%
56%
Year 0 Year 1 Year 2 Year 3
c. 18 months
studies
c. 18 months
royalties
% of total revenues – order of 4 LNGCs placed on June 30 of year 0
Studies
collected on
the first vessel
of the order
TOTAL LNGC ORDERS
Total orders: 31
Of which first vessels: 8
PRICING
Fixed rate of €334.62/m²
as at October 2015
Indexed to French labour
cost
AVERAGE REVENUE PER LNGC
First vessel: €9.5 M
Second and subsequent
vessels: €7.6 M

44
Appendix 12: an attractive business model supporting high cash generation
Source: Company
(1) Illustrative cycle for the first LNGC ordered by a particular customer, including engineering studies completed by GTT
Invoicing and revenue recognition Business model supports high cash generation
Months from receipt of order
▶ Revenue is recognized pro-rata temporis
between milestones
▶ Timing of invoicing and cash collection
according to 5 milestones leading to
structurally negative working capital for
GTT
▶ Initial payment collected from shipyards
at the effective date of order of a
particular vessel (10%)
▶ Steel cutting (20%)
▶ Keel laying (20%)
▶ Ship launching (20%)
▶ Delivery (30%) Negative Working Capital Position
Positive Working Capital Position
Cash
Revenue
% of contract (1)
Months from receipt of order
Negative Working Capital Position
Positive Working Capital Position
Cash
Revenue
Steel cutting
Keel laying
Ship
launching
Delivery c. 18 months
studies
c. 18 months
royalties

45
Appendix 13: sustained level of revenue since 2013 reflecting increase in order intake
Order book evolution Historical revenue development
67 50
82
210 217 209
8
6
7
7 10
17
75
56
89
218
227 226
0
50
100
150
200
250
2010 2011 2012 2013 2014 2015
Revenue from licenses (€ M)
Revenue from services (€ M)
In € M
2015 Revenue Breakdown
FSRU8.5%
FLNG3.6%
Onshore Storage
0.5%
Services7.5%
Barge0.2%
18
52
77
99
114 118
2010 2011 2012 2013 2014 2015
In number of orders – at end of period
Source: Company
LNGC/VLEC
79.6%

46
Appendix 14: managing employee base to meet growing demand
Evolution of GTT staff
242
286
370 377 378
0
100
200
300
400
2011 2012 2013 2014 2015
GTT staff by type of contract
(1) As at December 31, 2015
Permanent
85%
Total: 378 employees(1)
Non-permanent
15%
Staff levels
Current staff level adequate to support growth and new developments in the forthcoming years
85% of staff are on permanent contracts; 15% non-permanent
In 2015: 116 employees dedicated to innovation
Dec 31, 2014 Dec 31, 2013 Dec 31, 2012 Dec 31, 2011 Dec 31, 2015

47
Appendix 15: a responsible company
Social and societal responsibility
Social
Employment: recruit, retain and develop talents >>> 4.2% of turnover in 2015
Compensation: implement an attractive and evolutive system
Training: develop employability and expertise >>> 8,316 hours of training in 2015
Safety: improve preventive measures through action plans
Health: annual survey on working conditions >>> Satisfaction rate of 83% in 2015
Societal: continuous and constructive dialogue with all the LNG stakeholders
Environmental responsibility
Stakeholders
Performance of GTT systems
Safety of installations and crew
LNG training sessions for customers and partners
Hotline for shipowners
GTT
Environmental responsibility at site
A proactive sustainable development policy
48
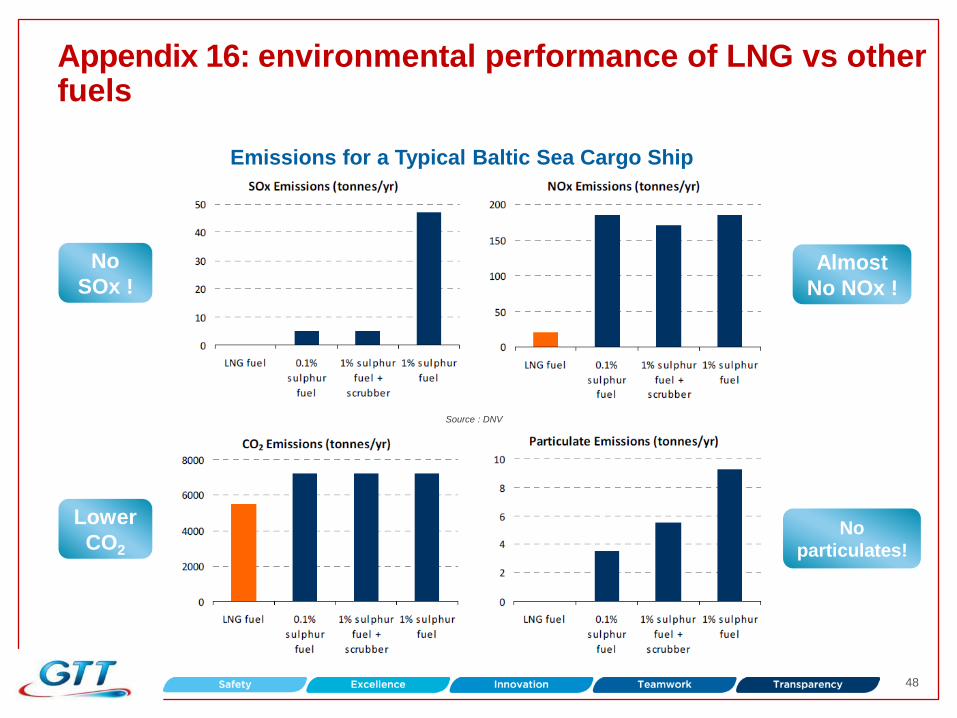
Appendix 16: environmental performance of LNG vs other fuels
Emissions for a Typical Baltic Sea Cargo Ship
No
SOx ! Almost
No NOx !
No
particulates!
Lower
CO2
Source : DNV

49
Appendix 17: natural gas, the fastest-growing fossil fuel worldwide
Natural gas demand drivers
Source: IEA data 2015 WEO
Natural gas is the fastest
growing major energy source
Close to 25% of energy
consumption in 2040, at the
same level as coal
Small (8.6%) but increasing
share of LNG in natural gas
consumption
Increase of trade gas
Why?
Abundant, widespread resources
Least carbon intensive fossil fuel
Geopolitical and regional drivers
Long term energy consumption trends
Gas exports and LNG share
50
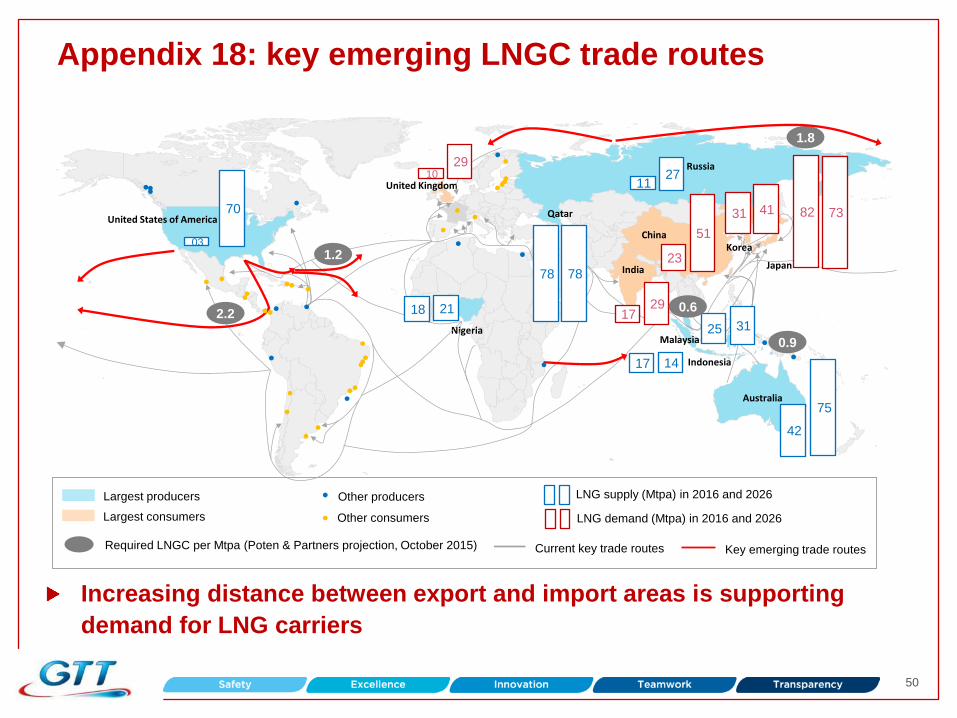
Appendix 18: key emerging LNGC trade routes
Largest producers
Largest consumers
Current key trade routes Key emerging trade routes
LNG supply (Mtpa) in 2016 and 2026
LNG demand (Mtpa) in 2016 and 2026 Other consumers
Other producers
Required LNGC per Mtpa (Poten & Partners projection, October 2015)
Increasing distance between export and import areas is supporting
demand for LNG carriers
Nigeria
United Kingdom
Qatar
China
India
Australia
Indonesia
Malaysia
Russia
United States of America
Japan
70
03
10 29
18 21
78 78
25 31
11 27
17 14
42
75
82 73
23
51
17 29
1.2
1.8
0.6
0.9
2.2
31 41
Korea

51
Appendix 19: focus on GTT’s competitive advantages
Source: Company data and comment (September 30, 2016)
(1) Other technologies have been developed, however are not known to have obtained final certification or orders to date. Excludes vessel orders below 30,000 m3
GTT’s technology positioning (1)
GTT Moss SPB KC-1
Technology ▶ Membrane ▶ Spherical tank ▶ Tank ▶ Membrane
Construction
costs
▶ Requires less steel and
aluminum than tanks for
a given LNG capacity
▶ Higher costs ▶ Higher costs ▶ Slightly higher costs
than GTT
Operating
costs
▶ More efficient use of
space
▶ Limited BOR (0.07%)
▶ Higher fuel / fee costs ▶ Higher fuel / fee costs ▶ Higher opex due to
BOR (0.16%)
LNGCs in
construction ▶ 85 ▶ 21 ▶ 4 ▶ 2
LNGCs in
operation ▶ 305 ▶ 97 ▶ 2 small ▶ None
Other ▶ Value added services ▶ Higher centre of gravity;
harder to navigate
▶ Japanese technology
developed 25 years ago.
No significant experience
▶ Korean technology with
no experience at sea
GTT technologies : cost effective, volume optimisation and high return of experience
52
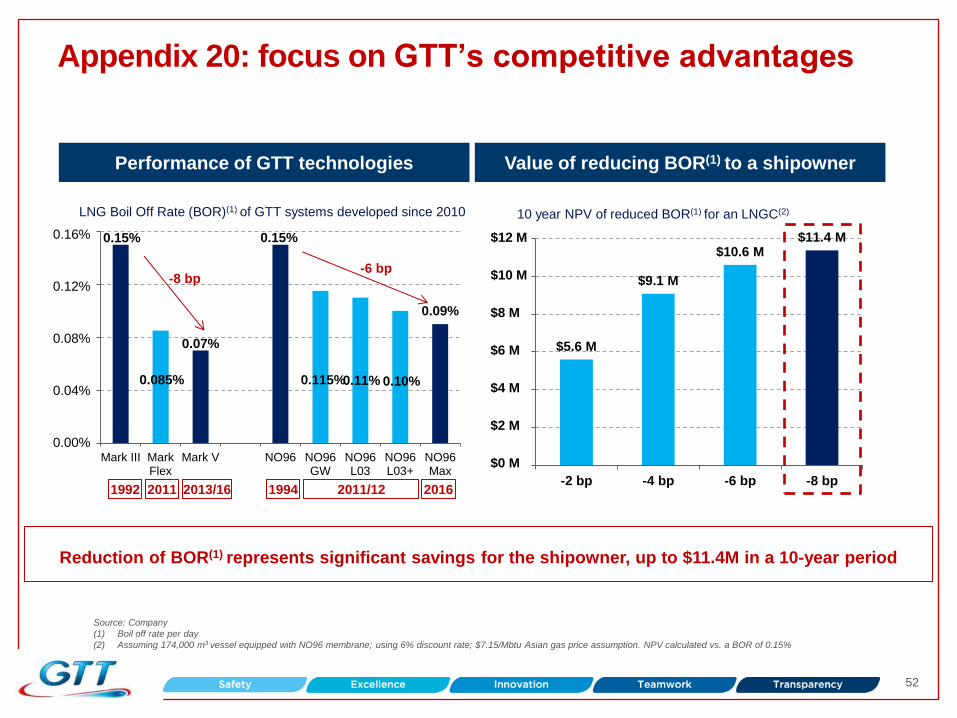
$5.6 M
$9.1 M
$10.6 M $11.4 M
0 M$
2 M$
4 M$
6 M$
8 M$
10 M$
12 M$
-2 bp -4 bp -6 bp -8 bp
Value of reducing BOR(1) to a shipowner Performance of GTT technologies
Appendix 20: focus on GTT’s competitive advantages
Reduction of BOR(1) represents significant savings for the shipowner, up to $11.4M in a 10-year period
0.15%
0.085%
0.07%
0.15%
0.115% 0.11% 0.10%
0.09%
0,00%
0,04%
0,08%
0,12%
0,16%
Mark III MarkFlex
Mark V NO96 NO96GW
NO96L03
NO96L03+
NO96Max
-8 bp -6 bp
10 year NPV of reduced BOR(1) for an LNGC(2)
Source: Company
(1) Boil off rate per day
(2) Assuming 174,000 m3 vessel equipped with NO96 membrane; using 6% discount rate; $7.15/Mbtu Asian gas price assumption. NPV calculated vs. a BOR of 0.15%
1992 2011 2013/16 2011/12 1994 2016
LNG Boil Off Rate (BOR)(1) of GTT systems developed since 2010
0.16%
0.12%
0.08%
0.04%
0.00%
$12 M
$10 M
$8 M
$6 M
$0 M
$2 M
$4 M

53
Appendix 21: information about the KFTC enquiry
On January 29, 2016, GTT was notified by the Korean Fair Trade Commission (KFTC) that
an enquiry had been opened.
Concerns a possible abuse by the Company of dominant position because of its
commercial practices in Korea.
We have received a first request for information (RFI) from the KFTC setting forth its
demands.
Our representatives in Korea have been in contact with the KFTC. The nature of these
exchanges remains confidential
The opening of this enquiry should not lead to any prejudgement as to its outcome.
At this stage, it is not possible to estimate either the length of the enquiry or its potential
outcome.
GTT believes that its business practices are compliant with the relevant competition laws
and intends to fully cooperate with the KFTC.
The Company will keep the markets updated as to any significant developments in this
respect.
