notifiable diseases and mortality tables · notifiable diseases and mortality tables ... jamestown...
TRANSCRIPT

Morbidity and Mortality Weekly Report
ND-624 MMWR / August 18, 2017 / Vol. 66 / No. 32
Notifiable Diseases and Mortality Tables
See Table I footnotes on next page.
TABLE I. Provisional cases of selected* infrequently reported notifiable diseases (<1,000 cases reported during the preceding year) — United States, week ending August 12, 2017 (32nd week)† (Export data)
DiseaseCurrent
weekCum 2017
5-year weekly
average§
Total cases reported for previous yearsStates reporting cases
during current week (No.)2016 2015 2014 2013 2012
Anthrax — — — — — — — —Arboviral diseases neuroinvasive and nonneuroinvasive¶,**:
Chikungunya virus disease — 29 9 246 896 NN NN NNEastern equine encephalitis virus disease — — 0 7 6 8 8 15Jamestown Canyon virus disease — 17 1 15 11 11 22 2La Crosse virus disease 5 11 2 35 55 80 85 78 TN (5)Powassan virus disease — 17 0 22 7 8 12 7St. Louis encephalitis virus disease — 1 0 8 23 10 1 3Western equine encephalitis virus disease — — — — — — — —
Botulism, total — 87 3 201 195 161 152 168foodborne — 13 1 31 37 15 4 27infant — 65 3 144 138 127 136 123other (wound and unspecified) — 9 0 26 20 19 12 18
Brucellosis 1 66 3 127 126 92 99 114 NE (1)Chancroid — 6 0 7 11 — — 15Cholera — 1 0 2 5 5 14 17Cyclosporiasis** 27 548 34 535 645 388 784 123 RI (1), NY (3), NYC (5), OH (2), VA (1),
TX (14), CA (1)Diphtheria — — — — — 1 — 1Haemophilus influenzae invasive disease (age <5 yrs)††:
serotype b — 15 1 30 29 40 31 30nontypeable 1 83 3 196 175 128 141 115 ME (1)non-b serotype — 85 1 159 135 266 233 263unknown serotype 2 155 2 187 167 39 34 37 NY (1), FL (1)
Hansen’s disease** — 41 2 78 89 88 81 82Hantavirus**:
Hantavirus infection (non-HPS) — — 0 2 3 NN NN NNHantavirus Pulmonary Syndrome (HPS) — 5 0 14 21 32 21 30
Hemolytic uremic syndrome, postdiarrheal** — 140 10 307 274 250 329 274Hepatitis B, perinatal virus infection§§ — 9 1 35 37 47 48 40Influenza-associated pediatric mortality**,¶¶ — 108 0 83 130 141 160 52Leptospirosis** — 30 1 78 40 38 NN NNListeriosis 9 364 22 786 768 769 735 727 NY (1), NYC (3), PA (1), OH (1), FL (2), AZ (1)Measles*** 1 119 2 85 188 667 187 55 OH (1)Meningococcal disease (Neisseria meningitidis)†††:
serogroup ACWY — 41 2 126 120 123 142 161serogroup B — 40 1 86 111 89 99 110other serogroup — 9 0 21 21 25 17 20unknown serogroup 1 119 2 142 120 196 298 260 VA (1)
Novel influenza A virus infections§§§ 3 19 12 23 7 3 21 313 ND (1), OH (1), PA (1)Plague — 1 0 — 16 10 4 4Poliomyelitis, paralytic — — — — — — 1 —Polio virus infection, nonparalytic** — — — — — — — —Psittacosis** — 3 0 12 4 8 6 2Q fever, total** 1 89 3 164 156 168 170 135
acute 1 73 3 132 122 132 137 113 TX (1)chronic — 16 1 32 34 36 33 22
Rabies, human — — 0 — 2 1 2 1SARS-CoV — — — — — — — —Smallpox — — — — — — — —Streptococcal toxic shock syndrome** 1 212 3 283 335 259 224 194 MO (1)Syphilis, congenital¶¶¶ — 274 9 628 493 458 348 322Toxic shock syndrome (other than streptococcal)** 1 14 1 40 64 59 71 65 TN (1)Trichinellosis** — 5 0 26 14 14 22 18Tularemia 1 101 8 230 314 180 203 149 MO (1)Typhoid fever (casued by Salmonella typhi) 1 167 9 376 367 349 338 354 WA (1)Vancomycin-intermediate Staphylococcus aureus** — 46 3 108 183 212 248 134Vancomycin-resistant Staphylococcus aureus** — — 0 — 3 — — 2

Morbidity and Mortality Weekly Report
MMWR / August 18, 2017 / Vol. 66 / No. 32 ND-625
TABLE I. (Continued) Provisional cases of selected* infrequently reported notifiable diseases (<1,000 cases reported during the preceding year) — United States, week ending August 12, 2017 (32nd week)† (Export data)
DiseaseCurrent
weekCum 2017
5-year weekly
average§
Total cases reported for previous yearsStates reporting cases
during current week (No.)2016 2015 2014 2013 2012
Viral hemorrhagic fevers****:Crimean-Congo hemorrhagic fever — — — — — NP NP NPEbola hemorrhagic fever — — — — — 4 NP NPGuanarito hemorrhagic fever — — — — — NP NP NPJunin hemorrhagic fever — — — — — NP NP NPLassa fever — — — — 1 1 NP NPLujo virus — — — — — NP NP NPMachupo hemorrhagic fever — — — — — NP NP NPMarburg fever — — — — — NP NP NPSabia-associated hemorrhagic fever — — — — — NP NP NP
Yellow fever — — — — — — — —Zika virus disease, non-congenital†††† 1 250 84 5,107 NN NN NN NN FL (1)
—: No reported cases. N: Not reportable. NA: Not available. NN: Not Nationally Notifiable. NP: Nationally notifiable but not published. Cum: Cumulative year-to-date counts. * Case counts for reporting years 2016 and 2017 are provisional and subject to change. Data for years 2012 through 2015 are finalized. For further information on interpretation
of these data, see http://wwwn.cdc.gov/nndss/document/ProvisionalNationaNotifiableDiseasesSurveillanceData20100927.pdf. † This table does not include cases from the U.S. territories. Three low incidence conditions, rubella, rubella congenital, and tetanus, are in Table II to facilitate case count verification
with reporting jurisdictions. § Calculated by summing the incidence counts for the current week, the 2 weeks preceding the current week, and the 2 weeks following the current week, for a total of 5 preceding
years. Additional information is available at http://wwwn.cdc.gov/nndss/document/5yearweeklyaverage.pdf. ¶ Updated weekly reports from the Division of Vector-Borne Diseases, National Center for Emerging and Zoonotic Infectious Diseases (ArboNET Surveillance). Data for West Nile
virus are available in Table II. ** Not reportable in all jurisdictions. Data from states where the condition is not reportable are excluded from this table, except for the arboviral diseases and influenza-associated
pediatric mortality. Reporting exceptions are available at http://wwwn.cdc.gov/nndss/downloads.html. †† Data for Haemophilus influenzae (all ages, all serotypes) are available in Table II. §§ In 2016, the nationally notifiable condition ‘Hepatitis B Perinatal Infection’ was renamed to ‘Perinatal Hepatitis B Virus Infection’ and reflects updates in the 2016 CSTE position
statement for Perinatal Hepatitis B Virus Infection. ¶¶ Updated weekly from reports to the Influenza Division, National Center for Immunization and Respiratory Diseases. Since October 2, 2016, 104 influenza-associated pediatric
deaths occurring during the 2016-17 season have been reported. *** The one measles case reported for the current week was imported. ††† Data for meningococcal disease (all serogroups) are available in Table II. §§§ Novel influenza A virus infections are human infections with influenza A viruses that are different from currently circulating human seasonal influenza viruses. With the exception
of one avian lineage influenza A (H7N2) virus, all novel influenza A virus infections reported to CDC since 2012 have been variant influenza viruses. Total case counts are provided by the Influenza Division, National Center for Immunization and Respiratory Diseases (NCIRD).
¶¶¶ Updated weekly from reports to the Division of STD Prevention, National Center for HIV/AIDS, Viral Hepatitis, STD, and TB Prevention. **** Prior to 2015, CDC’s National Notifiable Diseases Surveillance System (NNDSS) did not receive electronic data about incident cases of specific viral hemorrhagic fevers; instead
data were collected in aggregate as “viral hemorrhagic fevers”. Beginning in 2015, NNDSS has been updated to receive data for each of the viral hemorrhagic fevers listed below. In addition to the four cases of Ebola diagnosed in the United States to date in 2014, six residents of the United States have been medically evacuated to the United States for care after developing Ebola in West Africa. Ten of the 11 VHF cases reported for 2014 are confirmed as Ebola and one as Lassa fever.
†††† The Council of State and Territorial Epidemiologists approved position statement 16-ID-01 in June 2016, which modifies the previous case definition and naming convention from “Zika virus congenital infection” to “Zika virus disease, non-congenital”.

Morbidity and Mortality Weekly Report
ND-626 MMWR / August 18, 2017 / Vol. 66 / No. 32
* Ratio of current 4-week total to mean of 15 4-week totals (from previous, comparable, and subsequent 4-week periods for the past 5 years). The point where the hatched area begins is based on the mean and two standard deviations of these 4-week totals.
FIGURE I. Selected notifiable disease reports, United States, comparison of provisional 4-week totals August 12, 2017, with historical data
820.50.25 1
Beyond historical limits
DISEASE
Ratio (Log scale)*
DECREASE INCREASECASES CURRENT
4 WEEKS
Hepatitis A, acute
Hepatitis B, acute
Hepatitis C, acute
Legionellosis
Measles
Mumps
Pertussis
Giardiasis
Meningococcal disease
524
56
53
78
367
5
7
162
546
4
Data presented by the National Notifiable Diseases Data Team in the weekly MMWR are provisional, based on weekly reports to CDC by state health departments. Readers who have difficulty accessing this PDF file may access the HTML file at https://www.cdc.gov/mmwr/volumes/66/wr/mm6632md.htm. Address all inquiries about the MMWR Series, including material to be considered for publication, to Editor, MMWR Series, Mailstop E-90, CDC, 1600 Clifton Rd., N.E., Atlanta, GA 30329-4027 or to [email protected].
National Notifiable Diseases Data Team
Yvette D. DominiqueDeborah A. Adams Willie J. AndersonDiana Harris Onweh Alan W. Schley

Morbidity and Mortality Weekly Report
MMWR / August 18, 2017 / Vol. 66 / No. 32 ND-627
TABLE II. Provisional cases of selected notifiable diseases (≥1,000 cases reported during the preceding year), and selected* low frequency diseases, United States and U.S. territories, weeks ending August 12, 2017, and August 13, 2016 (32nd week)† (Export data)
Reporting area
Babesiosis Campylobacteriosis
Current week
Previous 52 weeks
Cum 2017 Cum 2016 Current week
Previous 52 weeks
Cum 2017 Cum 2016Med Max Med Max
United States 72 14 125 851 1,287 712 1,103 3,079 34,888 35,666New England 6 7 78 399 836 8 52 101 1,627 1,815
Connecticut — 1 20 15 239 2 11 27 375 427Maine 4 1 10 62 50 — 3 12 105 162Massachusetts — 3 51 264 413 — 26 50 773 850New Hampshire — 0 6 28 11 5 5 9 160 132Rhode Island 1 0 15 24 116 — 4 13 121 123Vermont 1 0 5 6 7 1 3 10 93 121
Mid. Atlantic 66 5 119 412 347 121 143 225 4,640 4,715New Jersey — 1 20 79 144 — 31 60 891 1,203New York (Upstate) 55 3 118 278 165 42 33 84 1,067 1,038New York City 11 0 13 55 38 45 36 59 1,256 1,020Pennsylvania N 0 0 N N 34 42 89 1,426 1,454
E.N. Central — 1 4 31 48 72 145 258 4,581 5,059Illinois — 0 0 — 2 — 38 62 1,141 1,242Indiana — 0 0 — — — 16 30 447 656Michigan — 0 1 1 — — 32 54 842 938Ohio — 0 1 2 — 62 37 65 1,192 1,203Wisconsin — 1 3 28 46 10 29 61 959 1,020
W.N. Central — 0 2 1 42 50 91 198 2,562 3,892Iowa — 0 1 1 — 26 18 44 650 682Kansas N 0 0 N N — 12 32 304 486Minnesota — 0 2 — 40 — 0 57 — 1,025Missouri N 0 1 N N 15 26 44 846 846Nebraska — 0 0 — 1 9 10 23 354 402North Dakota — 0 0 — 1 — 4 13 165 139South Dakota — 0 0 — — — 7 16 243 312
S. Atlantic — 0 1 4 6 26 167 258 5,311 5,702Delaware — 0 1 3 1 2 3 9 94 102District of Columbia — 0 1 — 1 — 0 4 6 43Florida N 0 0 N N — 73 111 2,455 2,036Georgia N 0 0 N N 18 19 36 703 629Maryland — 0 1 1 3 — 14 31 375 521North Carolina N 0 0 N N — 25 49 710 930South Carolina — 0 1 — 1 — 7 16 161 234Virginia N 0 0 N N 6 25 69 764 961West Virginia — 0 0 — — — 3 15 43 246
E.S. Central — 0 1 2 1 11 51 75 1,551 1,443Alabama — 0 1 1 — — 12 30 434 429Kentucky — 0 0 — 1 — 16 27 398 426Mississippi N 0 0 N N 8 8 15 298 132Tennessee — 0 1 1 — 3 14 24 421 456
W.S. Central — 0 1 — 3 141 129 293 3,786 4,011Arkansas — 0 0 — 1 14 11 27 387 327Louisiana — 0 0 — 2 — 8 23 125 334Oklahoma N 0 0 N N 17 16 60 336 648Texas — 0 1 — — 110 95 241 2,938 2,702
Mountain — 0 0 — 1 64 89 165 2,982 2,858Arizona — 0 0 — — 19 22 50 817 796Colorado N 0 0 N N 38 18 45 676 692Idaho N 0 0 N N 3 10 23 329 285Montana — 0 0 — 1 3 7 16 250 248Nevada N 0 0 N N — 3 9 88 132New Mexico N 0 0 N N 1 13 27 381 270Utah — 0 0 — — — 10 21 325 331Wyoming — 0 0 — — — 3 9 116 104
Pacific — 0 1 2 3 219 201 2,060 7,848 6,171Alaska N 0 0 N N 1 2 7 54 64California — 0 1 1 2 109 170 265 5,852 5,164Hawaii N 0 0 N N 19 9 36 445 337Oregon — 0 1 1 1 25 18 37 615 606Washington — 0 0 — — 65 4 1,911 882 —
TerritoriesAmerican Samoa U 0 0 U U — 0 0 — —C.N.M.I. — — — — — — — — — —Guam — 0 0 — — — 0 3 — 1Puerto Rico N 0 0 N N — 0 2 14 30U.S. Virgin Islands N 0 0 N N — 0 0 — —
C.N.M.I.: Commonwealth of Northern Mariana Islands.U: Unavailable. —: No reported cases. N: Not reportable. NN: Not Nationally Notifiable. NP: Nationally notifiable but not published. Cum: Cumulative year-to-date counts. Med: Median. Max: Maximum.* Three low incidence conditions, rubella, rubella congenital, and tetanus, are in Table II to facilitate case count verification with reporting jurisdictions.† Case counts for reporting years 2016 and 2017 are provisional and subject to change. For further information on interpretation of these data, see http://wwwn.cdc.gov/nndss/document/
ProvisionalNationaNotifiableDiseasesSurveillanceData20100927.pdf. Data for tuberculosis are displayed in Table III, which appears quarterly.

Morbidity and Mortality Weekly Report
ND-628 MMWR / August 18, 2017 / Vol. 66 / No. 32
TABLE II. (Continued) Provisional cases of selected notifiable diseases (≥1,000 cases reported during the preceding year), and selected* low frequency diseases, United States and U.S. territories, weeks ending August 12, 2017, and August 13, 2016 (32nd week)† (Export data)
Reporting area
Chlamydia trachomatis infection Coccidioidomycosis
Current week
Previous 52 weeks
Cum 2017 Cum 2016 Current week
Previous 52 weeks
Cum 2017 Cum 2016Med Max Med Max
United States 18,367 31,217 37,915 950,042 971,148 143 208 363 5,856 6,120New England 664 1,063 1,524 32,153 32,429 — 0 1 1 2
Connecticut 21 252 459 5,554 8,045 N 0 0 N NMaine — 88 153 2,704 2,474 N 0 0 N NMassachusetts 342 556 617 17,078 16,084 N 0 0 N NNew Hampshire 141 73 201 3,337 2,411 — 0 1 1 2Rhode Island 159 80 496 2,816 2,353 — 0 1 — —Vermont 1 24 102 664 1,062 N 0 0 N N
Mid. Atlantic 2,787 4,087 5,094 130,947 120,901 — 0 0 — —New Jersey 309 685 793 20,230 20,972 N 0 0 N NNew York (Upstate) 942 854 2,358 26,025 24,444 N 0 0 N NNew York City 782 1,391 1,594 43,802 40,488 N 0 0 N NPennsylvania 754 1,106 2,005 40,890 34,997 N 0 0 N N
E.N. Central 1,404 4,309 5,214 125,099 144,911 2 1 4 27 51Illinois — 1,045 1,501 27,889 44,842 N 0 0 N NIndiana 296 639 974 20,422 18,911 — 0 0 — 1Michigan 173 851 1,095 24,751 27,670 — 0 2 11 27Ohio 548 1,169 1,275 35,503 37,127 2 0 4 15 13Wisconsin 387 524 641 16,534 16,361 — 0 2 1 10
W.N. Central 557 1,897 2,128 56,661 57,405 — 1 2 22 75Iowa 155 261 302 7,875 7,777 N 0 0 N NKansas 116 257 295 7,936 7,269 N 0 0 N NMinnesota 29 444 524 12,890 13,783 — 0 2 — 49Missouri 253 631 750 19,199 18,727 — 0 2 10 16Nebraska — 162 274 4,691 4,991 — 0 2 9 4North Dakota 4 59 77 1,740 2,181 — 0 1 3 6South Dakota — 82 120 2,330 2,677 N 0 0 N N
S. Atlantic 3,654 6,357 11,499 197,937 203,054 — 0 2 4 6Delaware 116 102 197 3,317 3,001 — 0 1 — 1District of Columbia 204 157 426 5,728 4,472 — 0 0 — —Florida 1,267 1,907 2,771 60,648 58,104 N 0 0 N NGeorgia 528 1,202 1,432 36,563 39,379 N 0 0 N NMaryland 675 536 1,343 15,589 16,684 — 0 2 4 5North Carolina — 1,149 1,361 28,685 35,360 N 0 0 N NSouth Carolina 506 582 767 18,828 18,020 N 0 0 N NVirginia 276 743 4,710 26,008 25,125 N 0 0 N NWest Virginia 82 84 130 2,571 2,909 N 0 0 N N
E.S. Central 836 1,820 2,485 54,404 58,642 — 0 1 2 —Alabama — 483 633 14,677 18,106 N 0 0 N NKentucky 359 384 714 11,445 9,172 — 0 1 2 —Mississippi 477 325 711 9,147 11,961 N 0 0 N NTennessee — 663 917 19,135 19,403 N 0 0 N N
W.S. Central 3,715 4,223 5,407 130,475 129,431 — 0 3 2 12Arkansas 19 256 549 6,726 9,454 — 0 1 1 1Louisiana 719 694 1,684 22,920 17,931 — 0 3 1 11Oklahoma 72 337 472 9,439 13,344 N 0 0 N NTexas 2,905 2,869 4,072 91,390 88,702 N 0 0 N N
Mountain 1,674 2,096 2,714 62,986 66,241 137 114 159 3,648 3,825Arizona 1,462 670 1,092 22,135 20,098 137 110 155 3,530 3,733Colorado — 485 790 14,666 16,544 N 0 0 N NIdaho — 109 166 2,681 3,607 N 0 0 N NMontana — 76 158 1,106 2,644 — 0 3 13 7Nevada 1 272 433 7,631 8,466 — 2 6 65 45New Mexico 41 252 391 7,581 7,842 — 0 2 7 18Utah 136 190 231 6,081 5,803 — 1 4 31 21Wyoming 34 35 59 1,105 1,237 — 0 1 2 1
Pacific 3,076 5,146 5,737 159,380 158,134 4 83 224 2,150 2,149Alaska 45 114 142 3,380 3,434 N 0 0 N NCalifornia 2,105 3,974 4,445 125,880 120,866 4 83 224 2,145 2,141Hawaii 3 130 180 3,931 4,210 N 0 0 N NOregon 360 347 545 11,209 10,573 — 0 2 5 8Washington 563 503 819 14,980 19,051 N 0 0 N N
TerritoriesAmerican Samoa — 0 0 — — N 0 0 N NC.N.M.I. — — — — — — — — — —Guam — 0 0 — — — 0 0 — —Puerto Rico 165 122 350 4,545 4,867 N 0 0 N NU.S. Virgin Islands — 6 15 46 418 — 0 0 — —
C.N.M.I.: Commonwealth of Northern Mariana Islands.U: Unavailable. —: No reported cases. N: Not reportable. NN: Not Nationally Notifiable. NP: Nationally notifiable but not published. Cum: Cumulative year-to-date counts. Med: Median. Max: Maximum.* Three low incidence conditions, rubella, rubella congenital, and tetanus, are in Table II to facilitate case count verification with reporting jurisdictions.† Case counts for reporting years 2016 and 2017 are provisional and subject to change. For further information on interpretation of these data, see http://wwwn.cdc.gov/nndss/document/
ProvisionalNationaNotifiableDiseasesSurveillanceData20100927.pdf. Data for tuberculosis are displayed in Table III, which appears quarterly.

Morbidity and Mortality Weekly Report
MMWR / August 18, 2017 / Vol. 66 / No. 32 ND-629
TABLE II. (Continued) Provisional cases of selected notifiable diseases (≥1,000 cases reported during the preceding year), and selected* low frequency diseases, United States and U.S. territories, weeks ending August 12, 2017, and August 13, 2016 (32nd week)† (Export data)
Reporting area
Cryptosporidiosis
Dengue Virus Infections
Dengue§ Severe Dengue
Current week
Previous 52 weeks Cum 2017
Cum 2016
Current week
Previous 52 weeks Cum 2017
Cum 2016
Current week
Previous 52 weeks Cum 2017
Cum 2016Med Max Med Max Med Max
United States 149 159 757 4,424 5,947 — 5 33 93 695 — 0 1 5 7New England 3 7 24 211 232 — 0 1 1 22 — 0 0 — —
Connecticut 1 1 6 41 33 — 0 1 — 8 — 0 0 — —Maine 1 1 5 31 27 — 0 1 — 1 — 0 0 — —Massachusetts — 3 14 81 112 — 0 1 — 7 — 0 0 — —New Hampshire — 0 8 23 36 — 0 1 — 2 — 0 0 — —Rhode Island — 0 2 11 6 — 0 1 1 2 — 0 0 — —Vermont 1 1 11 24 18 — 0 1 — 2 — 0 0 — —
Mid. Atlantic 21 18 73 500 500 — 1 10 18 147 — 0 1 1 3New Jersey — 2 23 43 67 — 0 4 1 35 — 0 1 — 3New York (Upstate) 7 5 25 149 136 — 0 3 3 28 — 0 0 — —New York City 6 4 12 102 73 — 0 5 11 70 — 0 0 — —Pennsylvania 8 7 27 206 224 — 0 2 3 14 — 0 1 1 —
E.N. Central 34 35 301 979 1,379 — 0 8 16 50 — 0 1 2 1Illinois — 5 50 135 181 — 0 4 1 21 — 0 1 2 —Indiana — 3 10 83 134 — 0 1 — 6 — 0 0 — 1Michigan — 6 21 179 248 — 0 2 2 12 — 0 0 — —Ohio 27 11 207 288 395 — 0 2 3 6 — 0 0 — —Wisconsin 7 12 55 294 421 — 0 2 10 5 — 0 0 — —
W.N. Central 12 23 137 618 1,146 — 0 3 3 46 — 0 0 — —Iowa 1 9 65 232 345 — 0 1 — 12 — 0 0 — —Kansas — 2 7 38 77 — 0 1 2 4 — 0 0 — —Minnesota — 0 31 — 262 — 0 2 — 17 — 0 0 — —Missouri 7 5 23 151 214 — 0 1 — 8 — 0 0 — —Nebraska 4 4 16 95 110 — 0 1 1 2 — 0 0 — —North Dakota — 0 3 28 32 — 0 0 — 2 — 0 0 — —South Dakota — 3 7 74 106 — 0 1 — 1 — 0 0 — —
S. Atlantic 7 24 76 632 903 — 0 8 15 132 — 0 0 — 1Delaware — 0 2 3 12 — 0 0 — 2 — 0 0 — —District of Columbia — 0 3 6 9 — 0 1 4 12 — 0 0 — —Florida — 9 31 226 290 — 0 4 5 51 — 0 0 — —Georgia 6 7 22 207 186 — 0 1 3 15 — 0 0 — —Maryland — 1 10 26 44 — 0 1 — 9 — 0 0 — —North Carolina — 3 17 51 167 — 0 1 — 11 — 0 0 — —South Carolina — 1 8 24 51 — 0 0 — 12 — 0 0 — 1Virginia 1 3 15 84 130 — 0 3 3 20 — 0 0 — —West Virginia — 0 7 5 14 — 0 0 — — — 0 0 — —
E.S. Central 10 8 41 231 324 — 0 2 5 9 — 0 0 — —Alabama — 4 25 83 131 — 0 1 — 1 — 0 0 — —Kentucky 2 2 7 45 80 — 0 0 — 2 — 0 0 — —Mississippi 5 1 3 33 26 — 0 2 2 — — 0 0 — —Tennessee 3 3 10 70 87 — 0 2 3 6 — 0 0 — —
W.S. Central 41 18 92 461 533 — 0 5 8 29 — 0 1 1 1Arkansas 4 2 5 54 40 — 0 0 — 3 — 0 0 — —Louisiana — 1 7 12 64 — 0 2 — 3 — 0 0 — —Oklahoma 9 2 60 67 100 — 0 1 1 4 — 0 1 1 —Texas 28 14 33 328 329 — 0 3 7 19 — 0 1 — 1
Mountain 19 13 118 374 511 — 0 3 2 44 — 0 1 1 —Arizona 1 3 82 66 134 — 0 2 1 12 — 0 0 — —Colorado 10 3 14 95 112 — 0 2 — 13 — 0 1 1 —Idaho 3 1 7 46 70 — 0 1 1 4 — 0 0 — —Montana 1 1 6 46 44 — 0 0 — 2 — 0 0 — —Nevada — 0 2 15 8 — 0 1 — 4 — 0 1 — —New Mexico — 1 7 34 37 — 0 0 — 5 — 0 0 — —Utah 4 2 23 69 94 — 0 1 — 4 — 0 0 — —Wyoming — 0 3 3 12 — 0 0 — — — 0 0 — —
Pacific 2 13 143 418 419 — 1 11 25 213 — 0 0 — 1Alaska — 0 2 4 6 — 0 2 1 2 — 0 0 — —California 2 7 19 243 245 — 1 8 12 134 — 0 0 — —Hawaii — 0 3 2 — — 0 1 4 53 — 0 0 — —Oregon — 4 26 124 168 — 0 1 — 12 — 0 0 — —Washington — 0 131 45 — — 0 2 8 12 — 0 0 — 1
TerritoriesAmerican Samoa N 0 0 N N — 0 4 26 — — 0 0 — —C.N.M.I. — — — — — — — — — — — — — — —Guam — 0 0 — — — 0 1 — — — 0 0 — —Puerto Rico — 0 0 — 1 — 0 3 9 183 — 0 0 — —U.S. Virgin Islands — 0 0 — — — 0 1 1 9 — 0 0 — —
C.N.M.I.: Commonwealth of Northern Mariana Islands.U: Unavailable. —: No reported cases. N: Not reportable. NN: Not Nationally Notifiable. NP: Nationally notifiable but not published. Cum: Cumulative year-to-date counts. Med: Median. Max: Maximum.* Three low incidence conditions, rubella, rubella congenital, and tetanus, are in Table II to facilitate case count verification with reporting jurisdictions.† Case counts for reporting years 2016 and 2017 are provisional and subject to change. For further information on interpretation of these data, see http://wwwn.cdc.gov/nndss/document/
ProvisionalNationaNotifiableDiseasesSurveillanceData20100927.pdf. Data for tuberculosis are displayed in Table III, which appears quarterly. § Includes data for dengue and dengue-like illness.

Morbidity and Mortality Weekly Report
ND-630 MMWR / August 18, 2017 / Vol. 66 / No. 32
TABLE II. (Continued) Provisional cases of selected notifiable diseases (≥1,000 cases reported during the preceding year), and selected* low frequency diseases, United States and U.S. territories, weeks ending August 12, 2017, and August 13, 2016 (32nd week)† (Export data)
Reporting area
Ehrlichiosis and Anaplasmosis§
Ehrlichia chaffeensis Anaplasma phagocytophilum Undetermined
Current week
Previous 52 weeks Cum 2017
Cum 2016
Current week
Previous 52 weeks Cum 2017
Cum 2016
Current week
Previous 52 weeks Cum 2017
Cum 2016Med Max Med Max Med Max
United States 30 16 139 791 882 61 60 239 2,593 2,816 4 3 11 100 133New England — 1 3 22 45 14 26 131 1,221 1,146 1 0 2 9 3
Connecticut — 0 0 — 1 — 0 8 — 50 N 0 0 N NMaine — 0 1 4 2 11 5 32 324 235 1 0 1 3 2Massachusetts — 0 1 8 8 — 10 77 704 601 — 0 1 2 —New Hampshire — 0 1 1 6 — 0 1 3 53 — 0 0 — —Rhode Island — 0 2 4 26 — 1 13 24 92 — 0 0 — —Vermont — 0 1 5 2 3 3 23 166 115 — 0 1 4 1
Mid. Atlantic 4 3 65 105 108 46 13 84 865 572 2 0 4 21 25New Jersey — 1 6 37 59 — 2 9 73 76 — 0 2 3 4New York (Upstate) 3 2 64 55 38 39 11 73 739 426 2 0 4 16 12New York City 1 0 4 13 7 7 0 14 52 34 — 0 1 2 —Pennsylvania — 0 1 — 4 — 0 4 1 36 — 0 2 — 9
E.N. Central — 1 6 40 59 — 8 50 423 456 — 1 6 42 47Illinois — 0 2 6 28 — 0 1 1 8 — 0 0 — —Indiana — 0 0 — — — 0 0 — — — 0 4 16 15Michigan — 0 2 1 6 — 0 1 1 5 — 0 0 — —Ohio — 0 2 11 6 — 0 2 4 4 — 0 0 — —Wisconsin — 0 4 22 19 — 7 50 417 439 — 0 5 26 32
W.N. Central 6 4 27 238 227 1 2 32 30 583 1 0 3 9 39Iowa — 0 2 6 2 — 0 1 4 4 — 0 1 1 2Kansas — 0 4 21 46 — 0 0 — 4 — 0 0 — 1Minnesota — 0 1 — 4 — 0 31 — 557 — 0 2 — 27Missouri 6 3 24 211 171 1 0 3 14 6 1 0 2 6 6Nebraska — 0 2 — 3 — 0 1 — 2 — 0 0 — —North Dakota — 0 1 — 1 — 0 2 11 9 — 0 2 2 3South Dakota — 0 0 — — — 0 1 1 1 — 0 0 — —
S. Atlantic — 2 13 116 183 — 1 4 32 36 — 0 1 3 8Delaware — 0 3 14 12 — 0 2 5 4 — 0 1 — 1District of Columbia — 0 0 — 4 — 0 0 — 2 — 0 0 — —Florida — 0 2 10 18 — 0 2 5 4 — 0 0 — —Georgia — 0 1 1 12 — 0 0 — — — 0 1 1 2Maryland — 0 4 17 33 — 0 1 4 5 — 0 1 1 1North Carolina — 0 4 33 43 — 0 2 9 12 — 0 0 — —South Carolina — 0 0 — — — 0 0 — — — 0 0 — 1Virginia — 0 8 39 56 — 0 2 9 9 — 0 1 1 3West Virginia — 0 2 2 5 — 0 0 — — — 0 0 — —
E.S. Central 3 2 12 120 116 — 0 4 16 10 — 0 2 7 7Alabama — 0 1 6 7 — 0 1 3 4 — 0 0 — 3Kentucky 1 1 8 56 33 — 0 1 2 1 — 0 2 3 1Mississippi — 0 2 6 6 — 0 0 — — — 0 1 2 —Tennessee 2 1 10 52 70 — 0 4 11 5 — 0 2 2 3
W.S. Central 17 3 67 150 142 — 0 3 4 8 — 0 1 — 1Arkansas 5 3 13 124 133 — 0 1 3 7 — 0 0 — —Louisiana — 0 1 — 1 — 0 0 — — — 0 0 — —Oklahoma 12 0 60 16 1 — 0 3 — — — 0 0 — —Texas — 0 2 10 7 — 0 1 1 1 — 0 1 — 1
Mountain — 0 0 — 1 — 0 1 2 — — 0 1 3 2Arizona — 0 0 — — — 0 0 — — — 0 1 3 2Colorado N 0 0 N N N 0 0 N N N 0 0 N NIdaho N 0 0 N N N 0 0 N N N 0 0 N NMontana — 0 0 — 1 — 0 1 1 — — 0 0 — —Nevada — 0 0 — — — 0 0 — — — 0 0 — —New Mexico N 0 0 N N N 0 0 N N N 0 0 N NUtah — 0 0 — — — 0 1 1 — — 0 0 — —Wyoming — 0 0 — — — 0 1 — — — 0 0 — —
Pacific — 0 1 — 1 — 0 2 — 5 — 0 4 6 1Alaska N 0 0 N N N 0 0 N N N 0 0 N NCalifornia — 0 0 — — — 0 0 — 5 — 0 4 6 1Hawaii N 0 0 N N N 0 0 N N N 0 0 N NOregon — 0 1 — 1 — 0 2 — — — 0 0 — —Washington — 0 0 — — — 0 0 — — — 0 0 — —
TerritoriesAmerican Samoa N 0 0 N N N 0 0 N N N 0 0 N NC.N.M.I. — — — — — — — — — — — — — — —Guam N 0 0 N N N 0 0 N N N 0 0 N NPuerto Rico N 0 0 N N N 0 0 N N N 0 0 N NU.S. Virgin Islands — 0 0 — — — 0 0 — — — 0 0 — —
C.N.M.I.: Commonwealth of Northern Mariana Islands.U: Unavailable. —: No reported cases. N: Not reportable. NN: Not Nationally Notifiable. NP: Nationally notifiable but not published. Cum: Cumulative year-to-date counts. Med: Median. Max: Maximum.* Three low incidence conditions, rubella, rubella congenital, and tetanus, are in Table II to facilitate case count verification with reporting jurisdictions.† Case counts for reporting years 2016 and 2017 are provisional and subject to change. For further information on interpretation of these data, see http://wwwn.cdc.gov/nndss/document/ProvisionalNationaNotifiableDiseasesSurveillanceData20100927.pdf. Data for tuberculosis are displayed in Table III, which appears quarterly. § Cumulative total E. ewingii cases reported for year 2017 = 24, and 22 cases reported for 2016.
Morbidity and Mortality Weekly Report
MMWR / August 18, 2017 / Vol. 66 / No. 32 ND-631
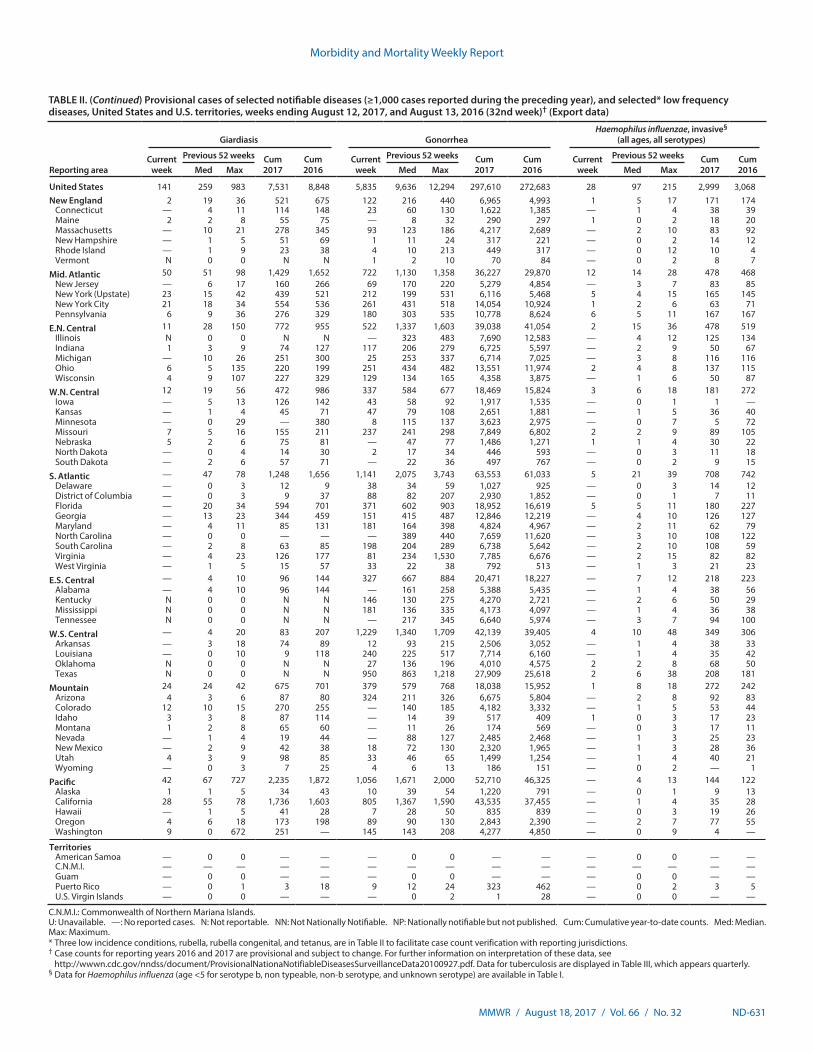
TABLE II. (Continued) Provisional cases of selected notifiable diseases (≥1,000 cases reported during the preceding year), and selected* low frequency diseases, United States and U.S. territories, weeks ending August 12, 2017, and August 13, 2016 (32nd week)† (Export data)
Reporting area
Giardiasis GonorrheaHaemophilus influenzae, invasive§
(all ages, all serotypes)
Current week
Previous 52 weeks Cum 2017
Cum 2016
Current week
Previous 52 weeks Cum 2017
Cum 2016
Current week
Previous 52 weeks Cum 2017
Cum 2016Med Max Med Max Med Max
United States 141 259 983 7,531 8,848 5,835 9,636 12,294 297,610 272,683 28 97 215 2,999 3,068New England 2 19 36 521 675 122 216 440 6,965 4,993 1 5 17 171 174
Connecticut — 4 11 114 148 23 60 130 1,622 1,385 — 1 4 38 39Maine 2 2 8 55 75 — 8 32 290 297 1 0 2 18 20Massachusetts — 10 21 278 345 93 123 186 4,217 2,689 — 2 10 83 92New Hampshire — 1 5 51 69 1 11 24 317 221 — 0 2 14 12Rhode Island — 1 9 23 38 4 10 213 449 317 — 0 12 10 4Vermont N 0 0 N N 1 2 10 70 84 — 0 2 8 7
Mid. Atlantic 50 51 98 1,429 1,652 722 1,130 1,358 36,227 29,870 12 14 28 478 468New Jersey — 6 17 160 266 69 170 220 5,279 4,854 — 3 7 83 85New York (Upstate) 23 15 42 439 521 212 199 531 6,116 5,468 5 4 15 165 145New York City 21 18 34 554 536 261 431 518 14,054 10,924 1 2 6 63 71Pennsylvania 6 9 36 276 329 180 303 535 10,778 8,624 6 5 11 167 167
E.N. Central 11 28 150 772 955 522 1,337 1,603 39,038 41,054 2 15 36 478 519Illinois N 0 0 N N — 323 483 7,690 12,583 — 4 12 125 134Indiana 1 3 9 74 127 117 206 279 6,725 5,597 — 2 9 50 67Michigan — 10 26 251 300 25 253 337 6,714 7,025 — 3 8 116 116Ohio 6 5 135 220 199 251 434 482 13,551 11,974 2 4 8 137 115Wisconsin 4 9 107 227 329 129 134 165 4,358 3,875 — 1 6 50 87
W.N. Central 12 19 56 472 986 337 584 677 18,469 15,824 3 6 18 181 272Iowa — 5 13 126 142 43 58 92 1,917 1,535 — 0 1 1 —Kansas — 1 4 45 71 47 79 108 2,651 1,881 — 1 5 36 40Minnesota — 0 29 — 380 8 115 137 3,623 2,975 — 0 7 5 72Missouri 7 5 16 155 211 237 241 298 7,849 6,802 2 2 9 89 105Nebraska 5 2 6 75 81 — 47 77 1,486 1,271 1 1 4 30 22North Dakota — 0 4 14 30 2 17 34 446 593 — 0 3 11 18South Dakota — 2 6 57 71 — 22 36 497 767 — 0 2 9 15
S. Atlantic — 47 78 1,248 1,656 1,141 2,075 3,743 63,553 61,033 5 21 39 708 742Delaware — 0 3 12 9 38 34 59 1,027 925 — 0 3 14 12District of Columbia — 0 3 9 37 88 82 207 2,930 1,852 — 0 1 7 11Florida — 20 34 594 701 371 602 903 18,952 16,619 5 5 11 180 227Georgia — 13 23 344 459 151 415 487 12,846 12,219 — 4 10 126 127Maryland — 4 11 85 131 181 164 398 4,824 4,967 — 2 11 62 79North Carolina — 0 0 — — — 389 440 7,659 11,620 — 3 10 108 122South Carolina — 2 8 63 85 198 204 289 6,738 5,642 — 2 10 108 59Virginia — 4 23 126 177 81 234 1,530 7,785 6,676 — 2 15 82 82West Virginia — 1 5 15 57 33 22 38 792 513 — 1 3 21 23
E.S. Central — 4 10 96 144 327 667 884 20,471 18,227 — 7 12 218 223Alabama — 4 10 96 144 — 161 258 5,388 5,435 — 1 4 38 56Kentucky N 0 0 N N 146 130 275 4,270 2,721 — 2 6 50 29Mississippi N 0 0 N N 181 136 335 4,173 4,097 — 1 4 36 38Tennessee N 0 0 N N — 217 345 6,640 5,974 — 3 7 94 100
W.S. Central — 4 20 83 207 1,229 1,340 1,709 42,139 39,405 4 10 48 349 306Arkansas — 3 18 74 89 12 93 215 2,506 3,052 — 1 4 38 33Louisiana — 0 10 9 118 240 225 517 7,714 6,160 — 1 4 35 42Oklahoma N 0 0 N N 27 136 196 4,010 4,575 2 2 8 68 50Texas N 0 0 N N 950 863 1,218 27,909 25,618 2 6 38 208 181
Mountain 24 24 42 675 701 379 579 768 18,038 15,952 1 8 18 272 242Arizona 4 3 6 87 80 324 211 326 6,675 5,804 — 2 8 92 83Colorado 12 10 15 270 255 — 140 185 4,182 3,332 — 1 5 53 44Idaho 3 3 8 87 114 — 14 39 517 409 1 0 3 17 23Montana 1 2 8 65 60 — 11 26 174 569 — 0 3 17 11Nevada — 1 4 19 44 — 88 127 2,485 2,468 — 1 3 25 23New Mexico — 2 9 42 38 18 72 130 2,320 1,965 — 1 3 28 36Utah 4 3 9 98 85 33 46 65 1,499 1,254 — 1 4 40 21Wyoming — 0 3 7 25 4 6 13 186 151 — 0 2 — 1
Pacific 42 67 727 2,235 1,872 1,056 1,671 2,000 52,710 46,325 — 4 13 144 122Alaska 1 1 5 34 43 10 39 54 1,220 791 — 0 1 9 13California 28 55 78 1,736 1,603 805 1,367 1,590 43,535 37,455 — 1 4 35 28Hawaii — 1 5 41 28 7 28 50 835 839 — 0 3 19 26Oregon 4 6 18 173 198 89 90 130 2,843 2,390 — 2 7 77 55Washington 9 0 672 251 — 145 143 208 4,277 4,850 — 0 9 4 —
TerritoriesAmerican Samoa — 0 0 — — — 0 0 — — — 0 0 — —C.N.M.I. — — — — — — — — — — — — — — —Guam — 0 0 — — — 0 0 — — — 0 0 — —Puerto Rico — 0 1 3 18 9 12 24 323 462 — 0 2 3 5U.S. Virgin Islands — 0 0 — — — 0 2 1 28 — 0 0 — —
C.N.M.I.: Commonwealth of Northern Mariana Islands.U: Unavailable. —: No reported cases. N: Not reportable. NN: Not Nationally Notifiable. NP: Nationally notifiable but not published. Cum: Cumulative year-to-date counts. Med: Median. Max: Maximum.* Three low incidence conditions, rubella, rubella congenital, and tetanus, are in Table II to facilitate case count verification with reporting jurisdictions.† Case counts for reporting years 2016 and 2017 are provisional and subject to change. For further information on interpretation of these data, see http://wwwn.cdc.gov/nndss/document/ProvisionalNationaNotifiableDiseasesSurveillanceData20100927.pdf. Data for tuberculosis are displayed in Table III, which appears quarterly. § Data for Haemophilus influenza (age <5 for serotype b, non typeable, non-b serotype, and unknown serotype) are available in Table I.

Morbidity and Mortality Weekly Report
ND-632 MMWR / August 18, 2017 / Vol. 66 / No. 32
TABLE II. (Continued) Provisional cases of selected notifiable diseases (≥1,000 cases reported during the preceding year), and selected* low frequency diseases, United States and U.S. territories, weeks ending August 12, 2017, and August 13, 2016 (32nd week)† (Export data)
Reporting area
Hepatitis (viral, acute, by type)
A B
Current week
Previous 52 weeks
Cum 2017 Cum 2016Current
week
Previous 52 weeks
Cum 2017 Cum 2016Med Max Med Max
United States 13 37 101 1,162 1,055 13 60 146 1,778 1,885New England — 2 5 35 52 1 2 5 64 57
Connecticut — 0 2 7 7 — 0 1 4 5Maine — 0 1 2 3 1 1 4 45 28Massachusetts — 1 4 22 33 — 0 3 14 22New Hampshire — 0 1 2 3 — 0 0 — —Rhode Island — 0 1 — 3 U 0 0 U UVermont — 0 1 2 3 — 0 1 1 2
Mid. Atlantic 4 5 11 157 131 1 4 11 101 122New Jersey — 1 4 27 46 — 1 4 18 30New York (Upstate) 2 1 4 35 30 — 0 4 16 23New York City 1 2 6 60 26 1 1 4 33 43Pennsylvania 1 1 4 35 29 — 1 4 34 26
E.N. Central — 5 15 230 89 2 9 22 350 337Illinois — 1 5 28 37 — 0 3 15 26Indiana — 0 2 6 13 — 3 10 120 92Michigan — 3 13 172 20 — 0 4 32 18Ohio — 0 7 17 18 2 4 16 167 195Wisconsin — 0 4 7 1 — 0 3 16 6
W.N. Central — 0 5 13 44 2 2 5 51 60Iowa — 0 2 4 8 — 0 2 10 6Kansas — 0 1 4 3 — 0 3 17 12Minnesota — 0 2 — 9 — 0 2 — 10Missouri — 0 1 4 10 2 1 3 20 23Nebraska — 0 4 1 11 — 0 2 4 6North Dakota — 0 0 — 2 — 0 1 — 1South Dakota — 0 0 — 1 — 0 0 — 2
S. Atlantic — 7 55 222 208 2 22 33 625 731Delaware — 0 1 2 — — 0 2 8 1District of Columbia — 0 3 — — U 0 0 U UFlorida — 3 10 132 64 — 11 19 306 322Georgia — 1 5 22 21 1 2 7 63 64Maryland — 0 5 13 13 — 0 2 16 17North Carolina — 1 5 16 32 1 3 10 67 101South Carolina — 0 4 11 12 — 0 4 7 18Virginia — 1 41 21 63 — 1 5 44 31West Virginia — 0 4 5 3 — 4 13 114 177
E.S. Central 1 0 4 18 21 3 11 19 320 291Alabama — 0 3 9 14 — 1 5 43 40Kentucky 1 0 1 6 4 2 4 12 134 116Mississippi — 0 1 2 2 1 1 3 24 15Tennessee — 0 2 1 1 — 4 9 119 120
W.S. Central 4 3 8 87 101 — 4 36 127 148Arkansas — 0 2 4 8 — 1 5 29 28Louisiana — 0 1 4 10 — 1 6 39 31Oklahoma — 0 4 4 5 — 0 15 8 5Texas 4 2 7 75 78 — 2 17 51 84
Mountain 3 2 11 116 56 — 1 4 47 48Arizona — 1 5 44 19 — 0 2 12 10Colorado 1 0 7 35 13 — 0 2 9 14Idaho — 0 1 2 3 — 0 2 6 5Montana — 0 1 3 1 — 0 1 3 1Nevada — 0 2 6 10 — 0 3 11 14New Mexico — 0 1 2 1 — 0 0 — 1Utah 2 0 3 18 9 — 0 2 6 3Wyoming — 0 3 6 — U 0 0 U U
Pacific 1 9 35 284 353 2 3 47 93 91Alaska — 0 1 — 1 1 0 1 4 5California 1 6 18 257 146 — 2 5 55 77Hawaii — 0 25 4 197 — 0 1 1 —Oregon — 0 3 15 9 — 0 3 9 9Washington — 0 31 8 — 1 0 45 24 —
TerritoriesAmerican Samoa — 0 0 — — — 0 0 — —C.N.M.I. — — — — — — — — — —Guam — 0 1 — 1 — 0 0 — —Puerto Rico — 0 1 2 19 — 0 1 1 11U.S. Virgin Islands — 0 0 — — — 0 0 — —
C.N.M.I.: Commonwealth of Northern Mariana Islands.U: Unavailable. —: No reported cases. N: Not reportable. NN: Not Nationally Notifiable. NP: Nationally notifiable but not published. Cum: Cumulative year-to-date counts. Med: Median. Max: Maximum.* Three low incidence conditions, rubella, rubella congenital, and tetanus, are in Table II to facilitate case count verification with reporting jurisdictions.† Case counts for reporting years 2016 and 2017 are provisional and subject to change. For further information on interpretation of these data, see http://wwwn.cdc.gov/nndss/document/
ProvisionalNationaNotifiableDiseasesSurveillanceData20100927.pdf. Data for tuberculosis are displayed in Table III, which appears quarterly.

Morbidity and Mortality Weekly Report
MMWR / August 18, 2017 / Vol. 66 / No. 32 ND-633
TABLE II. (Continued) Provisional cases of selected notifiable diseases (≥1,000 cases reported during the preceding year), and selected* low frequency diseases, United States and U.S. territories, weeks ending August 12, 2017, and August 13, 2016 (32nd week)† (Export data)
Reporting area
Hepatitis (viral, acute, by type)§ (Continued)
C (confirmed) C (probable)
Current week
Previous 52 weeks
Cum 2017 Cum 2016Current
week
Previous 52 weeks
Cum 2017 Cum 2016Med Max Med Max
United States 11 43 132 1,192 1,888 10 18 80 551 629New England — 5 14 150 345 — 2 4 38 85
Connecticut — 0 1 4 15 — 0 0 — —Maine — 0 3 15 10 — 0 1 5 9Massachusetts — 5 13 128 315 — 1 4 33 76New Hampshire — 0 0 — — — 0 0 — —Rhode Island — 0 0 — — — 0 0 — —Vermont — 0 1 3 5 — 0 0 — —
Mid. Atlantic 5 6 21 155 344 — 0 4 27 14New Jersey — 1 5 23 82 — 0 0 — —New York (Upstate) 1 3 9 84 115 — 0 3 12 14New York City 2 0 3 6 2 — 0 0 — —Pennsylvania 2 2 12 42 145 — 0 3 15 —
E.N. Central — 8 14 250 333 5 3 7 103 93Illinois — 0 2 15 16 — 0 2 6 1Indiana — 2 7 75 95 — 1 3 27 21Michigan — 0 5 59 38 — 0 3 34 16Ohio — 3 7 80 122 5 1 4 36 55Wisconsin — 1 4 21 62 — 0 0 — —
W.N. Central — 2 5 47 67 — 0 1 6 3Iowa — 0 0 — — — 0 0 — —Kansas — 0 2 9 8 — 0 1 1 1Minnesota — 0 3 — 30 — 0 0 — 1Missouri — 1 3 30 11 — 0 0 — —Nebraska — 0 1 1 1 — 0 1 4 —North Dakota — 0 1 1 1 — 0 0 — —South Dakota — 0 2 6 16 — 0 1 1 1
S. Atlantic — 9 18 269 407 — 4 11 118 165Delaware — 0 0 — — — 0 0 — —District of Columbia — 0 0 — — — 0 0 — —Florida — 4 9 152 164 — 1 4 35 39Georgia — 1 5 19 63 — 0 4 12 20Maryland — 0 3 12 27 — 0 2 6 6North Carolina — 0 4 5 62 — 0 4 9 65South Carolina — 0 1 2 8 — 0 1 1 1Virginia — 1 4 29 27 — 0 5 13 15West Virginia — 2 6 50 56 — 1 5 42 19
E.S. Central 2 4 9 119 198 2 5 12 164 185Alabama — 0 3 11 25 — 0 4 15 36Kentucky 2 1 8 40 62 1 3 9 97 91Mississippi — 0 0 — — — 0 0 — —Tennessee — 2 6 68 111 1 2 5 52 58
W.S. Central — 1 17 33 44 — 0 23 26 32Arkansas — 0 0 — — — 0 0 — —Louisiana — 0 1 2 5 — 0 2 3 10Oklahoma — 0 12 8 15 — 0 23 10 22Texas — 0 5 23 24 — 0 2 13 —
Mountain 3 2 9 65 106 2 1 5 37 37Arizona — 0 0 — — — 0 0 — —Colorado — 0 3 10 22 1 0 2 11 3Idaho 1 0 1 5 4 — 0 1 3 2Montana 1 0 2 9 13 — 0 1 1 —Nevada — 0 3 16 9 — 0 1 1 9New Mexico 1 0 2 5 14 — 0 1 3 12Utah — 1 4 20 44 1 0 3 18 11Wyoming — 0 0 — — — 0 0 — —
Pacific 1 2 62 104 44 1 0 33 32 15Alaska — 0 0 — — — 0 0 — —California — 1 6 50 32 — 0 3 17 12Hawaii — 0 0 — — — 0 0 — —Oregon — 0 3 21 12 — 0 1 3 3Washington 1 0 62 33 — 1 0 33 12 —
TerritoriesAmerican Samoa — 0 0 — — — 0 0 — —C.N.M.I. — — — — — — — — — —Guam — 0 0 — — — 0 0 — —Puerto Rico — 0 0 — — — 0 0 — —U.S. Virgin Islands — 0 0 — — — 0 0 — —
C.N.M.I.: Commonwealth of Northern Mariana Islands.U: Unavailable. —: No reported cases. N: Not reportable. NN: Not Nationally Notifiable. NP: Nationally notifiable but not published. Cum: Cumulative year-to-date counts. Med: Median. Max: Maximum.* Three low incidence conditions, rubella, rubella congenital, and tetanus, are in Table II to facilitate case count verification with reporting jurisdictions.† Case counts for reporting years 2016 and 2017 are provisional and subject to change. For further information on interpretation of these data, see http://wwwn.cdc.gov/nndss/document/
ProvisionalNationaNotifiableDiseasesSurveillanceData20100927.pdf. Data for tuberculosis are displayed in Table III, which appears quarterly. § Based on the CSTE Position Statement 15-ID-03: Revision of the Case Definition of Hepatitis C for National Notification, acute hepatitis C is now reported by case classification status.

Morbidity and Mortality Weekly Report
ND-634 MMWR / August 18, 2017 / Vol. 66 / No. 32
TABLE II. (Continued) Provisional cases of selected notifiable diseases (≥1,000 cases reported during the preceding year), and selected* low frequency diseases, United States and U.S. territories, weeks ending August 12, 2017, and August 13, 2016 (32nd week)† (Export data)
Reporting area
Invasive Pneumococcal Disease§ (all ages)
Confirmed Probable
Current week
Previous 52 weeks
Cum 2017 Cum 2016Current
week
Previous 52 weeks
Cum 2017 Cum 2016Med Max Med Max
United States 69 332 791 10,958 11,261 — 1 12 73 11New England 2 25 51 806 694 — 0 2 3 —
Connecticut — 5 18 175 143 — 0 2 3 —Maine 1 2 10 88 85 — 0 0 — —Massachusetts — 12 28 415 323 — 0 0 — —New Hampshire — 2 6 59 67 — 0 0 — —Rhode Island — 1 11 39 37 — 0 0 — —Vermont 1 1 5 30 39 — 0 0 — —
Mid. Atlantic 14 52 129 1,553 1,759 — 0 8 32 —New Jersey — 7 22 179 372 — 0 2 9 —New York (Upstate) 6 16 70 565 593 — 0 0 — —New York City 8 13 29 447 413 — 0 2 2 —Pennsylvania — 10 22 362 381 — 0 4 21 —
E.N. Central 7 57 108 1,932 2,013 — 0 2 6 6Illinois N 0 0 N N N 0 0 N NIndiana — 11 33 363 439 — 0 0 — —Michigan — 16 28 498 615 — 0 2 4 6Ohio 5 19 52 745 684 — 0 2 2 —Wisconsin 2 10 22 326 275 — 0 0 — —
W.N. Central 5 27 47 810 753 — 0 3 14 2Iowa N 0 0 N N N 0 0 N NKansas — 5 14 180 137 — 0 1 — —Minnesota — 0 14 — 309 — 0 0 — —Missouri 3 9 24 389 46 — 0 3 10 1Nebraska 1 3 10 101 124 — 0 1 2 1North Dakota 1 2 5 54 48 — 0 0 — —South Dakota — 2 7 86 89 — 0 1 2 —
S. Atlantic 4 56 120 1,983 1,884 — 0 3 7 —Delaware — 1 6 47 44 — 0 0 — —District of Columbia — 1 4 33 42 — 0 0 — —Florida 3 10 24 403 445 — 0 2 4 —Georgia 1 18 39 610 615 — 0 0 — —Maryland — 9 19 289 298 — 0 1 1 —North Carolina N 0 0 N N N 0 0 N NSouth Carolina — 8 37 434 236 — 0 2 2 —Virginia — 0 2 16 17 — 0 0 — —West Virginia — 4 13 151 187 — 0 0 — —
E.S. Central 7 33 72 1,135 1,072 — 0 1 1 1Alabama — 6 26 194 224 — 0 0 — —Kentucky — 6 17 219 157 — 0 1 1 1Mississippi — 6 11 153 148 — 0 0 — —Tennessee 7 16 38 569 543 — 0 1 — —
W.S. Central 20 35 231 1,277 1,502 — 0 2 6 1Arkansas 7 5 32 210 166 — 0 1 — 1Louisiana — 4 13 151 242 — 0 1 — —Oklahoma N 0 0 N N N 0 0 N NTexas 13 26 189 916 1,094 — 0 2 6 —
Mountain 10 36 69 1,334 1,455 — 0 1 4 1Arizona 1 11 28 449 526 — 0 1 2 —Colorado 5 10 19 336 318 — 0 0 — —Idaho N 0 0 N N N 0 0 N NMontana 2 2 4 57 69 — 0 1 2 1Nevada — 4 16 157 145 — 0 0 — —New Mexico 1 5 14 211 212 — 0 0 — —Utah — 4 10 112 162 — 0 0 — —Wyoming 1 0 3 12 23 — 0 0 — —
Pacific — 4 11 128 129 — 0 0 — —Alaska — 2 6 64 78 — 0 0 — —California N 0 0 N N N 0 0 N NHawaii — 2 8 64 51 — 0 0 — —Oregon N 0 0 N N N 0 0 N NWashington N 0 0 N N N 0 0 N N
TerritoriesAmerican Samoa N 0 0 N N N 0 0 N NC.N.M.I. — — — — — — — — — —Guam — 0 0 — — — 0 0 — —Puerto Rico — 0 0 — — — 0 0 — —U.S. Virgin Islands — 0 0 — — — 0 0 — —
C.N.M.I.: Commonwealth of Northern Mariana Islands.U: Unavailable. —: No reported cases. N: Not reportable. NN: Not Nationally Notifiable. NP: Nationally notifiable but not published. Cum: Cumulative year-to-date counts. Med: Median. Max: Maximum.* Three low incidence conditions, rubella, rubella congenital, and tetanus, are in Table II to facilitate case count verification with reporting jurisdictions.† Case counts for reporting years 2016 and 2017 are provisional and subject to change. For further information on interpretation of these data, see http://wwwn.cdc.gov/nndss/document/
ProvisionalNationaNotifiableDiseasesSurveillanceData20100927.pdf. Data for tuberculosis are displayed in Table III, which appears quarterly. § Includes drug resistant and susceptible cases of Invasive Pneumococcal Disease. This condition was previously named Streptococcus pneumoniae invasive disease and cases were reported
to CDC using different event codes to specify whether the cases were drug resistant or in a defined age group, such as <5 years.

Morbidity and Mortality Weekly Report
MMWR / August 18, 2017 / Vol. 66 / No. 32 ND-635
TABLE II. (Continued) Provisional cases of selected notifiable diseases (≥1,000 cases reported during the preceding year), and selected* low frequency diseases, United States and U.S. territories, weeks ending August 12, 2017, and August 13, 2016 (32nd week)† (Export data)
Reporting area
Invasive Pneumococcal Disease§ (age <5)
Confirmed Probable
Current week
Previous 52 weeks
Cum 2017 Cum 2016Current
week
Previous 52 weeks
Cum 2017 Cum 2016Med Max Med Max
United States 6 21 45 601 699 — 0 2 3 3New England — 1 3 26 39 — 0 0 — —
Connecticut — 0 2 7 8 — 0 0 — —Maine — 0 1 2 6 — 0 0 — —Massachusetts — 0 2 11 21 — 0 0 — —New Hampshire — 0 1 3 1 — 0 0 — —Rhode Island — 0 1 2 2 — 0 0 — —Vermont — 0 1 1 1 — 0 0 — —
Mid. Atlantic 1 2 9 68 85 — 0 0 — —New Jersey — 0 2 7 14 — 0 0 — —New York (Upstate) 1 1 7 30 34 — 0 0 — —New York City — 0 2 15 18 — 0 0 — —Pennsylvania — 0 3 16 19 — 0 0 — —
E.N. Central 1 3 9 108 99 — 0 1 1 1Illinois — 0 0 — — — 0 0 — —Indiana — 0 3 22 9 — 0 0 — —Michigan — 0 3 15 32 — 0 1 — 1Ohio 1 1 5 45 43 — 0 1 1 —Wisconsin — 0 3 26 15 — 0 0 — —
W.N. Central — 1 5 49 61 — 0 1 1 1Iowa N 0 0 N N N 0 0 N NKansas — 0 2 11 8 — 0 0 — —Minnesota — 0 2 — 21 — 0 0 — —Missouri — 0 2 18 8 — 0 1 1 1Nebraska — 0 2 5 13 — 0 0 — —North Dakota — 0 2 6 2 — 0 0 — —South Dakota — 0 2 9 9 — 0 0 — —
S. Atlantic — 5 10 127 126 — 0 0 — —Delaware — 0 1 2 1 — 0 0 — —District of Columbia — 0 1 1 — — 0 0 — —Florida — 1 3 43 39 — 0 0 — —Georgia — 1 6 28 39 — 0 0 — —Maryland — 0 2 18 19 — 0 0 — —North Carolina N 0 0 N N N 0 0 N NSouth Carolina — 0 4 12 4 — 0 0 — —Virginia — 0 2 16 17 — 0 0 — —West Virginia — 0 2 7 7 — 0 0 — —
E.S. Central — 2 8 51 56 — 0 0 — 1Alabama — 0 3 13 18 — 0 0 — —Kentucky — 0 2 10 4 — 0 0 — 1Mississippi — 0 2 8 12 — 0 0 — —Tennessee — 0 7 20 22 — 0 0 — —
W.S. Central 4 3 22 98 132 — 0 1 1 —Arkansas — 0 2 8 13 — 0 0 — —Louisiana — 0 2 10 21 — 0 0 — —Oklahoma — 0 3 8 9 — 0 0 — —Texas 4 2 19 72 89 — 0 1 1 —
Mountain — 2 7 68 94 — 0 1 — —Arizona — 0 2 17 34 — 0 0 — —Colorado — 0 2 14 12 — 0 0 — —Idaho — 0 1 5 7 — 0 1 — —Montana — 0 2 4 3 — 0 0 — —Nevada — 0 1 5 9 — 0 0 — —New Mexico — 0 2 7 10 — 0 0 — —Utah — 0 3 16 18 — 0 0 — —Wyoming — 0 1 — 1 — 0 0 — —
Pacific — 0 2 6 7 — 0 0 — —Alaska — 0 1 3 7 — 0 0 — —California N 0 0 N N N 0 0 N NHawaii — 0 1 3 — — 0 0 — —Oregon N 0 0 N N N 0 0 N NWashington N 0 0 N N N 0 0 N N
TerritoriesAmerican Samoa — 0 0 — — — 0 0 — —C.N.M.I. — — — — — — — — — —Guam — 0 0 — — — 0 0 — —Puerto Rico — 0 0 — — — 0 0 — —U.S. Virgin Islands — 0 0 — — — 0 0 — —
C.N.M.I.: Commonwealth of Northern Mariana Islands.U: Unavailable. —: No reported cases. N: Not reportable. NN: Not Nationally Notifiable. NP: Nationally notifiable but not published. Cum: Cumulative year-to-date counts. Med: Median. Max: Maximum.* Three low incidence conditions, rubella, rubella congenital, and tetanus, are in Table II to facilitate case count verification with reporting jurisdictions.† Case counts for reporting years 2016 and 2017 are provisional and subject to change. For further information on interpretation of these data, see http://wwwn.cdc.gov/nndss/document/
ProvisionalNationaNotifiableDiseasesSurveillanceData20100927.pdf. Data for tuberculosis are displayed in Table III, which appears quarterly. § Includes drug resistant and susceptible cases of Invasive Pneumococcal Disease. This condition was previously named Streptococcus pneumoniae invasive disease and cases were reported
to CDC using different event codes to specify whether the cases were drug resistant or in a defined age group, such as <5 years.

Morbidity and Mortality Weekly Report
ND-636 MMWR / August 18, 2017 / Vol. 66 / No. 32
TABLE II. (Continued) Provisional cases of selected notifiable diseases (≥1,000 cases reported during the preceding year), and selected* low frequency diseases, United States and U.S. territories, weeks ending August 12, 2017, and August 13, 2016 (32nd week)† (Export data)
Reporting area
Legionellosis Malaria
Current week
Previous 52 weeks
Cum 2017 Cum 2016 Current week
Previous 52 weeks
Cum 2017 Cum 2016Med Max Med Max
United States 84 136 236 3,372 2,759 26 31 102 899 1,049New England 1 6 37 220 123 — 2 7 76 83
Connecticut — 2 6 60 32 — 0 2 1 5Maine — 0 2 7 9 — 0 3 9 8Massachusetts — 3 18 100 53 — 2 6 55 56New Hampshire — 0 8 26 15 — 0 2 5 8Rhode Island — 0 9 16 11 — 0 3 5 3Vermont 1 0 2 11 3 — 0 1 1 3
Mid. Atlantic 41 28 56 771 568 13 9 28 237 230New Jersey — 2 9 43 100 — 1 9 52 48New York (Upstate) 21 10 27 292 160 2 1 8 36 36New York City 12 4 24 198 115 11 4 14 104 106Pennsylvania 8 7 20 238 193 — 2 5 45 40
E.N. Central 20 26 82 784 595 5 3 27 98 112Illinois — 5 17 117 158 — 1 5 25 42Indiana 1 3 12 86 70 — 0 4 7 8Michigan — 4 30 137 108 — 1 4 25 25Ohio 18 10 41 351 216 5 1 13 40 23Wisconsin 1 2 10 93 43 — 0 1 1 14
W.N. Central 6 5 26 144 189 1 2 7 48 81Iowa — 0 3 18 19 — 0 3 10 12Kansas — 0 4 11 14 — 0 2 8 3Minnesota — 0 12 — 45 — 0 4 — 43Missouri 4 2 13 93 97 1 0 3 18 10Nebraska 2 0 3 13 6 — 0 1 3 3North Dakota — 0 2 3 3 — 0 2 5 6South Dakota — 0 1 6 5 — 0 1 4 4
S. Atlantic 1 23 39 588 544 3 8 24 263 283Delaware — 0 4 16 13 1 0 3 6 12District of Columbia — 0 1 — 9 — 0 2 8 12Florida — 7 13 188 155 — 1 4 27 36Georgia 1 3 7 108 63 — 1 4 43 37Maryland — 2 12 67 78 — 3 15 117 114North Carolina — 3 11 87 112 — 0 4 15 26South Carolina — 1 4 19 29 — 0 3 — 6Virginia — 3 14 101 73 2 1 4 47 39West Virginia — 0 3 2 12 — 0 0 — 1
E.S. Central 2 8 19 264 156 — 0 4 15 30Alabama — 1 6 43 27 — 0 1 2 5Kentucky 1 2 6 67 42 — 0 2 5 7Mississippi — 1 5 31 13 — 0 1 3 7Tennessee 1 3 11 123 74 — 0 2 5 11
W.S. Central 8 7 39 213 167 1 2 29 56 86Arkansas — 1 6 28 25 — 0 2 3 1Louisiana — 0 2 4 14 — 0 1 1 10Oklahoma — 0 20 32 4 — 0 3 4 1Texas 8 4 20 149 124 1 2 25 48 74
Mountain 5 4 14 125 122 1 1 5 23 52Arizona 2 2 6 59 43 1 0 4 11 23Colorado 2 1 6 28 28 — 0 2 1 12Idaho 1 0 1 3 8 — 0 1 4 —Montana — 0 1 8 5 — 0 1 3 3Nevada — 0 4 10 18 — 0 1 1 4New Mexico — 0 3 3 7 — 0 0 — 2Utah — 0 3 13 11 — 0 3 3 6Wyoming — 0 1 1 2 — 0 1 — 2
Pacific — 11 84 263 295 2 2 46 83 92Alaska — 0 1 1 1 — 0 2 4 2California — 9 31 208 270 — 2 7 55 77Hawaii — 0 1 4 3 — 0 1 3 —Oregon — 1 3 21 21 1 0 2 7 13Washington — 0 67 29 — 1 0 44 14 —
TerritoriesAmerican Samoa N 0 0 N N — 0 0 — —C.N.M.I. — — — — — — — — — —Guam — 0 0 — — — 0 0 — —Puerto Rico — 0 2 1 6 — 0 1 — 2U.S. Virgin Islands — 0 0 — — — 0 0 — —
C.N.M.I.: Commonwealth of Northern Mariana Islands.U: Unavailable. —: No reported cases. N: Not reportable. NN: Not Nationally Notifiable. NP: Nationally notifiable but not published. Cum: Cumulative year-to-date counts. Med: Median. Max: Maximum.* Three low incidence conditions, rubella, rubella congenital, and tetanus, are in Table II to facilitate case count verification with reporting jurisdictions.† Case counts for reporting years 2016 and 2017 are provisional and subject to change. For further information on interpretation of these data, see http://wwwn.cdc.gov/nndss/document/
ProvisionalNationaNotifiableDiseasesSurveillanceData20100927.pdf. Data for tuberculosis are displayed in Table III, which appears quarterly.

Morbidity and Mortality Weekly Report
MMWR / August 18, 2017 / Vol. 66 / No. 32 ND-637
TABLE II. (Continued) Provisional cases of selected notifiable diseases (≥1,000 cases reported during the preceding year), and selected* low frequency diseases, United States and U.S. territories, weeks ending August 12, 2017, and August 13, 2016 (32nd week)† (Export data)
Reporting area
Meningococcal disease (Neisseria meningitidis)§ (all serogroups) Mumps Pertussis
Current week
Previous 52 weeks Cum 2017
Cum 2016
Current week
Previous 52 weeks Cum 2017
Cum 2016
Current week
Previous 52 weeks Cum 2017
Cum 2016Med Max Med Max Med Max
United States 1 6 21 209 246 40 160 519 4,240 1,983 122 303 1,220 9,358 9,973New England — 0 1 6 13 — 3 16 132 256 6 20 73 557 503
Connecticut — 0 1 — 4 — 0 2 8 33 — 1 5 39 69Maine — 0 0 — 1 — 0 4 1 4 4 7 19 245 153Massachusetts — 0 1 4 8 — 2 14 112 210 — 5 13 128 101New Hampshire — 0 0 — — — 0 1 2 8 1 1 4 29 40Rhode Island — 0 0 — — — 0 6 8 1 1 0 19 37 60Vermont — 0 1 2 — — 0 1 1 — — 2 47 79 80
Mid. Atlantic — 0 3 22 24 1 14 33 412 100 19 37 103 1,093 1,885New Jersey — 0 1 3 6 — 1 4 22 18 — 7 18 163 380New York (Upstate) — 0 2 8 6 1 4 23 127 44 9 9 33 325 424New York City — 0 3 4 7 — 5 19 158 34 — 3 14 64 195Pennsylvania — 0 1 7 5 — 1 15 105 4 10 19 86 541 886
E.N. Central — 1 6 21 25 — 8 29 388 668 24 63 191 1,704 2,193Illinois — 0 2 5 9 — 3 22 241 289 — 13 41 291 599Indiana — 0 2 5 5 — 0 4 30 278 — 4 18 193 113Michigan — 0 1 3 3 — 0 2 19 11 — 10 21 303 188Ohio — 0 3 8 5 — 1 8 50 64 24 18 38 537 586Wisconsin — 0 1 — 3 — 0 24 48 26 — 16 133 380 707
W.N. Central — 0 2 9 19 — 22 84 777 678 3 28 102 782 991Iowa — 0 1 — 2 — 4 15 95 594 — 2 19 75 81Kansas — 0 1 2 5 — 1 19 156 6 — 4 11 115 61Minnesota — 0 0 — 5 — 0 12 69 18 — 13 41 231 585Missouri — 0 1 5 4 — 11 72 441 4 3 7 87 276 112Nebraska — 0 1 2 2 — 0 2 4 45 — 2 5 50 112North Dakota — 0 0 — — — 0 2 12 9 — 1 4 31 29South Dakota — 0 0 — 1 — 0 0 — 2 — 0 1 4 11
S. Atlantic 1 1 5 50 37 1 3 10 129 54 5 25 46 778 827Delaware — 0 1 1 — — 0 1 2 — — 0 2 4 11District of Columbia — 0 0 — — — 0 2 10 1 — 0 3 12 6Florida — 0 3 16 9 1 0 5 27 10 4 7 19 257 216Georgia — 0 2 5 9 — 0 6 33 3 — 2 9 60 125Maryland — 0 2 3 1 — 0 3 3 2 — 2 10 59 66North Carolina — 0 2 8 3 — 0 3 23 27 — 5 10 153 201South Carolina — 0 2 7 4 — 0 2 4 3 1 2 12 111 75Virginia 1 0 3 9 8 — 0 4 27 7 — 4 24 119 107West Virginia — 0 1 1 3 — 0 1 — 1 — 0 2 3 20
E.S. Central — 0 1 6 12 — 1 13 107 96 — 13 40 565 554Alabama — 0 0 — 5 — 0 7 30 1 — 3 17 131 119Kentucky — 0 1 2 1 — 0 3 16 92 — 8 28 306 346Mississippi — 0 1 2 — — 0 8 21 — — 0 2 22 1Tennessee — 0 1 2 6 — 0 6 40 3 — 3 9 106 88
W.S. Central — 0 2 17 25 2 40 334 1,067 30 22 35 222 1,259 842Arkansas — 0 1 — 1 — 19 272 537 1 1 3 12 140 26Louisiana — 0 1 3 3 — 0 3 11 — — 1 6 44 36Oklahoma — 0 1 1 4 — 7 93 160 1 — 0 59 93 78Texas — 0 2 13 17 2 6 63 359 28 21 28 148 982 702
Mountain — 0 2 12 14 3 2 13 139 44 26 32 71 1,160 1,001Arizona — 0 1 4 2 3 0 12 32 4 7 8 17 313 211Colorado — 0 2 2 3 — 0 10 57 13 10 12 28 370 418Idaho — 0 1 1 1 — 0 2 5 1 — 1 6 31 70Montana — 0 1 — 1 — 0 3 6 20 9 0 18 62 12Nevada — 0 2 2 3 — 0 1 5 2 — 1 6 46 22New Mexico — 0 1 2 2 — 0 1 2 2 — 3 11 102 93Utah — 0 1 1 2 — 0 9 32 2 — 6 23 228 161Wyoming — 0 0 — — — 0 0 — — — 0 5 8 14
Pacific — 2 16 66 77 33 12 160 1,089 57 17 40 656 1,460 1,177Alaska — 0 1 1 4 — 0 3 5 2 1 1 10 25 80California — 1 4 41 61 — 2 11 77 52 5 30 62 937 906Hawaii — 0 0 — 1 3 1 26 241 — — 0 3 14 47Oregon — 0 3 16 11 — 1 5 54 3 1 3 10 124 144Washington — 0 13 8 — 30 1 152 712 — 10 2 618 360 —
TerritoriesAmerican Samoa — 0 0 — — — 0 0 — — — 0 0 — —C.N.M.I. — — — — — — — — — — — — — — —Guam — 0 0 — — — 0 0 — — — 0 0 — —Puerto Rico — 0 1 1 — — 0 1 1 1 — 0 1 2 10U.S. Virgin Islands — 0 0 — — — 0 0 — — — 0 0 — —
C.N.M.I.: Commonwealth of Northern Mariana Islands.U: Unavailable. —: No reported cases. N: Not reportable. NN: Not Nationally Notifiable. NP: Nationally notifiable but not published. Cum: Cumulative year-to-date counts. Med: Median. Max: Maximum.* Three low incidence conditions, rubella, rubella congenital, and tetanus, are in Table II to facilitate case count verification with reporting jurisdictions.† Case counts for reporting years 2016 and 2017 are provisional and subject to change. For further information on interpretation of these data, see http://wwwn.cdc.gov/nndss/document/
ProvisionalNationaNotifiableDiseasesSurveillanceData20100927.pdf. Data for tuberculosis are displayed in Table III, which appears quarterly.§ Data for meningococcal disease, invasive caused by serogroups ACWY, serogroup B, other serogroups, and unknown serogroups are available in Table I.

Morbidity and Mortality Weekly Report
ND-638 MMWR / August 18, 2017 / Vol. 66 / No. 32
TABLE II. (Continued) Provisional cases of selected notifiable diseases (≥1,000 cases reported during the preceding year), and selected* low frequency diseases, United States and U.S. territories, weeks ending August 12, 2017, and August 13, 2016 (32nd week)† (Export data)
Reporting area
Rabies, animal Rubella Rubella, congenital syndrome
Current week
Previous 52 weeks Cum 2017
Cum 2016
Current week
Previous 52 weeks Cum 2017
Cum 2016
Current week
Previous 52 weeks Cum 2017
Cum 2016Med Max Med Max Med Max
United States 48 49 131 1,390 2,228 1 0 1 6 1 — 0 1 2 —New England 8 3 13 99 180 — 0 0 — — — 0 1 1 —
Connecticut 2 1 6 28 73 — 0 0 — — — 0 0 — —Maine 2 1 5 27 44 — 0 0 — — — 0 0 — —Massachusetts — 0 0 — — — 0 0 — — — 0 1 1 —New Hampshire 2 0 2 13 17 — 0 0 — — — 0 0 — —Rhode Island — 0 4 6 14 — 0 0 — — — 0 0 — —Vermont 2 0 4 25 32 — 0 0 — — — 0 0 — —
Mid. Atlantic 19 11 36 322 598 — 0 1 2 — — 0 0 — —New Jersey — 0 0 — — — 0 0 — — — 0 0 — —New York (Upstate) 19 10 36 322 344 — 0 0 — — — 0 0 — —New York City — 0 1 — 3 — 0 1 2 — — 0 0 — —Pennsylvania — 0 20 — 251 — 0 0 — — — 0 0 — —
E.N. Central 1 1 11 44 73 — 0 0 — — — 0 1 — —Illinois — 0 5 24 38 — 0 0 — — — 0 1 — —Indiana — 0 0 — — — 0 0 — — — 0 0 — —Michigan 1 0 3 10 23 — 0 0 — — — 0 0 — —Ohio — 0 8 10 12 — 0 0 — — — 0 0 — —Wisconsin N 0 0 N N — 0 0 — — — 0 0 — —
W.N. Central 1 2 7 70 83 — 0 0 — — — 0 0 — —Iowa — 0 0 — — — 0 0 — — — 0 0 — —Kansas — 0 4 29 43 — 0 0 — — — 0 0 — —Minnesota — 0 0 — — — 0 0 — — — 0 0 — —Missouri — 0 3 14 15 — 0 0 — — — 0 0 — —Nebraska 1 0 2 13 10 — 0 0 — — — 0 0 — —North Dakota — 0 0 — — — 0 0 — — — 0 0 — —South Dakota — 0 3 14 15 — 0 0 — — — 0 0 — —
S. Atlantic 7 10 47 317 604 1 0 1 2 1 — 0 1 — —Delaware — 0 0 — — — 0 0 — — — 0 0 — —District of Columbia — 0 0 — — — 0 0 — — — 0 0 — —Florida — 0 45 78 59 1 0 1 2 1 — 0 0 — —Georgia — 0 9 — 159 — 0 0 — — — 0 0 — —Maryland — 4 21 96 203 — 0 0 — — — 0 1 — —North Carolina 6 4 10 125 162 — 0 0 — — — 0 0 — —South Carolina N 0 0 N N — 0 0 — — — 0 0 — —Virginia — 0 0 — — — 0 0 — — — 0 0 — —West Virginia 1 0 3 18 21 — 0 0 — — — 0 0 — —
E.S. Central — 1 8 37 66 — 0 0 — — — 0 0 — —Alabama — 1 7 28 49 — 0 0 — — — 0 0 — —Kentucky — 0 3 8 16 — 0 0 — — — 0 0 — —Mississippi — 0 1 1 1 — 0 0 — — — 0 0 — —Tennessee — 0 0 — — — 0 0 — — — 0 0 — —
W.S. Central 12 13 42 375 457 — 0 1 2 — — 0 1 1 —Arkansas 4 0 6 30 15 — 0 1 1 — — 0 0 — —Louisiana — 0 0 — — — 0 0 — — — 0 0 — —Oklahoma — 0 23 35 20 — 0 0 — — — 0 0 — —Texas 8 10 42 310 422 — 0 1 1 — — 0 1 1 —
Mountain — 0 8 11 41 — 0 0 — — — 0 0 — —Arizona N 0 0 N N — 0 0 — — — 0 0 — —Colorado — 0 0 — — — 0 0 — — — 0 0 — —Idaho — 0 4 2 9 — 0 0 — — — 0 0 — —Montana — 0 0 — — — 0 0 — — — 0 0 — —Nevada — 0 2 2 4 — 0 0 — — — 0 0 — —New Mexico — 0 1 3 4 — 0 0 — — — 0 0 — —Utah — 0 3 4 2 — 0 0 — — — 0 0 — —Wyoming — 0 2 — 22 — 0 0 — — — 0 0 — —
Pacific — 5 23 115 126 — 0 0 — — — 0 0 — —Alaska — 0 2 12 9 — 0 0 — — — 0 0 — —California — 5 12 99 108 — 0 0 — — — 0 0 — —Hawaii — 0 0 — — — 0 0 — — — 0 0 — —Oregon — 0 1 4 9 — 0 0 — — — 0 0 — —Washington — 0 20 — — — 0 0 — — — 0 0 — —
TerritoriesAmerican Samoa U 0 0 U U — 0 0 — — — 0 0 — —C.N.M.I. — — — — — — — — — — — — — — —Guam — 0 0 — — — 0 0 — — — 0 0 — —Puerto Rico — 0 0 — — — 0 0 — — — 0 0 — —U.S. Virgin Islands — 0 0 — — — 0 0 — — — 0 0 — —
C.N.M.I.: Commonwealth of Northern Mariana Islands.U: Unavailable. —: No reported cases. N: Not reportable. NN: Not Nationally Notifiable. NP: Nationally notifiable but not published. Cum: Cumulative year-to-date counts. Med: Median. Max: Maximum.* Three low incidence conditions, rubella, rubella congenital, and tetanus, are in Table II to facilitate case count verification with reporting jurisdictions.† Case counts for reporting years 2016 and 2017 are provisional and subject to change. For further information on interpretation of these data, see http://wwwn.cdc.gov/nndss/document/
ProvisionalNationaNotifiableDiseasesSurveillanceData20100927.pdf. Data for tuberculosis are displayed in Table III, which appears quarterly.

Morbidity and Mortality Weekly Report
MMWR / August 18, 2017 / Vol. 66 / No. 32 ND-639
TABLE II. (Continued) Provisional cases of selected notifiable diseases (≥1,000 cases reported during the preceding year), and selected* low frequency diseases, United States and U.S. territories, weeks ending August 12, 2017, and August 13, 2016 (32nd week)† (Export data)
Reporting area
Salmonellosis Shiga toxin-producing E. coli (STEC)§ Shigellosis
Current week
Previous 52 weeks Cum 2017
Cum 2016
Current week
Previous 52 weeks Cum 2017
Cum 2016
Current week
Previous 52 weeks Cum 2017
Cum 2016Med Max Med Max Med Max
United States 485 897 1,959 24,043 29,041 90 134 506 3,542 4,556 138 263 633 7,515 13,652New England 3 37 81 1,162 1,347 — 5 16 146 225 1 6 13 185 158
Connecticut 1 9 23 280 290 — 1 7 29 98 1 1 5 47 31Maine 2 2 7 53 78 — 0 3 15 21 — 0 1 4 —Massachusetts — 22 50 647 712 — 2 14 75 72 — 3 8 95 104New Hampshire — 3 8 67 120 — 0 3 16 17 — 0 3 8 7Rhode Island — 2 7 58 57 — 0 2 2 4 — 0 4 18 15Vermont — 2 8 57 90 — 0 3 9 13 — 0 2 13 1
Mid. Atlantic 117 78 205 2,300 2,787 15 13 30 403 450 31 23 41 673 975New Jersey — 7 55 110 585 — 2 6 59 99 — 5 12 131 163New York (Upstate) 32 25 65 722 794 3 4 14 140 158 9 4 14 129 114New York City 55 17 46 598 520 10 3 7 83 60 18 7 13 243 217Pennsylvania 30 29 66 870 888 2 4 14 121 133 4 7 18 170 481
E.N. Central 49 101 204 2,910 3,769 14 14 45 389 711 15 42 80 1,173 2,366Illinois — 29 54 765 1,103 — 2 9 54 241 — 6 16 157 424Indiana — 13 32 358 481 — 1 7 29 74 — 3 7 55 206Michigan — 17 41 544 675 — 2 10 79 96 — 12 31 347 421Ohio 49 26 68 873 939 14 3 19 154 137 12 13 30 373 719Wisconsin — 12 33 370 571 — 3 13 73 163 3 7 25 241 596
W.N. Central 61 61 114 1,699 2,410 25 20 62 586 891 30 14 50 392 1,751Iowa 11 13 30 445 478 4 3 19 156 206 4 2 7 68 349Kansas — 7 25 224 265 — 2 18 45 81 — 2 17 67 162Minnesota — 0 26 — 595 — 0 13 — 265 — 0 10 — 530Missouri 31 20 44 609 584 10 6 19 206 181 26 7 33 226 558Nebraska 19 6 22 241 172 10 2 8 104 85 — 1 8 13 123North Dakota — 2 9 59 81 1 0 4 30 24 — 0 2 1 12South Dakota — 4 13 121 235 — 1 9 45 49 — 0 7 17 17
S. Atlantic 32 216 513 6,008 7,306 — 11 27 315 341 7 51 80 1,469 1,669Delaware 4 2 17 75 77 — 0 2 5 7 — 1 6 26 35District of Columbia — 1 5 13 41 — 0 3 — 3 — 0 2 8 12Florida — 110 211 2,781 2,786 — 2 12 74 63 — 19 54 674 410Georgia 25 36 90 1,037 1,199 — 3 9 89 63 5 9 20 256 454Maryland — 13 38 328 486 — 1 6 28 39 — 3 8 118 94North Carolina — 26 93 715 1,169 — 1 5 25 44 — 7 28 135 219South Carolina — 17 78 463 787 — 0 2 16 28 — 3 22 167 169Virginia 3 22 46 560 626 — 2 9 77 79 2 3 13 83 271West Virginia — 2 12 36 135 — 0 3 1 15 — 0 2 2 5
E.S. Central 27 74 210 1,916 2,274 2 5 12 146 189 4 18 39 526 448Alabama 1 25 48 584 689 — 0 4 17 22 — 3 8 125 183Kentucky 9 11 35 332 432 1 1 5 26 56 2 7 20 168 114Mississippi 13 20 54 569 594 — 0 2 11 13 1 2 8 85 35Tennessee 4 16 111 431 559 1 3 7 92 98 1 5 13 148 116
W.S. Central 134 131 646 3,117 4,206 13 21 166 535 595 26 46 202 1,163 3,841Arkansas 20 13 46 329 394 3 2 7 53 66 — 3 15 159 106Louisiana — 13 51 172 736 — 0 2 3 16 — 4 22 59 254Oklahoma 33 17 52 433 460 10 2 39 56 69 4 3 44 91 497Texas 81 88 589 2,183 2,616 — 16 122 423 444 22 34 151 854 2,984
Mountain 39 54 94 1,611 1,685 6 14 31 361 514 15 21 46 564 1,265Arizona 14 16 34 447 472 2 3 9 100 91 12 11 30 284 916Colorado 21 12 33 382 412 3 2 11 42 138 3 3 16 104 91Idaho 2 4 10 129 109 1 2 12 74 97 — 0 3 16 37Montana 1 3 8 89 117 — 2 7 62 83 — 0 3 7 8Nevada — 3 9 88 127 — 0 4 11 34 — 1 6 22 40New Mexico — 6 17 167 180 — 0 5 21 26 — 3 17 107 120Utah 1 7 27 255 220 — 1 7 47 39 — 0 4 19 49Wyoming — 1 6 54 48 — 0 2 4 6 — 0 3 5 4
Pacific 23 112 824 3,320 3,257 15 23 274 661 640 9 45 232 1,370 1,179Alaska — 1 3 26 49 1 0 3 5 8 — 0 2 6 4California 15 85 141 2,475 2,783 — 15 39 396 515 3 41 71 1,132 1,067Hawaii — 5 16 147 161 — 0 3 15 10 — 0 3 26 27Oregon 6 9 19 278 264 1 4 12 118 107 1 1 12 78 81Washington 2 2 754 394 — 13 0 259 127 — 5 0 191 128 —
TerritoriesAmerican Samoa — 0 0 — — — 0 0 — — — 0 0 — —C.N.M.I. — — — — — — — — — — — — — — —Guam — 0 5 — 7 — 0 0 — — — 0 5 — 4Puerto Rico — 7 25 131 347 — 0 0 — — — 0 2 5 19U.S. Virgin Islands — 0 0 — — — 0 0 — — — 0 0 — —
C.N.M.I.: Commonwealth of Northern Mariana Islands.U: Unavailable. —: No reported cases. N: Not reportable. NN: Not Nationally Notifiable. NP: Nationally notifiable but not published. Cum: Cumulative year-to-date counts. Med: Median. Max: Maximum.* Three low incidence conditions, rubella, rubella congenital, and tetanus, are in Table II to facilitate case count verification with reporting jurisdictions.† Case counts for reporting years 2016 and 2017 are provisional and subject to change. For further information on interpretation of these data, see http://wwwn.cdc.gov/nndss/document/
ProvisionalNationaNotifiableDiseasesSurveillanceData20100927.pdf. Data for tuberculosis are displayed in Table III, which appears quarterly.§ Includes E. coli O157:H7, Shiga toxin-positive, serogroup non-O157, and Shiga toxin-positive, not serogrouped.

Morbidity and Mortality Weekly Report
ND-640 MMWR / August 18, 2017 / Vol. 66 / No. 32
TABLE II. (Continued) Provisional cases of selected notifiable diseases (≥1,000 cases reported during the preceding year), and selected* low frequency diseases, United States and U.S. territories, weeks ending August 12, 2017, and August 13, 2016 (32nd week)† (Export data)
Reporting area
Spotted Fever Rickettsiosis§
Syphilis, primary and secondaryConfirmed Probable
Current week
Previous 52 weeks Cum 2017
Cum 2016
Current week
Previous 52 weeks Cum 2017
Cum 2016
Current week
Previous 52 weeks Cum 2017
Cum 2016Med Max Med Max Med Max
United States 2 3 10 108 92 78 74 242 3,029 2,542 126 528 668 15,180 16,974New England — 0 0 — — — 0 3 26 14 2 15 30 425 478
Connecticut — 0 0 — — — 0 1 1 6 — 1 6 42 75Maine — 0 0 — — — 0 1 3 1 — 1 4 31 28Massachusetts — 0 0 — — — 0 3 18 5 — 10 22 304 284New Hampshire — 0 0 — — — 0 1 1 1 — 1 4 31 27Rhode Island — 0 0 — — — 0 2 2 1 2 0 18 9 53Vermont — 0 0 — — — 0 2 1 — — 0 3 8 11
Mid. Atlantic 2 0 2 10 3 4 2 11 81 69 23 65 90 1,959 2,222New Jersey — 0 1 1 2 — 1 8 40 45 — 7 19 183 287New York (Upstate) 2 0 2 8 — 3 0 11 15 5 10 10 31 328 285New York City — 0 1 1 1 — 0 2 7 7 5 33 50 973 1,186Pennsylvania — 0 0 — — 1 0 3 19 12 8 15 35 475 464
E.N. Central — 0 2 3 4 — 3 12 124 110 2 45 68 1,206 1,751Illinois — 0 2 2 1 — 1 8 50 44 — 15 36 307 772Indiana — 0 1 1 — — 1 5 48 30 2 6 10 177 210Michigan — 0 0 — 2 — 0 2 3 7 — 6 17 144 227Ohio — 0 1 — 1 — 0 3 15 16 — 14 21 467 461Wisconsin — 0 0 — — — 0 2 8 13 — 3 18 111 81
W.N. Central — 0 3 14 5 6 8 56 492 354 — 21 31 589 610Iowa — 0 0 — — — 0 1 5 9 — 2 5 48 44Kansas — 0 1 1 2 — 1 12 103 84 — 2 7 72 66Minnesota — 0 0 — — — 0 1 — 4 — 5 11 176 188Missouri — 0 2 9 2 6 6 42 367 230 — 8 14 250 247Nebraska — 0 1 2 — — 0 2 7 21 — 1 4 20 36North Dakota — 0 0 — — — 0 2 8 1 — 0 3 15 21South Dakota — 0 1 2 1 — 0 1 2 5 — 0 3 8 8
S. Atlantic — 1 5 53 60 1 12 43 531 575 11 120 154 3,544 4,069Delaware — 0 1 2 1 — 0 7 25 14 — 0 6 21 40District of Columbia — 0 0 — — — 0 1 2 3 — 3 13 106 102Florida — 0 2 3 3 — 0 4 13 4 3 46 63 1,368 1,492Georgia — 1 5 35 48 — 0 0 — — 1 24 36 731 909Maryland — 0 2 8 — — 0 3 16 — — 8 18 238 326North Carolina — 0 2 1 5 — 7 28 300 330 1 19 33 558 685South Carolina — 0 2 3 2 — 1 6 31 25 6 6 16 215 198Virginia — 0 1 1 1 1 4 22 142 191 — 8 29 286 284West Virginia — 0 0 — — — 0 2 2 8 — 0 4 21 33
E.S. Central — 0 4 9 5 20 21 84 973 847 15 25 36 691 763Alabama — 0 1 3 — 1 7 35 328 286 — 7 14 205 213Kentucky — 0 2 — 2 6 3 13 143 97 14 4 13 138 107Mississippi — 0 1 — — — 2 10 78 74 1 5 12 147 199Tennessee — 0 1 6 3 13 8 53 424 390 — 7 15 201 244
W.S. Central — 0 6 7 5 47 18 142 777 543 41 60 78 1,841 1,852Arkansas — 0 1 5 5 33 15 60 660 502 — 3 11 102 92Louisiana — 0 0 — — — 0 2 1 8 — 13 30 359 423Oklahoma — 0 6 2 — 14 0 114 86 3 — 2 10 38 164Texas — 0 1 — — — 1 12 30 30 41 41 58 1,342 1,173
Mountain — 0 3 10 9 — 0 3 16 18 — 35 57 996 1,026Arizona — 0 3 8 5 — 0 2 6 6 — 14 24 412 414Colorado — 0 0 — — — 0 1 2 — — 4 14 114 152Idaho — 0 1 1 3 — 0 1 1 2 — 1 3 33 33Montana — 0 1 1 1 — 0 2 6 3 — 0 3 10 8Nevada — 0 0 — — — 0 1 — 3 — 9 25 290 238New Mexico — 0 0 — — — 0 1 1 — — 3 11 85 114Utah — 0 0 — — — 0 1 — 3 — 1 6 48 65Wyoming — 0 0 — — — 0 0 — 1 — 0 1 4 2
Pacific — 0 1 2 1 — 0 2 9 12 32 129 177 3,929 4,203Alaska N 0 0 N N N 0 0 N N — 0 1 4 5California — 0 1 1 1 — 0 1 5 8 23 116 161 3,488 3,557Hawaii N 0 0 N N N 0 0 N N — 2 6 50 71Oregon — 0 1 1 — — 0 1 4 4 2 6 12 185 220Washington — 0 0 — — — 0 0 — — 7 8 23 202 350
TerritoriesAmerican Samoa N 0 0 N N N 0 0 N N — 0 0 — —C.N.M.I. — — — — — — — — — — — — — — —Guam N 0 0 N N N 0 0 N N — 0 0 — —Puerto Rico N 0 0 N N N 0 0 N N 2 8 18 257 320U.S. Virgin Islands — 0 0 — — — 0 0 — — — 0 0 — —
C.N.M.I.: Commonwealth of Northern Mariana Islands.U: Unavailable. —: No reported cases. N: Not reportable. NN: Not Nationally Notifiable. NP: Nationally notifiable but not published. Cum: Cumulative year-to-date counts. Med: Median. Max: Maximum.* Three low incidence conditions, rubella, rubella congenital, and tetanus, are in Table II to facilitate case count verification with reporting jurisdictions.† Case counts for reporting years 2016 and 2017 are provisional and subject to change. For further information on interpretation of these data, see http://wwwn.cdc.gov/nndss/document/
ProvisionalNationaNotifiableDiseasesSurveillanceData20100927.pdf. Data for tuberculosis are displayed in Table III, which appears quarterly. § Illnesses with similar clinical presentation that result from Spotted Fever Group Rickettsia infections are reported as Spotted Fever Rickettsioses. Rocky Mountain Spotted Fever (RMSF),
caused by Rickettsia rickettsii, is the most common and well-known Spotted Fever.

Morbidity and Mortality Weekly Report
MMWR / August 18, 2017 / Vol. 66 / No. 32 ND-641
TABLE II. (Continued) Provisional cases of selected notifiable diseases (≥1,000 cases reported during the preceding year), and selected* low frequency diseases, United States and U.S. territories, weeks ending August 12, 2017, and August 13, 2016 (32nd week)† (Export data)
Reporting area
Tetanus Varicella (chickenpox)
Current week
Previous 52 weeks
Cum 2017 Cum 2016 Current week
Previous 52 weeks
Cum 2017 Cum 2016Med Max Med Max
United States — 1 3 24 19 55 157 241 4,340 5,518New England — 0 1 1 — 8 14 25 448 561
Connecticut — 0 0 — — 1 1 5 61 78Maine — 0 1 1 — 6 4 10 120 137Massachusetts — 0 0 — — — 5 16 209 222New Hampshire — 0 0 — — — 0 4 — 59Rhode Island — 0 0 — — — 0 5 26 32Vermont — 0 0 — — 1 1 5 32 33
Mid. Atlantic — 0 1 2 4 7 19 38 563 666New Jersey — 0 0 — — — 8 23 244 255New York (Upstate) — 0 1 1 1 N 0 0 N NNew York City — 0 0 — 1 — 0 0 — —Pennsylvania — 0 1 1 2 7 11 21 319 411
E.N. Central — 0 1 2 2 7 35 56 1,001 1,277Illinois — 0 0 — 1 1 7 17 190 286Indiana — 0 1 — — — 3 10 110 122Michigan — 0 1 2 — — 9 21 304 368Ohio — 0 1 — 1 4 8 23 255 267Wisconsin — 0 0 — — 2 5 21 142 234
W.N. Central — 0 1 2 — 1 14 29 373 491Iowa — 0 1 — — N 0 0 N NKansas — 0 1 1 — — 0 11 — 119Minnesota — 0 0 — — — 6 23 241 209Missouri — 0 0 — — 1 2 8 81 88Nebraska — 0 1 1 — — 0 3 18 18North Dakota — 0 0 — — — 0 3 18 32South Dakota — 0 0 — — — 0 2 15 25
S. Atlantic — 0 1 7 5 7 22 48 667 869Delaware — 0 0 — — — 0 3 11 7District of Columbia — 0 0 — — — 0 2 13 14Florida — 0 1 2 3 7 12 28 410 500Georgia — 0 0 — — — 4 18 132 103Maryland — 0 1 1 — N 0 0 N NNorth Carolina — 0 1 3 — N 0 0 N NSouth Carolina — 0 0 — — — 2 15 69 83Virginia — 0 1 1 1 — 2 15 32 162West Virginia — 0 0 — 1 — 0 0 — —
E.S. Central — 0 1 1 3 1 1 5 34 67Alabama — 0 1 1 — — 1 5 29 64Kentucky — 0 1 — 1 N 0 0 N NMississippi — 0 0 — 1 1 0 2 5 3Tennessee — 0 0 — 1 N 0 0 N N
W.S. Central — 0 1 2 3 15 25 96 771 924Arkansas — 0 1 1 — — 2 10 58 80Louisiana — 0 0 — — — 0 8 1 45Oklahoma — 0 0 — 1 N 0 0 N NTexas — 0 1 1 2 15 23 91 712 799
Mountain — 0 1 4 1 8 16 39 405 603Arizona — 0 0 — 1 3 4 13 105 169Colorado — 0 0 — — 5 4 32 106 171Idaho — 0 1 1 — N 0 0 N NMontana — 0 1 1 — — 1 8 23 51Nevada — 0 1 1 — N 0 0 N NNew Mexico — 0 0 — — — 1 6 50 40Utah — 0 1 1 — — 3 10 116 163Wyoming — 0 0 — — — 0 2 5 9
Pacific — 0 1 3 1 1 2 6 78 60Alaska — 0 0 — 1 — 1 3 29 10California — 0 1 2 — — 0 3 15 29Hawaii — 0 0 — — 1 1 5 34 21Oregon — 0 1 1 — N 0 0 N NWashington — 0 0 — — N 0 0 N N
TerritoriesAmerican Samoa — 0 0 — — N 0 0 N NC.N.M.I. — — — — — — — — — —Guam — 0 0 — — — 0 5 — 7Puerto Rico — 0 0 — — — 1 5 20 54U.S. Virgin Islands — 0 0 — — — 0 0 — —
C.N.M.I.: Commonwealth of Northern Mariana Islands.U: Unavailable. —: No reported cases. N: Not reportable. NN: Not Nationally Notifiable. NP: Nationally notifiable but not published. Cum: Cumulative year-to-date counts. Med: Median. Max: Maximum.* Three low incidence conditions, rubella, rubella congenital, and tetanus, are in Table II to facilitate case count verification with reporting jurisdictions.† Case counts for reporting years 2016 and 2017 are provisional and subject to change. For further information on interpretation of these data, see http://wwwn.cdc.gov/nndss/document/
ProvisionalNationaNotifiableDiseasesSurveillanceData20100927.pdf. Data for tuberculosis are displayed in Table III, which appears quarterly.
Morbidity and Mortality Weekly Report
ND-642 MMWR / August 18, 2017 / Vol. 66 / No. 32
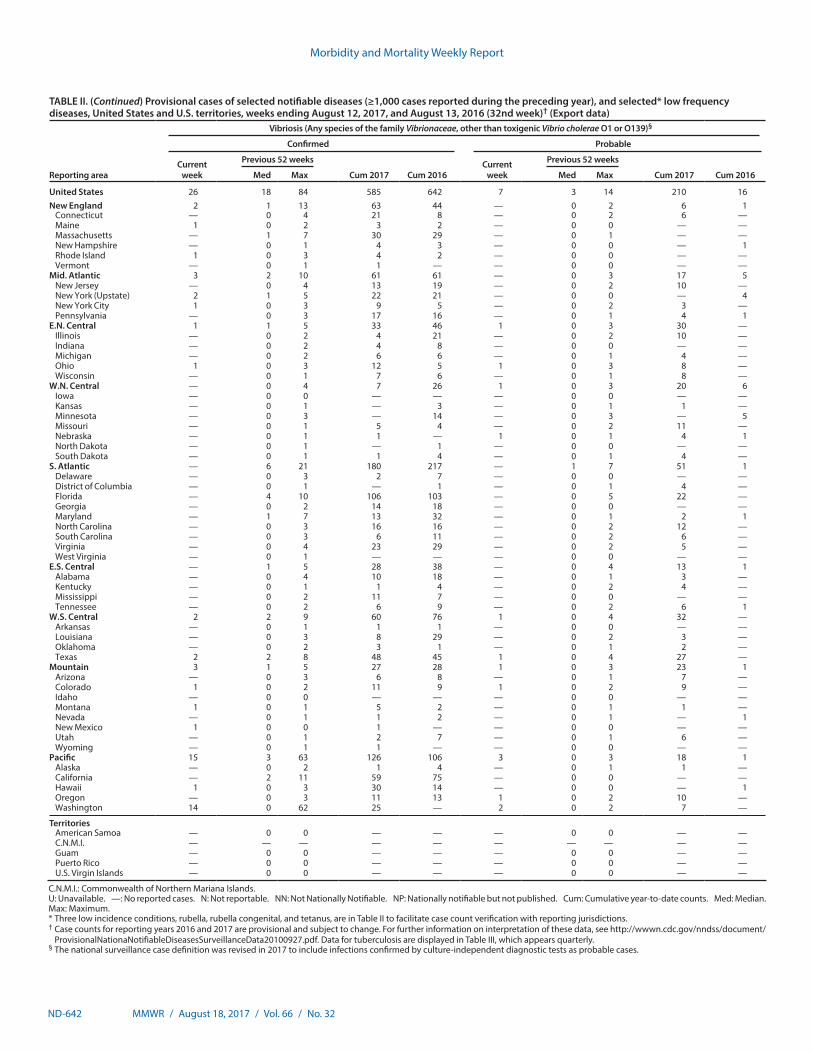
TABLE II. (Continued) Provisional cases of selected notifiable diseases (≥1,000 cases reported during the preceding year), and selected* low frequency diseases, United States and U.S. territories, weeks ending August 12, 2017, and August 13, 2016 (32nd week)† (Export data)
Reporting area
Vibriosis (Any species of the family Vibrionaceae, other than toxigenic Vibrio cholerae O1 or O139)§
Confirmed Probable
Current week
Previous 52 weeks
Cum 2017 Cum 2016Current
week
Previous 52 weeks
Cum 2017 Cum 2016Med Max Med Max
United States 26 18 84 585 642 7 3 14 210 16New England 2 1 13 63 44 — 0 2 6 1
Connecticut — 0 4 21 8 — 0 2 6 —Maine 1 0 2 3 2 — 0 0 — —Massachusetts — 1 7 30 29 — 0 1 — —New Hampshire — 0 1 4 3 — 0 0 — 1Rhode Island 1 0 3 4 2 — 0 0 — —Vermont — 0 1 1 — — 0 0 — —
Mid. Atlantic 3 2 10 61 61 — 0 3 17 5New Jersey — 0 4 13 19 — 0 2 10 —New York (Upstate) 2 1 5 22 21 — 0 0 — 4New York City 1 0 3 9 5 — 0 2 3 —Pennsylvania — 0 3 17 16 — 0 1 4 1
E.N. Central 1 1 5 33 46 1 0 3 30 —Illinois — 0 2 4 21 — 0 2 10 —Indiana — 0 2 4 8 — 0 0 — —Michigan — 0 2 6 6 — 0 1 4 —Ohio 1 0 3 12 5 1 0 3 8 —Wisconsin — 0 1 7 6 — 0 1 8 —
W.N. Central — 0 4 7 26 1 0 3 20 6Iowa — 0 0 — — — 0 0 — —Kansas — 0 1 — 3 — 0 1 1 —Minnesota — 0 3 — 14 — 0 3 — 5Missouri — 0 1 5 4 — 0 2 11 —Nebraska — 0 1 1 — 1 0 1 4 1North Dakota — 0 1 — 1 — 0 0 — —South Dakota — 0 1 1 4 — 0 1 4 —
S. Atlantic — 6 21 180 217 — 1 7 51 1Delaware — 0 3 2 7 — 0 0 — —District of Columbia — 0 1 — 1 — 0 1 4 —Florida — 4 10 106 103 — 0 5 22 —Georgia — 0 2 14 18 — 0 0 — —Maryland — 1 7 13 32 — 0 1 2 1North Carolina — 0 3 16 16 — 0 2 12 —South Carolina — 0 3 6 11 — 0 2 6 —Virginia — 0 4 23 29 — 0 2 5 —West Virginia — 0 1 — — — 0 0 — —
E.S. Central — 1 5 28 38 — 0 4 13 1Alabama — 0 4 10 18 — 0 1 3 —Kentucky — 0 1 1 4 — 0 2 4 —Mississippi — 0 2 11 7 — 0 0 — —Tennessee — 0 2 6 9 — 0 2 6 1
W.S. Central 2 2 9 60 76 1 0 4 32 —Arkansas — 0 1 1 1 — 0 0 — —Louisiana — 0 3 8 29 — 0 2 3 —Oklahoma — 0 2 3 1 — 0 1 2 —Texas 2 2 8 48 45 1 0 4 27 —
Mountain 3 1 5 27 28 1 0 3 23 1Arizona — 0 3 6 8 — 0 1 7 —Colorado 1 0 2 11 9 1 0 2 9 —Idaho — 0 0 — — — 0 0 — —Montana 1 0 1 5 2 — 0 1 1 —Nevada — 0 1 1 2 — 0 1 — 1New Mexico 1 0 0 1 — — 0 0 — —Utah — 0 1 2 7 — 0 1 6 —Wyoming — 0 1 1 — — 0 0 — —
Pacific 15 3 63 126 106 3 0 3 18 1Alaska — 0 2 1 4 — 0 1 1 —California — 2 11 59 75 — 0 0 — —Hawaii 1 0 3 30 14 — 0 0 — 1Oregon — 0 3 11 13 1 0 2 10 —Washington 14 0 62 25 — 2 0 2 7 —
TerritoriesAmerican Samoa — 0 0 — — — 0 0 — —C.N.M.I. — — — — — — — — — —Guam — 0 0 — — — 0 0 — —Puerto Rico — 0 0 — — — 0 0 — —U.S. Virgin Islands — 0 0 — — — 0 0 — —
C.N.M.I.: Commonwealth of Northern Mariana Islands.U: Unavailable. —: No reported cases. N: Not reportable. NN: Not Nationally Notifiable. NP: Nationally notifiable but not published. Cum: Cumulative year-to-date counts. Med: Median. Max: Maximum.* Three low incidence conditions, rubella, rubella congenital, and tetanus, are in Table II to facilitate case count verification with reporting jurisdictions.† Case counts for reporting years 2016 and 2017 are provisional and subject to change. For further information on interpretation of these data, see http://wwwn.cdc.gov/nndss/document/
ProvisionalNationaNotifiableDiseasesSurveillanceData20100927.pdf. Data for tuberculosis are displayed in Table III, which appears quarterly.§ The national surveillance case definition was revised in 2017 to include infections confirmed by culture-independent diagnostic tests as probable cases.

Morbidity and Mortality Weekly Report
MMWR / August 18, 2017 / Vol. 66 / No. 32 ND-643
TABLE II. (Continued) Provisional cases of selected notifiable diseases (≥1,000 cases reported during the preceding year), and selected* low frequency diseases, United States and U.S. territories, weeks ending August 12, 2017, and August 13, 2016 (32nd week)† (Export data)
Reporting area
West Nile virus disease§
Neuroinvasive Nonneuroinvasive¶
Current week
Previous 52 weeks
Cum 2017 Cum 2016Current
week
Previous 52 weeks
Cum 2017 Cum 2016Med Max Med Max
United States 4 8 120 127 373 2 4 97 98 357New England — 0 3 — 3 — 0 2 — 1
Connecticut — 0 1 — — — 0 0 — —Maine — 0 0 — — — 0 0 — —Massachusetts — 0 2 — 1 — 0 2 — 1New Hampshire — 0 0 — — — 0 0 — —Rhode Island — 0 1 — — — 0 0 — —Vermont — 0 0 — 2 — 0 0 — —
Mid. Atlantic — 0 8 1 6 — 0 2 2 2New Jersey — 0 1 — 3 — 0 0 — —New York (Upstate) — 0 4 — — — 0 2 2 —New York City — 0 3 — — — 0 0 — —Pennsylvania — 0 2 1 3 — 0 1 — 2
E.N. Central — 0 30 3 25 — 0 14 3 13Illinois — 0 15 1 15 — 0 14 3 11Indiana — 0 4 2 2 — 0 1 — —Michigan — 0 10 — 5 — 0 1 — —Ohio — 0 3 — 1 — 0 2 — 2Wisconsin — 0 2 — 2 — 0 2 — —
W.N. Central — 0 19 19 44 — 0 48 39 165Iowa — 0 3 — 3 — 0 5 1 1Kansas — 0 3 1 7 — 0 2 3 8Minnesota — 0 3 2 7 — 0 19 6 19Missouri — 0 3 2 1 — 0 1 — 1Nebraska — 0 7 3 7 — 0 7 8 30North Dakota — 0 6 6 8 — 0 11 10 30South Dakota — 0 8 5 11 — 0 16 11 76
S. Atlantic — 0 3 8 16 — 0 2 4 4Delaware — 0 0 — — — 0 0 — —District of Columbia — 0 0 — 1 — 0 0 — —Florida — 0 1 — 5 — 0 0 — 2Georgia — 0 3 6 1 — 0 1 3 1Maryland — 0 1 — 4 — 0 0 — —North Carolina — 0 1 — 2 — 0 0 — —South Carolina — 0 2 1 2 — 0 2 1 —Virginia — 0 2 1 1 — 0 1 — 1West Virginia — 0 0 — — — 0 1 — —
E.S. Central 2 0 8 20 18 — 0 5 8 7Alabama — 0 2 1 4 — 0 1 1 1Kentucky — 0 1 — 1 — 0 1 — 1Mississippi — 0 8 16 12 — 0 2 5 4Tennessee 2 0 1 3 1 — 0 1 2 1
W.S. Central 2 1 23 30 58 2 1 12 23 34Arkansas — 0 2 1 1 — 0 2 2 1Louisiana — 0 7 14 13 — 0 3 4 6Oklahoma — 0 2 3 6 — 0 2 3 9Texas 2 1 19 12 38 2 1 10 14 18
Mountain — 1 18 31 57 — 0 21 10 67Arizona — 0 6 23 25 — 0 2 4 13Colorado — 0 9 2 21 — 0 16 1 45Idaho — 0 1 1 1 — 0 2 — 1Montana — 0 1 — 1 — 0 1 — 2Nevada — 0 2 4 4 — 0 2 5 2New Mexico — 0 2 1 1 — 0 0 — —Utah — 0 3 — 2 — 0 2 — 2Wyoming — 0 2 — 2 — 0 2 — 2
Pacific — 0 43 15 146 — 0 15 9 64Alaska — 0 0 — — — 0 0 — —California — 0 42 15 143 — 0 15 7 63Hawaii — 0 0 — — — 0 0 — —Oregon — 0 1 — — — 0 1 1 1Washington — 0 3 — 3 — 0 1 1 —
TerritoriesAmerican Samoa — 0 0 — — — 0 0 — —C.N.M.I. — — — — — — — — — —Guam — 0 0 — — — 0 0 — —Puerto Rico — 0 0 — — — 0 0 — —U.S. Virgin Islands — 0 0 — — — 0 0 — —
C.N.M.I.: Commonwealth of Northern Mariana Islands.U: Unavailable. —: No reported cases. N: Not reportable. NN: Not Nationally Notifiable. NP: Nationally notifiable but not published. Cum: Cumulative year-to-date counts. Med: Median. Max: Maximum.* Three low incidence conditions, rubella, rubella congenital, and tetanus, are in Table II to facilitate case count verification with reporting jurisdictions.† Case counts for reporting years 2016 and 2017 are provisional and subject to change. For further information on interpretation of these data, see http://wwwn.cdc.gov/nndss/document/
ProvisionalNationaNotifiableDiseasesSurveillanceData20100927.pdf. Data for tuberculosis are displayed in Table III, which appears quarterly. § Updated weekly from the Division of Vector-Borne Diseases, National Center for Emerging and Zoonotic Infectious Diseases (ArboNET Surveillance). Data for Jamestown Canyon virus,
La Crosse virus, Chikungunya virus, Eastern equine encephalitis virus, Powassan virus, St. Louis virus, and Western equine encephalitis virus diseases are available in Table I. ¶ Not reportable in all states. Reporting exceptions are available at http://wwwn.cdc.gov/nndss/downloads.html.