notice of meeting - waikato · notice of meeting: i ... undertaken by a subgroup of the water users...
TRANSCRIPT

Notice of Meeting: I hereby give notice that an ordinary Meeting of the Strategy and Policy Committee will be held on:
Date: Tuesday 13 February, 2018 Time: 10.30am Meeting Room: Council Chamber Venue: Waikato Regional Council, 401 Grey Street, Hamilton East
VRJ Payne Chief Executive Officer
Strategy and Policy Committee Agenda
Chairman Cr B Simcock Deputy Chairman Cr T Mahuta Members Waikato Regional Council Cr J Hayman Cr J Hennebry Cr K Hodge Cr S Husband Cr S Kneebone Cr F Lichtwark Cr A Livingston Cr T Mahuta Cr D Minogue Cr R Rimmington Cr B Simcock Cr H Vercoe Cr K White
Cr B Quayle Quorum Eight (8) members
Gavin Dawson Democracy Advisor
Telephone: 0800 800 401 [email protected] Website: www.waikatoregion.govt.nz
1

OBJECTIVE: To set council’s strategic direction and policy responses, signal regional issues, respond to external agency statutory planning processes via advocacy submissions, advise Council in respect of thought leadership across matters of regional significance, establish strategic priorities for organisational direction and policy setting. SCOPE OF ACTIVITY: 1. This committee will advise council on matters relating to their regional governance role, which
will include delegation to: (a) Develop council’s strategic direction and recommend policy responses. (b) Develop council’s position on regionally significant issues. (c) Provide guidance on regional governance matters, and receive regular information from
regional governance projects, such as the work that is being undertaken by the Waikato Mayoral Forum work streams, which includes the development of the Regional Economic Development Strategy and the Waikato Spatial Plan.
(d) Prepare submissions in relation to central government, neighbouring regional council and territorial authority policy documents, strategies and proposals to support alignment with council’s strategic direction and policies.
2. To maintain oversight of all council’s policy and plans to ensure alignment with strategy. 3. To receive information that monitors the effectiveness of Council’s strategic influence in the
region and to review and recommend revision of Council’s position accordingly.
4. To approve changes to corporate support and financial policies apart from matters that affect or alter Council’s Annual or Long Term Plan.
5. To approve Strategic Finance Policy.
6. To approve Catchment Management and Regional Pest Management Policies, Plans and
Strategies. CROSS BOUNDARY COLLABORATION: 1. To foster cross boundary collaboration on issues where an inter-regional response will create
policy or advocacy efficiencies. 2. To be kept informed of emerging cross boundary issues and to provide guidance on Council’s
position. 3. To provide guidance on cross boundary collaboration, and also receive updates and feedback.
4. To provide strategic oversight for programmes related to Upper North Island direction, Auckland
policy integration, regional development, and improving connectedness and regional community.
2

POWER TO ACT:
1. To receive reports and presentations on the matters set out in the Scope of Activity.
2. To approve submissions on statutory documents, consistent with council policy.
3. To approve investment and liability management policies.
4. To approve Council’s Infrastructure Strategy, Scheme Land Licence Policy, Marine Oil SpillContingency Plan, and the Regional Pest Management Plan.
POWER TO RECOMMEND TO COUNCIL:
1. To provide recommendations for council action in relation to its strategic direction.
2. To provide central government advocacy on matters of regional importance.
3. To develop and council’s governance position on matters of regional significance includingmatters pertaining to cross boundary collaboration.
SUBCOMMITTEES REPORTING TO STRATEGY AND POLICY COMMITTEE:
1. Submissions Subcommittee
2. Regional Public Transport Plan Development Subcommittee
3

Item Table of Contents Page 1 Apologies
2 Confirmation of Agenda
3 Disclosures of Interest
4 Confirmation of Minutes
6 - 16
5 Verbal Update from Communications
6 Thames-Coromandel District Council and Hauraki District Council Mangrove Management Bill Doc # 11775432 Report to seek approval on the content, and subsequent lodgment, of the Council’s submission to the Thames-Coromandel District Council (TCDC) and Hauraki District Council (HDC) Mangrove Management Bill.
17 - 38
7 Update of National Policy Statement on Freshwater Management amendments, Swimmability targets Doc # 11793867 Report to provide an update on the swimmability targets being progressed by the Ministry for the Environment, Ministry of Primary Industries, and the regional sector.
39 - 42
8 Transport Update Doc # 11701489 Report to highlight current regional land transport planning issues.
43 - 49
9 Regional Public Transport Plan Fares Policy Amendment Doc # 11699552 Report to seek the endorsement and recommendation of the proposed fare policy amendment in the operative Regional Public Transport Plan 2015-25.
50 - 62
10 Water Users Liaison Forum – review of information gathering charges to inform Council’s Long Term Plan considerations Doc # 11685153 Report to inform Committee on the review of information gathering charges undertaken by a sub-group of the Water Users Liaison Forum, and to seek Committee approval of the annual charges for science and information gathering levied by WRC on water take consent holders in the region.
63 - 163
11 2018-2028 Long Term Plan – February update Doc # 11743745 Report to provide an update of the LTP development programme and set out the work plan for the next few months, outline the consultation topics for inclusion in the consultation document as agreed by the council at the
164 - 169
4

meeting on 30 January 2018, and outline the proposed process for submitting to other councils’ Long Term Plans
12 2018-2028 LTP forecasting assumptions Doc # 11744951 Report to present the final version of non-financial forecasting assumptions for the 2018-2028 Long Term Plan (LTP).
170 - 178
13 2018-2028 LTP performance measures Doc # 11790105 Report to adopt the 2018-2028 Long Term Plan (LTP) performance measures.
179 - 234
14 2018-2028 LTP rates remission and rates postponement policies Doc # 11793818 Report to present the proposed rates remission and postponement policies for inclusion in the 2018 – 2028 Long Term Plan. It highlights the key changes to these policies that staff are proposing, together with the rationale for these changes.
235 - 262
5
Strategy and Policy Committee MINUTES
Minutes of a meeting of the Strategy and Policy Committee held in Council Chambers, 401 Grey Street, Hamilton East on Tuesday 28 November 2017 at 10.00am Present: Chairperson Cr T Mahuta
(from 10.20am to 2.30pm) Cr A Livingston (from 10.00am to 10.20am and from 2.30pm to 4.00pm)
Waikato Regional Council Members Cr B Quayle Cr J Hennebry Cr S Husband Cr S Kneebone Cr F Lichtwark Cr A Livingston Cr D Minogue Cr R Rimmington Staff V Payne (Chief Executive) M Garret (Chief Financial Officer) B Bunting (Strategic Advisor) G Dawson (Democracy Advisor)
6

Under Standing Order 13.2, the Chief Executive of the Waikato Regional Council opened the meeting due to the absence of the Chair and Deputy Chair of the Committee. Councillor Livingston was appointed by the Committee as the Chair until Councillor Mahuta arrived. Cr Quayle moved/ Cr White seconded
SPC17/52 RESOLVED THAT Councillor Livingston be appointed as the Chair of Strategy and Policy Committee in the absence of the Chair and Deputy Chair.
The motion was put and carried (SPC17/52) Apologies (Agenda Item 1) The apologies from Councillors Vercoe, Simcock, and Hayman for absence and the late arrival of Councillor Mahuta were accepted.
Confirmation of Agenda (Agenda Item 2) Cr Livingston moved/Cr Minogue seconded)
SPC17/52.1 RESOLVED THAT the agenda of the meeting of the Strategy and Policy Committee of 28 November 2017, as circulated, be confirmed as the business for the meeting.
The motion was put and carried (SPC17/52.1) Disclosures of Interest (Agenda Item 3) There were no disclosures of interest.
SECTION A: UNDER DELEGATION AND FOR THE INFORMATION OF COUNCIL Verbal Update from Communications (Agenda Item 4) Team Leader – Communications (K. Jonson), and Manager – Communications and Engagement (N. Chrisp) gave a verbal report to the Committee. They raised the following discussion points:
• Explained and described the range of events where the Waikato Regional
Council (the WRC) had been represented; • Explained and described the promotion and engagement activities occurring
in relation to the Healthy Rivers Programme;
7

• Explained and described the data and findings of the stakeholderinteractions survey, and the progress and other measures being taken toimprove this area of the WRC; and
• Explained and described the results and next steps for the iLab project –harvesting innovative ideas from staff; and
• Work in the area of the recognition and acknowledgement of externalenvironmental groups.
Waipa Feasibility Study (Agenda Item 5, Doc 11084166)
Zone Manager (G. Blackie) presented and spoke to this report that provided information on a feasibility study that has been undertaken with co-funding from the Waikato River Authority and the Ministry of Primary Industries.
Discussion points included the following:
• Scoping of the study and the range of trees that were included;• Internal and external consultation process that was used in the study;• Need for an integrated approach and involvement from all sectors and
stakeholders;• How the study fits within, and is connected to, other local and central
government initiatives;• Potential use and benefits of the study including publicly available
information;• Resources that were used to complete the study;• Mitigation of any privacy, zoning, and land use risks;• High rate of sediment in the catchment; and• Perceived risks to and for the agricultural sector.
Cr Kneebone moved/Cr Minogue seconded.
SPC17/53 RESOLVED THAT the report ‘Waipa Afforestation Feasibility Study (Doc #11084166 dated 26 October 2017) be received.
The motion was put and carried (SPC17/53) Cr Husband voted against
Long Term Plan (LTP) Development – November 2017 (Agenda Item 6, Doc 11402758)
The Chief Financial Officer (M. Garret) and the Corporate Planning Manager (N. Hubbard) presented and spoke to this report which provided an update of the LTP development programme and set out the work plan for the next few months and introduce the proposed campaign for phase 2 of the LTP community engagement.
Discussion centred on the following themes:
• Need for a clear, measured, and language appropriate communicationsstrategy that uses a range of online and traditional communications
8
approaches that will effectively promote the Long Term Plan and enhance the level and quality of community engagement.
Cr Livingston moved/Cr Rimmington seconded.
SPC17/54 RESOLVED THAT the report ‘2018 – 2028 Long Term Plan (LTP) Development – November Update’ (Doc 11402758 dated 20 November 2017) be received.
The motion was put and carried (SPC17/54)
SECTION B: FOR RECOMMENDATION TO COUNCIL
Submission to Hamilton City Council’s Proposed Private Plan Change 2 - Te Awa Lakes (Agenda Item 10, Doc 11372485 & 11369040) The Chief Executive and Development Manager of the Perry Development Group made a presentation. They spoke to the Committee with the permission of the Chief Executive of the WRC under Section 15 of Standing Orders. Discussion points were as follows: • Economic and social benefits and risks of the development were
acknowledged by the Committee; • However, a prevailing concern was raised in relation to lack of information
and evidence related to zoning, environmental impacts, land use, transport, and infrastructure;
• It was noted by the Committee that more information is needed before a robust, transparent, and evidence based decision could be made by the Committee;
• In addition, concerns regarding the possible impact that the development will have on Central Hamilton were raised; and
• Proposed development plan was inconsistent with existing planning approaches and provisions.
It was noted by the Chief Executive of the WRC that staff would make a presentation immediately after the Perry Development Group presentation, which would address the concerns to date of the WRC. It is that presentation that the minutes now turn to. Acting Team Leader of Policy Implementation (L. Vyfhuis) presented and spoke to her report that provided the proposed background and positions of the WRC on the proposed development. Discussion followed after the presentation which included: • The Committee agreed with the speaker that there is a need to ensure that
the whole process is fully informed, evidence based, consistent, and results in creating and maintaining high levels of certainty;
9

• The proposed development was discussed in the context of central government policy making mechanisms such as national policy statements and, the position of the Futureproof Strategy in the Regional Policy Statement; and
• It was noted that change is constant, however, the systems used to encourage and approve development must be completed in an accountable and transparent manner.
Cr Minogue moved/Cr Livingston seconded.
SPC17/55 RESOLVED
1. THAT the report “Submission to Hamilton City Council’s Proposed Plan Change 2 – Te Awa Lakes be received.
RECOMMENDED
2. THAT the Committee approves the submission on the proposed private plan change 2 – Te Awa Lakes, subject to any amendments, for submission to Hamilton City Council.
3. THAT staff keep Council informed of any changes in Council’s position in the relation to Te Awa Lakes as a result of further information and/or discussions with the applicant, Futureproof and other parties.
RESOLVED
4. THAT the Committee approves the Director Science and Strategy submitting feedback to Hamilton City Council in respect of the proposed Te Awa Lakes Special Housing Areas which includes the submission on Proposed Private Plan Change 2 - Te Awa Lakes.
5. THAT the following paragraph be inserted into the Introduction section the WRC submission “2.4 - Council’s submission is assessed on the information provided. We have committed to undertaking discussions with the applicant and other parties to consider the issues raised in our submission.”
The motion was put and carried (SPC17/55)
Cr Hennebry and Cr White voted against the motion
Review of the Waikato Emergency Services Fund (Agenda Item 7, Doc 11253357) B. Boyle and P. Zimmer from Land Search and Rescue made a presentation to the Committee that demonstrated the range of work and situations that the organisation works with, how they are funded, and the issues and risks they face as an organisation. After the presentation the Committee asked the presenters a range of questions and the following discussion points were made:
10

• The Committee thanked the presenters for the work that they and their colleagues do for the public in the Waikato and around New Zealand; and
• The Committee expressed a shared view of the important role that the organisation performs.
The meeting adjourned for lunch at 12.40pm and reconvened at 1.30pm.
Ihsana Ageel, Principal Advisor – Community and Services, presented and spoke to this report. The report provided feedback from territorial authorities on the review of the Regional Services Fund (RSF), provided an update (from current beneficiaries) on service delivery for the year ended 2016/17, and to sought the view of the Committee on identifying next steps for this review to recommend to council. After the presentation the Committee raised the following points: • The Committee expressed some concerns around the system and manner in
which emergency services are funded and administered; • That there is a need for a careful and considered approach to resolving
service delivery and policy matters for the emergency services; and • There is a need for greater clarity of purpose and transparency standards for
local providers of emergency services. • The preference of option B of the report was expressed by a majority of the
Committee.
Cr Minogue moved/Cr Lichtwark seconded.
SPC17/56 RESOLVED 1. That the Report ‘Review of the Waikato Regional Emergency Fund’ be
received.
RECOMMENDED
2. That the Strategy and Policy Committee recommends option 3B, which includes Land Search and Rescue and an increase in quantum of funding, in subject to the Long Term Plan process.
RESOLVED 3. That the Strategy and Policy Committee supports a reassessment of the
Surf Life Saving allocation subject to Long Term Plan process.
`The motion was put and carried (SPC17/56)
SECTION B: FOR RECOMMENDATION TO COUNCIL
11

Local and Social Procurement (Agenda Item 8, Doc 11068593) Chief Financial Officer (M. Garret) presented and spoke to this report which provided a review of Local Procurement spend and an overview of Social Procurement considerations within the Council. After the presentation the Committee raised the following points: • There was interest from the Committee on using more local goods and
service providers with a broad and inclusive approach; • The Committee wanted to ensure that there is quality and meaningful
engagement throughout the procurement process; • The living wage movement and its aims was raised and the implementation
of it at the WRC. It was noted that it is a national policy issue and the WRC is not in a place to effectively address that issue; and
• Iwi are often part of many new projects and tenders because they are owners of assets that are involved such as land, this circumstance creates a need for full and genuine discussions between Iwi and the WRC.
Cr Rimmington moved/Cr Livingston seconded
SPC17/57 RESOLVED
1. That the report ‘Local and Social Procurement’ (Doc # 11315943 dated 02 November 2017) be received
RECOMMENDED
2. That the Procurement Policy be updated to include Social Procurement criteria.
RECOMMENDED
3. That social procurement guidelines are developed, based on social value considerations.
The motion was put and carried (SPC17/57) Councillor Lichtwark abstained from this vote citing perceived conflicts of interests
SECTION A: UNDER DELEGATION AND FOR THE INFORMATION OF COUNCIL
Maori Engagement Framework – Schedule 3 of the Significance and Engagement Policy (Agenda Item 9, Doc 11338356) Policy and Strategy – Matauranga Maori Engagement (T. Douglas), presented this report. The report set out to present the Māori Engagement Framework, Schedule 3 of the Waikato Regional Council Significance and Engagement Policy. The presenter noted that the resolution being presented at the end of that presentation was different from the original that was included in the agenda papers.
12

It was stated that the revised amendment would ask the Committee to approve the framework, not just receive the report. The following matters were raised by the Committee: • Many members felt that more policy and financial analysis was needed
before the Committee could make a transparent and fully informed decision; • There are high levels of support for Maori engagement frameworks from the
Committee. It was noted that these types of frameworks work best when a meaningful, deliberate, strategic, and high impact approach is used; and
• There is a need to encourage all internal and external stakeholders to view Maori engagement frameworks through more open and more objective approach.
It was suggested by Councillor Husband that the matter be discussed and analysed further at a workshop to allow a greater understanding of the framework and deeper analysis any potential impacts. Cr Husband moved/Cr Rimmington seconded
SPC17/58 RESOLVED 1. That the report ‘Maori Engagement framework’ be received and the matter
is workshopped.
2. That the committee endorse and recommend to council that the Maori Engagement Framework be included as Schedule 3 of the Significance and Engagement Policy (SEP) subject to the financial implications of the framework and collaboration matters being considered through LTP process.
The motion was put and carried (SPC17/58)
Shared Waters CCO, proposed by Hamilton City Council and Waipa District Council (Agenda Item 11, Doc 11368116, 11325541 & 11369040) Acting Team Leader – Policy Implementation (L. Vyfhuis) and Policy Advisor – Policy Implementation (A. Cifuentes) presented and spoke to this report. The report provided the Committee with an update on the proposed Council Controlled Organisation (CCO) that Hamilton City Council (HCC) and Waipa District Council (Waipa DC) intend to establish, in order to provide water, wastewater and stormwater services through a shared services arrangement (Shared Waters Management Company).
The Committee raised a range of issues, which included the following:
• There is a need to manage actual and perceived ownership and liability implications in relation to the management and delivery of public services through Council Controlled Organisations (CCO);
13

• There is a need to view political and policy implications within the legal framework that a CCO is governed by;
• The obligations of the WRC under co-governance and other Treaty Settlements need to be considered as part of the establishment and management of a CCO; and
• There is a need for all parties and stakeholders involved to clearly establish, understand, and own the guidelines and purposes of the proposed CCO.
Cr Rimmington moved/Cr Livingston seconded.
SPC17/59 RESOLVED
1. That the report “Shared Waters CCO, proposed by Hamilton City Council
and Waipa District Council” (Doc # 11368116, dated 28 November 2017) be received.
2. That the document “CCO Shared Water Management Company
submission” (Doc # 11325541, dated 27 November 2017) be received, and the committee retrospectively approves the same for lodgement to the Hamilton City and Waipa District Councils.
The motion was put and carried (SPC17/59)
Upcoming Submissions
(Agenda Item 12, Doc 11372559) Policy Advisor – Policy Implementation (H. Walsh) presented and spoke to this report. Cr Husband moved/Cr White seconded.
SPC17/60 RESOLVED That the report “Upcoming Submissions” (Doc # 11372559 dated 28 November 2017) be received.
The motion was put and carried (SPC17/60)
Regional and Coastal Plan Review (Agenda Item 13, Doc 10775620) The Manager Policy (T. Quickfall) presented and spoke to this report. The report sought a recommendation on the preferred governance arrangement for the Regional Plan and Coastal Plan review (He Taiao Mauriora – Healthy Environments), and for the Committee to endorse a process to obtain agreement from iwi Joint Management Agreement partners to commence the Regional Plan review. The following discussion took place in response to the presentation:
14

• It was noted that the content reflected the workshop previously held and the contribution of the team that worked on this project was appreciated;
• There is a need to include meaningful engagement with Iwi to ensure that there are positive outcomes that deal with a range of issues and that any risks for both Iwi and the WRC are effectively mitigated; and
• There is a need for robust and thorough discussion, along with clear, measured, and fit for purpose decisions around any governance systems and arrangements that may eventuate.
Cr Livingston moved/Cr Quayle seconded.
SPC17/61 RESOLVED
1. That the report ”Healthy Environments - He Taiao Mauriora (Regional and Coastal Plan review) – Preferred approach and process to obtain agreement to commence” (Doc # 10775620 dated 14 November) be received.
2. That the Committee endorse and recommend to Council a preferred governance arrangement Option 3 as follows:
a. Establishment of a Plan Review Committee comprising 6 elected members, 5 River Iwi governors, and a seat for 1 Pare Hauraki governor (scope to be confirmed)
b. Establish an as-required Plan Review Working Group with members selected from the Plan Review Committee, and as appropriate, a Department of Conservation member (scope to be confirmed).
3. That the Committee endorse and recommend to Council the following process for River iwi agreement to commence the Regional Plan Review:
a. Convene the Joint Working Parties (comprising Director Science and Strategy or delegate, and Joint Management Agreement managers). b. Joint Working Party recommendation(s) to Council’s Chief Executive and to Trust Board Chief Executives to commence the review of the Waikato Regional Plan. c. That the Chair and Councils Chief Executive co-write a letter to each River Iwi Trust Board Chair and Chief Executive and Chair requesting agreement to commence the review of the Waikato Regional Plan. d. Agreement to commence is provided in writing by response.
The motion was put and carried (SPC17/61)
Our Atmosphere and Climate 2017 Domain Report: Data to 2016 (Agenda Item 14, Doc 11311827) Principal Strategic Advisor – Science and Strategy (B. Dickie) presented and spoke to this report. The report provided the Committee with an understanding of the Atmosphere and Climate domain report and to report on the regional response with particular emphasis on the Climate Change Response Roadmap.
15

The following discussion resulted from the presentation: • Riparian planting is not counted in the Emissions Trading Scheme due to the
strict definition that is applied. This distorts the figures from what they actually are and is having a range of impacts around the Waikato region;
• Climate change and other environmental policy positions from central government were discussed, however, impacts are unclear at this early stage of new Government.
Cr Livingston moved/Cr Quayle seconded.
SPC17/62 RESOLVED That the report “Our Atmosphere and Climate 2017 Domain Report: Data to 2016” (Doc # 11311827 dated 1 November 2017) be received.
The motion was put and carried (SPC17/62) Meeting closed at 4.00pm. Doc # 1126352
16
Report to Strategy and Policy Committee
Date: 01 February 2018
Author: Ben Bunting, Principal Advisor Science and Strategy
Authoriser: Tracey May, Director Science and Strategy
Subject: Waikato Regional Council submission to the Thames-Coromandel District Council and Hauraki District Council Mangrove Management Bill
Section: A (Committee has delegated authority to make decision)
Purpose 1. To seek approval from Committee on the content, and subsequent lodgement, of the Council’s submission
to the Thames-Coromandel District Council (TCDC) and Hauraki District Council (HDC) Mangrove Management Bill.
Executive Summary 2. In late November 2017, the Parliament Governance and Administration Select Committee called for
submissions to the TCDC and HDC Mangrove Management Bill. The submission closing date is 23 February 2018.
3. The Local Bill, as currently worded, has implications and uncertainties for Council’s functions in the coastal marine area.
4. Council supports the intent of the Bill to improve the efficiency and effectiveness of mangrove management by the district councils.
5. Council’s submission on the Bill focusses on improving its workability, balance and fairness. It also seeks clarity from the Select Committee on the implications the Local Bill has for regional council functions, and on the district council’s responsibilities to avoid, remedy or mitigate adverse effects.
Staff Recommendations:
1. That the report ‘Waikato Regional Council submission to the Thames-Coromandel District Council and Hauraki District Council Mangrove Management Bill’ (Doc # 11775432 dated 1 February 2018) be received.
2. That Committee approve the “Waikato Regional Council submission to the Thames-Coromandel District Council and Hauraki District Council Mangrove Management Bill” (Doc # 11630356) for lodgement to the Secretariat of the Parliament Governance and Administration Select Committee.
Previous reports 6. The Committee previously received a report on the Local Bill at its March 2017 meeting (Doc # 10092097), at
that meeting Committee recommended: a. “THAT Council support Thames Coromandel District Council in their approach of seeking a Local Bill
for mangrove management. b. THAT Council takes a neutral position in regard to the content of the Bill.
17

a. THAT Council and Thames Coromandel District Council continue to work cooperatively under the Statement of Intent and requests that Thames Coromandel District Council keep Waikato Regional Council informed of the progress of the proposed Local Bill on a regular basis.”
b. (SPC17/59)
7. The Bill had not yet been drafted at the time of that Committee recommendation.
Background 8. Management of mangroves as an issue has a long history on the Coromandel Peninsula. By way of brief
recent history: a. Mangrove removal currently requires resource consent under the Waikato Regional Coastal Plan. b. ICM Directorate holds resource consents for the removal of mangroves at Whangamata,
Wharekawa and Tairua. Completion of these works is scheduled for April 2019. c. Exercise of these consents by Council has been challenging and, while the agreed consent
outcomes have been delivered, the level of amenity outcome desired by some parts of the Whangamata community were not part of the agreed consent outcomes.
d. In May 2016, the Chief Executives of Waikato Regional Council (WRC) and TCDC signed a Statement of Intent for collaborative mangroves management. This included reviewing, as a priority, the mangrove management provisions of the Waikato Regional Coastal Plan to better facilitate mangrove management.
e. In December 2016, WRC staff commenced a review of the mangrove management provisions of the Regional Coastal Plan in accordance with the Statement of Intent (SOI), as part of the wider Regional Coastal Plan Review. This work was well underway when, in March 2017, WRC became aware of the intention of TCDC to prepare a mangrove management Bill as a means to facilitate permissive mangrove removal. WRC was not consulted as part of the TCDC and HDC decision to pursue a Local Bill as an option.
f. The Local Bill was introduced to the Parliament in early July 2017 by Coromandel MP Scott Simpson (National) and passed its first reading in August 2017. As a consequence, WRC ‘paused’ the planned stakeholder and community engagement as part of the Regional Coastal Plan review so as to not distract the community from the Local Bill process and to avoid potentially unnecessary investment while progress of the Local Bill continued. This action to pause the WRC work programme was undertaken in agreement with TCDC through the Statement of Intent process.
g. In late November the Parliament Governance and Administration Select Committee called for submissions on the Local Bill. The submission period closes on 23 February.
Issues Overview of the Local Bill content
9. A copy of the Local Bill is at Attachment 2. The purpose of the Local Bill is to enable TCDC and HDC, either separately or jointly, to remove mangroves from the coastal area and restore, protect and enhance amenity values and/or ecosystems of the coastal area.
10. HDC’s interests in the Local Bill are focussed on the permissive maintenance dredging of streams and
channels that flow into the southern Firth of Thames.
11. The Local Bill provides both councils with the discretionary power to develop mangrove management plans for specified parts of their area, subject to the provisions contained in the Bill. The mangrove management plan, when adopted and operative, is the vehicle to achieve the purposes of the Local Bill. The Bill proposes that a mangrove management plan details:
The mangrove management area. This may be site/location specific or apply to any area of public land determined by the council.
Removal methods proposed to be used
Any rules and restrictions that should be applied to the management activity
Identification of any amenity values to be restored and/or ecosystems to be protected
A review mechanism to assess effectiveness of removal.
18

12. The council (TCDC or HDC) will establish a mangrove management committee (of the council) to prepare, adopt and implement the mangrove management plan. The Local Bill proposes a mangrove management committee contain at least one iwi representative.
13. The mangrove management committee must prepare a draft mangrove management plan which would
be subject to the Special Consultative Procedure (under Section 83 of the Local Government Act 2002) before adoption. This procedure provides the opportunity for interested persons to present their views to the council. While the committee must have regard to views expressed during the Special Consultative Procedure, it is the final decision maker in finalising and approving the mangrove management plan. There are no appeal rights under these provisions.
14. The Local Bill does not seek that the district councils endorse the final mangrove management plan by
decision to make it operative, but rather, the plan become operative when it is made publically available.
Implications of Local Bill (if enacted) 15. In exercising powers under the Local Bill, the two district councils would not have to comply with any other
existing laws which control mangrove management activities (including disposal activities) within areas defined through mangrove management plans. This includes subservient planning documents developed under the Resource Management Act 1991 (RMA), this would include the provisions of the Waikato Regional Coastal Plan. The enactment of the Local Bill would potentially set a challenging legal precedent for other discretionary activities usually subject to RMA provisions.
16. If the Local Bill was enacted, except as provided for in the Bill for mangrove management (as specified
through mangrove management plans), Council would continue to retain statutory responsibility under the Resource Management Act 1991 (RMA) relating to all other activities within the Coastal Marine Area (CMA), including discharges from land into the CMA.
17. A key concern for Council is that mangroves are part of a wider catchment ecosystem, and, without due
consideration of the catchment system the management of mangroves as proposed under the Local Bill has the potential for consequential and possibly unintended effects which may impact on, or conflict with, regional council functions.
Council position on the Local Bill
18. The management of mangroves has been a vexed issue for Council over the last decade. There are divergent community views about the value of mangroves, approaches to mangrove management and the outcomes sought. While Council staff have worked hard to ensure all views have been considered and included in decision making around mangrove management, there are polarised and vocal views within some parts of the Whangamata community which have, to a degree, had a bearing on the progress on the mangrove management policy response.
19. The resource consent process which Council has undertaken on behalf of the community and TCDC has
been costly and has been at the expense of greater investment in land management practices to reduce sedimentation. Sedimentation which has a strong correlation of catchment land management practices, the main contributor to mangrove spread, in harbours and estuaries.
20. From a financial and political perspective Council supports the district councils’ intent through the Local
Bill to improve the efficiency and effectiveness of mangrove management by the district councils and to enable the district councils to maintain areas previously cleared under the resource consent process.
21. Consistent with Committee recommendation SPC17/59 Council holds a neutral position on retaining or
removing mangroves. Council cannot form a ‘remove or retain’ position ahead of undertaking robust and inclusive consultation on the mangroves topic as part of Regional Coastal Plan review.
19

22. Council is strongly of the view that retention or removal of mangroves needs to be assessed on a case by case basis, having regard to the individual circumstances and values of each harbour and estuary as well as the localised community views.
Key points of Council submission 23. The focus of the attached submission is to improve the mechanics and workability and balance of
mangrove management plans proposed under the Local Bill. Key points raised for the Select Committee to consider in progressing the Local Bill include further information in regard to: a) the full suite of values associated with mangroves when preparing and considering a mangrove
management plan b) that implementation of mangrove removal under the local bill has the potential for consequential and
possibly unintended effects within the CMA that might impact on, or be in conflict with, regional functions to manage effects in the CMA
c) district council responsibilities for the full costs of mangrove management activities d) district council responsibilities for management of any adverse effects and remediation that might
result from mangrove removal activities, including costs e) the composition of a mangrove management committee being representative of community
perspectives, including the regional council f) the implications of activities or proposals sought under other legislation to be carried out in areas
subject to the Local Bill.
Next steps 24. On 29 March 2018 the Parliament Governance and Administration Select Committee intends to publish its
report and recommendation on whether or not the Bill should proceed further. The Select Committee comprises eight members consisting of four National MPs and four Labour Party MPs.
25. If the Local Bill does not progress further Council staff will immediately recommence its Regional Coastal
Plan review work on the mangroves topic including community engagement.
26. If the Local Bill is successful the Regional Coastal Plan would need to be amended in accordance with the enacted Bill.
Assessment of Significance 27. Having regard to the decision making provisions in the LGA 2002 and Councils Significance Policy, a decision
in accordance with the recommendations is not considered to have a high degree of significance.
Legislative context 28. The Local Bill is a proposed law only. Should the Select Committee decide progress of the Local Bill is
warranted it must pass a second and third reading in Parliament before enactment.
Policy Considerations 29. If the Local Bill does not progress further Council will immediately recommence its Regional Coastal Plan
review work on the mangroves topic including community engagement. To the best of the writer’s knowledge, this decision is not significantly inconsistent with nor is anticipated to have consequences that will be significantly inconsistent with any policy adopted by this local authority or any plan required by the Local Government Act 2002 or any other enactment.
Conclusion 30. Council intends to submit to the Parliament Governance and Administration Select Committee on the TCDC
and HDC Mangrove Management Bill. A submission has been prepared (attached) for Committee consideration. While supporting the district councils’ intent through the Local Bill, as currently structured it has implications and uncertainties for Council’s regional functions in the coastal marine area.
20

31. Council’s submission on the Local Bill focusses on improving its workability, as well as seeking clarity on regional council functions, the district councils’ responsibilities to avoid, remedy or mitigate adverse effects and the costs associated with this.
Attachments 1. Thames-Coromandel District Council and Hauraki District Council Mangrove Management Bill (Doc #
10609004). 2. Waikato Regional Council submission to the Thames-Coromandel District Council and Hauraki District
Council Mangrove Management Bill (Doc # 11630356).
21

File No: 22 12 05 Document No: 11630356 Enquiries to: Tracey May
13 February 2018 Secretariat Governance and Administration Select Committee Select Committee Services Parliament Buildings WELLINGTON 6160 Dear Sir/Madam Waikato Regional Council Submission to the Thames–Coromandel District Council and Hauraki District Council Mangrove Management Bill Thank you for the opportunity to make a submission on the “Thames–Coromandel District Council and
Hauraki District Council Mangrove Management Bill.” Attached is Waikato Regional Council’s
submission in regard to this document. This submission was formally endorsed by the Council’s
Strategy and Policy Committee under delegated authority on 13 February 2018.
Waikato Regional Council looks forward to being involved in further discussions regarding the
development of the Bill.
Should you have any queries regarding the content of this document please contact Tracey May,
Director Science and Strategy, on (07) 859 2748 or by email [email protected]
Regards Tracey May Director Science and Strategy
22

Submission from Waikato Regional Council on the Thames–Coromandel District Council and Hauraki District Council Mangrove Management Bill
Introduction and context 1.1 Waikato Regional Council (‘Council’) appreciates the opportunity to make a submission on the
Thames–Coromandel District Council and Hauraki District Council Mangrove Management Bill.
1.2 Mangroves are a native plant species and a valuable part of some coastal ecosystems in the Thames-Coromandel and Hauraki districts. Mangroves also perform an important role in trapping sediment and contaminants and in mitigating coastal erosion in some coastal areas.
1.3 Historically, changes in land uses surrounding harbours and estuaries where mangroves were present has resulted in increased sediment entering these areas, which in turn has created ideal conditions for mangroves to spread. Aerial photo records show that much of this expansion occurred from the 1940s to 1970s.
1.4 Other activities in the coastal marine area (CMA), such as dredging, reclamations, construction of marinas, causeways, roads, and urbanisation, has facilitated mangrove expansion through accelerated sedimentation and disruption to natural coastal processes which previously may have redistributed and removed sediment.
Concerns about mangroves 1.5 While there are divergent community views about the value of mangroves and approaches to
mangrove management, the spread of mangroves is causing concern to some people in some communities in the Thames-Coromandel and Hauraki districts. Particular concerns relate to mangroves altering the natural character, landscape and amenity values of an area.
1.6 Concerns are most prevalent in urbanised areas that border or overlook harbours and estuaries where mangroves are present, in particular where those longstanding residents have witnessed mangrove spread.
1.7 In addition to amenity values being reduced, mangrove spread may have adverse effects on public access, navigation and the ongoing use and function of coastal structures and infrastructure.
1.8 In response to the concerns noted above, Council acknowledges that some parts of some communities seek more permissive mangrove removal. Council’s statutory responsibilities around such decisions include considering the potential adverse effects of mangrove removal. These effects may vary depending on the location, scale and method of removal and values present and is not limited to:
a) disturbance and damage the foreshore and seabed b) adverse effects on water quality from the release of sediment and contaminants c) adverse effects ecological values, including bird species, particularly during breeding
and feeding d) adverse effects to wider ecosystem services provided by mangroves e) exacerbating coastal erosion where mangroves previously acted as a buffer or diffuser
of wave energy.
23

Council actions to manage mangroves 1.9 Mangrove removal currently requires resource consent under the Waikato Regional Coastal
Plan. The Regional Coastal Plan was developed in mid-1990’s when the then New Zealand Coastal Policy Statement (1994) specified that a coastal plan include provisions for mangrove management. The Resource Management Act 1991 (RMA), the New Zealand Coastal Policy Statement and the Waikato Regional Coastal Plan recognise the CMA is a public asset and mangrove management activities may be undertaken for public purposes.
1.10 Council has always sought to engage with its communities in regard to how mangroves may be managed and, through its harbour and catchment management activities, has focussed on the cause, that is to promote land use activities that lead to reducing sediment from entering the CMA.
1.11 From 2008–2012 Council worked closely with the Whangamata, Wharekawa and Tairua communities and Thames-Coromandel District Council (TCDC) to develop agreed resource consent applications on behalf of those communities. Council commissioned a significant knowledge base of technical and monitoring reports to inform the consent application and conditions.
1.12 Exercise of these consents by Council has been challenging and, while the agreed consent outcomes have been delivered, the level of amenity outcomes desired by some parts of the Whangamata community were not part of the agreed consent outcomes.
1.13 Consistent with the agreed consent conditions, removal of mangroves under these consents is staged, with monitoring trends and triggers needing to be met before removal of the next stage can commence. This robust and inclusive approach, including adaptive management responses, has ensured that potential adverse effects of removal have been for the most part avoided. Completion of the consented removal works is scheduled for April 2019.
1.14 In May 2016, the Chief Executives of Waikato Regional Council (WRC) and TCDC signed a Statement of Intent for collaborative mangroves management. This included reviewing, as a priority, the mangrove management provisions of the Waikato Regional Coastal Plan to better facilitate mangrove management.
1.15 In December 2016, WRC staff commenced a review of the mangrove management provisions of the Regional Coastal Plan in accordance with the Statement of Intent, as part of the wider Regional Coastal Plan Review. This work was well underway when, in March 2017, WRC became aware of the intention of TCDC to prepare a mangrove management bill as a means to facilitate permissive mangrove removal.
1.16 The Local Bill was introduced to the Parliament in early July 2017 and, as a consequence, WRC ‘paused’ the planned stakeholder and community engagement as part of the Regional Coastal Plan review so as to not distract the community from the Local Bill process with a parallel process, and to avoid potentially unnecessary investment while progress of the local bill continued.
1.17 If the Local Bill does not progress further Council will immediately recommence its Regional Coastal Plan review work on the mangroves topic including community engagement.
24

Council response to Local Bill 1.18 The Council retains statutory responsibility under the RMA relating to the CMA, and discharges
from land to the CMA. Mangroves are an integrated part of a wider ecosystem, and, without due consideration by the Select Committee, management of mangroves has the potential for consequential and possibly unintended effects within the CMA that might impact on, or conflict with, regional council functions.
1.19 Mangrove management should not therefore be undertaken in isolation and without due consideration of the localised context and possible consequences of both removal and retention. For this reason, the Council advocates for continued involvement in the preparation and implementation of a mangrove management plan, which is noted in our submission.
1.20 In regard to the Local Bill Council’s position is that: a. Council supports the district councils’ intent through the Local Bill to improve the efficiency
and effectiveness of mangrove management by the district councils.
b. We note that in the decision-making process to pursue this Local Bill the district councils have not identified or assessed other options for mangrove management or consulted with Waikato Regional Council as an affected party given its statutory responsibilities under the RMA.
c. Council holds a neutral position on retaining or removing mangroves. Council cannot form a ‘remove or retain’ position ahead of undertaking robust and inclusive consultation on the mangroves topic as part of Regional Coastal Plan review.
d. Council is strongly of the view that retention or removal of mangroves needs to be assessed on a case by case basis, having regard to the individual circumstances and values of each harbour and estuary as well as the localised community views.
e. Council is strongly of the view that any progression of Local Bill by the Select Committee must consider:
The full suite of values associated with mangroves when preparing and considering a mangrove management plan
that implementation of mangrove removal under the Local Bill has the potential for consequential and possibly unintended effects within the CMA that might impact on, or be in conflict with, regional functions to manage effects in the CMA
district council responsibilities for the full costs of mangrove management activities
district council responsibilities for management of any adverse effects and remediation that might result from mangrove removal activities, including costs
the composition of a mangrove management committee being a fair representation of community perspectives
the implications of activities or proposals sought under other legislation to be carried out in areas subject to the Local Bill.
1.21 Council’s submission proposes some amendments (Attachment 1) to improve the Bill in this
regard, particularly in respect of preparation and implementation of mangrove management plans proposed under the Bill.
1.22 The Council wishes to be heard before the Select Committee to present this submission.
25

1.23 Our contact details are: Waikato Regional Council Private Bag 3038 Waikato Mail Centre Hamilton 3240 (07) 859 0999 Attention: Tracey May, Director Science and Strategy
26

Attachment 1: Submission points on key elements proposed in the Bill
Clause Position Amendment sought Reasons
3 (a), (b) Amend to read: mangrove management activity— (a) means the protection, restoration, removal, prevention, monitoring, detection, control, destruction, or disposal of mangrove vegetation; and (b) includes— (i) hand removal of mangrove vegetation: (ii) mechanised removal of mangrove vegetation: (iii) whole tree removal: (iv) maintenance dredging
“Mangrove management activity” may also include actions to protect and restore mangrove vegetation where such actions demonstrably contribute value to coastal ecosystems. The term “whole tree removal” is not specific to mangroves and has the unintended consequence of providing for activities not related to mangrove management or the purposes of the Bill The term “maintenance dredging” is not specific to mangroves and has the unintended consequence of providing for activities not related to mangrove management or the purposes of the Bill. Or include specific reference to mangroves in the text.
4 (a), (b) Neutral Amend to read: The purposes of this Act are- (a) to facilitate the management removal of mangrove vegetation in the coastal area of each council to appropriate levels; and (b) to restore, protect and enhance the amenity values and/or ecosystems of the coastal area where mangroves exist from which mangrove vegetation is removed. (c) to facilitate the management of mangroves where they demonstrably contribute value to coastal ecosystems. (d) to facilitate the management of mangroves where they serve protect the coast from erosion caused by waves, tides and storms.
Mangroves “removal” predetermines an outcome, which might be “inappropriate” in some instances. The term “management” better provides for both removal and retention and aligns with the proposed amendment to Clause 3(a) above. The term “appropriate levels” is too uncertain for councils and the community. If ‘amenity’ or ‘ecology’ outcomes are to be used as rationale for ‘appropriate’ then the mangrove management plan should detail the demonstrable extent of those outcomes. The wording “amenity values and/or” ecosystems” sets up a competing tension between amenity and ecology. Considering only ecological and amenity values is too narrow and ignores other values associated with mangroves. The Bill should better consider how to recognise full suite of demonstrable values of retaining or removing mangroves.
27

Clause Position Amendment sought Reasons
5 (1) Support in part
(1) Each council shall may adopt prepare a draft mangrove management plan in relation to the coastal area of its district within 12 months. Add a timeframe for preparing a draft mangrove management plan (suggest within 12 months of the Bill’s enactment).
The term “may” retains some uncertainty, and may result in the Bill not being implemented and the default RMA process applying. Through this Local Bill WRC appreciates the urgency of the councils to commence planning for their mangrove management activities. Requiring that draft mangroves management plans be prepared within a statutory timeframe creates greater certainty for the councils, WRC and the community.
5 (2) (2) The purpose of the mangrove management plan is to enable the council to achieve and maintain appropriate levels of manage mangrove vegetation in its coastal area in accordance with the purposes of this Act.
The term “appropriate levels” is too uncertain for councils and the community. If ‘amenity’ or ‘ecology’ outcomes are to be used as rationale for ‘appropriate’ then the mangrove management plan should detail the demonstrable extent of those outcomes. The purpose of the mangrove management plan is specifically to achieve the purposes of the Local Bill.
5 (4)(a) (4) The mangrove management plan must— (a) identify and map the areas within the coastal area, by reference to maps, in which mangrove management activities are to be undertaken; and
Consistent with the purpose of the bill it is important that current and accurate maps are developed as part of mangrove management plans and that such maps identify locations where mangrove management activities are to be undertaken. The proposed rewording seeks that maps are prepared as part of preparing the mangrove management plan.
5 (4)(a) Insert new text after Clause (4)(a): (4)(b) identify and map the areas within the coastal area, in which mangroves are to be protected on the basis that they demonstrably contribute value to coastal ecosystems and where they serve protect the coast from erosion caused by waves, tides and storms..
Consistent with the purpose of the bill it is important that current and accurate maps are developed as part of mangrove management plans and that such maps identify locations where mangroves are to be retained, restored or protected where they support demonstrably significant ecosystem values or mitigate coastal hazards. Examples may include protecting habitat of ‘threatened’ or ‘at risk’ birds, or provide demonstrably wider ecosystem services and values.
28

Clause Position Amendment sought Reasons
5(4)(b) (b) state the objectives of the plan, including a description of the appropriate levels of mangrove management outcomes vegetation in the identified areas; and
The term “appropriate” is too uncertain for councils and the community. If ‘amenity’ or ‘ecology’ outcomes are to be used as rationale for ‘appropriate’ then the mangrove management plan should detail the demonstrable extent of those outcomes. The objectives of the mangrove management plan should be to deliver on described mangrove management outcomes. Through the current wording it also is not clear if (4)(b) is seeking to describe the extent of existing mangrove vegetation or the extent of mangrove vegetation following removal.
5 (4) Add a requirement that the mangrove management plan specify that disposal of removed mangrove vegetation must be outside of the CMA.
Removed mangrove vegetation left in the CMA risks smothering the foreshore and rotting on the intertidal flats, creating extensive anoxic areas which may damage the benthic communities and cause algal blooms and odour issues. Such issues would trigger RMA processes outside of the mangrove management plan and likely require WRC regulatory response.
5 (4)
Add a requirement that the mangrove management plan identify potential risks and specify methods to avoid, mitigate or remedy potential adverse effects of the mangroves removal process.
While removal of mangroves may be suitable in some circumstances, the mangrove management plan does not provide for the effects of removal. These might include (but not be limited to) disturbances to foreshore or seabed, disturbances to shell fish beds and bird habitat, use machinery in the CMA, accidental spills and discharges of contaminants, sediment mobilisation, and access to and from the CMA). Such detail should be a mandatory part of the mangrove management plan.
5 (4)(f) (f) describe the mechanisms the council intends to use to assess monitor, and report the effectiveness of the mangrove management activities in achieving the objectives of the plan
Monitoring and reporting is important to understand to what extent mangrove management activities have been effective in achieving mangrove management outcomes.
6 (2) Support in part
(2) Each council shall establish a committee of the council to prepare, adopt and implement the mangrove management plan. The Committee shall include at least one elected member from Waikato Regional Council, and the Waikato
WRC retains statutory functions for management of the effects of activities in the CMA, and has specific expertise around catchment management, policy and ecological systems, which would assist in the preparation and implementation of mangrove
29

Clause Position Amendment sought Reasons
Regional Council shall be consulted in preparing a mangrove management plan.
management plans. WRC needs to retain sufficient input into the preparation and implementation of mangrove management plans to ensure its catchment management and statutory CMA functions are not compromised, and that any expertise and information can be provided.
6(2) The composition of a mangrove management committee being a fair representation of community perspectives.
WRC recognises that having fair representation of community views around the decision making table will deliver more acceptable community outcomes than not.
6(6) (6) In preparing the final mangrove management plan, the council must have regard to consider the views expressed or received during the special consultative procedure, to the extent that those views are relevant to the purposes of this Act
The current wording ‘have regard to’ does not provide certainty that views will be considered by the committee. It is important that the committee process provide for written and verbal views to be received and documented.
7(1) (1) A mangrove management plan becomes operative when it is made publicly available endorsed by a decision the council.
Good governance process is that council plans are endorsed and adopted by a decision of council before being made operative.
8(2) That the Select Committee identify and consider the implications of activities or proposals sought under other legislation to be carried out in areas subject to the Local Bill.
WRC is aware of current Marine and Coastal Area (Takutai Moana) Act 2011 applications affecting the Firth of Thames. Several enactments, but in particular the RMA, require that if people are applying for resource consent, permit or approval in the common marine and coastal area, it is necessary to notify and seek the views of any group that has applied for recognition of customary marine title in the area. A similar requirement does not appear to apply to mangrove clearance under the Local Bill.
30

1028395-4
Thames-Coromandel District Council and Hauraki District Council Mangrove Management Bill
Local Bill
Explanatory note
General policy statement
The spread of mangroves in the coastal area of the districts of the two councils is increasingly becoming a concern for local communities.
Aerial photography from the 1940s shows minimal mangrove incursions into the districts' harbours and the Firth of Thames with white sandy beaches being the norm.
The lower Firth of Thames is an internationally significant tidal wetland protected by the Ramsar Convention and is an important wintering ground attracting thousands of Arctic nesting shorebirds such as the Bar-tailed Godwit and Lesser or Red Knot. The seaward advance of mangroves since the 1940s has considerably reduced the feeding habitat available to the birds.
Evident community concern about the impacts of mangroves dates from the early 2000s with, notably, the concerted effort since 2005 by the Whangamata community to address the spread of mangroves and restoration of harbour amenity.
To date, that process has consumed over a decade and in excess of $1,500,000.
Mechanisms allowing a transfer of authority under the Resource Management Act 1991 from regional to district councils do not adequately address the timing and resourcing concerns.
The district councils desire to see limited resources more effectively and efficiently utilised in the provision of core infrastructure and services, such as waste water treatment plants and catchment sediment management schemes to further protect estuarine environments.
31

2 Thames-Coromandel District Council and Hauraki District Council Explanatory Note
The process undertaken so far under the Resource Management Act 1991 has been costly, time-consuming and has not delivered outcomes.
A stream-lined, cost-effective, efficient and community-based process is required to ensure that the councils are mandated to implement a plan that reduces mangrove growth to acceptable levels to improve access, recreation, amenity and/or ecosystem values.
The bill empowers each council to prepare a draft mangrove management plan in relation to the coastal area of its district to achieve and maintain acceptable levels of mangrove vegetation in order to restore, protect or enhance the amenity values and/or ecosystems of the coastal area.
The draft plan is approved through the special consultative procedure under section 83 of the Local Government Act 2002.
The bill provides that the councils, if they agree, may prepare a mangrove management plan collaboratively, including by adopting a single integrated plan for both districts.
The bill empowers each council to implement an approved mangrove management plan.
Clause by clause analysis
Clause 1 is the title clause.
Clause 2 provides that the Act comes into force on the day after the date on which it receives the Royal Assent.
Clause 3 defines the terms used in the Bill. Most do not require explanation. The definition of coastal area (being the area in which a mangrove management plan may operate) is linked to the definition of coastal marine area in Section 2(1) of the Resource Management Act 1991. This definition in turn covers not only the foreshore and seabed but adjacent parts of rivers that flow into the sea.
Clause 4 sets out the purposes of the Act which are to remove mangrove vegetation from the coastal area and restore, protect and enhance amenity values and/or ecosystems of the coastal areas.
Clause 5 empowers each council to implement a mangrove management plan if it decides to do so. Any plan must achieve the purposes of the Act and must include the following:
a description of specific areas where mangrove management activities are to take place:
a description of the objectives of the plan, including a description of appropriate levels of mangrove vegetation; and
a description of methods to be used:
a statement of rules and restrictions applying to mangrove management activities:
32

3 Thames-Coromandel District Council and Hauraki District Council Explanatory Note
an identification of the amenity values and ecosystems to be restored or protected:
review mechanisms.
Clause 6 provides for the method by which a mangrove management plan of a council is to become operative. The process is to be overseen by a committee including at least one mana whenua representative. The committee prepares a first draft of the mangrove management plan which is then adopted through the special consultative procedure of the Local Government Act 2002. This includes public notification and the opportunity for interested persons to express their views, and have them considered. The clause also enables the two councils to prepare their plans collaboratively, including, if they agree, to prepare a single integrated plan.
Clause 7 empowers the councils to carry out mangrove management activities in accordance with the operative plan. In doing so, a council is not required to comply with any other enactment that would otherwise regulate or apply to mangrove management activities.
33

Thames-Coromandel District Council and Hauraki District Council
4
Scott Simpson
Thames-Coromandel District Council and Hauraki District Council Mangrove Management Bill
Local Bill
Contents Page
1 Title 5
2 Commencement 5
3 Interpretation 5
4 Purposes of Act 5
5 Purpose and content of mangrove management plan 6
6 Adoption and review of mangrove management plan 6
7 Powers of councils 7
34

Thames-Coromandel District Council and Hauraki District Council
5
The Parliament of New Zealand enacts as follows:
1 Title
This Act is the Thames-Coromandel District Council and Hauraki District Council Mangrove Management Act 2017.
2 Commencement
This Act comes into force on the day after the date on which it receives the Royal Assent.
3 Interpretation
In this Act, unless the context otherwise requires, -
council means-
(a) the Thames-Coromandel District Council; and
(b) the Hauraki District Council
coastal area means the coastal marine area within the district of each council, other than land in private ownership
coastal marine area has the meaning given in section 2(1) of the Resource Management Act 1991
mangrove management activity –
(a) means the removal, prevention, monitoring, detection, control, destruction or disposal of mangrove vegetation; and
(b) includes the following:
(i) hand removal of mangrove vegetation:
(ii) mechanised removal of mangrove vegetation:
(iii) whole tree removal:
(iv) maintenance dredging
mangrove management plan means the plan that has become operative under section 6(9)
mangrove vegetation means any seed, seedling, plant or remains of mangrove plants that exists in the coastal area
4 Purposes of Act
The purposes of this Act are –
35

Thames-Coromandel District Council and Hauraki District Council
6
(1) to facilitate the removal of mangrove vegetation in the coastal area of each council to appropriate levels; and
(2) to restore, protect and enhance the amenity values and/or ecosystems of the coastal area from which mangrove vegetation is removed.
5 Purpose and content of mangrove management plan
(1) Each council may adopt a mangrove management plan in relation to the coastal area of its district.
(2) The purpose of the mangrove management plan is to achieve and maintain appropriate levels of mangrove vegetation in the coastal area of the council district in accordance with the purpose of this Act.
(3) The mangrove management plan must achieve the purposes of this Act.
(4) The mangrove management plan –
(a) must include each of the following:
(i) the identification of areas within the coastal area, by reference to maps, in which mangrove management activities are to take place:
(ii) a statement of the objectives of the plan, including a description of appropriate levels of mangrove vegetation in the identified areas:
(iii) a description of the methods to be used in achieving the objectives of the plan:
(iv) a statement of rules and restrictions applying to the undertaking of mangrove management activities:
(v) an identification of the amenity values and/or ecosystems of the identified areas for the purposes of section 4(2):
(vi) a description of mechanisms the council intends to use to assess the effectiveness of the mangrove management activities in achieving the objective of the plan; and
(b) may include any other matter the council considers desirable or necessary to give effect to the purposes of this Act.
6 Adoption and review of mangrove management plan
(1) This section applies if a council decides to adopt a mangrove management plan in relation to the coastal area of its district.
(2) Each council shall establish a committee of the council to prepare, adopt and implement the mangrove management plan.
(3) The committee must include at least one iwi representative.
36

Thames-Coromandel District Council and Hauraki District Council
7
(4) The committee must prepare a first draft of the mangrove management plan.
(5) The council must use the special consultative procedure under section 83 of the Local Government Act 2002 in adopting the mangrove management plan, as if references in that section to “a statement of proposal” were references to the draft mangrove management plan.
(6) The council must commence the special consultative procedure within 6 months of completion of the draft of the mangrove management plan by the committee.
(7) Within 3 months of completion of the special consultative procedure, the council must prepare the final mangrove management plan and make it publicly available in the same manner it made the draft mangrove management plan publicly available as part of the special consultative procedure.
(8) The council must have regard to the views expressed during the special consultative procedure in preparing the final mangrove management plan, to the extent the views are relevant to the purposes of this Act.
(9) The mangrove management plan becomes operative on the day it is made publicly available.
(10) Each council may review its mangrove management plan at any time by conducting the process set out in sections 6 (1) to (9).
(11) The councils may prepare, adopt and review mangrove management plans collaboratively.
(12) Without limitation, the councils may:
(a) prepare a single integrated mangrove management plan covering both districts; and
(b) establish a joint committee under clauses 30 and 30A of schedule 7 of the Local Government act 2002 to prepare the integrated management plan; and
(c) adopt a joint special consultative procedure covering both districts.
7 Powers of the councils
(1) Each council has the power to carry out, and to contract for the carrying out of, mangrove management activities in accordance with the mangrove management plan.
(2) In exercising the powers conferred by section 7(1), a council is not required to comply with any other enactment that would otherwise regulate or apply to mangrove management activities.
37
Thames-Coromandel District Council and Hauraki District Council
8
(3) Each council must comply with the rules and reporting requirements in the mangrove management plan.
38

Report to Strategy and Policy Committee
Date: 05 February 2018
Author: Tracey May, Director Science and Strategy
Authoriser: Vaughan Payne, Chief Executive
Subject: Update of National Policy Statement on Freshwater Management amendments, Swimmability targets
Section: A (Committee has delegated authority to make decision)
Purpose 1. To provide the Committee with an update on the swimmability targets work being progressed by
the Ministry for the Environment, Ministry of Primary Industries and the regional sector.
Staff recommendations: 1. That the report ‘Update of National Policy Statement on Freshwater Management amendments,
Swimmability targets’ (Doc # 11793867 dated 05 February 2018) be received for information. 2. That the Committee note that the National Policy Statement for Freshwater Management requires
Council to publish final swimmability targets by 31 December 2018, and that the engagement process to determine the swimmability targets will be presented to the Committee at a future meeting for comment.
Executive summary In 2017 the then government progressed a number of changes to the National Policy Statement
for Freshwater Management (NPSFM), these included a focus on E.coli as a human health measure relating to water quality for swimming.
The NPSFM was also amended to include an overarching goal that 90% of the country’s large rivers and lakes (including hydro lakes) should be swimmable by 2040, and that regional councils to generate a report on contributions to achieve regional targets every five years.
In the Waikato, 49 per cent of rivers and lakes currently meet the proposed definition of swimmable.
Although the regional sector has expressed significant concern at the myopic approach taken to swimmability (the focus on only E.coli), it has been working with the Ministry for the Environment and the Ministry of Primary Industries on a project to identify present status and to document what initiatives are presently being progressed that work toward the national target.
The inter-agency project looks at how far existing initiatives have taken regions, how far planned initiatives will go to addressing the target, and what is the gap in relation to achieving the target.
There is some way to go for the Waikato region’s rivers to achieve the 90% target set by the NPSFM. There are some region’s that have already achieved the 90% target for rivers. Yet to occur are the conversations between regions to determine how the national target could be collectively achieved.
The first output of the inter-agency project will be the ‘Progress on swimmability report’ anticipated for release in March.
39

Regional councils are presently seeking direction from the Ministries on how to meet their individual and collective requirements in accordance with the NPSFM, and how best to use the report to inform the draft targets that region’s must determine by the end of March 2018.
Background 2. Throughout 2017 the Committee was kept informed of many water related initiatives that are
occurring at local, regional and national levels. The new government has signalled an ongoing commitment to better achieve freshwater management, in particular an improvement in water quality.
3. It has been acknowledged through 2018-2028 Long Term Plan conversations that the ongoing
changes to the National Policy Statement Freshwater Management (NPSFM) will influence the future management of water, in particular responsibilities and costs going forward. This report provides an update in regard to the recent increase in focus on the human health measure relating to water quality for swimming, E.coli, more widely referred to as ‘swimmability’.
4. Swimmability targets refers to a key amendment made to the NPSFM in 2017 through the
inclusion of an overarching goal that 90% of the country’s large rivers and lakes (including hydro lakes) should be swimmable by 2040. A reminder, that in achieving the targets the following matters require note:
80% of rivers and lakes are safe to swim in by 2030 and 90 % of rivers and lakes are safe to swim in no later than 2040 (swimmability targets)
the percentage of rivers and lakes which are fair, good and excellent increase over time (quality targets)
Regional councils to generate a report on contributions to achieve regional targets every five years.
5. The intent of the national target, supported by the now strengthened policy in the NPSFM, is that
all regional councils will publish targets for their regions which, collectively, will achieve the national target set. Draft swimmability targets are to be set by 31 March 2018, with final targets to be set by 31 December 2018.
6. According to the maps published by the Ministry for the Environment, 72 per cent by length of all
New Zealand rivers and lakes currently meet the proposed definition of swimmable, remembering that this is only in relation to E.coli as a measure of public health and does not refer to nutrients, sediment, or the presence of heavy metals. In the Waikato, 49 per cent of rivers and lakes currently meet the proposed definition of swimmable.
Inter-agency approach 7. Although the regional sector has expressed significant concern at the myopic approach taken to
swimmability (the focus on only E.coli), it has been working with the Ministry for the Environment and the Ministry of Primary Industries on a project to identify present status and to document what initiatives are presently being progressed that work toward the national target. The objectives of the cross agency group were to:
Determine work already underway within each region which would improve swimmability as it related to E.coli (Existing initiatives)
Model the impact of this work and other national commitments to determine the impact that this would have in achieving the target, an attempt to determine how far planned work will take us toward the target (Planned initiatives)
40

Identify the gap between work underway and additional work required to achieve the national target, providing an indication of ‘how big the job is’ for us collectively (Target to be achieved – investment gap)
Develop a process for addressing the gaps, including identifying additional information that may be required.
8. The graph below indicates the challenge ahead for the Waikato region’s rivers, noting that this is
if each region individually were to achieve the 90% target set by the NPSFM. There are some region’s that have already achieved the 90% target for rivers. Yet to occur are the conversations between regions to determine how the national target could be collectively achieved.
Next steps 9. It is intended that the first output of the inter-agency project will be the ‘Progress on swimmability
report’ anticipated for release in March. A number of pre-determined reporting deadlines have been missed as a result of the national election and the forming of the coalition government. Regional councils are presently seeking direction from the Ministries on how to meet their individual and collective requirements in accordance with the NPSFM, and how best to use the report to inform the draft targets that need to be determined by the end of March 2018.
10. From the Waikato region’s perspective we have advocated strongly for recognition of community
engagement expectations, and also for co-governance responsibilities, that need to occur before the regional council determines draft or final targets in relation to any aspect of water quality. This recognises not only the importance of water to our residents, but also to the potential costs of compliance with measures to achieve national targets. It is anticipated that as a result of the larger proportion of the region’s land use used for dairy farming it is likely that considerable investment will be required to achieve the national target for swimmable waters as it relates to E.coli.
Conclusion 11. As previously stated in reports to the Committee, and in reports that have informed LTP
discussions, implementation of central government direction at a regional and local level presents
0
10
20
30
40
50
60
70
80
90
100
Category 1
Target to be achieved (investment gap)
Planned initiatives
Existing initiatives
41
a number of challenges, these challenges are being compounded by continual amendments requiring rework and refocus.
12. Whilst the direction in regard to water management is being set at a national level implementation
is more and more being passed on to regional and local levels to deliver, with costs of implementation and compliance borne by our ratepayers.
13. Staff will keep members abreast of developments in regard to implementation of the NPSFM.
Once the report is publically available in March a further report will be placed before the Committee outlining a work programme to work toward the targets stated in the NPSFM.
42
Report to Strategy and Policy Committee
Date: 25 January 2018
Author: Bill McMaster, Team Leader Transport and infrastructure
Authoriser: Tracey May, Director Science and Strategy
Subject: Regional Transport Planning Update
Section: A (Committee has delegated authority to make decision)
Purpose 1. To provide the Strategy and Policy Committee with a report highlighting current regional land
transport planning issues.
Executive Summary 2. This is a busy time for regional transport planning activity, with reviews of the 2015 Regional Land
Transport Plan and 2015 Regional Public Transport Plan continuing, and implementation of the 2017 Regional Road Safety Strategy and 2017 Regional Cycling Programme Business Case actions. Staff are also project managing the Hamilton to Auckland Transport Connections Strategic Business Case project.
3. This report provides the Strategy and Policy Committee with an update on regional transport planning activities and looks ahead to key matters going forward.
Staff Recommendation: That the report “Regional Transport Planning Update” (Doc # 11701489 dated 25 January 2018) be received for information.
Background 4. The new Minister of Transport, Hon Phil Twyford has signalled the following Government priorities
for transport:
Giving public transport greater priority in cities and expanding the public transport system to support new housing and interregional commuting
Increasing the use of rail to enable efficient passenger and freight use
Supporting regional development
Increasing support for active modes – walking and cycling
Delivering health, safety and environmental improvements
Reducing the environmental impacts of transport
Mode neutrality in freight transport planning.
5. Given this significant change in focus from the previous government, the release of the new Government Policy Statement on Land Transport, which our regional transport planning activities must align to, has been delayed until late February/early March 2018. This delay has caused the shift in timeframes for our regional transport plans by two-three months. Progress nonetheless continues as Councils are moving through their long term planning processes.
43

2018 Update of 2015 Waikato Regional Land Transport Plan 6. The 2015 Waikato Regional Land Transport Plan (RLTP) is currently under review by the Regional
Transport Committee (RTC). Throughout 2017 the RLTP project team have been working with the RTC to update the strategic policy framework of the plan and the supporting programme of regional transport activities. A business case approach has been followed, the outcomes of which provide the updated framework for the strategic policy part of the RLTP. The RTC have been instrumental in providing direction on policy issues and there is strong region-wide support from the committee members for the policies contained in the plan.
7. Resulting from the change in central government following the September 2017 general election,
the Ministry of Transport has been working with the new Minister of Transport to develop a new Government Policy Statement on Land Transport (GPS). This GPS will confirm the national direction sought for transport investment and confirm the focus for the government in how money from that National Land Transport Fund (NLTF) will be invested in transport activities. The Minister issued advice to local authorities via a letter of intent to CEs on 20 November 2017 indicating a revised GPS would be available for engagement in early 2018.
8. The CE of the NZ Transport Agency released additional advice on 23 November 2017 confirming
that the development timeframes for delivery of RLTPs had been extended from 30 April to 30 June 2018 to take into account the availability of a revised GPS in early 2018.
9. Based on this information from the Minister and NZTA, RLTP project staff prepared an alternative
development timeline to allow additional time to incorporate advice from a revised GPS into the draft RLTP for consultation. The RTC resolved at their meeting on 4 December 2017 to accept the revised timeline and delay public consultation until March 2018. This was intended to allow additional time for any changes signalled in the GPS to be incorporated into the draft RLTP.
10. Subsequent advice received from the MoT on 31 January 2018 confirmed that development of a
revised GPS would not be available in February and that we would now be looking at a March release. The impact of the revised GPS being delayed until an unspecified time in March will mean there is insufficient time for WRC staff to amend the draft RLTP and reflect any changes signalled in the GPS.
11. In the absence of new guidance from an amended GPS, it is proposed to take the draft RLTP as it
currently stands to the RTC for adoption on 5 March to allow public notification on 9 March. The timelines for the RLTP development have been assessed in conjunction with staff from Democracy Services, and in order to meet our special consultative procedure guidelines, and the constraints of operating concurrently with LTP consultation, there is no opportunity to delay our amended timeline.
12. It is proposed that any new guidance that a draft GPS may provide that could impact on policies
contained in the draft RLTP are handled by way of WRC staff submission to the draft RLTP. 13. This approach has been taken by several regions from around the country. A number of regions
chose not to amend their original timelines and continued with a December-January consultation period, with the intention to reflect any changes arising from a new GPS to be handled by way of staff submission. Regions that have taken this approach include Otago-Southland, Northland, Horizons and Bay of Plenty. Different regions have approached their hearings and deliberations processes differently, including continuing business-as-usual and delaying deliberations until after the GPS is available.
14. WRC RLTP development staff consider that the draft update to the RLTP as it currently stands, is
well aligned with the Minister of Transport’s priorities as outlined in his Letter of Intent (detailed
44

in paragraph 4. above). We are not therefore, expecting significant changes to our plan if these priorities are confirmed.
15. However, there are some current policy issues that may require an increased focus in the draft
RLTP, particularly support for a passenger rail service between Hamilton and Auckland.
16. WRC RLTP development staff will undertake an additional review of the draft RLTP as it currently stands to ensure that the policies it contains are in keeping with the early signals received from the Minister in the Letter of Intent. Whilst an initial review of the plan indicates that there is good alignment in the plan as mentioned above, recent events with regards to Auckland Transport's Board rejecting their RLTP, will require a secondary assessment of our own plan to ensure we have responded adequately to any early signals in the absence of a revised GPS. Part of our response is to include a provisional activity related to Passenger Rail between Hamilton and Auckland in the event that funding for the service is confirmed.
17. Under the revised development timeline the draft RLTP will be taken to the RTC on 5 March 2018
for endorsement with public notification on 9 March 2018. Consultation will be held open until 9 April 2018 with hearings in late April and deliberations in May. The final RLTP will be taken to RTC for endorsement on 11 June 2018 and adoption by Council on 28 June 2018. This will then be submitted to NZTA for inclusion in the National Land Transport Programme in advance of the 30 June 2018 deadline.
2018 review of the 2015 Waikato Regional Public Transport Plan 18. Public transport is a key component of the regional land transport system and WRC has a statutory
responsibility for the planning and management of the public transport network in the region. The 2015 Waikato Regional Public Transport Plan (RPTP) is currently under review under the guidance of the Regional Public Transport Plan Development Subcommittee with an aim to adopt a new plan by September 2018. The new RPTP will guide the planning and development of the regional public transport system over the next 10 years (2018-2028).
19. The operative RPTP is progressing with its review, following the NZTA Business Case Approach (BCA). The key problems and benefits for public transport in the region have been identified and endorsed by the Subcommittee, and work is now progressing on the strategic responses to the identified problems. These responses will then be translated into strategy and policy for the drafting of the new RPTP.
20. A strategic case is being prepared by staff which provides further context and evidence relating to the problems, benefits and strategic responses identified. It is expected that the strategic case will be finalised following the confirmation of the strategic responses at the Subcommittee’s 19 February meeting.
Next steps 21. A third workshop has been planned with the RPTP Development Subcommittee and stakeholders
on 19 February to discuss how the strategic responses identified can be translated into strategy and policy in the RPTP.
22. It is expected that the draft RPTP will be approved for consultation by the Strategy and Policy Committee by May 2018, with consultation from late May to late June, and the final RPTP approved by September 2018.
Hamilton to Auckland Transport Connections Working group 23. The Waikato and Auckland regions are experiencing high population growth and this is expected
to continue more rapidly than predicted due to faster than expected housing demand in both
45
regions. The majority of this growth has occurred in the past five years in Auckland, Hamilton and key growth centres along State Highway 1/Waikato Expressway such as Pokeno and Tuakau.
24. This strong growth is expected to continue due to pending approved special housing areas, district
plan changes and a number of private plan changes that are being proposed by developers. This increasing growth is likely to place significant pressure on transport corridors between Hamilton and Auckland, and in particular the Waikato Expressway which is a nationally significant transport corridor that provides strategic transport connections for the Upper North Island.
25. In recognition of this growth the Waikato Regional Transport Committee (RTC) at its meeting on 4
September 2017, agreed to undertake a Strategic Business Case (SBC) to investigate transport connections between Hamilton and Auckland. The purpose of the SBC is for the key transport partners to identify and agree on the key problems or opportunities with respect to transport connections between Hamilton and Auckland, and to identify a preferred approach or response (with clear evidence) for addressing the problems.
26. An Auckland and Hamilton Transport Connections Working Party (the Working Party) has been
established by the RTC to develop a SBC by April/May this year. The Working Party includes representatives from Waikato Regional Council, Hamilton City Council, Waikato District Council, Auckland Council, Auckland Transport, KiwiRail and the NZ Transport Agency. Representatives from Treasury and the Ministry of Transport are also in attendance at the Working Party meetings.
27. The first meeting of the Working Party was held on 22 November where the process and timetable
for undertaking the SBC was confirmed. It was also agreed that the costs of undertaking the SBC were to be split three ways between WRC, WDC and HCC. It was also agreed to undertake a Customer Demand Survey which was to be jointly funded by WRC and HCC.
28. A contract for the Customer Demand Survey has been let and the survey and business interviews
are taking place in late January/ early February with a report back on the findings to be presented to the Working Party at their next meeting on 9 February.
29. The second meeting of the Working Party was held in Pukekohe on 19 December at 1pm. This was
the first SBC Investment Logic Mapping (ILM) workshop and identified the problems and benefits associated with the connections between Hamilton and Auckland.
30. The next meeting of the Working Party is planned to be held on 9 February where the next stages
of the SBC ILM will be undertaken and this will involve reviewing and confirming the problems and benefits leading on to the identification of the strategic response options going forward. The meeting will also be presented with the outcomes of the Customer Demand Survey.
31. A final meeting of the Working Party will be held on 2 March 2018 where the final SBC will be
received and endorsed before the findings are reported back to the partner organisations.
32. The SBC would also allow the consideration of a wide range of options and integration of modes to improve transport connections between Hamilton and Auckland, and will form the basis for decision-making on future inter-regional transport priorities and investment.
33. In parallel to the SBC, staff are continuing to work with the partner organisations on undertaking
further assessment of an interim Hamilton to Auckland passenger rail service.
Regional Road Safety 34. The Waikato Regional Road Safety Strategy 2017-21 (RRSS) was approved by the Regional
Transport Committee (RTC) on 3 July 2017 and adopted by the WRC on 27 July 2017.
46

35. Under the national guidance of the Safer Journeys Strategy and the regional guidance of the RRSS, road safety partners are working collaboratively to reduce deaths and serious injuries on the region’s roads.
36. The multi-party Regional Road Safety Forum continues to work together to strengthen partnerships and deliver better outcomes for the region. The Forum represents a diverse range of stakeholders and there has been very positive feedback on the value of the Forum as we go forward. A recent focus has been on vulnerable road users, accessibility and a joint submission to the NZTA consultation on raising the speed limit to 110km on the Waikato Expressway.
37. The Forum last met on 15 November 2017 and had a well-supported meeting with a focus on
potential road safety implications from the new coalition government policies and vulnerable road users and planning tools for infrastructure.
38. Road safety continues to be a high priority for the RTC and staff continue to provide regular
reporting and monitoring of regional trends and measures.
Regional Speed Management Project 39. Speed management is a key focus for the RTC and the RRS Forum. Over the past two years the
RTC has prepared a Regional Speed Management Programme Business Case and the region has been the pilot for the national rollout of the NZ Speed Management Guide.
40. The RTC has now delegated the oversight of speed management to the RRS Forum and the regional
Speed Management Working Group has continued its work in this area. The Working Group has identified the importance of continuing to work closely with the Regional Advisory Group (RAG) and individual road controlling authorities to advocate for the development of speed management plans and the implementation of the new speed management tools now made available. It is important that the region continues to work closely together to ensure a regionally consistent approach for speed management.
41. The current focus is on promoting territorial authorities to prepare speed management plans and providing regional advice and support on speed management activities. The Regional Speed Management working group met on 30 November and discussed its plan of activities for 2018.
42. On 13 December 2017 the Associate Minister of Transport, Hon Julie Anne Genter wrote to
councils seeking support to work in partnership with her to take action to improve road safety in New Zealand. In particular the Minster sought a focus on high-risk roads in regions and asked regions to accelerate the implementation of the new speed management approach to ensure there are safe and appropriate speeds on local roads. The Associate Minister has asked the NZ Transport Agency to partner with local government on these matters and address any barriers councils face in progressing road safety outcomes that are within its control, including considering its funding arrangements. The Minister has also directed officials from the Ministry of Transport to look across the road safety system and ensure that the appropriate funding, policy and regulatory settings are in place to implement changes to improve road safety as quickly as possible.
43. The Associate Minister is arranging a national road safety summit to discuss how Central and local
government can work more closely together to improve road safety outcomes in New Zealand. It is expected that the Summit will be in March 2018.
44. The Regional Speed Management Working Group is meeting on 15 February to scope out ways to
accelerate the regional speed management work including a project plan for developing the regional speed management plan.
47
Regional Cycling Collaboration 45. Following completion of the Regional Cycling Programme Business Case (PBC) in 2017, regional
cycling implementation continues with forward planning and Long Term Plan (LTP) 2018-21 funding proposals to support an increase in cycling infrastructure, cycle skills delivery, and communications. Following completion of a business case approach, the New Zealand Transport Agency is seeking a variation to the operative Regional Land Transport Plan to bring forward funding for Stage 1 of the Hamilton-Cambridge cycling connection (from Cambridge to SH 21). This variation will be going to the Regional Transport Committee meeting on 5 March for approval.
Regional Cycle Trails 46. Regional cycle trails have been recognised as a valuable and important cycling and economic
development opportunity for the region by the RTC, the Waikato Mayoral Forum (through the Waikato Plan), and Waikato Means Business (WMB). Cycle trails support the WRC strategic priorities and outcomes by supporting a healthy environment, strong economy and vibrant communities.
47. Cycle Trail stakeholders continue to work together to realise the identified regional priorities,
share expertise, provide consistent quality offerings and aim to leverage Government funding. Securing local share continues to be one of the most significant barriers to leveraging full value from the trails and this will continue to be a focus for WRC and Network members. The regional cycle trails network however has secured funding support for business case and business planning from Waikato Means Business and from the Ministry of Business, Innovation and Employment (MBIE). Term of reference for the business cases has started to be prepared.
Access Hamilton 48. Over the past year Hamilton City Council has been reviewing Access Hamilton, its integrated
transport strategy. WRC has been actively involved in this review and has had representation on the technical working group and on the elected member Task Force.
49. The strategic direction from Access Hamilton will guide council’s public transport work programme
by setting public transport mode share targets for Hamilton City. Access Hamilton was endorsed by Hamilton City Council in November 2017 and was presented to Waikato Regional Council in late 2017.
50. Further discussion on Access Hamilton outcomes and implications for WRC funding will be
addressed through Council’s Long Term Plan workshops and deliberations.
51. A key action arising from Access Hamilton is the development of a Mass Transit Plan. Waikato Regional Council staff are working alongside Hamilton City Council staff to scope out the Mass Transit Plan.
Conclusion 52. This report provides the Strategy and Policy Committee with an update on the key land transport
projects currently being undertaken.
Assessment of Significance 53. To the best of the writer’s knowledge, this decision is not significantly inconsistent with nor is
anticipated to have consequences that will be significantly inconsistent with any policy adopted by this local authority or any plan required by the Local Government Act 2002 or any other enactment.
48
Policy Considerations 54. To the best of the writer’s knowledge, this decision is not significantly inconsistent with nor is
anticipated to have consequences that will be significantly inconsistent with any policy adopted by this local authority or any plan required by the Local Government Act 2002 or any other enactment.
49

Report to Strategy and Policy Committee
Date: 25 January 2018
Author: Vincent Kuo, Senior Policy Advisor
Authoriser: Mike Garrett, Chief Financial Officer
Subject: Proposed amendment to the Regional Public Transport Plan Fare Policy
Section: B (For recommendation to Council)
Purpose 1. The purpose of this report is to seek the Strategy and Policy Committee endorsement and
recommendation to Council on the proposed fare policy amendment in the operative Regional Public Transport Plan 2015-25.
Executive Summary 2. A review of the Waikato fare structure has been undertaken in accordance with agreed actions in the
operative Regional Public Transport Plan 2015-25 (RPTP) adopted by Council in 2015.
3. The fare review project found that the existing fare system within the Waikato is complex, making it difficult to administer and difficult for users to understand. The complexity is largely driven by each component of the network having a separate pricing structure and differing business rules, which have evolved over time.
4. Informed by the project objectives, detailed technical analysis, along with engagement with key
stakeholders, a suite of recommended changes to the fare system have been proposed and endorsed by the RPTP Development Subcommittee (1 September 2017) and the Finance Committee (19 September 2017). The recommended fare review changes were approved by Council at its meeting in September 2017.
5. The RPTP Development Subcommittee at its meeting on 8 December 2017 also endorsed the proposed
amendments to the operative RPTP to give effect to the approved fare review changes. The proposed amendments will mainly involve changes to the fares and ticketing policies in the RPTP to allow the implementation of a new zonal fare structure and introduction of new ticketing products and business rules.
6. This report therefore seeks Strategy and Policy Committee endorsement of the proposed RPTP policy
changes as recommended by the RPTP Development Subcommittee, and to recommend that Council amend the current RPTP to incorporate the fare policy changes in advance of implementing the new ticketing system in 2018.
50
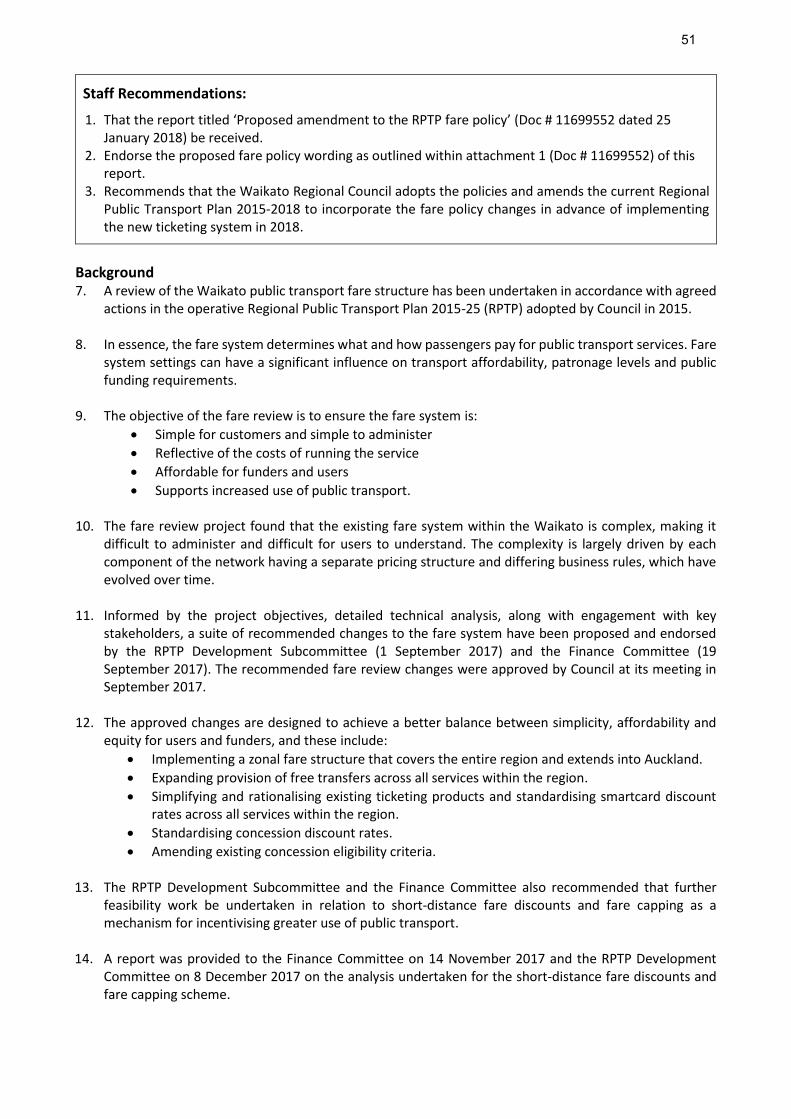
Staff Recommendations:
1. That the report titled ‘Proposed amendment to the RPTP fare policy’ (Doc # 11699552 dated 25 January 2018) be received.
2. Endorse the proposed fare policy wording as outlined within attachment 1 (Doc # 11699552) of this report.
3. Recommends that the Waikato Regional Council adopts the policies and amends the current Regional Public Transport Plan 2015-2018 to incorporate the fare policy changes in advance of implementing the new ticketing system in 2018.
Background 7. A review of the Waikato public transport fare structure has been undertaken in accordance with agreed
actions in the operative Regional Public Transport Plan 2015-25 (RPTP) adopted by Council in 2015.
8. In essence, the fare system determines what and how passengers pay for public transport services. Fare system settings can have a significant influence on transport affordability, patronage levels and public funding requirements.
9. The objective of the fare review is to ensure the fare system is:
Simple for customers and simple to administer
Reflective of the costs of running the service
Affordable for funders and users
Supports increased use of public transport. 10. The fare review project found that the existing fare system within the Waikato is complex, making it
difficult to administer and difficult for users to understand. The complexity is largely driven by each component of the network having a separate pricing structure and differing business rules, which have evolved over time.
11. Informed by the project objectives, detailed technical analysis, along with engagement with key stakeholders, a suite of recommended changes to the fare system have been proposed and endorsed by the RPTP Development Subcommittee (1 September 2017) and the Finance Committee (19 September 2017). The recommended fare review changes were approved by Council at its meeting in September 2017.
12. The approved changes are designed to achieve a better balance between simplicity, affordability and
equity for users and funders, and these include:
Implementing a zonal fare structure that covers the entire region and extends into Auckland.
Expanding provision of free transfers across all services within the region.
Simplifying and rationalising existing ticketing products and standardising smartcard discount rates across all services within the region.
Standardising concession discount rates.
Amending existing concession eligibility criteria. 13. The RPTP Development Subcommittee and the Finance Committee also recommended that further
feasibility work be undertaken in relation to short-distance fare discounts and fare capping as a mechanism for incentivising greater use of public transport.
14. A report was provided to the Finance Committee on 14 November 2017 and the RPTP Development Committee on 8 December 2017 on the analysis undertaken for the short-distance fare discounts and fare capping scheme.
51

15. The report found that the implementation of fare capping is feasible and would help incentivise greater use of public transport and reward those that are already frequent users. However the introduction of short-distance fares will not be viable to be implemented as part of the new ticketing system implementation in June 2018 due to the cost and complexity involved in enabling the functionality within the new system. The functionality could potentially be introduced at a later date.
16. The Finance Committee considered the potential risks and benefits associated with fare capping at the
November meeting and agreed in principal to endorse the proposal to introduce a fare capping scheme as part of the fare review proposals, subject to final approval of the fare capping thresholds. This decision is also supported by the RPTP Development Committee at their meeting in December 2017.
17. The fare review changes approved by Council in September 2017, together with the fare capping scheme
will form the overall package of fare review proposals that are set to be introduced as part of the new ticketing system in June 2018.
Proposed RPTP Fare Policy Amendment 18. It is important that the existing RPTP is amended to formalise the policy framework for the new fare
structure and ticketing system in order to support the implementation of the fare review proposals as part of the new ticketing system roll out in 2018. This will mainly involve amendments to the fares and ticketing policies and actions in sections 6.3.1 and 6.3.2 of the existing RPTP.
19. Under Section 6.3.1 ‘fare structure and ticketing’, the current fare structure is confirmed through Policy 17 that supports the retention of a flat fare structure for the Hamilton urban network and a graduated fare structure for services outside of Hamilton. Section 6.3.2 provides further details in relation to existing fare products and concessions, including 1-hour free transfer within the Hamilton urban network, City Explorer and 60 plus concession fare, which are subject to change based on the fare review proposals.
20. A new RPTP policy section for fares and ticketing has been prepared and endorsed by the RPTP
Subcommittee at its meeting on 8 December 2017. The new policy section is included in Attachment 1 for Committee consideration, and it includes:
A commentary section that provides the background to the new fare and ticketing policies and how the new fare system will work
A new fare zone map with proposed zone boundaries
A set of new policies and actions to reflect the new fare structure and changes to ticketing products and business rules as approved by Council.
21. It is expected that the new policy section, once endorsed by the Strategy and Policy Committee and
approved by Council, will replace sections 6.3.1 and 6.3.2 of the existing RPTP via a variation process. The new policy section adopted by Council will also be anchored into the new RPTP which is currently under review.
Legislative context 22. Under the Land Transport Management Act 2003, the RPTP can be varied at any time subject to the
‘significance policy’ set out in the plan.
Assessment of Significance 23. Staff have undertaken an assessment of the effects of the fare review proposals to determine the
significance of variation to the plan and the likely consultation requirements. A detailed assessment of significance is included within Attachment 2.
52

24. Overall, the proposed fare review changes are intended to deliver a better balance between simplicity, affordability and equity for users and funders, and are expected to have an overall neutral outcome in relation to fare revenue received and public subsidy required from funders.
25. Whilst the proposed changes would result in a degree of change for some existing users, a significant
amount of effort has gone into identifying a universal fare structure and complementary ticketing products that minimise potential adverse impacts for users and funders.
26. It is expected that the proposed fare structure would be of benefit to the vast majority of existing users.
However, a small proportion (1.3%) of existing users would be subject to relatively large fare increases. These increases will be partially offset by other benefits associated with transitioning to the proposed zonal structure, such as free transfers across all services and fare capping.
27. In assessing the impacts of proposed changes against the significance policy of the RPTP, staff considered
that the proposed variation is not significant. It is also proposed that where specific communities may be affected by fare increases, targeted communication will be undertaken to emphasis other mitigating factors/benefits that will be realised from the fare changes (i.e. free transfer across the whole network and fare capping scheme).
Policy Considerations 28. To the best of the writer’s knowledge, this decision is not significantly inconsistent with nor is anticipated
to have consequences that will be significantly inconsistent with any policy adopted by this local authority or any plan required by the Local Government Act 2002 or the Land Transport Management Act 2003.
Conclusion 29. The new integrated ticking system will be implemented in the Waikato region by July 2018, and there is
an opportunity to integrate changes to the region’s fare system with the implementation of the new ticketing system.
30. Council has already approved the fare review proposals in September 2017. However for the fare review
proposals to be implemented, this will require the existing RPTP to be amended to formalise the policy framework for the new fare structure and ticketing system.
31. This report therefore seeks Committee endorsement of the proposed RPTP policy changes as outlined
in attachment 1 of this report, and to recommend to Council that amendment of the current RPTP be undertaken to incorporate the fare policy changes in advance of implementing the new ticketing system.
Attachments 1. Proposed revised RPTP fares and ticketing section 2. Fare review proposals – RPTP significance policy assessment.
53

Attachment 1: Proposed replacement RPTP sections 6.3.1 (fares and ticketing system) and 6.3.2 (Fare concessions) New Policy Section 6.3.1 – Fare and ticketing system
This section includes policies and actions that guide the establishment and management of public transport fare structure and ticketing system, and is intended to replace to existing RPTP sections 6.3.1 and 6.3.2.
Introduction Improving the fares and ticketing system is a significant element in the modernisation of Waikato’s public transport network. It is Council’s intention to deliver an integrated fares and ticketing system across all public transport services with the goal of enhance customer experiences. The objective for fares and ticketing is set out below:
Objective 1: Implement a fares and ticketing system that:
Provides simplicity for customers to understand and is simple to administer;
Reflects of the costs of running the service;
Represents values for users for users and funders
Supports increased use of public transport; and
Supports integration of public transport services across the region.
Fare structure The future fare structure for the Waikato region is based on a comprehensive fare structure review undertaken in 2016/17 which is a key action identified in the operative RPTP 2015-25. The 2017 review confirmed a proposal to introduce a simpler, zone-based integrated fare structure across all public transport services in the region. Under a zonal fare system, fares will be based on the number of zones travelled in as part of a journey, irrespective of the bus routes. There are nine fare zones included in the new fare structure, encompassing the entire region. The fare zone boundaries are illustrated in Figure 7a.
54

Figures 7a: Waikato Public Transport Fare Zone Boundaries
The new fare structure will enable the fares system to fully support the new electronic ticketing system, and will provide integrated payment and business support systems that will make using public transport more convenient.
Policies: fare structure
P17 Public transport services will be delivered under an integrated zonal-fare structure that covers the Waikato Region.
P18 Council will undertake a comprehensive review of the fare structure at least once every six years
55

Ticketing system and fare products The Waikato fare system provides a range of fare products aimed at making travel easier and for passengers. For smartcard users, transfers between services will be free on all services - meaning there will be no additional cost for users if they transfer from one vehicle to another during their journey, provided the transfer between services is made within the prescribed transfer time limit. A daily and weekly fare cap will also be available, which will limit the amount that customers will be charged for travel in any given day or week. The fare caps will help incentivise greater use of public transport and reward those that are already frequent users. The cap will be applied automatically, and will not require any specific action by customers. Fare levels will be set by Waikato Regional Council, and will be subject to regular review and adjustment to ensure that user charges keep pace with changes in operating costs, and to meet the farebox recovery targets as set out in section 6.3.3 of the Plan. Fare levels will be set to incentivise use of the smartcard in preference to cash fares, i.e. cash fares will be set at a standardised premium to standard (adult) smartcard fares. The ability for smartcard users to transfer between services without financial penalty will further incentivise smartcard uptake. To further encourage smartcard use and less use of cash on bus services, free transfers will no longer be available in association with cash tickets or products Increased use of smartcards will be more affordable for passengers, improve boarding speeds and service reliability. It will also reduce cash handling costs and security risks.
Policies: ticketing system and fare products
P19 Council will seek to implement a common integrated ticketing system on all contracted public transport services within the Region.
P20 Council will encourage the use of electronic ticketing and seek to minimise the use of cash on public transport services.
P21 The value of cash fares will be set 40% higher than equivalent smartcard fares on all services.
P22 Free transfers will be available on all services for smartcard users only for travel within a prescribed transfer time and/or trip limit as published by Waikato Regional Council.
P23 Daily and weekly fare caps will be available for smartcard users on all Hamilton public transport services. Fare caps may be provided on other services within the region subject to agreement from respective District Councils.
P24 Council may implement temporary promotional fare and ticketing products to encourage uptake of public transport from time to time.
Fare concessions
Fare concessions offer discounted fares for specific users groups and are distinct from ticketing products, which are available to all users. The concession discount rate will be standardised at 30% off the standard (adult) smartcard fare for all concession groups and products (except children under-5 and SuperGold gold card holders, which are free). The Council recognises fare concessions are a way to support improved access for the transport disadvantaged, and will continue to provide concessions to targeted user groups such as children under 5 and super gold card holders.
56
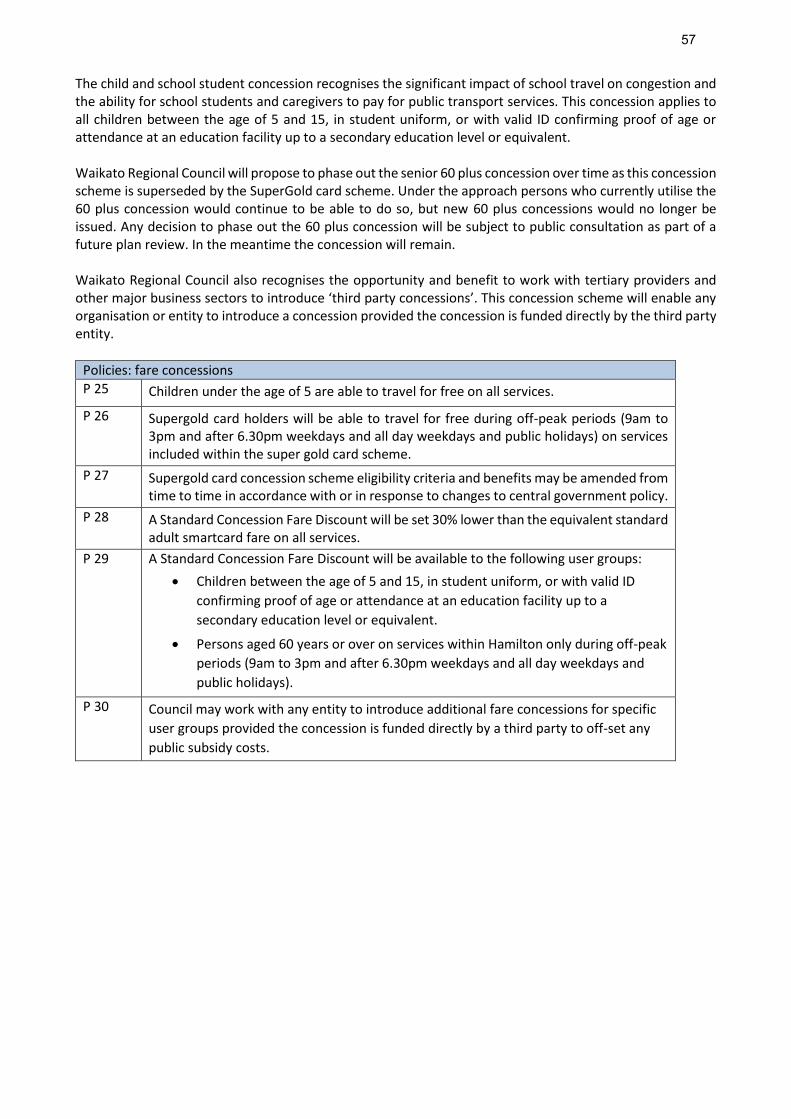
The child and school student concession recognises the significant impact of school travel on congestion and the ability for school students and caregivers to pay for public transport services. This concession applies to all children between the age of 5 and 15, in student uniform, or with valid ID confirming proof of age or attendance at an education facility up to a secondary education level or equivalent. Waikato Regional Council will propose to phase out the senior 60 plus concession over time as this concession scheme is superseded by the SuperGold card scheme. Under the approach persons who currently utilise the 60 plus concession would continue to be able to do so, but new 60 plus concessions would no longer be issued. Any decision to phase out the 60 plus concession will be subject to public consultation as part of a future plan review. In the meantime the concession will remain. Waikato Regional Council also recognises the opportunity and benefit to work with tertiary providers and other major business sectors to introduce ‘third party concessions’. This concession scheme will enable any organisation or entity to introduce a concession provided the concession is funded directly by the third party entity.
Policies: fare concessions
P 25 Children under the age of 5 are able to travel for free on all services.
P 26 Supergold card holders will be able to travel for free during off-peak periods (9am to 3pm and after 6.30pm weekdays and all day weekdays and public holidays) on services included within the super gold card scheme.
P 27 Supergold card concession scheme eligibility criteria and benefits may be amended from time to time in accordance with or in response to changes to central government policy.
P 28 A Standard Concession Fare Discount will be set 30% lower than the equivalent standard adult smartcard fare on all services.
P 29 A Standard Concession Fare Discount will be available to the following user groups:
Children between the age of 5 and 15, in student uniform, or with valid ID
confirming proof of age or attendance at an education facility up to a
secondary education level or equivalent.
Persons aged 60 years or over on services within Hamilton only during off-peak
periods (9am to 3pm and after 6.30pm weekdays and all day weekdays and
public holidays).
P 30 Council may work with any entity to introduce additional fare concessions for specific
user groups provided the concession is funded directly by a third party to off-set any
public subsidy costs.
57

Attachment 2: Fare Review Proposals – RPTP Significance Policy assessment
Background
The Regional Public Transport Plan 2015 – 2025 (RPTP) was adopted by Waikato Regional Council on 26 March 2015. The RPTP is a strategic document that sets the objectives and policies for public transport in the region. Policies and actions contained in the plan provide for a comprehensive fare structure review and implementation of a new electronic ticketing system. Chapter 6 “Policies and Actions” of the operative RPTP, specifically section 6.3, focuses on Fares and Ticketing. This section contains the policies and actions that guide the establishment and review of fare ticket products as well as reference to the farebox recovery policy. Undertaking a comprehensive review of fare structures is an action for the plan which looks to integrate this with a new electronic ticketing system. Under section 6.3.1 “Fare structure and ticketing system” the current fare structure is described and confirms the retention of a flat fare structure for the Hamilton urban network and a graduated fare structure for services outside of Hamilton. Specific fare products described include the existing 1-hour transfer, City Explorer and Return Plus fare products all of which may be subject to change based on proposals under the fare structure review. Policy 17 in the plan “Retain a flat fare structure for Hamilton and a graduated fare structure for services outside the Hamilton urban area, and council may implement a new fare structure, subject to the outcome of the fare structure review in 2014/15 (See A31)” confirms the intention to retain a single fare area for the Hamilton urban network with unprescribed flexibility for satellite services and the intention to implement changes to fare structures arising from the review. Action 31 referred to in policy 17 states “The council will review the fare structures at least once every 6 years and carry out a comprehensive fare structure review in 2014/15. This will include consideration of the fare structure, concession fares and ticketing products ahead of implementation of a new electronic ticketing system” and requires the completion of the fare review and the scope the review covers. Policy 18 in the plan is “Require an integrated electronic ticketing system on all contracted services (except small rural services where it is not economically viable) to support integration of public transport services across the region”. With the existing contract for electronic ticketing currently subject to extension and with a completion date in June 2018 there is a need to have a replacement system in place by this date. Waikato Regional Council has coordinated with nine other regional councils and NZTA to procure a provider for a new electronic ticketing system under the Regional Integrated Ticketing Scheme (RITS). This is intended to replace the existing system with enhanced functionality and interoperability between regions. In developing the new system, there exists the opportunity to integrate with a revised fare structure. This can be included in the development of the ticketing system and presents an opportunity to efficiently implement a revised fare structure, rather than re-programme the system after deployment. As per the policies above, undertaking a fare structure review and implementing the outcomes of the review have been provided for and publicly consulted on through the development of the Plan. A comprehensive independent fare structure review has been completed. A range of options were considered and evaluated to determine preferred options for fare structure, concessions and fare products. Using the preferred options identified in the review the impacts of adjusted fare policies have been assessed against regional passenger journeys and potential fare revenue. In the review, the analysis to determine impacts on journeys and fares has been made using the following assumptions based on preferred options:
58

Introducing a zonal fare structure, retaining a single zone covering the Hamilton urban area with fare zones radiating outwards from Hamilton
Cash fares priced at a 40% premium on Busit fares (rounded to the nearest 10 cents)
Child fares price at a 30% discount on Adult fares
A free transfers will apply across all services
All other fare products are deleted, including the Senior 60+, Taupo senior, and return fares.
Assessment of Significance
In considering the impact of a structural change to regional fares this needs to be assessed against the significance policy contained in the Regional Public Transport Plan 2015 - 2025 to determine the level of consultation required with stakeholders and the community. In assessing the significance of proposals included in the fare structure review comparison has been made using analysis of patronage and fare revenue changes against the significance policy criteria of the Plan. A summary of the fare structure review has been captured in an analysis report (Doc # 10634658). This is a subset of the more comprehensive fare structure review document (Doc # 10350131). Using the criteria of the RPTP Significance Policy a significant variation is considered to be one that is likely to have an impact that is ‘more than minor’ on:
1. the ability to achieve the goal and strategic priorities set out in this plan
2. the ability to achieve the objectives of the Regional Land Transport Plan
3. the amount and allocation of funding available to public transport across the region.
Ability to achieve the goal and strategic priorities set out in the RLTP
The goal for public transport contained in the plan is: “A growing and affordable public transport system that contributes to the economic, social and environmental vitality of the region”.
The implementation of a revised fare structure is not likely to impede the ability of the plan to work towards achieving this goal, and so would not be considered to have a ‘more than minor’ effect.
Chapter 5, section 5.2 contains the nine strategic priorities that contribute to achieving the goal of the RPTP. These priorities have been categorised into Region wide, Hamilton urban area, Satellite towns, and Rural areas. Fares and ticketing are specifically provided for in strategic priorities 1 and 3 of the plan.
o Strategic Priority 1 “Grow patronage in a way that is affordable to users and funders” and; o Strategic Priority 3 “Provide an attractive alternative to the private motor vehicle to promote travel
behaviour change”. The implementation of a revised fare structure is not likely to adversely impact any of the nine strategic priorities of the plan and so would not be considered to have a ‘more than minor’ effect on any of the strategic priorities of the plan.
Strategic Priority Assessment of Significance
Reg
ion
Wid
e
Grow patronage in a way that is affordable to users and funders
Not Significant
Ensure integration between services infrastructure, and land use planning
Not Applicable
Provide an attractive alternative to the private motor vehicle to promote travel behaviour change
Not Significant
59

Strategic Priority Assessment of Significance
Ham
ilto
n
urb
an
area
Provide safe, efficient and reliable services to employment centres and growth areas
Not Applicable
Provide access to essential service that supports the community’s social wellbeing
Not Applicable Sa
telli
te t
ow
ns Provide safe, efficient and reliable services
between satellite towns and Hamilton to meet the peak time demand
Not Applicable
Ensure satellite commuter services are integrated with Hamilton urban services to optimise service delivery
Not Applicable
Ru
ral a
reas
Provide efficient and reliable access to essential services, employment and district centres where there is sufficient demand and benefits, and where local share funding is available
Not Applicable
Provide support for seasonal bus services to key regional holiday destinations and special events where there is sufficient demand and benefits, and where local share funding is available
Not Applicable
Table 1: Assessment against RPTP strategic priorities
Ability to achieve the objectives of the Regional Land Transport Plan
The Regional Land Transport Plan 2015 – 2045 (RLTP) includes objectives for Affordability and Access and Mobility that have policies specifically related to the delivery of public transport. The proposals in the fare structure review are consistent with these policies. The affordability objective specifically identifies that a key component to achieving the RLTP’s affordability objective is “Implementation of the new Regional Public Transport Plan with its focus on an optimised and efficient network for Hamilton and surrounding satellite towns in particular”. This is supported by a key implementation measure:
M34 - Transport partners to achieve greater efficiencies in the public transport system through the implementation of the Regional Public Transport Plan 2015-2025 The Access and Mobility objective in the RLTP contains the following two policies relevant to public transport:
P27 - Optimise and grow an effective, efficient and affordable public transport system for Hamilton and surrounding satellite towns.
P28 - Maintain the existing rural public transport network and expand where there is identified demand and available funding. Along with the supporting key implementation measure:
M39 - Waikato Regional Council to ensure the Waikato Regional Public Transport Plan gives effect to the policy direction set for public transport in this plan
The implementation of a revised fare structure is not likely to adversely impact on the ability to achieve the objectives of the Regional Land Transport Plan and so would not be considered to have a ‘more than minor’ effect on any of the strategic priorities of the plan.
Amount and allocation of funding available to public transport across the region
Patronage and fare analysis of the introduction of a revised fare structure has shown an overall cost-neutral effect on fares. This should not have a significant effect on the ability of the region to fund public transport services across the region.
60
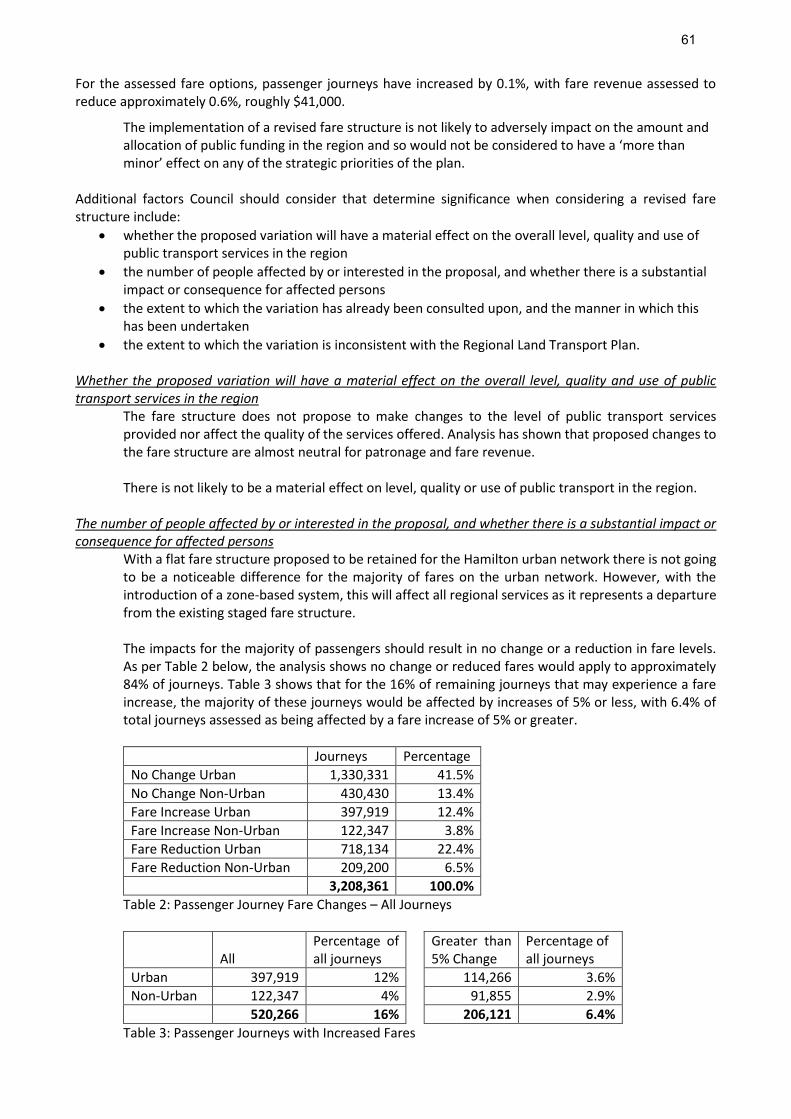
For the assessed fare options, passenger journeys have increased by 0.1%, with fare revenue assessed to reduce approximately 0.6%, roughly $41,000.
The implementation of a revised fare structure is not likely to adversely impact on the amount and allocation of public funding in the region and so would not be considered to have a ‘more than minor’ effect on any of the strategic priorities of the plan.
Additional factors Council should consider that determine significance when considering a revised fare structure include:
whether the proposed variation will have a material effect on the overall level, quality and use of public transport services in the region
the number of people affected by or interested in the proposal, and whether there is a substantial impact or consequence for affected persons
the extent to which the variation has already been consulted upon, and the manner in which this has been undertaken
the extent to which the variation is inconsistent with the Regional Land Transport Plan. Whether the proposed variation will have a material effect on the overall level, quality and use of public transport services in the region
The fare structure does not propose to make changes to the level of public transport services provided nor affect the quality of the services offered. Analysis has shown that proposed changes to the fare structure are almost neutral for patronage and fare revenue. There is not likely to be a material effect on level, quality or use of public transport in the region.
The number of people affected by or interested in the proposal, and whether there is a substantial impact or consequence for affected persons
With a flat fare structure proposed to be retained for the Hamilton urban network there is not going to be a noticeable difference for the majority of fares on the urban network. However, with the introduction of a zone-based system, this will affect all regional services as it represents a departure from the existing staged fare structure. The impacts for the majority of passengers should result in no change or a reduction in fare levels. As per Table 2 below, the analysis shows no change or reduced fares would apply to approximately 84% of journeys. Table 3 shows that for the 16% of remaining journeys that may experience a fare increase, the majority of these journeys would be affected by increases of 5% or less, with 6.4% of total journeys assessed as being affected by a fare increase of 5% or greater.
Journeys Percentage
No Change Urban 1,330,331 41.5%
No Change Non-Urban 430,430 13.4%
Fare Increase Urban 397,919 12.4%
Fare Increase Non-Urban 122,347 3.8%
Fare Reduction Urban 718,134 22.4%
Fare Reduction Non-Urban 209,200 6.5%
3,208,361 100.0%
Table 2: Passenger Journey Fare Changes – All Journeys
All
Percentage of all journeys
Greater than 5% Change
Percentage of all journeys
Urban 397,919 12% 114,266 3.6%
Non-Urban 122,347 4% 91,855 2.9%
520,266 16% 206,121 6.4%
Table 3: Passenger Journeys with Increased Fares
61

Analysis of the proposed options suggests that approximately 84% of public transport journeys will experience no change or a reduction in fare levels as a result of a revised fare structure. Of the remaining 16% of journeys that may experience a fare increase, just less than 10% will experience increases of 5% or less, with just over 6% of journeys experience fare increases of greater than 5%.
The extent to which the variation has already been consulted upon, and the manner in which this has been undertaken
The RPTP was consulted upon according to the special consultative procedure outlined in the Local Government Act 2002. Public consultation was undertaken over November to December 2014 with Hearings and Deliberations conducted in February 2015. Waikato Regional Council adopted the Plan on 26 March 2015 and delegated authority to the Chair of the Regional Public Transport Committee Hearings Committee for release of the final Plan.
The extent to which the variation is inconsistent with the Regional Land Transport Plan
As discussed above, the proposed variation is consistent with the Regional Land Transport Plan and is not considered to be significant.
Conclusion
In assessing the impacts of a fare structure review against the significance policy of the RPTP, the proposed variations would not be considered significant variations with the implementation of a fare review being provided for in Policy 17 of the plan. Although the overall proposal is not significant, where specific communities may be affected by fare increases, targeted communication is recommended to emphasize other mitigating factors/benefits that will be realised from the fare changes.
62
Report to Strategy and Policy Committee
Date: 18 January 2018
Author: Ben Bunting, Principal Advisor Science and Strategy
Authoriser: Tracey May, Director Science and Strategy
Subject: Water Users Liaison Forum – review of information gathering charges to inform Council’s LTP considerations
Section: B (For recommendation to Council)
Purpose 1. To inform Committee on the review of information gathering charges undertaken by a sub-group of
the Water Users Liaison Forum. 2. To seek Committee approval of the annual charges for science and information gathering levied by
WRC on water take consent holders in the region as a topic for consultation in the 2018-2018 LTP consultation document, including as an option, the charges proposed by the sub-group of the Water Users Liaison Forum.
Executive Summary 3. Through the Water Users Liaison Forum (WULF), convened by WRC, a sub-group was set up to review
the existing annual charges for science and information gathering levied by WRC on water take consent holders in the region.
4. Over five meetings between early October and late November 2017 the sub-group reviewed the current charging structure (the ‘status quo’) and recommended a revised structure and associated recommendations to Council’s Long Term Plan 2018-2028 considerations.
5. The meetings were facilitated by Ben Bunting (WRC). Mr Phillips, representing the irrigation sector, presented concerns with the ‘status quo’ and provided analysis of other approaches including tabling graphs and information. Ed Brown (WRC) provided context of the current charges and provided analysis of the different charging options that the sub-group debated. The remaining five sub-group members, representing different sectors and Iwi interests, received and debated the information from Mr Philips and Mr Brown.
6. No new or additional issues were raised by Mr Phillips throughout the sub-group meetings. The issues put forward by Mr Phillips have previously been robustly scrutinised, reported on and considered at length by Council in its 2015-2025 LTP deliberations and again in its 2016-17 Annual Plan.
7. The recommended charging structure proposed and accepted by the sub-group members seeks: a. retaining the current $65 minimum information gathering charge for all consent holders;
and b. removing the current two tiered charge ($0.37 per m3 up to 30,000m3 and $0.12 per m3 above
30,000m3) and replacing it with a uniform charge of $0.32m3 irrespective of amount, activity or location in the region.
8. Compared to the current charging regime an impact of the changes proposed by the sub-group would be that the consent holders that take the largest water volumes (generally municipal takes) would pay substantially more and smaller volumes takes marginally less.
9. After the last sub-group meeting, Mr Fred Phillips withdrew his support for the recommended charging structure previously accepted. The key reason for Mr Phillip’s change of position is that he seeks that charges be based on an annualised consented volume rather on a daily consented volume
63

because he believes that irrigators, who do not take water year-round, are disadvantaged by charges based on daily consented volume.
10. The issues put forward by Mr Phillips in withdrawing this support were discussed and considered by the sub-group at considerable length over their meetings. Despite robust and lengthy discussions, analysis and scenario modelling presented by Mr Phillips, the other members of the sub-group did not support his preferred position.
Staff Recommendations:
1. That the report titled ‘Water Users Liaison Forum– review of information gathering charges to inform Council’s LTP considerations’ (Doc # 11685153 dated 18 January 2018) be received.
2. That Committee approve the annual charges for science and information gathering levied by WRC on water take consent holders in the region as a topic for consultation in the 2018-2018 LTP consultation document.
3. That the options for consultation include:
a) Status quo – No change to the current arrangement for water user charges b) No change to quantum of funding received from water user charges but change to distribution
of charges as identified by the Water Users Liaison Forum sub-group – preferred option as set out in paragraph 30.
Background 11. The Water Users Liaison Forum (WULF) was convened by WRC in February 2017 and includes
representatives of water use consent holders from a range of sectors including irrigation, agriculture, horticulture, industry, electricity generation and local government.
12. Formation of the WULF was a resolution Council’s May 2016 meeting (refer Doc # 5835297) on its 2016-2017 Annual Plan deliberations on water take consent charges which stated:
“THAT Council coordinate a stakeholder working group and that staff report back on the terms of reference for the group taking into account feedback on the matters raised in this report and that $15,000 budget provision be made to facilitate the working group.”
13. The purpose of the WULF is to provide a forum for representatives of major water users in the Waikato region to enable discussion on water management issues recognising that water is a constrained resource.
14. The WULF is chaired by WRC Deputy Chair Councillor Tipa Mahuta with executive and administrative support provided by the Science and Strategy Directorate.
WULF sub-group 15. At its inaugural meeting in February 2017 the WULF, through its terms of reference, sought the
formation of a sub-group to review the existing annual charges for science and information gathering levied by WRC on water take consent holders in the region under Section 36 of the RMA.
16. The rationale for setting up the sub-group to undertake the review was to ensure there was consultation and key stakeholder input and was a recommendation from Council’s May 2016 meeting (refer Doc # 5835297).
17. Consistent with the WULF terms of reference advice and recommendations from the sub-group are to go directly to Council to be considered in its Long Term Plan 2018-2028 deliberations.
18. The sub-group nominations were confirmed at the WULF meeting of 27 September 2017 as:
Mr Andrew McGiven (Federated Farmers/Dairy NZ)
Mr Ed Mercer (Oji Fibre Solutions)
Mr Eugene Berryman-Kamp (Te Arawa River Iwi Trust)
Mr Fred Phillips (representing horticultural irrigators)
64
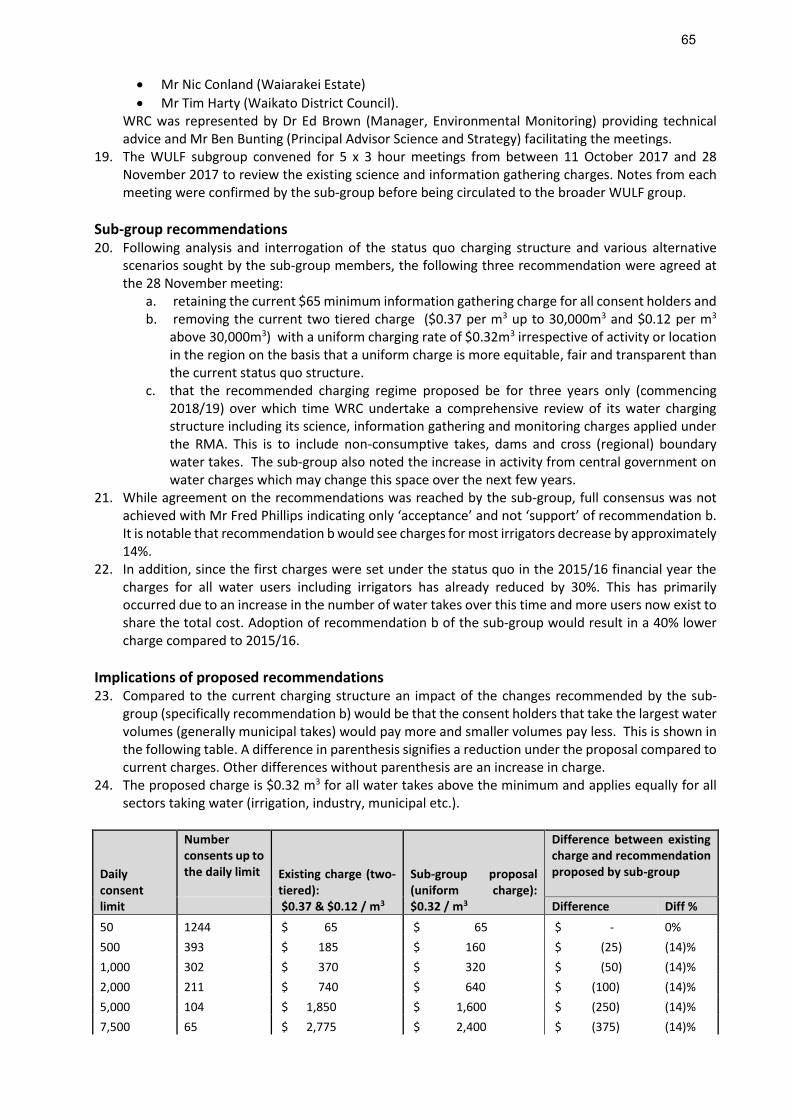
Mr Nic Conland (Waiarakei Estate)
Mr Tim Harty (Waikato District Council). WRC was represented by Dr Ed Brown (Manager, Environmental Monitoring) providing technical advice and Mr Ben Bunting (Principal Advisor Science and Strategy) facilitating the meetings.
19. The WULF subgroup convened for 5 x 3 hour meetings from between 11 October 2017 and 28 November 2017 to review the existing science and information gathering charges. Notes from each meeting were confirmed by the sub-group before being circulated to the broader WULF group.
Sub-group recommendations 20. Following analysis and interrogation of the status quo charging structure and various alternative
scenarios sought by the sub-group members, the following three recommendation were agreed at the 28 November meeting:
a. retaining the current $65 minimum information gathering charge for all consent holders and b. removing the current two tiered charge ($0.37 per m3 up to 30,000m3 and $0.12 per m3
above 30,000m3) with a uniform charging rate of $0.32m3 irrespective of activity or location in the region on the basis that a uniform charge is more equitable, fair and transparent than the current status quo structure.
c. that the recommended charging regime proposed be for three years only (commencing 2018/19) over which time WRC undertake a comprehensive review of its water charging structure including its science, information gathering and monitoring charges applied under the RMA. This is to include non-consumptive takes, dams and cross (regional) boundary water takes. The sub-group also noted the increase in activity from central government on water charges which may change this space over the next few years.
21. While agreement on the recommendations was reached by the sub-group, full consensus was not achieved with Mr Fred Phillips indicating only ‘acceptance’ and not ‘support’ of recommendation b. It is notable that recommendation b would see charges for most irrigators decrease by approximately 14%.
22. In addition, since the first charges were set under the status quo in the 2015/16 financial year the charges for all water users including irrigators has already reduced by 30%. This has primarily occurred due to an increase in the number of water takes over this time and more users now exist to share the total cost. Adoption of recommendation b of the sub-group would result in a 40% lower charge compared to 2015/16.
Implications of proposed recommendations 23. Compared to the current charging structure an impact of the changes recommended by the sub-
group (specifically recommendation b) would be that the consent holders that take the largest water volumes (generally municipal takes) would pay more and smaller volumes pay less. This is shown in the following table. A difference in parenthesis signifies a reduction under the proposal compared to current charges. Other differences without parenthesis are an increase in charge.
24. The proposed charge is $0.32 m3 for all water takes above the minimum and applies equally for all sectors taking water (irrigation, industry, municipal etc.).
Daily consent limit
Number consents up to the daily limit Existing charge (two-
tiered): $0.37 & $0.12 / m3
Sub-group proposal (uniform charge): $0.32 / m3
Difference between existing charge and recommendation proposed by sub-group
Difference Diff %
50 1244 $ 65 $ 65 $ - 0%
500 393 $ 185 $ 160 $ (25) (14)%
1,000 302 $ 370 $ 320 $ (50) (14)%
2,000 211 $ 740 $ 640 $ (100) (14)%
5,000 104 $ 1,850 $ 1,600 $ (250) (14)%
7,500 65 $ 2,775 $ 2,400 $ (375) (14)%
65
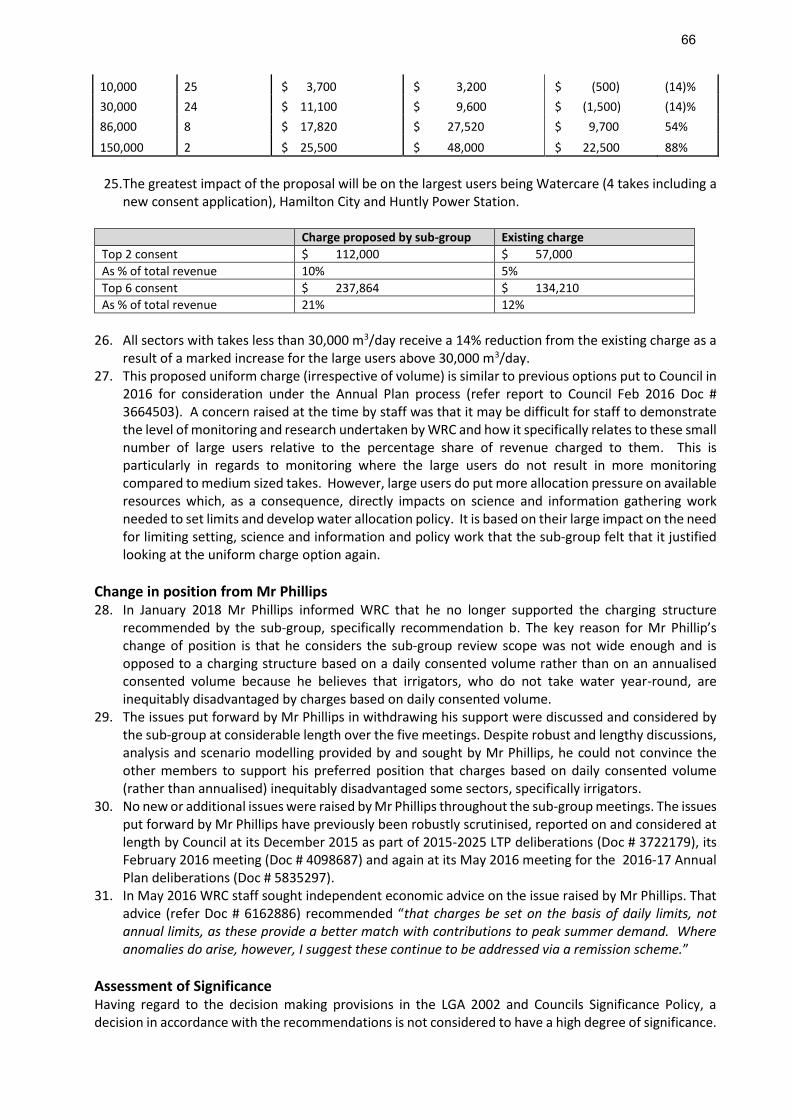
10,000 25 $ 3,700 $ 3,200 $ (500) (14)%
30,000 24 $ 11,100 $ 9,600 $ (1,500) (14)%
86,000 8 $ 17,820 $ 27,520 $ 9,700 54%
150,000 2 $ 25,500 $ 48,000 $ 22,500 88%
25. The greatest impact of the proposal will be on the largest users being Watercare (4 takes including a
new consent application), Hamilton City and Huntly Power Station.
Charge proposed by sub-group Existing charge
Top 2 consent $ 112,000 $ 57,000
As % of total revenue 10% 5%
Top 6 consent $ 237,864 $ 134,210
As % of total revenue 21% 12%
26. All sectors with takes less than 30,000 m3/day receive a 14% reduction from the existing charge as a
result of a marked increase for the large users above 30,000 m3/day. 27. This proposed uniform charge (irrespective of volume) is similar to previous options put to Council in
2016 for consideration under the Annual Plan process (refer report to Council Feb 2016 Doc # 3664503). A concern raised at the time by staff was that it may be difficult for staff to demonstrate the level of monitoring and research undertaken by WRC and how it specifically relates to these small number of large users relative to the percentage share of revenue charged to them. This is particularly in regards to monitoring where the large users do not result in more monitoring compared to medium sized takes. However, large users do put more allocation pressure on available resources which, as a consequence, directly impacts on science and information gathering work needed to set limits and develop water allocation policy. It is based on their large impact on the need for limiting setting, science and information and policy work that the sub-group felt that it justified looking at the uniform charge option again.
Change in position from Mr Phillips 28. In January 2018 Mr Phillips informed WRC that he no longer supported the charging structure
recommended by the sub-group, specifically recommendation b. The key reason for Mr Phillip’s change of position is that he considers the sub-group review scope was not wide enough and is opposed to a charging structure based on a daily consented volume rather than on an annualised consented volume because he believes that irrigators, who do not take water year-round, are inequitably disadvantaged by charges based on daily consented volume.
29. The issues put forward by Mr Phillips in withdrawing his support were discussed and considered by the sub-group at considerable length over the five meetings. Despite robust and lengthy discussions, analysis and scenario modelling provided by and sought by Mr Phillips, he could not convince the other members to support his preferred position that charges based on daily consented volume (rather than annualised) inequitably disadvantaged some sectors, specifically irrigators.
30. No new or additional issues were raised by Mr Phillips throughout the sub-group meetings. The issues put forward by Mr Phillips have previously been robustly scrutinised, reported on and considered at length by Council at its December 2015 as part of 2015-2025 LTP deliberations (Doc # 3722179), its February 2016 meeting (Doc # 4098687) and again at its May 2016 meeting for the 2016-17 Annual Plan deliberations (Doc # 5835297).
31. In May 2016 WRC staff sought independent economic advice on the issue raised by Mr Phillips. That advice (refer Doc # 6162886) recommended “that charges be set on the basis of daily limits, not annual limits, as these provide a better match with contributions to peak summer demand. Where anomalies do arise, however, I suggest these continue to be addressed via a remission scheme.”
Assessment of Significance Having regard to the decision making provisions in the LGA 2002 and Councils Significance Policy, a decision in accordance with the recommendations is not considered to have a high degree of significance.
66
It is noted that when setting charges under the Resource Management Act 1991, the special consultative procedure set in section 83 of the Local Government Act 2002 is followed.
Legislative context 32. In order to carry out its water resource management functions, the council requires adequate
information about the state of the environment. This requirement is formalised in section 35 of the RMA.
33. Section 35(1) of the RMA states: “Every local authority shall gather such information, and undertake or commission such research, as is necessary to carry out effectively its functions under this Act or regulations under this Act.”
34. Section 35(2)(a) of the RMA states that the council shall monitor: “...the state of the whole or any part of the environment of its region…to the extent that it is appropriate to enable [it] to effectively carry out its functions under this Act.”
35. From this it is important to acknowledge that the charges do not relate solely to monitoring but also include science and information gathering. Without this information council would be unable to ensure the sustainable management of water resources in the region.
36. The basis for charging consent holders for the council’s costs in relation to water allocation is section 36(4)(b) of the RMA.
Preferred Option 37. This report recommends that Committee approve the annual charges for science and information
gathering levied by WRC on water take consent holders in the region as a topic for consultation in the 2018-2018 LTP consultation document, and hat the options for consultation include:
a. Status quo – No change to the current arrangement for water user charges b. No change to quantum of funding received from water user charges but change to
distribution of charges as identified by the Water Users Liaison Forum sub-group – preferred option.
Policy Considerations 38. To the best of the writer’s knowledge, this decision is not significantly inconsistent with nor is
anticipated to have consequences that will be significantly inconsistent with any policy adopted by this local authority or any plan required by the Local Government Act 2002 or any other enactment.
Conclusion 39. A sub-group of the Water Users Liaison Forum has reviewed the current charges for science and
information gathering levied by WRC on water take consent holders in the region. Its recommendations and proposed charging structure the sub-group are to be considered as an option in Council’s Long Term Plan 2018-2028 deliberations.
Attachments 1. Insight Economics – review of proposed water monitoring charges May 2016 (Doc # 6162886) 2. Report to Council May 2016 – 2016/17 Annual Plan – water take consent charges deliberations report
(Doc # 5835297) 3. Report to Council February 2016 – Annual consent holder charges – water takes (Doc # 4098687) 4. Report to Council December 2015 – Annual charges for 2015/16 water take consents (Doc # 3722179).
67
INSIGHT ECONOMICS
PO Box 106 303
Commerce Street
Auckland 1143
Monday, May 09, 2016
Mike Garrett
Waikato Regional Council
401 Grey St
Hamilton 3216
Dear Mike,
Re: Review of Proposed Water Monitoring Charges
Thank you for the opportunity to review the matter above. The purpose of this letter is
to share my key findings, which I am more than happy to discuss further.
Scope of the Review
My review focussed on the following key issues:
1. Which principles should be used to evaluate charging options
2. Whether charges should be based on daily or annual limits
3. Whether charges should include minima and maxima
4. Whether the proposed 40/60 funding split is appropriate, and
5. Which of the four options I recommend for adoption.
My findings on each aspect are summarised below.
Which principles should be used to evaluate different charging options
My first task was to identify principles to guide the evaluation of options. To that
end, I propose the following guiding principles:
Economic efficiency – this requires the prices paid by each party to reflect
their true costs. In other words, the costs borne by each consent holder
should reflect the monitoring and investigation costs associated with it.
Equity – this comprises two parts: horizontal equity and vertical equity.
Horizontal equity requires consent holders in similar circumstances to be
treated the same, while vertical equity requires consent holders in different
circumstances to be treated differently.
Simplicity – this suggests that, all other things being equal, simpler charging
options should be preferred over more complex ones.
Transparency – which requires that charges be readily verifiable, and
Justifiability – which requires charges to be justifiable and legally defensible.
68

I note in passing that these principles are very similar to those outlined in the
Council’s revenue and financing policy. In addition, they closely reflect the
considerations set out in section 101(3) of the LGA 2002 and also section 36(4) of the
RMA. Accordingly, I consider them appropriate for assessing options.
Whether charges should be based on daily or annual limits
Having established evaluation criteria, I next considered whether charges should be
set on the basis of daily or annual consent limits. In short, the Council proposes to
use the former, while irrigators prefer the latter.
To advance the discussion, we must first clarify what the charges actually cover. In
summary, the charges part-fund four key workstreams:
Water allocation plan implementation – which sets yields, allocable flows,
and allocation limits. This information is then communicated to stakeholders
via Council’s website, technical reports, and the Regional Plan.
Hydrological Regimes – which focuses on groundwater and surface water
interactions to understand how and why rivers and streams respond to
climate change and variability.
Pressure Analysis – which focusses on the maintenance and update of
databases used to store data required to manage water allocations.
EM Flow Regimes – which entails the collection, cleaning and analysis of
data on historical and current water flows at 68 river flow monitoring sites
and 242 groundwater monitoring sites.
As these descriptions suggest, the key reason for undertaking monitoring and
investigation work is to ensure the efficient allocation of scarce water resources,
particularly during times of peak demand. These peaks, in turn, occur during the
summer months, when higher temperatures necessitate seasonal water uses such as
irrigation. In other words, the extent to which each consent causes the need for this
work (and benefits from it) largely reflects its contribution to peak summer demand.
Accordingly, it could be argued, the ideal method for setting charges is on the basis
of summer water allocations. However, unfortunately, the information required to
set charges in this manner is often unavailable or incomplete. For example, while
many consents have both daily and annual limits, few (if any) record summer
allocations or limits. As a result, an alternative method must be chosen.
The next obvious methods for setting the charges are on the basis of either daily or
annual limits. As noted above, the Council prefers the former. This is because, it
argues, the daily limit provides a better proxy for contributions to summer peak than
daily limits. To see why, consider the following simple example.
69

Table 1: Simple Worked Example for 3 Consents
Consent Limits Shares of Consent Limits
Consent Holders Daily Annual Daily Annual
A 500 182,500 5% 6%
B 1,500 150,000 15% 5%
C 8,000 2,920,000 80% 90%
Totals 10,000 3,252,500 100% 100%
In this example, the annual limits for consents A and C are 365 times their daily
limits, while the annual limit for consent B is only 100 times its daily limit. In other
words, consents A and C are full-year consents, while consent B is only part-year.
According to the consent limit shares shown in the table above:
if charges are set on the basis of daily limits, consent B pays 15%, but
if they are set on annual limits, consent B pays only 5%.
So, which is best? In short, it depends on whether consent B’s use is concentrated
during peak or off-peak periods. Specifically, if consent B’s takes are concentrated
during the peak period, then setting charges on the basis of daily limits is likely to be
more efficient and equitable because the daily limit provides a better proxy for its
share of peak demand. However, if consent B’s takes are spread fairly evenly
through the year, then annual limits may provide the better basis
To determine the likelihood that part-year consents reflect seasonal/summer uses, I
requested and analysed a database of consent information from the Council. Using
that data, I first filtered it to find only part-year consents. Then, I cross-tabulated the
results to show the split between total daily limits by likelihood of seasonality and
primary use. The following table records my findings.
Table 2: Sum of Daily Limits by Primary Use and Seasonality (Part-Year Consents Only)
Primary Use Likely Seasonal Unlikely Seasonal Seasonal Share
Agriculture 800,710 16,810 98%
Aquaculture (fresh and saline) 0 150 0%
Domestic & Municipal Water Supply 1,000 182,590 1%
Horticulture/market gardening 214,280 450 100%
Industry (Construction/roading) 460 6,620 7%
Industry (Electricity generation) 0 110 0%
Industry (Food processing) 0 49,290 0%
Industry (Others) 0 7,230 0%
Industry (Quarry/mining) 0 85,010 0%
Industry (Timber/paper) 1,200 180 87%
Recreation 15,200 770 95%
Rehabilitation 0 330 0%
All Primary Uses 1,032,860 349,550 75%
Table 2 shows that the likelihood of seasonality for part-year consents is very high
for certain primary uses, particularly agriculture and horticulture. However, for
70
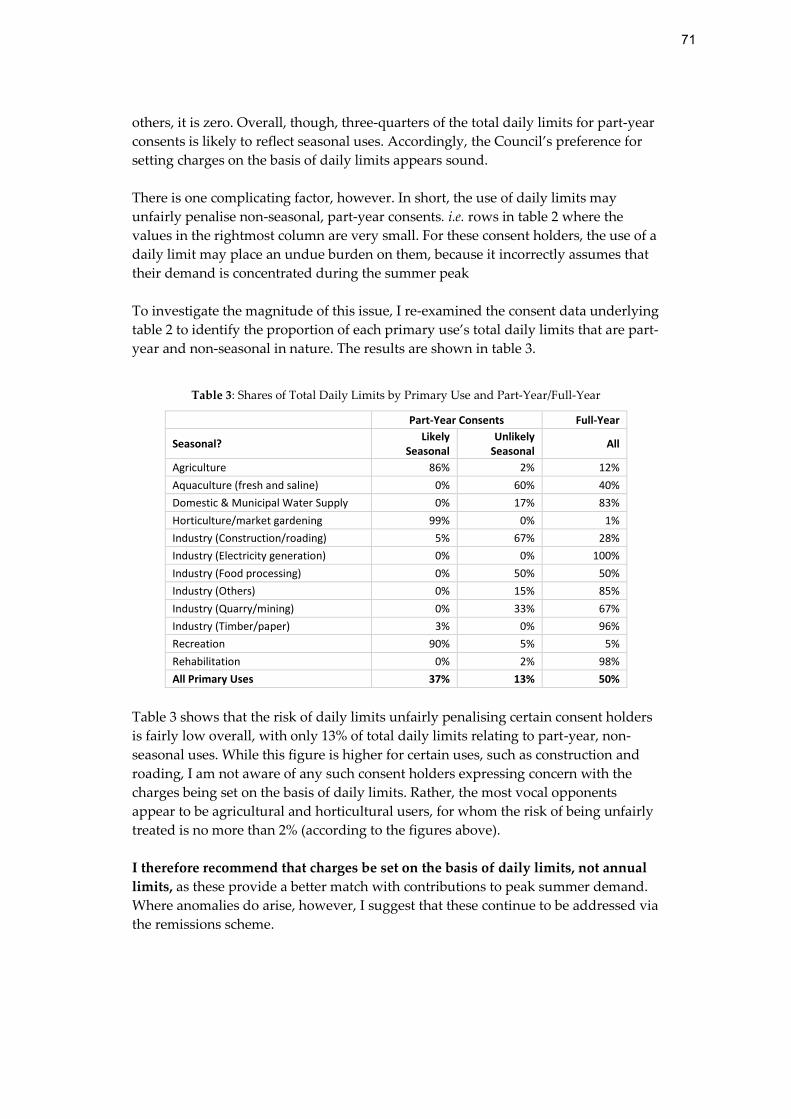
others, it is zero. Overall, though, three-quarters of the total daily limits for part-year
consents is likely to reflect seasonal uses. Accordingly, the Council’s preference for
setting charges on the basis of daily limits appears sound.
There is one complicating factor, however. In short, the use of daily limits may
unfairly penalise non-seasonal, part-year consents. i.e. rows in table 2 where the
values in the rightmost column are very small. For these consent holders, the use of a
daily limit may place an undue burden on them, because it incorrectly assumes that
their demand is concentrated during the summer peak
To investigate the magnitude of this issue, I re-examined the consent data underlying
table 2 to identify the proportion of each primary use’s total daily limits that are part-
year and non-seasonal in nature. The results are shown in table 3.
Table 3: Shares of Total Daily Limits by Primary Use and Part-Year/Full-Year
Part-Year Consents Full-Year
Seasonal? Likely
Seasonal Unlikely
Seasonal All
Agriculture 86% 2% 12%
Aquaculture (fresh and saline) 0% 60% 40%
Domestic & Municipal Water Supply 0% 17% 83%
Horticulture/market gardening 99% 0% 1%
Industry (Construction/roading) 5% 67% 28%
Industry (Electricity generation) 0% 0% 100%
Industry (Food processing) 0% 50% 50%
Industry (Others) 0% 15% 85%
Industry (Quarry/mining) 0% 33% 67%
Industry (Timber/paper) 3% 0% 96%
Recreation 90% 5% 5%
Rehabilitation 0% 2% 98%
All Primary Uses 37% 13% 50%
Table 3 shows that the risk of daily limits unfairly penalising certain consent holders
is fairly low overall, with only 13% of total daily limits relating to part-year, non-
seasonal uses. While this figure is higher for certain uses, such as construction and
roading, I am not aware of any such consent holders expressing concern with the
charges being set on the basis of daily limits. Rather, the most vocal opponents
appear to be agricultural and horticultural users, for whom the risk of being unfairly
treated is no more than 2% (according to the figures above).
I therefore recommend that charges be set on the basis of daily limits, not annual
limits, as these provide a better match with contributions to peak summer demand.
Where anomalies do arise, however, I suggest that these continue to be addressed via
the remissions scheme.
71

Whether charges should include minima and maxima
The next issue was whether the charges should include minima and/or maxima. To
begin, I note that two of the three options proposed by the Council (options 2 and 3)
include minima, and that all three include lower rates for takes above 30,000m3/day.
While this lower rate for very large takes is not strictly a maximum, it does have that
effect in practice. In other words, the use of a lower rate for very high takes causes
the charges paid by very large users to be lower than it would be otherwise, thereby
creating a de-facto maximum.
So, should the charges include minima and maxima? I begin with the minima.
The rationale for including a minimum is that some of the underlying costs incurred
by the Council are independent of resource intensity, and hence that all users should
make a certain contribution regardless of consent limits.
To determine whether this makes sense, I reviewed the extent to which activities
part-funded by the charges are indeed likely to contain fixed costs. Without a
detailed knowledge of each activity, this is a slightly difficult exercise. Nevertheless,
the following table summarises my estimated split between fixed and variable costs
for each activity.
Table 4: Estimated Fixed/Variable Cost Split
Estimated Cost Split
Activity Fixed Variable
Water allocation plan implementation 20% 80%
Hydrological regimes 40% 60%
Pressure Analysis 50% 50%
EM Flow Regimes SW and GW 10% 90%
In short, I consider each activity to contain at least some element of fixed costs, with
this proportion being highest for “pressure analysis” and lowest for “EM flow
regimes.” This is because the former largely relates to the ongoing maintenance and
updating of databases, which is not really driven by intensity of use, while the latter
is strongly driven by resource intensity.1 Given the likely presence of these fixed
costs, I agree with the adoption of a minimum charge.
But how big should that minimum charge be? To answer this, I reconciled my
estimated cost splits above with the total cost of each activity and also the proportion
to be recovered from the charges in question. Then, I divided the estimated total
fixed costs by the number of consent holders to derive an estimated value for the
minimum charge. Mr workings are set out below. In short, I estimate a minimum
charge of around $62.
1 One reason that this activity is not 100% driven by resource intensity is the fact that, under
variation 6, primary and secondary allocable flows for all catchments will be investigated
regardless of resource pressure.
72

Table 5: Calculation of Estimated Minimum Charge
Activity Total Cost Funding Split Estimated Cost Split
Charges Rates Fixed Variable
Water allocation plan implementation $617,000 65% 35% 20% 80%
Hydrological regimes $288,000 28% 72% 40% 60%
Pressure Analysis $203,000 85% 15% 50% 50%
EM Flow Regimes SW and GW $1,051,000 40% 60% 10% 90%
Total Fixed Costs to recover from Charges $241,000
Number of consent holders 3,900
Implied minimum charge $62
I now turn my attention to the Council’s proposal of a lower rate for takes above
30,000m3/day which effectively creates a maximum for very large users. According to
the Council, this is necessary because the variable costs of each activity are not linear.
As a result, each additional cubic metre of water attached to each given consent does
not necessarily give rise to the same costs. Accordingly, for the sake of equity,
efficiency and justifiability, a lower rate is applied for very large users.
Unfortunately, within the time and budget available for this review, it has not been
possible to adequately determine the linearity (or otherwise) of the variable costs
associated with the activities to be funded. However, the arguments put forward by
the Council for non-linearity mirror my experience elsewhere. Namely, that the costs
of monitoring the very largest consents is often much less than a purely-linear
pricing structure would suggest. Indeed, it is difficult to imagine, for example, that
the cost of monitoring the largest consent (which is 200,000m3/day) is truly 200 times
greater than consents for 1,000m3/day. As a result, I agree with applying a lower rate
above the threshold identified.
I also note that some of the very largest users undertake monitoring that would
otherwise be the responsibility of the Council. For example, Mighty River Power
operates its own monitoring scheme, the results of which it shares with the Council
for broader use.
Accordingly, I agree with the Council’s decision to apply a lower rate beyond
30,000m3/day for equity, efficiency and justifiability reasons.
Whether the proposed 40/60 funding split is appropriate
Before recommending one of the four options, I briefly comment on the Council’s
recent decision to increase the proportion of costs funded by charges from 30% to
40%. I understand that this has not found favour with consent holders, who are now
required to fund a greater share of the activities in question.
While it is difficult to be particularly authoritative absent a full-scale review, I offer
the following high-level comments:
73

According to the information sent to me, consent holders account for 90% of
all water takes in the region, but are only required to fund 40% of the costs
(ignoring their contribution to the general rate component). Conversely, all
other ratepayers fund 60% of the cost but consume only 10% of the water. On
this basis, it is difficult to see how the current arrangement is unfair to
consent holders.
Further, according to discussions with the Council, around 80%-90% of the
costs associated with the activities in question arise from the presence of
consented takes. In other words, the costs to Council would be around 80%-
90% lower if there were no consented takes. On this basis, requiring consent
holders to pay 40% of the costs also seems fair and reasonable.
Finally, I note that the split between private and public funding is
considerably higher for other consent-related costs. For example, Council
recovers 65% of consent processing and compliance monitoring costs from
consent holders, so requiring them to pay 40% of the costs in question does
not seem unreasonable to me.
My recommendation on the four options
Based on the discussion above, I recommend the adoption of option 2 because:
It is based on daily, not annual, limits.
It includes a minimum charge that is very similar to the one I have
independently calculated above, and
It includes a lower rate for very high takes to capture the non-linearity of the
variable cost component.
Other matters
In addition to the comments above, I would also like to briefly note the following
matters in passing:
The Council may wish to adopt a formal policy to address monitoring carried
out by consent holders. For example, the irrigators sent me a list of research
that they are currently funding, some of which may overlap with the
Council’s work programme. By adopting such a policy, all parties can be
clear about whether, and how, research commissioned by consent holders
will be used to defray the charges that form the subject of this review.
I understand that a number of seasonal uses are restricted in times of high
demand, which is understandable from the point of reconciling supply and
demand. However, to the extent that this happens regularly, it may be worth
factoring those reductions into the apportionment of charges from the outset.
Put slightly differently, it seems unfair to charge users on the basis of their
daily limit if that limit is often unachievable due to restrictions beyond their
74
control. Instead, they should be charged for the “realisable” portion of their
daily limit. This is likely to become more important as the number of
consents increases and the need for demand restrictions becomes more
common.
Sincerely,
Fraser Colegrave
Managing Director
Insight Economics Limited
75

Report to Council May 2016 – Decision Required
File No: 01 12 16A
Date: 28 April 2016
To: Chief Executive Officer
From: Chief Financial Officer
Subject: 2016/17 Annual Plan - water take consent charges deliberations report
Recommendation:
1. That the report 2016/17 Annual Plan - water take consent charges deliberations report (Doc #212332
dated 28 April 2016) be received
2. That Council confirm water take consent charge options being (one to be selected):
i. Option 1 – Current charge but projected for 2016/17
ii. Option 2 – Projected charge for 2016/17 with addition of minimum fee of $65
iii. Option 3 – Projected charge for 2016/17 with addition of minimum fee of $100
as set out in the Consultation Document for implementation from 1 July 2016, and
3. That Council coordinate a stakeholder working group and that staff report back on the terms of reference for the group taking into account feedback on the matters raised in this report and that $15,000 budget provision be made to facilitate the working group.
Background
Council changed the charging regime for information gathering activities for water takes in the 2015-2025 Long Term Plan (LTP) so that it was based on an amount corresponding to the maximum daily net take rate. Previously the charging regime was based on a four tiered system, based on the daily take rate, prompting consent holders to request that Council shift to a more equitable charging regime. The information gathering component of the annual charge funds a portion of the Science and Strategy Directorate’s activities. Most consent holders with water takes in 2014/15 received a reduction in their charge from the new policy but a smaller proportion of consent holders (about 132 or 12%) had an increase. This impact was anticipated in the LTP decision and set out in the Consultation Document. Some of the consent holders adversely affected by the new charges, particularly irrigators, contacted council and expressed concern at the new charges and, in particular, they were not consulted with directly on these changes and only became aware of the increase on receipt of their new invoice charge. This matter was discussed at the December 2015 Council meeting and staff were instructed to work with representatives of the irrigators and report back on the concerns they had with the new charging system and explore alternative options. Over December and January staff provided considerable information to Mr Philips (the irrigators’ representative) and met on several occasions to explain the information and clarify misunderstandings. Following this work a detailed report was submitted to the 25 February Council meeting (doc # 4098687) which set out alternative models, their benefits, limitations and impacts. Mr Philips was provided copies of all this material and given opportunity to have input into the content. The report included a letter Mr Phillips provided setting out the irrigators’ position. Staff also sought legal advice with respect to some of the matters that were
76
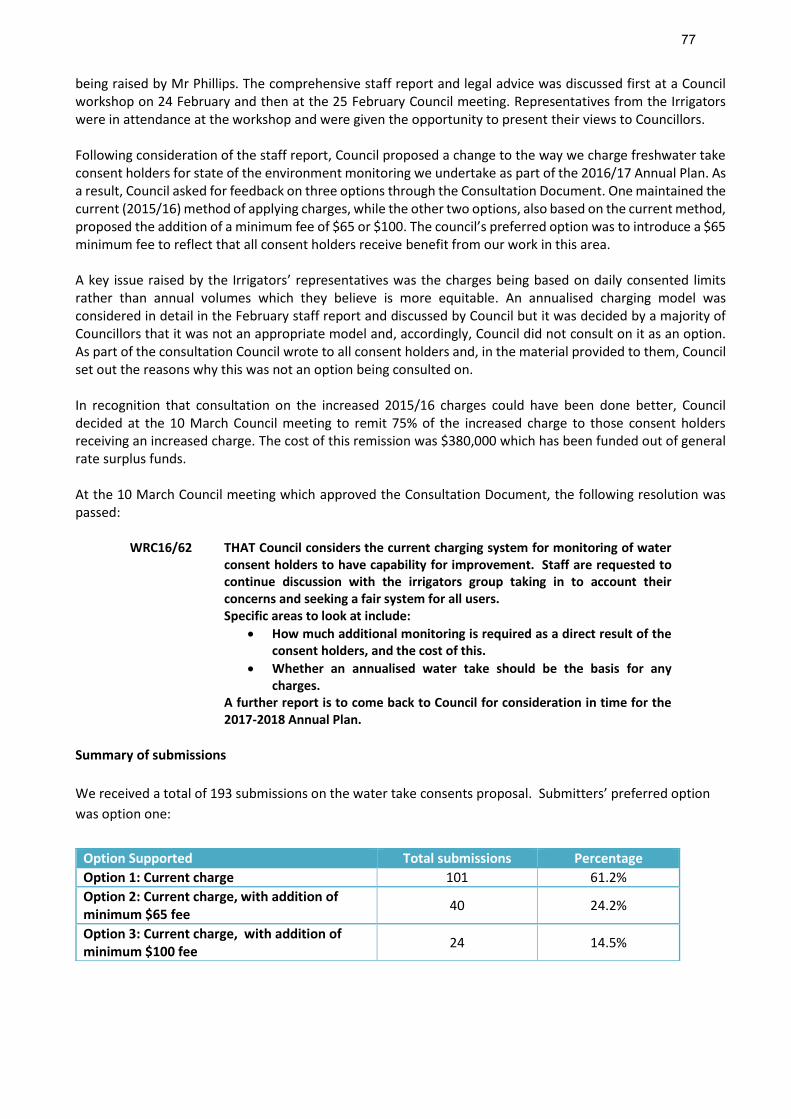
being raised by Mr Phillips. The comprehensive staff report and legal advice was discussed first at a Council workshop on 24 February and then at the 25 February Council meeting. Representatives from the Irrigators were in attendance at the workshop and were given the opportunity to present their views to Councillors. Following consideration of the staff report, Council proposed a change to the way we charge freshwater take consent holders for state of the environment monitoring we undertake as part of the 2016/17 Annual Plan. As a result, Council asked for feedback on three options through the Consultation Document. One maintained the current (2015/16) method of applying charges, while the other two options, also based on the current method, proposed the addition of a minimum fee of $65 or $100. The council’s preferred option was to introduce a $65 minimum fee to reflect that all consent holders receive benefit from our work in this area. A key issue raised by the Irrigators’ representatives was the charges being based on daily consented limits rather than annual volumes which they believe is more equitable. An annualised charging model was considered in detail in the February staff report and discussed by Council but it was decided by a majority of Councillors that it was not an appropriate model and, accordingly, Council did not consult on it as an option. As part of the consultation Council wrote to all consent holders and, in the material provided to them, Council set out the reasons why this was not an option being consulted on. In recognition that consultation on the increased 2015/16 charges could have been done better, Council decided at the 10 March Council meeting to remit 75% of the increased charge to those consent holders receiving an increased charge. The cost of this remission was $380,000 which has been funded out of general rate surplus funds. At the 10 March Council meeting which approved the Consultation Document, the following resolution was passed:
WRC16/62 THAT Council considers the current charging system for monitoring of water consent holders to have capability for improvement. Staff are requested to continue discussion with the irrigators group taking in to account their concerns and seeking a fair system for all users. Specific areas to look at include:
How much additional monitoring is required as a direct result of the consent holders, and the cost of this.
Whether an annualised water take should be the basis for any charges.
A further report is to come back to Council for consideration in time for the 2017-2018 Annual Plan.
Summary of submissions
We received a total of 193 submissions on the water take consents proposal. Submitters’ preferred option
was option one:
Option Supported Total submissions Percentage
Option 1: Current charge 101 61.2%
Option 2: Current charge, with addition of minimum $65 fee
40 24.2%
Option 3: Current charge, with addition of minimum $100 fee
24 14.5%
77

Common themes from submitters Many small (29) and large (17) consent holders stated our proposal is unfair. A total of 16 large consent holders favoured a fourth option based on an annualised allocation fee. Key reasons for supporting the proposal are noted in the table below:
Key reasons for NOT supporting the proposal are noted in the table below:
Key issues arising out of submission and hearings process
Summary of key issues raised by submitters and staff response
Charging should be based on annualised volumes not daily consented limits.
This matter has been dealt with in considerable detail in previous staff reports which explains why an Annualised Model is neither equitable nor practicable. To further assist Council’s consideration of this issue an independent economist consultant has assessed the options. Attached is his detailed report. His overall conclusion is that daily limits is a more appropriate basis for charging.
Are large consent holders paying very little or nothing?
No, large users are paying considerably more now than in 2014/15 – see para 1 below.
Should council adopt a charge model that produces a similar distribution in charges to the preferred model presented in paragraph 4c of the Joint submission (by DairyNZ, Federated Farmers, Horticulture NZ and Irrigation NZ)?
Yes, and WRC’s preferred daily fees option with $65 minimum charge achieves this – see para 5 below.
Is the Public:Private benefit and resulting charges inconsistent with other councils? (Joint submission HortNZ, Feds, IrrNZ DairyNZ)
No, charges are similar or less than other councils – see para 12 below.
What is the extra cost over and above what we would monitor/investigate just for water take monitoring/investigations?
Council’s monitoring costs are estimated at approximately $1.2 million – see para 21 below.
Does the net take approach result in major anomalies?
No – see para 22 below. The net take approach is of benefit to irrigators as it has made water available for them.
Themes # of submissions
Support for option 1 as options 2 & 3 are unfair for small consent holders 29
Current economic situation – users can’t afford to pay more 7
Should be separate rates for domestic and business use 2
Large users have more resources to afford an increase 3
Themes # of submissions
Prefer annual allocation 16
Maximum daily take model unfair for irrigators 9
Charging for water seen as wrong 7
Lack of communication/consultation 5
40:60 split disproportionate 3
A working group should be established to review proposal 3
78

Should the fees take account of reduced reliability of supply for irrigation takes?
No, Groundwater takes do not have reduced reliability. Most surface water irrigation takes are reduced on average each summer by only 6 days out of 120 or more days in the irrigation period – see para 28.
Should consent holders receive a discount for monitoring they undertake?
In part yes and this already applies – see para 30 below.
Has WRC used incorrect data, out of date data, and has no system for managing the data as raised by submitters?
No – see para 37 below.
Concern there is little transparency on what the charges go towards.
Staff consider this is identified in a number of council documents and plans – see para 44 below.
Concern that WRC monitoring and investigations do not focus on individual consent holders and are more focused on regional monitoring.
In part yes. However, this is also the primary purpose of the monitoring and investigations – see para 47 below.
Does WRC incorporate consent monitoring data into its database?
Yes – see para 49 below.
Does WRC use consent holders data? Yes – see para 50 below.
From the submission received do staff consider an alternative charging regime is more appropriate than the preferred option?
No. Information provided by the submitters including the joint submission have clarified that the model put forwards meets their view of an equitable approach.
A stakeholder group be formed with various representatives from the various groups of abstractive water users, with the purpose of agreeing the minimum charge, the non-consumptive charge and the rate per unit allocated including the allocation of any cap in order to finalise the WRC’s water take fee methodology.
Staff are supportive of forming a stakeholder working group but recommend this should not defer the implementation of the new charges for the 2016/17 year. The purpose of the group is to discuss key issues that water users are facing and as a forum for WRC to consult with and to keep the sector appropriately informed.
Are large consent holders paying too little?
1. No, very large consent holders are not paying too little. Very large holders are paying considerably more now than under the 2014/15 charges and are charged the maximum that can be justified based on their impact. Council has received legal advice from Mr Milne which identified that WRC would be at risk of judicial review if it imposed a larger charge than put forward under the three consulted options based on the daily charge.
2. The total charge for the 9 largest consent holders under the preferred method for 2016/17 is $205,000. This is equivalent to 19% of the total charge. The remaining nearly 4000 consents pay the other 81 percent. For the nine consent holders this is a 50% increase in charges from 2014/15.
79
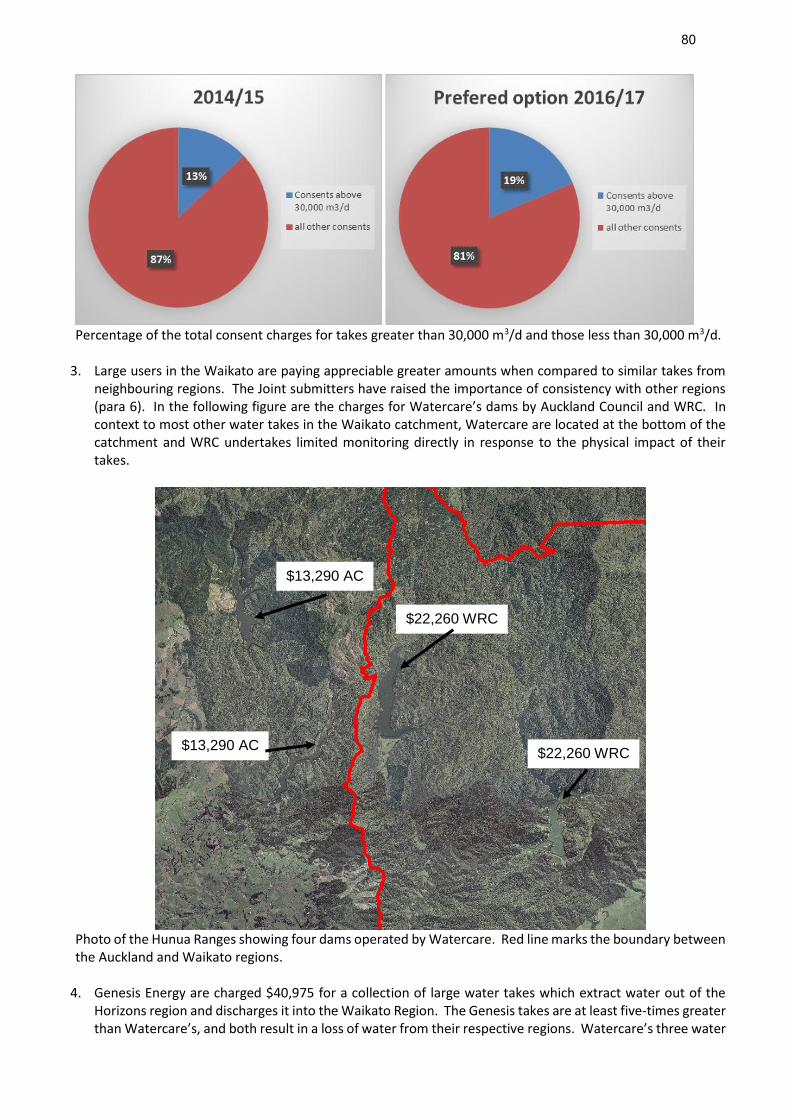
Percentage of the total consent charges for takes greater than 30,000 m3/d and those less than 30,000 m3/d.
3. Large users in the Waikato are paying appreciable greater amounts when compared to similar takes from neighbouring regions. The Joint submitters have raised the importance of consistency with other regions (para 6). In the following figure are the charges for Watercare’s dams by Auckland Council and WRC. In context to most other water takes in the Waikato catchment, Watercare are located at the bottom of the catchment and WRC undertakes limited monitoring directly in response to the physical impact of their takes.
Photo of the Hunua Ranges showing four dams operated by Watercare. Red line marks the boundary between the Auckland and Waikato regions.
4. Genesis Energy are charged $40,975 for a collection of large water takes which extract water out of the Horizons region and discharges it into the Waikato Region. The Genesis takes are at least five-times greater than Watercare’s, and both result in a loss of water from their respective regions. Watercare’s three water
$22,260 WRC
$22,260 WRC
$13,290 AC
$13,290 AC
80

takes would pay $70,020 under council’s preferred option for 2016/17 which is nearly double that for the much larger takes from Horizons.
Should council adopt a charge model that produces a similar distribution in charges to the preferred model presented in paragraph 4c of the Joint submission (by DairyNZ, Federated Farmers, Horticulture NZ and Irrigation NZ)?
5. The Joint submission presents a hybrid model (model 4) for charges which they consider is more equitable. They consider it is more equitable as it spreads the cost across the small and large users. I have inserted their diagram below and circled their preferred option for reference.
6. However, the joint submission does make an error in their paragraph 4 where they state that the figure presents the options being consulted on by WRC (models 1, 2 & 3). The figure does not present the models in the consultation document and presents an alternative range of 5 annualised models. As a result the figure cannot be relied on to make comparisons between the joint submitters preferred approach (model 4) and those put out for consultation by council. Further issues and correction to the model are presented in Appendix A of this report.
7. To correct for this mistake I have taken the joint submitters preferred model 4 (circled above) and compared it to the preferred approach (daily fee with $65 minimum) being put forward by council for 2016/17. This is shown in the following figure where the joint submitter’s most equitable approach, model 4, is shown by the blue bars. Next to this for comparison is the council’s preferred daily charge option with minimum of $65 (red bars). As can be seen the two approaches are virtually identical.
8. Based on this comparison staff continue to recommend the adoption of the daily approach with a minimum charge of $65 (red bars). The daily model is shown to match the equitable expectations of the joint submitters.
81
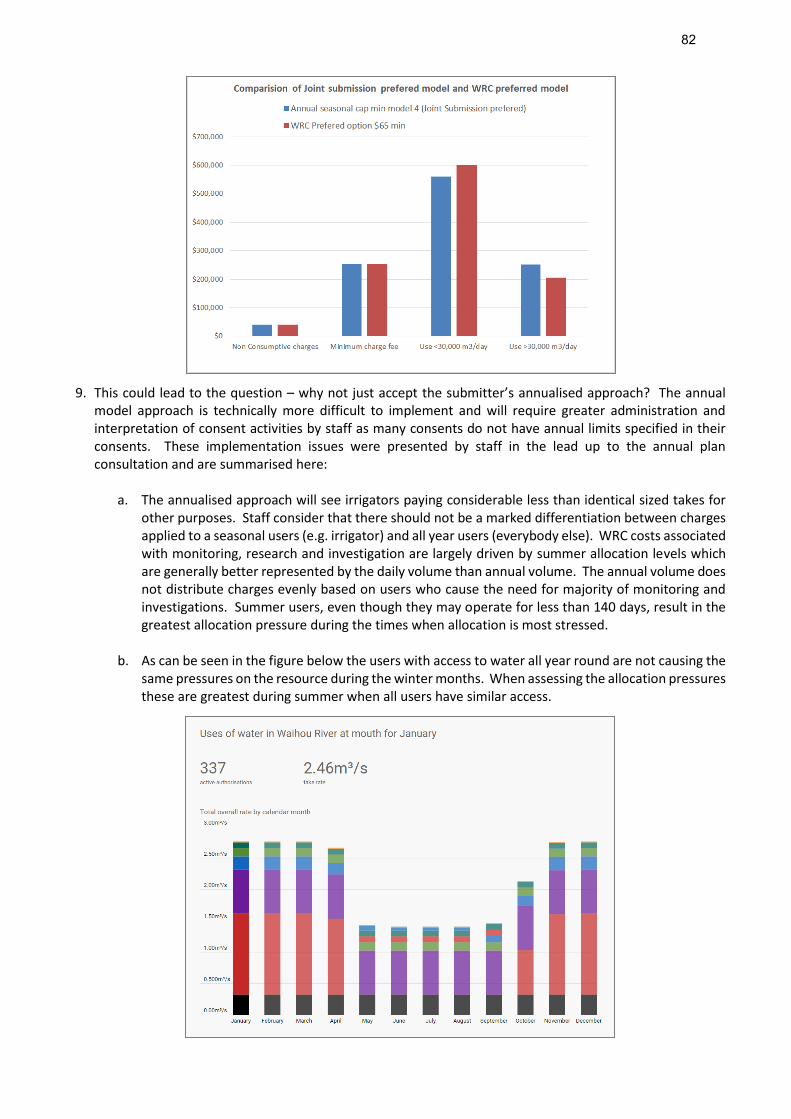
9. This could lead to the question – why not just accept the submitter’s annualised approach? The annual model approach is technically more difficult to implement and will require greater administration and interpretation of consent activities by staff as many consents do not have annual limits specified in their consents. These implementation issues were presented by staff in the lead up to the annual plan consultation and are summarised here:
a. The annualised approach will see irrigators paying considerable less than identical sized takes for other purposes. Staff consider that there should not be a marked differentiation between charges applied to a seasonal users (e.g. irrigator) and all year users (everybody else). WRC costs associated with monitoring, research and investigation are largely driven by summer allocation levels which are generally better represented by the daily volume than annual volume. The annual volume does not distribute charges evenly based on users who cause the need for majority of monitoring and investigations. Summer users, even though they may operate for less than 140 days, result in the greatest allocation pressure during the times when allocation is most stressed.
b. As can be seen in the figure below the users with access to water all year round are not causing the same pressures on the resource during the winter months. When assessing the allocation pressures these are greatest during summer when all users have similar access.
82

c. Staff consider that even if the annual approach was supported it would be difficult to implement due to incomplete data. Up to 45% of all water take consents do not have a specified seasonal or annual limit. Any annual based charge for irrigation / frost protection consents would need to be inferred. Inferred rates would also need to be considered for other sectors where takes may not be exercised uniformly over the year. This may even apply to consents with an annual limit but it is not an accurate indication of when they take water. The daily approaches in the 2016/17 Annual Plan utilises the most readily available and complete consent information – being daily volume. Nearly all consents have a daily limit specified in their consent certificates.
d. Consents with extreme seasonality, e.g. only operate for a few days/weeks each year, can apply for a remission under the current system and proposed system for 2016/17.
e. Mr Phillips considers that the charges should be based on an annual consent limit as this is what he considers council intended when it used the term ‘volume’. Staff do not support Mr Phillips interpretation. To this end, Council has received legal advice from Mr Milne, that councillors were presented in the Annual Plan workshop and Council meeting, that this is not the case. Mr Milne confirmed that the charges can be based on the daily limit as presented by staff.
10. Staff have also sought external independent advice from Insight Economics whether charges should be
based on annual or daily limits. In their review Insight Economics received all council reports, consent data and interviewed Mr Keenan of Horticulture NZ. Insight Economics recommend “that charges be set on the basis of the daily limits, not annual limits, as these provide a better match with contributions to peak summer demand. Where anomalies do arise, however, I suggest that these continue to be addressed via the remission scheme.”
11. In summary, the joint submitters have presented what they consider to be an equitable distribution of charges across the different sizes of take. As discussed above the preferred option put forward by council with minimum charge of $65 achieves this and is largely identical to the joint submitters.
Is the Public:Private benefit and resulting charges inconsistent with other councils? (Joint submission HortNZ, Feds, IrrNZ DairyNZ)
12. The charge a consent may receive is largely driven by the total cost of services and then the split between private and public. This then results in a charge per cubic meter of water.
13. WRC provides a high level of service; for water allocation we are ahead of most councils on implementing the government requirements under the National Policy Statement on Freshwater, including tools for efficient allocation, setting limits etc. Many other councils still need to change their plans to be NPS compliant (similar to what WRC is going through for the Healthy River Plan Change). Once other councils have been through this process they will likely need to amend their charges as WRC has.
14. Having said that we are further advanced in implementing water allocation measures, one might expect WRC charges to then be considerably greater than those of other councils especially due to our 60:40 public: private split across all monitoring. This is not the case – see figure below. Council charges are within 10% of Horizons and Bay of Plenty and are nearly half that for Auckland. Even though we require consent holders to pay a slightly greater portion of our total monitoring/investigation charge the resulting cost per individual is similar to or less than other neighbouring regions. This funding split was based on a detailed assessment of the state of the environment monitoring programme, and identification of the beneficiaries / contributors for that work through the 2012 LTP process. This overall funding allocation was approved by the council at that time, and has been applied consistently through subsequent annual plans. The overall SOE recovery ratio is 60:40 with individual activity budgets funded based on the private/public benefit assessment.
83

15. Attached in Appendix E is late information received from submitters comparing regional council recovery ratios taken from a 2013 report prepared by Greater Wellington Regional Council. When considering this information Councillors need to be aware of the points made in para’s 13 and 14.
Notes: 1 charge for special areas - e.g. equivalent Pukekohe aquifers managed by WRC 2 BoP average of separate groundwater and surface water charges assume take of 4000 m3/d
16. Many irrigators source water from the Kaawa groundwater aquifer under Pukekohe. This aquifer extends under both the Auckland and Waikato regions. For a take of 4500 m3/d this would be a fee of $3690 if the irrigator was in the Auckland region, but an identical activity from the same aquifer in the Waikato region would have a fee of $1980 – see figure below.
Red line is the regional boundary between Auckland and the Waikato at Pukekohe. Shown are the relative charges for an identical activity taking water from the same aquifer.
Water take from WRC for irrigating 4500 m3/d would be $1980 (based on $0.44 / m3)
Water take from AC for irrigating 4500 m3/d would be $3690 (based on $0.82 / m3)
84

17. For comparison, a take of 1001 m3/d under the 2014/15 WRC charges was paying $0.70 per cubic metre. When compared to other councils this was much higher. Whereas large irrigation takes, such as operated by many of the submitters, were only paying less than $0.15 per cubic metre. This is about a third of the cost in any of the other regions. Under the 2014/15 charges the moderate to large sized irrigation takes were being discounted and subsidised by the smaller water takes. This irregularity is removed from the daily consent charge models presented for 2016/17.
18. I note that HBRC split starts at 65:35 not 70:30 as presented by the Joint Submitters. In addition there is an additional flat fee of $115 for low flow monitoring and then “Should all of the fixed charges not be adequate to recover the actual and reasonable costs associated with the entire low flow monitoring programme, an additional charge shall be added to all consents that are subject to the above low flow fixed charge, to recover the actual and reasonable costs incurred.” As a result there is no certainty from year to year what a consent holder’s total charge will be. (Source: http://www.hbrc.govt.nz/assets/Document-
Library/Guides/Consents-Charges.pdf). For the 2016/17 financial year HBRC will recover from consent holders $1,487,000. This compares to $1,060,000 by WRC for 2016/17 noting that $1,175,000 is funded by General Rate.
19. In this regard I consider the council’s 60:40 split for all environmental monitoring is reasonable and relatively consistent with the split of other councils especially when taking into account the resulting charge an individual receives.
What is the extra cost over and above what we would monitor/investigate just for water take monitoring/investigations?
20. The following is a breakdown of the projects which would not be undertaken if there were no water takes, or just small water takes existed. The savings listed would be ongoing until at least 2025 for all of the work listed below:
a. WRC would not need a detailed approach to water allocation as required in chapters 3.3 and 3.4
of Regional Plan. The full Variation 6 implementation budget of $617k could be saved. This would be an ongoing saving as this work would continue until at least 2023. In summary this covers setting of allocation limits, aquifer investigations, maintain the water allocation calculator, purchasing monitoring equipment, developing irrigation water demand guidelines etc.
b. WRC would not need the Pressure analysis project. There would be no need to manage and analyse water meter records. No reporting to government on the actual use versus consented. The full Pressure analysis budget of $203k could be saved.
c. Flow regimes surface water and groundwater and Hydrological regimes – WRC would maintain most stream flow monitoring sites for flood purposes and to support the water quality network. While most sites would remain open we would be able to operate them at a much reduced cost due to less frequent visits (reduction from approx. 12 to 4 times per year) and installation of less expensive instruments. For example there would be very limited change to the monitoring network in the lower Waikato River with or without Watercare’s takes. The sites were initially installed for flood management and Watercare operates its own flow monitoring site below the dams. With no water takes we could close nearly all the groundwater level monitoring network which was enhanced in recent years. Approximate saving of $400k from $1.34 million.
d. Across all of these projects the savings are not just related to maintaining monitoring sites, equipment and data management but also due to reduced staffing and associated overheads. For example staff would not be needed for understanding water allocation issues, providing supporting for policy development, reporting to government and council. Without water takes there would not be the probing water allocation questions which need to be answered.
85

21. Total saving in excess of $1.2 million if there were no water takes or just small water takes existed. Does the net take approach result in major anomalies?
22. Staff consider the net take approach is appropriate and does not result in major anomalies. In general, all the charges for monitoring and investigation are focussed towards understanding what happens when water is removed from a stream or aquifer and is no longer available for others (including the streams and aquifers) to use. Non-consumptive takes (zero net take) have a considerably reduced charge as they do not remove water in a way that makes it unavailable for others. They have no little or impact on the level of catchment allocation stress.
23. What monitoring network would WRC have if all takes were non-consumptive? I consider it would be very similar to the network described above for the scenario if there were no water takes. That is they can operate largely without changing the amount of water flowing in the rivers and streams and council can considerably reduce its work.
24. The net take approach has been well considered and was introduced into the Regional Plan largely to the benefit of irrigators. Prior to the introduction of the net take approach the Waikato catchment was deemed fully allocated in 2006 with irrigation consents being declined in consent hearings. This was based on legal views that Huntly Power Station along with other non-consumptive consents were allocated all the water available to be allocated. As the rules at the time did not allow for the offsetting of the discharge associated with these takes the catchment had to be treated as being fully allocated. This did not make practical sense as these users did not consume water and did not reduce the availability for anybody downstream of their discharge from using the water. As a result the net take approach was introduced and has enabled further allocation of water. Irrigation consents have been the key beneficiary of this net take approach due to the new availability of water. It stops WRC locking up allocation on paper.
25. Staff consider Carter Holt Harvey’s surface water takes should be treated as a zero net take. And in doing so it actually has a considerable positive impact on irrigation consents. CHH do take a considerable amount of water from both groundwater and surface water. However, all the water is discharged back to the Waikato River. As a result, on the Waikato River main-stem CHH have no impact on availability of water. Only the Pokaiwhenua River has reduced flow and compared to consumptive takes it does not impact the rest of the Waikato catchment due to the return of the water to the Waikato River. If CHH is treated as a consumptive take the impact would be that water would need to be taken away from other consents who have benefited from CHH non-consumptive assessment. If treated as consumptive this would be the equivalent of 45 large irrigation consents that would need to be declined or removed from the existing allocation. Staff do not recommend this approach as the CHH takes are not having a physical impact on water availability across the greater Waikato catchment. Furthermore, WRC undertakes no flow monitoring on the Pokaiwhenua, this is undertaken in two locations by CHH and MRP. CHH undertake detailed ecological studies of the Pokaiwhenua. Their groundwater consent is treated as being consumptive as no water is returned to the aquifer and a full charge is applied.
26. Geothermal drilling consents are treated as zero net take due to their intermittent use and much of the water is recirculated via surface seepage dams. Not for the reason given by Mr Phillips at the hearings. Many of these drilling activities are consented over many years but may only operate for only a few weeks each year. If they were treated as being consumptive this would imply they are operating throughout most of the summer or year and make that water unavailable to be allocated to others. The non-consumptive approach has increased the allocation efficiency of the catchment making more water able to be allocated to other consent holders. It stops WRC locking up allocation on paper.
27. Council has been presented legal advice on changing from a net take to gross take by Mr Milne (Report to Council 18 February 2016). It is repeated here:
86
“You have further advised that you are being lobbied to return to the use of gross take allocation rates rather than net take rates when assessing the charge to the large users. The net take approach contras the matching discharge against the volume of the take because the discharge contributes to the allocable flow available to downstream users. The Variation 6 process demonstrated that the net take approach is sensible and defensible. If Council were to change to the gross take approach then I note that you consider that very large users would pay a disproportionately large amount of the total monitoring charge compared to the Council monitoring related to their activities. Clearly that would place your Council at risk of challenge by way of judicial review. Again, my advice is that your Council should not agree to the proposed change.”
Should the fees take account of reduced reliability of supply for irrigation takes?
28. Staff consider the fees should not provide a discount for reduced reliability. This is based on:
a. 20% of irrigation takes source their water from groundwater and there is no reduced reliability. Variation 6 affords 100% reliability for groundwater takes.
b. Of the remaining surface water takes the majority are allocated water from the primary allocable flow. This has the highest level of reliability. As a result these takes on average will only be restricted for less than 6 days per annum out of a possible 120 days they are usually consented to operate. In reality a holder will have many years without any restrictions at all and then may have a month or so restricted in a single year. In these rare years the consents are reduced and not fully cut off. The degree of restrictions are likely to be less than this as it is based on all takes operating at 100% capacity. The reality is, from reviewing water use records, this does not happen and is often around 60% capacity.
c. Many consents on the Waikato River will have even less likelihood of restrictions due to the way Mighty River Power operates their non-consumptive take and discharge of water from Lake Taupo and Karapiro Dam. MRP tend to operate the hydro system conservatively and artificially keep flows above the natural minimums which results in less restrictions for other users. For example for the recent dry summers, some with the lowest rainfall for 100 years, MRP kept the flow above the minimum and none of the users from the Waikato River main stem were restricted.
29. From the independent review by Insight Economics they comment “data provided to me by the Council
shows that such restrictions are fairly infrequent, and average only 6 days per year. Given the significant complexity involved with adjusting the charges on this basis, I do not consider the issue material enough to warrant further consideration.”
Should consent holders receive a discount for monitoring they undertake?
30. Staff consider a discount should not apply where it relates to consent holders providing data on how much water they have used – the reading of the water meter. Consent fees are already set taking into account that water meter reading would be undertaken by consent holders and as such the budgets are not set on the basis that WRC would be doing it.
31. Staff consider a discount could apply if the monitoring of river flow or groundwater level removes an existing burden/cost away from council. That is the consent holder is doing something the council would have otherwise done and now does not need to. However, often the level of monitoring by a consent holder does not reduce the level of monitoring that WRC is required to undertake.
32. In some situations where the river flow or groundwater level monitoring contributes to the wider
understanding of water allocation issues and pressures a discount could be applied for under the current
87

and proposed charging regime. Only one other council specifies the remission which is up to a maximum for 10% of the charge. This low level of discount indicates that most monitoring by consent holders does not usually result in the council being able to reduce the work it does, and the consideration that consent holders only pay 40% of the total costs for all environmental monitoring, implemented as a direct result of consent activities, with the remainder subsidised by general rates. For Mr Phillip’s example of Mr Miers installation of his weir it does not mean WRC can close any other sites in the Waikato River catchment. And when WRC is assessing the cumulative impact of Mr Miers and other takes on the Waikato River it relies on these other sites which Mr Miers and others contribute towards.
33. The Joint submission (para 11) requests a stakeholder group is formed to either change a person’s condition in relation to monitoring or a credit being attributed to the consent holder’s water take fee. A credit can be applied for at this very time via the existing remission process. Furthermore, if the reason for the remission is likely to continue for the life of the consent, rather than just one year, this can be accounted for at this time with a permanent remission. This is the approach already in place by WRC and provided for in the consent database – see below:
34. In addition all consents contain review clauses which enable the applicant to reduce their monitoring burden if it can be demonstrated that it is no longer needed.
35. Insight Economics’ independent review commented that Council could adopt a formal policy to address monitoring carried out by consent holders. By adopting such a policy, all parties can be clear about whether, and how, research commissioned by consent holders will be used to defray the charges.
36. I also note that in the coming financial year the environmental monitoring team is undertaking a review of its surface water flow monitoring network to see how it can better provide for consent holders, ecological and water quality monitoring, and flood management. The aim is to minimise the need for consent holders to undertake their own monitoring while remaining within the set monitoring budget.
Has WRC used incorrect data, out of date data, and has no system for managing the data as raised by submitters?
37. No, staff have not used or relied upon incorrect data or out of date data.
38. All water allocation data is entered in IRIS. IRIS is a consent database utilised by six regional councils. IRIS manages consent information to ensure that only active consents for a relevant financial year are identified and charges applied. When consents expire, lapse or are surrendered a charge would no longer apply. IRIS is linked to the financial system to enable part year charges to be applied when a consent is only active for part of a financial year.
39. Human error will result in the occasional incorrect value being entered in IRIS. When identified this is corrected. A number of quality assurance checks are regularly run to identify errors.
40. No errors have been identified in the process of setting the consent charges that would have changed the information presented or the recommendations made by staff. On a number of occasions since December
88

2015 Mr Phillips has contacted staff with concerns and the very large majority did not require correction or modification of the data. The latest of these was on the 3rd of May 2016 where Mr Phillips had concerns with 71 consents not being included in the information used by staff. This was found to not be the case.
41. Mr Phillips on behalf of Mark Miers has submitted that staff presented incorrect data for 20 consent holders and he provided a revised chart (reproduced below). Mr Phillips highlighted eight consent holders where he considered WRC used incorrect data and under represented the increase in charges likely to apply (shown by Mr Phillips with red font in the 5th column). For example Mr Phillips calculated a 144% increase for Wairakei Pastoral when in fact it is a 30% increase. Mr Phillips asks “are the figures correct?”. Yes they are, staff have not used incorrect data or made a mistake with the chart presented. I have reviewed calculations provided by Mr Phillips and these show that Mr Phillips has incorrectly double accounting 69 of the largest consents in his work. This double accounting by Mr Phillips incorrectly inflates the increase in charges from 2014/15 to 2015/16 by nearly $200,000 across these eight consent holders. Mr Phillip’s calculations excessively overstate and misrepresent the impact of the proposed charges for the 2015/16 year.
42. Mr Phillips raised “alarms bells” in relation to the following figure. He consider is was impossible for the 15 consent to receive greater than $10,000 reduction in fees. What Mr Phillips failed to note was that the 15 relates to the count of consent holders and each consent holder may have more than one consent receiving a reduction. Hence the total reduction across more than one consent can add up to more than $10,000 for an individual holder. This also applies to the other end of the figure where three consent holders receive an increase of more than $10,000.
89

43. Concern there is little transparency on what the charges go towards.
44. Many of the tasks undertaken (summarised below) by staff are outlined in the methods section of Chapters 3.3 and 3.4 of the Regional Plan. I have included these in Appendix B to this document.
45. Further to this additional tasks are also included in the National Policy Statement on Freshwater 2014 – given in Appendix C. Many of these tasks are ongoing and are not consent or catchment specific but apply across the region. For example tasks relating to water allocation efficiency can be applied to all consents holders.
46. Staff consider there is opportunity through a working group to keep the community better informed of council projects being undertaken to implement Variation 6. This could include the sharing of information on the hydrology network review, setting of criteria for remissions and being better informed on the projects being undertaken by council. The working group should not change the projects being undertaken as these have been set through a highly collaborative process through council hearings, workshops, mediation and Environment Court involving a much broader group of water users than are represented in these Annual Plan submissions.
Concern that WRC monitoring and investigations do not focus on individual consent holders and are more focused on regional monitoring.
47. This is correct, in part. The charges do not often relate to specific activities where staff are visiting each consent holder or undertaking specific studies directly downstream of an individual’s take. But this is not to say individuals don’t receive benefit from this work. This includes protecting existing users’ rights to water if they are being eroded by new applications. Further the suite of work council undertakes is not just to provide benefit back to the consent holder. It also includes work Council is required to do to manage the cumulative impacts consent holders have on the environment.
48. Summary of main work areas: o Setting of limits – Recent work in the Waihou and Piako catchments as per Table 3-4A of Regional Plan
and NPS Freshwater Management 2014. This work has required four years of focused field investigations to understand how much more water can be allocated without impacting water quality. This work to date has been presented to the Environment Performance Committee in 2015 and is now waiting to be scheduled into start the First Schedule Process. Without this work individual consent
90

holders would need to undertake these investigation when they come to renew their consents. The work also enables new consent holders to be able to be allocated water from within the limits without also undertaking this work.
o Irrigation efficiency work Method 3.4.5.3. – To set amounts of water needed for different irrigation
purposes and crops. This was undertaken by WRC with supported by HortNZ (in staff and growers time) and additional funding was received from MPI. This work identified that a large number of consent holders were applying for more water than was needed for their purpose and these guidelines enable this water to be made available to others. I note that Irrigation NZ were invited to join the project but choose not to. The work involved field monitoring of irrigation activities at 6 locations for four summers. Recently this work has been update to take account of the recent dry summers to ensure the guidelines are providing adequate water. Further work involves developing a web tool to enable irrigators to use it to plan their irrigation activity to minimise inefficient use and reduce leaching of nutrients beyond the root zone.
o Development of an irrigation calculator in 2006 which requires continual updating from the IRIS
consent database. It has also been upgraded to provide an understanding of the water pressure for each month of the year so as to identify further allocation options. This was made available on the WRC website this year. Further improvements will be required to meet the NPS Freshwater Management requirements. Water accounting protects existing users from new users eroding their access to water.
o Permitted use calculator is run regularly to keep track of how much water is likely to be used by
unconsented activities. Such as those enabled by our permitted rules or for stock drinking.
o Investigations into complaints when consent holders bores run dry and they apportion blame upon other nearby users or activities.
o Water use data from water meters is made available for water user groups, for example I recently
meet with DairyNZ in regards to the project referred to in paragraph 14 of the joint submission. In this instance we provided flow and water use data for this project and have offered staff time. The provision of data enables water users groups and organisations to optimise the water used by their sector to get further gains and economic growth. Much work is undertaken by council to enable this huge volume of data to be readily available and useable. That is the conversion of records written on paper into electronic form. Checking and correction of errors or tracking down missing records.
o WRC is nearing completion of an aquifer surface water model for the Pukekawa aquifer in the Lower
Waikato. This investigation relies heavily on reviewing of consent holder’s water use records, groundwater levels and stream flow monitoring by WRC. This aquifer is nearly exclusively utilised for horticultural irrigation. I note these groundwater takes have 100% access reliability with no summertime restrictions. This work is similar to that raised in paragraph 15 of the joint submission. Without this work default allocation limits would apply to this aquifer and the level of existing allocation would need to be reduced. This work provides protection for the irrigators.
o All aquifers in the region need to be assessed for setting limits as listed in Table 3-6 of the Regional
Plan and required under the NPSFM 2014.
o Purchasing of monitoring equipment including dissolved oxygen sensors which start at $5,000 each. Investigations in the Waihou and Piako required up to 12 of these deployed at any one time. These were purchased solely for water allocation investigations to understand what the cumulative effect of water takes in on the availability of oxygen in the water.
91

Does WRC incorporate consent monitoring data into its database?
49. Yes WRC does incorporate all readily available data. The following is an example of groundwater level and water use data for Miers.
Does WRC use consent holders data?
50. Yes WRC uses consent water use data for purposes other than regulatory compliance. The following are some examples of its use:
a. Enquires. A much asked question is how much water is actually used? This simple question relies on
considerable analysis by WRC staff of these records. This may be in reference to a sector (e.g. agriculture) or by catchment area (e.g. how much water is used for different purposes in the Waihou catchment).
b. To support trading to increase the number of consent holder able to access water
c. Water use data is reported on the Councils and Ministry for the Environment website LAWA (Land and Water Aotearoa).
http://www.lawa.org.nz/explore-data/waikato-region/water-quantity/
Time t01/10/2009 01/10/2010 01/10/2011 01/10/2012 01/10/2013 01/10/2014 01/10/2015
Volu
me -
wate
r use [
m³]
0
20000
40000
60000
80000
Bores (Waikato Regio / Meirs M & L (Production Bore) / VolWU / 30 - MonthTotal
92

d. Supporting water user groups as per recent meeting with Irrigation New Zealand (including presenters to this hearing) for a potential water user group of horticultural growers in the Pukekohe area.
e. Naturalising of low flow statistics which makes more water available for consent holders – Recent assessment finished for the Waihou and Piako catchments. Next will be the Waikato catchment. Implements Method 3.3.4.8. WRP.
f. Included in groundwater models used for setting limits and assessing the impact of groundwater takes. Model is nearing completion for the highly utilise Pukekawa aquifer.
g. Used to give understanding and context to changes in groundwater levels being monitored. In one situation declining groundwater levels were considered to be from aquifer overuse. However, an assessment of water take data showed this to not be the case and the declines could be relate to changes in the rainfall pattern. Without WRC using the water use data an unnecessary restriction on further allocation could have occurred restricting economic growth.
Ed Brown Manager, Environmental Monitoring
Mike Garrett Chief Financial Officer
Appendix A - Errors in graphing of Joint Submitters Model 4 Appendix B - Transparency about what council will do as specified in Regional Plan Appendix C - Transparency about what council will do as specified in NPS Freshwater 2014 Appendix D - Reference to Hearings Pack Appendix E - Further information from Environmental Management Solutions Ltd (Submitter) Attachments Insight Economics Water Charges Review (Doc #6209735)
93

Appendix A - Errors in graphing of Joint submitters Model 4. I do not recommend the adoption of the Annual Seasonal Cap Min Model 4 as provided in the joint submission. The model as presented in the joint submission, and which relies on data I have developed, has been incorrectly graphed by the submitters. For the use exceeding 30,000 m3/day the graph (orange bars) only apportions the part of the charge at the reduced cost per cubic metre. Much of the large user’s costs is incorrectly apportioned within the grey bar representing the smaller users. As such it incorrectly under represents the amount of charge the large users would get. For model 4 the orange bars should be twice as large as shown and the grey bar smaller. The actual distribution of model 4 is presented below. The ‘corrected’ distribution results in a near doublings of the charge apportioned to the large users which was not supported by staff throughout this process and also does not meet the equity principles put forward by the joint submitters based on their graphical presentation of an equitable approach.
Furthermore, the model 4 presented in the joint submission is not the same Model 4 as presented in the process leading up to the annual plans. It uses different costs per cubic meter of charge.
Double the charge applied to 9 consent holders
94

Appendix B - Transparency about what council will do as specified in Regional Plan
3.3.4 Implementation Methods – Water Takes
3.3.4.1 Environmental Education
(Method to implement Section 3.3.3 Policies 8 and 9)
The Waikato Regional Council will through ongoing environmental education programmes:
a) encourage the use of alternative water resources where there is over allocation
b) encourage consent holders to review their current water takes to ensure water use is still required and their use of water is efficient (see Chapter 3.4 of this Plan)
c) inform landowners and water users about the in-stream and groundwater values that need to be considered when assessing water take applications
d) inform the community about water management and allocation as contained in the Variation. The implications for all water users will be identified.
3.3.4.3 Water User Groups/Voluntary Agreements
(Method to implement Section 3.3.3 Policies 17, 18, 19 and 21)
The Waikato Regional Council will, in order to assist and support the community to understand water management and allocation as an essential element of restoring and protecting water bodies:
a) promote water user groups, or voluntary agreements between water users, to schedule takes and manage allocations.
b) initiate and support water user groups to assist with allocations during times of restrictions or when the catchment is fully or over allocated.
c) provide, where available, accurate technical information on which user groups can make decisions.
The Waikato Regional Council will further investigate how water user groups can be used to:
a) assist with management of water allocated to abstractors;
b) provide opportunities for shared investment in, and optimal use of water transport and storage infrastructure;
make best use of available water.
3.3.4.4 Estimating Permitted Takes and s14(3)(b) Takes
(Method to implement Section 3.3.3 Policies 8 and 9)
In order to accurately assess the level of permitted takes and water takes for reasonable stock and domestic needs (s14(3)(b) of the RMA), the Waikato Regional Council will maintain a model to estimate the level of permitted takes. In consultation with stakeholders the Waikato Regional Council will also undertake audits of actual use in selected areas to coincide with relevant catchment investigation dates.
3.3.4.5 Investigations
(Method to implement Section 3.3.3 Policy 4)
The Waikato Regional Council will continue to monitor aquifers and surface waters to ensure water use is sustainable and in areas of high use will develop sustainable yield limits and allocable flows. The council will develop means of making water allocation information readily available to the public.
95

3.3.4.6 Development of Minimum and Allocable Flows for Surface Water Bodies and Sustainable Yields for Aquifers
(Method to implement Section 3.3.3 Policies 1, 2, 3 and 4)
In determining allocable flows, minimum flows and sustainable yields, the Waikato Regional Council will:
a) Work with its iwi co-management partners and make use of a variety of recognised assessment methods as appropriate to the particular conditions, including maatauranga Maaori. In determining which combination of technical methods is most appropriate, guidance will be taken from any Integrated River Management Plan, any relevant planning document recognised by an iwi authority and lodged with the Council to the extent that its content has a bearing on water allocation, and the Ministry for the Environment – Environmental Flow Guidelines for Instream Values May 1998, or any subsequent update
b) Consult with key affected parties including tangata whenua representatives, existing consent holders, domestic or municipal suppliers, Fish and Game New Zealand, Department of Conservation, industry organisations and local area water user groups.
All new entries into Tables 3-5 and 3-6 will be included by way of a Plan Change under the First Schedule of the RMA.
3.3.4.8 Assessment of hydrological flow statistics for water allocation
(Method to implement Section 3.3.3 Policy 1)
The Waikato Regional Council will maintain a technical report detailing the calculation of flow statistics used for water allocation at key flow recorder sites in the Region, including methods to remove the influence of existing surface water takes. In the Waikato River catchment upstream of the Karapiro Dam this includes the Council developing a model to remove the influence of the eight Waikato River hydro-generation dams, the Lake Taupo outlet gates and the Tongariro Power Scheme on the hydrology of the catchment for implementing Standard 3.3.4.27 f). The model shall be independently peer reviewed.
The flow statistics in the technical report will typically be reassessed five yearly, unless there are any significant changes to the flow regime in which case the technical report will be reassessed as soon as practical thereafter. The technical report will be published on the Waikato Regional Council website.
Advisory Note:
The Council will make available to stakeholders a peer review of the model described in this method and the results of periodic reviews of the data used in this model.
3.3.4.9 Review Allocable Flows/Sustainable Yields
(Method to implement Section 3.3.3 Policy 1)
Waikato Regional Council will review minimum flows and primary and secondary allocable flows of surface water or the Sustainable Yields in aquifers when:
a) Targets and measures are incorporated into either the Vision and Strategy for the Waikato River promulgated under the Waikato River Co-management framework or the regional plan; or
b) Investigations indicate that the matters listed in Section 3.3.3 Policies 1 and 4 cannot be provided for at current minimum or allocable flows; or
96

c) Investigations indicate that the matters listed in either Policy 1 or 4 can be provided for at a different level of allocation than allowed for in either Table 3-5 or 3-6 respectively and that no adverse effects that are more than minor will occur; or
d) The allocation reaches or exceeds 70 percent of the primary allocable flow for catchments listed as “all other catchments” in Table 3-5; or
e) The allocation reaches or exceeds 70 percent of Management Level listed in Table 3-6; or
f) Actual or potential adverse effects are occurring within a catchment due to high demand for surface or groundwater or when tangata whenua values as noted in Section 3.3.3 Policies 1 and 4 are shown to be adversely affected; or
g) Investigations indicate that climate change is affecting surface water flows and sustainable yields in groundwater; or
h) Investigations demonstrate that there are significant improvements in water quality which could enable more water to be allocated for out of stream uses; or
i) Investigations indicate that the matters listed in Section 3.3.3 Policies 1 and 4 cannot be provided for at current minimum flows and primary and secondary allocable flows; or
j) Catchment investigation date listed in Table 3-4A occurs; or
k) Any significant changes to the inflow regime that occur in relation to the Waikato River catchment upstream of Karapiro Dam.
Table 3-4A Catchment Investigation Dates
Note:
Refer to water allocation maps ‘Catchment Investigation Dates’.
Catchment or Sub-Region Catchment Investigation Date - and on each 15th anniversary thereafter
Coromandel Peninsula (from the Waihou Catchment north) 1 July 2010
Waihou River including the sections of the streams which have their headwaters in the Waikato Region and their mouth in Bay of Plenty Region
1 July 2012
Piako River and all catchments flowing to the Firth of Thames along the Hunua and Hapuakohe Ranges
1 July 2014
West Coast (From Taranaki regional boundary to Auckland regional boundary excluding the Waikato Catchment)
1 July 2015
Waikato River (1) - Lake Taupo catchment above Huka Falls 1 July 2016
Waikato River (2) - Huka Falls to Karapiro Dam 1 July 2017
Waikato River (3) - Karapiro Dam to Ngaruawahia at confluence of Waipa (including the Waipa River)
1 July 2019
Waikato River (4) - Ngaruawahia at confluence of Waipa (excluding the Waipa River) to Mercer Bridge
1 July 2021
Waikato River (5) - Mercer Bridge to Waikato River Mouth 1 July 2023
97
3.4.4 Implementation Methods – Transfer of Water Take Permits
3.4.4.1 Environmental Education
(Method to implement Section 3.4.3 Policy 3)
Waikato Regional Council will, through environmental education programmes, raise the awareness of the community about transferring water permits by undertaking the following:
1. Providing information about the process for the transfer of permits between resource users
2. Providing educational material promoting the efficient use and conservation of water to minimise waste discharges
3. Providing information on the positive benefits to be derived from the efficient use of water.
3.4.5 Implementation Methods – The Use of Water
3.4.5.1 Environmental Education
(Method to implement Section 3.4.3 Policies 1 and 2)
Waikato Regional Council will, through environmental education programmes, raise the awareness of the community about efficient water use practices by undertaking the following:
1. Providing information regarding the adverse environmental and pasture production effects associated with inefficient irrigation of pastures
2. Providing information regarding the efficient use and conservation of water by householders and resource users
3. Providing information about the use of transferable permits between resource users
4. Providing educational material promoting the efficient use and conservation of water by industries to minimise waste discharges
5. Providing information on the positive benefits to be derived from the efficient use of water
6. Providing climate information measured by the Waikato Regional Council in order to improve the information base for positive irrigation management
7. Providing information on best irrigation practices to improve the efficient use of water.
3.4.5.2 Good Practice
(Method to implement Section 3.4.3 Policy 2)
Waikato Regional Council will, in conjunction with organisations, industries and individuals, provide guidance to develop, implement and undertake efficient water use practices, including:
1. Developing guidelines for water use efficiency
2. Promoting the reuse of water where appropriate
3. Promoting water efficient technology
4. Promoting ‘water efficient’ crops.
3.4.5.3 Crop and Pasture Monitoring Programme
(Method to implement Section 3.4.3 Policy 2)
Waikato Regional Council will undertake a crop and pasture irrigation monitoring programme in conjunction with commercial vegetable growers, farmers and associated industries to develop and test a set of guidelines to ensure sound scientific justification for consideration in relation to consent applications.
98

Appendix C – Transparency about what council will do as specified in NPS Freshwater 2014
B. Water quantity
Objective B1
To safeguard the life-supporting capacity, ecosystem processes and indigenous species including their associated ecosystems of fresh water, in sustainably managing the taking, using, damming, or diverting of fresh water.
Objective B2
To avoid any further over-allocation of fresh water and phase out existing over-allocation.
Objective B3
To improve and maximise the efficient allocation and efficient use of water.
Objective B4
To protect significant values of wetlands and of outstanding freshwater bodies.
Policy B1
By every regional council making or changing regional plans to the extent needed to ensure the plans establish freshwater objectives in accordance with Policies CA1-CA4 and set environmental flows and/or levels for all freshwater management units in its region (except ponds and naturally ephemeral water bodies) to give effect to the objectives in this national policy statement, having regard to at least the following:
a) the reasonably foreseeable impacts of climate change;
b) the connection between water bodies; and
c) the connections between freshwater bodies and coastal water.
Policy B2
By every regional council making or changing regional plans to the extent needed to provide for the efficient allocation of fresh water to activities, within the limits set to give effect to Policy B1.
Policy B3
By every regional council making or changing regional plans to the extent needed to ensure the plans state criteria by which applications for approval of transfers of water take permits are to be decided, including to improve and maximise the efficient allocation of water.
Policy B4
By every regional council identifying methods in regional plans to encourage the efficient use of water.12
Policy B5
By every regional council ensuring that no decision will likely result in future over-allocation – including managing fresh water so that the aggregate of all amounts of fresh water in a freshwater management unit that are authorised to be taken, used, dammed or diverted does not over-allocate the water in the freshwater management unit.
Policy B6
By every regional council setting a defined timeframe and methods in regional plans by which over-allocation must be phased out, including by reviewing water permits and consents to help ensure the total amount of water allocated in the freshwater management unit is reduced to the level set to give effect to Policy B1.
“Freshwater quantity accounting system” means a system that, for each freshwater management unit, records, aggregates and keeps regularly updated, information on the measured, modelled or estimated:
a) total freshwater take;
b) proportion of freshwater taken by each major category of use; and
c) where limits have been set, proportion of the limit that has been taken.
99

“Freshwater take” is a take of ground or surface fresh water whether authorised or not.
CC. Accounting for freshwater takes and contaminants
Objective CC1 To improve information on freshwater takes and sources of freshwater contaminants, in order to:
a) ensure the necessary information is available for freshwater objective and limit setting and freshwater management under this national policy statement; and
b) ensure information on resource availability is available for current and potential resource users.
Policy CC1
By every regional council:
a) establishing and operating a freshwater quality accounting system and a freshwater quantity accounting system for those freshwater management units where they are setting or reviewing freshwater objectives and limits in accordance with Policy A1, Policy B1, and Policies CA1-CA4; and
b) maintaining a freshwater quality accounting system and a freshwater quantity accounting system at levels of detail that are commensurate with the significance of the freshwater quality and freshwater quantity issues, respectively, in each freshwater management unit.
Policy CC2
By every regional council taking reasonable steps to ensure that information gathered in accordance with Policy CC1 is available to the public, regularly and in a suitable form, for the freshwater management units where they are setting or reviewing, and where they have set or reviewed, freshwater objectives and limits in accordance with Policy A1, Policy B1, and Policies CA1-CA4.
100
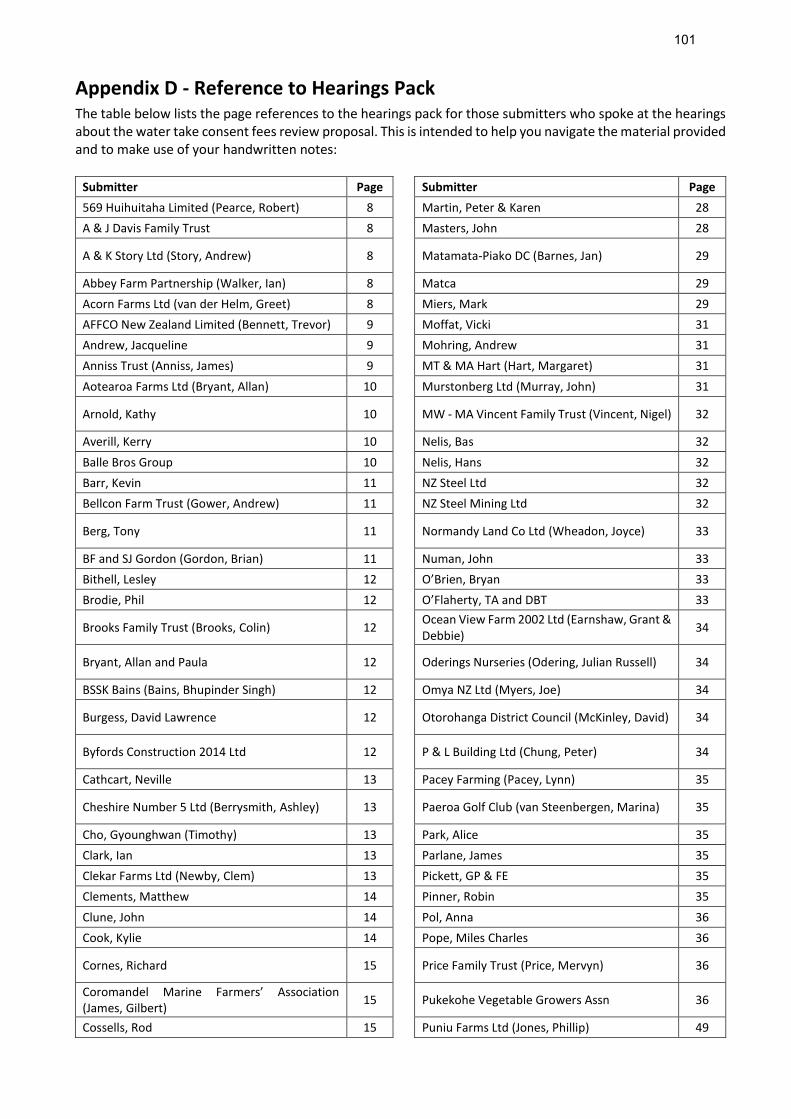
Appendix D - Reference to Hearings Pack The table below lists the page references to the hearings pack for those submitters who spoke at the hearings about the water take consent fees review proposal. This is intended to help you navigate the material provided and to make use of your handwritten notes:
Submitter Page Submitter Page
569 Huihuitaha Limited (Pearce, Robert) 8 Martin, Peter & Karen 28
A & J Davis Family Trust 8 Masters, John 28
A & K Story Ltd (Story, Andrew) 8 Matamata-Piako DC (Barnes, Jan) 29
Abbey Farm Partnership (Walker, Ian) 8 Matca 29
Acorn Farms Ltd (van der Helm, Greet) 8 Miers, Mark 29
AFFCO New Zealand Limited (Bennett, Trevor) 9 Moffat, Vicki 31
Andrew, Jacqueline 9 Mohring, Andrew 31
Anniss Trust (Anniss, James) 9 MT & MA Hart (Hart, Margaret) 31
Aotearoa Farms Ltd (Bryant, Allan) 10 Murstonberg Ltd (Murray, John) 31
Arnold, Kathy 10 MW - MA Vincent Family Trust (Vincent, Nigel) 32
Averill, Kerry 10 Nelis, Bas 32
Balle Bros Group 10 Nelis, Hans 32
Barr, Kevin 11 NZ Steel Ltd 32
Bellcon Farm Trust (Gower, Andrew) 11 NZ Steel Mining Ltd 32
Berg, Tony 11 Normandy Land Co Ltd (Wheadon, Joyce) 33
BF and SJ Gordon (Gordon, Brian) 11 Numan, John 33
Bithell, Lesley 12 O’Brien, Bryan 33
Brodie, Phil 12 O’Flaherty, TA and DBT 33
Brooks Family Trust (Brooks, Colin) 12 Ocean View Farm 2002 Ltd (Earnshaw, Grant & Debbie)
34
Bryant, Allan and Paula 12 Oderings Nurseries (Odering, Julian Russell) 34
BSSK Bains (Bains, Bhupinder Singh) 12 Omya NZ Ltd (Myers, Joe) 34
Burgess, David Lawrence 12 Otorohanga District Council (McKinley, David) 34
Byfords Construction 2014 Ltd 12 P & L Building Ltd (Chung, Peter) 34
Cathcart, Neville 13 Pacey Farming (Pacey, Lynn) 35
Cheshire Number 5 Ltd (Berrysmith, Ashley) 13 Paeroa Golf Club (van Steenbergen, Marina) 35
Cho, Gyounghwan (Timothy) 13 Park, Alice 35
Clark, Ian 13 Parlane, James 35
Clekar Farms Ltd (Newby, Clem) 13 Pickett, GP & FE 35
Clements, Matthew 14 Pinner, Robin 35
Clune, John 14 Pol, Anna 36
Cook, Kylie 14 Pope, Miles Charles 36
Cornes, Richard 15 Price Family Trust (Price, Mervyn) 36
Coromandel Marine Farmers’ Association (James, Gilbert)
15 Pukekohe Vegetable Growers Assn 36
Cossells, Rod 15 Puniu Farms Ltd (Jones, Phillip) 49
101

Cowie, William 15 Purdy, Brian 49
Crows Nest Farming (Lugt, Philip) 15 Robert Pryke Investments (NZ) Ltd (Pryke, Stuart)
49
D & EB Simpson Trust (Simpson, Dyson) 16 Rowe, Michael and Wendy 49
Dairy NZ, Fed Farmers NZ, Horticulture NZ, Irrigation NZ
16 Ruffell, Harry 49
Davey, Michael 16 S & C Kilgour (Kilgour, Carol) 49
DB & MJ Kalma Ltd (Kalma, Melanie) 16 Scott, Fiona 50
Dilworth School (Liversedge, Adam) 16 Scott, Peter 50
Dodunski, David and Hilary Anne 17 Seaview Avenue Te Puru Water Supply (Hillery, John)
50
DR + CJ Brown Auth 122246.01.01 (Brown, Douglas & Carolyn)
17 Settle, Ian 51
DR + CJ Brown Auth 124734.01.01 (Brown, Douglas & Carolyn)
17 Shaw, Trevor 51
DR + CJ Brown Auth 124735.01.01 (Brown, Douglas & Carolyn)
17 Sheenfield Farms Ltd (Dawson, Trevor) 51
Duncum, James George 17 Shepherd, Ray 51
Earnshaw, Eric & Barbara 17 Simpson, Trevor 51
EG Balle Holdings Ltd and Eatim Farms Ltd (Balle, Eamon)
18 Singh, Ajay 52
Emerald Downs Ltd (Coghlan, Graham) 18 Singh-Heer, Dabau 52
Evergreen Ventures Ltd (Bennett, Martin) 18 Sluter, Karen 53
Fong, Allan 18 Smeaton, Duncan 53
Forsythe, Claudia 18 South Waikato District Council (Wood, Tanya) 53
G&F Pickett Trust (Pickett, G & F) 19 Stace, Warren Alfred 53
Gamble, Leeann 19 Sterritt, Brett and Karen 54
Gavins Ltd (Pollard, Stefan) 19 ST Growers Ltd (Clarke, Nick) 54
GBC Winstone – Division of FCIL (Cave, Andrea) 19 Tairua Residents and Ratepayers Association 54
Glen Kaki Orchard (Lanigan, Phillip) 19 Tasman Heights (Burns, John Basil) 55
Goodman, Kevin and Linda 19 Tatahi Reserve 55
Graeme, Megan 20 Te Mata Water Supply Society Inc (Clark, Lynda)
55
Greig, Ashley 20 Te Puru Holiday Park Ltd (Julian, Ron) 55
Grey Family Trust (Grey, Philip) 20 Te Whenua O Matata Ltd (Mathis, Mary-Ann) 56
Groot, Lawrence 20 TG & A Dawson Family Trust (Dawson, Trevor) 56
GT & JC Walker (Walker, Andrew) 20 TG DJ Howard Ltd (Howard, Terry) 56
Guscott, Allan 20 TCDC (Leach, Glenn) 56
H.G.Leach & Co Ltd (Souchon, Eric) 21 The Oxenford Trust (Howe, Robert) 56
Hahn, Jacqueline 21 Thomas, Ashley 57
Hamilton City Council (Briggs, Richard) 21 Thomas, Campbell 57
Hamilton Grey Power (Hennebry, Roger) 21 Titchener, Gran 57
102

Hancock, Ian 22 Tower Farm Ltd Auth 122244.01.01 (Brown, Douglas & Carolyn)
57
Hart, Karen 22 Tower Farm Ltd Auth 124738-01.01 (Brown, Douglas & Carolyn)
58
Hauraki District Council (Adams, Toby) 22 Tui Ridge Ltd Auth 122241.01.01 (Brown, Douglas & Carolyn)
58
Hazlehurst Family Trust (Hazlehurst, Terry) 22 Tui Ridge Ltd Auth 124736.01.01 (Brown, Douglas & Carolyn)
58
Henderson, Ian 22 Turner, David and Elsie 58
Hill Family Trusts Partnership (Hill, Andrew) 22 Van der Poel, Kevin 58
Hosking, Debra 23 Vincent, Garry 58
Hunter, Pam 23 Voogt, Mary 59
Hyde Family Trust (Hyde, Rupert) 23 Waihi Gold Company Ltd (Watson, Kerry) 59
Hyndmans Quarries Ltd (Clements, Dudley) 23 Waikato District Council (Sanson, Allan) 59
Jacobs, Anthony and Susan 24 Waikato Federated Farmers (Le Mière, Paul) 59
Jane, Jeff 24 Waikato-Tainui Te Whakakitenga o Waikato Inc (O’Shannessey, Kevin)
60
JC Blake Ltd (Blake, Roger) 24 Wairakau Farms Ltd (Wells, Trevor) 60
Johnstone, Bains 24 Wairakei Pastoral Ltd 60
Kahikatea Meadows (Paeroa) Ltd (Peters, Mike) 24 Waitere Bay Co Ltd (McGill, Duncan) 60
Karnali Downs Ltd (Saxton, Simon) 25 Waitomo District Council (Hanna, Brian) 60
Kopua Farms Ltd (Snell, Harry) 25 Wakelin, Marian 61
Kowhai Drive Water Society (Campbell, Colin) 25 Wallace Corporation Ltd (Lamigo, Lou) 61
Kowhai Drive Water Supply Co Ltd (Jefferies, Max)
26 Waotu Farming Partnership (Nelis, Hans) 61
Kraakman, Sandra 26 Watkins, Martyn 61
Kreegher, Geoff 26 Whitegate Farm Ltd (Ryan, Rod) 62
L & K Vollebregt Family Trust (Ross, Kathleen) 27 Williams, Evan 62
Lakes and Waterways Action Group Trust (Penton, Jane)
27 WNH Mining Ltd 62
Lake Taupo Catchment Committee 27 Wood acre Partnership Trust (Wood, Michael) 62
Larsen Family Trust 27 Wood, Peter 62
Leslie, David 27 Wootton, John Walter 63
Luxford, Chris 28 Young, Roderick John 63
Marotini Dairy Ltd (Howe, Robert) 28
Z Energy, BP Oil, Mobil Oil, Oil companies joint submission
63
Martin Parks 28
103
Appendix E – Further information from Environmental Management Solutions Ltd (Submitter) From: Kelly Deihl [mailto:[email protected]] Sent: Thursday, 19 May 2016 10:12 a.m. To: Paula Southgate <[email protected]> Subject: Regional Charging Ratios - Section 36 Hi Paula, Many thanks for your time at the Hearing last Thursday, where Brendan and I addressed the Annual Plan water take consent fees review on behalf of Balle Brothers and in conjunction with Irrigation NZ, Hort NZ and other irrigators. As promised, please see below link for analysis of other regions consent funding ratios – in particular, reference table, page 4: http://www.gw.govt.nz/assets/council-reports/Report_PDFs/2013_55_1_Report.pdf Please do not hesitate to contact me if you have any further queries. Kind regards, Kelly
Kelly Deihl, Director Environmental Management Solutions Ltd 7 George Crescent, Buckland, Pukekohe 2677 T: 09 2387797 M: 0274111035 Attachment – Regional Charging Ratios – Section 36 (Doc #6258874)
104

Report to Council – Decision Required
File No: 47 03 10
Date: 18 February 2016
To: Council
From: Chief Executive
Subject: Annual consent holder charges – water takes
1 Purpose To obtain council direction for the setting of state of the environment monitoring annual consent holder charges – water take for the 2016/17 financial year. Recommendation: 1. That the report “Annual consent holder charges – water takes” (Doc #3664503 dated 12
February 2016) be received.
2. That the council reconfirm the existing basis for charging annual consent holder charges – water takes for the 2016/17 Annual Plan, and
3. That staff report back to the 10 March council meeting on options for dealing with the 2015/16 increased charges.
2 Background Council changed the charging regime for information gathering activities for water takes in the 2015-2025 Long Term Plan (LTP) so that it was based on an amount corresponding to the maximum daily net take rate. Previously the charging regime was based on a three tiered system, prompting consent holders to request that Council shift to a more equitable charging regime. The information gathering component of the annual charge funds a portion of the Science and Strategy Directorate’s activities. Most consent holders with water takes in 2014/15 have received a reduction in their charge from the new policy but a smaller proportion of consent holders (about 132 or 12%) had an increase of between $100 and $500, see figure below. About 195 (17%) had an increase of more than $500. This impact was anticipated in the LTP decision. Some of the consent holders adversely affected by the new charges, particularly irrigators, have contacted council and expressed concern at the new charges and, in particular, they were not consulted with directly on these changes.
105

Attached to this report is the ‘Report to Council December 2015: Annual charges for 2015/16 water take consents’ which provides detail on the monitoring and research undertaken by WRC in relation to the water take charges (refer Appendix 3). Staff have been in communication with the affected consent holders, and advised that a decision of council in relation to the 2015/16 charges would be made at the February 2016 council meeting. In the interim, these consent holders have been asked to pay an amount equivalent to the charge they received for the 2014/15 financial year.
3 Legal basis for charges In order to carry out its water resource management functions, the council requires adequate information about the state of the environment. This requirement is formalised in section 35 of the RMA. Section 35(1) of the RMA states:
“Every local authority shall gather such information, and undertake or commission such research, as is necessary to carry out effectively its functions under this Act or regulations under this Act.”
Section 35(2)(a) of the RMA states that the council shall monitor:
“...the state of the whole or any part of the environment of its region…to the extent that it is appropriate to enable [it] to effectively carry out its functions under this Act.”
From this it is important to acknowledge that the charges do not relate solely to monitoring but also include research. Without this information council would be unable to ensure the sustainable management of water resources in the region. Hence, the council undertakes:
Monitoring of groundwater and rivers to determine allocable water resources. Particular focus in Pukekohe, Pukekawa, Matamata, Hamilton Basin, Taupo and Coromadel.
Investigations of the values in the water bodies to be managed including, accounting of existing water takes, fish, invertebrates, biodiversity and water quality. Since 2008 a focus in Coromandel, Waihou, Piako and Whakapipi catchments.
15 4 10
149
526
68 55 7746
70 70
6 3
Change in information gathering charge - 2015/16
106

Activities to promote efficient use of water including workshops with consent holders and the development of irrigation water demand guidelines – implements Method 3.4.5.3 of the Waikato Regional Plan (Crop and Pasture Monitoring Programme).
Reporting to the public and central government (including LAWA, NPSFM 2014) on the level of water allocation in the region. Development and maintenance of Waikato region water allocation calculator.
If water was not taken by consent holders the council would not need to undertake the majority of this work. Details of the specific workstreams and costs recovered by these charged are included in the December council report (Included as Appendix 3 of this report, refer pages 36-38). The basis for charging consent holders for the council’s costs in relation to water allocation is section 36(4)(b) of the RMA. Variation 6 to the Waikato Regional Plan was a response to the problem of some catchments within the region being at, or approaching full allocation. Since consented users take 90 per cent of the water used in the region (the remainder being permitted activities), the need to implement these rules can also be considered to be in response to the demand for water by these users. The allocation of costs associated with the implementation of Variation 6 is based on section 36(4)(b) of the RMA, which states:
“...a particular person or persons should only be required to pay a charge (i) to the extent that the benefit of the local authority’s actions to which the charge relates is obtained by those persons as distinct from the community as a whole; or where the need for the local authority’s actions to which the charge relates is occasioned by the actions of those persons...”
Section 36(4)(b)(iii) of the RMA sets out the conditions under which a local authority may charge in relation to the state of the environment monitoring costs. In particular, it states that:
”...a particular person or persons should only be required to pay a charge...to the extent that the monitoring relates to the likely effects on the environment of those persons’ activities, or to the extent that the likely benefit to those persons of the monitoring exceeds the likely benefit of the monitoring to the community of the local authority as a whole...”
That is, people should be required to pay for the additional monitoring that is required because of their activities, or because they receive an exclusive benefit from the monitoring. This monitoring is separate to that which is undertaken by a consent holder in order for them to be compliant with their resource consent conditions. Consented water takes give rise to the need to monitor water flows since, as noted above, without the information produced by monitoring, the council could not manage the resource (that is, allocate water). In the first instance, the Council needs to ensure that minimum environmental flows are met, and then that allocation of water over and above those minimum flows occurs according to the specifications of the Regional Plan.
4 Identification of charging options The following section provides an evaluation of alternative charging approaches for water take consents. The options presented have been developed with input from representatives from the irrigation sector. While staff have been actively engaging with this sector, we have remained cognisant of the need to achieve an outcome that considers the effects of and impacts on all water users (i.e. is sector neutral). Through this process, a number of concerns have been raised by Mr Phillips on behalf of the irrigators and Mr Phillips presents these in Appendix 1 of this report.
107

A summary of the key concerns include: 1. Mighty River Power, though non-consumptive in its use of water, influences the
Waikato River’s flow and the policy protection afforded it under the National Policy Statement for Renewable Electricity Generation (2011) limits the availability of water for other users upstream of Karapiro Dam.
2. Water take activities which have reduced availability should be charged less, this includes takes which:
a. Are restricted during summer low flows, and/or b. Do not operate all year – e.g. the majority are for agriculture or horticulture
irrigation. 3. The charges should be more equitable – no reduced charge for takes over a certain
magnitude. 4. Takes for uses outside the region (e.g. Watercare) do not contribute the same
amount of funds under the general rate component towards the monitoring and research costs. It is viewed as being inequitable when comparing the combined general rate and consent holder contribution between consent holders residing within and outside the Waikato Region.
5. The current charging model is based on net take approach which ignores: a. That the take could be having an allocation impact near the take location prior
to the water being returned. b. The water returned can be of lower water quality which can limit the
availability of water to others. c. Irrigation water draining past the root zone is not included in the net take
assessment. d. Discharge consents pay a significantly smaller consent holder charge.
In undertaking the modelling of the various charging models, staff note that there will be approximately 4,000 consents that will receive a charge in 2016/17 compared to the baseline number of consents used for the setting of the 2015/16 charges of approximately 1,000 consents. The significant increase in the number of consents reflects the granting of farm water consents over the last two years. The modelling includes taking into account projections of likely to be granted dairy shed consents under Variation 6 and the impact of the new Watercare application currently in the consent queue. Based on the identified options and adjustments put forward by Mr Phillips to address the irrigators’ concerns, staff have modelled the impact under the following scenarios:
Net take daily limit with reduced rate for water exceeding 30,000 m3/d. Status quo Net take daily limit with reduced rate for water exceeding 30,000 m3/d and a
minimum charge of $65. Annualised net take limits with no adjustments. Annualised net take limits with summer adjustment factor1 and reduced rate for water
exceeding 30,000 m3/d. Annualised net take limits with summer adjustment factor, reduced rate for water
exceeding 30,000 m3/d and minimum charge of $65. Annualised gross take limits with reduced rate for water exceeding 30,000 m3/d.
Gross take approach ignores water returned after use – e.g. hydropower discharges.
1 Summer adjustment factor decreases the difference in charge between just summer takes and those operating all year.
108
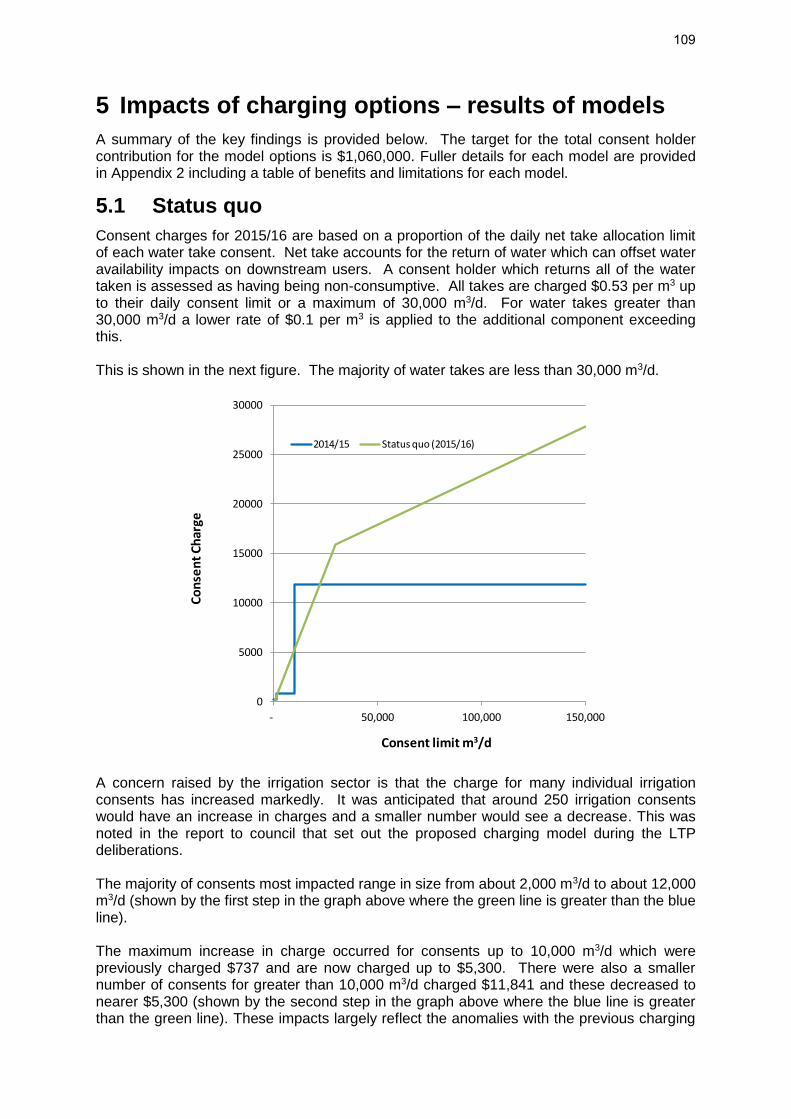
5 Impacts of charging options – results of models A summary of the key findings is provided below. The target for the total consent holder contribution for the model options is $1,060,000. Fuller details for each model are provided in Appendix 2 including a table of benefits and limitations for each model.
5.1 Status quo Consent charges for 2015/16 are based on a proportion of the daily net take allocation limit of each water take consent. Net take accounts for the return of water which can offset water availability impacts on downstream users. A consent holder which returns all of the water taken is assessed as having being non-consumptive. All takes are charged $0.53 per m3 up to their daily consent limit or a maximum of 30,000 m3/d. For water takes greater than 30,000 m3/d a lower rate of $0.1 per m3 is applied to the additional component exceeding this. This is shown in the next figure. The majority of water takes are less than 30,000 m3/d.
A concern raised by the irrigation sector is that the charge for many individual irrigation consents has increased markedly. It was anticipated that around 250 irrigation consents would have an increase in charges and a smaller number would see a decrease. This was noted in the report to council that set out the proposed charging model during the LTP deliberations. The majority of consents most impacted range in size from about 2,000 m3/d to about 12,000 m3/d (shown by the first step in the graph above where the green line is greater than the blue line). The maximum increase in charge occurred for consents up to 10,000 m3/d which were previously charged $737 and are now charged up to $5,300. There were also a smaller number of consents for greater than 10,000 m3/d charged $11,841 and these decreased to nearer $5,300 (shown by the second step in the graph above where the blue line is greater than the green line). These impacts largely reflect the anomalies with the previous charging
0
5000
10000
15000
20000
25000
30000
- 50,000 100,000 150,000
Co
nse
nt
Ch
arge
Consent limit m3/d
2014/15 Status quo (2015/16)
109

steps that the revised charging model was seeking to address. Where a 10,001 m3/d take paid $11,841 and a take just below this level paid $737. There are 383 consents for agriculture or horticulture irrigation. When comparing the 2014/15 step charges with the current 2015/16 charges:
95 (25%) received the largest increase of between $1,000 and $4,300. 143 (37%) had an increase of between $0.1 and $1000. 145 (38%) had a reduction of between $0.1 and $5,888.
The total increase in charges, from the stepped charges 2014/15 to the current 2015/16 charges2, for the combined irrigation consents is $220,235 which is an average of $575 per consent. Based on the new dairy shed consents, if these were charged under the 2014/15 (step charges) the total charge to dairy shed consent holders would have been $396,383, based on a surface water take charge of either $108 or $203. This reduces markedly to $85,726 under the existing 2015/16 charges model of $0.53 per m3 (a reduction of ~$310,000). In summary, under the existing 2015/16 charges model, based on projected consent numbers for 2017, the agricultural sector would pay an additional $220,235 for irrigation consents but would also receive a reduction of $310,000 for dairy shed consents compared to the previous 2014/15 stepped charges. The status quo model for 2015/16 was developed with four main principles in mind:
1. Administratively simple to apply and is largely based on legally defined information (being the daily consent limit).
2. Similar sized consents should pay a similar rate – i.e. no large step changes. 3. Based on the net take in response to remissions processed prior to 2014 and to align
with the Regional Plan. 4. That if challenged to the High Court, Staff could defend the charges in regards to s35
and s36 of the RMA – in essence the benefit to consent holders is justifiable. Pure equity between all takes does not apply unless it can be defended and justified. This was particularly the case for large water consent holders such as Watercare, Hamilton City and NZ Steel.
Projecting ahead to 2016/17, there will be an additional 3,000 consents since the $0.53 (for less than 30,000 m3/d) and $0.10 (for greater than 30,000 m3/d) rates were set in the LTP for 2015/16. Without changing the model but by reducing the charge rate to match the required budget for 2016/17 the total charge for each consent holder will reduce by approximately 20% from this year’s invoice. This is based on $0.44 for less than 30,000 m3/d and $0.12 for greater than 30,000 m3/d. The following is a summary of charges for a typical range of consents: m3/d Pre 2014/15 stepped
charge Current charge 2015/16 $0.53/0.1
Projected 2016/17 charges $0.44/0.12
50 $ 128.00 $ 26.50 $ 22.00 500 $ 203.00 $ 265.00 $ 220.00
1,000 $ 203.00 $ 530.00 $ 440.00 2,000 $ 737.00 $1,060.00 $ 880.00 5,000 $ 737.00 $2,650.00 $2,200.00 7,500 $ 737.00 $3,975.00 $3,300.00
10,000 $ 737.00 $5,300.00 $4,400.00 10,001 $11,841.00 $5,300.53 $4,400.44
2 Using $0.53 per cubic metre.
110

Under Status quo the largest water user’s charge has increased by ~160%. This is equivalent to an increase per consent of about ~$18,500 from 2014/15 to 2015/16. The largest 3 consents are held by Watercare and combined equate to an increase of ~$50,000. Summary of charges for largest users:
Existing charge model 2016/17
$0.44/0.12
Existing charge model 2015/16
$0.53/0.10
Step charge model 2014/15
Top 2 consents $ 61,200 $ 60,800 $ 23,682
% of total revenue 6% 5% 2%
% of consumptive allocation 12% 12% 12%
Top 6 consents $ 146,810 $ 151,742 $ 71,046
% of total revenue 13% 12% 6%
% of consumptive allocation 26% 26% 26%
Graph of consent charge for Status quo for 2015/16 (based on $0.53/$0.1) and 2016/17 (based on $0.44/$0.12) – right image is same data but at a finer scale for the size of most consents including those for irrigation. These show a reduction from 2015/16 to 2016/17.
5.2 Model 1: Status quo but with addition of minimum charge This is similar to Status quo but with the addition of a minimum uniform charge of $65. The two figures below show model 1. There are nearly 3300 consents which are for less than 175 m3/d which would have a fixed fee of $65. For the year 2016/17:
Charge decreases from $0.44 to $0.37 for less than 30,000 m3/d and remains at $0.12 for greater than 30,000 m3/d.
The $65 minimum charge, if implemented, would provide $211,380 in charges compared to $78,325 under the status quo 2015/16 and $416,256 if the 2014/15 lowest step charge of $128 was applied.
For the majority of medium to large consents (including those for irrigation) the charge is about 30% lower than for 2015/16 (status quo).
$-
$5,000
$10,000
$15,000
$20,000
$25,000
$30,000
- 50,000 100,000 150,000
Co
nse
nt
Ch
arge
Consent limit m3/d
Status quo (2015/16)
Status quo (2016/17)
$-
$1,000
$2,000
$3,000
$4,000
$5,000
$6,000
$7,000
- 2,000 4,000 6,000 8,000 10,000 12,000
Co
nse
nt
Ch
arge
Consent limit m3/d
Status quo (2015/16)
Status quo (2016/17)
111

The largest six consents (Watercare x4, Hamilton City and Huntly Power Station) would pay $134,210 which is a slight reduction from charges under status quo 2015/16.
The following is a summary of charges for a typical range of consents:
m3/d Projected 2016/17 charges $0.37/0.12
& min $65
Pre 2014/15 stepped charge
Current charge 2015/16 $0.53/0.1
Projected 2016/17 charges
$0.44/0.12 50 $ 65.00 $ 128.00 $ 26.50 $ 22.00
500 $ 185.00 $ 203.00 $ 265.00 $ 220.00 1,000 $ 370.00 $ 203.00 $ 530.00 $ 440.00 2,000 $ 740.00 $ 737.00 $1,060.00 $ 880.00 5,000 $ 1,850.00 $ 737.00 $2,650.00 $2,200.00 7,500 $ 2,775.00 $ 737.00 $3,975.00 $3,300.00
10,000 $ 3,700.00 $ 737.00 $5,300.00 $4,400.00 10,001 $ 3,700.37 $11,841.00 $5,300.53 $4,400.44
5.3 Model 2: Annualised with no reduction above 30,000 m3/d Consent charges are based on a proportion of the annual net take allocation limit, represented as an average daily value, and no reduction for large water takes. This in essence results in two separate charge regimes depending if a take is seasonal (e.g. irrigation) or if it can operate all year (others). For the year 2016/17:
Charge increases from $0.44 to $0.52 for less than 30,000 m3/d and increases from $0.12 to $0.52 for greater than 30,000 m3/d.
Irrigation consents are charged ~60% less than identically sized water takes (‘Irrigation consents’ compared with ‘Other consents’ in the following table).
Irrigation consent charges are ~55% lower than for status quo 2016/17. All other types of consents, of similar size to irrigation, are nearly 20% higher
compared to status quo for 2016/17. The largest six consents (Watercare x4, Hamilton City and Huntly Power Station)
would pay $386,878 and increase of $240,000 compared to status quo 2014/15. The 2016/17 charge to these six consent holders is equivalent to 36% of the total consent charges for the region.
-
5,000.00
10,000.00
15,000.00
20,000.00
25,000.00
30,000.00
- 50,000 100,000 150,000
Co
nse
nt
Ch
arge
Consent limit m3/d
Status quo (2015/16)
2014/15
M1 Status quo (2016/17) & minimum
Status quo (2016/17)
-
50.00
100.00
150.00
200.00
250.00
300.00
350.00
400.00
450.00
500.00
- 200 400 600 800 1,000
Co
nse
nt
Ch
arge
Consent limit m3/d
Status quo (2015/16)
2014/15
M1 Status quo (2016/17) & minimum
Status quo (2016/17)
112

The following is a summary of charges for a typical range of irrigation consents:
m3/d Annualised no cap $0.52 Projected 2016/17 charges $0.44/0.12
Current 2015/16 charges $0.53/0.10
Irrigation consents
Other consents
50 $ 9.97 $ 26.00 $ 22.00 $ 26.50 500 $ 99.73 $ 260.00 $ 220.00 $ 265.00
1,000 $ 199.45 $ 520.00 $ 440.00 $ 530.00 2,000 $ 398.90 $1,040.00 $ 880.00 $1,060.00 5,000 $ 997.26 $2,600.00 $2,200.00 $2,650.00 7,500 $ 1,495.89 $3,900.00 $3,300.00 $3,975.00
10,000 $ 1,994.52 $5,200.00 $4,400.00 $5,300.00
Graph of consent charge for irrigation versus other water takes for 2016/17 and status quo for 2015/16 and 2016/17 – right image is same data but at a finer scale for the size of most consents including those for irrigation.
5.4 Model 3: Annualised with reduction above 30,000 m3/d and increased weighting for summer takes This model builds on the annualised model (model 2 where consent charges are based on a proportion of the annual net take allocation limit, represented as an average daily value) but attempts to address a number of the concerns raised by staff by including a lower charge for takes greater than 30,000 m3/d and increasing the charge for seasonal takes. As with model 2 this in essence results in two separate charge regimes depending if a take is seasonal (e.g. irrigation) or if it can operate all year (others). For the year 2016/17:
Charge increases from $0.44 to $0.57 for less than 30,000 m3/d and increases from $0.12 to $0.285 for greater than 30,000 m3/d.
Irrigation consents are charged ~40% less than identically sized water takes (‘Irrigation consents’ compared with ‘Other consents’ in the following table).
Irrigation consent charges are ~25% lower than for status quo 2016/17. All other types of consents, of similar size to irrigation, are nearly 30% higher
compared to status quo for 2016/17.
$-
$10,000
$20,000
$30,000
$40,000
$50,000
$60,000
$70,000
$80,000
$90,000
- 50,000 100,000 150,000
Co
nse
nt
Ch
arge
Consent limit m3/d
M2 Annualised charge (other)
M2 Annualised charge (Irrigation)
Status quo (2016/17)
Status quo (2015/16)
$-
$1,000
$2,000
$3,000
$4,000
$5,000
$6,000
$7,000
- 2,000 4,000 6,000 8,000 10,000 12,000
Co
nse
nt
Ch
arge
Consent limit m3/d
M2 Annualised charge (other)
M2 Annualised charge (Irrigation)
Status quo (2016/17)
Status quo (2015/16)
113

The largest six consents (Watercare x4, Hamilton City and Huntly Power Station) would pay $263,175 and increase of $116,000 compared to status quo 2014/15. The 2016/17 charge to these six consent holders is equivalent to 25% of the total consent charges for the region.
The following is a summary of charges for a typical range of irrigation consents:
m3/d Annualised $0.57/$0.285 factor 1.5 Projected 2016/17 charges $0.44/0.12
Current 2015/16 charges $0.53/0.10
Irrigation consents
Other consents
50 $ 16.40 $ 28.50 $ 22.00 $ 26.50 500 $ 163.97 $ 285.00 $ 220.00 $ 265.00
1,000 $ 327.95 $ 570.00 $ 440.00 $ 530.00 2,000 $ 655.89 $1,140.00 $ 880.00 $1,060.00 5,000 $ 1,639.73 $2,850.00 $2,200.00 $2,650.00 7,500 $ 2,459.59 $4,275.00 $3,300.00 $3,975.00
10,000 $ 3,279.45 $5,700.00 $4,400.00 $5,300.00
Graph of consent charge for irrigation versus other water takes for 2016/17 and status quo for 2015/16 and 2016/17 – right image is same data but at a finer scale for the size of most consents including those for irrigation.
5.5 Model 4: Annualised with reduction above 30,000 m3/d, increased weighting for summer takes and minimum charge This is similar to Model 3, but with the inclusion of a minimum charge. The two figures below show model 3. There are nearly 3300 consents which are for less than 200 m3/d which would have a fixed fee of $65. These are represented by the flattening of the two lines in the right-hand figure below. As with models 2 and 3 this in essence results in two separate charge regimes depending if a take is seasonal (e.g. irrigation) or if it can operate all year (others). For the year 2016/17:
Charge increases from $0.44 to $0.50 for less than 30,000 m3/d and increases from $0.12 to $0.25 for greater than 30,000 m3/d.
The $65 minimum charge, if implemented, would provide $212,355 in charges compared to $78,325 under the status quo 2015/16 and $416,256 if the 2014/15 lowest step charge of $128 was applied.
$-
$10,000
$20,000
$30,000
$40,000
$50,000
$60,000
- 50,000 100,000 150,000
Co
nse
nt
Ch
arge
Consent limit m3/d
M3 Annualised, seasonal & cap (other)
M3 Annualised, seasonal & cap (Irrigation)
Status quo (2016/17)
Status quo (2015/16)
$-
$1,000
$2,000
$3,000
$4,000
$5,000
$6,000
$7,000
- 2,000 4,000 6,000 8,000 10,000 12,000
Co
nse
nt
Ch
arge
Consent limit m3/d
M3 Annualised, seasonal & cap (other)
M3 Annualised, seasonal & cap (Irrigation)
Status quo (2016/17)
Status quo (2015/16)
114

Irrigation consents are charged ~40% less than identically sized water takes (‘Irrigation consents’ compared with ‘Other consents’ in the following table).
Irrigation consent charges are ~35% lower than for status quo 2016/17. All other types of consents, of similar size to irrigation, are nearly 13% higher
compared to status quo for 2016/17. The largest six consents (Watercare x4, Hamilton City and Huntly Power Station)
would pay $230,999 and increase of $84,000 compared to status quo 2014/15. The 2016/17 charge to these six consent holders is equivalent to 21% of the total consent charges for the region.
The following is a summary of charges for a typical range of irrigation consents:
m3/d Annualised $0.50/$0.25 factor 1.5
and min $65 Projected 2016/17 charges $0.44/0.12
Current 2015/16 charges $0.53/0.10
Irrigation consents
Other consents
50 $ 65.00 $ 65.00 $ 22.00 $ 26.50 500 $ 143.84 $ 250.00 $ 220.00 $ 265.00
1,000 $ 287.67 $ 500.00 $ 440.00 $ 530.00 2,000 $ 575.34 $1,000.00 $ 880.00 $1,060.00 5,000 $ 1,438.36 $2,500.00 $2,200.00 $2,650.00 7,500 $ 2,157.53 $3,750.00 $3,300.00 $3,975.00
10,000 $ 2,876.71 $5,000.00 $4,400.00 $5,300.00
Graph of consent charge for irrigation versus other water takes for 2016/17 and status quo for 2015/16 and 2016/17 – right image is same data but at a finer scale for the size of most consents including those for irrigation.
5.6 Model 5: Annualised gross takes with reduction above 30,000 m3/d The approach for the gross takes generally assumes all takes except for flood purposes are treated as consumptive. This approach ignores consents where water is returned after use via discharges as defined in the Waikato Regional Plan. For the year 2016/17:
$-
$5,000
$10,000
$15,000
$20,000
$25,000
$30,000
$35,000
$40,000
$45,000
$50,000
- 50,000 100,000 150,000
Co
nse
nt
Ch
arge
Consent limit m3/d
M4 Annualised, seasonal, cap & min (other)
M4 Annualised, seasonal, cap & min (Irrigation)
Status quo (2016/17)
Status quo (2015/16)
$-
$1,000
$2,000
$3,000
$4,000
$5,000
$6,000
$7,000
- 2,000 4,000 6,000 8,000 10,000 12,000
Co
nse
nt
Ch
arge
Consent limit m3/d
M4 Annualised, seasonal, cap & min (other)
M4 Annualised, seasonal, cap & min (Irrigation)
Status quo (2016/17)
Status quo (2015/16)
115

Charge decreases from $0.44 to $0.27 for less than 30,000 m3/d and increases from $0.12 to $0.27 for greater than 30,000 m3/d.
Two additional charges are applied 1) takes for hydro power are charged $0.01 per m3, and 2) takes for industrial cooling are charged $0.02 per m3.
Irrigation consents are charged ~60% less than identically sized water takes (‘Irrigation consents’ compared with ‘Other consents’ in the following table).
Irrigation consent charges are ~75% lower than for status quo 2016/17. All other types of consents, of similar size to irrigation, are nearly 50% lower
compared to status quo for 2016/17. The largest six consents (Watercare x4, Hamilton City and Huntly Power Station)
would pay $489,804 and increase of $343,000 compared to status quo 2014/15. The 2016/17 charge to these six consent holders is equivalent to 46% of the total consent charges for the region.
The following is a summary of charges for a typical range of irrigation consents: m3/d Gross 0.27 Projected 2016/17
charges $0.44/0.12 Current 2015/16
charges $0.53/0.10
Irrigation consents
Other consents
50 $ 5.18 $ 13.50 $ 22.00 $ 26.50 500 $ 51.78 $ 135.00 $ 220.00 $ 265.00
1,000 $ 103.56 $ 270.00 $ 440.00 $ 530.00 2,000 $ 207.12 $ 540.00 $ 880.00 $1,060.00 5,000 $ 517.81 $1,350.00 $2,200.00 $2,650.00 7,500 $ 776.71 $2,025.00 $3,300.00 $3,975.00
10,000 $ 1,035.62 $2,700.00 $4,400.00 $5,300.00
Graph of consent charge for irrigation versus other water takes for 2016/17 and status quo for 2015/16 and 2016/17 – left image has extended horizontal axis to include MRP non-consumptive take, right image is same data but with finer scale for the size of most consents including those for irrigation.
$-
$20,000
$40,000
$60,000
$80,000
$100,000
$120,000
$140,000
$160,000
$180,000
$200,000
- 5,000,000 10,000,000 15,000,000
Co
nse
nt
Ch
arge
Consent limit m3/d
Gross
Gross (irrigation)
Status quo (2016/17)
Status quo (2015/16)
$-
$1,000
$2,000
$3,000
$4,000
$5,000
$6,000
$7,000
- 2,000 4,000 6,000 8,000 10,000 12,000
Co
nse
nt
Ch
arge
Consent limit m3/d
Gross
Gross (irrigation)
Status quo (2016/17)
Status quo (2015/16)
116

6 Summary/assessment 6.1 Staff response to key concerns raised by Mr. Phillips 1. Mighty River Power, though non-consumptive in its use of water, influences the Waikato
River’s flow and the policy protection afforded it under the National Policy Statement for Renewable Electricity Generation (2011) limits the availability of water for other users upstream of Karapiro Dam.
In a policy sense MRP’s use of water for electricity generation results in lower availability of water for consumptive allocation – but staff are not of the view that this should influence the charges under discussion. Very little of WRC monitoring or investigations relating to water takes are directly attributed to MRP activities. MRP’s operation does have an impact on the flow regime, generally to the benefit of reducing water shortages (i.e. using the hydro lakes for summer storage) and increasing the reliability of existing water abstractors. It should also be noted that MRP co-fund 7 river flow recording sites and this data is available for managing water shortage restriction of other consents in particular pasture irrigation activities. MRP for its main operation does not have a surface water take consent but rather a damming consent which has conditions relating to minimum and maximum discharges from each dam. The charges applying to Mighty River Power under the dam charges increased from ~$4,000 in 2014/15 to ~$32,000 in 2015/16.
2. Water take activities which have reduced availability should be charged less, this
includes takes which: a. Are restricted during summer low flows, and/or b. Do not operate all year – e.g. the majority are for agriculture or horticulture
irrigation. There is no data available to differentiate between consents with lower reliably of water take – e.g. may be restricted more than other takes. There is a range of reliability across similar consents and this detail is not readily available in a database which could be used for assessing charges. Staff considered that there is little or no difference in the cost to WRC to operate its monitoring, research and investigations as a result of a particular consent’s availability to water during a drought. It is more likely that the charge should increase for consents with lower reliability due to higher workload by WRC staff to ensure best information is available to consent holders to help manage their water takes. Staff consider that there should not be a marked differentiation between seasonal uses and all year users. WRC costs associated with research and investigation are largely driven by summer allocation levels which are generally better represented by the daily volume than annual volume. The annual volume does not distribute charges evenly based on users who cause the need for majority of monitoring and investigations. Summer users, even though they may operate for less than 140 days, result in the greatest allocation pressure during the times when allocation is most stressed.
3. The charges should be more equitable – no reduced charge for takes over a certain
magnitude. Staff consider that without a reduced charge they cannot justify the high charge for the largest uses based on the level of monitoring and research undertaken by WRC. WRC has received preliminary legal advice on this issue from Mr Milne. “In terms of risk management, I consider that the large users are the most likely to judicially review section 36 fixed charges which they consider to be unfair. As an illustration, Electricity Corporation of NZ Limited successfully judicially reviewed charges
117

imposed under section 24K of the Water and Soil Conservation Act 1967 set by Council’s statutory predecessor, the Waikato Catchment Board.
My concern is heightened by the fact that you advise that although a few users use a large portion of the allocated resource, there is not a one-to-one relationship with the Council monitoring activities and costs. If Council were to adopt the proposed regime then large users could judicially review its decision and require Council to justify that at least 20% of its monitoring activities is directly related to their activities. I understand your opinion to be that Council could not justify that position. That being so, my advice has to be that Council should not agree to the proposed new basis of charging. “ 4. Takes for uses outside the region (e.g. Watercare) do not contribute the same amount
of funds under the general rate component towards the monitoring and research costs. It is viewed as being inequitable when comparing the combined general rate and consent holder contribution between consent holders residing within and outside the Waikato Region.
Council has received preliminary legal advice on this issue from Mr Milne: “In our telephone discussion on 5 February following your receipt of my opinion of that date you asked me to consider another related matter. You have been lobbied to impose s36 charges which differentiate between those within the Region and those outside it.
I confirm my verbal advice that there is no basis for any such differentiation in section 36. I consider that any application for judicial review of a charging regime on that basis would inevitably succeed. “ “I consider that there is no legal basis upon which consent holders who are not ratepayers within the Waikato Region or consent holders who are ratepayers within the Waikato Region but whose activities benefit persons outside the Waikato Region should be charged on a higher basis than consent holders within the Region who are ratepayers and where the benefit of Council’s activity relates to the property upon which
the rates are paid.” 5. The model is based on net take approach which ignores:
a. That the take could be having an allocation impact near the take location prior to the water being returned, e.g. Carter Holt Harvey Pokaiwhenua take.
b. The water returned can be of lower water quality which can limit the availability of water to others, e.g. Huntly Power Station.
c. Irrigation water draining past the root zone is not included in the net take assessment.
d. Discharge consents pay a significantly smaller consent holder charge. For the CHH example the return of water to the Waikato River exceeds the amount taken from the surface water consents and are thus treated as being non-consumptive. That is they do not limit any other person from having access to water. CHH also have a large groundwater consent which is treated as being fully consumptive. Under the 1024/15 charges all the CHH consents received an extra large charge. However, the majority of this charge was remitted. Implementing a charge based on the quality of water would be very difficult. For example the temperature on the water returned by Huntly can be extremely variable depending on how many generators are operating. Huntly are already heavily constrained from operating during summer due to the ambient temperature of the Waikato River. They may consider that any other activity upstream should pay a higher charge due to their activity limiting
118

Huntly’s operation. Genesis evidence to the environment Court for Variation 6, which was not disputed by any party including the agricultural sector, showed that every drop of water removed upstream of Huntly increased the ambient temperature of the river. Huntly may argue that there should be a higher charge for water takes above Huntly along the same premise given by Mr Phillips. Correctly operated irrigation consents should not return significant amounts of water beyond the root zone. Irrigation should be managed to minimize drainage below the root zone to minimise nutrient leaching to groundwater and then rivers. Minimising irrigation drainage is covered by rules 3.4.5.6 to 3.4.5.8 of the WRP which relate to the use of water for crop and pasture irrigation. As noted by Mr Phillips discharges are treated separately. There are some important differences. The water take charges are primarily around the implementation of water allocation which includes SOE monitoring but in additional the actively managing allocation of water. It is the active management of allocation which is considerably different to how discharges are managed. This may change under healthy rivers where the implementation may require extra funding and reconsideration of the funding mechanism used. At the moment the monitoring associated with discharges is primarily SOE. Council has received preliminary legal advice on the issue of gross takes from Mr Milne: “You have further advised that you are being lobbied to return to the use of gross take allocation rates rather than net take rates when assessing the charge to the large users. The net take approach contras the matching discharge against the volume of the take because the discharge contributes to the allocable flow available to downstream users. The Variation 6 process demonstrated that the net take approach is sensible and defensible. If Council were to change to the gross take approach then I note that you consider that very large users would pay a disproportionately large amount of the total monitoring charge compared to the Council monitoring related to their activities. Clearly that would place your Council at risk of challenge by way of judicial review. Again, my advice is that your Council should not agree to the proposed change.”
6.2 Assessment of models Status quo 2016/17: Projecting ahead to 2016/17, there will be an additional 3,000 consents since the $0.53 (for less than 30,000 m3/d) and $0.10 (for greater than 30,000 m3/d) rates were set in the LTP for 2015/16. Without changing the model but by reducing the charge rate to match the required budget for 2016/17 the total charge for each consent holder will reduce by approximately 20% from this year’s invoice. This is based on $0.44 for less than 30,000 m3/d and $0.12 for greater than 30,000 m3/d. The remission process is also available to deal with the small number of consents which may not fit the daily model e.g. those that operate for a few days each year. Status quo 2016/17 with minimum charge Model 1: A minimum charge of $65 is applied to all consents less than 150 m3/d. This minimum charge, if implemented, would apply to 3,267 consent holders and provide $211,380 in charges compared to $78,325 under the status quo. For the majority of medium to large consents the charge for 2016/17 is about 30% lower than for 2015/16. The remission process is also available to deal with the small number of consents which may not fit the daily model e.g. those that operate for a few days each year.
119

Annualised models 2 to 4: Staff consider the three alternative models’ based around an annualising of water take volumes (with a variety of adjustment factors), as proposed by Mr Phillips on behalf of the irrigators, would be difficult to defend. If adopted a large number of consents would have a charge based on a derived annual value (i.e. not a legal value from their consent) and it is likely that there may be a large number of enquires and remission requests as individual consent holders try to get a lower assessment. A financial buffer would need to be built-in to deal with the cost of this process. The annualised approach reduces the charge for seasonal consent holders, e.g. irrigators. However, the decrease in charge is generally apportioned on to a small number of large consent holders. Depending on the annualised model chosen, the six largest consent holder would be charged between $230,999 and $386,878. This being between 21% and 36% of the total revenue. This charge would be primarily against Watercare x4, Hamilton City and Huntly Power Station. Staff consider they could not defend that level of charge in relation to the monitoring and investigation undertaken by WRC. Gross take model 5: This approach is likely to see a legal challenge to the basis of charges from the large power generators. This will also result in a large number of remission requests from other non-consumptive consent holders. The previous step charges for 2014/15 were based on gross take, but with a maximum charge of $11,842, and WRC dealt with remissions for nearly all the hydropower generators, in particular the small scale schemes. The number of remissions will no doubt increase if adopted as the two largest consents by Mighty River Power and Genesis Energy for the Tongariro Power Scheme would receive a charge of $292,896. This is a quarter of the total budget applied to just two non-consumptive consent holders. The six largest consent holders (Genesis x2, MRP, and Watercare x3)3 are charged $489,804 which is nearly half of the total charge across all the users in the region. This distribution of the charge largely on to non-consumptive water users would be difficult for staff to justify and defend. It is worth noting that due to a clerical error the 2015/16 charges were consulted to the public without the adjustment for non-consumptive operations such as power stations. In essence the hydro power stations in the consultation document were treated as being consumptive, i.e. gross takes. This result in submissions by the major power companies to ensure their consents were not treated as gross takes. Council, through the LTP submission and hearing process, decided to not treated these activities as gross takes. As discussed above, Council has received preliminary legal advice on the gross take issue from Mr Milne: “You have further advised that you are being lobbied to return to the use of gross take allocation rates rather than net take rates when assessing the charge to the large users. The net take approach contras the matching discharge against the volume of the take because the discharge contributes to the allocable flow available to downstream users. The Variation 6 process demonstrated that the net take approach is sensible and defensible. If Council were to change to the gross take approach then I note that you consider that very large users would pay a disproportionately large amount of the total monitoring charge compared to the Council monitoring related to their activities. Clearly that would place your Council at risk of challenge by way of judicial review. Again, my advice is that your Council should not agree to the proposed change.”
3 Watercare also have the seventh largest take.
120
6.3 Conclusion Mr Phillips on behalf of the irrigators he is representing provides provisional support for Model 4: Annualised with reduction above 30,000 m3/d, weighting for summer takes and minimum charge. The support is provisional as Mr Phillips is unable to meet with the irrigators to discuss the implications until the 26th February. Mr Phillips’ letter on the Irrigators’ position is provided in Appendix 4. Staff recommend that council continues charging consents using either:
a. the status quo model but taking into account the lower rates as a result of the increase in consent holder for 2016/17, or
b. the status quo model with minimum uniform charge (model 1).
7 Transitioning to new charges Once the council has made a decision on the preferred charging method, consideration needs to be given to the phasing of any significant increases in charges to consent holders. This includes consideration of any remission of charges already invoiced for the 2015/16 financial year. Staff intend to report back to Council on this matter to the 10 March council meeting.
8 Consultation on change to charging model Should the council resolve to propose a new charging model for the state of the environment monitoring charges for water takes, this change will be consulted on through the 2016/17 annual plan consultation document. The consultation document would contain an overview / summary of the proposed changes, impacts and information on how any increases would be implemented / phased in. A letter would be sent to consent holders at the beginning of the consultation period setting out the proposal and the ways in which a submission could be made.
9 Future matters to address Through the engagement with the irrigation sector, a number of areas have been identified where further dialogue is required:
Recognition of monitoring undertaken by consent holders. Staff note that a distinction needs to be made between monitoring undertaken in order to comply with consent conditions as opposed to monitoring that adds to the information the council uses to manage water resources (i.e. state of the environment monitoring).
10 Policy Considerations To the best of the writer’s knowledge, this decision is not significantly inconsistent with nor is anticipated to have consequences that will be significantly inconsistent with any policy adopted by this local authority or any plan required by the Local Government Act 2002 or any other enactment. Ed Brown Mike Garrett Manager, Environmental Monitoring Chief Financial Officer
121

Viewpoint as provided by Mr Phillips for the concerned Irrigators
Concerns include:
The contention that the consented volume in a location is proportional to the demand for environmental monitoring is very difficult to demonstrate, particularly in the Waikato catchment where the River mainstem flows are significantly influenced by MRP and the allocable flows permitted above Karapiro are only 5% of Q5 which is lower than most other waterways in the region. It is accepted however that there is a requirement for Information Gathering and Data Monitoring for aquifer and river flows and water quality and that charging consent holders on the basis of their consented available water takes is not unreasonable.
The results with the change from the coarse size groupings that existed prior to 2015 created substantial increases in charges for a large number of consent holders with water takes in the ranges from 400 – 1,000m3/day (from about $200 up to as much as $500), and for those with consents between 1,400 and 10,000m3/day the charges went from about $740 up to between $740 and $5,300. A substantial number of the consent holders in this range are farmers taking water for irrigation and this water has, in most cases, consent restrictions on the volume able to be taken per year and are generally category C for surface takes which means in periods deemed to be water short, these consents are shut down completely so that domestic, stock, community and industrial water takes can continue.
When this was brought to the attention of councillors and staff after the regime had
been approved and the bills had been sent out, there was an acceptance that the affected consent holders had not been aware of the implications contained within the Long Term Plan. Mr Phillips considers many of the councillors who approved the Plan were also unaware of the impact of the change.
The irrigation community does not object to a charge that is related to the water volume available for the use of the consent holder and accepts that while there is no clear relationship between the consent holder charge and the direct benefit to each individual consent holder, the principle of a smoothed system is likely to be more equitable. This is consistent with the resolution contained within the LTP “Our decision To combine our charging for groundwater and surface water, and move to a more graduated charging mechanism which matches with the volume of take permitted under each resource consent.” Given the difficulty of overturning a newly approved policy in the Long Term Plan the irrigators have therefore suggested that the annual availability of the consented water should be the basis for the Information Gathering and Data Monitoring levy, rather than the daily availability of the consent. Of course for consents that do not have an annual cap the annual availability is 365 times the daily availability. On the other hand a consent of say 3,650m3/day for 100 days has an annualised daily availability of 1,000m3/day less the likely number of days of shut down.. The irrigators believe that this would enable the principle espoused in the Long Term Plan to be retained but this interpretation of the principle would be more equitable. In working through the detail with staff Mr Phillips believes that the original proposal has some anomalies that need to be addressed.
122
These are: 1. The seasonality of irrigation and some other takes which should be annualised
with or without an adjustment factor. 2. The fact that irrigation consents have the highest probability of shutdown in the
event of a declared water shortage and so there is less surety of supply, so are of lower value than category B takes.
3. Irrigation Takes are the only takes where water is only allocated to meet the predicted need 9 years out of 10. All other takes are in the basis of meeting total demand. Averaged actual use is typically in the order of 60-70% of consented annual volume.
4. If the concept of spreading the consent holder contribution is to be based on the consent holders’ access to water then the issue of a potential low level fixed charge for small takes and reduced rates for extra large consents needs to be part of the review. Reducing the rates for the largest consent holders means that the other consent holders are required to pay a higher fee to offset the discount (irrespective of the name given to the reduced rate).
5. Currently the Council has chosen to set the consent holder contribution at 40% of the cost of the Information Gathering and Data Monitoring levy and the balance is from the general rate. Where the water is taken and exported from the region this funding model does not produce an equitable outcome especially in regard to Auckland City’s Water Care which currently takes 25% of the annualised consented water and pays 7% of the consent holder share of the Information Gathering and Data Monitoring levy, and pays less than $2,000 in General Rates. Of course Water Care is in the process of seeking much more water and this equation will become much worse if the same method of charging remains. It also means the high volume reduced rate effectively increases the contribution from other consent holders by about 18%.
6. The current model is also based on a net take approach which means that a consent holder who returns water is only charged for the net. CHH has a take for 60,000m3 per day from a spring feeding the Pokaiwhenua and returns an equivalent volume of process water back into the Pokaiwhenua about 10km downstream and so makes no contribution to the Information Gathering and Data Monitoring levy and it is the 6th largest take in the region. The water returned is likely to be different in quality from that taken and that the volume equivalence is only valid if there has been no change in location, timing or quality. If it was equivalent, then there would not be any need for a large take as the actual take would only need to be for any losses within the recycling system.
If Genesis requires a minimum flow at Huntly to be maintained which would seem to imply a greater need for environmental monitoring than the Net take approach would indicate. It appears this Net take approach is ignoring the additional environmental monitoring needed for the true magnitude of the environmental effects. The result is that standard consent holders are being levied at a higher rate to cover this anomaly. As part of the modelling it would seem that we should be able to model the gross take and the volume returned with the option to have a negative value for the water returned but that value would be less than the take value. For example
If a user takes 100,000 m3/day and returns 80,000 m3/day then the 100,000 would pay an environmental contribution at the going rate (say $0.40) and would get a rebate of a percentage of the rate, depending on the impact category.
123

If the impact is solely heat then if the water temp of the discharge exceeds the water temp of the take by more than 20 degrees there could be a surcharge rather than a rebate and if less than say 2 degrees 100% rebate.
Take Rate
Charge/m3 Rebate for returned water based on quality difference
$0.40 i.e. Temperature differential between take & return
Based on previous years mean performance
Net Take Gross take Gross Return Rebate Net Fee
20000 100000 80000 Temp Diff Performance for 20,000m3/day
Charge $40,000 Rebate Rate degrees C factor
0.4 2 1 $8,000
0.3 5 0.75 $16,000
0.2 10 0.5 $24,000
0.1 15 0.25 $32,000
0 20 0 $40,000
-0.2 25 -0.5 $56,000
If the water quality of the return is similar to the take
then the result is the same as for a net take based charge
Credit rates
Similarly for a sewage treatment plant, the rate of the rebate would improve along with the quality of the discharge. The reality is that we should be using a similar system for takes and discharges.
Discharge consents are paying a significantly smaller charge than the abstraction consents and using the net take approach means that the large dischargers are being seriously advantaged when the discharges arguably require a greater environmental monitoring assessment than the consumptive takes.
The whole net take approach sounds reasonable but ignores some major issues and which compound the existing anomalies in the current model. I believe that this means that some major contributors to the need for environmental monitoring are paying substantially less than the ordinary takes users.
This means that we should also model the gross takes and gross discharges because the environmental impacts and hence monitoring requirements would appear to be arguably linked. I suspect that this may even be a larger issue than annualizing the irrigation takes. In the debate round irrigation and ground water, Variation 6 presumes that all ground water is returned to the river systems. While I do not accept that in its totality, if that is the policy premise then we know that water passing beyond the root zone for irrigated pasture is significantly higher than for non irrigated pasture, but we are not treating that as an offset to arrive at a net return. I am not proposing that we should at this stage, but I am saying that we should not be treating large takes and large discharges as being equivalent to arrive at an arithmetic net.
Certainly with the emphasis on improving the water quality there needs to be an environmental monitoring programme and the outcome of any improvements will create significantly greater benefits for users especially at the downstream end and again Water Care will be a major beneficiary.
I accept that it may not be possible to use this tool to fix all of the issues raised but the possibility exists to adjust the model and the interpretations used to improve the equity of the charges and to give due regard to the economic circumstances of the parties, which is also a requirement of the RMA.
124

Impacts of charging options – detailed model results
1. Status quo Consent charges for 2015/16 are based on a proportion of the daily net take allocation limit of each water take consent. Net take accounts for the return of water which can offset water availability impacts on downstream users. A consent holder which returns all of the water taken is assessed as having being non-consumptive. All takes are charged $0.53 per m3 up to their daily consent limit or a maximum of 30,000 m3/d. For water takes greater than 30,000 m3/d a lower rate of $0.1 per m3 is applied to the additional component exceeding this. This is shown in the next figure. The majority of water takes are less than 30,000 m3/d.
A concern raised by the irrigation sector is that the charge for many individual irrigation consents has increased markedly. It was anticipated that around 250 irrigation consents would have an increase in charges and a smaller number would see a decrease. This was noted in the report to council that set out the proposed charging model. The majority of consents most impacted range in size from about 2,000 m3/d to about 12,000 m3/d (shown by the first step in the graph above where the green line is greater than the blue line). The maximum increase in charge occurred for consents up to 10,000 m3/d which were previously charged $737 and are now charged up to $5,300. There were also a smaller number of consents for greater than 10,000 m3/d charged $11,841 and these decreased to nearer $5,300 (shown by the second step in the graph above where the blue line is greater
0
5000
10000
15000
20000
25000
30000
- 50,000 100,000 150,000
Co
nse
nt
Ch
arge
Consent limit m3/d
2014/15 Status quo (2015/16)
125

than the green line). These impacts largely reflect the anomalies with the previous charging steps that the revised charging model was seeking to address. There are 383 consents for agriculture or horticulture irrigation. When comparing the 2014/15 step charges with the current 2015/16 charges:
95 (25%) received the largest increase of between $1,000 and $4,300. 143 (37%) had an increase of between $0.1 and $1000. 145 (38%) had a reduction of between $0.1 and $5,888.
The total increase in charges, from the stepped charges 2014/15 to the current 2015/16 charges4, for the combined irrigation consents is $220,235 which is an average of $575 per consent. Based on the new dairy shed consents, if these were charged under the 2014/15 (step charges) the total charge to dairy shed consent holders would have been $396,383, based on a surface water take charge of either $108 or $203. This reduces markedly to $85,726 under the existing 2015/16 charges model of $0.53 per m3 (a reduction of ~$310,000). In summary, under the existing 2015/16 charges model, based on projected consent numbers for 2017, the agricultural sector would pay an additional $220,235 for irrigation consents but would also receive a reduction of $310,000 for dairy shed consents compared to the previous 2014/15 stepped charges. The status quo model for 2015/16 was developed with four main principles in mind:
5. Administratively simple to apply and is largely based on legally defined information (being the daily consent limit).
6. Similar sized consents should pay a similar rate – i.e. no large step changes. 7. Based on the net take in response to remissions processed prior to 2014 and to align
with the Regional Plan. 8. That if challenged to the High Court, Staff could defend the charges in regards to s35
and s36 of the RMA – in essence the benefit to consent holders is justifiable. Pure equity between all takes does not apply unless it can be defended and justified. This was particularly the case for large water consent holders such as Watercare, Hamilton City and NZ Steel.
Projecting ahead to 2016/17, there will be an additional 3,000 consents since the $0.53 (for less than 30,000 m3/d) and $0.10 (for greater than 30,000 m3/d) rates were set in the LTP for 2015/16. Without changing the model but by reducing the charge rate to match the required budget for 2016/17 the total charge for each consent holder will reduce by approximately 20% from this year’s invoice. This is based on $0.44 for less than 30,000 m3/d and $0.12 for greater than 30,000 m3/d. The following is a summary of charges for a typical range of consents: m3/d Pre 2014/15 stepped
charge Current charge 2015/16 $0.53/0.1
Projected 2016/17 charges $0.44/0.12
50 $ 128.00 $ 26.50 $ 22.00 500 $ 203.00 $ 265.00 $ 220.00
1,000 $ 203.00 $ 530.00 $ 440.00 2,000 $ 737.00 $1,060.00 $ 880.00 5,000 $ 737.00 $2,650.00 $2,200.00 7,500 $ 737.00 $3,975.00 $3,300.00
10,000 $ 737.00 $5,300.00 $4,400.00 10,001 $11,841.00 $5,300.53 $4,400.44
4 Using $0.53 per cubic metre.
126

Under Status quo the largest water user’s charge has increased by ~160%. This is equivalent to an increase per consent of about ~$18,500 from 2014/15 to 2015/16. The largest 3 consents are held by Watercare and combined equate to an increase of ~$50,000. Summary of charges for largest users:
Existing charge model 2016/17
$0.44/0.12
Existing charge model 2015/16
$0.53/0.10
Step charge model 2014/15
Top 2 consents $ 61,200 $ 60,800 $ 23,682
% of total revenue 6% 5% 2%
% of consumptive allocation 12% 12% 12%
Top 6 consents $ 146,810 $ 151,742 $ 71,046
% of total revenue 13% 12% 6%
% of consumptive allocation 26% 26% 26%
Graph of consent charge for Status quo for 2015/16 (based on $0.53/$0.1) and 2016/17 (based on $0.44/$0.12) – right image is same data but at a finer scale for the size of most consents including those for irrigation. These show a reduction from 2015/16 to 2016/17. The following table summarises the benefits and limitations/impacts of this model as determined by Staff and Mr Phillips: Daily limit for setting charges Benefits Limitations/impacts Utilises most readily available and complete consent information – being daily volume. Nearly all consents have a daily limit specified in their consent certificates.
WRC costs associated with research and investigation are largely driven by summer allocation levels which are generally better represented by the daily volume than annual
$-
$5,000
$10,000
$15,000
$20,000
$25,000
$30,000
- 50,000 100,000 150,000
Co
nse
nt
Ch
arge
Consent limit m3/d
Status quo (2015/16)
Status quo (2016/17)
$-
$1,000
$2,000
$3,000
$4,000
$5,000
$6,000
$7,000
- 2,000 4,000 6,000 8,000 10,000 12,000
Co
nse
nt
Ch
arge
Consent limit m3/d
Status quo (2015/16)
Status quo (2016/17)
127
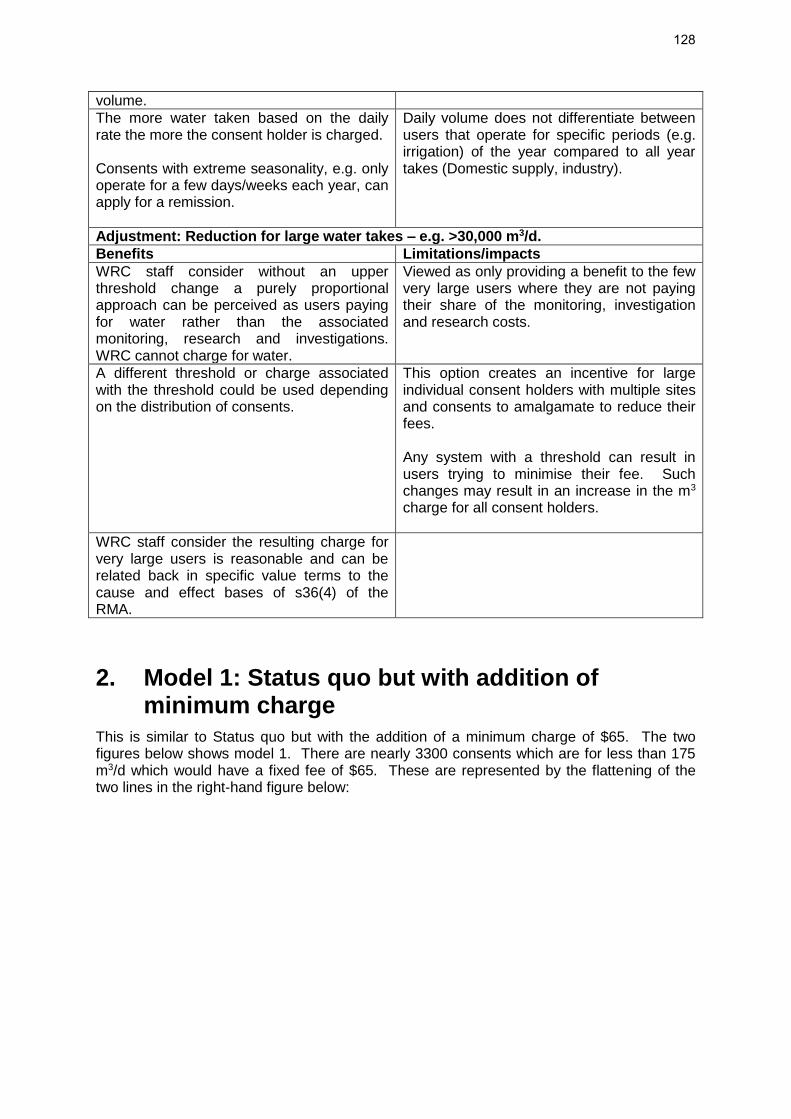
volume. The more water taken based on the daily rate the more the consent holder is charged. Consents with extreme seasonality, e.g. only operate for a few days/weeks each year, can apply for a remission.
Daily volume does not differentiate between users that operate for specific periods (e.g. irrigation) of the year compared to all year takes (Domestic supply, industry).
Adjustment: Reduction for large water takes – e.g. >30,000 m3/d. Benefits Limitations/impacts WRC staff consider without an upper threshold change a purely proportional approach can be perceived as users paying for water rather than the associated monitoring, research and investigations. WRC cannot charge for water.
Viewed as only providing a benefit to the few very large users where they are not paying their share of the monitoring, investigation and research costs.
A different threshold or charge associated with the threshold could be used depending on the distribution of consents.
This option creates an incentive for large individual consent holders with multiple sites and consents to amalgamate to reduce their fees. Any system with a threshold can result in users trying to minimise their fee. Such changes may result in an increase in the m3 charge for all consent holders.
WRC staff consider the resulting charge for very large users is reasonable and can be related back in specific value terms to the cause and effect bases of s36(4) of the RMA.
2. Model 1: Status quo but with addition of minimum charge
This is similar to Status quo but with the addition of a minimum charge of $65. The two figures below shows model 1. There are nearly 3300 consents which are for less than 175 m3/d which would have a fixed fee of $65. These are represented by the flattening of the two lines in the right-hand figure below:
128

A consequence of this approach is the charge decreases from $0.44 to $0.37 for less than 30,000 m3/d and remains at $0.12 for greater than 30,000 m3/d. A minimum charge of $65 is applied to all consents less than 175 m3/d. This minimum charge, if implemented, would apply to 3,267 consent holders and provide $211,380 in charges compared to $78,325 under the status quo 2015/16. If the 2014/15 lowest step charge of $128 was applied to these 3267 small consent holders this would provide $416,256. For the majority of medium to large consents (see following table and figure), model 1: status quo but with a minimum charge, the charge is about 70% of those for 2015/16. Model 1 charges are about 84% of the current charges for 2016/17. The following is a summary of charges for a typical range of consents:
m3/d Projected 2016/17 charges $0.37/0.12
& min $65
Pre 2014/15 stepped charge
Current charge 2015/16 $0.53/0.1
Projected 2016/17 charges
$0.44/0.12 50 $ 65.00 $ 128.00 $ 26.50 $ 22.00
500 $ 185.00 $ 203.00 $ 265.00 $ 220.00 1,000 $ 370.00 $ 203.00 $ 530.00 $ 440.00 2,000 $ 740.00 $ 737.00 $1,060.00 $ 880.00 5,000 $ 1,850.00 $ 737.00 $2,650.00 $2,200.00 7,500 $ 2,775.00 $ 737.00 $3,975.00 $3,300.00
10,000 $ 3,700.00 $ 737.00 $5,300.00 $4,400.00 10,001 $ 3,700.37 $11,841.00 $5,300.53 $4,400.44
0
5000
10000
15000
20000
25000
30000
- 50,000 100,000 150,000
Co
nse
nt
Ch
arge
Consent limit m3/d
2014/15
M1 Status quo (2016/17) & minimum
0
50
100
150
200
250
300
350
400
450
500
- 200 400 600 800 1,000
Co
nse
nt
Ch
arge
Consent limit m3/d
2014/15
M1 Status quo (2016/17) & minimum
129

For the large users there is little difference between the charge for the Status quo 2015/16,current charge 2016/17 and model 1 (status quo with minimum). Summary of charges for largest users:
Projected 2016/17 charges $0.37/0.12
& min $65
Existing charge 2016/17
$0.44/0.12
Existing charge 2015/16
$0.53/0.10
step charge 2014/15
Top 2 consents $ 57,000 $ 61,200 $ 60,800 $ 23,682
% of total revenue 5% 6% 5% 2%
% of consumptive allocation 12% 12% 12% 12%
Top 6 consents $ 134,210 $ 146,810 $ 151,742 $ 71,046
% of total revenue 12% 13% 12% 6%
% of consumptive allocation 26% 26% 26% 26%
The following table summarises the benefits and limitations/impacts of this model as determined by Staff and Mr Phillips: Daily limit for setting charges Benefits Limitations/impacts Utilises most readily available and complete consent information – being daily volume. Nearly all consents have a daily limit specified in their consent certificates.
WRC costs associated with research and investigation are largely driven by summer allocation levels which are generally better represented by the daily volume than annual volume.
The more water taken based on the daily rate the more the consent holder is charged. Consents with extreme seasonality, e.g. only
Daily volume does not differentiate between users that operate for specific periods (e.g. irrigation) of the year compared to all year takes (Domestic supply, industry).
-
5,000.00
10,000.00
15,000.00
20,000.00
25,000.00
30,000.00
- 50,000 100,000 150,000
Co
nse
nt
Ch
arge
Consent limit m3/d
Status quo (2015/16)
2014/15
M1 Status quo (2016/17) & minimum
Status quo (2016/17)
-
50.00
100.00
150.00
200.00
250.00
300.00
350.00
400.00
450.00
500.00
- 200 400 600 800 1,000
Co
nse
nt
Ch
arge
Consent limit m3/d
Status quo (2015/16)
2014/15
M1 Status quo (2016/17) & minimum
Status quo (2016/17)
130

operate for a few days/weeks each year, can apply for a remission.
Adjustment: Reduction for large water takes – e.g. >30,000 m3/d. Benefits Limitations/impacts WRC staff consider without an upper threshold change a purely proportional approach can be perceived as users paying for water rather than the associated monitoring, research and investigations. WRC cannot charge for water.
Viewed as only providing a benefit to the few very large users where they are not paying their share of the monitoring, investigation and research costs.
A different threshold or charge associated with the threshold could be used depending on the distribution of consents.
This option creates an incentive for large individual consent holders with multiple sites and consents to amalgamate to reduce their fees. Any system with a threshold can result in users trying to minimise their fee. Such changes may result in an increase in the m3 charge for all consent holders.
WRC staff consider the resulting charge for very large users is reasonable and can be related back in specific value terms to the cause and effect bases of s36(4) of the RMA.
Adjustment: Minimum base charge to all consents Benefits Limitations/impacts Can bring in a relatively large total of revenue while only adding a nominal additional cost to all consents.
A minimum base charge for consent holders with small takes is likely to be less than the charges levied in 2014/15 with the two lowest step charges being $128 and $203.
This amount though nominal can be very large in relation to the small size of the majority of water takes in the region. There are over 3000 new dairy shed consents for which this charge could apply. Introduction of a minimum fixed charge would result in a proportionately high increase for many consent holders from the charges they have received in 2015/16. The majority of those affected will be holders of new dairy shed consents, where the first charges they received were the minimal charges for 2015/16. The reason for the change would need to be carefully communicated to this sector. Consideration of a maximum % increase in charges has been requested – this may need to be considered for this group under this scenario.
131

Would reduce the charge required from the small number of larger water takes in the region.
May be viewed as a subsidy from the small users to the larger users.
A minimum base charge recognises that a proportion of the costs of monitoring are fixed, and so should be shared equitably across all consent holders.
The amount to charge could be subjective and not easily related back in specific value terms to the cause and effect bases of s36(4) of the RMA.
3. Model 2: Annualised with no reduction above 30,000 m3/d Consent charges are based on a proportion of the annual net take allocation limit, represented as an average daily value, and no reduction for large water takes. This in essence results in two separate charge regimes depending if a take is seasonal (e.g. irrigation) or if it can operate all year (others) – see following figure:
This charge is based on using the consented annual limit where available or a derived value where it is not. About 40% of the major consents do not have an annual limit specified in their consent and a value would need to be derived. The benefit of an annualised charge is that for consents operated for only part of the year the amount of water applied to their charge is reduced when calculated as a daily average take. For example, an irrigation take for 5,000 m3/d is assumed to operate for 140 days and gives an annual total of 700,000 m3/yr. When smoothed over the whole year (divided by 365 days) this is equivalent to 1,918 m3/d. It is this lesser value for which a charge is applied. In contrast a 5,000 m3/d consent for industry or domestic supply which does not have a limit is assumed to operate 365 days and the charge is based on 5,000 m3/d. A consequence of this approach, where some consents are reduced in size, is that the charge per cubic metre increases from $0.44 to $0.52 for less than 30,000 m3/d and $0.12 to $0.52 for greater than 30,000 m3/d. As shown by the summary table below this results in the irrigation consents being charged about a third of the charge of identically sized water takes
$-
$10,000
$20,000
$30,000
$40,000
$50,000
$60,000
$70,000
$80,000
$90,000
- 50,000 100,000 150,000
Co
nse
nt
Ch
arge
Consent limit m3/d
M2 Annualised charge (Irrigation)
M2 Annualised charge (other)
132
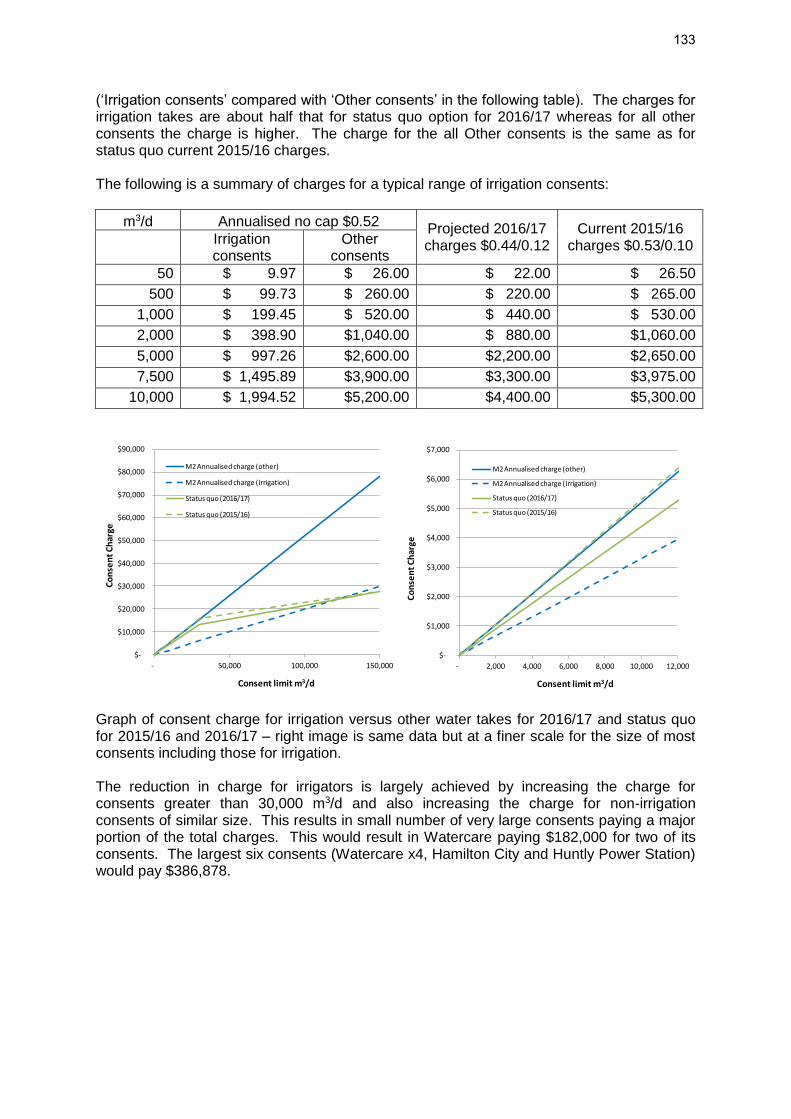
(‘Irrigation consents’ compared with ‘Other consents’ in the following table). The charges for irrigation takes are about half that for status quo option for 2016/17 whereas for all other consents the charge is higher. The charge for the all Other consents is the same as for status quo current 2015/16 charges. The following is a summary of charges for a typical range of irrigation consents:
m3/d Annualised no cap $0.52 Projected 2016/17 charges $0.44/0.12
Current 2015/16 charges $0.53/0.10
Irrigation consents
Other consents
50 $ 9.97 $ 26.00 $ 22.00 $ 26.50 500 $ 99.73 $ 260.00 $ 220.00 $ 265.00
1,000 $ 199.45 $ 520.00 $ 440.00 $ 530.00 2,000 $ 398.90 $1,040.00 $ 880.00 $1,060.00 5,000 $ 997.26 $2,600.00 $2,200.00 $2,650.00 7,500 $ 1,495.89 $3,900.00 $3,300.00 $3,975.00
10,000 $ 1,994.52 $5,200.00 $4,400.00 $5,300.00
Graph of consent charge for irrigation versus other water takes for 2016/17 and status quo for 2015/16 and 2016/17 – right image is same data but at a finer scale for the size of most consents including those for irrigation. The reduction in charge for irrigators is largely achieved by increasing the charge for consents greater than 30,000 m3/d and also increasing the charge for non-irrigation consents of similar size. This results in small number of very large consents paying a major portion of the total charges. This would result in Watercare paying $182,000 for two of its consents. The largest six consents (Watercare x4, Hamilton City and Huntly Power Station) would pay $386,878.
$-
$10,000
$20,000
$30,000
$40,000
$50,000
$60,000
$70,000
$80,000
$90,000
- 50,000 100,000 150,000
Co
nse
nt
Ch
arge
Consent limit m3/d
M2 Annualised charge (other)
M2 Annualised charge (Irrigation)
Status quo (2016/17)
Status quo (2015/16)
$-
$1,000
$2,000
$3,000
$4,000
$5,000
$6,000
$7,000
- 2,000 4,000 6,000 8,000 10,000 12,000
Co
nse
nt
Ch
arge
Consent limit m3/d
M2 Annualised charge (other)
M2 Annualised charge (Irrigation)
Status quo (2016/17)
Status quo (2015/16)
133

Summary of charges for largest users:
Annualised
charge $0.52
Existing charge 2016/17
$0.44/0.12
Existing charge 2015/16
$0.53/0.10
step charge 2014/15
Top 2 consents $ 182,000 $ 61,200 $ 60,800 $ 23,682
% of total revenue 17% 6% 5% 2%
% of consumptive allocation 18% 12% 12% 12%
Top 6 consents $ 386,878 $ 146,810 $ 151,742 $ 71,046
% of total revenue 36% 13% 12% 6%
% of consumptive allocation 38% 26% 26% 26%
The following table summarises the benefits and limitations/impacts of this model as determined by Staff and Mr Phillips: Annualising water takes for setting limits Benefits Limitations/impacts Reduced the potential charge for consents which have a high daily limit but low annual limit. E.g. are only used for short periods during the year.
WRC costs associated with research and investigation are largely driven by summer allocation levels which are generally better represented by the daily volume than annual volume. The annual volume does not distribute charges evenly based on users who cause the need for majority of monitoring and investigations. Summer users even though they may operate for less than 120 days cause the greatest allocation pressure during the summer. Annual volume could be weighted depending on time of year of operation – greater weight on summer consents compared to all year round or winter takes.
Of the 1,053 consents 385 or 36.5% are for Irrigation/Frost protection where consent conditions may be able to be reviewed in order to set an annual limit for the purpose of these charges. There may be others that have similar constraints outside of irrigation that also need to be considered. All of the irrigation consents are recorded as such and very few do not have an annual limit and those that do not are seasonally limited to a number of days, or are in the process of renewal where limits are being applied
Incomplete data to action this. Up to 45% of all water take consents do not have a specified seasonal or annual limit. Any annual based charge for irrigation / frost protection consents would need to be inferred. Inferred rates would also need to be considered for other sectors where takes may not be exercised uniformly over the year. This may even apply to consents with an annual limit. Changing of consent condition would incur additional charges to the consent holder.
If not otherwise stated, takes for more than 183 days equivalent may be deemed to be annualised at the peak daily rate. Takes that have fewer than 183 days equivalent are annualised based on the actual availability
Where consent holders believe that they should have an annual limit of less than 183 days they can apply for a consent variation. Changing of consent condition would incur
134

additional charges to the consent holder. The ability to implement a charging structure such as this would require additional administration and may be difficult to convey to consent holders. Greater likelihood of WRC receiving a large number of remission requests to modify the annualised rate assessed by WRC. A buffer would need to be built in to deal with the cost of this process.
Annual volume on its own does not provide for the situation that much of the WRC costs associated with research and investigation are driven by summer allocation levels which are generally better represented by the daily volume.
4. Model 3: Annualised with reduction above 30,000 m3/d and increased weighting for summer takes
This model builds on the annualised model (model 2 where consent charges are based on a proportion of the annual net take allocation limit, represented as an average daily value) but attempts to address a number of the concerns raised by staff by including a lower charge for takes greater than 30,000 m3/d and increasing the charge for seasonal takes. As with model 2 this in essence results in two separate charge regimes depending if a take is seasonal (e.g. irrigation) or if it can operate all year (others) – see following figure.
$-
$10,000.00
$20,000.00
$30,000.00
$40,000.00
$50,000.00
$60,000.00
- 50,000 100,000 150,000
Co
nse
nt
Ch
arge
Consent limit m3/d
M3 Annualised, seasonal & cap (Irrigation)
M3 Annualised, seasonal & cap (other)
135

The seasonal takes (primarily for irrigation) are calculated as for Model 1 but with a lower charge for above 30,000 m3/d and a scaling factor for seasonal takes. The seasonal factor increases the charge from around 38%5 of an equivalent consent to 57%6 of an equivalent consent. For example, a consent for 5,000 m3/d when annualised (as per model 1) is 1,918 m3/d but with an adjustment is increased to 2,877 m3/d.7 A consequence of this model, compared to status quo, is the charge increases from $0.44 to $0.57 for less than 30,000 m3/d and $0.12 to $0.285 for greater than 30,000 m3/d. As shown by the summary table below, this results in the irrigation consents being charged about 60 per cent of the charge of identically sized water takes. The charges for irrigation takes are about 75% of that for status quo option whereas for all other consents it is more expensive. The following is a summary of charges for a typical range of irrigation consents:
m3/d Annualised $0.57/$0.285 factor 1.5 Projected 2016/17 charges $0.44/0.12
Current 2015/16 charges $0.53/0.10
Irrigation consents
Other consents
50 $ 16.40 $ 28.50 $ 22.00 $ 26.50 500 $ 163.97 $ 285.00 $ 220.00 $ 265.00
1,000 $ 327.95 $ 570.00 $ 440.00 $ 530.00 2,000 $ 655.89 $1,140.00 $ 880.00 $1,060.00 5,000 $ 1,639.73 $2,850.00 $2,200.00 $2,650.00 7,500 $ 2,459.59 $4,275.00 $3,300.00 $3,975.00
10,000 $ 3,279.45 $5,700.00 $4,400.00 $5,300.00
Graph of consent charge for irrigation versus other water takes for 2016/17 and status quo for 2015/16 and 2016/17 – right image is same data but at a finer scale for the size of most consents including those for irrigation. This model still results in small number of very large consents paying a major portion of the total charges. This would result in Watercare paying $117,000 for two of its consents. The
5 Assuming 140 days operation for an irrigation consent, 140/365 days = 38%. Where year round consents operate for 365 days.
6 Assuming 140 days operation for an irrigation consent. 140 days * 1.5 scaling factor gives 210 days. 210/365 days = 57%. 7 Adjustment factor consider appropriate by Mr Phillips was 1.5.
$-
$10,000
$20,000
$30,000
$40,000
$50,000
$60,000
- 50,000 100,000 150,000
Co
nse
nt
Ch
arge
Consent limit m3/d
M3 Annualised, seasonal & cap (other)
M3 Annualised, seasonal & cap (Irrigation)
Status quo (2016/17)
Status quo (2015/16)
$-
$1,000
$2,000
$3,000
$4,000
$5,000
$6,000
$7,000
- 2,000 4,000 6,000 8,000 10,000 12,000
Co
nse
nt
Ch
arge
Consent limit m3/d
M3 Annualised, seasonal & cap (other)
M3 Annualised, seasonal & cap (Irrigation)
Status quo (2016/17)
Status quo (2015/16)
136

largest six consents (Watercare x4, Hamilton City and Huntly Power Station) would pay $263,175. Summary of charges for largest users:
Annualised charge $0.57/0.285 and
summer factor of 1.5
Existing charge 2016/17
$0.44/0.12
Existing charge 2015/16
$0.53/0.10
step charge 2014/15
Top 2 consents $ 116,850 $ 61,200 $ 60,800 $ 23,682
% of total revenue 11% 6% 5% 2%
% of consumptive allocation 16% 12% 12% 12%
Top 6 consents $ 263,175 $ 146,810 $ 151,742 $ 71,046
% of total revenue 25% 13% 12% 6%
% of consumptive allocation 35% 26% 26% 26%
The following table summarises the benefits and limitations/impacts of this model as determined by Staff and Mr Phillips: Annualising water takes for setting limits Benefits Limitations/impacts Reduced the potential charge for consents which have a high daily limit but low annual limit. E.g. are only used for short periods during the year.
WRC costs associated with research and investigation are largely driven by summer allocation levels which are generally better represented by the daily volume than annual volume. The annual volume does not distribute charges evenly based on users who cause the need for majority of monitoring and investigations. Summer users even though they may operate for less than 120 days cause the greatest allocation pressure during the summer. Annual volume could be weighted depending on time of year of operation – greater weight on summer consents compared to all year round or winter takes.
Of the 1,053 consents 385 or 36.5% are for Irrigation/Frost protection where consent conditions may be able to be reviewed in order to set an annual limit for the purpose of these charges. There may be others that have similar constraints outside of irrigation that also need to be considered.
Incomplete data to action this. Up to 45% of all water take consents do not have a specified seasonal or annual limit. Any annual based charge for irrigation / frost protection consents would need to be inferred. Inferred rates would also need to be considered for other sectors where takes may not be exercised uniformly over the year. This may even apply to consents with an annual limit. Changing of consent condition would incur additional charges to the consent holder.
137

If not otherwise stated, takes for more than 183 days equivalent may be deemed to be annualised at the peak daily rate. Takes that have fewer than 183 days equivalent are annualised based on the actual availability
Where consent holders believe that they should have an annual limit of less than 183 days they can apply for a consent variation. Changing of consent condition would incur additional charges to the consent holder. The ability to implement a charging structure such as this would require additional administration and may be difficult to convey to consent holders. Greater likelihood of WRC receiving a large number of remission requests to modify the annualised rate assessed by WRC. A buffer would need to be built in to deal with the cost of this process.
Annual volume on its own does not provide for the situation that much of the WRC costs associated with research and investigation are driven by summer allocation levels which are generally better represented by the daily volume.
Adjustment: Reduction for large water takes – e.g. >30,000 m3/d. Benefits Limitations/impacts WRC staff consider without an upper threshold change a purely proportional approach can be perceived as users paying for water rather than the associated monitoring, research and investigations. WRC cannot charge for water.
Viewed as only providing a benefit to the few very large users where they are not paying their share of the monitoring, investigation and research costs.
A different threshold or charge associated with the threshold could be used depending on the distribution of consents.
This option creates an incentive for large individual consent holders with multiple sites and consents to amalgamate to reduce their fees. Any system with a threshold can result in users trying to minimise their fee. Such changes may result in an increase in the m3 charge for all consent holders.
WRC staff consider the resulting charge for very large users is reasonable and can be related back in specific value terms to the cause and effect bases of s36(4) of the RMA.
Adjustment: weighting factor for increasing charge to summer seasonal takes Benefits Limitations/impacts Distributes the charge in a more similar way for both seasonal and all year round consents.
No guidance available on what is a suitable factor.
138

Staff consider a high factor should be used as seasonal takes occur at the critical time of year. This therefore reduces the benefits identified by the irrigators for using the annualised approach.
5. Model 4: Annualised with reduction above 30,000 m3/d, increased weighting for summer takes and minimum charge
This is similar to Model 3, but with the inclusion of a minimum charge. The two figures below show model 3. There are nearly 3300 consents which are for less than 200 m3/d which would have a fixed fee of $65. These are represented by the flattening of the two lines in the right-hand figure below. As with models 2 and 3 this in essence results in two separate charge regimes depending if a take is seasonal (e.g. irrigation) or if it can operate all year (others).
A consequence of this approach is the charge increases from $0.44 to $0.50 for less than 30,000 m3/d and $0.12 to $0.25 for greater than 30,000 m3/d. A minimum charge of $65 is applied to all consents less than 130 m3/d. This minimum charge, if implemented, would apply to 3,267 consent holders and provide $212,355 in charges (~20% of the total charges) compared to $78,325 under the status quo. As shown by the summary table below, this results in the irrigation consents being charged about 57 per cent of the charge of identically sized water takes. The charges for irrigation takes are about 65% of that for status quo 2016/17 whereas for all other consents the charges are about 10% higher than the status quo 2016/17 and similar to the current 2015/16 charges. The offset in charge for the 95 most impacted irrigation consent holders, with greater than $1,000 increase in 2015/16 charge, is largely provided by increasing the charge via a flat fee for 3,267 small users primarily for dairy shed water. The following is a summary of charges for a typical range of irrigation consents:
$-
$5,000.00
$10,000.00
$15,000.00
$20,000.00
$25,000.00
$30,000.00
$35,000.00
$40,000.00
$45,000.00
$50,000.00
- 50,000 100,000 150,000
Co
nse
nt
Ch
arge
Consent limit m3/d
M4 Annualised, seasonal, cap & min (Irrigation)
M4 Annualised, seasonal, cap & min (other)
$-
$50.00
$100.00
$150.00
$200.00
$250.00
$300.00
$350.00
$400.00
$450.00
$500.00
- 200 400 600 800 1,000
Co
nse
nt
Ch
arge
Consent limit m3/d
M4 Annualised, seasonal, cap & min (Irrigation)
M4 Annualised, seasonal, cap & min (other)
139
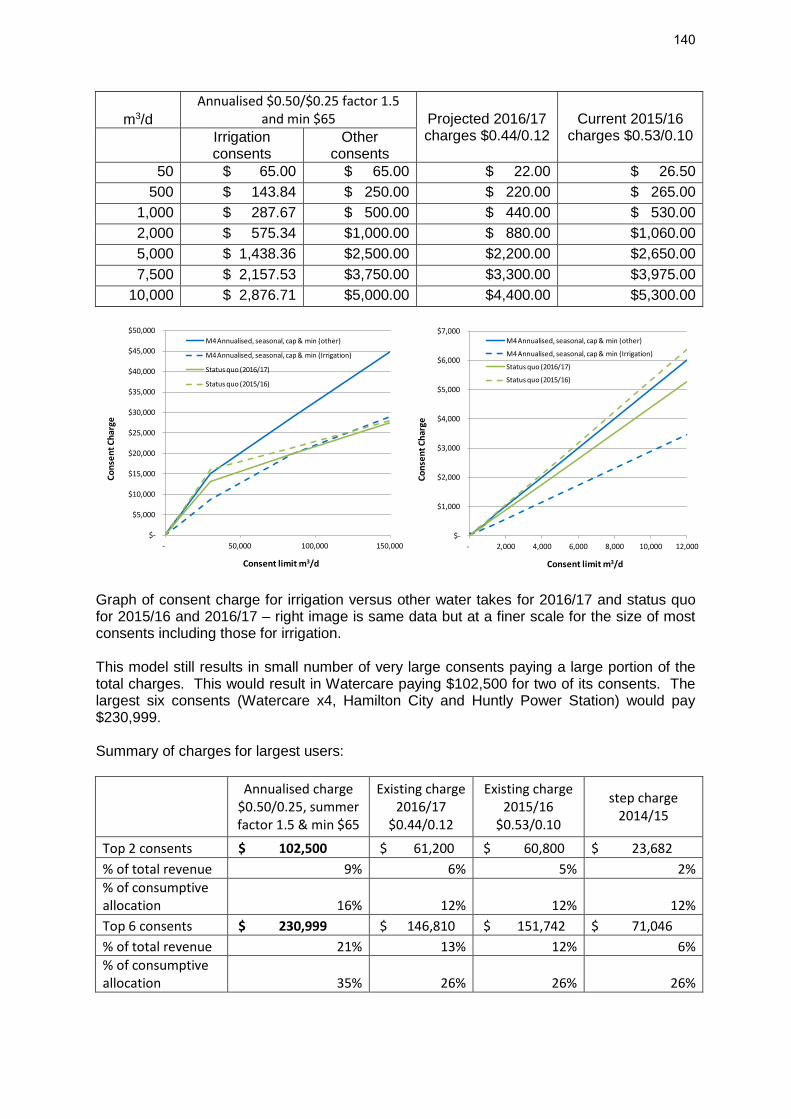
m3/d Annualised $0.50/$0.25 factor 1.5
and min $65 Projected 2016/17 charges $0.44/0.12
Current 2015/16 charges $0.53/0.10
Irrigation consents
Other consents
50 $ 65.00 $ 65.00 $ 22.00 $ 26.50 500 $ 143.84 $ 250.00 $ 220.00 $ 265.00
1,000 $ 287.67 $ 500.00 $ 440.00 $ 530.00 2,000 $ 575.34 $1,000.00 $ 880.00 $1,060.00 5,000 $ 1,438.36 $2,500.00 $2,200.00 $2,650.00 7,500 $ 2,157.53 $3,750.00 $3,300.00 $3,975.00
10,000 $ 2,876.71 $5,000.00 $4,400.00 $5,300.00
Graph of consent charge for irrigation versus other water takes for 2016/17 and status quo for 2015/16 and 2016/17 – right image is same data but at a finer scale for the size of most consents including those for irrigation. This model still results in small number of very large consents paying a large portion of the total charges. This would result in Watercare paying $102,500 for two of its consents. The largest six consents (Watercare x4, Hamilton City and Huntly Power Station) would pay $230,999. Summary of charges for largest users:
Annualised charge $0.50/0.25, summer factor 1.5 & min $65
Existing charge 2016/17
$0.44/0.12
Existing charge 2015/16
$0.53/0.10
step charge 2014/15
Top 2 consents $ 102,500 $ 61,200 $ 60,800 $ 23,682
% of total revenue 9% 6% 5% 2%
% of consumptive allocation 16% 12% 12% 12%
Top 6 consents $ 230,999 $ 146,810 $ 151,742 $ 71,046
% of total revenue 21% 13% 12% 6%
% of consumptive allocation 35% 26% 26% 26%
$-
$5,000
$10,000
$15,000
$20,000
$25,000
$30,000
$35,000
$40,000
$45,000
$50,000
- 50,000 100,000 150,000
Co
nse
nt
Ch
arge
Consent limit m3/d
M4 Annualised, seasonal, cap & min (other)
M4 Annualised, seasonal, cap & min (Irrigation)
Status quo (2016/17)
Status quo (2015/16)
$-
$1,000
$2,000
$3,000
$4,000
$5,000
$6,000
$7,000
- 2,000 4,000 6,000 8,000 10,000 12,000
Co
nse
nt
Ch
arge
Consent limit m3/d
M4 Annualised, seasonal, cap & min (other)
M4 Annualised, seasonal, cap & min (Irrigation)
Status quo (2016/17)
Status quo (2015/16)
140

The following table summarises the benefits and limitations/impacts of this model as determined by Staff and Mr Phillips: Annualising water takes for setting limits Benefits Limitations/impacts Reduced the potential charge for consents which have a high daily limit but low annual limit. E.g. are only used for short periods during the year.
WRC costs associated with research and investigation are largely driven by summer allocation levels which are generally better represented by the daily volume than annual volume. The annual volume does not distribute charges evenly based on users who cause the need for majority of monitoring and investigations. Summer users even though they may operate for less than 120 days cause the greatest allocation pressure during the summer. Annual volume could be weighted depending on time of year of operation – greater weight on summer consents compared to all year round or winter takes.
Of the 1,053 consents 385 or 36.5% are for Irrigation/Frost protection where consent conditions may be able to be reviewed in order to set an annual limit for the purpose of these charges. There may be others that have similar constraints outside of irrigation that also need to be considered.
Incomplete data to action this. Up to 45% of all water take consents do not have a specified seasonal or annual limit. Any annual based charge for irrigation / frost protection consents would need to be inferred. Inferred rates would also need to be considered for other sectors where takes may not be exercised uniformly over the year. This may even apply to consents with an annual limit. Changing of consent condition would incur additional charges to the consent holder.
If not otherwise stated, takes for more than 183 days equivalent may be deemed to be annualised at the peak daily rate. Takes that have fewer than 183 days equivalent are annualised based on the actual availability
Where consent holders believe that they should have an annual limit of less than 183 days they can apply for a consent variation. Changing of consent condition would incur additional charges to the consent holder. The ability to implement a charging structure such as this would require additional administration and may be difficult to convey to consent holders. Greater likelihood of WRC receiving a large number of remission requests to modify the annualised rate assessed by WRC. A buffer would need to be built in to deal with the cost of this process.
141

Annual volume on its own does not provide for the situation that much of the WRC costs associated with research and investigation are driven by summer allocation levels which are generally better represented by the daily volume.
Adjustment: Reduction for large water takes – e.g. >30,000 m3/d. Benefits Limitations/impacts WRC staff consider without an upper threshold change a purely proportional approach can be perceived as users paying for water rather than the associated monitoring, research and investigations. WRC cannot charge for water.
Viewed as only providing a benefit to the few very large users where they are not paying their share of the monitoring, investigation and research costs.
A different threshold or charge associated with the threshold could be used depending on the distribution of consents.
This option creates an incentive for large individual consent holders with multiple sites and consents to amalgamate to reduce their fees. Any system with a threshold can result in users trying to minimise their fee. Such changes may result in an increase in the m3 charge for all consent holders.
WRC staff consider the resulting charge for very large users is reasonable and can be related back in specific value terms to the cause and effect bases of s36(4) of the RMA.
Adjustment: weighting factor for increasing charge to summer seasonal takes Benefits Limitations/impacts Distributes the charge in a more similar way for both seasonal and all year round consents.
No guidance available on what is a suitable factor. Staff consider a high factor should be used as seasonal takes occur at the critical time of year. This therefore reduces the benefits identified by the irrigators for using the annualised approach.
Adjustment: Minimum base charge to all consents Benefits Limitations/impacts Can bring in a relatively large total of revenue while only adding a nominal additional cost to all consents.
A minimum base charge for consent holders with small takes is likely to be less than the charges levied in 2014/15 with the two lowest step chares being $128 and $203.
This amount though nominal can be very large in relation to the small size of the majority of water takes in the region. There are over 3000 new dairy shed consents for which this charge could apply. Introduction of a minimum fixed charge would result in a proportionately high
142
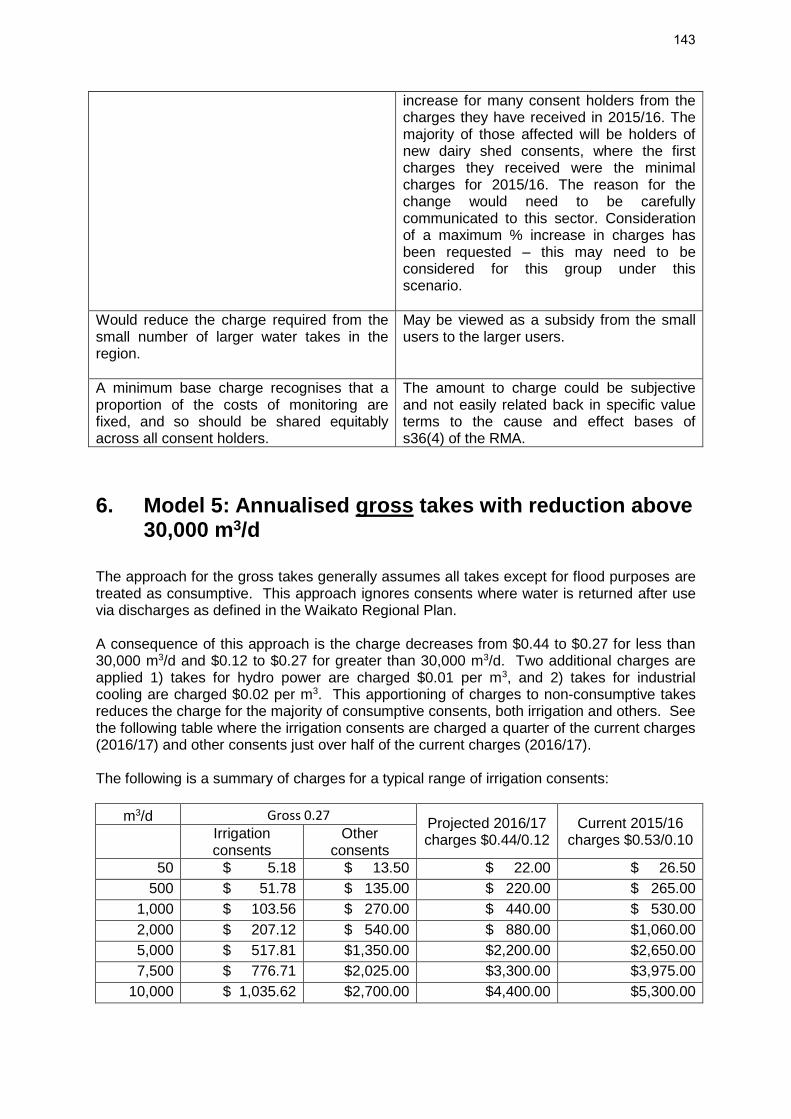
increase for many consent holders from the charges they have received in 2015/16. The majority of those affected will be holders of new dairy shed consents, where the first charges they received were the minimal charges for 2015/16. The reason for the change would need to be carefully communicated to this sector. Consideration of a maximum % increase in charges has been requested – this may need to be considered for this group under this scenario.
Would reduce the charge required from the small number of larger water takes in the region.
May be viewed as a subsidy from the small users to the larger users.
A minimum base charge recognises that a proportion of the costs of monitoring are fixed, and so should be shared equitably across all consent holders.
The amount to charge could be subjective and not easily related back in specific value terms to the cause and effect bases of s36(4) of the RMA.
6. Model 5: Annualised gross takes with reduction above 30,000 m3/d
The approach for the gross takes generally assumes all takes except for flood purposes are treated as consumptive. This approach ignores consents where water is returned after use via discharges as defined in the Waikato Regional Plan. A consequence of this approach is the charge decreases from $0.44 to $0.27 for less than 30,000 m3/d and $0.12 to $0.27 for greater than 30,000 m3/d. Two additional charges are applied 1) takes for hydro power are charged $0.01 per m3, and 2) takes for industrial cooling are charged $0.02 per m3. This apportioning of charges to non-consumptive takes reduces the charge for the majority of consumptive consents, both irrigation and others. See the following table where the irrigation consents are charged a quarter of the current charges (2016/17) and other consents just over half of the current charges (2016/17). The following is a summary of charges for a typical range of irrigation consents:
m3/d Gross 0.27 Projected 2016/17 charges $0.44/0.12
Current 2015/16 charges $0.53/0.10
Irrigation consents
Other consents
50 $ 5.18 $ 13.50 $ 22.00 $ 26.50 500 $ 51.78 $ 135.00 $ 220.00 $ 265.00
1,000 $ 103.56 $ 270.00 $ 440.00 $ 530.00 2,000 $ 207.12 $ 540.00 $ 880.00 $1,060.00 5,000 $ 517.81 $1,350.00 $2,200.00 $2,650.00 7,500 $ 776.71 $2,025.00 $3,300.00 $3,975.00
10,000 $ 1,035.62 $2,700.00 $4,400.00 $5,300.00
143
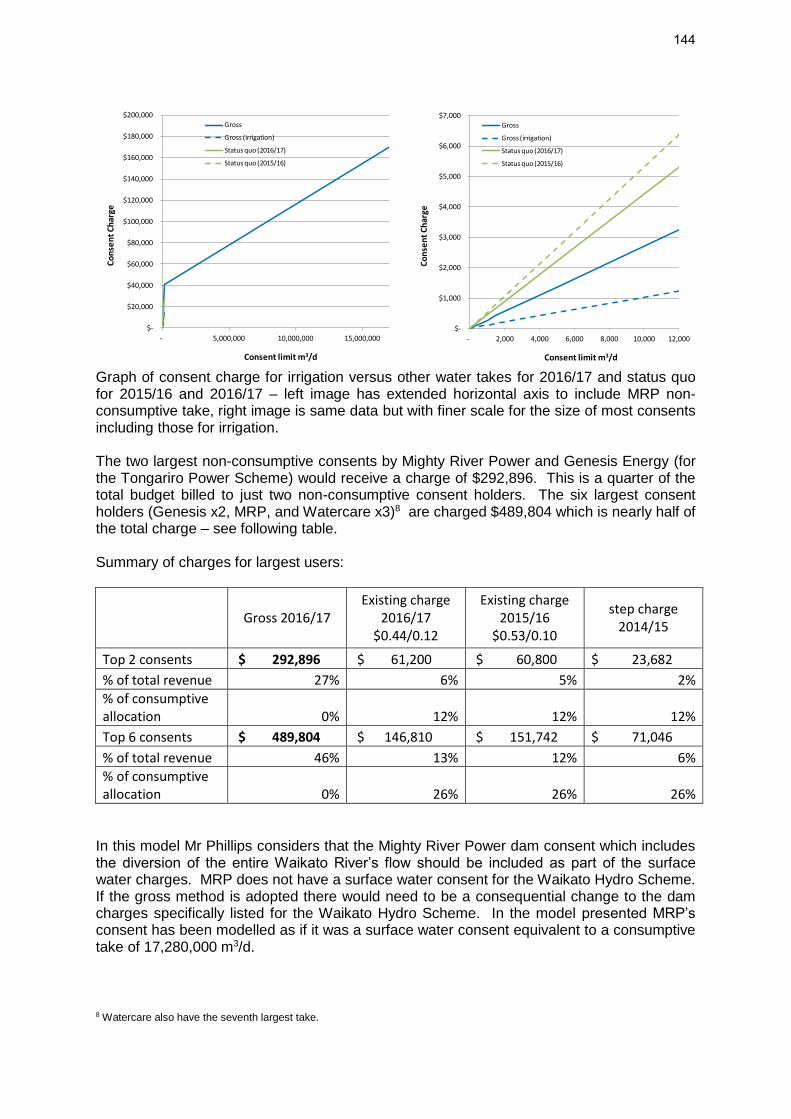
Graph of consent charge for irrigation versus other water takes for 2016/17 and status quo for 2015/16 and 2016/17 – left image has extended horizontal axis to include MRP non-consumptive take, right image is same data but with finer scale for the size of most consents including those for irrigation. The two largest non-consumptive consents by Mighty River Power and Genesis Energy (for the Tongariro Power Scheme) would receive a charge of $292,896. This is a quarter of the total budget billed to just two non-consumptive consent holders. The six largest consent holders (Genesis x2, MRP, and Watercare x3)8 are charged $489,804 which is nearly half of the total charge – see following table. Summary of charges for largest users:
Gross 2016/17
Existing charge 2016/17
$0.44/0.12
Existing charge 2015/16
$0.53/0.10
step charge 2014/15
Top 2 consents $ 292,896 $ 61,200 $ 60,800 $ 23,682
% of total revenue 27% 6% 5% 2%
% of consumptive allocation 0% 12% 12% 12%
Top 6 consents $ 489,804 $ 146,810 $ 151,742 $ 71,046
% of total revenue 46% 13% 12% 6%
% of consumptive allocation 0% 26% 26% 26%
In this model Mr Phillips considers that the Mighty River Power dam consent which includes the diversion of the entire Waikato River’s flow should be included as part of the surface water charges. MRP does not have a surface water consent for the Waikato Hydro Scheme. If the gross method is adopted there would need to be a consequential change to the dam charges specifically listed for the Waikato Hydro Scheme. In the model presented MRP’s consent has been modelled as if it was a surface water consent equivalent to a consumptive take of 17,280,000 m3/d.
8 Watercare also have the seventh largest take.
$-
$20,000
$40,000
$60,000
$80,000
$100,000
$120,000
$140,000
$160,000
$180,000
$200,000
- 5,000,000 10,000,000 15,000,000
Co
nse
nt
Ch
arge
Consent limit m3/d
Gross
Gross (irrigation)
Status quo (2016/17)
Status quo (2015/16)
$-
$1,000
$2,000
$3,000
$4,000
$5,000
$6,000
$7,000
- 2,000 4,000 6,000 8,000 10,000 12,000
Co
nse
nt
Ch
arge
Consent limit m3/d
Gross
Gross (irrigation)
Status quo (2016/17)
Status quo (2015/16)
144

annual gross take allocation limit Benefits Limitations/impacts Hydro generation is benefiting from the water and is effectively limiting the availability of water to the rest of the community.
High likelihood of legal challenge by those receiving a large charge for a non-consumptive activity. Staff consider they could not defend non-consumptive takes being charged considerable more than consumptive takes.
WRC costs associated with research and investigation are largely driven by summer consumptive allocation levels which are generally better represented by daily net take values.
Adjustment: Reduction for large water takes – e.g. >30,000 m3/d. Benefits Limitations/impacts WRC staff consider without an upper threshold change a purely proportional approach can be perceived as users paying for water rather than the associated monitoring, research and investigations. WRC cannot charge for water.
Viewed as only providing a benefit to the few very large users where they are not paying their share of the monitoring, investigation and research costs.
A different threshold or charge associated with the threshold could be used depending on the distribution of consents.
This option creates an incentive for large individual consent holders with multiple sites and consents to amalgamate to reduce their fees. Any system with a threshold can result in users trying to minimise their fee. Such changes may result in an increase in the m3 charge for all consent holders.
WRC staff consider the resulting charge for very large users is reasonable and can be related back in specific value terms to the cause and effect bases of s36(4) of the RMA.
145

Report to Council December 2015 – Decision Required
File No: 56 10 05B
Date: 3 December 2015
To: Chief Executive Officer
From: Director, Science and Strategy
Subject: Annual charges for 2015/16 water take consents
1 Purpose The purpose of this report is to present concerns raised by some consent holders regarding the increase in their 2015/16 Annual charges for water takes and options for Council to consider to address the issues raised. Recommendation: 1. That the report ‘Annual charges for 2015/16 water take consents’ (Doc # 3632744 dated 3
December 2015) be received, and
2. That council confirm that either:
a) all water take annual consent charges should be invoiced according to the fees and charges schedule as outlined in the Long Term Plan 2015-2025 and advise the 212 consent holders previously written to that an extended/deferred payment date of 20 October 2016 be available for payment of the 2015/16 consent charges, or
b) full or part remission (to be determined) be provided to water take consent holders who had existing consents in 2014/15 and new invoices issued.
2 Background Council changed the charging regime for information gathering activities for water takes in the 2015-2025 Long Term Plan (LTP) so that it was based on an amount corresponding to maximum daily water take rate. The information gathering component of the annual charge funds a portion of the Science and Strategy Directorate’s activities (refer section 3). Most consent holders with water takes in 2014/15 have received a reduction in their charge from the new policy but a smaller proportion xx consent holders (about 25%) had significantly higher charges. This impact was anticipated in the LTP decision. Some of these consent holders adversely affected by the new charges, particularly irrigators, have contacted council and expressed concern at the new charges.
146

The following table lists the 20 consent holders with the largest $ increase as a result of the changed policy. Many of the consent holders have more than one consent and the increases shown are the total increase across all the consents. For example Watercare has three separate consents with a combined increase $55,708. Consent holder 2014/15 charge 2015/16 charge Increase Watercare Services Ltd 24,002 79,710 55,708 Wairakei Pastoral Ltd 110,064 151,582 41,517 Waikato North Head Mining Ltd 21,226 33,656 12,430 AS Wilcox and Sons Ltd 4,727 13,873 9,146 Solid Energy New Zealand Ltd 9,980 18,819 8,839 Genesis Energy Ltd 13,149 21,988 8,839 Taupo District Council 20,139 28,933 8,795 New Zealand Steel Mining Ltd 25,295 33,994 8,699 Balle Bros Growers Ltd 11,742 20,088 8,346 DR & CJ Brown 1,436 8,385 6,949 Hauraki District Council 18,512 25,058 6,546 Matamata-Piako District Council 6,677 12,950 6,273 Hamilton City Council 26,164 31,919 5,755 Waikato District Council 5,707 11,195 5,488 New Zealand Steel Ltd 12,001 17,030 5,029 Thames-Coromandel District Council 8,039 13,003 4,964 Trinity Lands Ltd 2,918 7,376 4,459 Hill Family Trusts Partnership 1,148 5,602 4,454 Rangatira 8A17 Trust 574 4,900 4,326 Okuhau Farm Partnership 574 4,900 4,326 TOTAL 324,073 544,962 220,890 Staff wrote to 212 affected consent holders advising them their issues would be raised with councillors at the 15 December 2015 council meeting so that councillors could decide how they wished to deal with the matters raised. The issues raised by irrigators were discussed with councillors recently at the Draft Annual Plan workshop held on 2 December 2015.
15 4 10
149
526
68 55 7746
70 70
6 3
Change in information gathering charge - 2015/16
147

3 Activities funded by the information gathering charge The information gathering charge funds up to 40% of science water quantity investigation and monitoring activities, including installation and monitoring of water levels in stream for allocation, water shortage directions, ground water and aquifer investigations, understanding impacts of users on the region’s water resources etc.. The remaining 60% is funded by General rate. The overall funding of these activities was determined based on the detailed review of charging undertaken through the 2012 LTP. At this time, each project was assessed to determine the benefit / causation across resource user groups:
Consented resource users Permitted activity resource users The general public
The outcome from this review was to determine the share of costs that should be funded by consented resource users, with the remaining share funded through the general rate. The funding shares for each project vary, depending on the assessment of benefit / causation relating to the specific work delivered by individual projects. The summary of the funding of the key projects that receive funding through the state of the environment monitoring charge is presented below: Project 2015/16 budgeted
expenditure Funded by
Fees and charges General rate D1003 – Water allocation plan implementation
616,980 65% 35%
D1005- Hydrological Regimes (low flow/flood)
288,173 28% 72%
S1003 Pressure Analysis
203,465 85% 15%
D1202 – EM Flow Regimes SW and GW
1,051,024 40% 60%
A description of the key projects funded, and the work that is delivered is presented in this section. D1003 – Water Allocation Plan Implementation This work stream provides current information and decision-making tools supporting water allocation to deal with the increasing level of demand or competition for water. The management of water demand and use requires: 1) a robust understanding and monitoring of how much water is available under various environmental conditions, and 2) effective tools to allocate water. D1003 addresses the second point and works in connection with D1005 (Hydrological Regimes) Work stream. D1003 sets sustainable yields for aquifer and flow limits for streams and rivers to manage surface water quantity. Groundwater models are developed and used to set sustainable yields at catchment level. Minimum and allocable flows are now assessed to identify how much can be removed for allocation. Surface and groundwater allocation calculators are developed and maintained to assist the water allocation process and prioritisation. Recent investigations and research include:
Development of water allocation accounting system as required by Waikato Regional Plan and National Policy Statement on Freshwater Management 2014.
Provision of hydrology and water allocation data to LAWA and MfE for official reporting.
148

Review of river flow statistics. Recent work has substantially increased the amount of water available in the Piako catchment.
Development of irrigation water demand guidelines in conjunction with commercial vegetable growers, farmers and associated industries – used in the processing of all irrigation consents.
Investigation of groundwater limits in the Pukekawa and Pukekohe volcanic aquifers – highly utilised by horticulture irrigation.
Investigation of groundwater limits in Hauraki Plains aquifers – highly utilised by Agriculture and horticulture irrigation.
Investigation of surface water limits; Lower Waikato tributaries, Coromandel streams, Piako and Waihou rivers.
Information is included as allocation limits in the regional plan, reported on WRC website in the form web-based calculators and water allocation tool, verbal presentations, technical reports, guidelines and indicators for consent holders, consent officers and the public. Total D1003 revenue is $617,000 of which 65% are from consent charges. Staff labour excluding indirect costs – Investigations and research are in the order of $192,000 per annum. Direct costs - Investigations and research are in the order of $200,000 per annum D1005- Hydrological Regimes (low flow/flood) This Work stream identifies and characterises surface and groundwater responses to changes of climate, land use and water use to ensure flow regimes are maintained or enhanced. The management of water demand and use requires :
1) a robust understanding and monitoring of how much water is available under various environmental conditions and
2) effective tools to allocate water.
D1005 addresses the first point and work in connection with D1003 (Water Allocation) Work stream.
D1005 focuses on surface and groundwater interactions. Water levels and streams are analysed to understand why and how rivers respond to extreme events such as flood or drought. A better understanding is gained on why and how rivers respond to climate variability and change. Early warning signals for drought events are being developed to assist drought-response planning process. Information is reported on WRC website in the form of verbal presentations, technical reports, guidelines, indicators and web-based calculators and water allocation tool. Recent investigations and research include:
Annual flow data to internal and external users; Annual analysis and report on significant changes in GW level; Annual analysis and report on significant changes in SW level; Investigation on surface-groundwater interaction in the Reporoa area to better understand
stream depletion effect from major water takes consents; Development of in-flow model to assess optimum level for Lakes Whangape and Waahi; Revision of Upper Waikato 3D geological model to better understand transfer of water and
nutrients; and Development of adverse event (drought) assessment criteria that provide more certainty
during dry periods. Total D1005 revenue is $208,000 of which 28% is funded by consent charges. This percentage is lower than for D1003 and D1202. This is because the reasons as to “why we need to do the work’ and “who benefits from it?” have a higher public -user component than private users when the apportionment of the cost was assessed. Labour excluding indirect costs – Investigations and research are in the order of $54,000 per annum. Direct costs - Investigations and research in the
149

order of $150,000 in 2015-16 only. This includes $115,000 of additional funding allocated to the Fresh Water Quantity Network Review in the LTP 2015-25. S1003 Pressure Analysis This Work stream focuses on the maintenance and update of IRIS and WISKI databases which store water use data, consent information and hydrology data used for managing the allocation of freshwater. It also coordinates the storage of data in each respective database and provides the ability to merge this data for internal and external reporting purposes.
Recent Investigations include: Stream lined process for receiving water use data with minimal Council required manual
data entry. Collection and analysis of real-time data contributes to effective and efficient allocation of
water resources by providing the following: o Water use reporting by individual consents – accounts for 75% of all consented
water o Where water is available for transfer or redistribution o Water use compared to consent conditions and limits.
Automated analysis of water use compared to consent limits including during restrictions. Readily available measures of data accuracy (QA/QC) Web based reporting of water use trends and availability. IRIS and WISKI maintained with information which supports reporting on RMA s360
Regulations.
Total S1003 revenue is $203,000 charged as a flat fee. Staff labour excluding indirect costs – Investigations and research are in the order of $80,000 per annum. Direct costs - Investigations and research are in the order of $3,000 per annum D1202 – EM Flow Regimes SW and GW Data is collected, quality assured, analysed and managed to provide a region-wide picture of historical and current water flow. WRC maintains River flow monitoring at 68 locations. The cost attributed towards water allocation is in the order of $300,000 per annum. These sites are used by consent holder to trigger when they can and cannot take water, and to determine if water can be allocated or not to new applicants. This use of the flow recorder sites for water allocation purposes has required a considerable increase in time or effort ensuring the data are accurate and readily available for consent holders. WRC also maintains Groundwater level monitoring at 242 locations in the order of $60,000 per annum. Total D1202 revenue is $1,050,000 of which 40% are from consent charges. Staff labour excluding indirect costs – Monitoring are in the order of $360,000 per annum. Direct cost - Monitoring are in the order of $210,000 per annum
4 Issues raised by consent holders The issues raised by water take consent holders that have contacted council with concerns are summarised as follows:
150

1. Inadequate direct consultation during development of the Long Term Plan and notification of final decisions, meaning the invoices with higher charges came as a surprise to consent holders.
2. Concern by some about volumetric charging in general. 3. Concern that capping the charge rate of 53 cents/m3/day at 30 000 m3/day and then
decreasing to 10 cents/m3/day thereafter is unfair and effectively means smaller water take consent holders subsidise larger water users.
4. Daily volumetric charges don’t reflect total amounts taken annually and an annual basis for charging water takes better reflects impacts on the resource and would be a fairer way of charging.
5. Actual use is not reflected by allocated use. 6. There are specific issues relating to use of water that need to be taken into account. There have been specific requests to council that consent holders who held consents in 2014/15 should not have to pay the new charges and, instead, pay a similar quantum to the previous year. It has also been requested that a fees and charges policy is re-consulted with consent holders during the 2016/17 Draft Annual Plan process. A few consent holders have indicated they will not pay the current invoice. There have also been requests by a few consent holders that their issues be put before council at the 15 December meeting and these are attached to this report. Staff are meeting representatives from the Irrigators group on Monday December 14 and will update Councillors on those discussions at the Council meeting.
5 Discussion Discussion of the issues with council at the Draft Annual Plan workshop on 2 December 2015 indicated there are advantages and disadvantages with different charging mechanisms that will favour or adversely affect different consent holders. Information on impacts to existing consent holders had been raised with council during the 2015-2025 LTP deliberations and retrospective changes to the current year’s schedule of fees and charges is not possible. The total number of existing consent holders estimated to be affected by the charges (~250) is similar to those predicted in the LTP discussions, with 212 consent holders receiving an invoice for water take consents greater than $50 over the previous year. The following commentary responds to the concerns raised by consent holders: Concern by some about volumetric charging in general. Council has used a volumetric approach since 2012 in an attempt to have a fairer charging structure. Volumetric charging matches with the principle that our monitoring programme addresses the cumulative effects of resource use, and that intensity of resource use is a key driver of costs. In general the more water you take the closer we get to the allocation limits. The closer we are to the allocation limits the more work council needs to do as there is greater stress on the resource. The current LTP continues using the volumetric approach but with a per-unit of water charge compared to four broad per-unit of water categories. Prior to 2012, charges were volumetric but without explicit direct reference to volume specified in the LTP. Until now the volumetric approach has not been an identified as an issue based on the feedback while addressing remissions.
Concern that capping the charge rate of 53 cents/m3/day at 30 000 m3/day and then decreasing to 10 cents/m3/day thereafter is unfair and means smaller water take consent holders subsidise larger water users. The current charges remedy the situation where small users were previously significantly subsidising large users. Under the 2012 LTP charges, small user paid at least $100 whereas large users paid at the most $11,400. Under the current charges over half the consent holders pay substantially less than $100 and the large users pay up to $28,000. Staff consider that without apply a decreasing rate above 30,000 m3/day Council will not be meeting the requirements of s36(b) of the RMA where the “actions to which the charge relates is occasioned by the actions of
151

those persons”. That is it would be difficult to justify that nearly all of the monitoring and investigations that are a occurring are as a direct result of the taking of water by the few very large users above 30,000 m3/day.
Daily volumetric charges don’t reflect total amounts taken annually and an annual basis for charging water takes better reflects impacts on the resource and would be a fairer way of charging. Staff consider annual based charges do not better reflect the impacts of the consented activities on the resource. All catchments in the Waikato region are under greatest allocation pressure during the summer months. The daily consented take rate better reflects the peak allocation demand that necessitates the summer time focussed monitoring, investigations and research undertaken by WRC. The daily based charge is also more likely to be included in water take consent conditions whereas many water takes, including irrigation, do not have an annual or seasonal limit as a condition. This is being rectified when these consents are renewed, but will not be complete across all consents for at least another 5 years. If annual charges were used these would need additional factors applied to take account of consents which operate more during summer. Further weighting could also be applied to consents from highly and over allocated catchments as these catchments require more WRC input compared to low stress catchments.
Actual use is not reflected by allocated use. This is correct. Actual use can be substantially less, especially during wetter summers. Funding based on actual use would result in considerable variation from year to year in charges received. Individual consent holders with have little certainty of what they would be charged each year as it would depend on how much water they used and also how much water all the other consent holder used.
6 Current remission policy Remission may be applied where:
There is a mistake with the information used in setting the charge, e.g. incorrect rate of water allocated.
The take is non-consumptive. This is now addressed in the current charges with a subcategory for non-consumptive takes.
The consent holder is providing a significant level of monitoring of stream flows. A partial remission may be considered in this situation.
The new charges are intended to minimise the number of remissions compared to prior years. To ensure consistency in the remission process a sub-group of staff including Janine Becker, Edmund Brown and Dominique Noiton will meet to discuss the reasons a remission might be given. Some of the issues raised in the recent letters may be addressed through the remissions process, e.g. Matthew and David Dean case (related to Attachment 3) where a remission has been applied for this year’s charges as the activity only takes water via harvesting (only at high flows) and the pumping equipment has not been installed.
7 Options to address the concerns raised The options identified by staff in light of the concerns raised by some consent holders are:
Retain the current charges, but allow an extended period over which payment may be made
Remit all or a portion of the increased charges. The basis (and amount) of this remission would need to be determined. Remission is also complicated by the fact that it is difficult to compare year on charges with some existing consent holders. For example, some existing
152

consent holders have surrendered or received new consents during the past year, or had consents for only part of the past or current year.
Any remission of charges would affect the revenue of Science and Strategy and current work programmes of the directorate. Council would need to consider how to offset or mitigate this impact if they choose a remission option. The full remission of increased water charges would equate to $437,000 (excluding GST).If this was applied then the impact of the 20 largest increases would be $220,890 (refer table above of 20 largest $ increases). If the Council choose to remit all or part of the increased charges it could do so on the basis that the impacted parties were unaware of the financial impact in this financial year. In doing this, Council could consider to exclude those organisations who would reasonably have been expected to have known of the proposed changes. This would include Local Authorities, CCO’s and organisations who submitted to the LTP. If required, this will be quantified at the council meeting. Mike Garrett Chief Financial Officer
Tracey May Director, Science and Strategy
Chris McLay Director, Resource Use Attachments The following correspondence has been received and requested to be provided to Councillors for the December council meeting. 1. Letter from Trevor Simpson and Mike Peters dated 6 November 2015 (Doc # 3609198) 2. Letter from Fred Phillips dated 20 November 2015 (Doc # 3638914) 3. Letter from Matthew Dean on behalf of Mooka Flats and Silverdene Farm dated 24 November
2015 (Doc # 3627508)
153
Appendix 4
Letter from Mr Philips – Irrigators’ Position 19 Feb 2016 Agricultural Business Associates
PO Box 14 107 Hamilton 3252
Phone 07 838 0477 Fax 07 838 0476
19 February 2016 Ed Brown and Mike Garrett Waikato Regional Council Dear Ed and Mike,
Re the proposed consent holder charges As we discussed, there does not appear to be any strong, quantifiable, relationship between consented volume take and the direct costs associated with environmental monitoring and research. Having said that, the irrigators accept that making a direct contribution, related to water availability, is not unreasonable. This is to arrive at a 40% user contribution to support the 60% ratepayer contribution to this programme. To quote the resolution contained in the LTP Our decision To combine our charging for groundwater and surface water, and move to a more graduated charging mechanism which matches with the volume of take permitted under each resource consent. From an irrigators perspective any contribution must recognise that irrigation consents are not directly comparable with other consents that provide for year round supply, that meet the total potential demand of the consent holder and are essentially not subject to likely shutdown. For that not to be recognised would in my view be inequitable. This means that any supported option must annualise the consent daily take values to arrive at the correct volume of take permitted under each resource consent. This means that an irrigation take and any other take restricted in days of availability would pay less than a standard consent with the same daily take volume, but would pay the same as another standard take with the same annualised volume. For example an irrigation take of 122 days availability and 6000m3/day has an annualised take of 200m3/day and would pay the same rate as a 2000m3/day consent with 365 days availability.
154
We recognise that the greatest pressure on monitoring is in the summer and that a weighting factor could be appropriate. What that means is that year round consents are effectively getting a discount on their non summer water. It is important to accept that this levy on consent holders is to meet 40% of the total programme irrespective of the peaks and troughs of the workload within the year. Weighting factors be they positive or negative as with the takes above 30,000m3/day have to be moderate and handled with care. On this basis we come from a start point
1. that the consents should be annualised 2. That adjustment factors may be applied to consents to recognise high volumes and
low volumes but that adjustments should be fine tuning rather than blunt instruments For example it is my perception that if an adjustment to the basic model is a factor greater than 50%, then the basic model premise is not appropriate.
This should also apply to the top end of the scale with the super large consents because if the super large consents are paying a reduced rate, then that funding is by default, loaded onto the smaller consent holders. From the Irrigation consent holder group perspective, this too is regarded as inequitable. For these reasons the status quo is not supported. Given the alternative options modelled The simplest model is Model 2 which is a straight annualised approach across all consents with no cap and while this appears the most equitable, you believe that it would be hard to justify to the large users under section 36(4)(b). It needs to be recognised that all of the irrigation takes have a lower daily take rate than the current 30,000m3 cap. So the cap only applies to consents held by Hamilton City, Genesis Energy, New Zealand Steel and Water Care. Water Care makes a near zero contribution to the 60% from the general rate. Model 4 recognises that a summer use factor on irrigation consents recognises that summer is the period when monitoring intensity is greatest. What the final factor value between 0 and 50% would need to be worked through. Model 5 is believed to have the potential to be the most equitable model but has some major hurdles to be overcome and may not be able to be achieved in the medium term. It is likely to be vigorously contested by the largest water users unless it can be done by negotiation rather than through the traditional submission and legal process. As a consequence Model 4 is deemed to be the most appropriate but I am not able to meet with the irrigators to discuss the implications until the 26th February. Yours sincerely Fred Phillips Natural Resource Engineer
155

Report to Council December 2015 – Decision Required
File No: 56 10 05B
Date: 3 December 2015
To: Chief Executive Officer
From: Director, Science and Strategy
Subject: Annual charges for 2015/16 water take consents
1 Purpose The purpose of this report is to present concerns raised by some consent holders regarding the increase in their 2015/16 Annual charges for water takes and options for Council to consider to address the issues raised. Recommendation: 1. That the report ‘Annual charges for 2015/16 water take consents’ (Doc # 3632744 dated 3
December 2015) be received, and
2. That council confirm that either:
a) all water take annual consent charges should be invoiced according to the fees and charges schedule as outlined in the Long Term Plan 2015-2025 and advise the 212 consent holders previously written to that an extended/deferred payment date of 20 October 2016 be available for payment of the 2015/16 consent charges, or
b) full or part remission (to be determined) be provided to water take consent holders who had existing consents in 2014/15 and new invoices issued.
2 Background Council changed the charging regime for information gathering activities for water takes in the 2015-2025 Long Term Plan (LTP) so that it was based on an amount corresponding to maximum daily water take rate. The information gathering component of the annual charge funds a portion of the Science and Strategy Directorate’s activities (refer section 3). Most consent holders with water takes in 2014/15 have received a reduction in their charge from the new policy but a smaller proportion xx consent holders (about 25%) had significantly higher charges. This impact was anticipated in the LTP decision. Some of these consent holders adversely affected by the new charges, particularly irrigators, have contacted council and expressed concern at the new charges.
156

The following table lists the 20 consent holders with the largest $ increase as a result of the changed policy. Many of the consent holders have more than one consent and the increases shown are the total increase across all the consents. For example Watercare has three separate consents with a combined increase $55,708. Consent holder 2014/15 charge 2015/16 charge Increase Watercare Services Ltd 24,002 79,710 55,708 Wairakei Pastoral Ltd 110,064 151,582 41,517 Waikato North Head Mining Ltd 21,226 33,656 12,430 AS Wilcox and Sons Ltd 4,727 13,873 9,146 Solid Energy New Zealand Ltd 9,980 18,819 8,839 Genesis Energy Ltd 13,149 21,988 8,839 Taupo District Council 20,139 28,933 8,795 New Zealand Steel Mining Ltd 25,295 33,994 8,699 Balle Bros Growers Ltd 11,742 20,088 8,346 DR & CJ Brown 1,436 8,385 6,949 Hauraki District Council 18,512 25,058 6,546 Matamata-Piako District Council 6,677 12,950 6,273 Hamilton City Council 26,164 31,919 5,755 Waikato District Council 5,707 11,195 5,488 New Zealand Steel Ltd 12,001 17,030 5,029 Thames-Coromandel District Council 8,039 13,003 4,964 Trinity Lands Ltd 2,918 7,376 4,459 Hill Family Trusts Partnership 1,148 5,602 4,454 Rangatira 8A17 Trust 574 4,900 4,326 Okuhau Farm Partnership 574 4,900 4,326 TOTAL 324,073 544,962 220,890 Staff wrote to 212 affected consent holders advising them their issues would be raised with councillors at the 15 December 2015 council meeting so that councillors could decide how they wished to deal with the matters raised. The issues raised by irrigators were discussed with councillors recently at the Draft Annual Plan workshop held on 2 December 2015.
15 4 10
149
526
68 55 7746
70 70
6 3
Change in information gathering charge - 2015/16
157
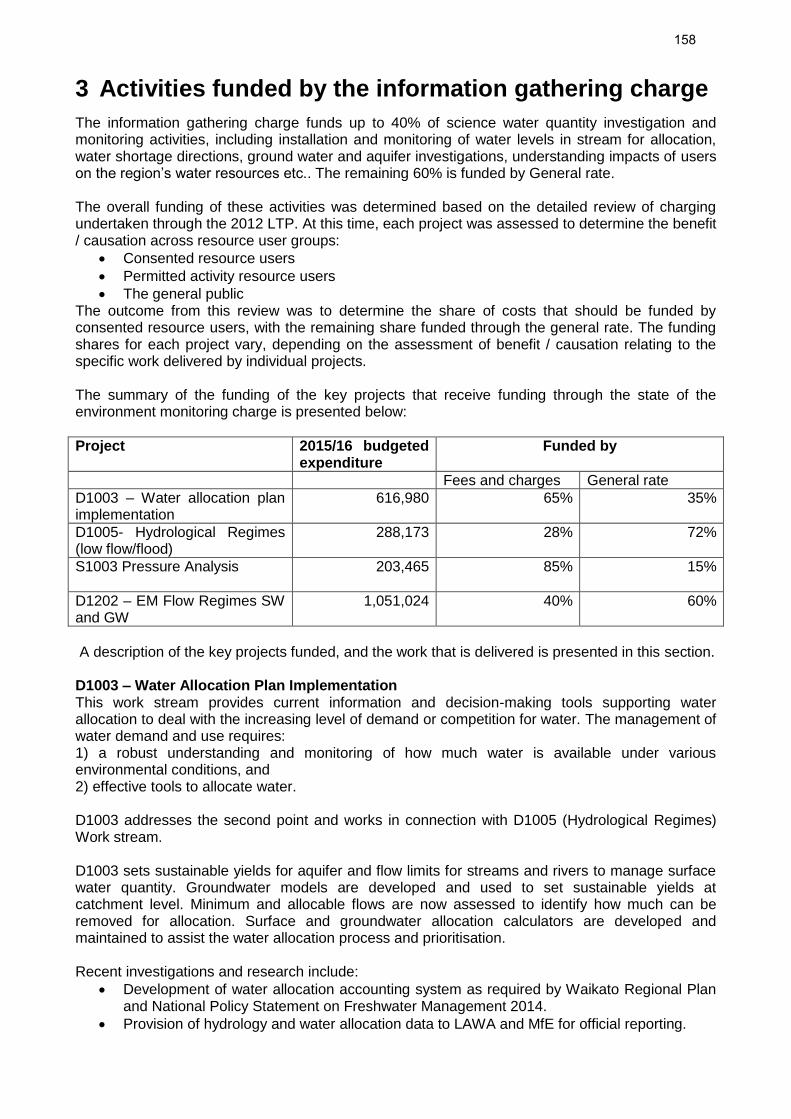
3 Activities funded by the information gathering charge The information gathering charge funds up to 40% of science water quantity investigation and monitoring activities, including installation and monitoring of water levels in stream for allocation, water shortage directions, ground water and aquifer investigations, understanding impacts of users on the region’s water resources etc.. The remaining 60% is funded by General rate. The overall funding of these activities was determined based on the detailed review of charging undertaken through the 2012 LTP. At this time, each project was assessed to determine the benefit / causation across resource user groups:
Consented resource users Permitted activity resource users The general public
The outcome from this review was to determine the share of costs that should be funded by consented resource users, with the remaining share funded through the general rate. The funding shares for each project vary, depending on the assessment of benefit / causation relating to the specific work delivered by individual projects. The summary of the funding of the key projects that receive funding through the state of the environment monitoring charge is presented below: Project 2015/16 budgeted
expenditure Funded by
Fees and charges General rate D1003 – Water allocation plan implementation
616,980 65% 35%
D1005- Hydrological Regimes (low flow/flood)
288,173 28% 72%
S1003 Pressure Analysis
203,465 85% 15%
D1202 – EM Flow Regimes SW and GW
1,051,024 40% 60%
A description of the key projects funded, and the work that is delivered is presented in this section. D1003 – Water Allocation Plan Implementation This work stream provides current information and decision-making tools supporting water allocation to deal with the increasing level of demand or competition for water. The management of water demand and use requires: 1) a robust understanding and monitoring of how much water is available under various environmental conditions, and 2) effective tools to allocate water. D1003 addresses the second point and works in connection with D1005 (Hydrological Regimes) Work stream. D1003 sets sustainable yields for aquifer and flow limits for streams and rivers to manage surface water quantity. Groundwater models are developed and used to set sustainable yields at catchment level. Minimum and allocable flows are now assessed to identify how much can be removed for allocation. Surface and groundwater allocation calculators are developed and maintained to assist the water allocation process and prioritisation. Recent investigations and research include:
Development of water allocation accounting system as required by Waikato Regional Plan and National Policy Statement on Freshwater Management 2014.
Provision of hydrology and water allocation data to LAWA and MfE for official reporting.
158
Review of river flow statistics. Recent work has substantially increased the amount of water available in the Piako catchment.
Development of irrigation water demand guidelines in conjunction with commercial vegetable growers, farmers and associated industries – used in the processing of all irrigation consents.
Investigation of groundwater limits in the Pukekawa and Pukekohe volcanic aquifers – highly utilised by horticulture irrigation.
Investigation of groundwater limits in Hauraki Plains aquifers – highly utilised by Agriculture and horticulture irrigation.
Investigation of surface water limits; Lower Waikato tributaries, Coromandel streams, Piako and Waihou rivers.
Information is included as allocation limits in the regional plan, reported on WRC website in the form web-based calculators and water allocation tool, verbal presentations, technical reports, guidelines and indicators for consent holders, consent officers and the public. Total D1003 revenue is $617,000 of which 65% are from consent charges. Staff labour excluding indirect costs – Investigations and research are in the order of $192,000 per annum. Direct costs - Investigations and research are in the order of $200,000 per annum D1005- Hydrological Regimes (low flow/flood) This Work stream identifies and characterises surface and groundwater responses to changes of climate, land use and water use to ensure flow regimes are maintained or enhanced. The management of water demand and use requires :
1) a robust understanding and monitoring of how much water is available under various environmental conditions and
2) effective tools to allocate water.
D1005 addresses the first point and work in connection with D1003 (Water Allocation) Work stream.
D1005 focuses on surface and groundwater interactions. Water levels and streams are analysed to understand why and how rivers respond to extreme events such as flood or drought. A better understanding is gained on why and how rivers respond to climate variability and change. Early warning signals for drought events are being developed to assist drought-response planning process. Information is reported on WRC website in the form of verbal presentations, technical reports, guidelines, indicators and web-based calculators and water allocation tool. Recent investigations and research include:
Annual flow data to internal and external users; Annual analysis and report on significant changes in GW level; Annual analysis and report on significant changes in SW level; Investigation on surface-groundwater interaction in the Reporoa area to better understand
stream depletion effect from major water takes consents; Development of in-flow model to assess optimum level for Lakes Whangape and Waahi; Revision of Upper Waikato 3D geological model to better understand transfer of water and
nutrients; and Development of adverse event (drought) assessment criteria that provide more certainty
during dry periods. Total D1005 revenue is $208,000 of which 28% is funded by consent charges. This percentage is lower than for D1003 and D1202. This is because the reasons as to “why we need to do the work’ and “who benefits from it?” have a higher public -user component than private users when the apportionment of the cost was assessed. Labour excluding indirect costs – Investigations and
159
research are in the order of $54,000 per annum. Direct costs - Investigations and research in the order of $150,000 in 2015-16 only. This includes $115,000 of additional funding allocated to the Fresh Water Quantity Network Review in the LTP 2015-25. S1003 Pressure Analysis This Work stream focuses on the maintenance and update of IRIS and WISKI databases which store water use data, consent information and hydrology data used for managing the allocation of freshwater. It also coordinates the storage of data in each respective database and provides the ability to merge this data for internal and external reporting purposes.
Recent Investigations include: Stream lined process for receiving water use data with minimal Council required manual
data entry. Collection and analysis of real-time data contributes to effective and efficient allocation of
water resources by providing the following: o Water use reporting by individual consents – accounts for 75% of all consented
water o Where water is available for transfer or redistribution o Water use compared to consent conditions and limits.
Automated analysis of water use compared to consent limits including during restrictions. Readily available measures of data accuracy (QA/QC) Web based reporting of water use trends and availability. IRIS and WISKI maintained with information which supports reporting on RMA s360
Regulations.
Total S1003 revenue is $203,000 charged as a flat fee. Staff labour excluding indirect costs – Investigations and research are in the order of $80,000 per annum. Direct costs - Investigations and research are in the order of $3,000 per annum D1202 – EM Flow Regimes SW and GW Data is collected, quality assured, analysed and managed to provide a region-wide picture of historical and current water flow. WRC maintains River flow monitoring at 68 locations. The cost attributed towards water allocation is in the order of $300,000 per annum. These sites are used by consent holder to trigger when they can and cannot take water, and to determine if water can be allocated or not to new applicants. This use of the flow recorder sites for water allocation purposes has required a considerable increase in time or effort ensuring the data are accurate and readily available for consent holders. WRC also maintains Groundwater level monitoring at 242 locations in the order of $60,000 per annum. Total D1202 revenue is $1,050,000 of which 40% are from consent charges. Staff labour excluding indirect costs – Monitoring are in the order of $360,000 per annum. Direct cost - Monitoring are in the order of $210,000 per annum
4 Issues raised by consent holders The issues raised by water take consent holders that have contacted council with concerns are summarised as follows:
160

1. Inadequate direct consultation during development of the Long Term Plan and notification of final decisions, meaning the invoices with higher charges came as a surprise to consent holders.
2. Concern by some about volumetric charging in general. 3. Concern that capping the charge rate of 53 cents/m3/day at 30 000 m3/day and then
decreasing to 10 cents/m3/day thereafter is unfair and effectively means smaller water take consent holders subsidise larger water users.
4. Daily volumetric charges don’t reflect total amounts taken annually and an annual basis for charging water takes better reflects impacts on the resource and would be a fairer way of charging.
5. Actual use is not reflected by allocated use. 6. There are specific issues relating to use of water that need to be taken into account. There have been specific requests to council that consent holders who held consents in 2014/15 should not have to pay the new charges and, instead, pay a similar quantum to the previous year. It has also been requested that a fees and charges policy is re-consulted with consent holders during the 2016/17 Draft Annual Plan process. A few consent holders have indicated they will not pay the current invoice. There have also been requests by a few consent holders that their issues be put before council at the 15 December meeting and these are attached to this report. Staff are meeting representatives from the Irrigators group on Monday December 14 and will update Councillors on those discussions at the Council meeting.
5 Discussion Discussion of the issues with council at the Draft Annual Plan workshop on 2 December 2015 indicated there are advantages and disadvantages with different charging mechanisms that will favour or adversely affect different consent holders. Information on impacts to existing consent holders had been raised with council during the 2015-2025 LTP deliberations and retrospective changes to the current year’s schedule of fees and charges is not possible. The total number of existing consent holders estimated to be affected by the charges (~250) is similar to those predicted in the LTP discussions, with 212 consent holders receiving an invoice for water take consents greater than $50 over the previous year. The following commentary responds to the concerns raised by consent holders: Concern by some about volumetric charging in general. Council has used a volumetric approach since 2012 in an attempt to have a fairer charging structure. Volumetric charging matches with the principle that our monitoring programme addresses the cumulative effects of resource use, and that intensity of resource use is a key driver of costs. In general the more water you take the closer we get to the allocation limits. The closer we are to the allocation limits the more work council needs to do as there is greater stress on the resource. The current LTP continues using the volumetric approach but with a per-unit of water charge compared to four broad per-unit of water categories. Prior to 2012, charges were volumetric but without explicit direct reference to volume specified in the LTP. Until now the volumetric approach has not been an identified as an issue based on the feedback while addressing remissions.
Concern that capping the charge rate of 53 cents/m3/day at 30 000 m3/day and then decreasing to 10 cents/m3/day thereafter is unfair and means smaller water take consent holders subsidise larger water users. The current charges remedy the situation where small users were previously significantly subsidising large users. Under the 2012 LTP charges, small user paid at least $100 whereas large users paid at the most $11,400. Under the current charges over half the consent holders pay substantially less than $100 and the large users pay up to $28,000. Staff consider that without apply a decreasing rate above 30,000 m3/day Council will not be meeting the requirements of s36(b) of the RMA where the “actions to which the charge relates is occasioned by the actions of
161

those persons”. That is it would be difficult to justify that nearly all of the monitoring and investigations that are a occurring are as a direct result of the taking of water by the few very large users above 30,000 m3/day.
Daily volumetric charges don’t reflect total amounts taken annually and an annual basis for charging water takes better reflects impacts on the resource and would be a fairer way of charging. Staff consider annual based charges do not better reflect the impacts of the consented activities on the resource. All catchments in the Waikato region are under greatest allocation pressure during the summer months. The daily consented take rate better reflects the peak allocation demand that necessitates the summer time focussed monitoring, investigations and research undertaken by WRC. The daily based charge is also more likely to be included in water take consent conditions whereas many water takes, including irrigation, do not have an annual or seasonal limit as a condition. This is being rectified when these consents are renewed, but will not be complete across all consents for at least another 5 years. If annual charges were used these would need additional factors applied to take account of consents which operate more during summer. Further weighting could also be applied to consents from highly and over allocated catchments as these catchments require more WRC input compared to low stress catchments.
Actual use is not reflected by allocated use. This is correct. Actual use can be substantially less, especially during wetter summers. Funding based on actual use would result in considerable variation from year to year in charges received. Individual consent holders with have little certainty of what they would be charged each year as it would depend on how much water they used and also how much water all the other consent holder used.
6 Current remission policy Remission may be applied where:
There is a mistake with the information used in setting the charge, e.g. incorrect rate of water allocated.
The take is non-consumptive. This is now addressed in the current charges with a subcategory for non-consumptive takes.
The consent holder is providing a significant level of monitoring of stream flows. A partial remission may be considered in this situation.
The new charges are intended to minimise the number of remissions compared to prior years. To ensure consistency in the remission process a sub-group of staff including Janine Becker, Edmund Brown and Dominique Noiton will meet to discuss the reasons a remission might be given. Some of the issues raised in the recent letters may be addressed through the remissions process, e.g. Matthew and David Dean case (related to Attachment 3) where a remission has been applied for this year’s charges as the activity only takes water via harvesting (only at high flows) and the pumping equipment has not been installed.
7 Options to address the concerns raised The options identified by staff in light of the concerns raised by some consent holders are:
Retain the current charges, but allow an extended period over which payment may be made
Remit all or a portion of the increased charges. The basis (and amount) of this remission would need to be determined. Remission is also complicated by the fact that it is difficult to compare year on charges with some existing consent holders. For example, some existing
162

consent holders have surrendered or received new consents during the past year, or had consents for only part of the past or current year.
Any remission of charges would affect the revenue of Science and Strategy and current work programmes of the directorate. Council would need to consider how to offset or mitigate this impact if they choose a remission option. The full remission of increased water charges would equate to $437,000 (excluding GST).If this was applied then the impact of the 20 largest increases would be $220,890 (refer table above of 20 largest $ increases). If the Council choose to remit all or part of the increased charges it could do so on the basis that the impacted parties were unaware of the financial impact in this financial year. In doing this, Council could consider to exclude those organisations who would reasonably have been expected to have known of the proposed changes. This would include Local Authorities, CCO’s and organisations who submitted to the LTP. If required, this will be quantified at the council meeting. Mike Garrett Chief Financial Officer
Tracey May Director, Science and Strategy
Chris McLay Director, Resource Use Attachments The following correspondence has been received and requested to be provided to Councillors for the December council meeting. 1. Letter from Trevor Simpson and Mike Peters dated 6 November 2015 (Doc # 3609198) 2. Letter from Fred Phillips dated 20 November 2015 (Doc # 3638914) 3. Letter from Matthew Dean on behalf of Mooka Flats and Silverdene Farm dated 24 November
2015 (Doc # 3627508)
163

Report to Strategy and Policy Committee
Date: 13 February 2018
Author: Nicole Hubbard, Manager Corporate Planning
Authoriser: Mike Garrett, Chief Financial Officer
Subject: 2018-2028 Long Term Plan (LTP) Development – February Update
Section: A (Committee has delegated authority to make decision)
Purpose 1. This report will:
a. provide an update of the LTP development programme and set out the work plan for the next few months,
b. outline the consultation topics for inclusion in the consultation document as agreed by the council at the meeting on 30 January 2018.
c. outline the proposed process for submitting to other councils’ Long Term Plans
Executive Summary 2. The ongoing LTP work programme is moving Council towards adoption of the 2018-2028 LTP consultation
document in March 2018, and final adoption of the plan in June 2018.
3. Through the 30 January budget meetings Council confirmed the topics for consultation. This report outlines those topics, with the draft text for the consultation document being workshopped on 13 February.
4. During February, March and April 2018 councils throughout New Zealand will be consulting on their Long
Term Plans. Staff will draft submissions to territorial authorities in the Waikato region, as well as Bay of Plenty and Auckland Council on relevant consultation topics and these will be presented to Council for endorsement. Appendix 1 outlines the process for signing off submissions.
Staff Recommendations:
1. That the report ‘2018-2028 Long Term Plan (LTP) Development – February Update’ (Doc # 11743745) dated 13 February 2018 be received, and
2. That the consultation topics as outlined in the table in paragraph 10 be noted.
3. That the process for approving submissions to other councils’ Long Term Plans, as presented in appendix 1, be approved.
Background 5. Local Government Long Term Plans (LTPs) are developed every three years, with a 10 year horizon. The
LTP describes “what we do and why”, “how we manage our finances”, and the impact on rates. 6. The 2018-2028 LTP development programme was introduced at the council induction workshop in
November 2016, and a report presented to council in December 2016 outlined the key ‘building blocks’ of the LTP.
164
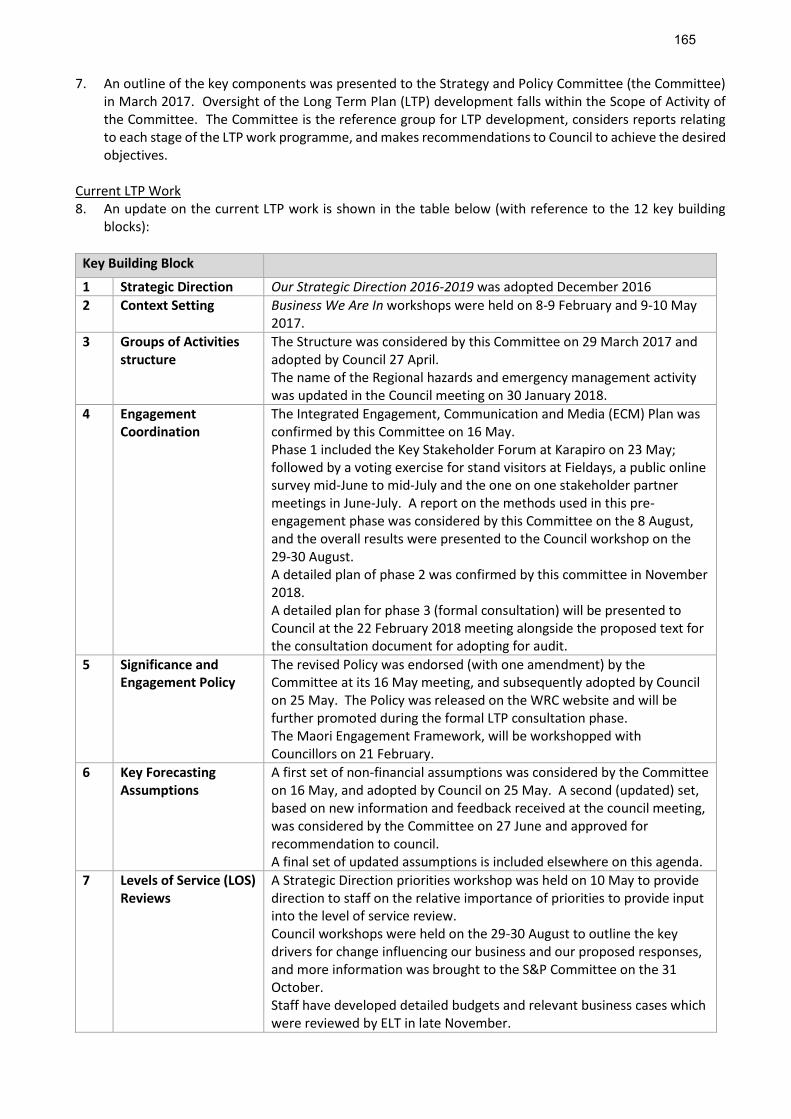
7. An outline of the key components was presented to the Strategy and Policy Committee (the Committee) in March 2017. Oversight of the Long Term Plan (LTP) development falls within the Scope of Activity of the Committee. The Committee is the reference group for LTP development, considers reports relating to each stage of the LTP work programme, and makes recommendations to Council to achieve the desired objectives.
Current LTP Work 8. An update on the current LTP work is shown in the table below (with reference to the 12 key building
blocks):
Key Building Block
1 Strategic Direction Our Strategic Direction 2016-2019 was adopted December 2016
2 Context Setting Business We Are In workshops were held on 8-9 February and 9-10 May 2017.
3 Groups of Activities structure
The Structure was considered by this Committee on 29 March 2017 and adopted by Council 27 April. The name of the Regional hazards and emergency management activity was updated in the Council meeting on 30 January 2018.
4 Engagement Coordination
The Integrated Engagement, Communication and Media (ECM) Plan was confirmed by this Committee on 16 May. Phase 1 included the Key Stakeholder Forum at Karapiro on 23 May; followed by a voting exercise for stand visitors at Fieldays, a public online survey mid-June to mid-July and the one on one stakeholder partner meetings in June-July. A report on the methods used in this pre-engagement phase was considered by this Committee on the 8 August, and the overall results were presented to the Council workshop on the 29-30 August. A detailed plan of phase 2 was confirmed by this committee in November 2018. A detailed plan for phase 3 (formal consultation) will be presented to Council at the 22 February 2018 meeting alongside the proposed text for the consultation document for adopting for audit.
5 Significance and Engagement Policy
The revised Policy was endorsed (with one amendment) by the Committee at its 16 May meeting, and subsequently adopted by Council on 25 May. The Policy was released on the WRC website and will be further promoted during the formal LTP consultation phase. The Maori Engagement Framework, will be workshopped with Councillors on 21 February.
6 Key Forecasting Assumptions
A first set of non-financial assumptions was considered by the Committee on 16 May, and adopted by Council on 25 May. A second (updated) set, based on new information and feedback received at the council meeting, was considered by the Committee on 27 June and approved for recommendation to council. A final set of updated assumptions is included elsewhere on this agenda.
7 Levels of Service (LOS) Reviews
A Strategic Direction priorities workshop was held on 10 May to provide direction to staff on the relative importance of priorities to provide input into the level of service review. Council workshops were held on the 29-30 August to outline the key drivers for change influencing our business and our proposed responses, and more information was brought to the S&P Committee on the 31 October. Staff have developed detailed budgets and relevant business cases which were reviewed by ELT in late November.
165

Key Building Block
A high level budget ‘strawman’ was presented to Council to the 13 December Council workshop, with the detailed budget being presented to Council from 30 January 2018, and approved on 2 February 2018.
8 Service delivery reviews (s17A)
An update on the progress of s17a reviews was provided to S&P committee on the 19 September.
9 Performance measurement framework
The performance measurement framework was signed off by S&P Committee on the 19 September, with draft LTP performance measures circulated to Councillors for feedback on 13 December, and included elsewhere on this agenda with feedback from Audit NZ incorporated.
10 Infrastructure Strategy
A draft of the strategy was presented to Strategy and Policy Committee on 31 October, and Integrated Catchment Management Committee on 7 December 2017. A final version of the strategy will be presented to Council on 22 February 2018 for adoption for audit.
11 & 12
Revenue and financing policy, financial strategy and rates remission policies
Workshop held with council on 3 October on Revenue and Financing Policy and rates remission policies. A separate report was discussed at S&P Committee on the 31 October covering the planned work to review the Revenue and Financing Policy. The Revenue and Financing Policy and the Financial Strategy were adopted at the Council meeting on 31 January, with an update on the impacts of information gathering and research charges to be provided at this meeting as a separate agenda item. The Financial Strategy will be included in the consultation document, and the Revenue and Financing Policy will be a supporting document. Both of these will be presented to Council on the 22 February for adopting for audit.
Upcoming Work 9. The programme of work over the next few months is presented in the table below. The items scheduled
for this Committee meeting of 13 February 2018 are included elsewhere in this agenda.
Date Key Building Block Action Committee To Council
13 Feb 6 Key non-financial assumptions
Approve the updates to the assumptions.
Strategy and Policy
22 Feb
13 Feb 9 Levels of service and performance measures
Approve the updates to performance measures.
Strategy and Policy
22 Feb
13 Feb 11 Rates remission and rates postponement policies
Approve policies Strategy and Policy
22 Feb
13 Feb 12 Revenue and financing policy
Approve the fees and charges in relation to information gathering and research
Strategy and Policy
22 Feb
22 Feb All Full consultation document and supporting documents
Adopt the consultation document and supporting documents for audit following Council feedback at the 13 February workshop.
Council N/A
13 Mar All Full consultation document and supporting documents
Adopt consultation document and supporting documents for consultation
Council N/A
166
Issues Topics for consultation 10. The following topics were confirmed for consultation through the 31 January budget meetings:
Topic Detail
Funding of biosecurity activity Increased funding for controlling:
Dama wallaby
Wilding pines
Climbing spindle berry
Old man’s beard
Kauri dieback
Alligator weed and yellow flag iris
Velvetleaf Also increased funding for the Priority Pest Management Programme.
Catchment management rates Increased levels of service and catchment rates
Asset depreciation Not fully funding depreciation in Lower Waikato, Waihou and Piako in years 1 and 2 of the LTP
Regional emergency services fund
The addition of LandSAR as a funding recipient and increased funding provided to Surf Lifesaving
Community facilities framework Should council adopt the facilities framework?
Regional theatre proposal Should council contribute $5m toward the regional theatre construction cost and ongoing $300,000 asset maintenance contribution?
Fees and charges Changes to council’s regulatory fees and charges
Water user charges Changes to the way water user charges are calculated
Use of the investment fund Capping the annual contribution to the Regional Development Fund at the 2017/18 level rather than a further two years’ increase in contributions with a corresponding reduction in rates subsidy from investment fund income as set out in the 2015 LTP.
Hamilton to Auckland transport connections – interim solution
A proposal to introduce an interim train service between Hamilton and Auckland.
Matangi boundary change Request from the Matangi drainage area to extend its boundary by transferring an area from the Hautapu drainage area.
Tauhei flood protection There is a land owners meeting scheduled for 19 February 2018 to discuss the options of proceeding with the project in full, proceeding with a part of the project, or reverting back to maintaining the current infrastructure. This meeting will give an indication of land owners preference, and therefore the options to be consulted on in the LTP.
11. A detailed communications and engagement plan for the consultation period of 16 March to 16 April will
be presented to Council at its meeting on the 22 February 2018. Submissions to other Territorial Authorities Long Term Plans (Appendix one) 12. During February, March and April 2018 councils throughout New Zealand will be consulting on their Long
Term Plans. Staff will draft submissions to territorial authorities in the Waikato region, as well as Bay of Plenty and Auckland Council on relevant consultation topics and these will be presented to Council for endorsement. Appendix 1 outlines the process for signing off submissions.
Assessment of Significance 13. Having regard to the decision making provisions in the Local Government Act 2002 and council’s
Significance and Engagement Policy, a decision in accordance with the recommendations is not considered to have a high degree of significance.
167

Legislative context 14. Council has the ability to make these decisions under sections 76-81 of the Local Government Act.
Policy Considerations 15. To the best of the writer’s knowledge, this decision is not significantly inconsistent with nor is anticipated
to have consequences that will be significantly inconsistent with any policy adopted by this local authority or any plan required by the Local Government Act 2002 or any other enactment.
Conclusion 16. The development of the 2018-2028 Long Term Plan (LTP) includes an 18 month programme of work which
commenced in December 2016, and which will be completed in June 2018. 17. The Strategy and Policy Committee will receive and consider matters relating to this development
programme. 18. The current programme of work from February 2018 to April 2018 is presented to the Committee.
Appendices Appendix 1: Proposed Process for Submitting to Other Councils’ Long Term Plans.
168
Appendix 1: Proposed process for submitting to other councils’ long term plans
1. Throughout February, March and April 2018 councils throughout New Zealand will be consulting on their 2018-2028 Long Term Plans. In the past WRC has made a submission to other territorial authorities in the Waikato as well as Bay of Plenty Regional Council and Auckland Council.
2. Staff will be reviewing the consultation documents from these councils as they are released and
drafting a submission based on the consultation topics in the document. 3. Due to the standard consultation period being around one month, timeframes to get the submission
written and approved are very tight. 4. Staff will prepare a draft submission based on current Council policies and will be reviewed by ELT. The
draft submission will be circulated to the Chair, Deputy Chair, any constituent councillor(s), iwi councillors and the chair of a committee for relevant topics. There will be a very tight turnaround to get any comments back to staff (two to three days) and actioned prior to the submission being submitted.
5. Formal adoption of the submission will have to occur retrospectively in all but one case. Depending on timing, the submission will either go to Strategy and Policy Committee, the submissions sub-committee or Council for adoption.
169

Report to Strategy and Policy Committee
Date: 24 January 2018
Author: Anthea Sayer, Senior Corporate Planner, Corporate Planning
Authoriser: Mike Garrett, Chief Financial Officer
Subject: Non-financial forecasting assumptions for 2018-2028 Long Term Plan
Section: B (For recommendation to Council) Purpose 1. To present the committee with the final version of non-financial forecasting assumptions for the 2018-
2028 Long Term Plan (LTP). Executive Summary 2. Non-financial forecasting assumptions for the 2018-2028 LTP were sent to May and June 2017 Strategy
and Policy Committee meetings for recommendation to council. A number of changes have been made as a result of both meetings and after further staff review. The assumptions will be adopted by council for auditing as part of the background information for the 2018-2028 LTP consultation on the 22 February 2018.
Staff Recommendations:
1. That the report ‘Non-financial forecasting assumptions for 2018-2028 Long Term Plan’ (Doc # 11744951 dated 24 January 2018) be received.
2. That the non-financial forecasting assumptions, as presented, be approved for recommendation to council.
Background 3. Under the Local Government Act 2002, local authorities must disclose significant forecasting
assumptions underlying the financial estimates made in the LTP. Assumptions must state how various issues may or may not affect our ability to meet our levels of service in the future.
4. Non-financial assumptions have been split into regional assumptions and group of activity (GOA)
assumptions.
5. The first round of 2018-2028 LTP forecasting assumptions were presented to the May 2017 Strategy and Policy Committee meeting with a second round of assumptions (additions and amendments since the May meeting) brought back to the June 2017 Strategy and Policy Committee meeting.
6. All forecasting assumptions were adopted at the June meeting with the exception of the land use change
assumption. The minutes from that meeting state:
170
The Committee raised concerns about the forecasting assumption considering Land Use Change – specifically that plan change 1 would influence land use change. A member raised concerns that in his opinion the public had been advised that plan change 1 would not require land use change. Staff advised that the assumption statement simply outlined the likelihood of the plan change influencing land use change, as opposed to requiring it. This item was tabled for consideration at a later date when Policy staff were available to advise on it.
Issue 7. Council must disclose significant forecasting assumptions as part of the LTP. The assumptions will be
adopted by council for auditing on 22 February 2018 as part of LTP background documents therefore forecasting assumptions need to be finalised prior to that occurring.
What changes have been made? 8. All changes since the June Policy and Strategy Committee meeting have been highlighted in yellow in
appendices one and two. However, a summary of changes is noted below.
9. The regional economic assumption has been removed. Instead, the growth assumption (a financial assumption) has been expanded to include gross domestic product projections for the Waikato region.
10. An additional assumption has been added around the future governance and management arrangements of the Lake Taupo Protection Trust.
11. An additional assumption has been added around the Healthy Environments project.
12. Three GOA assumptions have been added, two for Community and Services and one for Public Transport.
13. The Proportion of total service costs covered by passenger fares Public Transport GOA assumption has been updated to now include a percentage figure.
14. The land use change assumption has not been changed since the June council meeting. The intention of
the assumption was to signal that plan change one would likely influence land use change, as opposed to requiring it.
Assessment of significance 15. Having regard to the decision making provisions in the Local Government Act 2002 and council’s
Significance and Engagement Policy, a decision in accordance with the recommendations is not considered to have a high degree of significance.
Policy considerations 16. To the best of the writer’s knowledge, this decision is not significantly inconsistent with nor is anticipated
to have consequences that will be significantly inconsistent with any policy adopted by this local authority or any plan required by the Local Government Act 2002 or any other enactment.
Conclusion 17. The Local Government Act 2002 requires councils to disclose significant forecasting assumptions. This
report outlines changes made since the June 2017 Strategy and Policy Committee and seeks the committee’s approval for recommendation to council.
Attachments Appendix 1 – regional forecasting assumptions Appendix 2 – groups of activities forecasting assumptions.
171

Appendix 1 – regional forecasting assumptions
FORECASTING ASSUMPTION RISK LEVEL OF UNCERTAINTY
Waikato Regional Council strategic direction In December 2016, Waikato Regional Council adopted a new strategic direction to guide work over the current council’s term. It is assumed that the first three years of the 2018 - 2028 Long Term Plan will have a strategic focus on council’s seven priority areas (below) while continuing to work towards a healthy environment, strong economy and vibrant communities.
• Support communities to take action on agreed outcomes • Forge and strengthen partnerships to achieve positive outcomes for the region • Positively influence future land use choices to ensure long term sustainability • Manage freshwater more effectively to maximise regional benefit • Increase communities’ understanding of risks and resilience to change • Enhance the value of the region’s coasts and marine area • Shape the development of the region so it supports our quality of life.
That council decides to change its strategic direction sometime in the next three years.
Low
Land use change There are a number of development trends that are having an impact on land use change in the region.
• Since the mid-1990s there has been a net reduction in exotic forestry in the region and net increase in high producing grassland
• Intensive farming is continuing to move onto less suitable land • Diversification of rural land use (such as tea and Manuka) • There has been an increase in cropland, market gardening, orchards and vineyards • The amount of high quality rural land subdivided for lifestyle blocks continues to increase • Increasing demand for housing and house prices in the Waikato region driven by high Auckland prices.
Land use change projections from 2013 – 2063 are noted below from the Land use, demographic and economic projections for the Waikato region, 2013 to 2063 (hectares) – for selected land uses technical report. However, it is likely Plan Change 1 Waikato and Waipa River catchments (Healthy Rivers) and subsequent plan changes will influence land use change over time.
Urban growth pressures in the region accelerate more than anticipated.
Low
172
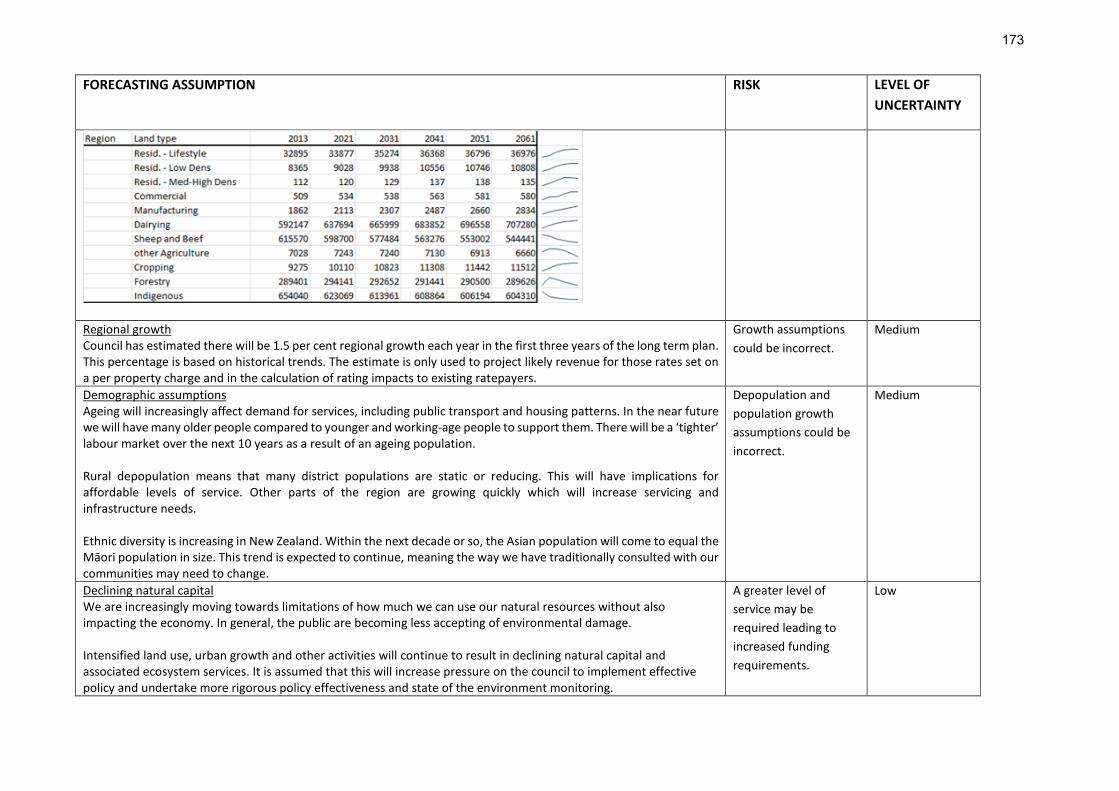
FORECASTING ASSUMPTION RISK LEVEL OF UNCERTAINTY
Regional growth Council has estimated there will be 1.5 per cent regional growth each year in the first three years of the long term plan. This percentage is based on historical trends. The estimate is only used to project likely revenue for those rates set on a per property charge and in the calculation of rating impacts to existing ratepayers.
Growth assumptions could be incorrect.
Medium
Demographic assumptions Ageing will increasingly affect demand for services, including public transport and housing patterns. In the near future we will have many older people compared to younger and working-age people to support them. There will be a ‘tighter’ labour market over the next 10 years as a result of an ageing population. Rural depopulation means that many district populations are static or reducing. This will have implications for affordable levels of service. Other parts of the region are growing quickly which will increase servicing and infrastructure needs. Ethnic diversity is increasing in New Zealand. Within the next decade or so, the Asian population will come to equal the Māori population in size. This trend is expected to continue, meaning the way we have traditionally consulted with our communities may need to change.
Depopulation and population growth assumptions could be incorrect.
Medium
Declining natural capital We are increasingly moving towards limitations of how much we can use our natural resources without also impacting the economy. In general, the public are becoming less accepting of environmental damage. Intensified land use, urban growth and other activities will continue to result in declining natural capital and associated ecosystem services. It is assumed that this will increase pressure on the council to implement effective policy and undertake more rigorous policy effectiveness and state of the environment monitoring.
A greater level of service may be required leading to increased funding requirements.
Low
173

FORECASTING ASSUMPTION RISK LEVEL OF UNCERTAINTY
Climate change There has been a large shift in the understanding and acceptance of climate change risks over the last three years and increased international support for the need to address the risks. For the Waikato, it is assumed that as a result of climate change the region can generally expect:
- Warmer, drier summers, particularly in the north east and Coromandel areas - Milder winter nights - Rising sea levels - Shifting seasons - Increased frequency and intensity of extreme weather events.
Council assumes we will need to adapt to likely climate change effects such as weather related natural hazards and sea level rise. This means localising global climate change planning and models to allow for considered adaptation responses.
The impacts of climate change could be felt sooner or be greater than assumed.
Low
Organisational assumptions It is assumed that the purpose of the Local Government Act 2002 will remain: ‘to enable democratic decision making and action by, and on behalf of, communities and to meet the current and future needs of communities for good quality local infrastructure, local public services, and performance of regulatory functions in a way that is most cost effective for households and businesses’.
The purpose of local government will change.
Low
Treaty settlements It is assumed that central government will require Waikato Regional Council to implement Treaty settlements. This will come at an increasing and significant cost to council from which council should seek recompense from central government.
That no financial recompense is made by central government.
High – this could mean an increased funding requirement which will have to be budgeted to fund the cost to implement Treaty settlement legislation.
Influence of iwi There is increasing influence of Iwi in the region. Existing and nearly-completed Treaty settlements are increasing the economic power of iwi and this will increase expectations of council, for example, over natural resource management.
Council cannot meet iwi expectations and an increased level of service is required.
Medium
174

FORECASTING ASSUMPTION RISK LEVEL OF UNCERTAINTY
Lake Taupo Protection Trust Future governance and management arrangements remain unknown.
Governance and management arrangements change and have a financial impact on council
Medium
Healthy Environments Only the policy stage of the Healthy Environments project has been budgeted. Implementation costs will be budgeted in the 2021-2031 LTP.
Implementation costs are required earlier than year one of the 2021-2031 LTP.
Low
Economic growth The region’s economy is very dependent on dairy farming therefore it is subject to swings in the world commodity market. The region’s economy is also very dependent on the international economy which remains sluggish, and with significant risks of further corrections. However, the Reserve Bank (March 2017) believes the New Zealand economic outlook is positive with strong immigration gains, household spending and construction.
Economic conditions could worsen.
Medium
175
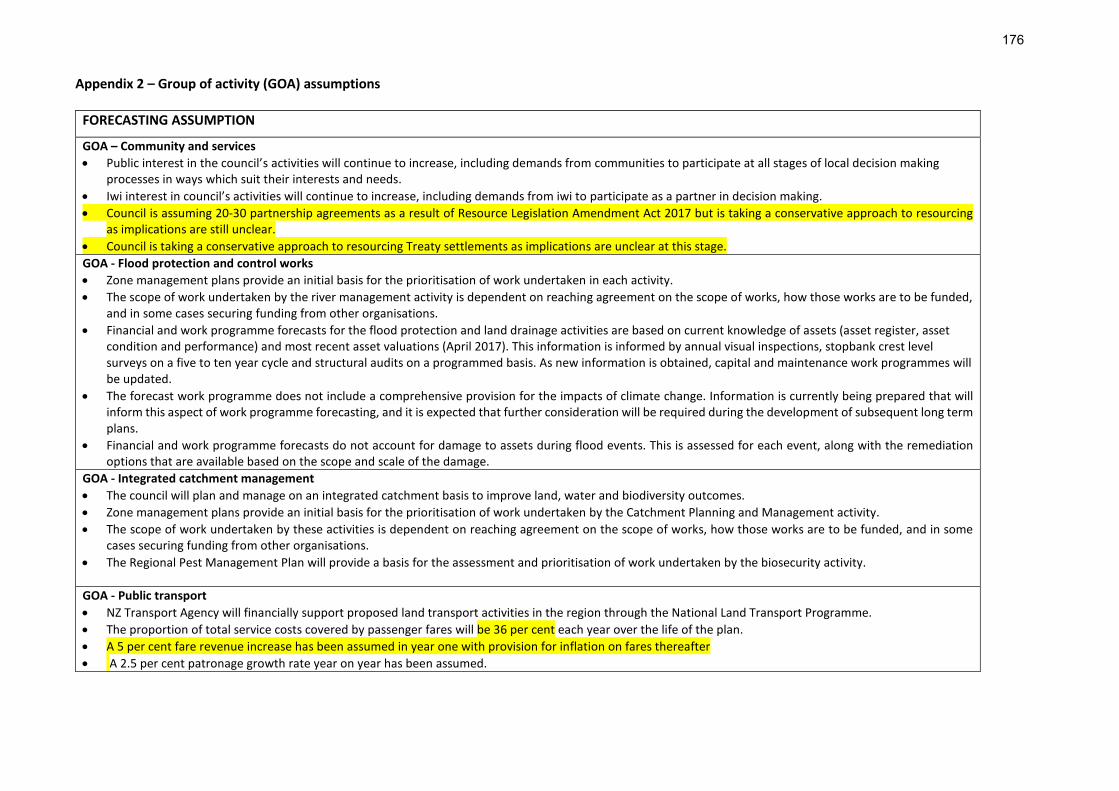
Appendix 2 – Group of activity (GOA) assumptions
FORECASTING ASSUMPTION
GOA – Community and services • Public interest in the council’s activities will continue to increase, including demands from communities to participate at all stages of local decision making
processes in ways which suit their interests and needs. • Iwi interest in council’s activities will continue to increase, including demands from iwi to participate as a partner in decision making. • Council is assuming 20-30 partnership agreements as a result of Resource Legislation Amendment Act 2017 but is taking a conservative approach to resourcing
as implications are still unclear. • Council is taking a conservative approach to resourcing Treaty settlements as implications are unclear at this stage. GOA - Flood protection and control works • Zone management plans provide an initial basis for the prioritisation of work undertaken in each activity. • The scope of work undertaken by the river management activity is dependent on reaching agreement on the scope of works, how those works are to be funded,
and in some cases securing funding from other organisations. • Financial and work programme forecasts for the flood protection and land drainage activities are based on current knowledge of assets (asset register, asset
condition and performance) and most recent asset valuations (April 2017). This information is informed by annual visual inspections, stopbank crest level surveys on a five to ten year cycle and structural audits on a programmed basis. As new information is obtained, capital and maintenance work programmes will be updated.
• The forecast work programme does not include a comprehensive provision for the impacts of climate change. Information is currently being prepared that will inform this aspect of work programme forecasting, and it is expected that further consideration will be required during the development of subsequent long term plans.
• Financial and work programme forecasts do not account for damage to assets during flood events. This is assessed for each event, along with the remediation options that are available based on the scope and scale of the damage.
GOA - Integrated catchment management • The council will plan and manage on an integrated catchment basis to improve land, water and biodiversity outcomes. • Zone management plans provide an initial basis for the prioritisation of work undertaken by the Catchment Planning and Management activity. • The scope of work undertaken by these activities is dependent on reaching agreement on the scope of works, how those works are to be funded, and in some
cases securing funding from other organisations. • The Regional Pest Management Plan will provide a basis for the assessment and prioritisation of work undertaken by the biosecurity activity. GOA - Public transport • NZ Transport Agency will financially support proposed land transport activities in the region through the National Land Transport Programme. • The proportion of total service costs covered by passenger fares will be 36 per cent each year over the life of the plan. • A 5 per cent fare revenue increase has been assumed in year one with provision for inflation on fares thereafter • A 2.5 per cent patronage growth rate year on year has been assumed.
176

FORECASTING ASSUMPTION
• An interim solution to the Hamilton to Auckland transport connections project is being proposed in this LTP, however, the outcome beyond that will be dependent on the success or otherwise of the interim solution trial and the completion of the strategic business case. Financial provision has been made over the life of the LTP at the same level as year two given the uncertainty of spend in the outer years.
GOA - Regional hazards and emergency response • Public and stakeholder expectations on the accessibility of hazard and risk information and advice will increase. • Public and stakeholder expectations on the quality of information and advice will continue to increase. • There will be increasing pressure to intensify the use of hazard prone land. • As public/stakeholder expectations increase so will the cost of protection and the associated risks. • The need to better understand the impacts of climate change and the subsequent response will continue to increase. • The National Marine Oil Spill Contingency Plan and Regional Marine Oil Spill Contingency Plan will provide a basis for the scope of work undertaken by the
Marine Oil Spill Response team. • The Waikato CDEM Group/Waikato Regional Council service level agreement will provide a basis for the scope of work undertaken by the support to CDEM
activity. GOA - Resource use • Increased public interest and expectations relating to environmental issues will result in higher levels of public reporting of environmental incidents and
monitoring required by council, with subsequent impacts on levels of service for compliance monitoring, incident response and investigation/enforcement of non-compliance.
• The consent processing and compliance activity level of service in the long term plan will need to be reviewed during the life of the plan to take into account the implementation of the Healthy Rivers Plan implementation.
• The proposed Coastal Plan review, full regional plan review, and Hauraki plan change will not have an impact on Resource Use level of service for the first three years of the LTP.
• Evolution of co-management will result in higher expectations from iwi partners, e.g. iwi based honorary enforcement officers, more training/mentoring of Iwi staff.
• As new regulations come on line (e.g. Healthy Rivers / Hauraki / Coastal Plan / 1080) there will be a need to respond to complaints in respect of potential breaches and deal with any incidents of non-compliance.
• The form and function of the maritime services activity will remain the same. GOA - Science and strategy • Much of the existing work programmes are based on current statutory responsibilities. However, imminent Resource Management Act reform, new national
direction, changes to existing national direction and treaty settlement legislation will require significant changes to existing work programmes. • Use of new technology will be necessary to help provide communities with data, involve them in the GOA’s work and empower communities to take action. • Working together will be a change to business as usual and is likely to require new skill sets and additional resourcing to develop a common evidence base with
iwi and others with whom we are working. • Council’s desire to achieve multiple benefits from decision making, coupled with its regional leadership role, mean that an increasing proportion of the Science
and Strategy GOA’s work will involve working together internally and externally to achieve integrated outcomes, rather than being narrow, more prescribed pieces of work.
GOA - Waikato Civil Defence and Emergency Management Group
177

FORECASTING ASSUMPTION
• Natural hazards and disasters are predicted to increase in both frequency and severity over time. • Key partners and stakeholders will continue to support and contribute to the work of Civil Defence Emergency Management (CDEM) across the region. • Several reviews of CDEM activations will be undertaken by Central Government. The learnings and recommendations are likely to impact on how CDEM is
undertaken in New Zealand. • Further amendments to the CDEM Act 2002 will be passed through Parliament. The implications of these remain uncertain. • As the recovery function becomes more prominent in the legislation, an increase in staffing may be required to meet these new legislated activities. • Impacts from the recently amendment Resource Management Act elevating natural hazards and risk reduction to a matter of national importance are yet to be
clarified and implemented. • The Sendai Framework for Disaster Risk Reduction is to be legislated and the National Resilience Strategy to be introduced across New Zealand as a matter of
national importance. These strategic documents will drive CDEM capability and assist in empowering communities to develop their own Community Response Plans.
178

Report to Strategy and Policy Committee
Date: 13 February 2018
Author: Anthea Sayer, Senior Corporate Planner, Corporate Planning
Authoriser: Mike Garrett, Chief Financial Officer
Subject: 2018-2028 Long Term Plan performance measures
Section: B (For recommendation to Council)
Purpose 1. To adopt the 2018-2028 Long Term Plan (LTP) performance measures.
Executive Summary 2. A set of 51 performance measures have been drafted for the 2018-2028 LTP. A total of 28 were rolled
over from the last LTP and 23 new measures were developed. Councillors were given the opportunity to provide feedback after the 13 December LTP workshop where the draft measures were distributed for review. Audit NZ has reviewed the proposed measures and their feedback has been incorporated. The performance measures now need to be adopted by council and will be included as supporting material on the council website during LTP consultation.
Staff Recommendations:
1. That the report ‘2018-2028 Long Term Plan performance measures’ (Doc # 11704072 dated 13 February 2018) be received.
2. That council adopts the 2018-2028 Long Term Plan performance measures to be included as supporting material for consultation.
Background 3. Schedule 10 of the Local Government Act 2002 requires councils to develop performance measures that
enable the public to assess the level of service delivered for major aspects of each groups of activities. This includes one mandatory measure for regional councils related to flood protection and control works.
Development of 2018-2028 LTP measures 4. Over the past few months, staff have been reviewing and developing levels of service and performance
measures. A template was used as the basis of the review and ensured strong linkages were made between council’s strategic direction (community outcomes), why we deliver the service, and levels of service and associated performance measures.
5. The key attributes shown in each table highlight the objectives council is attempting to achieve by
undertaking the activity. Common attributes include sustainability, safety, customer service, quality, reliability/responsiveness, accessibility and affordability. Levels of service and performance measures were then based around the key attributes.
6. A desktop review of existing measures was also completed to determine whether they had been
successful – were they a true measure of the work we do? Were they able to be easily measured? If the
179

answer was yes and the measure still aligned to the council’s strategic direction, the measure was retained. Where appropriate, some measures were benchmarked against other regional councils.
7. There are a total of 51 performance measures, an increase from 42 in the 2015-2025 LTP. 28 are rolled
over from the previous LTP.
Changes since 13 December workshop 8. Councillors were provided with a copy of the draft measures at the 13 December LTP workshop and given
the opportunity to provide feedback by 15 January. 9. Throughout January Audit New Zealand were also reviewing the draft measure and provided comments
to staff for consideration.
10. As a result seven performance measures have been updated, and these changes are listed in paragraphs 13 to 20.
11. A small number of minor wording changes were also made to levels of service and performance measures
as a result of feedback. The changes don’t alter the meaning of the levels of service or measures, rather they just provide clarity.
12. The Office of the Auditor-General will undertake a final review (‘hot’ review) of the consultation document
and supporting information and may have some additional changes to levels of service and performance measures as a result.
13. The environmental monitoring activity measure Data is available 98% of the time for flood alarmed
hydrology sites was removed as it was a technical measure and did not represent a service provided to the community.
14. The biosecurity measure Reducing trend in infestations of "progressive containment" pest plants at known
sites was also removed as the method to collect the data was not robust enough.
15. The integration and infrastructure measure has been split into two measures. 1. Update the Regional Policy Statement as per the schedule programme 2. Actively engage with district plan change process to ensure RPS is given effect to.
16. A Waikato civil defence and emergency management group measure has been split into two measures:
1. The operative Group CDEM Plan is reviewed within statutory timeframes 2. Annual assessment and, if necessary, revision of Group Plan to ensure it complies with current
legislative requirements. 17. The target for the following biodiversity measure has been increased from 90% to 100%.
Percentage of projects funded through Natural Heritage Partnership Programme that achieve milestones as per the funding agreement. 90% was seen as too low when in the past two years this measure has achieved a 100% result.
18. The measure Percentage of flood recovery plans put in place after all major events was removed from the river management activity as it also appeared in the flood protection activity.
19. The year 2 target for the Iwi Maori participation measure Completion of key actions identified in the Maori Partnership Approach was changed from Review of the MPA completed to Number of actions completed as per schedule. This was because there was no clear link between the year two target and the performance measure.
180

20. The regional strategy and development measure The strategic direction is updated every three years was removed as it would not be able to be reported on until the next LTP. The following measure has replaced it:
LEVELS OF SERVICE
What’s
important for
this activity
(key attributes)
What we will
deliver to the
community
(levels of
service)
How we will
measure
performance
(performance
measure)
Baseline result
Year 1 2018/19
Year 2 2019/20
Year 3 2020/21
Years 4-10 2021/22-2028/29
Is this a new
measure?
Quality – ensuring
the work we
undertake is
delivering on our
strategic direction
priorities
To ensure that
council is making
progress towards
its strategic
direction
priorities
Report annually on progress made against council’s strategic direction
Progress reported in the WRC annual report
Progress reported in the WRC annual report
Progress reported in the WRC annual report
Progress reported in the WRC annual report
Progress reported in the WRC annual report
Yes
Next steps 21. The performance measures will be included as supporting material on the council website during LTP
consultation.
Assessment of significance 22. Having regard to the decision making provisions in the Local Government Act 2002 and council’s
Significance and Engagement Policy, a decision in accordance with the recommendations is not considered to have a high degree of significance.
Conclusion 23. The Local Government Act 2002 requires councils to develop performance measures. A new set of 51
performance measures has been developed for the 2018–2028 LTP which includes 23 new measures and 27 measures retained from the 2015-2025 LTP. There is no requirement to include the measures in the consultation document; however the new set of measures will be included as supporting documentation on the Waikato Regional Council website.
Attachments Appendix 1 - 2018-2028 Long Term Plan performance measures.
181

Appendix 1: 2018-2028 Long Term Plan performance measures
GOA: FLOOD PROTECTION AND CONTROL WORKS 2018-2028 LTP PERFORMANCE MEASURES: FLOOD PROTECTION
WHAT WE DO
Waikato Regional Council is the primary agency responsible for providing communities with an agreed level of protection from floods. The council owns and manages significant flood protection schemes within the region, with a total asset value of approximately $580 million.
The flood protection services are focused primarily on those specific geographic areas where schemes have been agreed with communities. The services are closely connected to hazard, risk and land use management. Key assets managed include stopbanks, floodgates, pump stations, channel/streams and pumps.
WHY WE DO IT
Council has the function of minimising and preventing damage caused by floods and erosion in the region to reduce the risks to communities from flooding and other risks associated with rivers, streams and their catchments while supporting the economic productivity of protected land. Its objective is to safeguard people’s lives and property, reduce impacts on the environment, and protect services such as water supply, power, telecommunication and transport networks that could be damaged as a result of flooding.
Responsible officer: Lisa Drysdale Reporting officer: Gareth Langdon
Level of alignment to community outcomes ■ = primary contribution ■ = secondary contribution
HEALTHY ENVIRONMENT STRONG ECONOMY VIBRANT COMMUNITIES
• Land use is appropriate to its long term sustainability
• The full range of ecosystem types, including land,
water and coastal and marine ecosystems, is in a
healthy and functional state.
• Economic growth ensures natural capital and
ecosystem services are maintained
• By 2034 value added per capita will grow by 2.8% per
annum so that the Waikato region is in the upper third
of regions in New Zealand for economic performance
• New investment is attracted to the region through
improved reputation and partnerships.
• Communities are less vulnerable and more resilient to
natural hazards, the effects of climate change and
changes to society and the economy
• People and communities are well connected to each
other, to services (including health and other essential
services), and to opportunities including recreation,
education and jobs.
Level of alignment to council priorities
PRIORITY LEVEL OF ALIGNMENT
Support communities to take action on agreed outcomes Strongly contributes
Forge and strengthen partnerships to achieve positive outcomes for the region Strongly contributes
Positively influence future land use choices to ensure long term sustainability Partially contributes
Increase communities’ understanding of risks and resilience to change Strongly contributes
182

Enhance the value of the region’s coasts and marine area Partially contributes
Shape the development of the region so it supports our quality of life Strongly contributes
LEVELS OF SERVICE
What’s important for
this activity
(key attributes)
What we will deliver
to the community
(levels of service)
How we will measure
performance
(performance
measure)
Baseline result
Year 1 2018/19
Year 2 2019/20
Year 3 2020/21
Years 4-10 2021/22-2028/29
Is this a new measure?
Safety:
Ensuring the safety of property, people and stock by actively managing and maintaining agreed flood protection schemes to the agreed 'annual exceedance probability' (AEP) levels.
Sustainability:
Supporting the economic return of farm and urban areas within agreed schemes by ensuring they are protected from flooding and ensuring scheme land is managed in a manner that promotes its long term economic and biodiversity properties.
To provide the standard of flood protection agreed with communities as set out in zone plans and associated documents.
Mandatory measure
Major flood protection and control works are maintained, repaired and renewed to the key standards defined in relevant planning documents (such as zone management plan, annual works programme or long term plan)
2016/17
Achieved
Achieved Achieved Achieved Achieved No. From the 2015-2025 LTP.
Mandatory measure.
Three further performance measures sit under this measure.
Percentage of planned mandatory maintenance* actions achieved each year
2016/17
84.2%
85% 85% 85% 90% No, from 2015-2025 LTP.
Percentage of stopbanks maintained to above designed flood height, as agreed within each zone
2016/17
Rural: 92%
Urban: n/a
Rural: 93%
Urban: 93%
Rural: 93%
Urban: 95%
Rural: 93%
Urban: 98%
Rural: 93%
Urban: 98%
No. From 2015-2025 LTP.
Percentage of flood recovery plans** implemented after all major events
New measure
50% compliant
80% compliant
100% compliant
100% compliant
Yes
Notes/Definitions: *Maintenance can mean repair, renew or maintain.
** The plans set out timeframes under which flood response actions are to be completed.
183

2018-2028 LTP PERFORMANCE MEASURES: RIVER MANAGEMENT
WHAT WE DO
Waikato Regional Council has overall responsibility for managing rivers and streams in the Waikato region. The Council manages rivers and streams to reduce impacts on communities from erosion, channel instability and channel congestion. Programmes are based on priority and the level of risk to people and property.
Good river management includes erosion control, gravel management and management of vegetation, but also seeks to achieve broader environmental outcomes such as habitat restoration and biodiversity enhancement.
A guiding principle for the council is ‘integrated’ catchment management which seeks to promote the sustainable management of the region’s natural resources across a number of activity areas.
WHY WE DO IT
The main focus of river management is on activities to maintain the stability and capacity of rivers and streams. The purpose is to safeguard productive land, people and property along with achieving broader environmental outcomes.
River management protects valuable soil from eroding, supports improving water quality by protecting waterways from sediment entry, and protects property from flooding damage. River management is therefore closely aligned to the flood protection activity.
Responsible officer: Lisa Drysdale Reporting Officer Gareth Langdon
Level of alignment to community outcomes ■ = primary contribution ■ = secondary contribution
HEALTHY ENVIRONMENT STRONG ECONOMY VIBRANT COMMUNITIES • Land use is appropriate to its long term sustainability
• The full range of ecosystem types, including land,
water and coastal and marine ecosystems, is in a
healthy and functional state
• Economic growth ensures natural capital and
ecosystem services are maintained
• New investment is attracted to the region through
improved reputation and partnerships
• Communities are less vulnerable and more resilient
to natural hazards, the effects of climate change and
changes to society and the economy
• Communities are empowered and supported to take
action on agreed outcomes.
• People and communities are well connected to each
other, to services (including health and other essential
services), and to opportunities including recreation,
education and jobs
• There is increased benefit from the use and
protection of our amenity and recreational features
and values
• Co-governance with iwi is meaningful and effective
Level of alignment to council priorities
PRIORITY LEVEL OF ALIGNMENT Support communities to take action on agreed outcomes Strongly contributes
184

Forge and strengthen partnerships to achieve positive outcomes for the region Strongly contributes
Manage freshwater more effectively to maximise regional benefit Strongly contributes
Increase communities’ understanding of risks and resilience to change Strongly contributes
Shape the development of the region so it supports our quality of life Partially contributes
LEVELS OF SERVICE
What’s important for
this activity
(key attributes)
What we will deliver
to the community
(levels of service)
How we will measure
performance
(performance
measure)
Baseline result
Year 1 2018/19
Year 2 2019/20
Year 3 2020/21
Years 4-10 2021/22-2028/29
Is this a new measure?
Safety
Ensuring the safety of infrastructure, property, people, and biodiversity by actively managing and maintaining channel capacity and stability.
To maintain channel capacity and stability of priority rivers and streams in each management zone.
Percentage of planned maintenance actions achieved each year
New measure
85% 85% 85% 90% Yes. This is a new measure for the river management activity but has previously been used for flood protection.
Customer service
Responding to local government bodies, iwi, and the general public queries or issues with the rivers and surrounding land managed by the WRC.
Percentage of enquiries acknowledged within two working days.
New measure
95% 95% 95% 95% Yes. Demonstrates the customer service attribute.
185

2018-2028 LTP PERFORMANCE MEASURES: LAND DRAINAGE
WHAT WE DO
Waikato Regional Council manages a system of natural and built infrastructure to provide adequate land drainage to support productive pastoral (and other) farming. Without these drainage networks, these areas of land would be less productive and largely inaccessible.
Council has oversight of 92 land drainage schemes which were set up based on a historic network of drains. Each scheme is fully funded under its own targeted rate.
Other drainage schemes exist within the region, including those managed by district councils, drainage on land outside formalised schemes, private schemes and areas managed by the NZ Transport Agency. .
WHY WE DO IT
Land drainage services safeguard the economic wellbeing of the region by maintaining the drainage network to provide land owners the ability to manage the water table on their properties, reducing surface flooding resulting from rainfall events and maintaining water levels to support healthy pasture. Without these drainage networks, these areas of land would be less productive.
While drainage has greatly improved the ability to farm land profitably, excessive drainage and land use may accelerate loss of peat soils. The Waikato Regional Policy Statement (RPS) seeks to achieve a balance between drainage and the long term protection of peat soils for future generations.
Responsible officer: Matthew Davis Reporting Officer Drainage manager TBC
Level of alignment to community outcomes ■ = primary contribution ■ = secondary contribution
HEALTHY ENVIRONMENT STRONG ECONOMY VIBRANT COMMUNITIES • Land use is sustainable
• The full range of ecosystem types, including land,
water and coastal and marine ecosystems, is in a
healthy and functional state.
• By 2034 value added per capita will grow by 2.8% per
annum so that the Waikato region is in the upper third
of regions in New Zealand for economic performance
• Economic growth ensures natural capital and
ecosystem services are maintained.
• Communities are less vulnerable and more resilient to
natural hazards, the effects of climate change and
changes to society and the economy
• People and communities are well connected to each
other, to services (including health and other essential
services), and to opportunities including recreation,
education and jobs.
Level of alignment to council priorities
PRIORITY LEVEL OF ALIGNMENT Support communities to take action on agreed outcomes Partially contributes
Increase communities’ understanding of risks and resilience to change Strongly contributes
186

LEVELS OF SERVICE
What’s important for
this activity
(key attributes)
What we will deliver to
the community
(levels of service)
How we will measure
performance (performance
measure)
Baseline result
Year 1 2018/19
Year 2 2019/20
Year 3 2020/21
Years 4-10 2021/22-2028/29
Is this a new measure?
Quality - an effective job is being done.
To provide reliable water table management on land within drainage schemes for the purpose of maintaining pastoral production.
Number of reported incidences where it takes more than three days to remove surface water after events with up to a 10% annual exceedance probability.
2016/17
≤5
≤5 ≤5 ≤5 ≤5 No. From 2015-2025 LTP.
187

GOA: INTEGRATED CATCHMENT MANAGEMENT 2018-2028 LTP PERFORMANCE MEASURES: CATCHMENT MANAGEMENT AND PLANNING
WHAT WE DO
The catchment planning and management activity provides for the management of catchments throughout the region. Key priorities for this activity include maintaining existing soil conservation schemes, promoting, planning and implementing new catchment protection projects, implementing localised water quality programmes, protecting biodiversity, managing shallow lakes, and planning for zones, catchments and harbours.
Works are delivered according to priorities established within each management zone or outcome area and include erosion control and prevention, riparian protection through fencing and planting, lake and wetland protection, enhancement and restoration, bush fragment protection and pest plant and animal control.
Council also undertakes zone, catchment and harbour management planning, including the development and review of eight zone management plans.
WHY WE DO IT
Overall, catchment management aims to achieve:
• reduced sedimentation of rivers, harbours and estuaries
• more stable rivers and catchments
• greater awareness of land and water sustainability
• improvement and protection of the region's harbours and estuaries
• improvement and maintenance of water quality
• improvement and protection of biodiversity and shallow lakes
• co-ordinated and integrated catchment planning.
Catchment management activities are catchment-wide by nature, with the benefits experienced both locally within and across catchments. They often span more than one territorial authority and for this reason, regional councils are deemed the most appropriate management agency for these public good services.
Responsible officer: Michelle Lewis Reporting Officer Tane Desmond
Level of alignment to community outcomes ■ = primary contribution ■ = secondary contribution
HEALTHY ENVIRONMENT STRONG ECONOMY VIBRANT COMMUNITIES • Land use is sustainable
• It is safe to swim and take kai from all freshwater
• The full range of ecosystem types, including land,
water and coastal and marine ecosystems, is in a
• Economic growth ensures natural capital and
ecosystem services are maintained
• Our diverse communities feel like a valued part of the
Waikato and take pride in the region.
• Communities are empowered and supported to take
action on agreed outcomes.
• Communities are less vulnerable and more resilient to
188

healthy and functional state
• All soil quality indicators are trending positive.
natural hazards, the effects of climate change and
changes to society and the economy
• There is increased benefit from the use and protection
of our amenity and recreational features and values
• Co-governance with iwi is meaningful and effective.
Level of alignment to council priorities
PRIORITY LEVEL OF ALIGNMENT Forge and strengthen partnerships to achieve positive outcomes for the region Strongly contributes
Positively influence future land use choices to ensure long term sustainability Strongly contributes
Manage freshwater more effectively to maximise regional benefit Strongly contributes
189

LEVELS OF SERVICE
What’s important for
this activity
(key attributes)
What we will deliver
to the community
(levels of service)
How we will measure
performance
(performance measure)
Baseline result
Year 1 2018/19
Year 2 2019/20
Year 3 2020/21
Years 4-10 2021/22-2028/29
Is this a new measure?
Quality - Robust planning work is undertaken and quality implementation takes place.
To maintain existing historic scheme works to ensure gains are preserved
Percentage of sampled catchment works maintained in effective condition to the standards set out in zone plans.*
* a sample of at least 10% of all catchment scheme and non-scheme works (Individual work agreements legally protected on property title outside schemes) are inspected to assess works condition every year. Works include fencing, planting and erosion control structures.
2016/17
87.8% achieved
70% 70% 70% 70% No, however there was a similar measure in the 2015 LTP but it has been expanded to include catchment AND non-scheme works
Notes/Definitions: The target has been lowered to 70% to take account of the fact the measure now includes catchment and non-scheme works.
LEVELS OF SERVICE
What’s important for
this activity
(key attributes)
What we will deliver
to the community
(levels of service)
How we will measure
performance
(performance measure)
Baseline result
Year 1 2018/19
Year 2 2019/20
Year 3 2020/21
Years 4-10 2021/22-2028/29
Is this a new measure?
Quality - Robust planning work is undertaken and quality implementation takes place.
To implement agreed plans (catchment new works) with landowners and land managers for reduced erosion, improved water quality and enhanced biodiversity
Percentage of catchment new works undertaken in priority catchments and/or at priority sites across all zones.
New measure
70% 80% 80% 80% Yes. Monitors the implementation of plans.
Notes/Definitions: This includes: priority catchments as identified in zone plans or as part catchment management planning activities. Priority sites as identified in the
Waikato and Waipa River Restoration Strategy or as part biodiversity prioritisation investigations.
190

2018-2028 LTP PERFORMANCE MEASURES: LAND MANAGEMENT ADVISORY SERVICES
WHAT WE DO
This activity works with others to deliver a range of non-regulatory services to support the agriculture industry to reduce its environmental footprint. It includes community engagement and extension programmes aimed at building farmer awareness of good practices and developing capability and capacity within the industry. The activity promotes and supports research into good practice and farm systems solutions to underpin the extension programmes.
It supports policy implementation by raising awareness of regulatory requirements and in particular it coordinates Farm Environment Planning within the Waikato and Waipa (Healthy Rivers) catchments. It also works in the Hauraki catchments to prepare the agriculture industry for the implications of Plan Change 2.
This service complements regulatory functions by engaging with the agriculture sector and ensuring that it has the systems, capability and capacity to manage the effect of agriculture on water and soil values. Provision of this service is incorporated into integrated catchment management as a whole, ensuring that all aspects of managing a catchment are considered and supported.
WHY WE DO IT
The aim of the service is to reduce the effects of agriculture on the environment. The primary benefit is to the agriculture industry in helping it to meet its obligations. The wider community benefits from having cleaner water bodies and healthier ecosystems.
Responsible officer: Patrick Whaley Reporting Officer Alan Campbell
Level of alignment to community outcomes ■ = primary contribution ■ = secondary contribution
HEALTHY ENVIRONMENT STRONG ECONOMY VIBRANT COMMUNITIES
• Land use is sustainable
• It is safe to swim and take kai from all freshwater
• The Waikato has become predator free, in line with
the New Zealand 2050 target without compromising
indigenous biodiversity
• The full range of ecosystem types, including land,
water and coastal and marine ecosystems, is in a
healthy and functional state
• All soil quality indicators are trending positive.
• By 2034 value added per capita will grow by 2.8% per annum so
that the Waikato region is in the upper third of regions in New
Zealand for economic performance
• Economic growth ensures natural capital and ecosystem services
are maintained
• We are achieving the best use of the region’s fresh water.
• Our diverse communities feel like a valued part of the Waikato and take pride in the region. • Communities are empowered and supported to take action on agreed outcomes. • Communities are less vulnerable and more resilient to natural hazards, the effects of climate change and changes to society and the economy • We support all parts of the Waikato being as successful as they can be Co-governance with iwi is meaningful and
effective.
191
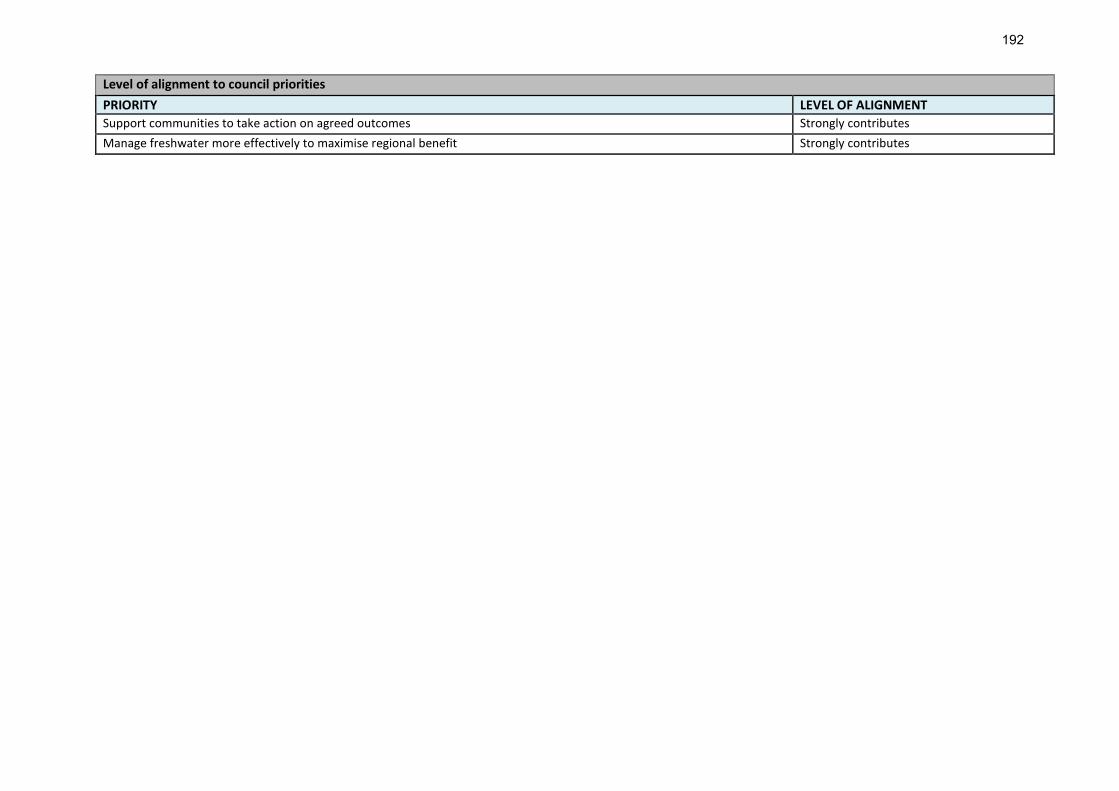
Level of alignment to council priorities
PRIORITY LEVEL OF ALIGNMENT
Support communities to take action on agreed outcomes Strongly contributes
Manage freshwater more effectively to maximise regional benefit Strongly contributes
192
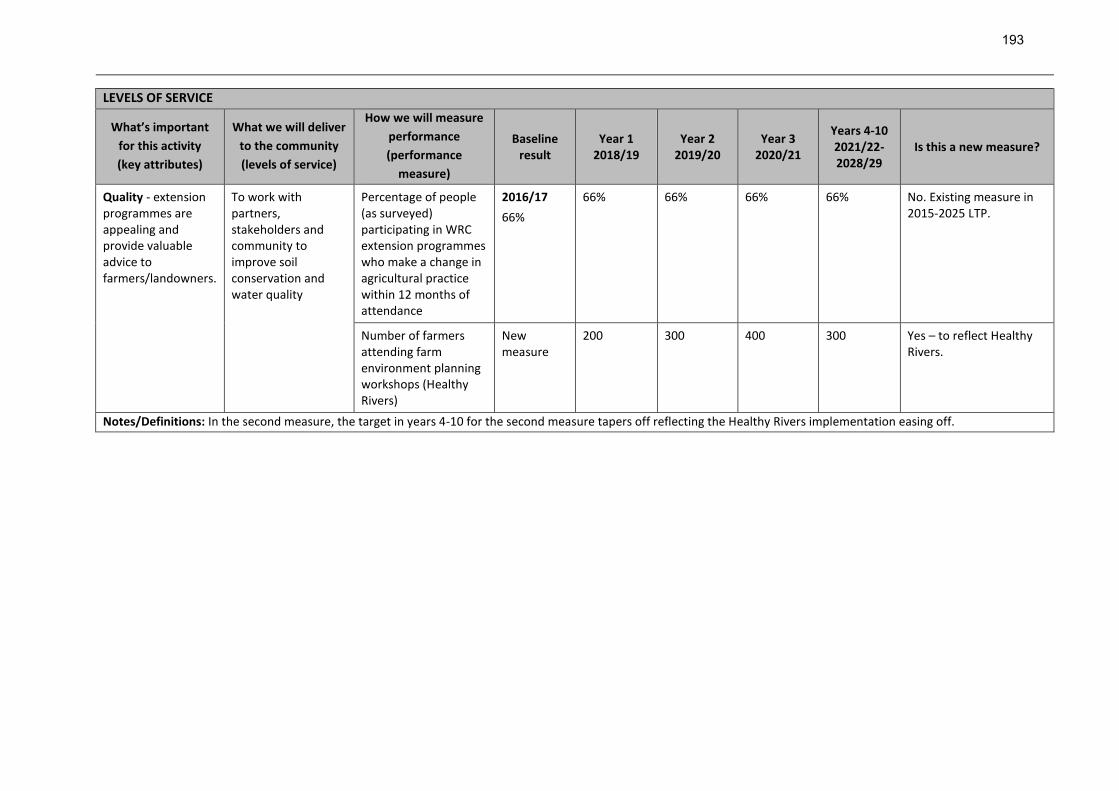
LEVELS OF SERVICE
What’s important
for this activity
(key attributes)
What we will deliver
to the community
(levels of service)
How we will measure
performance
(performance
measure)
Baseline result
Year 1 2018/19
Year 2 2019/20
Year 3 2020/21
Years 4-10 2021/22-2028/29
Is this a new measure?
Quality - extension programmes are appealing and provide valuable advice to farmers/landowners.
To work with partners, stakeholders and community to improve soil conservation and water quality
Percentage of people (as surveyed) participating in WRC extension programmes who make a change in agricultural practice within 12 months of attendance
2016/17
66%
66% 66% 66% 66% No. Existing measure in 2015-2025 LTP.
Number of farmers attending farm environment planning workshops (Healthy Rivers)
New measure
200 300 400 300 Yes – to reflect Healthy Rivers.
Notes/Definitions: In the second measure, the target in years 4-10 for the second measure tapers off reflecting the Healthy Rivers implementation easing off.
193
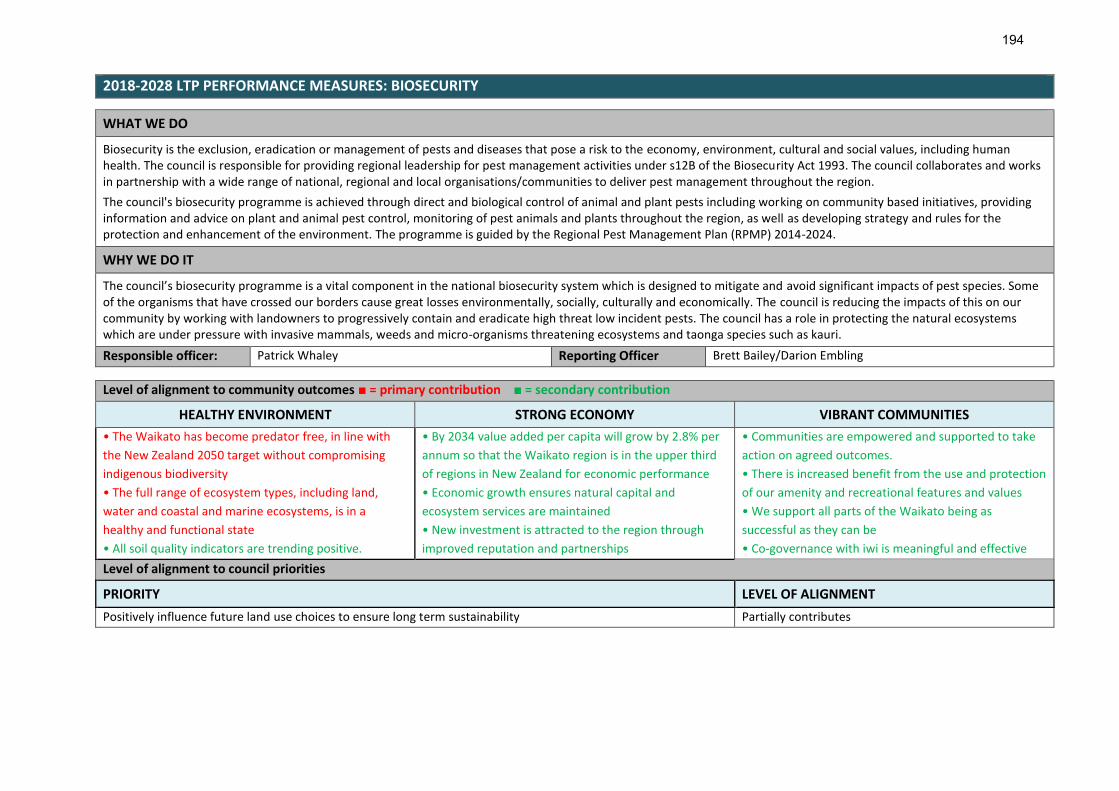
2018-2028 LTP PERFORMANCE MEASURES: BIOSECURITY
WHAT WE DO
Biosecurity is the exclusion, eradication or management of pests and diseases that pose a risk to the economy, environment, cultural and social values, including human health. The council is responsible for providing regional leadership for pest management activities under s12B of the Biosecurity Act 1993. The council collaborates and works in partnership with a wide range of national, regional and local organisations/communities to deliver pest management throughout the region.
The council's biosecurity programme is achieved through direct and biological control of animal and plant pests including working on community based initiatives, providing information and advice on plant and animal pest control, monitoring of pest animals and plants throughout the region, as well as developing strategy and rules for the protection and enhancement of the environment. The programme is guided by the Regional Pest Management Plan (RPMP) 2014-2024.
WHY WE DO IT
The council’s biosecurity programme is a vital component in the national biosecurity system which is designed to mitigate and avoid significant impacts of pest species. Some of the organisms that have crossed our borders cause great losses environmentally, socially, culturally and economically. The council is reducing the impacts of this on our community by working with landowners to progressively contain and eradicate high threat low incident pests. The council has a role in protecting the natural ecosystems which are under pressure with invasive mammals, weeds and micro-organisms threatening ecosystems and taonga species such as kauri.
Responsible officer: Patrick Whaley Reporting Officer Brett Bailey/Darion Embling
Level of alignment to community outcomes ■ = primary contribution ■ = secondary contribution
HEALTHY ENVIRONMENT STRONG ECONOMY VIBRANT COMMUNITIES
• The Waikato has become predator free, in line with
the New Zealand 2050 target without compromising
indigenous biodiversity
• The full range of ecosystem types, including land,
water and coastal and marine ecosystems, is in a
healthy and functional state
• All soil quality indicators are trending positive.
• By 2034 value added per capita will grow by 2.8% per
annum so that the Waikato region is in the upper third
of regions in New Zealand for economic performance
• Economic growth ensures natural capital and
ecosystem services are maintained
• New investment is attracted to the region through
improved reputation and partnerships
• Communities are empowered and supported to take
action on agreed outcomes.
• There is increased benefit from the use and protection
of our amenity and recreational features and values
• We support all parts of the Waikato being as
successful as they can be
• Co-governance with iwi is meaningful and effective
Level of alignment to council priorities
PRIORITY LEVEL OF ALIGNMENT
Positively influence future land use choices to ensure long term sustainability Partially contributes
194
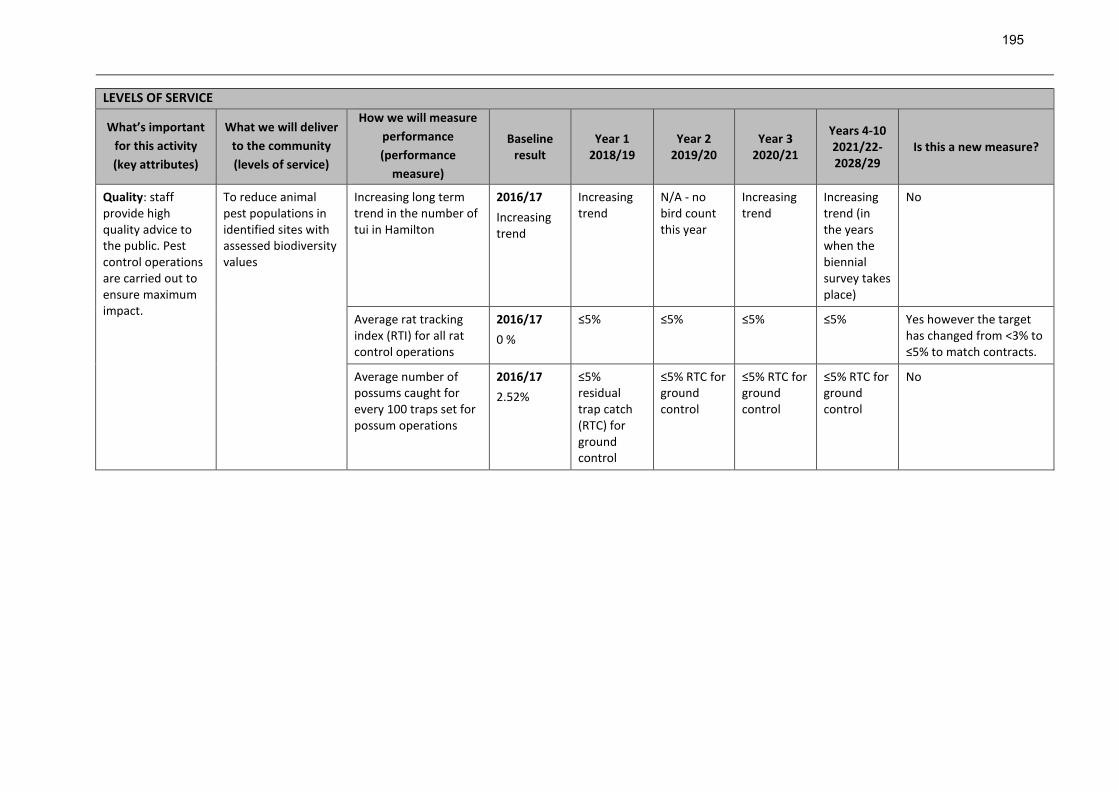
LEVELS OF SERVICE
What’s important
for this activity
(key attributes)
What we will deliver
to the community
(levels of service)
How we will measure
performance
(performance
measure)
Baseline result
Year 1 2018/19
Year 2 2019/20
Year 3 2020/21
Years 4-10 2021/22-2028/29
Is this a new measure?
Quality: staff provide high quality advice to the public. Pest control operations are carried out to ensure maximum impact.
To reduce animal pest populations in identified sites with assessed biodiversity values
Increasing long term trend in the number of tui in Hamilton
2016/17
Increasing trend
Increasing trend
N/A - no bird count this year
Increasing trend
Increasing trend (in the years when the biennial survey takes place)
No
Average rat tracking index (RTI) for all rat control operations
2016/17
0 %
≤5% ≤5% ≤5% ≤5% Yes however the target has changed from <3% to ≤5% to match contracts.
Average number of possums caught for every 100 traps set for possum operations
2016/17
2.52%
≤5% residual trap catch (RTC) for ground control
≤5% RTC for ground control
≤5% RTC for ground control
≤5% RTC for ground control
No
195

LEVELS OF SERVICE
What’s important
for this activity
(key attributes)
What we will deliver
to the community
(levels of service)
How we will measure
performance
(performance
measure)
Baseline result
Year 1 2018/19
Year 2 2019/20
Year 3 2020/21
Years 4-10 2021/22-2028/29
Is this a new measure?
Quality: staff provide high quality advice to the public. Pest control operations are carried out to ensure maximum impact.
To control low density, high threat plant pests to minimise impacts on primary industry and human health
Reducing trend in the number of eradication pest plants* in known sites
2016/17
Reducing trend
Reducing trend
Reducing trend
Reducing trend
Reducing trend
No
Notes/Definitions: *Eradication pest plants are those with limited distribution or density. Eventual goal is eradication at known sites in the region, although 'zero density' is more practical to achieve. Includes African feather grass, cathedral bells, Chilean flame creeper, evergreen buckthorn, horse nettle, Chinese knotweed, lantana, Manchurian wild rice, mile-a-minute, nassella tussock, fire stemmed needle grass and Chilean needle grass, noogoora bur, purple loose strife, rhododendron ponticum, sagittaria, seaspurge, Senegal tea, spartine, variegated thistle, water poppy and white bryony.
196
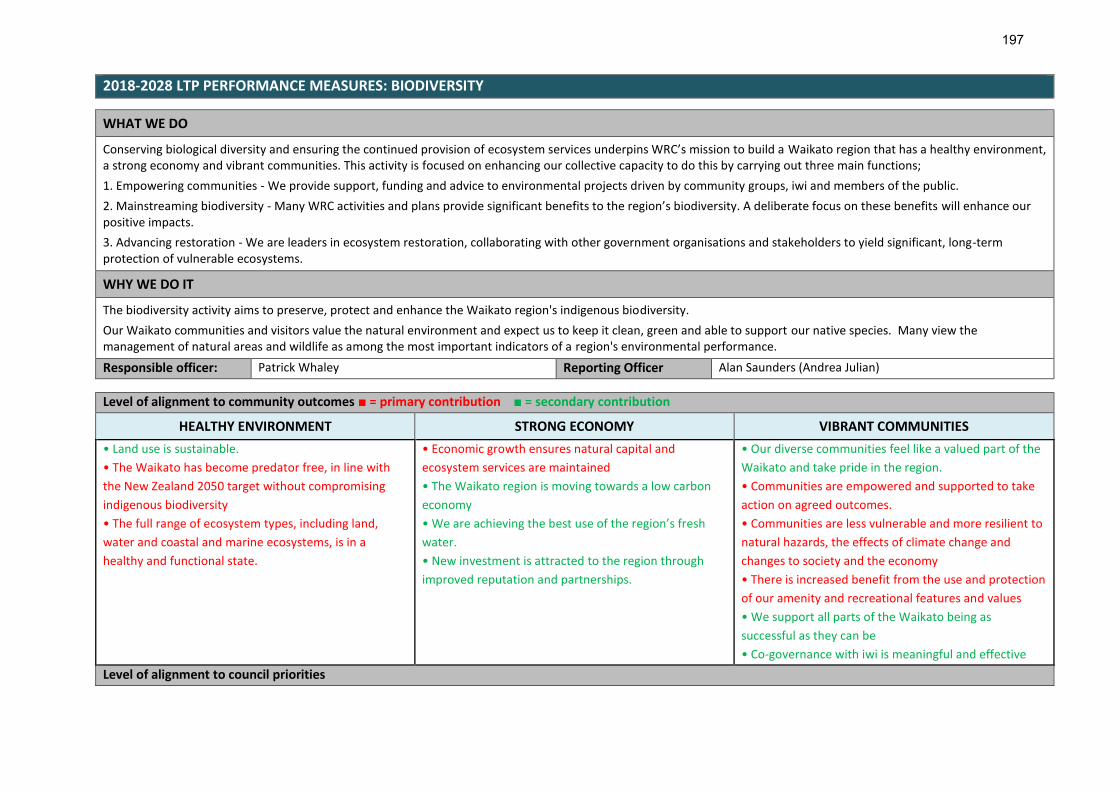
2018-2028 LTP PERFORMANCE MEASURES: BIODIVERSITY
WHAT WE DO
Conserving biological diversity and ensuring the continued provision of ecosystem services underpins WRC’s mission to build a Waikato region that has a healthy environment, a strong economy and vibrant communities. This activity is focused on enhancing our collective capacity to do this by carrying out three main functions;
1. Empowering communities - We provide support, funding and advice to environmental projects driven by community groups, iwi and members of the public.
2. Mainstreaming biodiversity - Many WRC activities and plans provide significant benefits to the region’s biodiversity. A deliberate focus on these benefits will enhance our positive impacts.
3. Advancing restoration - We are leaders in ecosystem restoration, collaborating with other government organisations and stakeholders to yield significant, long-term protection of vulnerable ecosystems.
WHY WE DO IT
The biodiversity activity aims to preserve, protect and enhance the Waikato region's indigenous biodiversity.
Our Waikato communities and visitors value the natural environment and expect us to keep it clean, green and able to support our native species. Many view the management of natural areas and wildlife as among the most important indicators of a region's environmental performance.
Responsible officer: Patrick Whaley Reporting Officer Alan Saunders (Andrea Julian)
Level of alignment to community outcomes ■ = primary contribution ■ = secondary contribution
HEALTHY ENVIRONMENT STRONG ECONOMY VIBRANT COMMUNITIES
• Land use is sustainable.
• The Waikato has become predator free, in line with
the New Zealand 2050 target without compromising
indigenous biodiversity
• The full range of ecosystem types, including land,
water and coastal and marine ecosystems, is in a
healthy and functional state.
• Economic growth ensures natural capital and
ecosystem services are maintained
• The Waikato region is moving towards a low carbon
economy
• We are achieving the best use of the region’s fresh
water.
• New investment is attracted to the region through
improved reputation and partnerships.
• Our diverse communities feel like a valued part of the
Waikato and take pride in the region.
• Communities are empowered and supported to take
action on agreed outcomes.
• Communities are less vulnerable and more resilient to
natural hazards, the effects of climate change and
changes to society and the economy
• There is increased benefit from the use and protection
of our amenity and recreational features and values
• We support all parts of the Waikato being as
successful as they can be
• Co-governance with iwi is meaningful and effective
Level of alignment to council priorities
197

PRIORITY LEVEL OF ALIGNMENT
Support communities to take action on agreed outcomes Strongly contributes
Forge and strengthen partnerships to achieve positive outcomes for the region Strongly contributes
Positively influence future land use choices to ensure long term sustainability Strongly contributes
Increase communities’ understanding of risks and resilience to change Strongly contributes
Enhance the value of the region’s coasts and marine area Strongly contributes
LEVELS OF SERVICE
What’s important
for this activity
(key attributes)
What we will deliver
to the community
(levels of service)
How we will measure
performance (performance
measure)
Baseline result
Year 1 2018/19
Year 2 2019/20
Year 3 2020/21
Years 4-10 2021/22-2028/29
Is this a new measure?
Quality - the work undertaken leads to positive biodiversity outcomes.
To work in partnership with others to maintain and enhance indigenous biodiversity
Percentage of projects funded through Natural Heritage Partnership Programme that achieve milestones as per the funding agreement
2016/17
100%
100% 100% 100% 100% No
Number of on the ground projects in action to protect and restore indigenous biodiversity per zone
New measure
≥2 per zone
≥2 per zone ≥2 per zone ≥2 per zone Yes
198
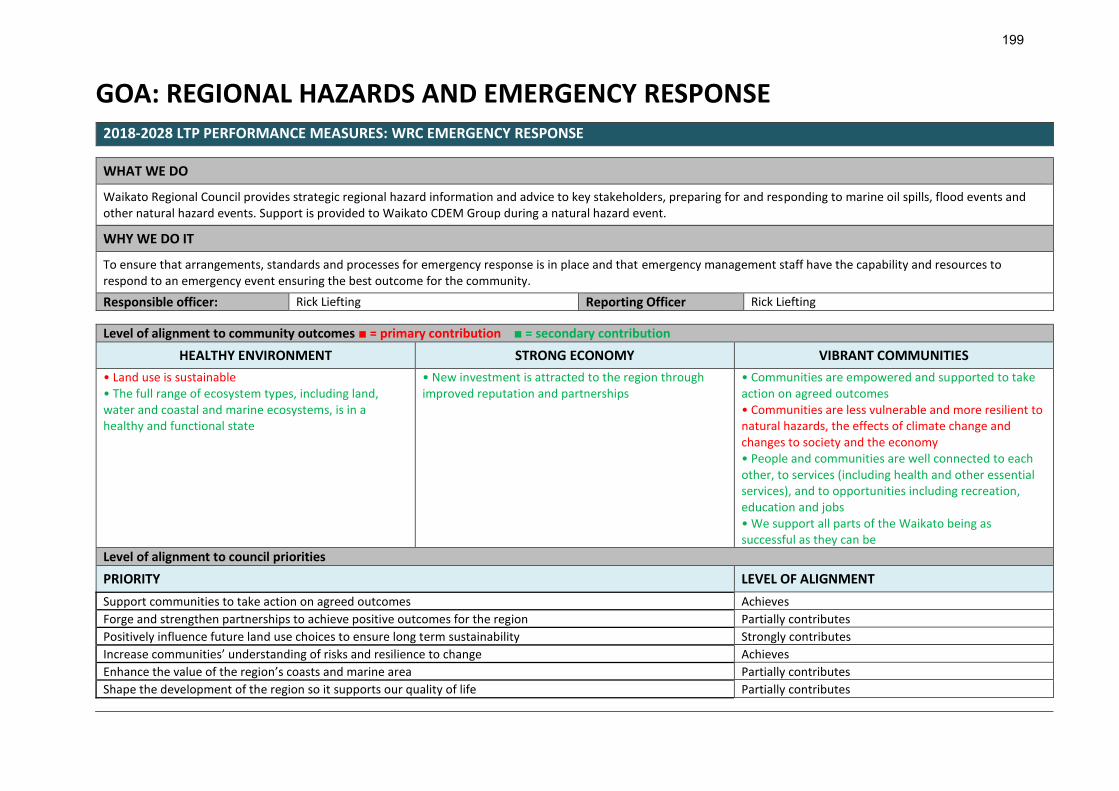
GOA: REGIONAL HAZARDS AND EMERGENCY RESPONSE 2018-2028 LTP PERFORMANCE MEASURES: WRC EMERGENCY RESPONSE
WHAT WE DO
Waikato Regional Council provides strategic regional hazard information and advice to key stakeholders, preparing for and responding to marine oil spills, flood events and other natural hazard events. Support is provided to Waikato CDEM Group during a natural hazard event.
WHY WE DO IT
To ensure that arrangements, standards and processes for emergency response is in place and that emergency management staff have the capability and resources to respond to an emergency event ensuring the best outcome for the community.
Responsible officer: Rick Liefting Reporting Officer Rick Liefting
Level of alignment to community outcomes ■ = primary contribution ■ = secondary contribution
HEALTHY ENVIRONMENT STRONG ECONOMY VIBRANT COMMUNITIES
• Land use is sustainable • The full range of ecosystem types, including land, water and coastal and marine ecosystems, is in a healthy and functional state
• New investment is attracted to the region through improved reputation and partnerships
• Communities are empowered and supported to take action on agreed outcomes • Communities are less vulnerable and more resilient to natural hazards, the effects of climate change and changes to society and the economy • People and communities are well connected to each other, to services (including health and other essential services), and to opportunities including recreation, education and jobs • We support all parts of the Waikato being as successful as they can be
Level of alignment to council priorities
PRIORITY LEVEL OF ALIGNMENT
Support communities to take action on agreed outcomes Achieves
Forge and strengthen partnerships to achieve positive outcomes for the region Partially contributes
Positively influence future land use choices to ensure long term sustainability Strongly contributes
Increase communities’ understanding of risks and resilience to change Achieves
Enhance the value of the region’s coasts and marine area Partially contributes
Shape the development of the region so it supports our quality of life Partially contributes
199

LEVELS OF SERVICE
What’s important for this activity
(key attributes)
What we will deliver to the community
(levels of service)
How we will measure performance (performance
measure)
Baseline result
Year 1 2018/19
Year 2 2019/20
Year 3 2020/21
Years 4-10 2021/22-2028/29
Is this a new measure?
Customer service - customers receive timely advise on river levels during flood events
To provide the community with timely flood event information and situation reports and to respond effectively to flood events to lessen the adverse effects
Percentage of customers satisfied with the Waikato Regional Council’s flood warning service (source: contact database survey)
2016/17
93%
90% 90% 90% 90% No
Reliability/responsiveness - support is provided to CDEM during an emergency, and we maintain the Regional Marine Oil Spill Contingency Plan to ensure we can respond during an event.
To reduce the environmental impact of marine oil spills by having a safe, coordinated and effective plan in place and maintain an effective readiness to respond
A marine oil spill plan is in place and two exercises are undertaken per year
2016/17
Plan in place and two exercises undertaken
Plan in place and two exercises undertaken
Plan in place and two exercises undertaken
Plan in place and two exercises undertaken
Plan in place and two exercises undertaken
No, however wording has changed
Notes
Marine oil spill – the wording of this measure has changed to be more explicit but we are still measuring the same as the 2015-2025 measure.
200

2018-2028 LTP PERFORMANCE MEASURES: RESILIENT DEVELOPMENT
WHAT WE DO
Resilient development involves the collection and provision of strategic information and advice to district councils, the Waikato CDEM Group and landowners on a range of hazards, on behalf of the regional community and stakeholders. The information is used to help identify areas of the region most at risk from hazard events, and to minimise risk and damage to people, homes, businesses, and infrastructure. This ensures communities can prepare for or avoid hazards; that risks are reduced over time, and that sound decisions are made about the future development of hazard prone areas.
WHY WE DO IT
The provision of natural hazard information allows communities to make better decisions on managing existing and proposed development to minimise risk and damage to people, homes, businesses, and infrastructure.
Responsible officer: Rick Liefting Reporting Officer Rick Liefting
Level of alignment to community outcomes ■ = primary contribution ■ = secondary contribution
HEALTHY ENVIRONMENT STRONG ECONOMY VIBRANT COMMUNITIES
• Land use is sustainable • The full range of ecosystem types, including land, water and coastal and marine ecosystems, is in a healthy and functional state
• Communities are empowered and supported to take action on agreed outcomes. • Communities are less vulnerable and more resilient to natural hazards, the effects of climate change and changes to society and the economy • People and communities are well connected to each other, to services (including health and other essential services), and to opportunities including recreation, education and jobs • We support all parts of the Waikato being as successful as they can be
Level of alignment to council priorities
PRIORITY LEVEL OF ALIGNMENT
Support communities to take action on agreed outcomes Achieves Positively influence future land use choices to ensure long term sustainability Achieves Increase communities’ understanding of risks and resilience to change Achieves Enhance the value of the region’s coasts and marine area Achieves
201

LEVELS OF SERVICE What’s important for this
activity (key attributes)
What we will deliver to the community (levels of service)
How we will measure performance
(performance measure)
Baseline result
Year 1 2018/19
Year 2 2019/20
Year 3 2020/21
Years 4-10 2021/22-2028/29
Is this a new measure?
Reliability/responsiveness WRC provides sound and timely advice to communities and our stakeholders.
To provide technical support to the Waikato CDEM Group to enable resilient Waikato communities
Percentage of agreed Waikato CDEM Group requests responded to within specified timeframes
New measure
100% 100% 100% 100% Yes
Accessibility - our strategic data and advice is easily accessible to communities and stakeholders.
To provide hazard information to communities and stakeholders to ensure they are well informed
Provide relevant and up-to-date hazard information to communities and stakeholders via the online hazards portal
New measure
Data updated quarterly
Data updated quarterly
Data updated quarterly
Data updated quarterly
Yes
Notes/Definitions:
Provide relevant hazard information – there is a regional hazards metadata base (saved in Discover) where this information is currently stored. The intention is to make the information available to the public via the online hazards portal. The portal will be implemented prior to 2018-19 reporting.
202
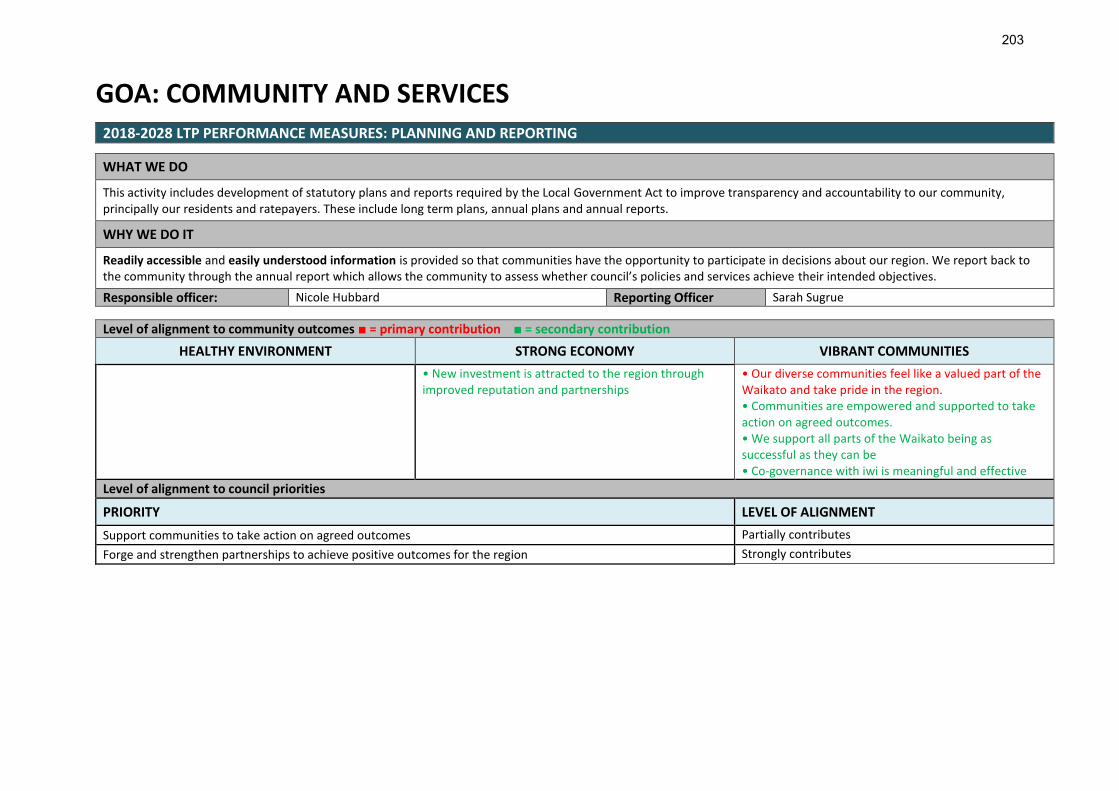
GOA: COMMUNITY AND SERVICES 2018-2028 LTP PERFORMANCE MEASURES: PLANNING AND REPORTING
WHAT WE DO
This activity includes development of statutory plans and reports required by the Local Government Act to improve transparency and accountability to our community, principally our residents and ratepayers. These include long term plans, annual plans and annual reports.
WHY WE DO IT
Readily accessible and easily understood information is provided so that communities have the opportunity to participate in decisions about our region. We report back to the community through the annual report which allows the community to assess whether council’s policies and services achieve their intended objectives.
Responsible officer: Nicole Hubbard Reporting Officer Sarah Sugrue
Level of alignment to community outcomes ■ = primary contribution ■ = secondary contribution
HEALTHY ENVIRONMENT STRONG ECONOMY VIBRANT COMMUNITIES
• New investment is attracted to the region through improved reputation and partnerships
• Our diverse communities feel like a valued part of the Waikato and take pride in the region. • Communities are empowered and supported to take action on agreed outcomes. • We support all parts of the Waikato being as successful as they can be • Co-governance with iwi is meaningful and effective
Level of alignment to council priorities
PRIORITY LEVEL OF ALIGNMENT
Support communities to take action on agreed outcomes Partially contributes
Forge and strengthen partnerships to achieve positive outcomes for the region Strongly contributes
203

LEVELS OF SERVICE What’s important for this
activity (key attributes)
What we will deliver to the community (levels of service)
How we will measure performance
(performance measure)
Baseline result
Year 1 2018/19
Year 2 2019/20
Year 3 2020/21
Years 4-10 2021/22-2028/29
Is this a new measure?
Quality - Legislative documents are fit for purpose and of a high standard (audited).
To produce high quality and fit for purpose long term plans and amendments to long term plans to encourage participation in decision making by the regional community
Long term plans and amendments to long term plans receive ‘unmodified’ audit opinions
2016/17
Unmodified opinion received
Unmodified opinion received
Unmodified opinion received
Unmodified opinion received
Unmodified opinion received
No. Was in the 2015-2025 LTP.
204

2018-2028 LTP PERFORMANCE MEASURES: COMMUNITY PARTNERSHIPS
WHAT WE DO
This activity provides support and advice within council and externally through specific programmes, to build awareness, involvement, engagement, and education. The education programmes share a focus on multi-agency relationships to bring about behavioural change to enhance sustainability and road safety education. This activity is also focused on creating clarity, transparency, and consistency across our stakeholder relationships and partnerships to achieve our key objectives so that the organisation is best placed to identify emerging opportunities and new revenue streams.
WHY WE DO IT
We work with others to support the community to achieve what’s important to them. We do this by providing information, skills, funding, and connections with other agencies to allow collaboration. We keep people safe on our roads through effective road safety education, and drive behaviour change through key community
Responsible officer: Nicola Chrisp Reporting Officer Gemma Bright /Cathy Kopeke
Level of alignment to community outcomes ■ = primary contribution ■ = secondary contribution
HEALTHY ENVIRONMENT STRONG ECONOMY VIBRANT COMMUNITIES
• The full range of ecosystem types, including land, water and coastal and marine ecosystems, is in a healthy and functional state
• Economic growth ensures natural capital and ecosystem services are maintained • New investment is attracted to the region through improved reputation and partnerships
• Our diverse communities feel like a valued part of the Waikato and take pride in the region • Communities are empowered and supported to take action on agreed outcomes • Communities are less vulnerable and more resilient to natural hazards, the effects of climate change and changes to society and the economy • People and communities are well connected to each other, to services (including health and other essential services), and to opportunities including recreation, education and jobs • Significant reduction in boating fatalities and road related fatalities and serious injuries
Level of alignment to council priorities
PRIORITY LEVEL OF ALIGNMENT
Support communities to take action on agreed outcomes Strongly contributes
Forge and strengthen partnerships to achieve positive outcomes for the region Achieves
Increase communities’ understanding of risks and resilience to change Partially contributes
205

LEVELS OF SERVICE
What’s important for this activity
(key attributes)
What we will deliver to the community
(levels of service)
How we will measure performance (performance
measure)
Baseline result
Year 1 2018/19
Year 2 2019/20
Year 3 2020/21
Years 4-10 2021/22-2028/29
Is this a new measure?
Accessibility - we provide opportunities for people to collaborate and work with us.
To collaborate with other agencies and the people of the Waikato to deliver new and current initiatives that achieve economic, environmental and social outcomes
Number of initiatives implemented as a result of working together with our key stakeholders and partners to achieve mutually beneficial outcomes.
2016/17
12 initiatives
Maintain or increase the number of initiatives
Maintain or increase the number of initiatives
Maintain or increase the number of initiatives
Maintain or increase the number of initiatives
Yes, however, this measure was previously used to measure against the community outcomes and has been reported on once.
Notes / Definitions:
Key stakeholders are defined as: Council's identified key stakeholders.
Partners are: list - TAs, NZTA, Toimata foundation, Wintec, UOW, Go Eco (WEC), YMCA, Tokoroa Community Services (this is the current list, potential to grow with new initiatives)
Initiatives: are defined as a project or programme of work that is delivered through a partnership approach with our key stakeholders or partners for mutual benefits.
Current initiatives
(1) Sub-regional waste awareness group (2) Regional waste bylaw development (3) Regional waste planning template development (4) Disaster waste management project
(5) Waste innovation challenge (6) Circular economy innovation symposium (one off) (7) Business sustainability online education. (8) Delivery of the Ruben the Road Safety Bear programme (9) Fleet day event (10) Delivery of safer journeys programme with 7 regional road safety campaign areas. (11) Stock truck effluent feasibility and disposal study. (12) South Waikato Youth Symposium (13) Delivery of the Enviroschools programme and three regional celebration events.
206

2018-2028 LTP PERFORMANCE MEASURES: IWI MAORI PARTICIPATION
WHAT WE DO
Waikato Regional Council works, at a political and operational level, with iwi, hapū, marae and individuals to ensure the traditional role of tangata whenua as kaitiaki is respected and tangata whenua and Māori communities can contribute meaningfully to council decision making. Tai-ranga-whenua, council’s Māori focus unit, aims to build council capability and confidence so it can partner with iwi Māori more effectively. It also aims to strengthen relationships with iwi Māori through collective initiatives that expand iwi capability and broaden the scope of shared work.
WHY WE DO IT
We work with our internal staff to build capacity and capability to improve accessibility and provide a better service to Iwi Maori. This enables council to make more effective and efficient decisions which lead to robust and lasting solutions that strengthen and support the well-being of Maori and the wider community.
Responsible officer: Neville Williams Reporting Officer Tutahanga Douglas/Michael Carey
Level of alignment to community outcomes ■ = primary contribution ■ = secondary contribution
HEALTHY ENVIRONMENT STRONG ECONOMY VIBRANT COMMUNITIES
• Land use is sustainable. • It is safe to swim and take kai from all freshwater • The Waikato has become predator free, in line with the New Zealand 2050 target, without compromising indigenous biodiversity. • The full range of ecosystem types, including land, water and coastal and marine ecosystems, is in a healthy and functional state
• Economic growth ensures natural capital and ecosystem services are maintained. • We are achieving the best use of the region’s fresh water. • New investment is attracted to the region through improved reputation and partnerships.
• Our diverse communities feel like a valued part of the Waikato and take pride in the region. • Communities are empowered and supported to take action on agreed outcomes. • People and communities are well connected to each other, to services (including health and other essential services), and to opportunities including recreation, education and jobs • We support all parts of the Waikato being as successful as they can be • Co-governance with iwi is meaningful and effective
Level of alignment to council priorities
PRIORITY LEVEL OF ALIGNMENT
Forge and strengthen partnerships to achieve positive outcomes for the region Strongly contributes
Positively influence future land use choices to ensure long term sustainability Partially contributes
207

LEVELS OF SERVICE
What’s important for this activity
(key attributes)
What we will deliver to the community
(levels of service)
How we will measure performance (performance
measure)
Baseline result
Year 1 2018/19
Year 2 2019/20
Year 3 2020/21
Years 4-10 2021/22-2028/29
Is this a new measure?
Accessibility - the ease with which Iwi/Maori can engage with council.
To support a treaty based partnership approach in our engagement with Iwi Maori
Completion of key actions identified in the Maori Partnership Approach
New measure
Number of actions completed as per schedule
Number of actions completed as per schedule
Number of actions completed as per schedule
Number of actions completed as per schedule
Yes – this measure encompasses the broader picture of what this activity deliver. For more information refer notes below.
Notes / Definitions: This measure is defined as the number of key actions completed on time as specified in the MPA. The actions are listed in the MPA, for easy reference they have been captured in Doc# 11302648. The MPA is a strategic document that intends to address identified issues and any upcoming trends in relation to Iwi Maori. The Maori Partnership Approach drives the work programme for TRW. A measure in relation to achieving or implementing the actions as stated in the MPA provides transparency and accountability to our communities.
208

2018-2028 LTP PERFORMANCE MEASURES: GOVERNANCE
WHAT WE DO
This activity supports the chairman and councillors in their roles, ensures council processes such as triennial elections and meetings are run correctly, and decision making processes are robust and transparent. This includes working in partnerships and collaboratively by providing for iwi, community and key stakeholder representation on the council’s standing subcommittees and councillor representation on other local government, key stakeholder and community groups.
Maintaining the integrity of the council’s processes is also supported by the provision of timely and appropriate responses to official information requests and Ombudsmen’s office enquiries.
WHY WE DO IT
The governance of the council is the responsibility of the chairman and councillors. Their role is to represent the communities that elected them as well as to consider the interests of future generations and the region at large. This activity aims to support elected members in their roles and to make robust decisions that promote community wellbeing and manage the region’s natural resources in a sustainable way. Good decision making requires high quality evidence and open and transparent processes that encourage participation. This activity also ensures the purpose and principles of local government as prescribed in the LGA are met.
Responsible officer: Mali Ahipene Reporting Officer Sarah McLeay
Level of alignment to community outcomes ■ = primary contribution ■ = secondary contribution
HEALTHY ENVIRONMENT STRONG ECONOMY VIBRANT COMMUNITIES
• Our diverse communities feel like a valued part of the Waikato and take pride in the region • We support all parts of the Waikato being as successful as they can be • Co-governance with iwi is meaningful and effective
Level of alignment to council priorities
PRIORITY LEVEL OF ALIGNMENT
Support communities to take action on agreed outcomes Partially contributes
Forge and strengthen partnerships to achieve positive outcomes for the region Partially contributes
209

LEVELS OF SERVICE
What’s important for this activity
(key attributes)
What we will deliver to the community
(levels of service)
How we will measure performance (performance
measure)
Baseline result
Year 1 2018/19
Year 2 2019/20
Year 3 2020/21
Years 4-10 2021/22-2028/29
Is this a new measure?
Accessibility - Our services are accessible for our communities in relation to accessing information that relates to council decision making.
To provide and promote governance processes that are robust and transparent for the regional community
Percentage of official information requests responded to within statutory timeframes
2016/17
100%
100% 100% 100% 100% No – they were rolled over for the following reasons:
Provides consistency
Measure in use by other councils
No issues identified with the measure in previous years.
Percentage of council agendas that are publicly available two working days or more before the meeting
2016/17
100%
100% 100% 100% 100%
Notes/Definitions: Measure 1 is defined as the percentage requests for information made and responded in accordance with the timeframes specified in the Local Government Official Information and Meetings Act 1987.
Measure 2 is defined as the percentage council agendas made available two working days prior to council/governance meetings.
*Council agenda is defined as agendas for meetings of the full council, committee and subcommittee meetings
*publicly available means, available on our website and availability of agenda for people to view on request (email requests, walk-in requests).
210

GOA: WAIKATO CDEM 2018-2028 LTP PERFORMANCE MEASURES: WAIKATO CIVIL DEFENCE EMERGENCY MANAGEMENT GROUP (CDEM)
WHAT WE DO
The Waikato CDEM Group is responsible for delivering on the 4 Rs (readiness, response, reduction and recovery) as outlined in the CDEM Group Plan. The entity responsible for coordinating this activity is the Group Emergency Management Office (GEMO), which is administered by the WRC but takes its direction from the CDEM Joint Committee (an elected body representing all councils). Through strategic (regional level) planning and the provision of technical advice or services to all members, the GEMO supports operational level planning to ensure that local CDEM organisations and the community have the capacity and a capability to respond to and recover from an emergency. This activity includes facilitation of community, organisational and business readiness; the provision of an appropriate emergency response and coordination capability; identification and promotion of reduction activities that ultimately reduce the impacts on our communities from an emergency; and the coordination of recovery efforts to ensure the best outcome for the community. In addition, the GEMO has an operational role of coordinating regional or more complex emergencies. This is achieved through the provision of a Group Emergency Coordination Centre (GECC) and professional leadership in the form of Group Controllers and supporting specialist staff.
WHY WE DO IT
The purpose of CDEM under the act is to ‘improve and promote the sustainable management of hazards in a way that contributes to the social, economic, cultural and environmental wellbeing and safety of the public as well as for the protection of property’. The Waikato CDEM Group deliver on this purpose through the following actions: Readiness, Response, Recovery and reduction.
Responsible officer: Lee Hazlewood Reporting Officer TBC
Level of alignment to community outcomes ■ = primary contribution ■ = secondary contribution
HEALTHY ENVIRONMENT STRONG ECONOMY VIBRANT COMMUNITIES
• Land use is sustainable • New investment is attracted to the region through improved reputation and partnerships
• Our diverse communities feel like a valued part of the Waikato and take pride in the region • Communities are empowered and supported to take action on agreed outcomes. • Communities are less vulnerable and more resilient to natural hazards, the effects of climate change and changes to society and the economy
Level of alignment to council priorities
PRIORITY LEVEL OF ALIGNMENT
Support communities to take action on agreed outcomes Strongly contributes
Positively influence future land use choices to ensure long term sustainability Partially contributes
Increase communities’ understanding of risks and resilience to change Strongly contributes
211
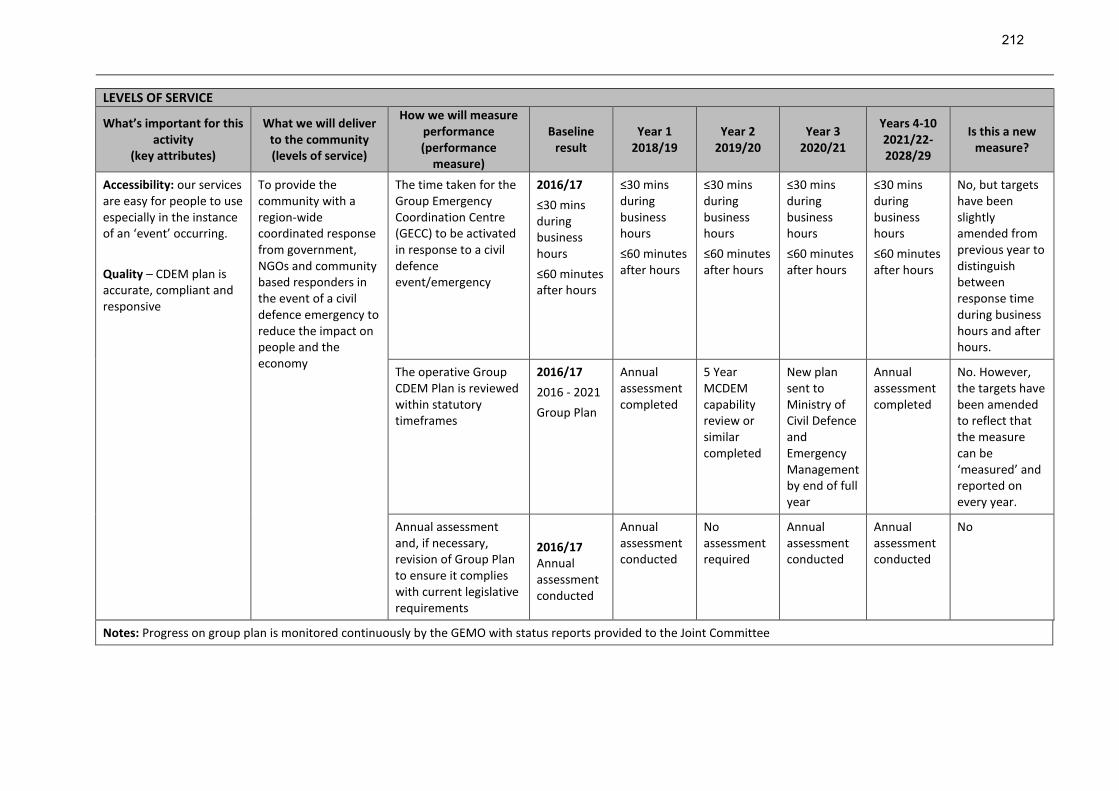
LEVELS OF SERVICE
What’s important for this activity
(key attributes)
What we will deliver to the community (levels of service)
How we will measure performance (performance
measure)
Baseline result
Year 1 2018/19
Year 2 2019/20
Year 3 2020/21
Years 4-10 2021/22-2028/29
Is this a new measure?
Accessibility: our services are easy for people to use especially in the instance of an ‘event’ occurring.
Quality – CDEM plan is accurate, compliant and responsive
To provide the community with a region-wide coordinated response from government, NGOs and community based responders in the event of a civil defence emergency to reduce the impact on people and the economy
The time taken for the Group Emergency Coordination Centre (GECC) to be activated in response to a civil defence event/emergency
2016/17
≤30 mins during business hours
≤60 minutes after hours
≤30 mins during business hours
≤60 minutes after hours
≤30 mins during business hours
≤60 minutes after hours
≤30 mins during business hours
≤60 minutes after hours
≤30 mins during business hours
≤60 minutes after hours
No, but targets have been slightly amended from previous year to distinguish between response time during business hours and after hours.
The operative Group CDEM Plan is reviewed within statutory timeframes
2016/17
2016 - 2021
Group Plan
Annual assessment completed
5 Year MCDEM capability review or similar completed
New plan sent to Ministry of Civil Defence and Emergency Management by end of full year
Annual assessment completed
No. However, the targets have been amended to reflect that the measure can be ‘measured’ and reported on every year.
Annual assessment and, if necessary, revision of Group Plan to ensure it complies with current legislative requirements
2016/17 Annual assessment conducted
Annual assessment conducted
No assessment required
Annual assessment conducted
Annual assessment conducted
No
Notes: Progress on group plan is monitored continuously by the GEMO with status reports provided to the Joint Committee
212

GOA: SCIENCE AND STRATEGY 2018-2028 LTP PERFORMANCE MEASURES: ENVIRONMENTAL MONITORING
WHAT WE DO
This activity focuses on the collection, storage, management and analysis of quality-assured data on the current state of air, water, land, coastal resources, and ecosystems. Data is collected to support the operation of flood warning systems, use and allocation of surface and ground freshwater resources, setting water quality limits, identifying changes in water quantity and quality, soil, fresh water ecology, coastal ecology and air quality. Data is used to support the setting of policies and rules, and inform resource consent decisions.
WHY WE DO IT
Environmental Monitoring enables the public to understand how the environment is changing through time. It ensures high quality and consistent data is collected, often reducing the need for the public to undertake their own monitoring. The public has increased protection from natural disasters (including floods and drought) and health risks in a timely manner, associated with, for example, poor air quality, water quality and contaminated land.
Responsible officer: Ed Brown Reporting officer: Ed Brown
Level of alignment to community outcomes ■ = primary contribution ■ = secondary contribution
HEALTHY ENVIRONMENT STRONG ECONOMY VIBRANT COMMUNITIES
• Land use is sustainable
• It is safe to swim and take kai from all freshwater
• The full range of ecosystem types, including land,
water and coastal and marine ecosystems, is in a
healthy and functional state
• All soil quality indicators are trending positive.
• Economic growth ensures natural capital and
ecosystem services are maintained
• We are achieving the best use of the region’s fresh
water.
• Our diverse communities feel like a valued part of the
Waikato and take pride in the region.
• Communities are empowered and supported to take
action on agreed outcomes.
• Communities are less vulnerable and more resilient to
natural hazards, the effects of climate change and
changes to society and the economy
• There is increased benefit from the use and protection
of our amenity and recreational features and values
• Co-governance with iwi is meaningful and effective
Level of alignment to council priorities
PRIORITY LEVEL OF ALIGNMENT
Support communities to take action on agreed outcomes Partially contributes
Forge and strengthen partnerships to achieve positive outcomes for the region Partially contributes
213

Positively influence future land use choices to ensure long term sustainability Partially contributes
Manage freshwater more effectively to maximise regional benefit Strongly contributes
Increase communities’ understanding of risks and resilience to change Partially contributes
Enhance the value of the region’s coasts and marine area Partially contributes
LEVELS OF SERVICE
What’s important for
this activity
(key attributes)
What we will deliver
to the community
(levels of service)
How we will measure
performance
(performance
measure)
Baseline result
Year 1 2018/19
Year 2 2019/20
Year 3 2020/21
Years 4-10 2021/22-2028/29
Is this a new measure?
Quality - measure and manage accurate data
To provide high quality and timely data to key decision makers and the public
External audit of one environmental domain each year shows good quality control of data collection and analysis
1 domain audited
1 domain audited
1 domain audited
1 domain audited
1 domain audited
No but the wording of this measure has been updated slightly.
Notes / Definitions: External means independent of the Environmental Monitoring Section. May be undertaken by other sections within WRC.
Environmental domains include hydrology (surface water or groundwater), water quality (freshwater or coastal), air quality, geothermal and ecology.
An individual domain should not be reaudited until all have been done.
What’s important for
this activity
(key attributes)
What we will deliver
to the community
(levels of service)
How we will measure
performance
(performance
measure)
Baseline result
Year 1 2018/19
Year 2 2019/20
Year 3 2020/21
Years 4-10 2021/22-2028/29
Is this a new measure?
Reliability / responsiveness - data is available in a timely manner for users including immediate flood response.
To provide high quality and timely data to key decision makers and the public
During a flood events the maximum contiguous period without data is 70 minutes for flood alarmed hydrology sites
New measure
<70 minutes without data
<70 minutes without data
<70 minutes without data
<70 minutes without data
Yes as there was previously no measures for reliability or responsiveness.
Notes/Definitions: Alarmed sites are determined from those with triggers and alerts set in Hydrotel system for flood purposes.
Hydrology sites are those that measure river flow, river or lake level or rainfall.
Flood event is determined when river flows exceed the early warning level set in Hydrotel for each site.
214
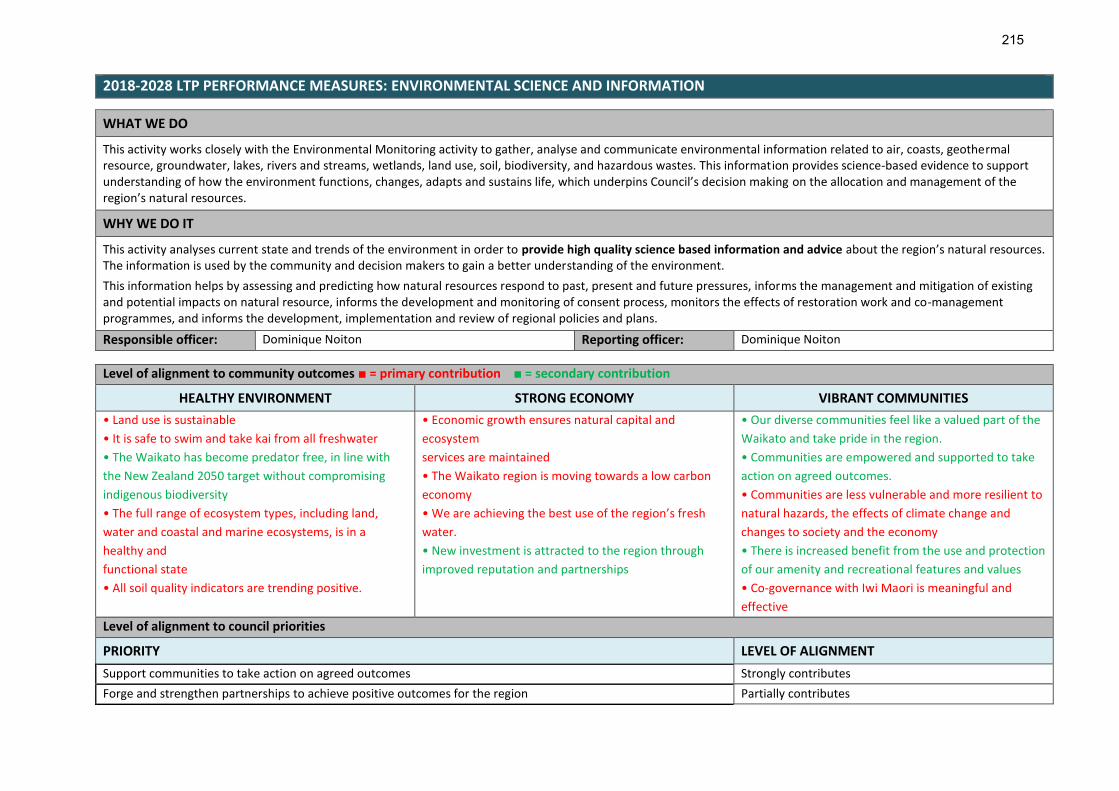
2018-2028 LTP PERFORMANCE MEASURES: ENVIRONMENTAL SCIENCE AND INFORMATION
WHAT WE DO
This activity works closely with the Environmental Monitoring activity to gather, analyse and communicate environmental information related to air, coasts, geothermal resource, groundwater, lakes, rivers and streams, wetlands, land use, soil, biodiversity, and hazardous wastes. This information provides science-based evidence to support understanding of how the environment functions, changes, adapts and sustains life, which underpins Council’s decision making on the allocation and management of the region’s natural resources.
WHY WE DO IT
This activity analyses current state and trends of the environment in order to provide high quality science based information and advice about the region’s natural resources. The information is used by the community and decision makers to gain a better understanding of the environment.
This information helps by assessing and predicting how natural resources respond to past, present and future pressures, informs the management and mitigation of existing and potential impacts on natural resource, informs the development and monitoring of consent process, monitors the effects of restoration work and co-management programmes, and informs the development, implementation and review of regional policies and plans.
Responsible officer: Dominique Noiton Reporting officer: Dominique Noiton
Level of alignment to community outcomes ■ = primary contribution ■ = secondary contribution
HEALTHY ENVIRONMENT STRONG ECONOMY VIBRANT COMMUNITIES
• Land use is sustainable
• It is safe to swim and take kai from all freshwater
• The Waikato has become predator free, in line with
the New Zealand 2050 target without compromising
indigenous biodiversity
• The full range of ecosystem types, including land,
water and coastal and marine ecosystems, is in a
healthy and
functional state
• All soil quality indicators are trending positive.
• Economic growth ensures natural capital and
ecosystem
services are maintained
• The Waikato region is moving towards a low carbon
economy
• We are achieving the best use of the region’s fresh
water.
• New investment is attracted to the region through
improved reputation and partnerships
• Our diverse communities feel like a valued part of the
Waikato and take pride in the region.
• Communities are empowered and supported to take
action on agreed outcomes.
• Communities are less vulnerable and more resilient to
natural hazards, the effects of climate change and
changes to society and the economy
• There is increased benefit from the use and protection
of our amenity and recreational features and values
• Co-governance with Iwi Maori is meaningful and
effective
Level of alignment to council priorities
PRIORITY LEVEL OF ALIGNMENT
Support communities to take action on agreed outcomes Strongly contributes
Forge and strengthen partnerships to achieve positive outcomes for the region Partially contributes
215

Positively influence future land use choices to ensure long term sustainability Strongly contributes
Manage freshwater more effectively to maximise regional benefit Strongly contributes
Increase communities’ understanding of risks and resilience to change Partially contributes
Enhance the value of the region’s coasts and marine area Strongly contributes
Shape the development of the region so it supports our quality of life Partially contributes
LEVELS OF SERVICE
What’s important
for this activity
(key attributes)
What we will deliver
to the community
(levels of service)
How we will measure
performance
(performance measure)
Baseline result
Year 1 2018/19
Year 2 2019/20
Year 3 2020/21
Years 4-10 2021/22-2028/29
Is this a new measure?
Accessibility - access to information / analysis.
To provide high quality, independent and timely information on the allocation and management of natural resources to key decision makers and the community.
Percentage of indicators on the changes and trends in natural resource availability are analyses and reported on as per the indicator monitoring schedule.
2016/17
100%
100% 100% 100% 100% No
Quality - there is a scientific methodology that underpins the information and analysis provided.
216

2018-2028 LTP PERFORMANCE MEASURES: SOCIAL AND ECONOMIC INFORMATION
WHAT WE DO
The activity supports evidence based planning and decision making by gathering, analysing and reporting on social and economic data and information and linking this to environmental knowledge. The activity provides socio-economic data and information, evaluation and survey design and analysis, undertakes community research, provides guidance on stakeholder processes, analyses and reports on population and economic statistics and develops economic models and scenarios. These functions enable council to have a better understanding of the social and economic qualities, opinions and aspirations of our communities, which contributes to informed debate and decision-making about policy and allocation of natural resources. The information is used to assist council meet its legislated responsibilities, monitor the state and trends of the environment, develop, implement and review council policies, and track progress towards the council's strategic direction. The section also undertakes research and advises on best practice for engagement and consultation processes with communities, and monitors people’s understanding, awareness and attitudes in regards to the work that the Council does.
WHY WE DO IT
The collection and management of quality information on the community and economy in relation to sustainable management of natural resources enables the council to effectively respond to emerging issues and new challenges. This activity ensures that a rounded approach to resource management is undertaken, it complements natural and physical science so that decisions are made in a manner that takes account of the inter-relationships that exist between environment, economy and society/communities. This is critical to sustaining growth and maintaining, or improving, the environmental and ecological health and the use of resources for future generations. The section economists inform debate on the regional economy, what drives it, and the connections necessary to support the critical links between a healthy environment and strong economy.
Responsible officer: Ruth Buckingham Reporting officer: Ruth Buckingham
Level of alignment to community outcomes ■ = primary contribution ■ = secondary contribution
HEALTHY ENVIRONMENT STRONG ECONOMY VIBRANT COMMUNITIES
• Land use is sustainable
• It is safe to swim and take kai from all freshwater
• The full range of ecosystem types, including land,
water and coastal and marine ecosystems, is in a
healthy and functional state
• All soil quality indicators are trending positive.
• By 2034 household median incomes are above the
New Zealand average
• By 2034 value added per capita will grow by 2.8% per
annum so that the Waikato region is in the upper third
of regions in New Zealand for economic performance
• Economic growth ensures natural capital and
ecosystem services are maintained
• We are achieving the best use of the region’s fresh
water.
• New investment is attracted to the region through
improved reputation and partnerships
• Our diverse communities feel like a valued part of the
Waikato and take pride in the region.
• Communities are empowered and supported to take
action on agreed outcomes.
• Communities are less vulnerable and more resilient to
natural hazards, the effects of climate change and
changes to society and the economy
• People and communities are well connected to each
other, to services (including health and other essential
services), and to opportunities including recreation,
education and jobs
• There is increased benefit from the use and protection
217
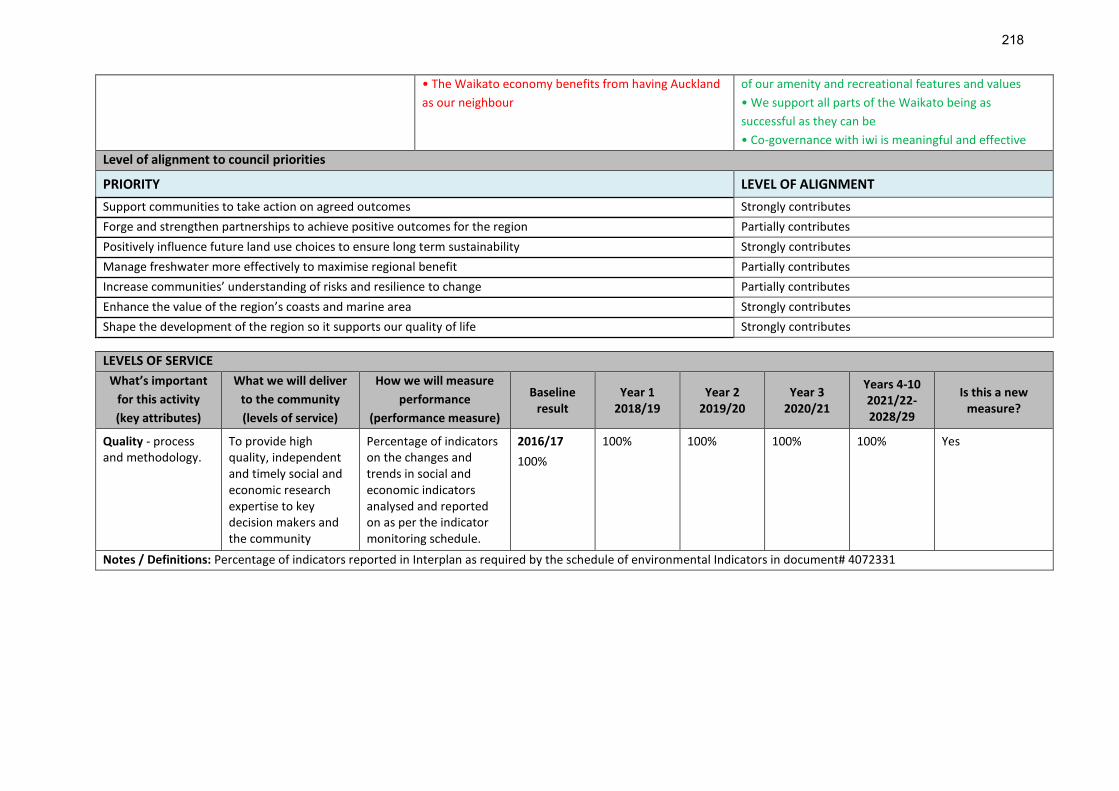
• The Waikato economy benefits from having Auckland
as our neighbour
of our amenity and recreational features and values
• We support all parts of the Waikato being as
successful as they can be
• Co-governance with iwi is meaningful and effective
Level of alignment to council priorities
PRIORITY LEVEL OF ALIGNMENT
Support communities to take action on agreed outcomes Strongly contributes
Forge and strengthen partnerships to achieve positive outcomes for the region Partially contributes
Positively influence future land use choices to ensure long term sustainability Strongly contributes
Manage freshwater more effectively to maximise regional benefit Partially contributes
Increase communities’ understanding of risks and resilience to change Partially contributes
Enhance the value of the region’s coasts and marine area Strongly contributes
Shape the development of the region so it supports our quality of life Strongly contributes
LEVELS OF SERVICE
What’s important
for this activity
(key attributes)
What we will deliver
to the community
(levels of service)
How we will measure
performance
(performance measure)
Baseline result
Year 1 2018/19
Year 2 2019/20
Year 3 2020/21
Years 4-10 2021/22-2028/29
Is this a new measure?
Quality - process and methodology.
To provide high quality, independent and timely social and economic research expertise to key decision makers and the community
Percentage of indicators on the changes and trends in social and economic indicators analysed and reported on as per the indicator monitoring schedule.
2016/17
100%
100% 100% 100% 100% Yes
Notes / Definitions: Percentage of indicators reported in Interplan as required by the schedule of environmental Indicators in document# 4072331
218
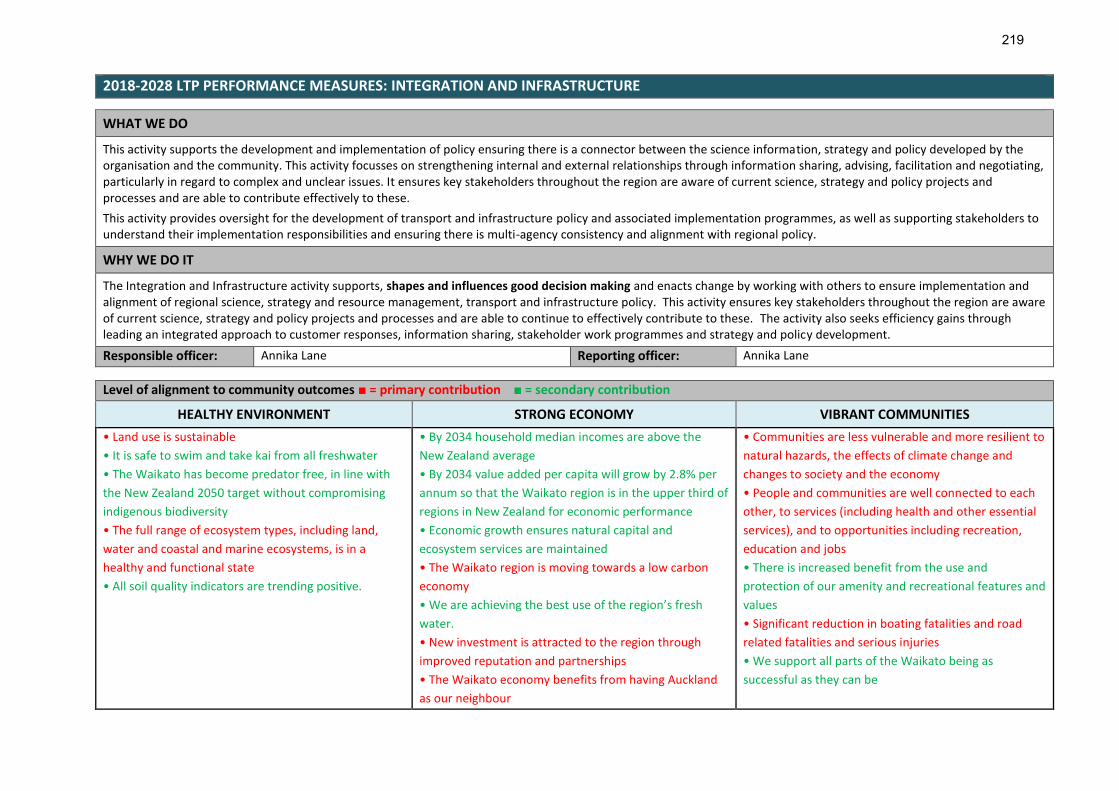
2018-2028 LTP PERFORMANCE MEASURES: INTEGRATION AND INFRASTRUCTURE
WHAT WE DO
This activity supports the development and implementation of policy ensuring there is a connector between the science information, strategy and policy developed by the organisation and the community. This activity focusses on strengthening internal and external relationships through information sharing, advising, facilitation and negotiating, particularly in regard to complex and unclear issues. It ensures key stakeholders throughout the region are aware of current science, strategy and policy projects and processes and are able to contribute effectively to these.
This activity provides oversight for the development of transport and infrastructure policy and associated implementation programmes, as well as supporting stakeholders to understand their implementation responsibilities and ensuring there is multi-agency consistency and alignment with regional policy.
WHY WE DO IT
The Integration and Infrastructure activity supports, shapes and influences good decision making and enacts change by working with others to ensure implementation and alignment of regional science, strategy and resource management, transport and infrastructure policy. This activity ensures key stakeholders throughout the region are aware of current science, strategy and policy projects and processes and are able to continue to effectively contribute to these. The activity also seeks efficiency gains through leading an integrated approach to customer responses, information sharing, stakeholder work programmes and strategy and policy development.
Responsible officer: Annika Lane Reporting officer: Annika Lane
Level of alignment to community outcomes ■ = primary contribution ■ = secondary contribution
HEALTHY ENVIRONMENT STRONG ECONOMY VIBRANT COMMUNITIES
• Land use is sustainable
• It is safe to swim and take kai from all freshwater
• The Waikato has become predator free, in line with
the New Zealand 2050 target without compromising
indigenous biodiversity
• The full range of ecosystem types, including land,
water and coastal and marine ecosystems, is in a
healthy and functional state
• All soil quality indicators are trending positive.
• By 2034 household median incomes are above the
New Zealand average
• By 2034 value added per capita will grow by 2.8% per
annum so that the Waikato region is in the upper third of
regions in New Zealand for economic performance
• Economic growth ensures natural capital and
ecosystem services are maintained
• The Waikato region is moving towards a low carbon
economy
• We are achieving the best use of the region’s fresh
water.
• New investment is attracted to the region through
improved reputation and partnerships
• The Waikato economy benefits from having Auckland
as our neighbour
• Communities are less vulnerable and more resilient to
natural hazards, the effects of climate change and
changes to society and the economy
• People and communities are well connected to each
other, to services (including health and other essential
services), and to opportunities including recreation,
education and jobs
• There is increased benefit from the use and
protection of our amenity and recreational features and
values
• Significant reduction in boating fatalities and road
related fatalities and serious injuries
• We support all parts of the Waikato being as
successful as they can be
219
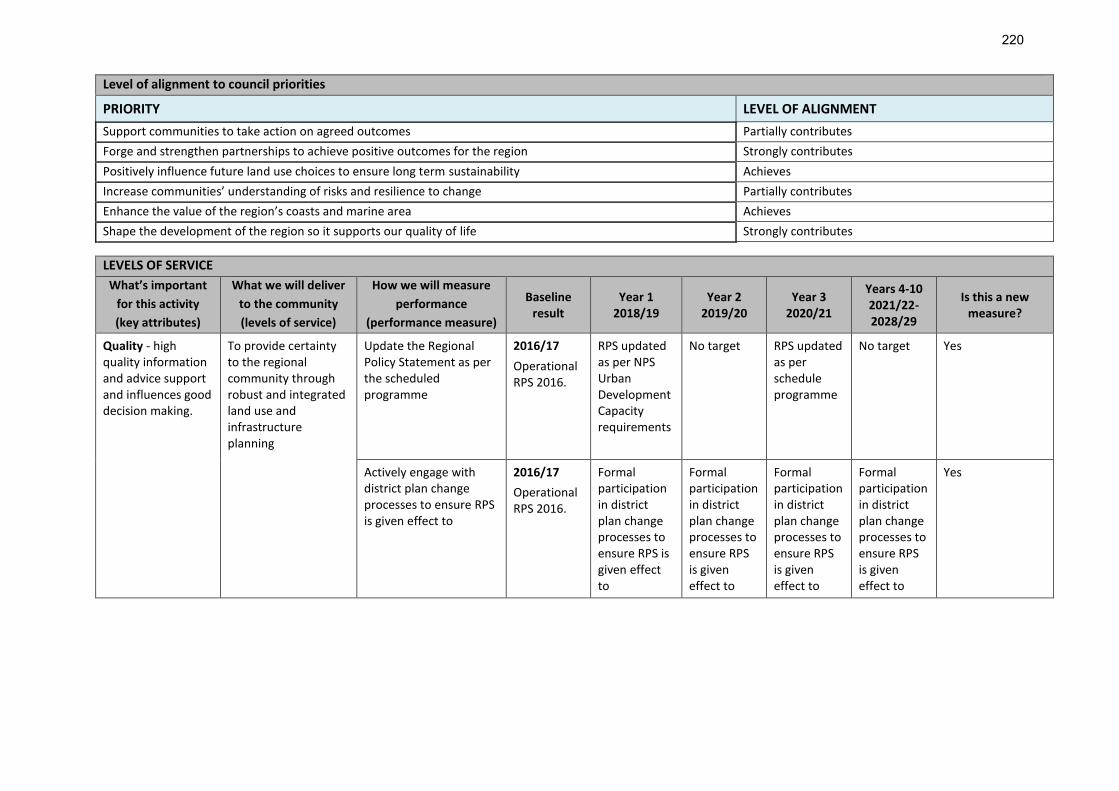
Level of alignment to council priorities
PRIORITY LEVEL OF ALIGNMENT
Support communities to take action on agreed outcomes Partially contributes
Forge and strengthen partnerships to achieve positive outcomes for the region Strongly contributes
Positively influence future land use choices to ensure long term sustainability Achieves
Increase communities’ understanding of risks and resilience to change Partially contributes
Enhance the value of the region’s coasts and marine area Achieves
Shape the development of the region so it supports our quality of life Strongly contributes
LEVELS OF SERVICE
What’s important
for this activity
(key attributes)
What we will deliver
to the community
(levels of service)
How we will measure
performance
(performance measure)
Baseline result
Year 1 2018/19
Year 2 2019/20
Year 3 2020/21
Years 4-10 2021/22-2028/29
Is this a new measure?
Quality - high quality information and advice support and influences good decision making.
To provide certainty to the regional community through robust and integrated land use and infrastructure planning
Update the Regional Policy Statement as per the scheduled programme
2016/17
Operational RPS 2016.
RPS updated as per NPS Urban Development Capacity requirements
No target RPS updated as per schedule programme
No target Yes
Actively engage with district plan change processes to ensure RPS is given effect to
2016/17
Operational RPS 2016.
Formal participation in district plan change processes to ensure RPS is given effect to
Formal participation in district plan change processes to ensure RPS is given effect to
Formal participation in district plan change processes to ensure RPS is given effect to
Formal participation in district plan change processes to ensure RPS is given effect to
Yes
220

2018-2028 LTP PERFORMANCE MEASURES: RESOURCE MANAGEMENT POLICY
WHAT WE DO
Council has a statutory responsibility to develop and review resource management plans and a regional policy statement under the Resource Management Act 1991.
Council’s primary resource management documents include the regional policy statement, and region plans covering the coast (the Waikato Regional Coastal Plan), and land, water, and air (the Waikato Regional Plan), which ensure natural resources are sustainably managed while enabling economic development, growth and communities to thrive.
The regional resource management plans inform the development of RMA District Plans held by territorial authorities.
This activity also provides future focused, effective resource management policy and planning information, advice, analysis and solutions under other relevant legislation.
WHY WE DO IT
In consultation with the community resource management policies and plans are developed that deliver quality policy direction to ensure a sustainable environment and a viable regional economy.
Credible and evidence-based policy analysis and advice is central to the successful management of scarce, limited or competing resources, and enables our regional communities to make informed decisions about the use of our region’s natural resources and respond to emerging challenges such as climate change, regional growth and changing demographics.
Waikato region resource management plans are enabling and permit a wide range of activities that would otherwise require resource consent. In this way, regional plans not only set policy direction but include regulation that provides for certainty of investment while safeguarding natural resources.
Responsible officer: Tony Quickfall Reporting officer: Tony Quickfall
Level of alignment to community outcomes ■ = primary contribution ■ = secondary contribution
HEALTHY ENVIRONMENT STRONG ECONOMY VIBRANT COMMUNITIES
• Land use is sustainable
• It is safe to swim and take kai from all freshwater
• The full range of ecosystem types, including land,
water and coastal and marine ecosystems, is in a
healthy and functional state
• All soil quality indicators are trending positive.
• By 2034 household median incomes are above the
New Zealand average
• By 2034 value added per capita will grow by 2.8% per
annum so that the Waikato region is in the upper third
of regions in New Zealand for economic performance
• Economic growth ensures natural capital and
ecosystem services are maintained
• The Waikato region is moving towards a low carbon
economy
• We are achieving the best use of the region’s fresh
water.
• Communities are less vulnerable and more resilient to
natural hazards, the effects of climate change and
changes to society and the economy
• People and communities are well connected to each
other, to services (including health and other essential
services), and to opportunities including recreation,
education and jobs
• There is increased benefit from the use and protection
of our amenity and recreational features and values
• We support all parts of the Waikato being as
221

• New investment is attracted to the region through
improved reputation and partnerships
• The Waikato economy benefits from having Auckland
as our neighbour.
successful as they can be
• Co-governance with iwi is meaningful and effective.
Level of alignment to council priorities
PRIORITY LEVEL OF ALIGNMENT
Support communities to take action on agreed outcomes Strongly contributes
Forge and strengthen partnerships to achieve positive outcomes for the region Achieves
Positively influence future land use choices to ensure long term sustainability Achieves
Manage freshwater more effectively to maximise regional benefit Achieves
Increase communities’ understanding of risks and resilience to change Strongly contributes
Enhance the value of the region’s coasts and marine area Achieves
Shape the development of the region so it supports our quality of life Strongly contributes
LEVELS OF SERVICE
What’s important
for this activity
(key attributes)
What we will deliver
to the community
(levels of service)
How we will measure
performance
(performance
measure)
Baseline result
Year 1 2018/19
Year 2 2019/20
Year 3 2020/21
Years 4-10 2021/22-2028/29
Is this a new measure?
Reliability / timeliness - The process is robust, transparent and undertaken within legislative timeframes.
To provide certainty to the regional community through a robust, integrated and consistent environmental planning framework.
Compliance with Resource Management Act and treaty settlement legislative planning requirements
2016/17
All legislative requirements are met
All legislative requirements are met
All legislative requirements are met
All legislative requirements are met
All legislative requirements are met
Yes but with the additional of treaty settlement legislation.
Notes / Definitions: This will be monitored through WRC's "Complywith" monitoring. This will need updating at the next reporting round to include relevant treaty
settlement legislation and RMA recent amendments.
222

What’s important
for this activity
(key attributes)
What we will deliver
to the community
(levels of service)
How we will measure
performance
(performance
measure)
Baseline result
Year 1 2018/19
Year 2 2019/20
Year 3 2020/21
Years 4-10 2021/22-2028/29
Is this a new measure?
Accessibility - the community has sufficient opportunity to participate in planning processes.
To provide opportunities to be involved in planning processes
Percentage of Resource Management Act (RMA) planning documents made available for consultation that meet RMA legislative requirements
2016/17
100%
100% 100% 100% 100% Yes – we didn’t previously have a measure on accessibility.
What’s important
for this activity
(key attributes)
What we will deliver
to the community
(levels of service)
How we will measure
performance
(performance
measure)
Baseline result
Year 1 2018/19
Year 2 2019/20
Year 3 2020/21
Years 4-10 2021/22-2028/29
Is this a new measure?
Sustainability - ensuring that natural and physical resources are managed sustainably.
To provide a Regional Policy Statement and a Regional Plan(s) that ensure natural and physical resources are managed sustainably
State of the Environment reporting is undertaken annually
New measure
Reported annually
Reported annually
Reported annually
Reported annually
Reported annually
Yes – we didn’t previously have a measure on sustainability
Notes / Definitions: SOE monitoring provides measurable and scientifically valid data. This will inform the policy effectiveness review which will also assess subjective data and other drivers that might be affecting plan effectiveness (e.g. economic and geo-political drivers).
223
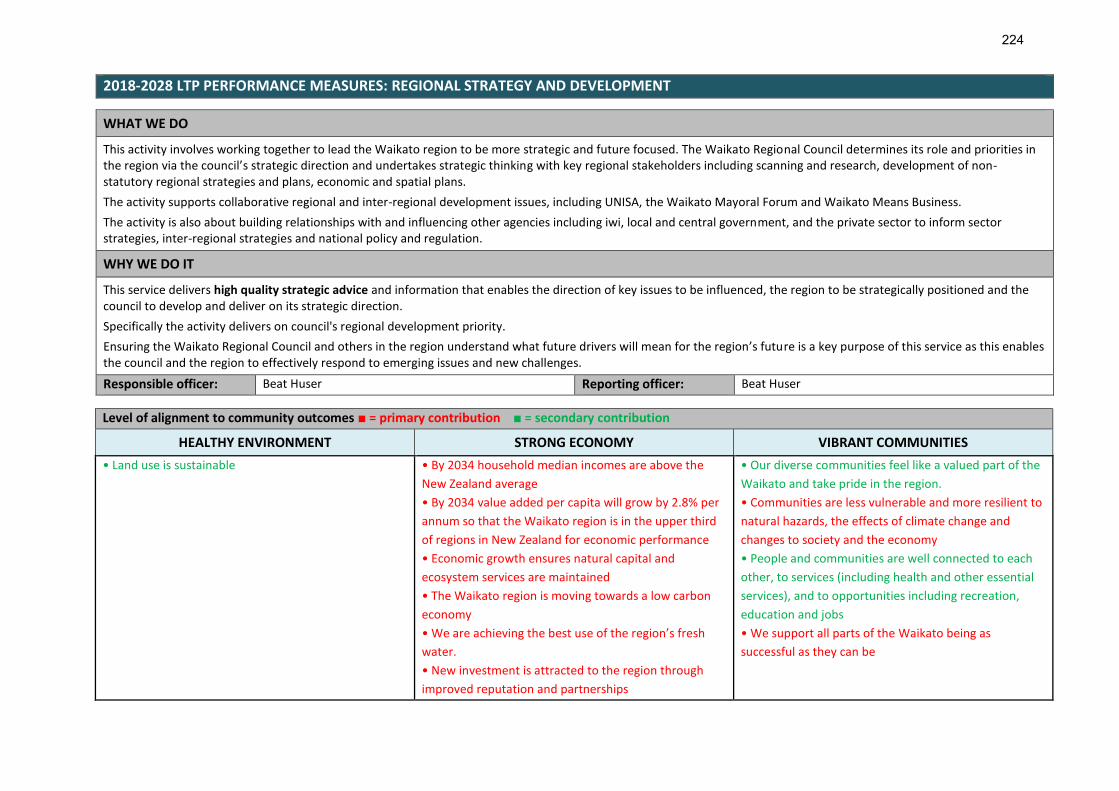
2018-2028 LTP PERFORMANCE MEASURES: REGIONAL STRATEGY AND DEVELOPMENT
WHAT WE DO
This activity involves working together to lead the Waikato region to be more strategic and future focused. The Waikato Regional Council determines its role and priorities in the region via the council’s strategic direction and undertakes strategic thinking with key regional stakeholders including scanning and research, development of non-statutory regional strategies and plans, economic and spatial plans.
The activity supports collaborative regional and inter-regional development issues, including UNISA, the Waikato Mayoral Forum and Waikato Means Business.
The activity is also about building relationships with and influencing other agencies including iwi, local and central government, and the private sector to inform sector strategies, inter-regional strategies and national policy and regulation.
WHY WE DO IT
This service delivers high quality strategic advice and information that enables the direction of key issues to be influenced, the region to be strategically positioned and the council to develop and deliver on its strategic direction.
Specifically the activity delivers on council's regional development priority.
Ensuring the Waikato Regional Council and others in the region understand what future drivers will mean for the region’s future is a key purpose of this service as this enables the council and the region to effectively respond to emerging issues and new challenges.
Responsible officer: Beat Huser Reporting officer: Beat Huser
Level of alignment to community outcomes ■ = primary contribution ■ = secondary contribution
HEALTHY ENVIRONMENT STRONG ECONOMY VIBRANT COMMUNITIES
• Land use is sustainable • By 2034 household median incomes are above the
New Zealand average
• By 2034 value added per capita will grow by 2.8% per
annum so that the Waikato region is in the upper third
of regions in New Zealand for economic performance
• Economic growth ensures natural capital and
ecosystem services are maintained
• The Waikato region is moving towards a low carbon
economy
• We are achieving the best use of the region’s fresh
water.
• New investment is attracted to the region through
improved reputation and partnerships
• Our diverse communities feel like a valued part of the
Waikato and take pride in the region.
• Communities are less vulnerable and more resilient to
natural hazards, the effects of climate change and
changes to society and the economy
• People and communities are well connected to each
other, to services (including health and other essential
services), and to opportunities including recreation,
education and jobs
• We support all parts of the Waikato being as
successful as they can be
224

• The Waikato economy benefits from having Auckland
as our neighbour
Level of alignment to council priorities
PRIORITY LEVEL OF ALIGNMENT
Forge and strengthen partnerships to achieve positive outcomes for the region Partially contributes
Manage freshwater more effectively to maximise regional benefit Strongly contributes
Increase communities’ understanding of risks and resilience to change Partially contributes
Shape the development of the region so it supports our quality of life Achieves
LEVELS OF SERVICE
What’s important
for this activity
(key attributes)
What we will deliver
to the community
(levels of service)
How we will measure
performance
(performance measure)
Baseline result
Year 1 2018/19
Year 2 2019/20
Year 3 2020/21
Years 4-10 2021/22-2028/29
Is this a new measure?
Quality – ensuring
the work we
undertake is
delivering on our
strategic direction
priorities
To ensure that council
is making progress
towards its strategic
direction priorities
Report annually on progress made against council’s strategic direction
Progress reported in the WRC annual report
Progress reported in the WRC annual report
Progress reported in the WRC annual report
Progress reported in the WRC annual report
Progress reported in the WRC annual report
Yes
225

GOA: RESOURCE USE 2018-2028 LTP PERFORMANCE MEASURES: CONSENT PROCESSING AND COMPLIANCE MONITORING
WHAT WE DO
Waikato Regional Council is responsible for issuing resource consents under the Resource Management Act which allow people to use the region’s natural resources (including air, land, water, geothermal and coasts) sustainably. Consents often contain conditions which make sure the environment is protected, and these are monitored by council on a prioritisation basis.
Council also proactively monitors compliance with a small subset of the 73 permitted activities in the Regional Plan, in particular rules relating to farm animal effluent, water takes and soil disturbance.
Under the Building Act, council is responsible for processing resource consent applications for large dams on behalf of all North Island regional councils, not including the unitary authorities.
WHY WE DO IT
Implementing council’s responsibilities to issue consents and monitor permitted activities helps protect the Waikato’s unique environment while allowing for growth and development in a sustainable way. This ensures that the region’s resources are managed sustainably for current as well as future generations.
Council also has the regulatory responsibility to ensure large dams are appropriately designed and authorised, so that the potential risks to people and property are minimised.
Responsible officer: Brent Sinclair Reporting Officer Nikki Wall
Level of alignment to community outcomes ■ = primary contribution ■ = secondary contribution
HEALTHY ENVIRONMENT STRONG ECONOMY VIBRANT COMMUNITIES
• Land use is sustainable
• It is safe to swim and take kai from all freshwater
• The full range of ecosystem types, including land,
water and coastal and marine ecosystems, is in a
healthy and functional state
• All soil quality indicators are trending positive.
• Economic growth ensures natural capital and
ecosystem services are maintained
• We are achieving the best use of the region’s fresh
water.
• New investment is attracted to the region through
improved reputation and partnerships.
• Our diverse communities feel like a valued part of the
Waikato and take pride in the region.
• Communities are less vulnerable and more resilient to
natural hazards, the effects of climate change and
changes to society and the economy
• There is increased benefit from the use and protection
of our amenity and recreational features and values.
Level of alignment to council priorities
PRIORITY LEVEL OF ALIGNMENT
Forge and strengthen partnerships to achieve positive outcomes for the region Strongly contributes
226

Positively influence future land use choices to ensure long term sustainability Strongly contributes
Manage freshwater more effectively to maximise regional benefit Strongly contributes
Enhance the value of the region’s coasts and marine area Strongly contributes
LEVELS OF SERVICE
What’s important
for this activity
(key attributes)
What we will deliver
to the community
(levels of service)
How we will measure
performance
(performance
measure)
Baseline result
Year 1 2018/19
Year 2 2019/20
Year 3 2020/21
Years 4-10 2021/22-2028/29
Is this a new measure?
Quality - best practice decision making.
To efficiently and effectively deliver consenting and compliance monitoring processes under the Resource Management Act 1991 to enable the lawful use of natural and physical resources.
Percentage of resource consents processed in accordance with RMA 1991 timeframe discount regulations.
2016/17
99.9%
≥95% ≥95% ≥95% ≥95% No
Percentage of highest
priority (P1) consented
sites monitored each
year.
2016/17
100%
100% 100% 100% 100% No
Percentage of
significant non-
compliance incidents
where action is taken.
2016/17
100%
100% 100% 100% 100% Yes
Notes/Definitions: Notes - * options for response include:
- desktop response
- immediate site inspection
- phone call only
- referred to external contractor
- referred to investigations
- referred to other.
227

2018-2028 LTP PERFORMANCE MEASURES: INVESTIGATIONS AND INCIDENT RESPONSE
WHAT WE DO
Council runs a 24 hour / 7 day a week response service to ensure the environment, people or property are not seriously affected by pollution incidents or non-compliant activities or resource users. Council also investigates serious breaches of environmental or maritime regulation and where significant non-compliance has been found to occur, formally investigates the incident to enable decisions to be made on appropriate action, including enforcement.
WHY WE DO IT
This activity safeguards the community and environment against activities and incidents that could cause damage to our air, water, soils, geothermal and coastal marine areas.
Responsible officer: Patrick Lynch Reporting Officer Patrick Lynch
Level of alignment to community outcomes ■ = primary contribution ■ = secondary contribution
HEALTHY ENVIRONMENT STRONG ECONOMY VIBRANT COMMUNITIES
• Land use is sustainable
• It is safe to swim and take kai from all freshwater
• The full range of ecosystem types, including land,
water and coastal and marine ecosystems, is in a
healthy and functional state
• All soil quality indicators are trending positive.
• Economic growth ensures natural capital and
ecosystem services are maintained
• We are achieving the best use of the region’s fresh
water.
• New investment is attracted to the region through
improved reputation and partnerships
• Our diverse communities feel like a valued part of the
Waikato and take pride in the region.
• Communities are less vulnerable and more resilient to
natural hazards, the effects of climate change and
changes to society and the economy
• There is increased benefit from the use and
protection of our amenity and recreational features and
values
Level of alignment to council priorities
PRIORITY LEVEL OF ALIGNMENT
Support communities to take action on agreed outcomes Strongly contributes
Positively influence future land use choices to ensure long term sustainability Strongly contributes
Manage freshwater more effectively to maximise regional benefit Strongly contributes
228
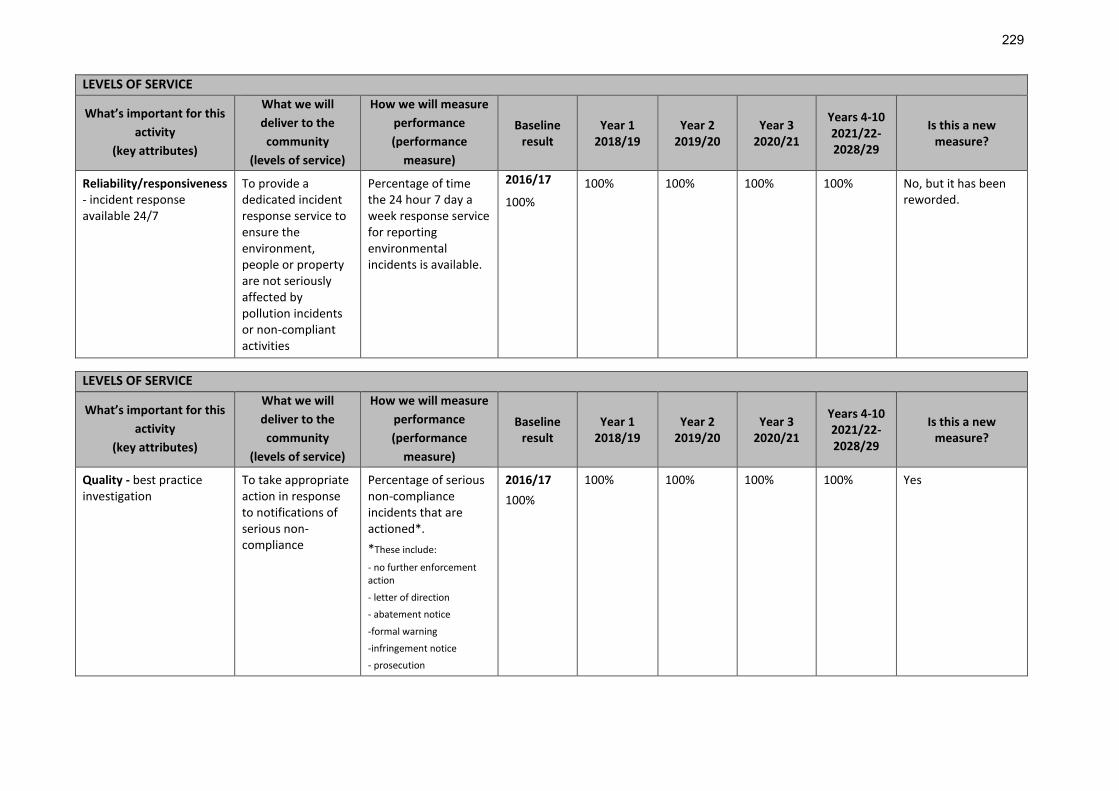
LEVELS OF SERVICE
What’s important for this
activity
(key attributes)
What we will
deliver to the
community
(levels of service)
How we will measure
performance
(performance
measure)
Baseline result
Year 1 2018/19
Year 2 2019/20
Year 3 2020/21
Years 4-10 2021/22-2028/29
Is this a new measure?
Reliability/responsiveness - incident response available 24/7
To provide a dedicated incident response service to ensure the environment, people or property are not seriously affected by pollution incidents or non-compliant activities
Percentage of time the 24 hour 7 day a week response service for reporting environmental incidents is available.
2016/17
100%
100% 100% 100% 100% No, but it has been reworded.
LEVELS OF SERVICE
What’s important for this
activity
(key attributes)
What we will
deliver to the
community
(levels of service)
How we will measure
performance
(performance
measure)
Baseline result
Year 1 2018/19
Year 2 2019/20
Year 3 2020/21
Years 4-10 2021/22-2028/29
Is this a new measure?
Quality - best practice investigation
To take appropriate action in response to notifications of serious non-compliance
Percentage of serious non-compliance incidents that are actioned*.
*These include:
- no further enforcement action
- letter of direction
- abatement notice
-formal warning
-infringement notice
- prosecution
2016/17
100%
100% 100% 100% 100% Yes
229

2018-2028 LTP PERFORMANCE MEASURES: MARITIME SERVICES
WHAT WE DO
This activity is split into three primary workstreams namely policy and procedures, compliance with the navigation safety bylaw and education, and operations. Operations include compliance activities, debris removal, and inspecting and maintaining the region’s network of navigation aids.
WHY WE DO IT
Providing maritime services ensures the region’s waterways are safe and navigable.
Responsible officer: Nicole Botherway Reporting Officer Nicole Botherway
Level of alignment to community outcomes ■ = primary contribution ■ = secondary contribution
HEALTHY ENVIRONMENT STRONG ECONOMY VIBRANT COMMUNITIES
• Land use is sustainable
• It is safe to swim and take kai from all freshwater
• The full range of ecosystem types, including land,
water and coastal and marine ecosystems, is in a
healthy and functional state
• All soil quality indicators are trending positive.
• Economic growth ensures natural capital and
ecosystem services are maintained
• We are achieving the best use of the region’s fresh
water.
• New investment is attracted to the region through
improved reputation and partnerships.
• Our diverse communities feel like a valued part of the
Waikato and take pride in the region.
• Communities are less vulnerable and more resilient to
natural hazards, the effects of climate change and
changes to society and the economy
• There is increased benefit from the use and protection
of our amenity and recreational features and values.
Level of alignment to council priorities
PRIORITY LEVEL OF ALIGNMENT
Enhance the value of the region’s coasts and marine area Strongly contributes
230
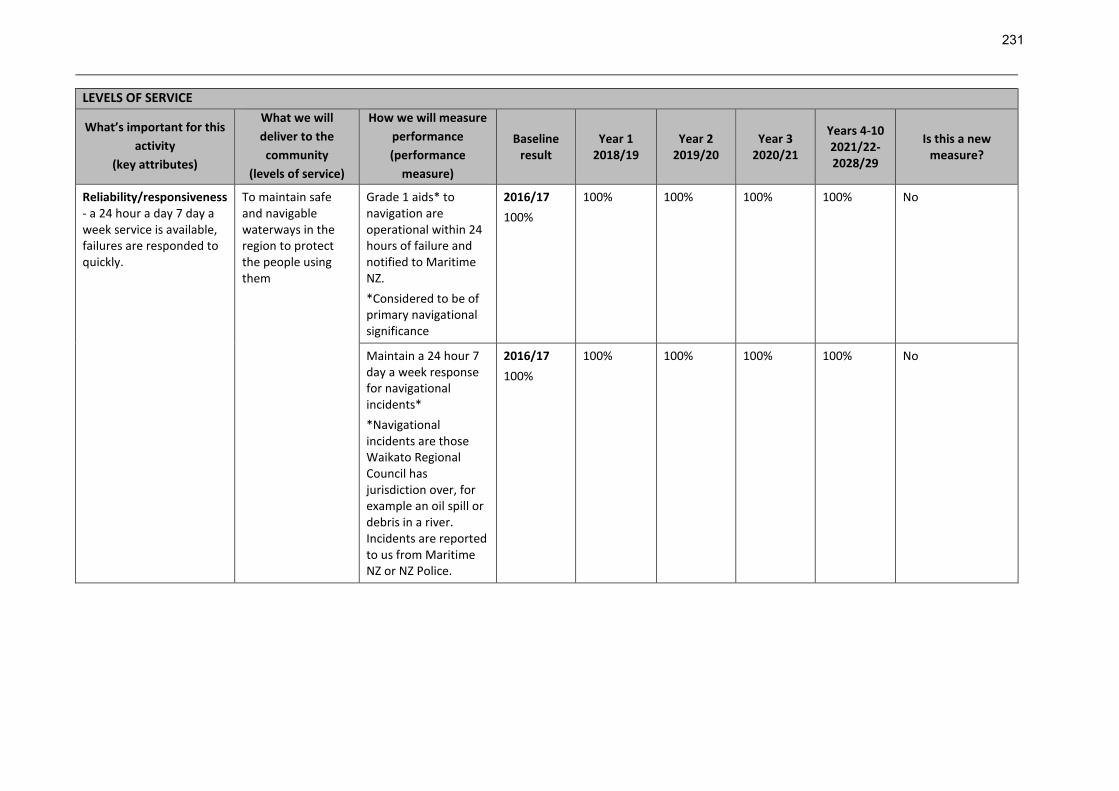
LEVELS OF SERVICE
What’s important for this
activity
(key attributes)
What we will
deliver to the
community
(levels of service)
How we will measure
performance
(performance
measure)
Baseline result
Year 1 2018/19
Year 2 2019/20
Year 3 2020/21
Years 4-10 2021/22-2028/29
Is this a new measure?
Reliability/responsiveness - a 24 hour a day 7 day a week service is available, failures are responded to quickly.
To maintain safe and navigable waterways in the region to protect the people using them
Grade 1 aids* to navigation are operational within 24 hours of failure and notified to Maritime NZ.
*Considered to be of primary navigational significance
2016/17
100%
100% 100% 100% 100% No
Maintain a 24 hour 7 day a week response for navigational incidents*
*Navigational incidents are those Waikato Regional Council has jurisdiction over, for example an oil spill or debris in a river. Incidents are reported to us from Maritime NZ or NZ Police.
2016/17
100%
100% 100% 100% 100% No
231

GOA: PUBLIC TRANSPORT 2018-2028 LTP PERFORMANCE MEASURES: PUBLIC TRANSPORT
WHAT WE DO
Waikato Regional Council provides public transport services to enable access to education, employment, healthcare and social opportunities for people within our Region. In urban areas the public transport system also serves to reduce road congestion and offers environmental benefits by providing an alternative to private motor vehicles.
Waikato Regional Council also provides comprehensive public bus services within Hamilton and to satellite towns around Hamilton. There are also a number of rural centres within the region serviced by Councils public transport network. In addition, the Council provides Total Mobility services in Hamilton, Tokoroa and Taupo, which provides door to door transport services for people with disabilities.
Council’s public transport team works closely with local councils, transport service providers, businesses, institutions, community organisations and a wide range of other stakeholders to ensure public transport meets the needs of the people it serves.
WHY WE DO IT
Public transport services give the public an alternative to private vehicle travel, provide access for the transport disadvantaged, supports urban growth objectives, reduces congestion by reducing vehicle movements, provides rural communities with better access to essential services and enhances access to special events.
Responsible officer: Andrew Wilson Reporting Officer Trudi Knight
Level of alignment to community outcomes ■ = primary contribution ■ = secondary contribution
HEALTHY ENVIRONMENT STRONG ECONOMY VIBRANT COMMUNITIES
• Land use is sustainable
• The full range of ecosystem types, including land,
water and coastal and marine ecosystems, is in a
healthy and functional state
• By 2034 household median incomes are above the
New Zealand average
• The Waikato region is moving towards a low carbon
economy
• New investment is attracted to the region through
improved reputation and partnerships
• Our diverse communities feel like a valued part of
the Waikato and take pride in the region.
• People and communities are well connected to
each other, to services (including health and other
essential services), and to opportunities including
recreation, education and jobs
• We support all parts of the Waikato being as
successful as they can be
Level of alignment to council priorities
PRIORITY LEVEL OF ALIGNMENT
Shape the development of the region so it supports our quality of life Strongly contributes
232
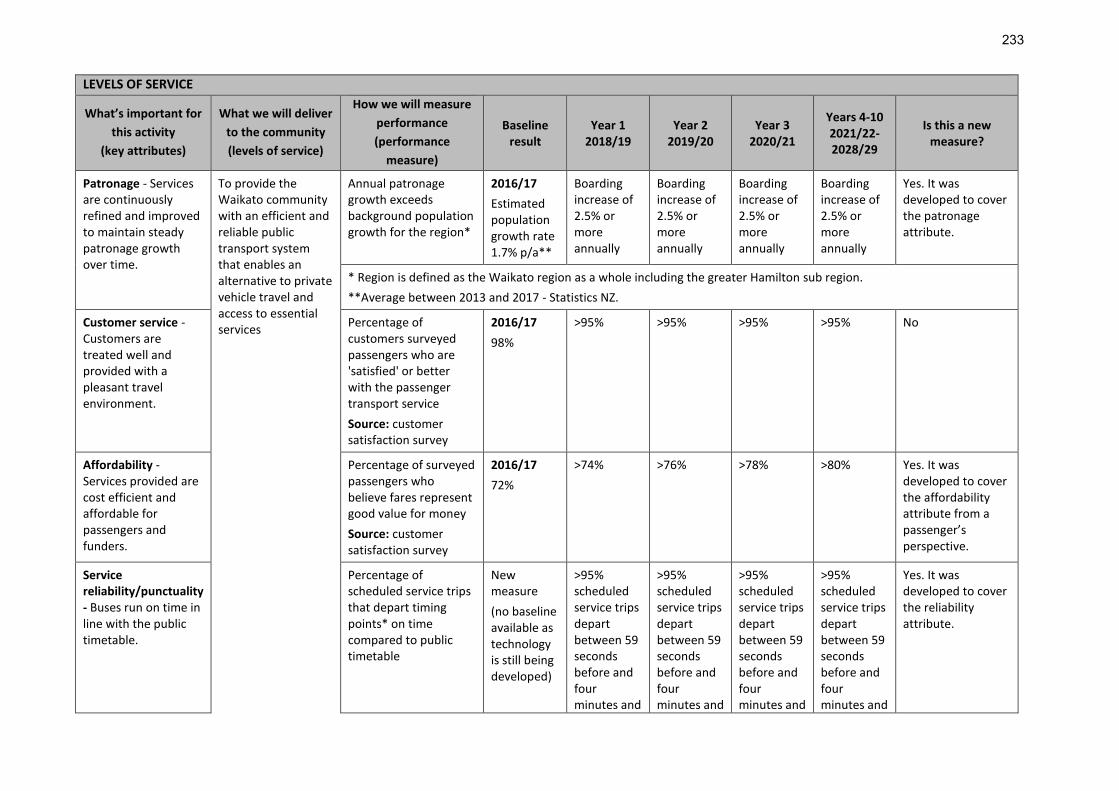
LEVELS OF SERVICE
What’s important for
this activity
(key attributes)
What we will deliver
to the community
(levels of service)
How we will measure
performance
(performance
measure)
Baseline result
Year 1 2018/19
Year 2 2019/20
Year 3 2020/21
Years 4-10 2021/22-2028/29
Is this a new measure?
Patronage - Services are continuously refined and improved to maintain steady patronage growth over time.
To provide the Waikato community with an efficient and reliable public transport system that enables an alternative to private vehicle travel and access to essential services
Annual patronage growth exceeds background population growth for the region*
2016/17
Estimated population growth rate 1.7% p/a**
Boarding increase of 2.5% or more annually
Boarding increase of 2.5% or more annually
Boarding increase of 2.5% or more annually
Boarding increase of 2.5% or more annually
Yes. It was developed to cover the patronage attribute.
* Region is defined as the Waikato region as a whole including the greater Hamilton sub region.
**Average between 2013 and 2017 - Statistics NZ.
Customer service - Customers are treated well and provided with a pleasant travel environment.
Percentage of customers surveyed passengers who are 'satisfied' or better with the passenger transport service
Source: customer satisfaction survey
2016/17
98%
>95% >95% >95% >95% No
Affordability - Services provided are cost efficient and affordable for passengers and funders.
Percentage of surveyed passengers who believe fares represent good value for money
Source: customer satisfaction survey
2016/17
72%
>74% >76% >78% >80% Yes. It was developed to cover the affordability attribute from a passenger’s perspective.
Service reliability/punctuality - Buses run on time in line with the public timetable.
Percentage of scheduled service trips that depart timing points* on time compared to public timetable
New measure
(no baseline available as technology is still being developed)
>95% scheduled service trips depart between 59 seconds before and four minutes and
>95% scheduled service trips depart between 59 seconds before and four minutes and
>95% scheduled service trips depart between 59 seconds before and four minutes and
>95% scheduled service trips depart between 59 seconds before and four minutes and
Yes. It was developed to cover the reliability attribute.
233

59 seconds after the scheduled departure time
59 seconds after the scheduled departure time
59 seconds after the scheduled departure time
59 seconds after the scheduled departure time
*A timing point is defined as a key interval along a route (it is less frequent than a bus stop). The number of timing points varies for each route.
Accessibility - Services are easy to use and enable access to education, employment, healthcare and social opportunities for people with our region.
Percentage of households in Hamilton within 800m of public transport bus stop
2016/17
96%
>97% >98% >98% >98% Yes. It was developed to cover the accessibility attribute.
234

Report to Strategy and Policy Committee
Date: 07 February 2018
Author:
Janine Becker, Manager Finance
Judy van Rossem, Biodiversity Project Manager
Authoriser: Mike Garrett, Chief Financial Officer
Subject: 2018 - 2028 Long Term Plan - Rates remission and postponement policies
Section: A (Committee has delegated authority to make decision)
Purpose 1. This report presents the proposed rates remission and postponement policies for inclusion in the 2018
– 2028 Long Term Plan. It highlights the key changes to these policies that staff are proposing, together with the rationale for these changes.
Executive Summary 2. As part of the development of the 2018 – 2028 Draft Long Term Plan (LTP) staff have undertaken a
review of the rates remission and postponement policies.
3. While generally these policies are effective, staff are proposing to amalgamate the current policies with respect to remissions on land protected for biodiversity, and to introduce a new policy for the remission of uncollectible rates.
Staff Recommendations:
1. That the report “2018 – 2028 Long Term Plan – Rates remission and postponement policies” (Doc # 11788746 dated 07 February 2018) be received.
2. That the committee approve the revised rates remission and postponement policies as presented for consultation as part of the 2018 – 2028 Draft Long Term Plan.
Background 4. As part of the development of the 2018 – 2028 Draft Long Term Plan, staff have reviewed the
effectiveness of current rates remission policies. The areas for review have been presented to the council through workshops in October 2017.
5. Key changes proposed to the policies are: a. A revision of the Conservation and Significant Natural Areas remission policies – bringing these
two policies together b. The addition of a remission policy to deal with uncollectible rates.
Remission of rates on land protected for biodiversity 6. To date, the council has had two policies for rates remission for natural heritage protection purposes –
one for covenants and one for significant natural areas (SNAs).
235

7. These policies are designed to encourage landowners to maintain, enhance and protect natural heritage features by offering a financial incentive.
8. The two policies have been reviewed for the following reasons:
(a) lack of clarity around implementation of the SNA policy due to: - the uncertainty around the SNA designation of sites that have been labelled as “likely” significant
due to data deficiency - incomplete inventory for all districts (so some districts “miss out”) - uncertainty around rankings for SNAs and the complicated system of % remissions based on
whether they are ranked in the top third etc. (b) the opportunity to combine the policies into one, especially where a property contains a covenant
which is also an SNA. (c) the low uptake of rates remissions under these two policies – in particular the policy for remission
for SNAs under which no remissions have been granted since its introduction in 2012. 9. The value of remissions granted under the provisions of the current rates remission policies are
summarised in the following tables:
2017/18 Rating Unit area (ha)
Remission area (ha)
% of total rating area
$Rates $Remission % of Total $Rate
Total QEII Remission
87,335 14,427 16.52% $628,141 $95,325 15.18%
Total Nga Whenua Rahui Remission
19,541 9,468 48.45% $43,996 $12,803 29.10%
Total “conservation” remission
106,876 23,895 22.36% $672,137 $108,128 16.09%
2016/17 Rating Unit area (ha)
Remission area (ha)
% of total rating area
$Rates $Remission % of Total $Rate
Total QEII Remission
85,424 14,280 16.72% $617,927 $91,726 14.84%
Total Nga Whenua Rahui Remission
20,343 9,449 46.45% $37,116 $11,170 30.10%
Total “conservation” remission
105,768 23,729 22.43% $655,042 $102,896 15.71%
2017/18 Rating Unit area (ha)
Remission area (ha)
% of total rating area
$Rates $Remission % of Total $Rate
Total Taupo Lakeshore Remission
3,142 1,655 52.68% $18,659 $13,753 73.71%
2016/17 Rating Unit area (ha)
Remission area (ha)
% of total rating area
$Rates $Remission % of Total $Rate
Total Taupo Lakeshore Remission
3,142 1,655 52.68% $19,155 $14,068 73.45%
10. A number of councils provide rate remissions for land for conservation purposes, providing the
landowner with some recognition for protecting biodiversity values and compensation for forgoing
236

potential income from the protected land. In 2014, Auckland Council commissioned a review of the advantages and disadvantages of various incentive schemes for biodiversity protection. They found that rates reduction schemes for biodiversity protection tend to be poorly advertised, underutilised and unclear about their nature and extent. Rates relief may not achieve protection unless it is accompanied by a covenant guaranteeing long-term protection. They found a strong argument for rates relief on covenanted land, or land set aside for conservation purposes (Murray, Bade and Seabrook-Davison 2014).
11. Rates relief usually offers token amounts of compensation to landowners and is not enough to cover
landowner costs of actively managing biodiversity. Therefore although it is not a major motivator for landowners in terms of voluntary protection, it does however offer councils another ‘string in their bow’ and is important to retain. It also has relatively low transaction costs and there is flexibility in the design of rates remission policies. In many cases, the actual amount of the remission is less important than the symbolic recognition of the landowner’s commitment to biodiversity protection.
12. The following factors improve the likelihood of success for a rates remission approach for conservation
purposes or biodiversity protection:
including it as one of a number of mechanisms to assist landowners with biodiversity protection and restoration
for covenants in perpetuity, making the rates relief endure for periods of time (say at least three years) so as to reduce the administrative burden to the owner needing to apply every year and also to provide a degree of certainty. It could be reassessed if at any time the covenant was lifted, or varied, or if the owner was in breach of the covenant
not having a requirement for landowners who receive rate relief to provide public access. 13. In the Waikato region, rates remission can be considered as part of a comprehensive package of non-
regulatory mechanisms to assist landowners to protect and restore biodiversity values. Landowners who may receive rates remission on their covenant or SNA may also be receiving funds from Council to fence waterways, remove pests and weeds, purchase plants, stock-proof a covenant or SNA and receive free advice and information.
Aspects of the rates remission policy for QEII and Nga Whenua Rahui covenants
14. The current policy for rates remission on covenants appears to be working well. Those landowners receiving a rates remission are informed of the amount of the rates remitted on their rates bill, thus demonstrating to them a clear reward for protecting the natural area on their property in perpetuity. There is also no requirement for public access to be provided to the covenant area.
15. Very few of the above two remission types have been applied as a result of a ratepayer application. The council receives updated QEII spatial data and QEII covenant agreement documents on a quarterly basis and from this the remission is pro-actively applied. The Nga Whenua Rahui remissions are applied in a similar manner with the spatial data and supporting documentation being reviewed annually; the council has not received any applications directly from the ratepayers for the Nga Whenua Rahui remission. Under the existing remission policy, council is able to apply these remissions on the ratepayers’ behalf.
16. The QEII National Trust is continuing to develop relationships with regional and district councils and have
recently discussed the establishment of a MoU between the two organisations. In the Trust’s experience, where formal funding agreements have been implemented – including rates remissions - the number of covenants, and extent of biodiversity protection, has increased substantially.
237

Aspects of the rates remission policy for SNAS
Ranking versus level of significance
17. In contrast, the SNA rates remission policy does not appear to be working well. The SNA schedules are not consistent in terms of their status across the region and there are no agreed ranking documents or lists as specified in the policy. Furthermore, the SNA inventories are subject to change as restoration efforts create new sites, or ground-truthing confirms boundaries and/or rankings, or District Plans are reviewed. WRC can only approve remissions based on its existing policy which is calculated based on the ranking of the area within its ecosystem type in each district (top third, second third etc. in terms of ecological values) - if this isn’t available the remission cannot be calculated.
18. A simpler and more workable policy is needed which removes the reliance on the scoring/ranking of
SNAs within each district but limits remissions to a broad level of significance (international, national, regional etc.) as this can be applied across most of the districts. Only Taupo, Matamata-Piako and Hamilton City do not specify a level of significance for the SNAs in their district plans; however, it is possible to assign a level on an individual case-by-case basis as applications for rates remissions are made.
Requirement for management plans
19. Only a small proportion of sites have management plans agreed with Council, as specified in the current policy. When Council is managing or funding a catchment new works project, the works are usually put into an Environmental Programme Agreement (EPA) which has terms and conditions attached and this constitutes a management plan. In cases where Council’s funding contribution exceeds $35,000, this EPA agreement is required to be registered on the property title through a Memorandum of Encumbrance (MoE) which is a form of legal protection. There is a need for the SNA remissions policy to focus on the long term protection of the biodiversity values in question either through a MOE, covenant or other form of legal protection as described below.
Legal protection
20. The current policy does not require SNAs to be legally protected, despite the stated objective to “encourage the protection and enhancement of indigenous vegetation”. As a minimum, remnant bush and wetlands and other SNAs should be fenced to exclude stock and wild animals, to ensure the ecological integrity is maintained. Going one step further with legal protection of such areas particularly on private land makes an important contribution to Council’s effort to maintain and restore a full range of remaining natural habitats and ecosystems as stated in the Waikato Regional Policy Statement. It is recognised that there is a diversity of mechanisms beyond QEII covenants and Nga Whenua Rahui kawenata to protect areas of high value biodiversity in perpetuity. Such mechanisms include:
a conservation covenant under section 77 of the Reserves Act 1977
a declaration of protected private land under section 76 of the Reserves Act 1977
a management agreement for conservation purposes under section 38 of the Reserves Act 1977
a covenant for conservation purposes under section 27 of the Conservation Act 1987
a management agreement for conservation purposes under section 29 of the Conservation Act 1987
a covenant with a district council which has the effect of preserving the land for natural or cultural conservation purposes
a Memorandum of Encumbrance and associated Environmental Programme Agreement required by the regional council as a condition of catchment works funding.
21. As all legally protected areas are automatically designated as SNAs under the “protected land”
significance criterion, then an adjustment of Council’s current policy to capture the diversity of legal mechanisms would result in more biodiversity areas being eligible for rates remission and recognition of the landowner’s efforts to ensure the area is preserved in perpetuity. Unfortunately it is not possible to know exactly how much private land SNA is legally protected under these types of alternative
238

covenants. However, it is estimated that less than 5% would be eligible in addition to those areas under a Memorandum of Encumbrance.
22. By requiring areas to be legally protected under one of these mechanisms also negates the need for a
management plan as covenants and management agreements will almost always include conditions such as stock-proof fencing. However it would be prudent to include evidence of this as a requirement of the application for remission.
Alignment with district councils
23. The following councils currently have maps and schedules of SNAs included either wholly or partly in their district plans (developed following consultation with landowners): - Hamilton City - Hauraki District - Rotorua District - Waitomo District - Waipa District - South Waikato District - Taupo District - Matamata Piako District - Thames-Coromandel District Council.
24. Waikato District Council is currently reviewing their district plan and will also be including a schedule of
SNAs in 2018. Only Otorohanga District does not have schedules of SNAs included in their district plan. 25. In recognising the extensive consultation processes that have preceded the inclusion of the lists of SNAs
in nearly all of the district plans - and the objectives, policies and methods for protecting indigenous biodiversity in the Waikato RPS – it makes sense for Council’s revised rates remission policy for SNAs to refer to the district plan schedules when calculating rates remission. This alignment further harmonises rating policies with the constituent district councils and ensures a level of consistency and certainty.
Revised policy
26. Staff have recommended wrapping the two current policies into one policy aimed at encouraging landowners to protect and conserve natural features and areas of high biodiversity value. Now that nearly all District Councils have incorporated SNAs into their district plans it is timely for us to revisit these policies and to align them more closely across the region.
27. The revised policy is included in the attached document. 28. The requirement for the SNA to be given a ranking within its ecological district has been removed as this
is difficult to determine in practice, as SNA ranking lists are not consistent across the region. However, the level of ranking (regionally, nationally or internationally significant) has been reviewed and it is recommended that the policy is limited to those areas that are nationally or internationally significant as this reduces the financial impact of this policy.
29. The revised policy supports the provisions of the Waikato Regional Policy Statement and current District
Plans. It recognises that most SNAs and biodiversity contained within are already protected by plan rules and this policy offers some encouragement to landowners to maintain and enhance and protect these features through small remissions on rates to complement other mechanisms such as grants, technical advice and assistance and legal protection.
239

Estimated eligibility for remission under revised policy
30. Staff estimate that there is $88,700 of rates remission for those areas that would be eligible under the revised policy as they have either a Memorandum of Encumbrance registered on their title or an agreement providing protection for the land with Waikato Regional Council.
31. No additional budget provision has yet been made for this increased remission value. If council approves
the revised policy, this additional cost will either need to be met through existing budgets, or addressed via the Chief Executive’s submission to the Long Term Plan in April 2018.
Remission of uncollectible rates 32. The proposed policy is new, and based on similar policies administered by other councils. The application
of this policy would allow for staff to recognise those outstanding balances that it is not likely that payment will be received for on an annual basis. By remitting these rates, we would be able to avoid the accrual of penalties which require writing off as a bad debt at the time that the rates become statute barred.
33. An example of where this policy may be able to be applied is in relation to multiple-owned Maori
freehold land where rates are unpaid on an ongoing basis. At the end of 2016/17, the council wrote off $95,163 of statute-barred rates and penalties that had been assessed against multiple-owned Maori freehold land. Of this amount, the value of the original rates assessed was $39,954 with the remaining $55,209 being penalties applied on the outstanding balance owing. By applying penalties on rates that are deemed uncollectible, the council is overstating the revenue that it is likely to receive on the settlement of the rates account. For general land, the council has powers to collect any outstanding amount that extend to the sale of the property. These same powers cannot be applied to multiple-owned Maori freehold land.
Assessment of Significance 34. Having regard to the decision making provisions in the LGA 2002 and Councils Significance Policy, a
decision in accordance with the recommendations is not considered to have a high degree of significance.
Legislative context 35. The Local Government Act 2002 requires the council to have the following rating policies:
A rates remission policy
A rates postponement policy.
36. Any remission policy mast state:
The objectives sought to be achieved by the remission of rates
The conditions and criteria to be met in order for rates to be remitted.
Preferred Option 37. Staff recommend the approval of the revised rates remission and postponement policies as presented.
38. The combined policy with respect to the remission of rates for the protection of biodiversity supports
the provisions of the Waikato Regional Policy Statement and current District Plans. It recognises that most SNAs and biodiversity contained within are already protected by plan rules and this policy offers some encouragement to landowners to maintain and enhance and protect these features through small remissions on rates to complement other mechanisms such as grants, technical advice and assistance and legal protection.
39. The additional policy for the remission of uncollectible rates will assist with the management of these
account balances on an ongoing basis, rather than seeing the accumulation of rates penalties on balances that are not able to be collected.
240

Policy Considerations 40. To the best of the writer’s knowledge, this decision is not significantly inconsistent with nor is anticipated
to have consequences that will be significantly inconsistent with any policy adopted by this local authority or any plan required by the Local Government Act 2002 or any other enactment.
Attachments 1. Draft Rates Remission and Postponement Policies (June 2018) (Doc # 10264888).
241

DRAFT Rates Remission and Postponement Policies
June 2018
242

Table of contents
1 Remission of rates for sporting and recreational organisations ............................... 1
1.1 Objectives 1
1.2 Criteria and conditions 1
2 Remission of rates for community organisations .................................................... 2
2.1 Objectives: 2
2.2 Criteria and conditions 2
3 Remission and postponement of rates on Maori freehold land ............................... 3
3.1 Objectives 3
3.2 Criteria and conditions 3
3.3 Applications for remissions 3
4 Remission of rates on land protected for conservation purposes ............................ 4
4.1 Objective 4
4.2 Criteria 4
5 Remission of rates for Significant Natural Areas (SNAs) .......................................... 5
5.1 Objective Error! Bookmark not defined.
5.2 Criteria and conditions Error! Bookmark not defined.
6 Remission of rates for Lake Taupo lakebed ............................................................ 6
6.1 Objectives 6
6.2 Criteria and conditions 6
7 Remission of targeted rates for urban land in areas classified as rural, commercial or industrial areas ................................................................................................. 7
7.1 Objective 7
7.2 Criteria and conditions 7
8 Remission of the Waihou/Piako scheme catchment rate ........................................ 8
8.1 Objective 8
8.2 Criteria and Conditions 8
9 Remission of rates on rating units with a capital valuation of $1,000 or less ........... 9
9.1 Objective 9
9.2 Criteria and conditions 9
10 Remission of the Public Transport Rate ................................................................ 10
10.1 Objective 10
10.2 Criteria and conditions 10
11 Rates postponement policy ................................................................................. 11
11.1 Objective 11
11.2 General approach 11
11.3 Criteria and conditions 11
243

12 Remission of uncollectible rates .......................................................................... 14
12.1 Objective 14
12.2 Criteria and conditions 14
13 Remission of penalties ........................................................................................ 15
13.1 Objective 15
13.2 Criteria and conditions 15
14 General remission policy ..................................................................................... 16
14.1 Objective 16
14.2 Criteria and conditions 16
15 Policy on early payment of rates .......................................................................... 17
244

245
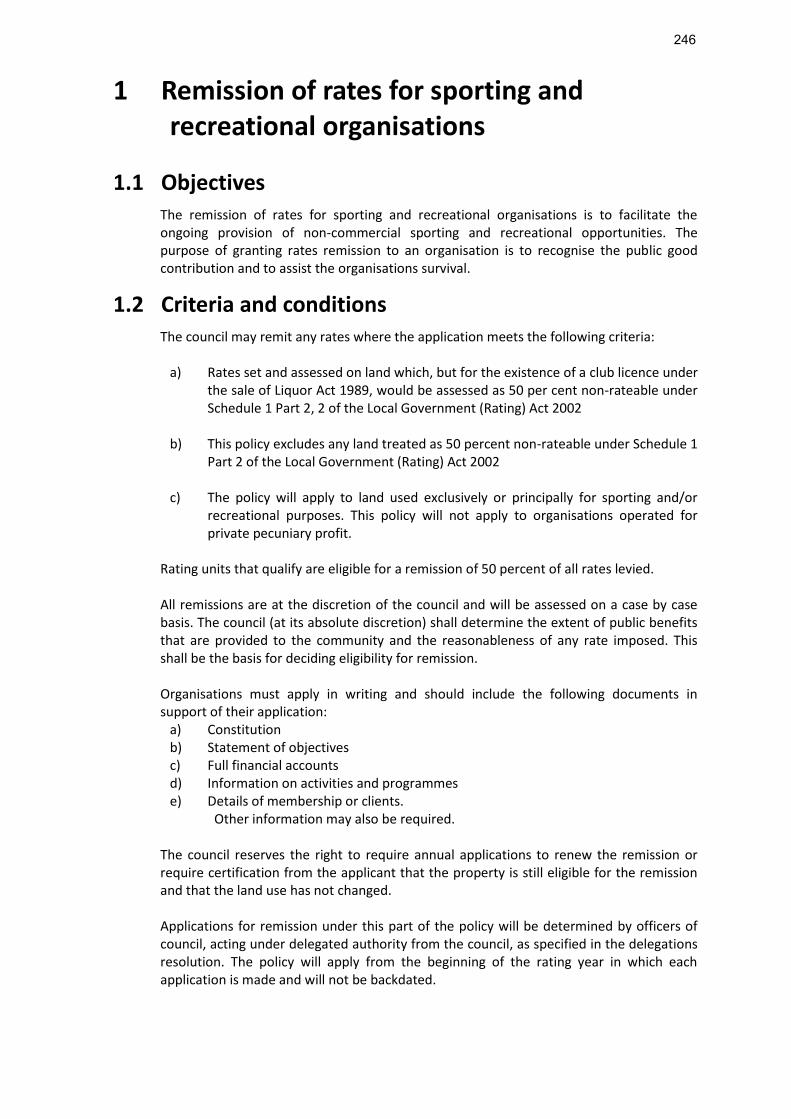
1 Remission of rates for sporting and recreational organisations
1.1 Objectives The remission of rates for sporting and recreational organisations is to facilitate the ongoing provision of non-commercial sporting and recreational opportunities. The purpose of granting rates remission to an organisation is to recognise the public good contribution and to assist the organisations survival.
1.2 Criteria and conditions The council may remit any rates where the application meets the following criteria:
a) Rates set and assessed on land which, but for the existence of a club licence under
the sale of Liquor Act 1989, would be assessed as 50 per cent non-rateable under Schedule 1 Part 2, 2 of the Local Government (Rating) Act 2002
b) This policy excludes any land treated as 50 percent non-rateable under Schedule 1 Part 2 of the Local Government (Rating) Act 2002
c) The policy will apply to land used exclusively or principally for sporting and/or recreational purposes. This policy will not apply to organisations operated for private pecuniary profit.
Rating units that qualify are eligible for a remission of 50 percent of all rates levied.
All remissions are at the discretion of the council and will be assessed on a case by case basis. The council (at its absolute discretion) shall determine the extent of public benefits that are provided to the community and the reasonableness of any rate imposed. This shall be the basis for deciding eligibility for remission.
Organisations must apply in writing and should include the following documents in support of their application:
a) Constitution b) Statement of objectives c) Full financial accounts d) Information on activities and programmes e) Details of membership or clients.
Other information may also be required.
The council reserves the right to require annual applications to renew the remission or require certification from the applicant that the property is still eligible for the remission and that the land use has not changed. Applications for remission under this part of the policy will be determined by officers of council, acting under delegated authority from the council, as specified in the delegations resolution. The policy will apply from the beginning of the rating year in which each application is made and will not be backdated.
246
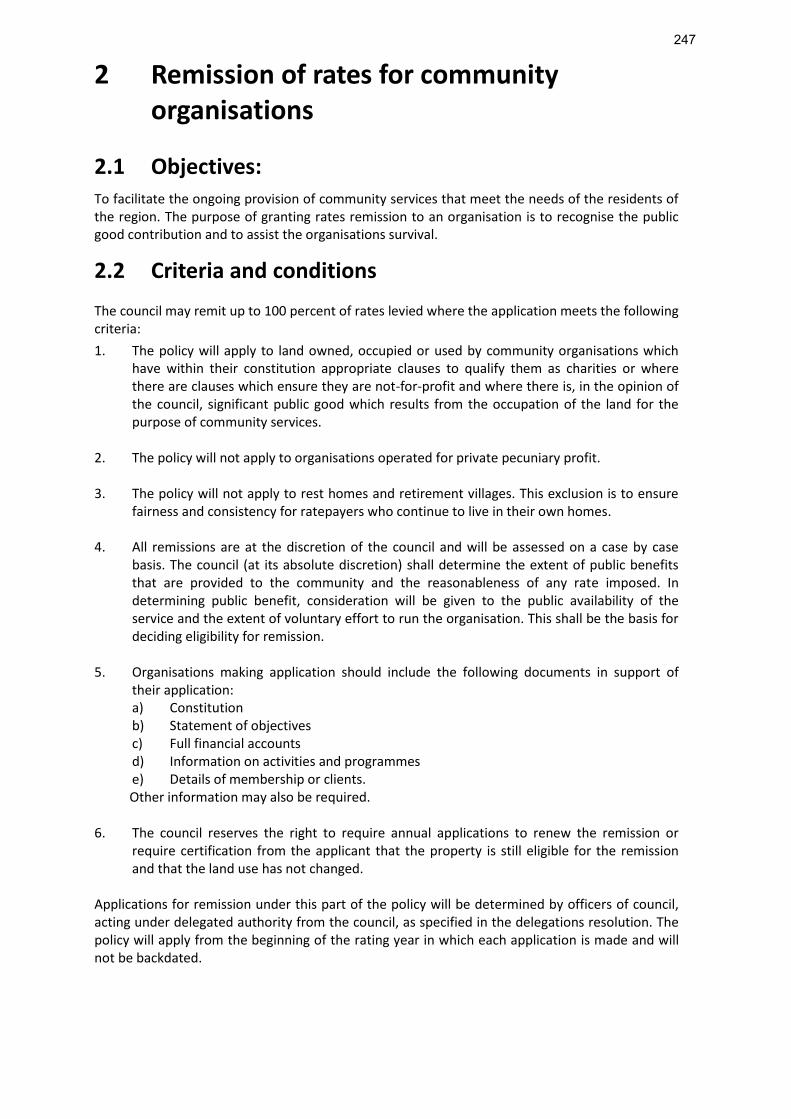
2 Remission of rates for community organisations
2.1 Objectives: To facilitate the ongoing provision of community services that meet the needs of the residents of the region. The purpose of granting rates remission to an organisation is to recognise the public good contribution and to assist the organisations survival.
2.2 Criteria and conditions
The council may remit up to 100 percent of rates levied where the application meets the following criteria:
1. The policy will apply to land owned, occupied or used by community organisations which have within their constitution appropriate clauses to qualify them as charities or where there are clauses which ensure they are not-for-profit and where there is, in the opinion of the council, significant public good which results from the occupation of the land for the purpose of community services.
2. The policy will not apply to organisations operated for private pecuniary profit.
3. The policy will not apply to rest homes and retirement villages. This exclusion is to ensure
fairness and consistency for ratepayers who continue to live in their own homes.
4. All remissions are at the discretion of the council and will be assessed on a case by case basis. The council (at its absolute discretion) shall determine the extent of public benefits that are provided to the community and the reasonableness of any rate imposed. In determining public benefit, consideration will be given to the public availability of the service and the extent of voluntary effort to run the organisation. This shall be the basis for deciding eligibility for remission.
5. Organisations making application should include the following documents in support of
their application: a) Constitution b) Statement of objectives c) Full financial accounts d) Information on activities and programmes e) Details of membership or clients.
Other information may also be required. 6. The council reserves the right to require annual applications to renew the remission or
require certification from the applicant that the property is still eligible for the remission and that the land use has not changed.
Applications for remission under this part of the policy will be determined by officers of council, acting under delegated authority from the council, as specified in the delegations resolution. The policy will apply from the beginning of the rating year in which each application is made and will not be backdated.
247

3 Remission and postponement of rates on Maori freehold land
3.1 Objectives The objectives of this remission and postponements policy are:
a) to recognise situations where there is no occupier, trustee or person gaining an
economic or financial benefit from the land b) to recognise matters related to the physical accessibility of the land c) to recognise and take account of the presence of waahi tapu that may affect the
use of the land for other purposes d) where part of a block is occupied, to grant remission to the portion of land not
occupied e) to enable the council to act fairly and reasonably.
3.2 Criteria and conditions The council will consider remission or postponement of rates, in whole or in part, for Maori freehold land as determined by the Maori Land Court, owned by more than two persons. To qualify for remission or postponement the property must comply with the following criteria:
No income or economic benefit is derived from the use or occupation of that land; and
a) the land is inaccessible or b) the land is unoccupied, or c) the land is the unoccupied portion of a block where only a portion is occupied.
3.3 Applications for remissions Owners or trustees making application should include the following information in their applications:
a) details of the property including valuation number b) the objectives that will be achieved by providing a remission c) documentation which proves the land which is the subject of the application is
Maori freehold land, including a schedule of owners.
Application for remission or postponement of rates on Maori freehold land should be made after the commencement of the rating year. Applications may be back dated. The council staff may apply for remission or postponement on behalf of the owners.
Remission or postponement, and the extent thereof is at the sole discretion of the council and may be cancelled or reduced at any time. The council will maintain a register of properties for which remission or postponement is granted. It will review this register annually and may:
a) add properties that comply b) remove properties where the circumstance has changed and they no longer apply.
Applications for remission under this part of the policy will be determined by officers of the council, acting under delegated authority from the council, as specified in the delegations resolution.
248
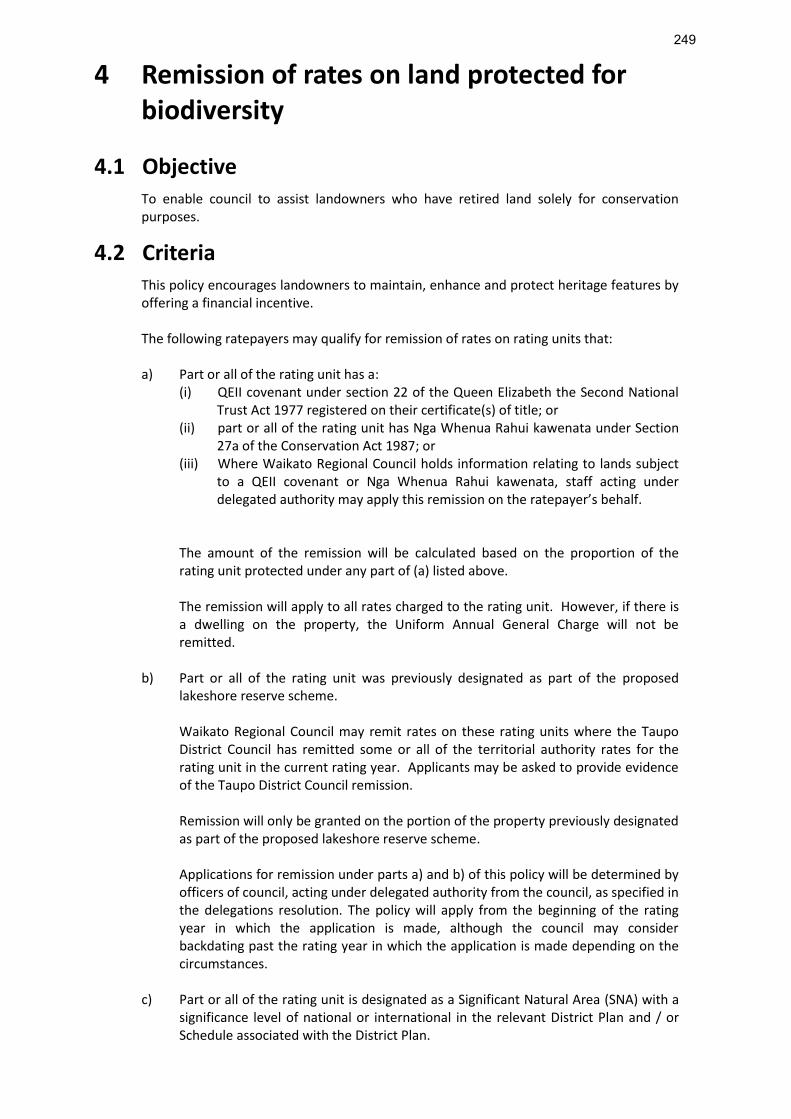
4 Remission of rates on land protected for biodiversity
4.1 Objective To enable council to assist landowners who have retired land solely for conservation purposes.
4.2 Criteria This policy encourages landowners to maintain, enhance and protect heritage features by offering a financial incentive.
The following ratepayers may qualify for remission of rates on rating units that:
a) Part or all of the rating unit has a:
(i) QEII covenant under section 22 of the Queen Elizabeth the Second National Trust Act 1977 registered on their certificate(s) of title; or
(ii) part or all of the rating unit has Nga Whenua Rahui kawenata under Section 27a of the Conservation Act 1987; or
(iii) Where Waikato Regional Council holds information relating to lands subject to a QEII covenant or Nga Whenua Rahui kawenata, staff acting under delegated authority may apply this remission on the ratepayer’s behalf.
The amount of the remission will be calculated based on the proportion of the rating unit protected under any part of (a) listed above. The remission will apply to all rates charged to the rating unit. However, if there is a dwelling on the property, the Uniform Annual General Charge will not be remitted.
b) Part or all of the rating unit was previously designated as part of the proposed
lakeshore reserve scheme. Waikato Regional Council may remit rates on these rating units where the Taupo District Council has remitted some or all of the territorial authority rates for the rating unit in the current rating year. Applicants may be asked to provide evidence of the Taupo District Council remission. Remission will only be granted on the portion of the property previously designated as part of the proposed lakeshore reserve scheme. Applications for remission under parts a) and b) of this policy will be determined by officers of council, acting under delegated authority from the council, as specified in the delegations resolution. The policy will apply from the beginning of the rating year in which the application is made, although the council may consider backdating past the rating year in which the application is made depending on the circumstances.
c) Part or all of the rating unit is designated as a Significant Natural Area (SNA) with a significance level of national or international in the relevant District Plan and / or Schedule associated with the District Plan.
249

A mechanism must be in place which provides for the enduring protection of the land concerned, such as:
a conservation covenant under section 77 of the Reserves Act 1977;
a declaration of protected private land under section 76 of the Reserves Act 1977;
a management agreement for conservation purposes under section 38 of the Reserves Act 1977;
a covenant for conservation purposes under section 27 of the Conservation Act 1987;
a management agreement for conservation purposes under section 29 of the Conservation Act 1987;
a covenant with the local council which has the effect of preserving the land for conservation purposes;
a Memorandum of Encumbrance linked to an Environmental Programme Agreement via the regional council;
any other covenant or agreement which in the opinion of Council provides enduring protection for the land.
Criteria Applications for remission under this provision must be made in writing by the ratepayer, and supported by the following documentation: (i) an aerial photograph or map of the area(s) that the remission is requested
for; and (ii) evidence of the legal protection mechanism; and (iii) evidence of fencing to exclude stock from the SNA. The remission will apply to all rates charged to the SNA area. However, if there is a dwelling on the property, the Uniform Annual General Charge will not be remitted. The council will delegate authority to approve applications for remission on SNAs to particular officers as set out in the council’s delegations resolution. Application for rates remissions must be made prior to the commencement of the rating year (1 July). Any applications made during a rating year will be considered for remission at the commencement of the following rating year. Any remissions granted will not be backdated. SNAs where remission is granted may be subject periodically to audit either by on the ground inspection or by analysis of aerial photography to ensure that the condition of the SNA is at least maintained and that stock proof fencing remains in place.
250

5 Remission of rates for Lake Taupo lakebed
5.1 Objectives
To continue to provide ratepayers with an incentive to maintain Lake Taupo in a natural state.
To recognise the special characteristics and value of Lake Taupo to the region.
5.2 Criteria and conditions
Remission is available to the Lake Taupo lakebed land where the title for that land is in private ownership and the owners recognise the significance of public access to the lake and environs and operate the land as if it was a public reserve.
One hundred per cent remission of all rates and charges shall be given to qualifying rating units.
Applications for remission under this policy will be determined by officers of council, acting under delegated authority from the council, as specified in the delegations resolution.
251

6 Remission of targeted rates for urban land in areas classified as rural, commercial or industrial areas
6.1 Objective To ensure that owners of residential rating units situated in areas classified as rural, commercial or industrial for the purposes of targeted rates are treated equitably with comparable rating units elsewhere in the district.
6.2 Criteria and conditions To qualify for consideration for remission under this part of the policy, the rating unit must be in an area zoned as ‘urban’ under the territorial authority district plan and have a targeted rate classification of rural, industrial or commercial.
Those ratepayers wishing to claim remission under this part of the policy must make an application in writing. Applications may be backdated.
The council will delegate authority to approve applications for remission of targeted rates for urban land in areas classified as rural, commercial or industrial areas to particular officers as set out in the council's delegations resolution.
Applications for remission under this part of the policy will be determined by officers of council, acting under delegated authority from the council, as specified in the delegations resolution. If an application is approved, the council will direct its valuation service provider or classifier to inspect the rating unit and prepare a report to determine what rate would be assessed if the rating unit were appropriately classified. This report shall be the basis on which remission shall be calculated. As a condition of approval the ratepayer may be required to contribute to the cost of this report. Ratepayers should note that the valuation service provider’s or classifier’s decision is final, as there are no statutory right of objection or appeal for remissions assessed in this way.
252

7 Remission of the Waihou/Piako scheme catchment rate
7.1 Objective Where land is still in its undeveloped state or has reverted to indigenous bush or swamp cover, or has been planted in exotic forests, it is considered to have a neutral effect on rates of rainfall runoff. In addition the land improves the biodiversity within the catchment and retention of this land use is encouraged by Council.
7.2 Criteria and Conditions Remission will be considered for a rating unit where areas of land are still in an undeveloped state and/or reverted to native bush or swamp cover and/or planted in exotic forest. This remission will be applied to the land value portion of the targeted catchment rate where the area is 10 hectares or more and stock excluded Applications must be made in writing and be supported by an aerial photograph or map of the area(s) that the remission is requested for. Applications for remission under this part of the policy will be determined by officers of council, acting under delegated authority from the council, as specified in the delegations resolution.
253

8 Remission of rates on rating units with a capital valuation of $1,000 or less
8.1 Objective To allow the council to act fairly, reasonably and efficiently where rating units have capital valuations of $1,000 or less.
8.2 Criteria and conditions Rating units that have a registered capital value of $1000 or less held in the District Valuation Roll as at 30 June for the current rating year are eligible for remission of rates.
The remission applied will be 100 per cent of all Waikato Regional Council Rates that have been assessed for the rating unit. Staff acting under delegated authority may apply this remission on the ratepayer’s behalf.
254

9 Remission of the Public Transport Rate
9.1 Objective To allow the council to act fairly and reasonably in applying the Public Transport rate differentials, reflecting the maximum benefit assessed as being received by property owners.
9.2 Criteria and conditions
Public Transport Indirect Benefit rate
A remission of a portion of the Public Transport Indirect Benefit rate will be granted to those properties with a capital value greater than $2.5 million, and which are only paying the indirect rate (that is they are located further than 800 metres of a bus route). The remission will be applied to the portion of the rate where the value exceeds $2.5 million. Remission will be applied by staff prior to the annual rates invoices being issued.
Public Transport Direct Benefit rate
A remission of the Public Transport Direct Benefit rate will be granted to those properties where:
There is no established footpath in place between their property and the nearest bus route, and
Where these residents are required to travel through an 80 kilometre per hour speed zone in order to reach the nearest bus route.
Those properties eligible for remission will be assessed by staff, based on information provided by Hamilton City Council, with the remission to be applied prior to the annual rates invoices being issued.
255

10 Rates postponement policy
10.1 Objective
To give ratepayers a choice between paying rates now or later subject to the full cost of
postponement being met by the ratepayer and the council being satisfied that the risk of loss in
any case is minimal.
10.2 General approach
Only rating units defined as residential and used for personal residential purposes by the
applicant(s) will be eligible for consideration of rates postponement under the criteria and
conditions of this policy.
Current and all future rates may be postponed indefinitely until the sale of the property, if at least
one ratepayer (or, if the ratepayer is a family trust, at least one named occupier) is 65 years of age
or older. Where the ratepayer is younger than 65, current and all future rates may be postponed
to a date not more than 15 years from 30 June in the rating year in which application is made.
Owners of units in retirement villages will be eligible provided that the council is satisfied
payment of postponed rates can be adequately secured.
The council will add to the postponed rates all financial and administrative costs to ensure
neutrality.
10.3 Criteria and conditions a) Criteria
i) Eligibility Any ratepayer is eligible for postponement provided that the rating unit is used by
the ratepayer for personal residential purposes (whether as a principal residence or as a holiday home). This includes, in the case of a family trust owned property, use by a named individual or couple. People occupying a unit in a retirement village under an occupation licence will be able to apply for postponement of the rates payable by the retirement village on their unit with the agreement of the owner of the retirement village.
ii) Risk The council must be satisfied, on reasonable assumptions, that the risk of any
shortfall when postponed rates and accrued charges are ultimately paid is negligible. To determine this, an actuary has been engaged to develop a model that will forecast expected equity when repayment falls due.
Where a ratepayer wishes to postpone both this council’s rates and those of another
territorial authority, council reserves the right to make actuarial calculations to include both authority rates to ensure a final 20 per cent equity is maintained. Each authority will make its own independent decision as to postponement and if any shortfall of payment should eventually occur, each authority will share on a pro rata basis.
iii) Insurance The property must be insured for its full value and evidence of this produced
annually.
256

If insurance is not available due to risk/hazard rating of the property, the insurance for the covered rates debt will be arranged by council under blanket cover that will be available in 2006/07. The premium will be added to the postponed rates. In the interim years no insurance will be required.
iv) Mortgage
Postponement of rates on a property subject to a mortgage will be available only if council holds a letter from the mortgagee agreeing to the postponement.
v) Independent advice Applicants will be referred to an appropriately qualified and trained independent agency. The agency will work with applicant to ensure they are aware of all aspects of the policy before deciding to proceed with postponement. Confirmation that this advice has been sought will be required by the council before postponement is granted.
vi) Security Postponed rates will be registered as a statutory land charge on the rating unit
title. This means that the council will have first call on the proceeds of any revenue from the sale or lease of the rating unit.
Postponement will not be granted if a statutory land charge cannot be registered on the rating unit title. Council has the right to decline postponement if the property is situated in a known hazard zone.
b) Conditions Any postponed rates (under this policy) will be postponed until:
i) The death of the ratepayer(s) or named individual or couple (in this case the council will allow up to 12 months for payment so that there is ample time available to settle the estate) or
ii) Until the ratepayer(s) ceases to be the owner or occupier of the rating unit (in
this case council, at its discretion, may allow up to 12 months for payment to allow time to make payment arrangements) or
iii) Until a date specified by the council.
c) Postponement of territorial authority and regional council rates
Where the ratepayer is seeking to postpone rates assessed by both the regional council and the territorial authority, the combined impact of the postponement must be considered when assessing the application against the criteria set out above. To give best effect to this, the council will work with the territorial authority to ensure that a single process is used to gather the information that will support the postponement application. The independent advice sought by the ratepayer will be required to consider the combined rates, and will be provided to both councils to assess prior to the approval of any postponement.
d) Fees Application fee
An application fee will be charged in accordance with the fees outlined in the Funding Impact Statement. This will be added to postponed rates.
257

Financial costs The financial cost will be charged in accordance with the rate outlined in the Funding
Impact Statement. This will be added to postponed rates. Payment The postponed rates or any part thereof may be paid at any time. The applicant may
elect to postpone the payment of a lesser sum than that which they would be entitled to have postponed pursuant to this policy.
e) Review or suspension of policy
The policy is in place indefinitely and can be reviewed subject to the requirements of the Local Government Act 2002 at any time. Any resulting modification will not change the entitlement of people already in the scheme in relation to previously postponed rates, however if the scheme was suspended the ratepayer would be required to pay future rates. The council reserves the right not to postpone any further rates once the total of postponed rates and accrued charges exceeds 80 per cent of the rateable value of the property as recorded in the council’s rating information database. This will require the ratepayer(s) for that property to pay all future rates but will not require any payment in respect of rates postponed up to that time. These will remain due for payment on death or sale. The policy consciously acknowledges that future changes in policy could include withdrawal of the postponement option.
f) Procedures
i) Applications must be on the required form that will be available from any council office.
ii) The policy will apply from the beginning of the rating year in which the application is
made, although the council may consider backdating past the rating year in which the application is made depending on the circumstances.
Applications for postponement under this part of the policy will be determined by officers of the council, acting under delegated authority from the council, as specified in the delegations resolution.
258
11 Remission of uncollectible rates
11.1 Objective To allow for situations where all practicable methods of enforcing rates collection have been
exhausted and it is in the Council's financial interests to remit such rates.
11.2 Criteria and conditions All rates both arrears and current including any targeted rates will be remitted where council
considers the objective will be achieved in so doing. This policy will be applied at council instigation.
Properties receiving a remission under this policy must be reviewed every year.
Decisions under this policy are delegated to officers as set out in the council’s Delegation Manual.
259

12 Remission of penalties
12.1 Objective The objective of this part of the remission policy is to enable the council to act fairly and reasonably in its consideration of rates that the council has not received by the penalty date.
12.2 Criteria and conditions Remission of a penalty charged on the current year’s rates will be considered where payment is made and provided the ratepayer has made no late payments for rates within the preceding rating year and either:
Payment of the full amount of the current year’s rates is received within four weeks of the penalty being charged, or
an agreed payment arrangement is put in place Where further rates are still outstanding, the ratepayer will be required to enter into a payment arrangement before any remission of penalties is considered. The council’s preferred method of payment is by way of direct debit authority. Where a payment arrangement is entered into through a direct debit authority, the council will consider the full remission of the latest penalties. For other payment arrangements made, a partial remission of the latest penalties will be considered. Any payment arrangement entered into must clear the rates due over a period of time agreed to by council staff. Applications for remission of penalties in excess of $250 must be made in writing. Applications for remissions of penalties of $250 or less may be made by telephone, email, in person at Waikato Regional Council’s Hamilton Office or in writing. Each application will be considered on its merits. The council will delegate authority to approve applications for remission of penalties to particular officers as set out in the council's delegations resolution.
260

13 General remission policy
13.1 Objective To give council the ability to consider individual circumstances based on principles of fairness and equity.
13.2 Criteria and conditions Remission of rates that do not fall within the definition of other remission policies may be granted at the discretion of the Group Manager, Finance having consideration of the individual circumstances of the property at the time the rates were struck and the fairness and equity of the remission request, provide that the approval of the remission must not set a precedent that unfairly disadvantages other ratepayers. Any remission granted under this policy will be reported to the Finance and Audit committee at the first opportunity.
261

14 Policy on early payment of rates Section 55 and 56 of the Local Government (Rating) Act 2002 empowers councils to accept early payment of rates.
Council proposes to accept payment of rates in anticipation of rates for subsequent financial years.
262