notice of amendment of the presentation of consolidated...
TRANSCRIPT

Notice of Amendment of the Presentation of Consolidated Financial Results for the Fiscal Year Ended March 31, 2015
Honda Motor Co., Ltd. (the “Company”) released on its website today the amendment of the presentation of consolidated financial results for the year ended March 31, 2015 released on April 28, 2015 to recognize the effects of subsequent events.
Particular
1. Subsequent Events
The Company and its consolidated subsidiaries have been conducting market-based measures in relation to airbag inflators, such as product recalls and a Safety Improvement Campaign. Due to factors arising since May 2015 such as an expansion of the scope of these market-based measures based on an agreement between our supplier and the U.S. National Highway Traffic Safety Administration, a change has arisen in the estimate relating to product warranty expenses as announced on June 12, 2015. The Company recognized the effects of the subsequent events in its consolidated financial results.
2. Amendment
Please refer to the underlined items of attached documents for the details of the amendment.

1
S660(Japan)
FY15 Financial Results
Honda Motor Co., Ltd.April 28, 2015

2
Topics
• - FY15 Consolidated Financial Results (U.S. GAAP)• - FY16 Consolidated Financial Forecast (IFRS)• - Dividend
Tetsuo IwamuraExecutive Vice President
3
10,000
11,000
12,000
13,000
5,000
5,500
6,000
8,000
9,000
10,000
11,000
3,000
3,200
3,400
3,600
11,842.4
12,646.7
0
200
400
600
800
1,000
750.2
606.8
0
200
400
600
800
1,000
574.1493.0
*1
Outline of FY15 Results Summary (Consolidated)
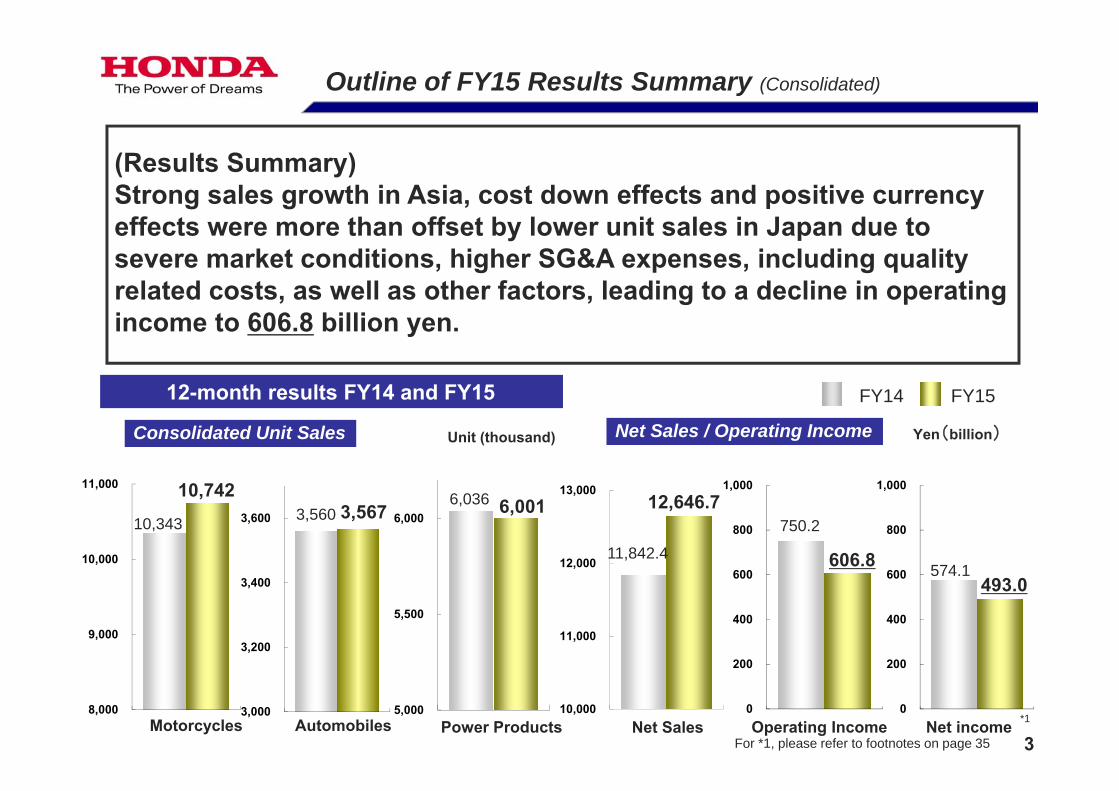
(Results Summary)Strong sales growth in Asia, cost down effects and positive currency effects were more than offset by lower unit sales in Japan due to severe market conditions, higher SG&A expenses, including quality related costs, as well as other factors, leading to a decline in operating income to 606.8 billion yen.
FY14 FY1512-month results FY14 and FY15
Consolidated Unit Sales Net Sales / Operating Income Yen(billion)
Net incomeMotorcycles Automobiles Net Sales Operating IncomePower ProductsFor *1, please refer to footnotes on page 35
10,7423,560 3,567
6,036 6,00110,343
Unit (thousand)

4
Honda GroupUnit Sales
12-Month Results
FY14 FY15 Change
Motorcycles 17,021 17,765 + 4.4%
Automobiles 4,323 4,364 + 0.9%
Power Products 6,036 6,001 - 0.6%
Consolidated Unit Sales
12-Month Results
FY14 FY15 Change
Motorcycles 10,343 10,742 + 3.9%
Automobiles 3,560 3,567 + 0.2%
Power Products 6,036 6,001 - 0.6%
13,000
15,000
17,000
19,000
4,000
4,250
4,500
5,000
5,500
6,000
6,000
8,000
10,000
12,000
3,000
3,200
3,400
3,600
3,800
17,02117,765
4,3234,364
6,036 6,001
10,34310,742
3,560 3,567
5,000
5,500
6,0006,036 6,001
FY15 Unit Sales Results
(thousand)
(thousand)
Honda Group Unit Sales FY14 FY15
Unit(thousand)
Power ProductsAutomobilesMotorcycles
Consolidated Unit Sales Unit(thousand)
Power ProductsAutomobilesMotorcycles
Honda Group Unit Sales-Increase in motorcycle unit sales in India, Indonesia and Vietnam more than offset decreases in S. America, Thailand -Increase in automobile unit sales due to the positive impact of new model introductions in Indonesia, India and China, which more than offset the negative impact of severe market conditions in Japan and Thailand

5
Financial Results 12 MonthsFY14 FY15 Change
Net sales 11,842.4 12,646.7 + 6.8%
Operating income 750.2 606.8 - 19.1%
Operating margin 6.3% 4.8% - 1.5pt
Income before income taxes 728.9 644.8 - 11.5%
Equity in income of affiliates 132.4 126.5 - 4.5%
Net income 574.1 493.0 - 14.1%
EPS (Yen) 318.54 273.54 - 45.00
*1
US Dollar 100 110 Yen down by 10 yen
Euro 136 139 Yen down by 3 yen
*2
10,000
11,000
12,000
13,000
0
200
400
600
800
1,000
0
200
400
600
800
1,000
0
200
400
600
800
1,000
0
200
400
600
800
1,000
11,842.4
12,646.7750.2
606.8728.9
644.8
132.4 126.5
574.1493.0
FY15 Financial Results (consolidated)
Yen (billion)
Average Rates (Yen)
(Financial Summary)-Revenue increased by 6.8% mainly due to increased revenue from motorcycle business operations, as well as favorable foreign currency translation effects.
-Operating income decreased by 19.1% due to an increase in SG&A expenses, including quality related costs, as well as the negative impact on income from volume and model mix despite a cost reduction contributionand positive favorable foreign currency effects.
Net Sales Operating Income Income before income taxes
Equity in incomeof affiliates Net Income
For *1 and *2, please refer to footnotes on page 35
Yen(billion)
FY14 FY15
*1For *1, please refer to footnotes on page 35

6
FY15Results
FY16Forecast
FY16Forecast
(Reference)Change
U.S. GAAP IFRS U.S. GAAP Amount %
Sales revenue 12,646.7 14,500.0 13,850.0 + 1,203.2 + 9.5%
Operating profits 606.8 685.0 660.0 + 53.1 + 8.8%
(as a percentage of sales revenue) 4.8% 4.7% 4.8% -Share of profit from investments accounted for using the equity method - 135.0 - - -
Profit before income taxes 644.8 805.0 650.0 + 5.1 + 0.8%
Equity in income of affiliates 126.5 - 140.0 + 13.4 + 10.6%
Profit for year attributable to owners of the parent 493.0 525.0 525.0 + 31.9 + 6.5%
Honda’s forecast for the year ending March 31, 2016 is based on IFRS.
*2
FY16 Financial Forecast (Consolidated)
Note 1
Note 2
Note 3
Note 4EPS (Yen) 273.54 291.30 291.30 + 17.76
US Dollar (Yen) 110 115 115 Yen down by5 yen
Euro (Yen) 139 125 125 Yen up by14 yen
Note 1: “Net sales and other operating revenue” in U.S. GAAP is stated as “Sales revenue”Note 2: “Equity in income of affiliates” in U.S. GAAP is stated as “Share of profit of investments accounted for under the equity method”Note 3: “Net income attributable to Honda Motor Co., Ltd.” in U.S. GAAP is stated as “Profit for the year attributable to owners of the parent”Note 4: “Basic net income attributable to Honda Motor Co., Ltd. Per common share” is stated as “Basic profit for the year attributable to owners of the parent
per common share”.
Average Rates (Yen)
Yen (billion)

7
Dividend per Share FY14 FY15Results
( Projection)
FY16(Expectation)
Increase/Decrease from
FY14
Increase/Decrease
fromFY15
1st Quarter End 20 22 + 2 ( 22 ) -
2nd Quarter End 20 22 + 2 ( 22 ) -
3rd Quarter End 20 22 + 2 ( 22 ) -
4th Quarter End 22 ( 22 ) - ( 22 ) -
Fiscal Year 82 ( 88 ) ( + 6 ) ( 88 ) -
Dividend(Yen)

8
Topics
• FY15 Financial Results (U.S. GAAP)- 4th Quarter Financial Results- Net Sales and Other Operating Revenue- Change in Income before Income Taxes- Business & Geographical Segment Information
- Equity in Income of Affiliates- Capital Expenditures
• FY16 Financial Forecast (IFRS)
Kohei TakeuchiManaging Officer and DirectorChief Financial Officer

9
1,000
2,000
3,000
4,000
1,500
1,700
1,900
2,100
2,000
2,500
3,000
500
700
900
2,779 933 915 1,9902,057
3,097.23,353.7
0
50
100
150
200
250
165.2
67.1
2,730
0
50
100
150
200
250
170.5
68.0
*1
Outline of FY15 4th Quarter Results Summary (Consolidated)
(Results Summary)Strong sales growth in Asia and positive currency effects were more than offset by lower unit sales in Japan due to severe market conditions, higher SG&A expenses, including quality related costs, as well as other factors, leading to a decline in operating income to 67.1billion yen.
Consolidated Unit Sales Net Sales / Operating Income
FY14 FY154th Quarter Results FY14 and FY15
Unit (thousand) Yen
(billion)
Motorcycles Automobiles Operating IncomePower products Net SalesFor *1, please refer to footnotes on page 35
Net Income

10
Honda GroupUnit Sales
4Q Results ( 3 Months)
FY14 FY15 Change
Motorcycles 4,500 4,615 + 2.6%
Automobiles 1,195 1,204 + 0.8%
Power Products 1,990 2,057 + 3.4%
ConsolidatedUnit Sales
4Q Results ( 3 Months)
FY14 FY15 Change
Motorcycles 2,730 2,779 + 1.8%
Automobiles 933 915 - 1.9%
Power Products 1,990 2,057 + 3.4%
3,000
3,500
4,000
4,500
5,000
900
1,000
1,100
1,200
1,300
1,300
1,600
1,900
2,200
2,000
2,200
2,400
2,600
2,800
3,000
700
800
900
1,000
4,5004,6151,195 1,204 1,990
2,057
2,730 2,779 933915
1,300
1,600
1,900
2,200
1,9902,057
FY15 4th Quarter Unit Sales Results
(Thousands)
(Thousands)
Unit(thousands)
FY14 FY15Honda Group Unit Sales
Consolidated Unit Sales Unit(thousands)
Power Products Automobiles Motorcycles
Power Products Automobiles Motorcycles
Honda Group Unit Sales- Increase in motorcycle unit sales due to strong growth in Asia and elsewhere despite a decrease in South America. - Increase in automobile unit sales due to higher sales in Asia and some other countries, while severe market conditions
led to a decrease in Japan.

6.5%
5.9%
7.6%
5.3%
6.6%
5.5% 5.4%
2.0%0%
2%
4%
6%
8%
1Q 2Q 3Q 4Q
FY2014FY2015
184.9 171.4
228.5
165.2
198.0 164.4 177.2
67.1
0
50
100
150
200
250
1Q 2Q 3Q 4Q
FY14FY15
11
Financial ResultsYen (billion)
4Q Results ( 3 Months )FY14 FY15 Change
Net sales 3,097.2 3,353.7 + 8.3%
Operating income 165.2 67.1 - 59.4%
Operating margin 5.3% 2.0% - 3.3pt
Income before income taxes 174.7 72.0 - 58.8%
Equity in income of affiliates 37.3 36.6 - 1.9%
Net income 170.5 68.0 - 60.1%
EPS (Yen) 94.61 37.77 - 56.84
*1
US Dollar 103 119 Yen down by 16 yen
Euro 141 134 Yen up by 7 yen
*2
FY15 4th Quarter Financial Results (Consolidated)
(Financial Summary)- Net sales and other operating revenue increased by 8.3% mainly due to a sales increase inmotorcycle business operations as well as the positive impact of foreign exchange effects, despite a sales decline in automobile businessoperations.-Operating income decreased by 59.4% mostly due to a rise in SG&A expenses, including quality related costs, a decline in income associated with a negative impact on sales volume and model mix, as well as other factors, despite positive currency effects.
Average Rates (Yen)
Operating Income Yen (billion)
For *1 and *2, please refer to footnotes on page 35
Operating Margin

( + 4.8 %) ( - 2.8 %)( + 3.3 %) ( + 6.5 %)
Excluding currency translation effects - 34.4 ( - 1.1 %)
3,097.2+ 21.5 - 67.6 + 6.2 + 5.3
+ 290.9 3,353.7
+ 256.4 ( + 8.3 %)
Net sales & other operating revenue FY14 4Q FY15 4Q
Motorcycles 448.5 514.5
Automobiles 2,378.2 2,524.7Financial Services Business 187.7 221.3Power Product &Other Businesses 82.6 93.0
Total 3,097.2 3,353.7Market average rates
US Dollar 103 119Euro 141 134
12
Net Sales and Other Operating Revenue <FY15 4th Qtr>
Yen (billion)
FY15 4QFY14 4Q
AutomobileBusiness
Financial ServicesBusiness
MotorcycleBusiness
Currency EffectsPower Product &
Other Businesses

( + 4.6 %) ( - 0.2 %) ( + 7.4%) ( - 0.6 %)
Excluding currency translation effects + 107.3 ( + 0.9 %)
11,842.4+ 77.1 - 19.4 + 51.5 - 1.8
+ 696.9 12,646.7
+ 804.2 ( + 6.8 %)
Net sales & other operating revenue
FY14 Twelve Months
FY15 Twelve Months
Motorcycles 1,663.6 1,824.1
Automobiles 9,176.3 9,693.2Financial Services Business 698.1 814.4Power Product &Other Businesses 304.2 314.8
Total 11,842.4 12,646.7Market average rates
US Dollar 100 110 Euro 134 139
13
Net Sales and Other Operating Revenue <FY15 Twelve Months>
Yen (billion)
AutomobileBusiness
Financial ServicesBusiness
MotorcycleBusiness
Currency Effects
Power Product &Other Businesses
FY14Twelve Months
FY15Twelve Months
14
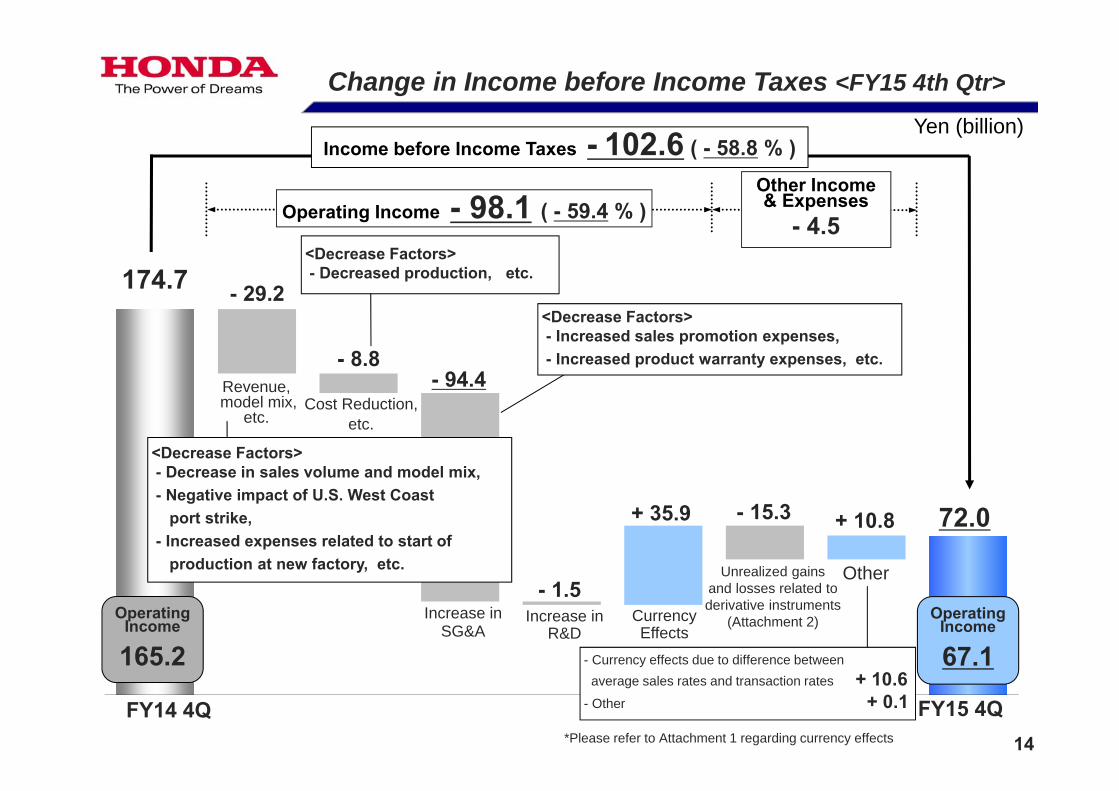
Income before Income Taxes - 102.6 ( - 58.8 % )
174.7
72.0
- 29.2
- 8.8- 94.4
- 1.5
+ 35.9 - 15.3 + 10.8
Operating Income - 98.1 ( - 59.4 % )Other Income& Expenses
- 4.5
Operating Income
165.2
Operating Income
67.1
Change in Income before Income Taxes <FY15 4th Qtr>
Yen (billion)
Revenue,model mix,
etc.Cost Reduction,
etc.
Increase inSG&A
Increase inR&D
CurrencyEffects
Unrealized gainsand losses related toderivative instruments
(Attachment 2)
Other
FY15 4QFY14 4Q*Please refer to Attachment 1 regarding currency effects
<Decrease Factors>- Decreased production, etc.
<Decrease Factors>- Increased sales promotion expenses, - Increased product warranty expenses, etc.
<Decrease Factors>- Decrease in sales volume and model mix, - Negative impact of U.S. West Coast
port strike, - Increased expenses related to start of
production at new factory, etc.
- Currency effects due to difference between average sales rates and transaction rates + 10.6
- Other + 0.1

15
Income before Income Taxes - 84.1 ( - 11.5 % )
644.8- 82.5
+ 34.4 - 156.6
- 17.7+ 79.0 - 34.3
+ 93.6
Operating Income - 143.4 ( - 19.1 % )
Other Income& Expenses
+ 59.2
728.9
Operating Income
750.2Operating
Income
606.8
Change in Income before Income Taxes <FY15 Twelve Months>
Yen (billion)
Revenue,model mix,
etc.
Cost Reduction,etc.
Increase inSG&A Increase in
R&DCurrencyEffects
Unrealized gainsand losses related toderivative instruments
(Attachment 2)
Other
FY14Twelve Months
FY15Twelve Months
<Increase Factors>- Cost reduction efforts, etc.<Decrease Factors>- Raw material price increase, - Increased depreciation costs, - Decreased production, etc.
<Decrease Factors>- Increased product warranty expenses, - Increased sales promotion expenses, etc.
<Decrease Factors>- Decrease in sales volume and model mix, - Increased sales incentives, - Changes of pension and post retirementprogram in North America vs. previous FY
- Increased expenses related to start of production at new factory, etc.
- Currency effects due to difference between average sales rates and transaction rates + 84.7
- Other + 8.8
*Please refer to Attachment 1 regarding currency effects

4,054 4,216 4,251
4,500 4,137
4,581 4,432
4,615
3,600
3,800
4,000
4,200
4,400
4,600
4,800
Japan 54 63 52 57 48 50 49 52North
America 62 68 63 83 62 69 69 85Europe 52 38 27 49 60 47 32 53
Asia 3,479 3,536 3,678 3,843 3,593 3,998 3,872 4,041Other
Regions 407 511 431 468 374 417 410 384Total 4,054 4,216 4,251 4,500 4,137 4,581 4,432 4,615
Activa (India)
16
+ 115( + 2.6 % )
Motorcycle - Honda Group Unit Sales(Motorcycles + All-Terrain Vehicles, etc.)
<ASIA>- India: Increased sales of Activa Series, positive impact of
CB Unicorn 160 and CD110 Dream launches- Indonesia: Increased sales of BeAT-FI, Vario FI and other
models
<Other Regions>- Brazil: Decreased sales of CG125 FAN and other models
Unit (Thousand)
1Q 2Q 3Q 4Q 1Q 2Q 3Q 4QFY14 FY15

42.5 45.5 34.5 42.9 43.9 38.1 53.5 45.6
10.7% 10.9%
8.6%9.6%
10.8%
8.7%
11.6%
8.9%
-4%
-2%
0%
2%
4%
6%
8%
10%
12%
14%
0
30
60
90
120
150
FY14 FY151Q 2Q 3Q 4Q 1Q 2Q 3Q 4Q
Honda GroupUnit Sales
(Consolidated Unit Sales)
4,054(2,371)
4,216(2,585)
4,251(2,657)
4,500(2,730)
4,137(2,457)
4,581(2,743)
4,432(2,763)
4,615(2,779)
Net Sales 396.8 418.0 400.1 448.5 407.7 438.3 463.4 514.5( + 14.7 % )
( + 6.2 % )
17
Motorcycle Business Net Sales/Operating Income (Margin)
Unit (thousand)Yen (billion)
Operating IncomeOperating Margin
Yen (billion)
+ 66.0 (Currency effect + 44.4)
1Q 2Q 3Q 4Q 1Q 2Q 3Q 4QFY14 FY15
<Increase Factors>- Increase in sales volume and model mix, - Positive currency effect, etc
<Decrease Factors>- Increased SG&A expenses, etc.
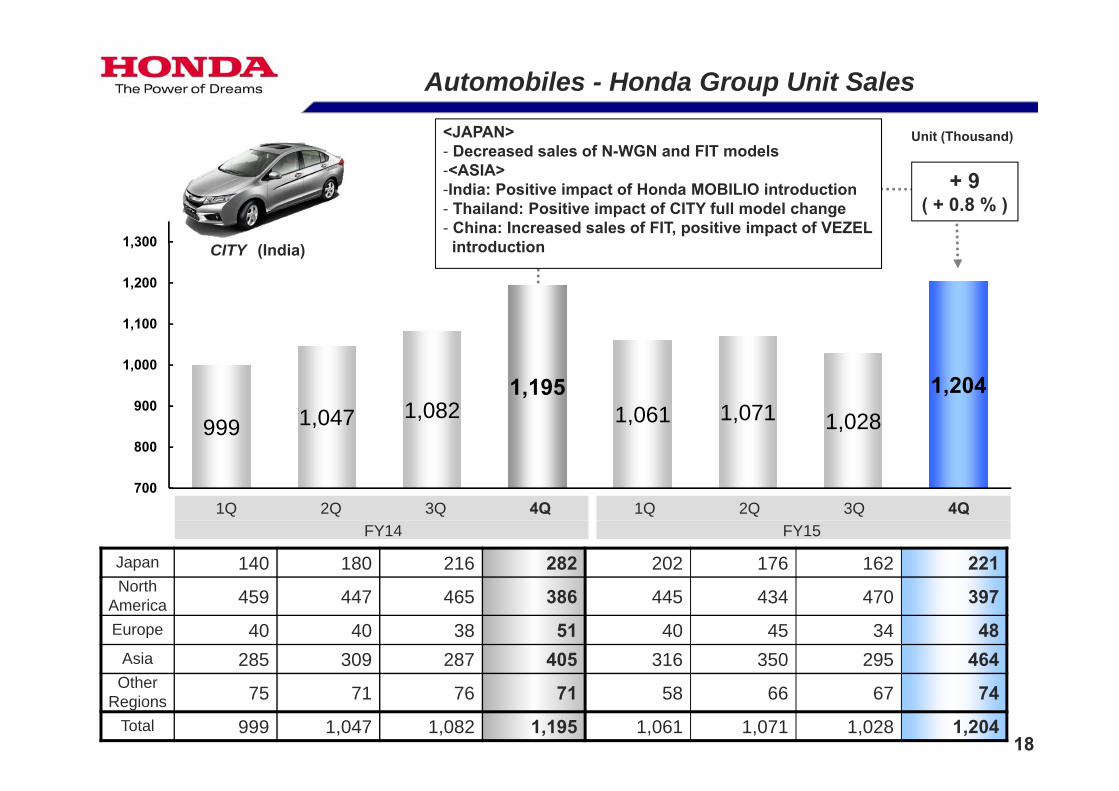
999 1,047 1,082 1,195
1,061 1,071 1,028 1,204
700
800
900
1,000
1,100
1,200
1,300
Japan 140 180 216 282 202 176 162 221North
America 459 447 465 386 445 434 470 397Europe 40 40 38 51 40 45 34 48
Asia 285 309 287 405 316 350 295 464Other
Regions 75 71 76 71 58 66 67 74Total 999 1,047 1,082 1,195 1,061 1,071 1,028 1,204
+ 9( + 0.8 % )
18
CITY (India)
Automobiles - Honda Group Unit Sales
Unit (Thousand)<JAPAN>- Decreased sales of N-WGN and FIT models-<ASIA>-India: Positive impact of Honda MOBILIO introduction- Thailand: Positive impact of CITY full model change- China: Increased sales of FIT, positive impact of VEZEL
introduction
1Q 2Q 3Q 4Q 1Q 2Q 3Q 4QFY14 FY15

96.3 80.1 154.2
72.9 99.8 79.1 76.4 - 23.9
4.4%3.6%
6.5%
3.1%4.3%
3.4% 3.0%
-0.9%-2%
0%
2%
4%
6%
8%
-100
0
100
200
300
400
( + 6.3 % )
FY14 FY151Q 2Q 3Q 4Q 1Q 2Q 3Q 4Q
Honda GroupUnit Sales
(Consolidated Unit Sales)
999(858)
1,047(869)
1,082(900)
1,195(933)
1,061(895)
1,071(880)
1,028(877)
1,204(915)
Net Sales 2,200.9 2,233.1 2,377.7 2,383.0 2,323.7 2,316.4 2,549.1 2,534.1
19
Automobile Business Net Sales/Operating Income (Margin)
Unit (thousand)Yen (billion)
+ 151.1 (Currency effect + 214.1)
Operating IncomeOperating Margin
Yen (billion)
1Q 2Q 3Q 4Q 1Q 2Q 3Q 4QFY14 FY15
<Increase Factors>- Positive currency impact, etc.
<Decrease Factors>- Increased SG&A expenses, - Change in sales volume and model mix, - Negative impact of U.S. West Coast port strike, - Increased expenses related to start of production at a
new factory, - Decreased production, etc.

1,589 1,295 1,162
1,990 1,510 1,286 1,148
2,057
0
500
1,000
1,500
2,000
2,500
Japan 63 93 63 95 68 85 83 102North
America 828 504 427 959 773 497 423 1,005Europe 237 156 198 441 240 191 197 465
Asia 364 426 338 372 336 410 304 353Other
Regions 97 116 136 123 93 103 141 132Total 1,589 1,295 1,162 1,990 1,510 1,286 1,148 2,057
+ 67( + 3.4 % )
20
GCV160( Engine )
Power Products - Honda Group Unit Sales
Unit (Thousand)<NORTH AMERICA>- Increased sales of high pressure washers and OEM
lawn mower engines- Increased sales of lawn mowers
<EUROPE>-Increased sales of lawn mower OEM engines
1Q 2Q 3Q 4Q 1Q 2Q 3Q 4QFY14 FY15

1.3 -0.8
-2.8 0.5
2.3 -1.0
-3.8 -4.5
1.7%
-1.1%
-3.7%
0.7%
3.1%
-1.4%-4.8% -4.7%
-5%
0%
5%
10%
-100
0
100
200( + 11.4 % )
21
FY14 FY151Q 2Q 3Q 4Q 1Q 2Q 3Q 4Q
Honda GroupUnit Sales
(Consolidated Unit Sales)
1,589(1,589)
1,295(1,295)
1,162(1,162)
1,990(1,990)
1,510(1,510)
1,286(1,286)
1,148(1,148)
2,057(2,057)
Net Sales 77.9 75.9 78.6 85.6 77.0 75.4 79.8 95.3
Power Product & Other Businesses Net Sales/Operating Income (Margin)
Unit (thousand)Yen (billion)
+ 9.7 (Currency effect + 5.0) Operating IncomeOperating Margin
Yen (billion)
1Q 2Q 3Q 4Q 1Q 2Q 3Q 4QFY14 FY15
<Decrease Factors>- Increased expenses related to other businesses, - Negative currency translation effects, etc.
-10
10

FY14 FY151Q 2Q 3Q 4Q 1Q 2Q 3Q 4Q
Total Assets of Finance
Subsidiaries7,206.8 7,404.6 8,082.7 7,980.9 8,009.0 8,659.0 9,457.4 9,340.9
Net Sales 167.9 172.5 177.6 190.4 189.3 195.6 216.3 225.2
44.6 46.5 42.7 48.8 51.8 48.2 51.0 50.0
26.6% 27.0%24.0% 25.6%
27.4% 24.7%23.6% 22.2%
-20%
-10%
0%
10%
20%
30%
40%
0
200
400
600
800
1,000
1,200( + 18.3 % )
( + 2.5 % )
22
Yen (billion)
Financial Services BusinessTotal Assets/Net Sales/Operating Income (Margin)
Operating IncomeOperating Margin
Yen (billion) + 34.8 (Currency effect + 27.3)
1Q 2Q 3Q 4Q 1Q 2Q 3Q 4QFY14 FY15
<Increase Factors>- Positive currency effects, etc.
<Decrease Factors>- Increased expenses related to lease residual values, etc.
80
60
40
20

23
FY14 FY15 Change FY14 FY15 Change FY14 FY15 Change
Japan 226 199 - 27 818 761 - 57 314 338 + 24North
America 276 285 + 9 1,757 1,746 - 11 2,718 2,698 - 20Europe 166 192 + 26 169 167 - 2 1,032 1,093 + 61
Asia 14,536 15,504 + 968 1,286 1,425 + 139 1,500 1,403 - 97Other
Regions 1,817 1,585 - 232 293 265 - 28 472 469 - 3Total 17,021 17,765 + 744 4,323 4,364 + 41 6,036 6,001 - 35
17,021 17,765 4,323 4,364 6,036 6,001
+ 744( + 4.4 %)
+ 41( + 0.9 %)
- 35( - 0.6 %)
Honda Group Unit Sales <Twelve Months>
AutomobilesMotorcycles Power Products
Unit(Thousand)
FY15FY14 FY15FY14 FY15FY14

24
165.6
403.7
-1.7182.7181.3
231.4
-7.0201.1
-1,000
0
1,000
2,000
3,000
4,000
5,000
+ 9.5 % + 10.1 %
(10.0 %)
(4.4 %)
(- 0.6 %)
(25.8 %)
(- 2.2 %)
(24.3%)(2.4 %)(9.9%)
- 42.7 %
Net Sales/Operating Income (Margin) by Business Segment <FY15 Twelve Months >
Motorcycle Business
Automobile Business
Power Product & Other Businesses
Financial Services Business
Twelve Months Twelve Months Twelve Months Twelve MonthsFY14 FY15 FY14 FY15 FY14 FY15 FY14 FY15
Honda GroupUnit Sales
(Consolidated Unit Sales)
1,702.1 1,776.5 432.3 436.4 603.6 600.1 - -
(1,034.3) (1,074.2) (356.0) (356.7) (603.6) (600.1) (-) (-)
Net Sales 1,663.6 1,824.1 9,194.9 9,723.5 318.1 327.6 708.5 826.5
Operating Income : Yen (billion) Operating Margin : (%)
Twelve Months Twelve Months Twelve Months Twelve Months
FY14 FY15 FY14 FY15 FY14 FY15 FY14 FY15
Unit (thousand)Yen (billion)
500
400
300
200
100

25
43.2 41.8
14.9
54.0
12.9
-3.2 -4.8 -5.7
64.1
3.9
-200
0
200
400
600
800
1,000
Japan North America Europe Asia Other
Regions4Q 4Q 4Q 4Q 4Q
FY14 FY15 FY14 FY15 FY14 FY15 FY14 FY15 FY14 FY15
Net Sales 1,109.1 1,020.1 1,405.3 1,658.0 244.0 196.9 748.2 933.1 260.3 252.0
+ 18.7 % - 69.6 %
Yen (billion)
Operating Income : Yen (billion) Operating Margin : (%)
4Q 4Q 4Q 4Q 4Q
FY14 FY15 FY14 FY15 FY14 FY15 FY14 FY15 FY14 FY15
Net Sales/Operating Income (Margin) by Geographical Segment <FY15 4th Qtr>
100
80
60
40
20
-20

Japan North America Europe Asia
Other Regions
Twelve Months Twelve Months Twelve Months Twelve Months Twelve Months
FY14 FY15 FY14 FY15 FY14 FY15 FY14 FY15 FY14 FY15
Net Sales 4,192.2 3,937.4 5,969.9 6,527.3 775.2 740.9 2,826.9 3,290.7 1,025.5 943.6
26
214.0 290.9
-17.1
217.9
44.9 160.8 183.7
-18.8
271.330.7
-1,000
0
1,000
2,000
3,000
4,000
- 24.9 % - 36.8 % + 24.5 % - 31.6 %
Net Sales/Operating Income (Margin) by Geographical Segment <FY15 Twelve Months>
Yen (billion)
Twelve Months Twelve Months Twelve Months Twelve Months Twelve Months
FY14 FY15 FY14 FY15 FY14 FY15 FY14 FY15 FY14 FY15
Operating Income : Yen (billion) Operating Margin : (%)
200
100
27
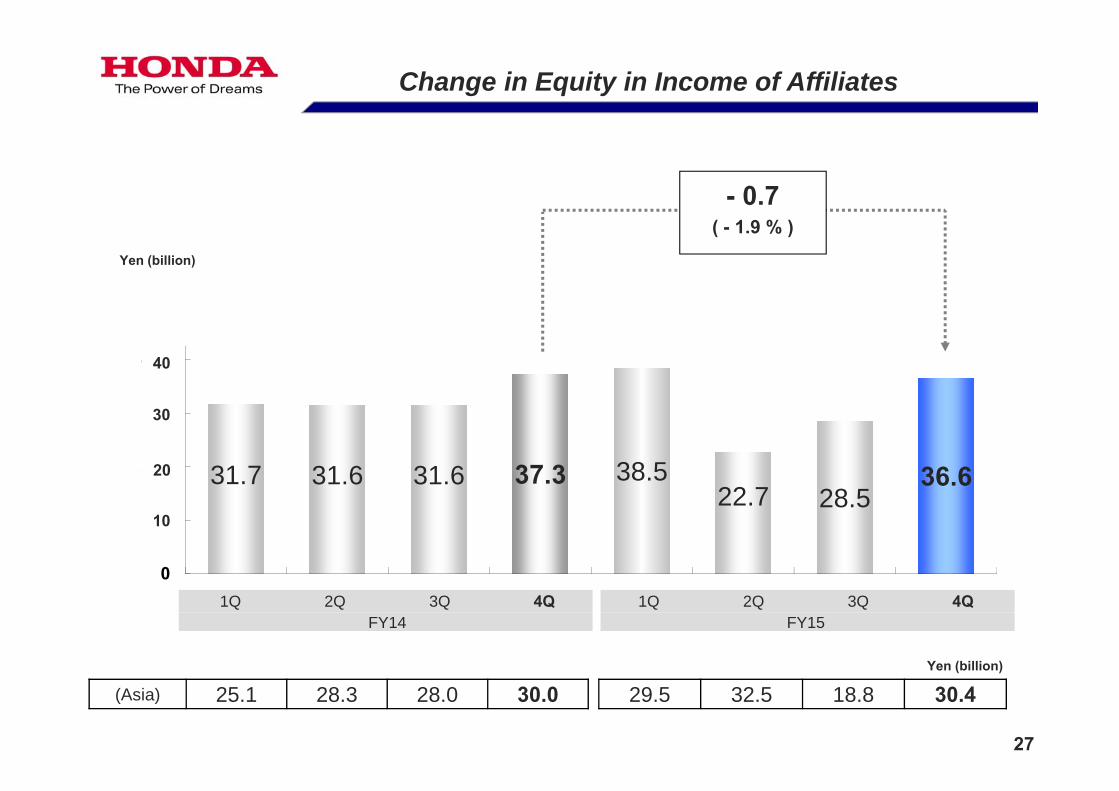
31.7 31.6 31.6 37.3 38.522.7 28.5
36.6
0
100
200
300
400
500
600
700 - 0.7( - 1.9 % )
(Asia) 25.1 28.3 28.0 30.0 29.5 32.5 18.8 30.4
Change in Equity in Income of Affiliates
Yen (billion)
1Q 2Q 3Q 4Q 1Q 2Q 3Q 4QFY14 FY15
Yen (billion)
40
30
20
10

28
- 105.5726.1 + 5.6
- 0.2 - 3.6+ 35.5 657.9
- 68.2 ( - 9.4 % )
Capital Expenditure FY14 Twelve Months
FY15 Twelve Months
Motorcycle Business 55.5 64.4Automobile Business 656.4 582.3Financial Services Business 0.6 0.4Power Product & Other Businesses 13.5 10.6
Total 726.1 657.9Market average ratesUS Dollar 100 110 Euro 134 139
Excluding currency translation effects - 103.7 ( - 14.3 % )
Yen (billion)
Consolidated Capital Expenditures <FY15 Twelve Months>
MotorcycleBusiness
AutomobileBusiness
FinancialServicesBusiness
Power Product & Other Businesses
Currency Translation
Effects
FY14Twelve Months
FY15Twelve Months
•Capital expenditures in results aforementioned exclude investment inoperating leases, capital leases and intangible assets

29
• FY15 Financial Results (U.S. GAAP)- 4th Quarter Financial Results- Net Sales and Other Operating Revenue- Change in Income before Income Taxes- Business & Geographical Segment Information
- Equity in Income of Affiliates- Capital Expenditures
• FY16 Financial Forecast (IFRS)
Topics

2014年度実績
米国会計基準
2015年度見通しIFRS
2015年度見通し(参考
値)米国会計基準
2014年度実績
米国会計基準
2015年度見通しIFRS
2015年度見通し(参考
値)米国会計基準
2014年度実績
米国会計基準
2015年度見通しIFRS
2015年度見通し(参考
値)米国会計基準
Japan 199 200 200 761 740 740 338 340 340North
America 285 325 325 1,746 1,890 1,890 2,698 2,880 2,880
Europe 192 190 190 167 160 160 1,093 1,090 1,090
Asia 15,504 16,065 15,925 1,425 1,655 1,605 1,403 1,570 1,560Other
Regions 1,585 1,445 1,455 265 270 260 469 480 480
Total 17,765 18,225 18,095 4,364 4,715 4,655 6,001 6,360 6,350
17,765 18,095 4,364 4,6556,001 6,350
18,225 4,7156,360
FY15ResultsU.S. GAAP
FY16Forecast
IFRS
FY16ForecastU.S. GAAP(Reference)
FY16 Forecast: Honda Group Unit Sales
AutomobilesMotorcycles Power Products
Unit(Thousand)
FY15ResultsU.S. GAAP
FY16Forecast
IFRS
FY16ForecastU.S. GAAP(Reference)
FY15ResultsU.S. GAAP
FY16Forecast
IFRS
FY16ForecastU.S. GAAP(Reference)
30

2014年度実績
米国会計基準
2015年度見通しIFRS
2015年度見通し(参考
値)米国会計基準
2014年度実績
米国会計基準
2015年度見通しIFRS
2015年度見通し(参考
値)米国会計基準
2014年度実績
米国会計基準
2015年度見通しIFRS
2015年度見通し(参考
値)米国会計基準
Japan 199 200 200 752 690 735 338 340 340North
America 285 325 325 1,746 1,890 1,890 2,698 2,880 2,880
Europe 192 190 190 167 160 160 1,093 1,090 1,090
Asia 8,481 8,915 8,910 637 705 705 1,403 1,570 1,560
Other Regions 1,585 1,445 1,455 265 270 260 469 480 480
Total 10,742 11,075 11,080 3,567 3,715 3,750 6,001 6,360 6,350
10,742 11,080 3,567 3,75011,075 3,7156,001 6,3506,360
FY15ResultsU.S. GAAP
FY16Forecast
IFRS
FY16ForecastU.S. GAAP(Reference)
FY15ResultsU.S. GAAP
FY16Forecast
IFRS
FY16ForecastU.S. GAAP(Reference)
FY15ResultsU.S. GAAP
FY16Forecast
IFRS
FY16ForecastU.S. GAAP(Reference)
AutomobilesMotorcycles Power Products
Unit(Thousand)
FY16 Forecast: Consolidated Unit Sales
31

32
FY15Results
FY16Forecast
FY16Forecast
(Reference)Change
U.S. GAAP IFRS U.S. GAAP Amount %
Sales revenue 12,646.7 14,500.0 13,850.0 + 1,203.2 + 9.5%
Operating profits 606.8 685.0 660.0 + 53.1 + 8.8%
(as a percentage of sales revenue) 4.8% 4.7% 4.8% -Share of profit from investments accounted for using the equity method - 135.0 - - -
Profit before income taxes 644.8 805.0 650.0 + 5.1 + 0.8%
Equity in income of affiliates 126.5 - 140.0 + 13.4 + 10.6%
Profit for year attributable to owners of the parent 493.0 525.0 525.0 + 31.9 + 6.5%
Honda’s forecast for the year ending March 31, 2016 is based on IFRS.
*2
FY16 Financial Forecast (Consolidated)
Note 1
Note 2
Note 3
Note 4EPS (Yen) 273.54 291.30 291.30 + 17.76
US Dollar (Yen) 110 115 115 Yen down by5 yen
Euro (Yen) 139 125 125 Yen up by14 yen
Note 1: “Net sales and other operating revenue” in U.S. GAAP is stated as “Sales revenue”Note 2: “Equity in income of affiliates” in U.S. GAAP is stated as “Share of profit of investments accounted for under the equity method”Note 3: “Net income attributable to Honda Motor Co., Ltd.” in U.S. GAAP is stated as “Profit for the year attributable to owners of the parent”Note 4: “Basic net income attributable to Honda Motor Co., Ltd. Per common share” is stated as “Basic profit for the year attributable to owners of the parent
per common share”.
Average Rates (Yen)
Yen (billion)

33
Income before Income taxes + 5.1 ( + 0.8 % )
644.8
805.0+ 167.3+ 60.0 - 45.2
- 44.0- 85.0
- 47.9
+ 155.0
Operating Income + 53.1 ( + 8.8 % )
FY15Results
U.S. GAAP
Operating Income
685.0
Operating Income
606.8
FY16Forecast
U.S. GAAP(Reference)
FY16Forecast
IFRS
Operating Income
660.0
650.0
・Operating Income + 25.0 ・Reclassification of Equity inincome of affiliates + 135.0
・Others - 5.0
(Attachment 4)
・Unrealized gains and losses related to derivative instruments - 17.0
・Others - 30.9
・JPY / USD + 69.0・USD / Others - 106.0( BRL, CAD, MXN)・Others - 48.0
FY16 Forecast: Change in Income before Income Taxes
Yen (billion)
Revenue,model mix,
etc.
Cost Reduction, etc.
Increase inSG&A Increase in
R&DCurrency Effects
Other GAAP differences

34
FY15Results
FY16Forecast
FY16Forecast
(Reference)
Change(vs. FY15)
U.S. GAAP IFRS U.S. GAAP
Capitalexpenditures * 657.9 670.0 670.0 + 12.0
Depreciation andamortization * 408.3 455.0 455.0 + 46.6
Research and developmentexpenditures ** 662.6 720.0 710.0 + 47.3
FY16 Forecast: Capital Expenditures, Depreciation and R&D
* Capital expenditures as well as Depreciation and amortization in results and forecast aforementioned exclude investment in operating leases, capital leases and intangible assets
** Research and development expenditures are research and development activity related costs incurred during the reporting period and are inconformity to "Research and development" on our Consolidated Statement of Income in accordance with U.S. GAAP. In accordance with IFRS, however, a portion of research and development expenditures is recognized as an intangible asset and amortized over its estimated useful life. As such, this amount is not in conformity to "Research and development" on our Consolidated Statement of Income
Yen (billion)

Caution with Respect to Forward-Looking Statements:This slide contains forward-looking statements about the performance of Honda, which are based on management’s assumptions and beliefs taking into account information currently available to it. Therefore, please be advised that Honda’s actual results could differ materially from those described in these forward-looking statements as a result of numerous factors, including general economic conditions in Honda’s principal markets and foreign exchange rates between the Japanese yen and the U.S. dollar, theEuro and other major currencies, as well as other factors detailed from time to time.Accounting standards: Our consolidated financial results for FY15 were prepared in conformity with U.S. Generally Accepted Accounting Principles and the Financial Forecast for FY16 was prepared in conformity with International Financial Reporting Standards.Notice on the Factors for Increases and Decreases in Income:With respect to the discussion above of the change in operating income, management has identified the factors set forth below and used what it believes to be a reasonable method to analyze the respective changes in such factors. Each of these factors is explained below. Management has analyzed changes in these factors at the levels of the Company and its material consolidated subsidiaries.(1)“Foreign currency effects” consist of translation adjustments, which come from the translation of the currency of foreignsubsidiaries’ financial statements into Japanese Yen, and foreign currency adjustments, which result from foreign-currency-denominated sales, which, at the levels of the Company and those consolidated subsidiaries which have been analyzed, primarilyrelate to the following currencies: U.S. dollar, Canada dollar, Euro, GBP, BRL and Japanese Yen.(2) With respect to “cost reduction and effects of raw material cost fluctuations”, management has analyzed cost reduction andeffects of raw material cost fluctuations at the levels of the Company and its material foreign manufacturing subsidiaries in NorthAmerica, Europe and other regions.(3) With respect to “changes in net sales and model mix”, management has analyzed changes in sales volume and in the mix ofproduct models sold in major markets which have resulted in increases/decreases in profit, as well as certain other reasons forincreases/decreases in net sales and cost of sales.(4) With respect to “selling, general and administrative expenses”, management has analyzed reasons for an increase/decrease inselling, general and administrative expenses from the previous fiscal year net of currency translation effects.(5) With respect to “research and development expenses”, management has analyzed reasons for an increase/decrease in researchand development expenses from the previous fiscal year net of currency translation effects.
*1 Net income attributable to Honda Motor Co., Ltd.*2 : “Basic net income attributable to Honda Motor Co., Ltd. Per common share” in U.S. GAAP is stated as “Basic profit for the year attributable to owners of
the parent per common share” in IFRSEPS is calculated based on weighted average number of shares outstanding as shown below: - Fiscal Year FY14: 1,802,294,000 (approx), FY15: 1,802,289,000 (approx) (page 5)- 4th Quarter FY14: 1,802,291,000 (approx), FY15: 1,802,287,000 (approx) (page 11)- Fiscal Year FY15: 1,802,289,000 (approx), FY16: 1,802,286,000 (approx) (pages 6 and 32) 35

36

37
FY154Q
FY15Twelve Months
Average Rates (Yen)FY144Q
FY154Q
Change
JPY / USD + 20.1 103 119 Yen down by16 yen + 43.1
JPY / Euro + 0.1 141 134 Yen up by7 yen + 1.6
JPY / Others + 3.1 ― ― ― + 5.5Transactions between other
currencies - 16.5 ― ― ― - 53.7 Difference of average rates *1
(Impact on Operating income) + 6.8 *1:Impact of YoY difference of FOREX to be used for booking revenue of foreign currency transactions - 3.6
Difference between transaction *2 rates and average sales rates (Impact on Other income & expenses)
+ 10.6 *2:Impact of YoY difference between average FOREX and hedge rates during the period + 84.7
Currency effect associated with sales transactions + 17.4 + 81.1
Currency effect from translation of foreign financial statements (impact on Operating income) *3
+ 29.1*3:Effect due to the difference of the rate used for
translating Honda’s overseas subsidiaries’ financial statements denominated in foreign currencies into Japanese yen with the corresponding period of the fiscal year
+ 82.6
Total + 46.5 + 163.7
- Currency Effects -(effects associated with sales transactions and translation effects)
(Attachment 1)
Yen (billion)

38
4Q Twelve Months
FY14 FY15 Change FY14 FY15 Change
Foreigncurrencyforward
+ 11.4 + 2.3 - 9.1 + 49.6 + 0.5 - 49.1
Interest rate swap /
Currency swap+ 3.2 - 3.1 - 6.4 - 10.2 + 4.1 + 14.3
Others - 0.0 + 0.2 + 0.2 - 0.0 + 0.3 + 0.3
Total + 14.7 - 0.6 - 15.3 + 39.3 + 4.9 - 34.3
- Unrealized Gains and Losses Related to Derivative Instruments -(Attachment 2)
Yen (billion)

39
+ 899.8 - 525.8
- 242.1 + 90.71,148.6
1,371.1
Net change + 222.5
+ 855.9 - 750.5
- 206.1 + 69.31,180.0 1,148.6
Free cash flow + 105.4
Net change - 31.4
Net income + 405.3Equity in income of affiliates
- 126.5Depreciation + 488.1Other + 132.8
Net Cash639.7
Net Cash583.2
Net Cash783.4
Net Cash583.2
Capital expenditures*1 - 770.0Other + 19.5
Dividends paid - 142.3Others - 63.7
Net income + 492.7Equity in income of affiliates
- 132.4Depreciation + 440.0Other + 55.6
Capital expenditures*1 - 719.1Other + 193.2
Dividends paid - 158.6Others - 83.5
Free cash flow+ 373.9
- Cash Flows of Non-financial Services Businesses -(Attachment 3)
Yen (billion)FY14 Twelve Months
FY15 Twelve Months
Cash flows fromoperating activities
Cash flows from investing activities Cash flows from
financing activitiesEffect of exchange rate changes on
cash and cash equivalents
Cash & cash equivalents at end of FY13
Cash & cash equivalents at end of FY14*1 This includes purchases of intangible assets
Cash & cash equivalents end of FY14
Cash & cash equivalents at end of FY15*1 This includes purchases of intangible assets
Cash flows fromoperating activities
Cash flows from investing activities Cash flows from
financing activitiesEffect of exchange rate changes on
cash and cash equivalents

40
Capitalized developmentcost
Post-employment benefits
Others(Operating income)
Reclassification of Equity in income
of affiliates
650.0
805.0+ 50.0 - 23.0 - 2.0
+ 135.0
Income beforeincome taxes
FY16 ForecastU.S. GAAP
(Reference)
Sales Revenue14,500.0
Net Sales13,850.0
Operating income + 25.0 ( + 3.8 % )
Income before income taxes + 155.0 ( + 23.8 % )
Operating Profit
685.0
Operating Income
660.0
0Disposal of equipment
held for rentalSales revenue / Cost of Sales
Gross basis
- 5.0
+ 650.0 ( + 4.7 % )
Disposal of equipment held for rentalSales revenue / Cost of Sales Gross basis + 630.0Others (Unification of the reporting period etc.) + 20.0
【 Major difference 】・ Unification of the reporting period・ Others
Yen (billion)
(Attachment 4)- Impact of Accounting Standard on FY16 Forecast (Consolidated) -
Profit beforeincome taxes
FY16 ForecastIFRS
Others

41
FY14Results
FY15Results
FY16Forecast
Increase /Decrease from
FY14
Increase /Decrease from
FY15
Net sales 3,488.3 3,331.1 - 4.5% 3,500.0 + 5.1%
Operatingincome 125.6 96.3 - 23.3% 70.0 - 27.3%
Operatingmargin 3.6% 2.9% - 0.7pt 2.0% - 0.9pt
Ordinaryincome 345.9 347.6 + 0.5% 325.0 - 6.5%
Net income 262.9 264.6 + 0.7% 255.0 - 3.7%
US Dollar 100 110 Yen down by10 yen 115 Yen down by
5 yen
Euro 136 139 Yen down by3 yen 125 Yen up by
14 yen
- FY15 Financial Results andFY16 Financial Forecast (Unconsolidated) -
(Attachment 5)
Yen (Billion)
Average Rates (Yen)