notes to the accounts - greenekingreports.com from items that will never ... the amendment has...
TRANSCRIPT

Annual report 2014 GREENE KING PLCwww.greeneking.co.uk
Corporate governanceStrategic report Financial statements
1 Accounting policiesCorporate informationThe consolidated financial statements of Greene King plc for the 53 weeks ended 4 May 2014 were authorised for issue by the board of directors on 2 July 2014. Greene King plc is a public limited company incorporated and domiciled in England and Wales. The company’s shares are listed on the London Stock Exchange.
Statement of complianceThe group’s financial statements have been prepared in accordance with International Financial Reporting Standards (IFRS) as adopted by the EU as they apply to the financial statements of the group for the 53 weeks ended 4 May 2014 (prior year 52 weeks ended 28 April 2013) and in accordance with the provisions of the Companies Act 2006.
Basis of preparationThe consolidated financial statements have been prepared in accordance with those parts of the Companies Act 2006 applicable to companies reporting under IFRS. They are presented in pounds sterling, with values rounded to the nearest hundred thousand, except where otherwise indicated.
Basis of consolidationThe consolidated financial statements incorporate the financial statements of Greene King plc, its subsidiaries and its related party, Greene King Finance plc. Greene King Finance plc is a special purpose entity set up to raise bond finance for the group, which is consolidated as a quasi-subsidiary. The financial statements of subsidiaries are prepared for the same reporting year as the parent company with adjustments made to their financial statements to bring their accounting policies in line with those used by the group.
The results of subsidiaries are consolidated from the date of acquisition, being the date on which the group obtains control, and continue to be consolidated until the date that such control ceases. Intercompany transactions, balances, income and expenses are eliminated on consolidation.
Changes in accounting policiesThe accounting policies adopted are consistent with those of the previous financial year, apart from the changes arising from the adoption of new accounting standards set out below:
The Group applied, for the first time, certain standards and amendments that require restatement of previous financial statements. These include amendments to IAS 1 Presentation of Financial Statements and IAS 19 Employee Benefits (Revised 2011).
IAS 1 Presentation of Items of Other Comprehensive Income (amendments to IAS 1)The amendments to IAS 1 introduce a grouping of items presented in other comprehensive income. Items that could be reclassified (or recycled) to profit or loss at a future point in time, for example net gains on cash flow hedges taken to equity, are now presented separately from items that will never be reclassified, for example actuarial gains and losses on defined benefit pension schemes. The amendment has affected the presentation of the consolidated statement of comprehensive income but has had no impact on the group’s financial position or performance.
IAS 19 Employee Benefits (revised 2011)IAS 19 (revised 2011) has been applied retrospectively from 30 April 2012 with comparatives restated for the impact of its adoption. The standard replaces interest costs and expected return on plan assets with a net interest amount that is calculated by applying the discount rate to the net pension liability/asset. The impact of IAS 19 (revised 2011) on the current and comparative period is shown in note 9.
IAS 19 (revised) has been applied retrospectively, with the following permitted exceptions:
– the carrying amounts of other assets have not been adjusted for changes in employee benefit costs that were included before 28 April 2012; and
– sensitivity disclosures for the defined benefit obligation for the comparative period have not been provided.
IFRS 13 Fair Value MeasurementIFRS 13 applies prospectively for financial periods that began on or after 1 January 2013 and establishes a single source of guidance under IFRS for all fair value measurement. IFRS 13 does not change when an entity is required to use fair values, but rather provides guidance on how to measure fair value under IFRS when fair value is required or permitted and extends the disclosures required in respect of fair value measurement. The standard defines fair value as the price that would be received to sell an asset or paid to transfer a liability in an orderly transaction between market participants at the measurement date (exit price). The default risk, i.e. the entity’s own credit risk, must also be reflected in the fair value of a liability. The implementation of IFRS 13 has resulted in a non-significant adjustment to the fair value of derivatives.
Significant accounting policiesProperty, plant and equipmentProperty, plant and equipment is stated at cost or deemed cost on transition to IFRS, less accumulated depreciation and any impairment in value.
Depreciation is calculated on a straight-line basis over the estimated useful life of the asset.
Freehold land is not depreciated. Freehold and long leasehold buildings are depreciated to their estimated residual values over periods up to 50 years, and short leasehold improvements are depreciated to their estimated residual values over the shorter of the remaining term of the lease or useful life of the asset. Residual value is reviewed at least at each financial year end and there is no depreciable amount if residual value is the same as, or exceeds, book value. Plant and equipment assets are depreciated over their estimated lives which range from three to 20 years.
Residual values, useful lives and methods of depreciation are reviewed for all categories of property, plant and equipment and adjusted, if appropriate, at each financial year end.
An item of property, plant and equipment is de-recognised upon disposal or when no future economic benefits are expected from its use. Profit or loss on de-recognition is calculated as the difference between the net disposal proceeds and the carrying amount of the asset, and is included in the income statement in the year of de-recognition.
NOTES TO THE ACCOUNTSFor the fifty-three weeks ended 4 May 2014

Financial statements
GREENE KING PLC Annual report 2014 www.greeneking.co.uk
1 Accounting policies continuedSignificant accounting policies continuedBusiness combinations and goodwill Business combinations are accounted for using the acquisition method. The cost of an acquisition is measured as the aggregate of the consideration transferred, measured at acquisition date fair value and the amount of any non-controlling interest in the acquiree. The choice of measurement of non-controlling interests, either at fair value or at the proportionate share of the acquiree’s identifiable net assets, is determined on a transaction by transaction basis. Acquisition costs incurred are taken to the income statement.
When the group acquires a business, it assesses the financial assets and liabilities assumed for appropriate classification and designation in accordance with the contractual terms, economic circumstances and pertinent conditions as at the acquisition date. This includes the separation of embedded derivatives in host contracts of the acquiree.
Any contingent consideration to be transferred to the vendor will be recognised at fair value at the acquisition date. Subsequent changes to the fair value of the contingent consideration which are deemed to be an asset or a liability will be recognised in accordance with IAS 39 either in the income statement or in other comprehensive income. If the contingent consideration is classified as equity, it should not be re-measured until it is finally settled within equity.
Goodwill is initially measured at cost, being the excess of the aggregate of the acquisition-date fair value of the consideration transferred and the amount recognised for the non-controlling interest over the net identifiable amounts of the assets acquired and liabilities assumed in exchange for the business combination. Assets acquired and liabilities assumed in transactions separate to the business combinations, such as the settlement of pre-existing relationships or post-acquisition remuneration arrangements, are accounted for separately from the business combination in accordance with their nature and applicable IFRSs. Identifiable intangible assets, meeting either the contractual-legal or separability criterion, are recognised separately from goodwill. Contingent liabilities representing a present obligation are recognised if the acquisition-date fair value can be measured reliably.
If the aggregate of the acquisition-date fair value of the consideration transferred and the amount recognised for the non-controlling interest is lower than the fair value of the assets, liabilities and contingent liabilities and the fair value of any pre-existing interest held in the business acquired, the difference is recognised in the income statement.
After initial recognition, goodwill is measured at cost less any accumulated impairment losses.
ImpairmentProperty, plant and equipmentIndividual assets are grouped for impairment assessment purposes at the lowest level at which there are identifiable cash inflows independent of the cash inflows of other groups of assets.
An assessment is made at each reporting date as to whether there is an indication of impairment. If an indication exists, the group makes an estimate of the recoverable amount of each asset group. An asset’s or cash-generating unit’s recoverable amount is the higher of its fair value less costs to sell and value in use and is determined for an individual asset, unless the asset does not generate cash inflows that are largely independent of those from other assets or groups of assets.
An impairment loss is recognised where the recoverable amount is lower than the carrying value of assets. If there is an indication that any previously recognised impairment losses may no longer exist or may have decreased, a reversal of the loss may be made only if there has been a change in the estimates used to determine the recoverable amounts since the last impairment loss was recognised. The carrying amount of the asset is increased to its recoverable amount only up to the carrying amount that would have resulted, net of depreciation, had no impairment loss been recognised for the asset in prior years.
Impairment losses and any subsequent reversals are recognised in the income statement.
Details of the impairment losses recognised in respect of property, plant and equipment are provided in note 14.
GoodwillGoodwill is reviewed for impairment annually or more frequently if events or changes in circumstances indicate that the carrying value may be impaired.
For the purpose of impairment testing, goodwill acquired in a business combination is, from the acquisition date, allocated to each of the group’s cash-generating units (or groups of cash-generating units) that are expected to benefit from the combination, irrespective of whether other assets or liabilities of the acquiree are assigned to those units. Each unit or group of units to which goodwill is allocated represents the lowest level within the group at which goodwill is monitored for internal management purposes and cannot be larger than an operating segment before aggregation.
Impairment is determined by the recoverable amount of an operating segment. Where this is less than the carrying value of the operating segment an impairment loss is recognised immediately in the income statement. This loss cannot be reversed in future periods.
Where goodwill forms part of a cash-generating unit and part of the operation within that unit is disposed of, any goodwill associated with the operation disposed of is included in the carrying amount of the operation when determining the gain or loss on disposal of the operation. Goodwill disposed of in this circumstance is measured based on the relative values of the operation disposed of and the portion of the cash-generating unit retained.
Goodwill amortised prior to the conversion to IFRS on 3 May 2004 has not been reinstated and the net book value of goodwill at that date has been carried forward as the carrying value. Prior to May 1998, goodwill was written off to reserves. Such goodwill has not been reinstated and is not included in determining profit or loss on disposal.
Financial instrumentsFinancial instruments are recognised when the group becomes party to the contractual provisions of the instrument and are de-recognised when the group no longer controls the contractual rights that comprise the financial instrument, normally through sale or when all cash flows attributable to the instrument are passed to an independent third party.
NOTES TO THE ACCOUNTS CONTINUEDFor the fifty-three weeks ended 4 May 2014

Annual report 2014 GREENE KING PLCwww.greeneking.co.uk
Corporate governanceStrategic report Financial statements
Financial assetsFinancial assets are classified as either financial assets at fair value through the income statement, loans and receivables, held-to-maturity investments or available-for-sale financial assets. The group determines the classification of its financial assets at initial recognition and, where appropriate, re-evaluates this designation at each financial year end.
The group makes trade loans to publicans who purchase the group’s beer. Trade loans are non-derivative and are not quoted in an active market and have therefore been designated as ‘Loans and receivables’, carried at amortised cost using the effective interest method. Gains and losses are recognised in income when the loans and receivables are de-recognised or impaired, as well as through the amortisation process.
The group assesses at each balance sheet date whether any individual trade loan is impaired. If there is evidence that an impairment loss has been incurred, the amount of loss is measured as the difference between the loan’s carrying amount and the expected future receipts, (excluding future credit losses that have not been incurred), discounted at the loan’s original effective interest rate. The loss is recognised in operating profit.
Trade receivablesTrade receivables are recorded at their original invoiced amount less an allowance for any doubtful amounts when collection of the full amount is no longer considered probable.
InventoriesInventories are valued at the lower of cost and net realisable value. Raw materials are valued at average cost. Finished goods and work in progress comprise materials, labour and attributable production overheads where applicable, and are valued at average cost.
Cash and cash equivalentsCash and cash equivalents in the balance sheet comprise cash at bank and in hand and short-term deposits with an original maturity of three months or less. For the consolidated cash flow statement, cash and cash equivalents consist of cash and cash equivalents as defined above, net of outstanding bank overdrafts.
Property, plant and equipment held for saleProperty, plant and equipment is classified as held for sale only if it is available for sale in its current condition, management is committed to the sale and a sale is highly probable and expected to be completed within one year from the date of classification. Property, plant and equipment classified as held for sale is measured at the lower of carrying amount and fair value less costs to sell and is no longer depreciated or amortised.
Interest-bearing loans and borrowingsAll loans and borrowings are initially recognised at fair value of the consideration received, net of issue costs. After initial recognition, interest-bearing loans and borrowings are measured at amortised cost using the effective interest method.
Finance costs and incomeFinance costs are expensed to the income statement using the effective interest method. Finance income is recognised in the income statement using the effective interest method.
Derivative financial instruments and hedge accountingThe group uses interest rate swaps to hedge its exposure to interest rate fluctuations on its variable rate loans, notes and bonds.
Interest rate swaps are initially measured at fair value, if any, and carried on the balance sheet as an asset or liability. Subsequent measurement is at fair value determined by reference to market values for similar instruments. If a derivative does not qualify for hedge accounting the gain or loss arising on the movement in fair value is recognised in the income statement.
Hedge accountingTo qualify for hedge accounting the hedge relationship must be designated and documented at inception. Documentation must include the group’s risk management objective and strategy for undertaking the hedge and formal allocation to the item or transaction being hedged. The group also documents how it will assess the effectiveness of the hedge and carries out assessments on a regular basis to determine whether it has been, and is likely to continue to be, highly effective.
Hedges can be classified as either fair value (hedging exposure to changes in fair value of an asset or liability), or cash flow (hedging the variability in cash flows attributable to an asset, liability, or forecast transaction). The group uses its interest rate swaps as cash flow hedges.
Cash flow hedge accountingThe effective portion of the gain or loss on an interest rate swap is recognised directly in equity, whilst any ineffective portion is recognised immediately in the income statement.
Amounts taken to equity are transferred to the income statement in the same period that the financial income or expense is recognised, unless the hedged transaction results in the recognition of a non-financial asset or liability whereby the amounts are transferred to the initial carrying amount of the asset or liability.
When a hedging instrument expires or is sold, terminated or exercised, or no longer qualifies for hedge accounting, amounts previously recognised in equity are held there until the previously hedged transaction affects profit or loss. If the hedged transaction is no longer expected to occur, the cumulative gain or loss recognised in equity is immediately transferred to the income statement.
Trade payablesTrade payables are non-interest bearing and are stated at their nominal value.

Financial statements
GREENE KING PLC Annual report 2014 www.greeneking.co.uk
1 Accounting policies continuedSignificant accounting policies continuedProvisionsProvisions are recognised when the group has a present legal or constructive obligation as a result of a past event, when it is probable that an outflow of resources will be required to settle the obligation, and when a reliable estimate can be made of the amount of the obligation.
Provisions are discounted to present value, where the effect of the time value of money is material, using a pre-tax discount rate that reflects current market estimates of the time value of money and the risks specific to the liability. The amortisation of the discount is recognised as a finance cost.
Pensions and other post-employment benefitsDefined benefit pension schemesThe group operates a number of defined benefit pension schemes which require contributions to be made into separately administered funds. The cost of providing benefits under the schemes is determined separately for each plan using the projected unit credit actuarial method on an annual basis. The current service cost is charged to operating profit. Any actuarial gains and losses are recognised in full in the group statement of comprehensive income in the period in which they occur.
When a settlement or curtailment occurs the obligation and related scheme assets are re-measured and the resulting gain or loss is recognised in the income statement in the same period.
Net interest is calculated by applying the discount rate to the net defined benefit liability or asset and is recorded in the group income statement.
The defined benefit asset or liability recognised on the balance sheet comprises the present value of the schemes’ obligations less the fair value of scheme assets. Defined benefit assets are restricted to the extent that they are considered recoverable.
Defined contribution pension schemesThe cost of the group’s defined contribution pension schemes amounts to the value of contributions made. Contributions are charged to the income statement as they become payable.
Post-employment healthcare benefitThe group also provided certain additional post-employment healthcare benefits to employees which are unfunded.
Share-based paymentsCertain employees and directors receive equity-settled remuneration, whereby they render services in exchange for shares or rights over shares. The fair value of the shares and options granted are measured using a Black-Scholes model, at the date at which they were granted. No account is taken in the fair value calculation of any vesting conditions (service and performance), other than market conditions (performance linked to the price of the shares of the company). Any other conditions that are required to be met in order for an employee to become fully entitled to an award are considered non-vesting conditions. Like market performance conditions, non-vesting conditions are taken into account in determining the grant date fair value. The fair value of shares and options granted is recognised as an employee expense with a corresponding increase in equity spread over the period in which the vesting conditions are fulfilled ending on the relevant vesting date. The cumulative amount recognised as an expense reflects the extent to which the vesting period has expired, adjusted for the estimated number of shares and options that are ultimately expected to vest. The periodic charge or credit is the movement in the cumulative position from beginning to end of that period.
No expense is recognised for awards that do not ultimately vest provided vesting is not conditional on market or non-vesting conditions. The dilutive effect of outstanding options is reflected as additional share dilution in calculating earnings per share figures.
Own sharesOwn shares consist of treasury shares and shares held within an employee benefit trust. The group has an employee benefit trust for the granting of shares to applicable employees.
Own shares are recognised at cost as a deduction from shareholders’ equity. Subsequent consideration received for the sale of such shares is also recognised in equity, with any difference between the sale proceeds from the original cost being taken to revenue reserves. No gain or loss is recognised in the performance statements on transactions in treasury shares.
RevenueGenerally, revenue represents external sales (excluding taxes) of goods and services, net of discounts. Revenue is recognised to the extent that it is probable that the economic benefits will flow to the group and is measured at the fair value of consideration receivable, excluding discounts, rebates, and other sales taxes or duty relating to brewing and packaging of certain products. Revenue principally consists of drink, food and accommodation sales, which are recognised at the point at which goods or services are provided, rental income, which is recognised on a straight-line basis over the lease term and machine income, where net takings are recognised as earned.
Operating leasesLeases where the lessor retains substantially all the risks and benefits of ownership are classified as operating leases. Lease payments are recognised as an expense in the income statement on a straight-line basis over the period of the lease.
Lease premiums paid on entering into or acquiring operating leases represent prepaid lease payments and are held on the balance sheet as current (the portion relating to the next financial period) or non-current prepayments. These are amortised on a straight-line basis over the lease term.
NOTES TO THE ACCOUNTS CONTINUEDFor the fifty-three weeks ended 4 May 2014

Annual report 2014 GREENE KING PLCwww.greeneking.co.uk
Corporate governanceStrategic report Financial statements
TaxesIncome taxThe income tax charge comprises both the income tax payable based on profits for the year and the deferred income tax. It is calculated using taxation rates enacted or substantively enacted by the balance sheet date and is measured at the amount expected to be recovered from or paid to the taxation authorities.
Income tax relating to items recognised directly in equity is recognised in equity and not in the income statement.
Deferred taxDeferred tax is provided for using the liability method on temporary differences at the balance sheet date between the tax bases of assets and liabilities and their carrying values in the financial statements.
Deferred tax is recognised for all temporary differences except where the deferred tax arises from the initial recognition of goodwill or of an asset or liability in a transaction that is not a business combination that, at the time of the transaction, affects neither the accounting profit nor taxable profit or loss or, in respect of taxable temporary differences associated with investments in subsidiaries, where the timing of the reversal of the temporary differences can be controlled and it is probable that the temporary differences will not reverse in the foreseeable future.
Deferred tax assets are recognised for all deductible temporary differences and carry forward of unused tax losses only to the extent that it is probable that taxable profit will be available against which the deductible temporary differences and the carry forward of unused tax losses can be utilised.
The carrying amount of deferred tax assets is reviewed at each balance sheet date and reduced to the extent that it is no longer probable that sufficient taxable profit will be available to allow all or part of the deferred tax asset to be utilised. Unrecognised deferred tax assets are reassessed at each balance sheet date and are recognised to the extent that it has become probable that future taxable profit will allow the deferred tax asset to be recovered.
Deferred tax assets and liabilities are measured, on an undiscounted basis, at the tax rates that are expected to apply to the year when the asset is realised or the liability is settled, based on tax rates that have been enacted or substantively enacted at the balance sheet date.
Deferred tax relating to items recognised directly in equity is recognised in equity and not in the income statement.
Exceptional itemsExceptional items are defined as items of income or expense which, because of their nature, size or expected frequency, merit separate presentation to allow a better understanding of the financial performance in the period.
New standards and interpretations not appliedAs at the date of approval of the financial statements there are a number of standards and interpretations issued by the IASB and IFRIC with an effective date after the date of these financial statements and which have not been early adopted by the group. These are expected to be applied as follows:
IFRS 9 Financial InstrumentsIFRS 9 Financial Instruments was first issued in November 2009 and has since been amended several times. The standard will eventually replace IAS 39 and covers the classification, measurement and de-recognition of financial assets and financial liabilities, together with a new hedge accounting model. The IASB intends to expand IFRS 9 to add new requirements for impairment and for it to become a complete replacement of IAS 39 for periods beginning on or after 1 January 2018. The adoption of the first phase of IFRS 9 will have an effect on classification and measurement of the group’s financial assets, but will not have an impact on classification and measurement of financial liabilities. The group will quantify the effect in conjunction with the other phases, when the final standard including all phases is issued.
IFRS 10 Consolidated Financial StatementsIFRS 10 replaces the portion of IAS 27 that addresses the accounting for consolidated financial statements. It also addresses the issues raised in SIC-12 Consolidation — Special Purpose Entities, which resulted in SIC-12 being withdrawn. IFRS 10 changes whether an entity is consolidated by revising the definition of control and is effective for accounting periods beginning on or after 1 January 2014. There is no impact on the group’s financial position of performance as a result of the introduction of this standard.
IFRS 12 Disclosure of Interests in Other EntitiesThe new standard, which is effective for accounting periods beginning on or after 1 January 2014, sets out the required disclosures for entities reporting under IFRS 10 and IFRS 11 that were previously included in IAS 27, IAS 28 and IAS 31. The standard includes disclosure requirements for all forms of interest in other legal entities, including subsidiaries, joint arrangements, associates, special purpose vehicles and other off-balance sheet vehicles. The impact on the group is on disclosure in the consolidated financial statements only, where summarised information may need to be provided.
IFRS 15 Revenue from Contracts with CustomersIFRS 15 is effective for financial years beginning on or after 1 January 2017 and establishes a comprehensive framework for determining when to recognise revenue and how much revenue to recognise. The core principle in that framework is that a company should recognise revenue to depict the transfer of promised goods or services to the customer in an amount that reflects the consideration to which the company expects to be entitled in exchange for those goods or services. The standard was published in May 2014 and the impact of its introduction has yet to be assessed by the group.

Financial statements
GREENE KING PLC Annual report 2014 www.greeneking.co.uk
1 Accounting policies continuedNew standards and interpretations not applied continuedIFRS 15 Revenue from Contracts with Customers continuedThe following standards and interpretations are relevant to the group though they have been assessed as having no financial impact or additional disclosure requirements at this time:
– IFRS 11 Joint Arrangements
– IAS 28 Associates and Joint Ventures (Amendment)
– IAS 32 Offsetting Financial Assets and Financial Liabilities (Amendment)
– IAS 36 Recoverable Amount Disclosures for Non-financial Assets (Amendment)
– IAS 39 Novation of Derivatives and Continuation of Hedge Accounting (Amendment)
– IFRS 10, IFRS 12 and IAS 27 Investment Entities (Amendment)
– IFRS 11 Joint Arrangements (Amendment)
– IAS 16 and IAS 38 Clarification of Acceptable Methods of Depreciation and Amortisation (Amendment)
– IAS 28 Associates and Joint Ventures (Amendment)
– IAS 19 Defined Benefit Plans: Employee Contributions (Amendment)
– Improvements to International Financial Reporting Standards (2010-2012 Cycle)
– IFRS 2 Share-based Payments
– IFRS 3 Business Combinations
– IFRS 8 Operating Segments
– IFRS 13 Fair Value Measurements
– IAS 24 Related Party Disclosures
– Improvements to International Financial Reporting Standards (2011-2013 Cycle)
– IFRS 3 Business Combinations
– IFRS 13 Fair Value Measurements
Significant accounting judgments and estimatesThe preparation of financial statements requires management to make judgments, estimates and assumptions in the application of accounting policies that affect reported amounts of assets and liabilities, income and expense. The group bases its estimates and judgments on historical experience and other factors deemed reasonable under the circumstances, including any expectations of future events. Actual results may differ from these estimates. The estimates and assumptions considered to be significant are detailed below.
TaxationJudgment is required when determining the provision for taxes as the tax treatment of some transactions cannot be finally determined until a formal resolution has been reached with the tax authorities. Assumptions are also made around the assets which qualify for capital allowances and the level of disallowable expenses and this affects the income tax calculation. Provisions are also made for uncertain exposures which can have an impact on both deferred and current tax. Tax benefits are not recognised unless it is probable that the benefit will be obtained and tax provisions are made if it is possible that a liability will arise. The final resolution of these transactions may give rise to material adjustments to the income statement and/or cash flow in future periods. The group reviews each significant tax liability or benefit each period to assess the appropriate accounting treatment.
Share-based paymentsJudgment is required when calculating the fair value of awards made under the group’s share-based payment plans. Note 8 describes the key assumptions and valuation model inputs used in the determination of these values. In addition estimates are made of the number of awards that will ultimately vest; judgment is required in relation to the probability of meeting non-market based performance conditions and the continuing participation of employees in the plans.
Pension liabilitiesThe present values of pension liabilities are determined on an actuarial basis and depend on a number of actuarial assumptions which are disclosed in note 9. Any change in these assumptions will impact on the carrying amount of pension liabilities. Note 9 describes the key assumptions used in the accounting for retirement benefit obligations.
Impairment of goodwillThe group determines whether goodwill is impaired on at least an annual basis. Details of the tests and carrying value of the assets are shown in note 13. This requires an estimation of the value in use of the cash-generating units to which the goodwill is allocated. Value-in-use calculations require assumptions to be made regarding the expected future cash flows from the cash-generating unit and choice of a suitable discount rate in order to calculate the present value of those cash flows. If the actual cash flows are lower than estimated, future impairments may be necessary.
NOTES TO THE ACCOUNTS CONTINUEDFor the fifty-three weeks ended 4 May 2014

Annual report 2014 GREENE KING PLCwww.greeneking.co.uk
Corporate governanceStrategic report Financial statements
Impairment of property, plant and equipmentThe group determines whether property, plant and equipment is impaired where there are indicators of impairment. This requires an estimation of the value in use at a site level. Value-in-use calculations require assumptions to be made regarding the expected future cash flows from the cash-generating unit and choice of a suitable discount rate in order to calculate the present value of those cash flows.
Note 14 describes the assumptions used in the impairment testing of property, plant and equipment together with an analysis of the sensitivity to changes in key assumptions.
Residual valuesResidual values of property are determined with reference to current market property trends. If residual values were lower than estimated, an impairment of asset value and reassessment of future depreciation charge may be required. Useful lives are reassessed annually which may lead to an increase or reduction in depreciation accordingly.
Property provisionsThe group provides for its onerous obligations under operating leases where the property is closed or vacant and for properties where rental expense is in excess of income. The estimated timings and amounts of cash flows are determined using the experience of internal and external property experts. However, changes to the expected method of exiting from the obligation could lead to changes in the level of provision recorded.
2 Segment informationThe group has determined the following three reportable segments that are largely organised and managed separately according to the nature of products and services provided, brands, distribution channels and profile of customers:
Retail: Managed pubs and restaurants
Pub Partners: Tenanted and leased pubs
Brewing & Brands: Brewing, marketing and selling beer
These are also considered to be the group’s operating segments and are based on the information presented to the chief executive who is considered to be the chief operating decision maker.
Transfer prices between operating segments are set on an arm’s length basis.Pub Brewing Total
Retail Partners & Brands Corporate operations2014 £m £m £m £m £m
Revenue 963.0 149.6 189.0 — 1,301.6 Operating costs (775.3) (84.3) (158.6) (17.8) (1,036.0)
Segment operating profit 187.7 65.3 30.4 (17.8) 265.6 Exceptional items (66.2)Net finance costs (94.2)Income tax expense (9.1)
96.1
Balance sheetSegment assets 1,991.1 697.2 361.1 43.0 3,092.4 Unallocated assets* 267.5
1,991.1 697.2 361.1 43.0 3,359.9 Segment liabilities (96.6) (10.0) (67.5) (88.9) (263.0)Unallocated liabilities* (2,034.2)
(96.6) (10.0) (67.5) (88.9) (2,297.2)
Net assets 1,894.5 687.2 293.6 (45.9) 1,062.7
Other segment informationCapital expenditure – tangible assets 146.3 20.1 4.9 4.3 175.6 Goodwill disposed (0.3) (6.1) — — (6.4)Impairment of property, plant and equipment (3.5) (18.5) — — (22.0)Impairment of disposal group — (34.2) — — (34.2)Depreciation (48.8) (9.6) (5.7) — (64.1)EBITDA** 236.5 74.9 36.1 (17.8) 329.7
* Unallocated assets/liabilities comprise cash, borrowings, pensions, net deferred tax, net current tax, and derivatives.
** EBITDA represents earnings before interest, tax, depreciation and exceptional items and is calculated as operating profit before exceptionals adjusted for the depreciation charge for the period.

Financial statements
GREENE KING PLC Annual report 2014 www.greeneking.co.uk
2 Segment information continued Total
Pub Brewing operationsRetail Partners & Brands Corporate £m
2013 £m £m £m £m (restated)
Revenue 863.6 153.7 177.4 — 1,194.7 Operating costs (695.9) (85.6) (147.4) (17.6) (946.5)
Segment operating profit 167.7 68.1 30.0 (17.6) 248.2 Exceptional items (19.0)Net finance costs (118.2)Income tax expense (16.5)
94.5
Balance sheetSegment assets 1,885.6 794.2 370.6 44.8 3,095.2 Unallocated assets* 107.4
1,885.6 794.2 370.6 44.8 3,202.6 Segment liabilities (91.2) (12.2) (66.2) (88.0) (257.6)Unallocated liabilities* (1,973.5)
(91.2) (12.2) (66.2) (88.0) (2,231.1)
Net assets 1,794.4 782.0 304.4 (43.2) 971.5
Other segment informationCapital expenditure – tangible assets 105.2 16.5 2.7 1.1 125.5 Capital expenditure – business combinations 3.0 — — — 3.0 Goodwill disposed (0.2) (4.3) — — (4.5)Impairment of property, plant and equipment (3.8) (15.5) — — (19.3)Depreciation (44.6) (8.2) (5.4) (0.1) (58.3)EBITDA** 212.3 76.3 35.4 (17.5) 306.5
* Unallocated assets/liabilities comprise cash, borrowings, pensions, net deferred tax, net current tax, and derivatives.
** EBITDA represents earnings before interest, tax, depreciation and exceptional items and is calculated as operating profit before exceptionals adjusted for the depreciation charge for the period.
Management reporting and controlling systemsManagement monitors the operating results of its strategic business units separately for the purpose of making decisions about allocating resources and assessing performance. Segment performance is measured based on segment operating profit or loss referred to as trading profit in our management and reporting systems. Included within the corporate column in the table above are functions managed by a central division.
No information about geographical regions has been provided as the group’s activities are predominantly domestic.
3 RevenueRevenue is analysed as follows:
2014 2013£m £m
Goods 1,204.7 1,100.1 Services 96.9 94.6
1,301.6 1,194.7
NOTES TO THE ACCOUNTS CONTINUEDFor the fifty-three weeks ended 4 May 2014

Annual report 2014 GREENE KING PLCwww.greeneking.co.uk
Corporate governanceStrategic report Financial statements
4 Other income and expensesOperating profit is stated after charging:
2014 2013
Before Beforeexceptional Exceptional exceptional Exceptional
items items Total items items Total£m £m £m £m £m £m
Changes in inventory of finished goods and work in progress 65.4 — 65.4 71.1 — 71.1 Cost of products sold recognised as an expense 451.7 — 451.7 401.4 — 401.4 Employment costs (note 6) 323.4 — 323.4 291.7 — 291.7 Depreciation of property, plant and equipment 64.1 — 64.1 58.3 — 58.3 Operating lease rentals– minimum lease rentals 17.9 — 17.9 16.9 — 16.9 Other operating charges 113.5 59.8 173.3 107.1 12.3 119.4 Net loss/(profit) on disposal — 6.4 6.4 — 6.7 6.7
1,036.0 66.2 1,102.2 946.5 19.0 965.5
Fees paid to the auditor during the period consisted of: 2014 2013
£m £m
Audit of the consolidated financial statements 0.2 0.2 Audit of subsidiaries 0.1 0.1 Tax advisory services 0.1 —
Included in other operating charges 0.4 0.3
Fees paid in respect of tax advisory services are shown net of amounts recharged to third parties.
5 Exceptional items2014 2013
£m £m
Included in operating profitImpairment of disposal group (note 21) 34.2 —Impairment of property, plant and equipment (note 14) 22.0 17.7Impairment of property, plant and equipment resulting from fire damage (note 14) — 1.6Exceptional VAT 7.0 —Insurance proceeds (3.4) (0.8)Net loss on disposal of property, plant and equipment and goodwill 6.4 5.4Other loss on disposal — 1.3Acquisition and other related costs — 2.2Pension and post-employment liabilities credit — (8.4)
66.2 19.0
Included in financing costsInterest on tax adjustment in respect of prior periods 1.1 — Ineffective cash flow hedges – fair value gains (1.1) —Ineffective cash flow hedges – transfer from equity — 28.2 Interest on exceptional VAT 1.7 —
Total exceptional items before tax 67.9 47.2
Tax impact of exceptional items (10.5) (9.0)Tax credit in respect of the licensed estate (6.5) (7.5)Tax credit in respect of rate change (18.8) (6.1)Adjustment in respect of prior periods – income tax 3.9 (20.8)Adjustment in respect of prior periods – deferred tax 1.2 21.0
Total exceptional tax (30.7) (22.4)
Total exceptional items after tax 37.2 24.8

Financial statements
GREENE KING PLC Annual report 2014 www.greeneking.co.uk
5 Exceptional items continuedExceptional operating costsOn 1 May 2014 the group announced the disposal of 275 non-core pubs from our Pub Partners estate; this disposal completed on 2 June 2014. An impairment charge totalling £34.2m has been recognised as a result of this disposal: £19.6m in respect of the carrying value of the assets and a charge of £14.6m relating to the impairment of goodwill allocated to these sites.
During the period the group has recognised an impairment loss of £22.0m (2013: £17.7m) in respect of its licensed estate. The impairment has been recognised in respect of pubs where the higher of value in use and fair value less costs to sell has fallen below the net book value.
During the period ended 2 May 2010 the group received a refund of £7.0m from HMRC in respect of VAT on gaming machines following a ruling involving the Rank Group plc that the application of VAT contravened the EU’s principle of fiscal neutrality. HMRC appealed the ruling, issuing protective assessments to recover the VAT in the event its appeal was successful. On 30 October 2013 the decision was overturned and the group was therefore required to repay the VAT of £7.0m and associated interest of £1.7m in the period. On 16 April 2014 the Supreme Court granted Rank permission to appeal which is likely to be heard in early 2015.
In the period, the group received insurance compensation to meet the costs of restoring fire-damaged sites totalling £3.4m (2013: £0.8m). Further amounts are receivable as the projects progress.
Acquisition costs in the prior year were in respect of amounts payable, two years post acquisition and subject to the future profitability of the businesses, to the former owners of Cloverleaf Restaurants and Realpubs, who remained employees of the group.
Following the closure of the group’s defined benefit pension schemes to future accrual an exceptional credit of £8.4m was recognised in the prior year. This comprised a gain of £10.1m in respect of past service accruals no longer being linked to future salary growth less £1.7m of implementation costs and fees.
The net loss on disposal of property plant and equipment of £6.4m (2013: £5.4m loss) comprises a total profit on disposal of £8.0m (2013: £6.9m) and a total loss on disposal of £14.4m (2013: £12.3m). The loss on disposal includes £6.4m (2013: £4.5m) in respect of goodwill allocated to parts of operating segments disposed of in the year. The other loss on disposal of £1.3m relates to the loss on disposal of an investment in the prior year.
Exceptional finance costsThe £1.1m fair value gain is the mark-to-market movement on the ineffective element of cash flow hedges resulting from changes in the LIBOR yield curve.
Exceptional taxThe tax credit in respect of the licensed estate arisen from movements in their tax base cost, including the impact of indexation.
The Finance Act 2013 reduced the rate of corporate tax from 23% to 21% from 1 April 2014 and to 20% from 1 April 2015. The lower rate of 20% has been used to determine the overall net deferred liability as the temporary differences are expected to reverse at the lower rate. The effect of the lower rate is to reduce the deferred tax provision by a net £9.1m, comprising a credit to the group income statement of £18.8m and a debit to the group statement of comprehensive income of £9.7m.
The adjustment in respect of prior periods’ income tax arises from finalising the tax returns for earlier periods including tax relief for capital expenditure and repairs and reversal of tax relief previously taken on intra-group transactions.
The adjustment in respect of prior periods’ deferred tax arises from finalising the tax returns and also deferred tax on revaluation and rolled over gains on the licensed estate.
6 Employment costs2014 2013
£m £m
Wages and salaries 293.3 265.1 Other share-based payments (note 8) 4.4 3.9
Total wages and salaries 297.7 269.0 Social security costs 21.3 18.8 Other pension costs (note 9)– defined benefit — 1.7 – defined contribution 4.4 2.2
323.4 291.7
The total expense of share-based payments relates to equity-settled schemes.
The average number of employees during the period was as follows: 2014 2013
Retail 21,263 21,127 Pub Partners 55 61 Brewing & Brands 829 832 Corporate 430 412
22,577 22,432
The figures above include 12,132 (2013: 12,054) part-time employees.
Details of directors’ emoluments are shown in the directors’ remuneration report on pages 54 to 60.
NOTES TO THE ACCOUNTS CONTINUEDFor the fifty-three weeks ended 4 May 2014

Annual report 2014 GREENE KING PLCwww.greeneking.co.uk
Corporate governanceStrategic report Financial statements
7 Finance (costs)/income2014 2013
BeforeBefore exceptional
exceptional Exceptional items Exceptional Totalitems items Total (restated) items (restated)
£m £m £m £m £m £m
Bank loans and overdrafts (11.6) — (11.6) (9.3) — (9.3)Other loans (79.8) — (79.8) (77.9) — (77.9)Ineffective element of cash flow hedges 1.6 1.1 2.7 — — — Ineffective cash flow hedges – transfer from equity — — — — (28.2) (28.2)Interest on tax adjustment in respect of prior period — (2.8) (2.8) — — — Unwinding of discount element of provisions (0.6) — (0.6) (0.5) — (0.5)Net finance cost from pensions (2.5) — (2.5) (2.7) — (2.7)
Total finance costs (92.9) (1.7) (94.6) (90.4) (28.2) (118.6)
Bank interest receivable 0.4 — 0.4 0.4 — 0.4
Total finance income 0.4 — 0.4 0.4 — 0.4
Net finance costs (92.5) (1.7) (94.2) (90.0) (28.2) (118.2)
8 Share-based payment plansThe group operates three types of share-based payment arrangements: a senior management long-term incentive plan (LTIP/growth LTIP), a deferred share scheme for other management and a general employee share option plan (SAYE). In prior periods a deferred bonus scheme and an executive share option plan (ESOS) have also been operated.
The general terms of each plan are detailed in the directors’ remuneration report on pages 49 to 60. All are equity settled.
The total charge recognised for the period arising from share-based payment transactions including National Insurance contributions is £6.0m (2013: £5.0m). A corresponding credit of £4.4m (2013: £3.9m) has been recognised in equity.
The fair value of the LTIP/growth LTIP issued in 2014 is considered to be equal to the share price on the date of issue.
The fair value of equity-settled options issued in prior years was estimated using a Black-Scholes model. The fair value of the grants and model inputs used to calculate the fair values of grants during the period was as follows:2014 SAYE
Weighted average share price 865pExercise price 701pExpected dividend yield 3.3%Risk-free rate of return 0.6%Volatility 21.6%Expected life (years) 3.3Weighted average fair value of grants in the year 163p
2013 LTIP SAYE
Weighted average share price 596p 708pExercise price — 505pExpected dividend yield 4.5% 3.8%Risk-free rate of return 0.2% 0.6%Volatility 23.8% 22.0%Expected life (years) 3.0 3.3Weighted average fair value of grants in the year 521p 168p
Risk-free rate of return is the yield on zero coupon UK government bonds with the same life as the expected option life. Expected volatility is based on historical volatility of the company’s share price which assumes that the past trend in share price movement is indicative of future trends. Expected life of options has been taken as the mid-point of the relevant exercise period. This is not necessarily indicative of future exercise patterns.
No other feature of the equity instruments granted was incorporated into the fair value measurement.

Financial statements
GREENE KING PLC Annual report 2014 www.greeneking.co.uk
8 Share-based payment plans continuedMovement in outstanding options and rights during the period is as follows:
ESOS Number
of optionsWeighted average
exercise price
2014 2013 2014 2013m m p p
Outstanding at the beginning of the period 0.6 1.0 472 451Forfeited — — 493 528Exercised (0.3) (0.4) 444 412
Outstanding at the end of the period 0.3 0.6 506 472
Exercisable at the end of the period 0.3 0.6 506 472
SAYE Number
of options Weighted average
exercise price
2014 2013 2014 2013m m p p
Outstanding at the beginning of the period 1.8 2.0 400 363Granted 0.4 0.6 701 507Forfeited (0.2) (0.3) 446 407Exercised (0.4) (0.5) 329 336
Outstanding at the end of the period 1.6 1.8 502 400
Exercisable at the end of the period 0.2 0.4 349 308
LTIP Number of shares
2014 2013m m
Outstanding at the beginning of the period 2.7 2.9 Granted 0.9 0.9 Forfeited (0.2) (0.3)Vested (0.9) (0.8)
Outstanding at the end of the period 2.5 2.7
Exercisable at the end of the period — —
The options and shares granted under the LTIP are at nil cost; therefore the weighted average exercise price for rights outstanding at the beginning and end of the period, granted, forfeited and exercised during the period is £nil (2013: £nil).
ESOS, SAYE and LTIPOptions were exercised on a range of dates. The weighted average share price through the period was 841p in 2014 and 607p in 2013.
The rights outstanding at 4 May 2014 under the LTIP had an exercise price of £nil (2013: £nil) and a weighted average remaining contractual life of 1.3 years (2013: 1.3 years).
The outstanding options for the ESOS scheme had an exercise price between 408p and 528p (2013: 332p and 528p) and for the SAYE scheme between 274p and 701p (2013: 274p and 505p).
The weighted average remaining contractual life was 1.1 years for the ESOS (2013: 1.8 years) and 2.8 years for the SAYE scheme (2013: 2.8 years).
Deferred share bonus schemeIn the prior period selected senior executives participated in a deferred share bonus scheme. Awards made under this scheme are based on a percentage of salary and are paid in shares. Awards are made to eligible employees on the achievement of corporate targets and vest once required service periods are completed.
During the year 0.04m (2013: 0.05m) shares were purchased to fulfil awards made in 2012/2013 (2011/2012) under this scheme.
NOTES TO THE ACCOUNTS CONTINUEDFor the fifty-three weeks ended 4 May 2014
Annual report 2014 GREENE KING PLCwww.greeneking.co.uk
Corporate governanceStrategic report Financial statements
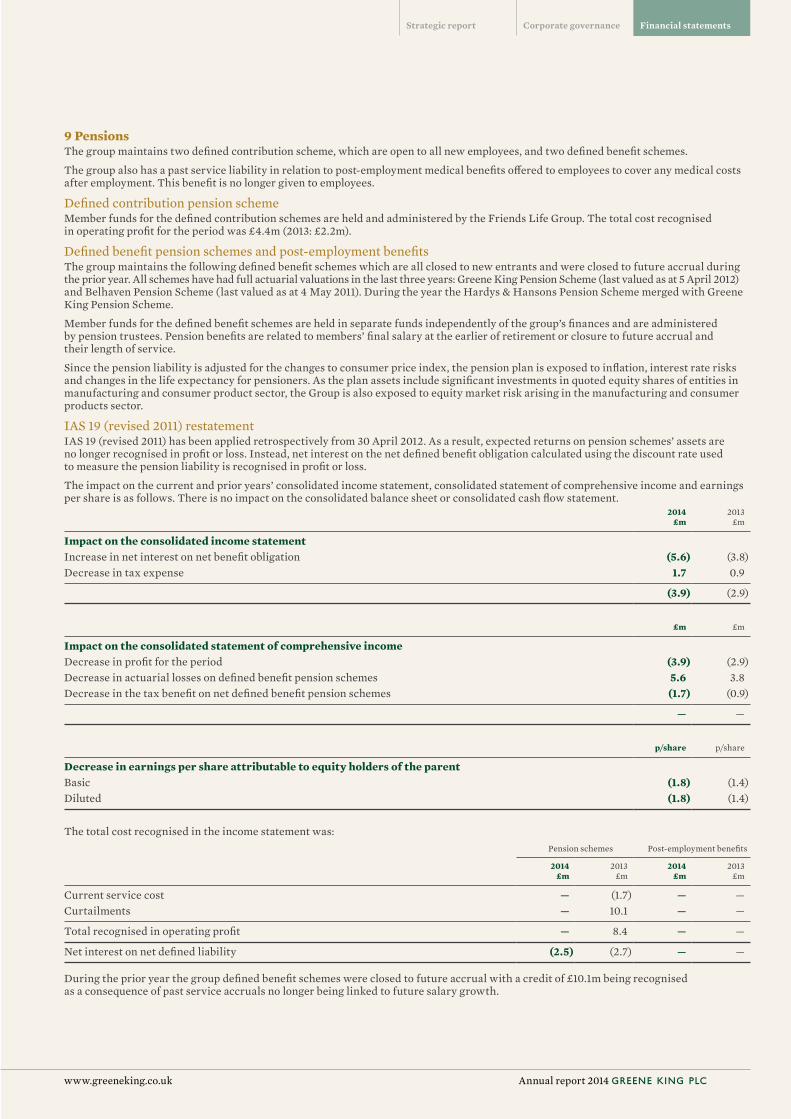
9 PensionsThe group maintains two defined contribution scheme, which are open to all new employees, and two defined benefit schemes.
The group also has a past service liability in relation to post-employment medical benefits offered to employees to cover any medical costs after employment. This benefit is no longer given to employees.
Defined contribution pension schemeMember funds for the defined contribution schemes are held and administered by the Friends Life Group. The total cost recognised in operating profit for the period was £4.4m (2013: £2.2m).
Defined benefit pension schemes and post-employment benefitsThe group maintains the following defined benefit schemes which are all closed to new entrants and were closed to future accrual during the prior year. All schemes have had full actuarial valuations in the last three years: Greene King Pension Scheme (last valued as at 5 April 2012) and Belhaven Pension Scheme (last valued as at 4 May 2011). During the year the Hardys & Hansons Pension Scheme merged with Greene King Pension Scheme.
Member funds for the defined benefit schemes are held in separate funds independently of the group’s finances and are administered by pension trustees. Pension benefits are related to members’ final salary at the earlier of retirement or closure to future accrual and their length of service.
Since the pension liability is adjusted for the changes to consumer price index, the pension plan is exposed to inflation, interest rate risks and changes in the life expectancy for pensioners. As the plan assets include significant investments in quoted equity shares of entities in manufacturing and consumer product sector, the Group is also exposed to equity market risk arising in the manufacturing and consumer products sector.
IAS 19 (revised 2011) restatementIAS 19 (revised 2011) has been applied retrospectively from 30 April 2012. As a result, expected returns on pension schemes’ assets are no longer recognised in profit or loss. Instead, net interest on the net defined benefit obligation calculated using the discount rate used to measure the pension liability is recognised in profit or loss.
The impact on the current and prior years’ consolidated income statement, consolidated statement of comprehensive income and earnings per share is as follows. There is no impact on the consolidated balance sheet or consolidated cash flow statement.
2014 2013£m £m
Impact on the consolidated income statementIncrease in net interest on net benefit obligation (5.6) (3.8) Decrease in tax expense 1.7 0.9
(3.9) (2.9)
£m £m
Impact on the consolidated statement of comprehensive incomeDecrease in profit for the period (3.9) (2.9) Decrease in actuarial losses on defined benefit pension schemes 5.6 3.8 Decrease in the tax benefit on net defined benefit pension schemes (1.7) (0.9)
— —
p/share p/share
Decrease in earnings per share attributable to equity holders of the parentBasic (1.8) (1.4) Diluted (1.8) (1.4)
The total cost recognised in the income statement was:Pension schemes Post-employment benefits
2014 2013 2014 2013£m £m £m £m
Current service cost — (1.7) — — Curtailments — 10.1 — —
Total recognised in operating profit — 8.4 — —
Net interest on net defined liability (2.5) (2.7) — —
During the prior year the group defined benefit schemes were closed to future accrual with a credit of £10.1m being recognised as a consequence of past service accruals no longer being linked to future salary growth.

Financial statements
GREENE KING PLC Annual report 2014 www.greeneking.co.uk
9 Pensions continuedThe values of the schemes’ liabilities have been determined by a qualified actuary based on the results of the last actuarial valuation, updated to 4 May 2014 using the following principal actuarial assumptions:
2014 2013
Discount rate 4.1% 3.9%Expected pension payment increases 3.3% 3.1%Rate of inflation (RPI) 3.6% 3.2%Rate of inflation (CPI) 2.7% 2.5%
The mortality assumptions imply the following expectations of years of life from age 65:Man currently aged 40 24.6 24.0 Woman currently aged 40 27.0 26.4 Man currently aged 65 22.4 22.3 Woman currently aged 65 24.5 24.5
Mortality assumptions are based on standard tables adjusted for scheme experience and with an allowance for future improvement in life expectancy.
The table below shows the investment allocation of pension assets against the related liabilities of the pension schemes and other post-employment benefits:
Pension plans’ value Post-employment benefits
2014 2013 2014 2013£m £m £m £m
Investment quoted in active markets:Equities 225.7 207.6 — — With profits 2.8 2.7 — — Bonds 63.4 64.5 — — Unquoted investments:Cash 3.6 5.5 — —
Total fair value of assets 295.5 280.3 — — Present value of scheme liabilities Funded plans (347.7) (344.1) — — Unfunded plans — — (1.3) (1.5)
Non-current liability recognised (52.2) (63.8) (1.3) (1.5)
The movements in the pension schemes’ net liability during the period are as follows:
Pension assets Pension liabilities Net pension liability
2014 2013 2014 2013 2014 2013£m £m £m £m £m £m
At beginning of period 280.3 237.3 (344.1) (304.6) (63.8) (67.3)Pension costs charged to income statementCurrent service cost — — — (1.7) — (1.7)Net interest 10.9 11.0 (13.4) (13.7) (2.5) (2.7)
10.9 11.0 (13.4) (15.4) (2.5) (4.4)Benefits paid (10.1) (10.0) 10.1 10.0 — — Settlements and curtailments (note 5) — — — 10.1 — 10.1 Re-measurement gains/(losses) in other comprehensive incomeReturn on plan assets (excluding amounts included in net interest expenses) 7.1 27.5 — — 7.1 27.5 Actuarial changes arising from changes in demographic assumptions — — 2.1 (46.9) 2.1 (46.9)Actuarial changes arising from changes in financial assumptions — 4.0 (1.4) (2.3) (1.4) 1.7 Experience adjustments — — (1.0) 5.4 (1.0) 5.4
7.1 31.5 (0.3) (43.8) 6.8 (12.3)Contributions paid – employers 7.3 10.1 — — 7.3 10.1 Contributions paid – employees — 0.4 — (0.4) — —
At end of period 295.5 280.3 (347.7) (344.1) (52.2) (63.8)
NOTES TO THE ACCOUNTS CONTINUEDFor the fifty-three weeks ended 4 May 2014

Annual report 2014 GREENE KING PLCwww.greeneking.co.uk
Corporate governanceStrategic report Financial statements
The movements in the post-employment benefits liability during the period are as follows:Post-employment benefits liability
2014 2013£m £m
At beginning of period (1.5) (1.5)Settlements and curtailments 0.2 —
At end of period (1.3) (1.5)
Experience adjustments for the current and previous period are as follows:2014 2013
Pension schemes £m £m
Defined benefit obligation (347.7) (344.1)Plan assets 295.5 280.3
Deficit (52.2) (63.8)Experience adjustments on scheme liabilities (1.0) 5.4 Percentage of scheme liabilities 0.3% (1.6%)Experience adjustments on scheme assets 7.1 27.7 Percentage of scheme assets 2.4% 9.9%
2014 2013Post-employment benefits £m £m
Benefit obligation (1.3) (1.5)Experience adjustments on benefit obligation — —
The sensitivities regarding the principal assumptions used to measure the scheme liabilities are set out below:Decrease/(increase)
in liability 2014
£m
0.25% points increase in discount rate 15.0 0.25% points increase in inflation assumption (12.3)Additional one year increase to life expectancy (12.4)
The following payments, which are also the minimum funding requirements, are the expected contributions to the defined benefit plan in future years:
2014 2013£m £m
Within one year 6.9 6.9 Between two and five years 27.5 27.5 Between five and ten years 24.8 31.1 After ten years — 0.5
59.2 66.0
The average duration of the defined benefit plan obligation at the end of the reporting period is 17 years (2013: 18 years).

Financial statements
GREENE KING PLC Annual report 2014 www.greeneking.co.uk
10 Taxation2014 2013
BeforeBefore exceptional
exceptional Exceptional items Exceptional Totalitems items Total (restated) items (restated)
Consolidated income statement £m £m £m £m £m £m
Income taxCorporation tax before exceptional items 43.6 — 43.6 42.5 — 42.5 Recoverable on exceptional items — (2.6) (2.6) — (0.4) (0.4)
Current income tax 43.6 (2.6) 41.0 42.5 (0.4) 42.1 Adjustment in respect of prior periods — 3.9 3.9 — (20.8) (20.8)
43.6 1.3 44.9 42.5 (21.2) 21.3
Deferred taxOrigination and reversal of temporary differences (3.8) (14.4) (18.2) (4.5) (16.1) (20.6)Adjustment in respect of prior periods — 1.2 1.2 — 21.0 21.0 Tax credit in respect of rate change — (18.8) (18.8) — (6.1) (6.1)
(3.8) (32.0) (35.8) (4.5) (1.2) (5.7)
Tax charge in the income statement 39.8 (30.7) 9.1 38.0 (22.4) 15.6
20132014 (restated)
Group statement of comprehensive income £m £m
Deferred taxGain/(loss) on actuarial valuation of pension liability 1.3 (2.8)Net gain/(loss) on revaluation on cash flow hedges 12.9 (2.4)Tax charge in respect of rate change 9.0 2.7
23.2 (2.5)
2014 2013Group statement of changes in equity £m £m
Deferred taxShare-based payment – future taxable benefit 0.5 (1.9)Tax charge in respect of rate change 0.7 0.1
Deferred tax reported in equity 1.2 (1.8)
Income taxShare-based payments – current taxable benefit (1.9) (0.5)
Total tax reported in equity (0.7) (2.3)
Reconciliation of income tax expense for periodThe effective rate of taxation is lower than the full rate of corporation tax. The differences are explained below:
20132014 (restated)
£m £m
Profit before tax 105.2 111.0
Profit before tax multiplied by standard rate corporation tax 22.8% (2013: 23.9%) 24.0 26.5 Effects of:Expenses not deductible for tax purposes 5.3 2.5 Exceptional tax credit in respect of the licensed estate (6.5) (7.5)Exceptional tax credit in respect of rate change (18.8) (6.1)Adjustment in respect of prior periods – income tax 3.9 (20.8)Adjustment in respect of prior periods – deferred tax charge 1.2 21.0
Income tax expense reported in the income statement 9.1 15.6
NOTES TO THE ACCOUNTS CONTINUEDFor the fifty-three weeks ended 4 May 2014

Annual report 2014 GREENE KING PLCwww.greeneking.co.uk
Corporate governanceStrategic report Financial statements
Income tax payableThe income tax liability of £46.5m (2013: £41.1m) includes an assessment of the expected payments on uncertain tax positions which have yet to be agreed or are in dispute with HMRC.
Deferred taxThe deferred tax included in the balance sheet is as follows:
2014 2013£m £m
Deferred tax liabilityAccelerated capital allowances 38.0 49.7 Rolled over gains and property revaluation 72.0 96.8
110.0 146.5
Deferred tax assetPensions and post-employment medical benefits (10.6) (14.9)Other accruals and deferred income (2.1) (2.4)Derivatives (33.9) (54.0)Share-based payment (4.7) (5.0)Tax losses carried forward — (0.1)
(51.3) (76.4)
Net deferred tax liability 58.7 70.1
The deferred tax included in the income statement is as follows:2014 2013
BeforeBefore exceptional
exceptional Exceptional items Exceptional Totalitems items Total (restated) items (restated)
£m £m £m £m £m £m
Deferred tax in the income statementAccelerated capital allowances (4.0) (7.7) (11.7) (5.0) 7.6 2.6 Rolled over gains and property revaluations — (24.8) (24.8) — (6.8) (6.8)Pensions and post-employment medical benefit 1.0 — 1.0 1.3 2.3 3.6 Other accruals and deferred income — 0.3 0.3 — 0.3 0.3 Derivatives — 0.2 0.2 — (6.5) (6.5)Share-based payments (0.9) — (0.9) (0.8) — (0.8)Tax losses carried forward 0.1 — 0.1 — 1.9 1.9
Deferred tax expense (3.8) (32.0) (35.8) (4.5) (1.2) (5.7)
The movements on deferred tax assets and liabilities during the period are shown below:
Deferred tax liabilities
Accelerated capital
allowances£m
Rolled over gains and property
revaluation£m
Total£m
At 29 April 2012 47.1 103.6 150.7 Charge/(credit) to the income statement 2.6 (6.8) (4.2)
At 28 April 2013 49.7 96.8 146.5 Credit to the income statement (11.7) (24.8) (36.5)
At 4 May 2014 38.0 72.0 110.0

Financial statements
GREENE KING PLC Annual report 2014 www.greeneking.co.uk
10 Taxation continuedDeferred tax continued
Deferred tax assets
Pensions and post-
employment medical benefits
£m
Other accruals and
deferred income
£mDerivatives
£m
Share- based
payments£m
Taxes losses
carried forward
£mTotal
£m
At 29 April 2012 (16.4) (2.7) (47.1) (2.4) (2.0) (70.6)Credit to equity/comprehensive income (2.1) — (0.4) (1.8) — (4.3)Charge/(credit) to the income statement 3.6 0.3 (6.5) (0.8) 1.9 (1.5)
At 28 April 2013 (14.9) (2.4) (54.0) (5.0) (0.1) (76.4)Charge to equity/comprehensive income 3.3 — 19.9 1.2 — 24.4 Charge/(credit) to the income statement 1.0 0.3 0.2 (0.9) 0.1 0.7
At 4 May 2014 (10.6) (2.1) (33.9) (4.7) (0.0) (51.3)
There are no income tax consequences attaching to the payment of dividends by Greene King plc to its shareholders.
Factors that may affect future tax chargesThe Finance Act 2013 reduced the rate of corporation tax from 23% to 20% from 1 April 2015. The effect of these changes is to reduce the net deferred tax liability by £9.1m, comprising a credit to the group income statement of £18.8m and a debit to the group statement of comprehensive income of £9.7m (as explained in note 5).
11 Dividends paid and proposed2014 2013
£m £m
Declared and paid in the periodInterim dividend for 2014: 7.60p (2013: 7.15p) 16.6 15.5 Final dividend for 2013: 19.45p (2012: 18.1p) 42.1 39.0
58.7 54.5
Proposed for approval at AGMFinal dividend for 2014 – 20.8p (2013: 19.45p) 45.5 42.1 Total proposed dividend for 2014 – 28.4p (2013: 26.6p) 62.1 57.9
Dividends on own shares have been waived.
12 Earnings per shareBasic earnings per share has been calculated by dividing the profit attributable to equity holders of £96.1m (2013: £95.4m) by the weighted average number of shares in issue during the period (excluding own shares held) of 217.2m (2013: 216.1m).
Diluted earnings per share has been calculated on a similar basis taking account of 1.1m (2013: 1.3m) dilutive potential shares under option, giving a weighted average number of ordinary shares adjusted for the effect of dilution of 218.3m (2013: 217.4m). There were no (2013: nil) anti-dilutive share options excluded from the diluted earnings per share calculation. The performance conditions for share options granted over 2.6m (2013: 2.8m) shares have not been met in the current financial period and therefore the dilutive effect of the number of shares which would have been issued at the period end has not been included in the diluted earnings per share calculation.
Adjusted earnings per share excludes the effect of exceptional items and is presented to show the underlying performance of the group on both a basic and diluted basis.
Earnings Basic earnings per share Diluted earnings per share
Adjusted earnings per share2014
£m
2013(restated)
£m2014
p
2013(restated)
p2014
p
2013(restated)
p
Profit attributable to equity holders 96.1 95.4 44.2 44.1 44.0 43.9 Exceptional items 37.2 24.8 17.2 11.5 17.1 11.4
Profit attributable to equity holders before exceptional items 133.3 120.2 61.4 55.6 61.1 55.3
Treasury shares and shares held by the EBT are excluded from the calculation of weighted average number of shares in issue.
NOTES TO THE ACCOUNTS CONTINUEDFor the fifty-three weeks ended 4 May 2014

Annual report 2014 GREENE KING PLCwww.greeneking.co.uk
Corporate governanceStrategic report Financial statements
13 Goodwill£m
CostAt 29 April 2012 729.3 Disposal (4.5)
At 28 April 2013 724.8 Disposal (6.4)Transfer to assets held for sale (14.6)
At 4 May 2014 703.8
ImpairmentAt 28 April 2013 —Impairment of disposal group (note 5) (14.6)Transfer to assets held for sale 14.6
At 4 May 2014 —
Net book valueAt 4 May 2014 703.8 At 28 April 2013 724.8 At 29 April 2012 729.3
All goodwill was purchased as part of business combinations. As from 3 May 2004, the date of transition to IFRS, goodwill is no longer amortised but is subject to annual impairment testing.
Goodwill has been allocated to operating segments, the lowest group of cash-generating units in the group at which goodwill is monitored internally, based on the extent that the benefits of acquisitions flow to that segment.
Goodwill disposed of in the year is the amount of goodwill allocated to parts of operating segments disposed of during the year. The amount disposed is calculated based on the relative value of the operation disposed and the portion of the operating segment retained.
The carrying amount of goodwill has been allocated £353.5m (2013: £353.8m) to Retail, £135.8m (2013: £156.5m) to Pub Partners and £214.5m (2013: £214.5m) to Brewing & Brands.
The recoverable amount of each segment was determined on a value-in-use basis, using cash flow projections based on one year budgets approved by the board, and in all cases exceeded the carrying amount.
The key assumptions used in the value-in-use calculations are budgeted EBITDA, the pre-tax discount rate and the growth rate used to extrapolate cash flows beyond the budgeted period.
Budgeted EBITDA is based on past experience adjusted to take account of the impact of expected changes to each cash-generating unit’s pub estate or operations, sales prices and volumes, capital expenditure, business mix and margin.
Cash flows are discounted at 9.0% (2013: 9.0%) which is used as an approximation for the risk-adjusted discount rate of the relevant operating segment. A growth rate of 2.0% (2013: 2.0%) has been used to extrapolate cash flows. The growth rate is considered a conservative rate and is below the long-term average growth rate for the industry.
Sensitivity to changes in assumptionsThe calculation is most sensitive to changes in the assumptions used for budgeted cash flow, pre-tax discount rate and growth rate. Management considers that reasonable possible changes in assumptions would be an increase in discount of 1% point, a reduction in growth rate of 1% point or a 10% reduction in budgeted cash flow. As an indication of sensitivity, when applied to the value-in-use calculation none of these changes would have resulted in an impairment of goodwill in the period.

Financial statements
GREENE KING PLC Annual report 2014 www.greeneking.co.uk
14 Property, plant and equipmentLicensed estate Other
Land and Plant and Land and Plant andbuildings equipment buildings equipment Total
£m £m £m £m £m
CostBalances at 29 April 2012 2,058.7 557.1 60.2 117.5 2,793.5 Additions during period 75.3 46.4 2.2 1.6 125.5 Acquisitions (note 17) 2.9 0.1 — — 3.0 Transfer to property, plant and equipment held for sale (8.3) (1.2) — — (9.5)Disposals during period (34.6) (5.3) (0.6) — (40.5)
Balances at 28 April 2013 2,094.0 597.1 61.8 119.1 2,872.0 Additions during period 98.8 67.6 2.4 6.8 175.6 Transfer to property, plant and equipment held for sale (87.5) (26.9) — — (114.4)Disposals during period (45.2) (6.0) (0.8) — (52.0)
Balances at 4 May 2014 2,060.1 631.8 63.4 125.9 2,881.2
Depreciation and impairmentBalances at 29 April 2012 134.2 387.4 8.7 71.9 602.2 Provided during the year 7.0 45.8 2.2 3.3 58.3 Written back on disposals (14.9) (2.8) (0.1) — (17.8)Impairment (see below) 19.3 — — — 19.3 Transfer to property, plant and equipment held for sale (0.3) (0.8) — — (1.1)
Balances at 28 April 2013 145.3 429.6 10.8 75.2 660.9 Provided during the year 8.5 49.9 2.4 3.3 64.1 Written back on disposals (19.5) (2.8) (0.1) — (22.4)Impairment (see below) 41.6 — — — 41.6 Transfer to property, plant and equipment held for sale (8.8) (23.9) — — (32.7)
Balances at 4 May 2014 167.1 452.8 13.1 78.5 711.5
Net book valueAt 4 May 2014 1,893.0 179.0 50.3 47.4 2,169.7 At 28 April 2013 1,948.7 167.5 51.0 43.9 2,211.1 At 29 April 2012 1,924.5 169.7 51.5 45.6 2,191.3
The licensed estate relates to properties, and assets held within those properties, licensed to trade (i.e. managed, tenanted and leased houses). Other assets relate to property, plant and equipment associated with unlicensed properties (i.e. brewing, distribution and central assets).
The net book value of land and buildings comprises:2014 2013
£m £m
Freehold properties 1,842.8 1,906.0 Leasehold properties >50 years unexpired term 60.3 58.3 Leasehold properties <50 years unexpired term 40.2 35.4
1,943.3 1,999.7
ValuationThe licensed estate properties were valued by the group’s own professionally qualified chartered surveyors, as at 20 December 2003, on the basis of existing use value, in accordance with the Royal Institution of Chartered Surveyors’ Appraisal and Valuation Standards. A representative sample of properties was also valued by external valuer Gerald Eve Chartered Surveyors and Property Consultants, who confirmed that the values were consistent with their appraisal. Frozen revaluation has been taken as deemed cost on the transition to IFRS; therefore no historic cost analysis is provided.
Up to 1999 the brewery and depots were valued at depreciated replacement cost and other properties at open market value. These valuations have been retained but they have not been updated. Subsequent additions have been included at cost or, in the case of acquisitions, at fair value.
Charges over assetsIncluded in land and buildings are properties with a net book value of £1,422.1m (2013: £1,437.7m) over which there is a first charge in favour of the securitised debt holders as detailed in note 23.
NOTES TO THE ACCOUNTS CONTINUEDFor the fifty-three weeks ended 4 May 2014

Annual report 2014 GREENE KING PLCwww.greeneking.co.uk
Corporate governanceStrategic report Financial statements
Future capital expenditure2014 2013
£m £m
Contracted for 9.0 7.7
Impairment of property, plant and equipmentDuring the year £41.6m of impairment losses (2013: £19.3m) were recognised in the income statement as exceptional costs. The impairment includes a £19.6m charge in relation to the sale of the disposal group as discussed in note 5.
£1.6m of the impairment recognised in the prior year within the Retail estate was in respect of licensed properties damaged by fire. In the period the group has received £3.4m (2013: £0.8m) of insurance compensation to meet the costs incurred to date of restoring these properties; further compensation is expected to be received as the restoration projects progress.
These are analysed between the group’s principal reporting segments as shown below:2014 2013
£m £m
Retail 3.5 3.8 Pub Partners 18.5 15.5 Pub Partners in respect of disposal group (note 5) 19.6 —
41.6 19.3
The group considers that each of its individual pubs is a cash-generating unit (CGU). Each CGU is reviewed annually for indicators of impairment. When indicators of impairment are identified the carrying value of the CGU is compared to its recoverable amount. The recoverable amount is the higher of the CGU’s fair value less costs to sell and its value in use.
The group estimates value in use using a discounted cash flow model. The key assumptions used are the discount rate applied to cash flow projections of 9% (2013: 9%) and the projected cash flows extrapolated using an average growth rate of 2% (2013: 2%) which is below the long-term average growth rate for the industry. Other commercial assumptions relating to individual CGUs have been made based on historic trends adjusted for management’s estimates of medium-term trading prospects.
Estimates of fair value less costs to sell are based on valuations undertaken by in-house property experts.
The impairment in respect of the disposal group has been calculated based on expected net disposal proceeds.
The remaining impairment charge recognised in the Retail and Pub Partners estates are primarily the result of the reduced trading performance of a relatively small number of pubs due to a combination of site-specific trading circumstances and the general weakening of the UK consumer environment seen in the year.
Sensitivity to changes in assumptionsThe level of impairment is predominantly dependent upon judgments used in arriving at fair values, future growth rates and the discount rate applied to cash flow projections. The impact on the impairment charge of applying different assumptions to fair values, the growth rates used to calculate cash flow projections and in the pre-tax discount rates would be as follows:
Increased impairment resulting from a 10% reduction in fair value: 2014 2013
£m £m
Retail 0.9 0.6 Pub Partners 2.8 3.8
3.7 4.4
Increased impairment resulting from a 1% increase in discount rate: 2014 2013
£m £m
Retail 0.6 0.4 Pub Partners 1.9 3.2
2.5 3.6
Increased impairment resulting from a 1% reduction in growth rate:£m £m
Retail 0.6 0.4 Pub Partners 1.9 3.2
2.5 3.6

Financial statements
GREENE KING PLC Annual report 2014 www.greeneking.co.uk
15 Financial assets2014 2013
£m £m
Trade loans (net of provision) 8.6 8.1
Total current 8.6 8.1
Trade loans (net of provision) 23.7 25.5 Investments 0.5 0.5
Total non-current 24.2 26.0
Trade loans are net of provisions of £4.1m (2013: £4.1m). During the year £0.2m (2013: £0.3m) of the provision was utilised and £0.2m (2013: £0.3m) of new provision created. All trade loans, net of any provision recognised, are considered to be neither past due nor impaired.
Trade loans are advanced to customers on terms linked to supply terms such that returns are greater than interest income. The fixed rate trade loans amounted to £21.7m (2013: £21.4m) and variable rate trade loans amounted to £14.7m (2013: £16.3m). Included in fixed rate loans are £11.3m of loans with settlement related to purchase levels (2013: £9.4m). The write-down of these loans has been taken on a straight-line basis over the remaining term of the loan as an approximation of the settlement.
The fixed rate trade loans had a weighted average interest rate of 0.73% (2013: 1.93%) and a weighted average period of 5.20 years (2013: 6.81 years). Interest rates on variable rate trade loans are linked to base rate.
2014 2013Trade loans £m £m
Balance at beginning of period 33.6 36.6 Advances 5.4 4.1 Repayments (6.7) (7.1)
Balance at end of period 32.3 33.6
16 Subsidiary undertakingsThe main subsidiary undertakings are:
Proportionof voting
Subsidiary undertakings Principal activity Held by Holding rights
Greene King Brewing and Retailing Limited Brewing and retailing Subsidiary Ordinary shares 100%Greene King Retailing Parent Limited Holding company Parent Ordinary shares 100%Greene King Pubs Limited Property Parent Ordinary shares 100%Greene King Investments Limited Holding company Parent Ordinary shares 100%Greene King Retailing Limited Pub retailing Subsidiary Ordinary shares 100%Greene King Services Limited Employment Subsidiary Ordinary shares 100%Greene King Retail Services Limited Employment Subsidiary Ordinary shares 100%Greene King Properties Limited Property Parent Ordinary shares 100%Greene King Developments Limited Property Parent Ordinary shares 100%Premium Dining Restaurants and Pubs Limited Retailing Subsidiary Ordinary shares 100%
17 Business combinationsDuring the prior year the group acquired the remaining 60% interest in Ensco 600 Limited for consideration of £0.9m and also repaid the company’s bank borrowings totalling £1.2m. The fair value of the tangible fixed assets acquired was £3.0m.
18 Inventories2014 2013
£m £m
Raw materials and work in progress 4.8 4.2 Finished goods and goods for resale 23.9 21.3 Consumable stores 1.8 1.5
30.5 27.0
NOTES TO THE ACCOUNTS CONTINUEDFor the fifty-three weeks ended 4 May 2014

Annual report 2014 GREENE KING PLCwww.greeneking.co.uk
Corporate governanceStrategic report Financial statements
19 Trade and other receivables2014 2013
£m £m
Other receivables 0.1 0.1
Total non-current 0.1 0.1
Trade receivables 54.2 66.1 Other receivables 6.0 7.8
Total current 60.2 73.9
Trade and other receivables are non-interest bearing.
The ageing analysis of trade receivables is as follows:2014 2013
£m £m
Neither past due nor impaired 51.7 59.7 Past due but not impaired– Less than 30 days 0.7 3.3
– 30–60 days 1.4 0.8 – Greater than 60 days 0.4 2.3
54.2 66.1
Trade receivables are shown net of a provision of £4.6m (2013: £5.2m).
20 Cash and cash equivalents2014 2013
£m £m
Cash at bank and in hand 31.3 31.0 Short-term deposits 27.4 —Liquidity facility reserve (note 23) 157.5 —
Cash and cash equivalents for balance sheet 216.2 31.0 Bank overdrafts (13.8) (10.8)
Cash and cash equivalents for cash flow 202.4 20.2
Included in cash at bank and in hand and short-term deposits is £16.1m (2013: £12.2m) held within securitised bank accounts which are only available for use by the securitisation entities within the group. The securitisation entities comprise Greene King Retailing Parent Limited and its subsidiaries.
The liquidity facility reserve is restricted cash as explained in note 23.
Interest receivable on cash and short-term deposits is linked to base rate and is received either monthly or in line with the term of the deposit.
21 Property, plant and equipment held for sale2014 2013
£m £m
Property, plant and equipment held for sale 81.7 8.4
At the period end, property plant and equipment held for sale represents £81.7m (2013: £8.4m) of pubs that are being actively marketed for sale with expected completion dates within one year. The value of property, plant and equipment held for sale represents the expected net disposal proceeds and is the value after a current year impairment charge of £19.6m (2013: £0.7m) included as an exceptional item.
Included in the above is the agreed sale of 275 non-core tenanted and leased pubs from the Pub Partners segment to Hawthorn Leisure Limited for a total consideration of £75.6m. The sale completed on 2 June 2014.

Financial statements
GREENE KING PLC Annual report 2014 www.greeneking.co.uk
22 Trade and other payables: current2014 2013
£m £m
Trade payables 90.8 96.1 Other payables– Other taxation and social security costs 55.2 58.7 – Accruals and deferred income 90.6 82.2 – Interest payable 19.9 12.9
256.5 249.9
Trade payables and other payables are non-interest bearing. Interest payable is mainly settled monthly, quarterly or semi-annually throughout the year, in accordance with the terms of the related financial instrument.
23 Borrowings2014 2013
Repayment Current Non-current Total Current Non-current Totaldate £m £m £m £m £m £m
Bank overdrafts On demand 13.8 — 13.8 10.8 — 10.8 Liquidity facility loan On demand 157.5 — 157.5 — — — Bank loans – floating rate 2016 — 276.6 276.6 — 177.9 177.9 Securitised debt 2005 to 2036 30.7 1,173.2 1,203.9 29.0 1,263.7 1,292.7
202.0 1,449.8 1,651.8 39.8 1,441.6 1,481.4
Bank overdraftsOverdrafts are utilised for the day to day management of cash. The group has facilities of £25.0m (2013: £25.0m) available with interest linked to base rate.
Bank loans – unsecuredIn the year the group increased and extended a five-year revolving credit facility of £460m (2013: £400m), of which £276.6m (2013: £177.9m) was drawn down at the year end. Any amounts drawn down bear interest at a margin above LIBOR, with commitment payments on the undrawn portions. Interest is payable at each renewal date which vary in maturity. Although any individual draw-downs are repayable within 12 months of the balance sheet date, the group expects to renew this funding. Immediate renewal is available under the £460m facility until June 2018. Final repayment of the total drawn-down balance is due as one payment on the agreement repayment date.
Liquidity facilityDuring the current period the standby liquidity facility provider had its short-term credit rating downgraded below the minimum prescribed in the relevant facility agreement and as such the group exercised its entitlement to draw the full amount of the facility and hold it in a designated bank account. The corresponding balance of £157.5m (2013: £nil) held in this bank account is included within cash and cash equivalents. The amounts drawn down can only be used for the purpose of meeting the securitisation’s debt service obligations should there ever be insufficient funds available from operations to meet such payments. As such these amounts are considered to be restricted cash.
Securitised debtThe group has issued various tranches of bonds in connection with the securitisation of 2,035 of the group’s pubs held in Greene King Retailing Limited at the date of the most recent tap. The bonds are secured over the properties and their future income streams and were issued by Greene King Finance plc.
The group’s securitised debt consists of the following tranches:
Tranche
Nominal value
(£m)
Carrying value (£m)***
Interest
Effectiveinterest
rate** (%)
Principalrepayment
period Average life*2014 2013
A1 132.3 131.1 140.0 Floating 6.11%** 2031 7.3 yearsA2 246.8 244.3 247.6 Fixed 5.32% 2031 11.7 yearsA3 95.8 94.8 105.1 Floating 6.09%** 2021 4.1 yearsA4 258.9 257.4 257.3 Fixed 5.11% 2034 14.4 yearsA5 257.2 257.2 263.7 Floating 7.76%** 2033 11.9 yearsB1 120.9 119.8 119.8 Fixed/floating 6.36% 2034 19.2 yearsB2 99.9 99.3 99.2 Floating 6.92%** 2036 21.3 yearsAB1 — — 60.0
1,211.8 1,203.9 1,292.7
* This assumes notes are held until final maturity.** Includes the effect of interest rate swaps and future rate step-ups.*** Carrying value is net of related deferred finance fees.
NOTES TO THE ACCOUNTS CONTINUEDFor the fifty-three weeks ended 4 May 2014

Annual report 2014 GREENE KING PLCwww.greeneking.co.uk
Corporate governanceStrategic report Financial statements
Repayment of nominal is made by quarterly instalments, in accordance with the repayment schedule, over the period shown above. Payment of interest is made on quarterly dates for all classes of bond. All of the floating rate bonds are fully hedged using interest rate swaps.
The Class A1, A2, A3, A4 and A5 bonds rank pari passu in point of security and as to payment of interest and principal, and have preferential interest payment and repayment rights over the Class B bonds. The Class B1 and B2 bonds rank pari passu in point of security, principal repayment and interest payment.
The securitisation is governed by various covenants, warranties and events of default, many of which apply to Greene King Retailing Limited, a group company. These include covenants regarding the maintenance and disposal of securitised properties and restrictions on its ability to move cash to other group companies.
24 Financial instrumentsThe primary treasury objectives of the group are to identify and manage the financial risks that arise in relation to underlying business needs, and provide secure and competitively priced funding for the activities of the group. If appropriate, the group uses financial instruments and derivatives to manage these risks.
The principal financial instruments held for the purpose of raising finance for operations are bank loans and overdraft, securitised bonds, cash and short-term deposits. Other financial instruments arise directly from the operations of the group, such as trade receivables, payables and trade loans.
Derivative financial instruments, principally interest rate swaps, are used to manage the interest rate risks related to the group’s operations and financing sources. No speculative trading in derivative financial instruments is undertaken.
The main risks from the group’s financial instruments are cash flow risk, interest rate risk, credit risk and liquidity risk. The policy for managing each of these risks is set out below.
Interest rate riskExposure to changes in interest rates on the group’s borrowings is reviewed with regard to the maturity profile and cash flows of the underlying debt. The group uses a mixture of fixed and floating interest rate debt with exposure to market interest rate fluctuations primarily arising from the floating rate instruments. The group operates a policy that no less than 95% of the overall interest exposure should be hedged. The group enters into interest rate swaps to manage the exposure. The swaps are designated as cash flow hedges at the date of contract included within the accounts, and tested for effectiveness every six months.
In accordance with IFRS 7, the group has undertaken sensitivity analysis on its financial instruments which are affected by changes in interest rates. This analysis has been prepared on the basis of a constant amount of net debt, a constant ratio of fixed to floating interest rates, and on the basis of the hedging instruments in place at 4 May 2014 and 28 April 2013. The analysis relates only to balances at these dates and is not representative of the year as a whole. The following assumptions were made:
– Balance sheet sensitivity to interest rates applies only to derivative financial instruments, as the carrying value of debt and deposits does not change as interest rates move.
– Gains and losses are recognised within equity or the income statement in line with the accounting policies of the group.
– Cash flow hedges were assumed to be effective or ineffective on the same basis as those as at the year end. An explanation for the split between those hedges that were effective at the year end and those that were ineffective is detailed within the cash flow hedging note.
Based on the group’s net position at the year end, a 1% increase or decrease in interest rates would change the group’s profit before tax by approximately £0.6m (2013: £0.2m) and the group’s equity by £81.0m (2013: £106.1m).
Liquidity riskThe group mitigates liquidity risk by managing cash generated by its operations combined with bank borrowings and long-term debt. The group’s objective is to maintain a balance between the continuity of funding and flexibility through the use of overdrafts and bank loans. The group also monitors the maturity of financial liabilities to avoid the risk of a shortage of funds.
The standard payment terms that the company has with its suppliers is 60 days following month end (2013: 60 days following month end).
Excess cash used in managing liquidity is placed on interest-bearing deposit with maturities fixed at no more than one month. Short-term flexibility is achieved through the use of short-term borrowing on the money markets.

Financial statements
GREENE KING PLC Annual report 2014 www.greeneking.co.uk
24 Financial instruments continuedLiquidity risk continuedThe table below summarises the maturity profile of the group’s financial liabilities at 4 May 2014 and 28 April 2013 based on contractual undiscounted payments including interest.
Within 1 year 1–2 years 2–5 years > 5 years Total Period ended 4 May 2014 £m £m £m £m £m
Interest bearing loans and borrowings:– Capital 202.4 32.9 390.4 1,037.3 1,663.0 – Interest 56.2 61.2 193.2 532.0 842.6
258.6 94.1 583.6 1,569.3 2,505.6 Interest rate swaps settled net 29.8 23.8 43.7 99.3 196.6
288.4 117.9 627.3 1,668.6 2,702.2 Trade payables and accruals 181.4 — — — 181.4 Provisions in respect of financial liabilities 0.5 0.5 1.5 6.2 8.7
470.3 118.4 628.8 1,674.8 2,892.3
Within 1 year 1–2 years 2–5 years > 5 years Total Period ended 28 April 2013 £m £m £m £m £m
Interest bearing loans and borrowings:– Capital 29.4 31.1 284.4 1,136.2 1,481.1 – Interest 54.5 55.8 160.3 663.9 934.5
83.9 86.9 444.7 1,800.1 2,415.6 Interest rate swaps settled net 32.2 30.7 73.4 127.8 264.1
116.1 117.6 518.1 1,927.9 2,679.7 Trade payables and accruals 178.3 — — — 178.3 Provisions in respect of financial liabilities 0.5 0.5 1.6 8.3 10.9
294.9 118.1 519.7 1,936.2 2,868.9
Credit riskThe policy for third party trading is that all customers who wish to trade on credit terms are subject to regular credit verification procedures. Receivable balances are also monitored on an ongoing basis and provided against where deemed necessary to limit the exposure to bad debts to a non-significant level.
Other financial assets includes trade loans and cash. Credit risk is the risk of default by the counterparty to discharge their obligation and the maximum exposure of the group is the carrying amount of these instruments.
There is no requirement for collateral and there are no significant concentrations of credit risk within the group.
Cash flow hedgingAt 4 May 2014 the group held four (2013: four) interest rate swap contracts for a nominal value of £170m (2013: £140m), designated as a hedge of the cash flow interest rate risk of the £276.6m (2013: £177.8m) draw down from the variable credit facility in the year. The interest rate swaps are held on the balance sheet as a fair value liability of £23.4m (2013: £4.0m). The cash flows occurred semi-annually based a variable rate of interest based on LIBOR.
At 4 May 2014 the group held five (2013: five) interest rate swap contracts for a nominal value of £585.1m (2013: £667.9m), entered into as part of the securitisation and subsequent securitisation taps. A fair value liability of £149.0m (2013: £235.2m) has been recognised on the balance sheet in respect of these contracts which are designated cash flow hedges against £585.1m (2013: £667.9m) of variable rate bonds, receiving a variable rate of interest based on LIBOR and paying a weighted average fixed rate of 7.3% (2013: 5.1%). The contract maturity dates are December 2034 and March 2036. The bonds and interest rate swaps have the same critical terms excluding credit risk.
Changes in cash flow hedge fair values are recognised in the hedging reserve to the extent that the hedges are effective. Following repurchase of the £60.0m AB1 the cash flow hedge in respect of this bond has ceased to be effective and hedge accounting has been discontinued. In the prior year an exceptional cost of £28.2m was recognised in respect of the fair value of the interest rate swap no longer qualifying for hedge accounting which has been recycled from equity to the income statement. The remaining interest rate swaps have been assessed as highly effective during the period and are expected to remain highly effective over their remaining contract lives.
The percentage of debt that was fixed as at the year end was 95.5% (2013: 98.6%) in line with the group’s policy of fixing at least 95% of all debt.
NOTES TO THE ACCOUNTS CONTINUEDFor the fifty-three weeks ended 4 May 2014

Annual report 2014 GREENE KING PLCwww.greeneking.co.uk
Corporate governanceStrategic report Financial statements
Interest rate riskThe following tables set out the group’s exposure to interest rate risk and the maturity profile for each class of interest-bearing financial asset and financial liability.
Within 1 year 1–2 years 2–3 years 3–4 years 4–5 years > 5 years Total 4 May 2014 £m £m £m £m £m £m £m
Fixed rateSecuritised debt 3.8 4.4 5.1 5.9 6.7 595.6 621.5 Financial asset (6.2) (4.2) (3.4) (2.5) (1.9) (3.5) (21.7)Variable rateSecuritised debt 26.9 28.0 29.2 30.4 31.6 436.3 582.4 Bank loans — — — — 276.6 — 276.6 Overdraft 13.8 — — — — — 13.8Financial asset (2.5) (2.2) (2.1) (2.0) (1.9) (4.0) (14.7)Cash and short-term deposits (58.7) — — — — — (58.7)Interest rate swap liabilities 9.4 9.1 8.3 8.3 8.3 129.0 172.4
Within 1 year 1–2 years 2–3 years 3–4 years 4–5 years > 5 years Total 28 April 2013 £m £m £m £m £m £m £m
Fixed rateSecuritised debt 3.3 3.8 4.4 5.1 6.1 602.0 624.7 Financial asset (5.6) (3.8) (3.2) (2.7) (2.0) (4.1) (21.4)Variable rateSecuritised debt 25.7 26.8 28.0 29.2 30.5 527.8 668.0 Bank loans — — — — 177.8 — 177.8 Overdraft 10.8 — — — — — 10.8Financial asset (2.5) (2.3) (2.3) (2.1) (2.0) (5.1) (16.3)Cash and short-term deposits (31.0) — — — — — (31.0)Interest rate swap liabilities 12.8 13.2 12.0 10.9 9.6 180.7 239.2
The interest on variable rate financial instruments is repriced at intervals of less than one year. The interest on fixed rate financial instruments is fixed until the maturity of the instrument. Investments, trade and other receivables, and trade and other payables are not included above as they are non-interest bearing and are not subject to interest rate risk.
Fair valuesSet out in the table on page 98 is a comparison of carrying amounts and fair values of all of the group’s financial instruments.
The fair values of the financial assets and liabilities are included at the amount at which the instrument could be exchanged in a current transaction between willing parties, other than in a forced liquidation or sale. The following methods and assumptions were used to estimate the fair values:
Cash and cash equivalents (comprising cash at bank and in hand and short-term deposits) – approximates to the carrying amount stated in the accounts.
Financial assets – these are carried at amortised cost using the effective interest method and fair value is deemed to be the same as this.
Short-term loans and overdrafts – approximates to the carrying amount because of the short maturity of these instruments.
Long-term loans – based on quoted market prices in the case of the securitised debt; approximates to the carrying amount in the case of the floating rate bank loans and other variable rate borrowings.
Interest rate swaps – calculated by discounting all future cash flows by the market yield curve at the balance sheet date and adjusting for, where appropriate, the group’s and counterparty credit risk. The changes in credit risk had no material effect on the hedge effectiveness assessment for derivatives designated in hedge relationships.

Financial statements
GREENE KING PLC Annual report 2014 www.greeneking.co.uk
24 Financial instruments continuedFair values continued
Fair Carrying Fair Carryingvalue value value value
Hierarchical 2014 2014 2013 2013classification £m £m £m £m
Financial liabilitiesOverdraft Level 2 13.8 13.8 10.8 10.8 Interest-bearing loans and borrowings– securitised debt Level 1 1,234.7 1,203.9 1,259.9 1,292.7 – floating rate bank loans Level 2 276.6 276.6 177.8 177.8 – liquidity facility loan Level 2 157.5 157.5 — — Interest rate swaps Level 2 172.4 172.4 239.2 239.2 Financial assetsCash Level 2 (58.7) (58.7) (31.0) (31.0)Liquidity facility reserve Level 2 (157.5) (157.5) — — Financial assets Level 3 (32.3) (32.3) (33.6) (33.6)
Carrying values are stated net of any deferred finance fees which amounted to £11.4m (2013: £10.7m).
Hierarchical classification of financial assets and liabilities measured at fair valueIFRS 13 requires that the classification of financial instruments at fair value be determined by reference to the source of inputs used to derive fair value.
The classification uses the following three-level hierarchy:
Level 1 – unadjusted quoted prices in active markets for identical assets or liabilities.
Level 2 – other techniques for which all inputs which have a significant effect on the recorded fair value are observable, either directly or indirectly.
Level 3 – techniques which use inputs which have a significant effect on the recorded fair value that are not based on observable market data.
During the periods ending 4 May 2014 and 28 April 2013 there were no transfers between levels 1, 2, or 3 fair value measurements.
Capital risk managementThe group aims to maximise shareholder value by maintaining a strong credit rating and a core level of debt which optimises the weighted average cost of capital (WACC) and shareholder value.
A number of mechanisms are used to manage debt and equity levels (together referred to as capital), as appropriate in the light of economic and trading conditions. To maintain or adjust the capital structure, the group may adjust the dividend payment to shareholders, return capital to shareholders or issue new shares. No changes were made in the objectives, policies or processes during the period.
The group monitors capital using interest cover and several other measures including fixed charge cover, the ratio of net debt to EBITDA and free cash flow debt service coverage. Interest cover is calculated by dividing operating profit before exceptional items by net finance costs before exceptional items (note 7). For the period to 4 May 2014 interest cover was 3.0x (2013: 2.9x). The board’s dividend policy is to maintain a minimum dividend cover of two times adjusted basic earnings per share.
25 ProvisionsProperty
leases£m
At 29 April 2012 9.0 Unwinding of discount element of provisions 0.5 Utilised during the period (1.8)
At 28 April 2013 7.7 Unwinding of discount element of provisions 0.6 Provided for during the period 0.3 Utilised during the period (2.1)
At 4 May 2014 6.5
NOTES TO THE ACCOUNTS CONTINUEDFor the fifty-three weeks ended 4 May 2014

Annual report 2014 GREENE KING PLCwww.greeneking.co.uk
Corporate governanceStrategic report Financial statements
Provisions have been analysed between current and non-current as follows:4 May 28 April
2014 2013 £m £m
Current 0.5 0.5 Non-current 6.0 7.2
6.5 7.7
The provision for property leases has been set up to cover operating costs of vacant or loss making premises. The provision covers the expected shortfall between operating income and rents payable. Payments are expected to be ongoing on these properties for an average of 15 years.
26 Share capital 2014 2013
Number of Share Number of Shareissued shares capital issued shares capital
m £m m £m
Called-up, allotted and fully paidAt beginning of period 218.3 27.3 217.5 27.2 Issue of share capital – share options exercised 0.7 0.1 0.8 0.1
At end of period 219.0 27.4 218.3 27.3
Details of options granted and outstanding are included in note 8.
27 ReservesShare premium accountShare premium represents the excess of proceeds received over the nominal value of new shares issued.
Capital redemption reserve Capital redemption reserve arose from the purchase and cancellation of own share capital, and represents the nominal amount of the share capital cancelled.
Hedging reserveHedging reserve adjustments arise from the movement in fair value of the group’s derivative instruments used as an effective hedge, in line with the accounting policy disclosed in note 1. Amounts recycled to income are included within finance costs in the income statement.
Own shares Own shares relates to shares held in treasury, held by the employee benefit trust or purchased to fulfil awards made under the deferred share bonus scheme. At 4 May 2014 0.53m shares (2013: 0.69m) were held in treasury, 0.55m shares (2013: 1.06m) were held by the employee benefit trust and 0.04m (2013: 0.05m) were held to fulfil awards under the deferred share bonus scheme. The market value at 4 May 2014 of the treasury shares was £4.6m (2013: £4.9m), of the shares held by the employee benefit trust was £4.8m (2013: £7.5m) and of the shares held for the deferred share bonus scheme was £0.3m (2013: £0.3m).
The employee benefit trust is independently managed and has purchased shares in order to satisfy outstanding employee share options and potential awards under the long-term incentive plan.
At the year end 0.39m (2013: 0.55m) treasury shares and 0.31m (2013: 0.44m) shares in the employee benefit trust were allocated to meet awards under the long-term incentive plan.
A transfer of £4.7m (2013: £4.0m) from own shares to retained earnings has been made to reflect transfers to satisfy awards under the long-term incentive plan and options exercised under the executive share option plan and reflects the weighted average cost of own shares.
During the period 0.04m (2013: 0.05m) shares were repurchased at a cost of £0.3m (2013: £0.3m) to fulfil awards made under the deferred share bonus scheme with 0.04m shares transferred to individuals to satisfy awards. The employee benefit trust purchased 0.20m shares (2013: 0.45m) at a cost of £1.6m and 0.70m (2013: 0.79m) shares were transferred to satisfy awards under the long-term incentive plan.
GoodwillThe cumulative amount of goodwill written off to retained earnings in respect of acquisitions made prior to May 1998 amounts to £89.7m.

Financial statements
GREENE KING PLC Annual report 2014 www.greeneking.co.uk
28 Working capital and non-cash movements2014 2013
£m £m
(Increase)/decrease in inventories (3.5) 2.4 Decrease/(increase) in trade and other receivables 12.9 (6.4)(Decrease)/increase in trade and other payables (3.8) 17.3 Decrease in provisions (1.7) (1.7)Share-based payment expense 4.4 3.9 Difference between defined benefit pension contributions paid and amounts charged (7.5) (8.4)Exceptional items (5.3) (1.1)
Working capital and non-cash movements (4.5) 6.0
29 Analysis of and movements in net debt2014 2013
£m £m
Cash in hand at bank* 58.7 31.0 Liquidity facility reserve* 157.5 —Overdrafts (13.8) (10.8)Current portion of borrowings (30.7) (29.0)Liquidity facility loan (157.5) — Non-current portion of borrowings (1,449.8) (1,441.6)
Closing net debt (1,435.6) (1,450.4)
* Included in cash on the balance sheet.2014 2013
Movement in net debt £m £m
Net increase/(decrease) in cash and cash equivalents 182.2 (11.6)Proceeds – advances of borrowings (100.0) — Proceeds – advance of liquidity facility (note 23) (157.5) — Repurchase of securitised debt 60.0 — Repayment of principal – securitised debt 29.4 27.8 Repayment of principal – loans and loan notes — 30.0 Finance issue costs 2.6 —
Decrease in net debt arising from cash flows 16.7 46.2 Other non-cash movements (1.9) (3.4)
Decrease in net debt 14.8 42.8 Opening net debt (1,450.4) (1,493.2)
Closing net debt (1,435.6) (1,450.4)
NOTES TO THE ACCOUNTS CONTINUEDFor the fifty-three weeks ended 4 May 2014

Annual report 2014 GREENE KING PLCwww.greeneking.co.uk
Corporate governanceStrategic report Financial statements
30 Financial commitmentsThe group has entered into commercial leases on certain properties and items of plant and machinery. The terms of the leases vary but typically on inception a property lease will be for a period of up to 30 years and plant and machinery will be for less than five years. Most property leases have an upwards only rent review based on open market rents at the time of the review.
Future minimum rentals payable under non-cancellable operating leases:2014 2013
£m £m
Within one year 13.9 13.9 Between one and five years 46.9 47.4 After five years 141.5 138.5
202.3 199.8
The group leases part of its licensed estate and other non-licensed properties to tenants. The majority of lease agreements have terms of between six months and 25 years and are classified for accounting purposes as operating leases. Most of the leases with terms of over three years include provision for rent reviews on either a three year or five-year basis.
Future minimum lease rentals receivable under non-cancellable operating leases are as follows:2014 2013
£m £m
Within one year 30.4 34.7 Between one and five years 79.7 76.4 After five years 65.8 71.8
175.9 182.9
31 Related party transactionsNo transactions have been entered into with related parties during the period.
Greene King Finance plc is a special purpose entity set up to raise bond finance for the group, and as such is deemed a related party. The results of the entity have been consolidated.
Compensation of directors and other key management personnel of the group2014 2013
£m £m
Short-term employee benefits (including national insurance contributions) 4.0 3.8 Post-employment pension and medical benefits 0.5 0.5 Share-based payments 1.7 1.3
6.2 5.6
Directors’ interests in an employee share incentive planDetails of the options held by executive members of the board of directors are included in the remuneration report. No options have been granted to the non-executive members of the board of directors under this scheme.
32 Post balance sheet eventsFinal dividendA final dividend of 20.8p per share (2013: 19.45p) amounting to a dividend of £45.5m (2013: £42.1m) was proposed by the directors at their meeting on 2 July 2014. These financial statements do not reflect the dividend payable.
Disposal of non-core assetsOn 1 May 2014 the group announced the disposal of 275 non-core pubs from the Pub Partners estate; this disposal completed on 2 June 2014. The disposal group of 275 pubs has been transferred to assets held for sale.
33 Contingent liabilitiesThe group has provided guarantees totalling £1.1m at 4 May 2014 (2013: £1.9m) in respect of free trade customers’ bank borrowings.