notes to financial statements - land bank of the · notes to financial statements (amounts in...
TRANSCRIPT

10
LAND BANK OF THE PHILIPPINES NOTES TO FINANCIAL STATEMENTS
(Amounts in thousands, except as indicated)
1. Corporate Information
The Land Bank of the Philippines (Parent) is a financial institution wholly-owned by the National Government. The Parent was established in 1963 as the financial intermediary of the Land Reform Program of the government. Later, it became the first universal bank by charter with expanded commercial banking powers to sustain its social mission of spurring countryside development. The Parent is a depository bank of the government and its various instrumentalities. The Parent services the requirements of the national government, local government units and government-owned and controlled corporations. As of December 31, 2014, 69 percent of the deposit portfolio came from the government while the rest came from private depositors. The Parent and its subsidiaries (Group) are engaged in the business of banking, financing, leasing, real estate, insurance brokering and other related services to personal, commercial, corporate and institutional clients. The Group‟s products and services include deposit-taking, lending and related services, treasury and capital market operations, trade services, payments and cash management, and trust services. The Parent‟s principal office of business is located at the LandBank Plaza, 1598 M.H. Del Pilar corner Dr. J. Quintos Streets, Malate, Manila. The accompanying comparative financial statements of the Parent were authorized for issue by the Parent‟s Board of Directors on February 23, 2015 while those of the subsidiaries were approved for issue by their respective Board of Directors on various dates. 2. Summary of Significant Accounting Policies
2.1 Basis of Financial Statements Preparation The accompanying financial statements have been prepared on a historical cost basis except for financial assets and financial liabilities at fair value through profit or loss (FVPL), available-for- sale (AFS) investments, and derivative financial instruments that have been measured at fair value. The financial statements of the Parent include the accounts maintained in the Regular Banking Unit (RBU) and Foreign Currency Deposit Unit (FCDU). The financial statements individually prepared for these units are combined after eliminating inter-unit accounts. The functional currency of RBU and FCDU is Philippine Peso and United States Dollar (USD), respectively. For financial reporting purposes, FCDU accounts and foreign

11
currency-denominated accounts in the RBU are translated in Philippine Peso based on the Philippine Dealing System (PDS) closing rate prevailing at end of the year. The consolidated financial statements are presented in Philippine peso, and all values are rounded to the nearest thousand pesos (P000) except when otherwise indicated. 2.2 Statement of Compliance The consolidated financial statements of the Group and of the Parent have been prepared in compliance with the Philippine Financial Reporting Standards (PFRS). 2.3 Basis of Consolidation The consolidated financial statements include the financial statements of the Parent and the following wholly-owned subsidiaries:
Name
Country of Incorporation
Principal Activity
Functional Currency
LBP Leasing Corporation Philippines Leasing Philippine peso LBP Insurance Brokerage Inc. Philippines Insurance brokerage Philippine peso LBP Resources and Development Corporation
Philippines
Real estate
Philippine peso
Masaganang Sakahan, Inc. Philippines Trading Philippine peso LBP Financial Services-Italy Italy Financial services Euro
The consolidated financial statements were prepared using consistent accounting policies for like transactions and other events in similar circumstances. All significant inter-company balances and transactions have been eliminated in consolidation. Significant Accounting Policies
Foreign currency translation Transactions and balances The books of accounts of the RBU are maintained in Philippine Peso, while those of the FCDU are maintained in USD. For financial reporting purposes, the foreign currency-denominated monetary assets and liabilities in the RBU are translated in Philippine Peso based on the Philippine Dealing System (PDS) closing rate prevailing at the statement of financial position date. Foreign exchange differences arising from revaluation and translation of foreign-currency denominated assets and liabilities are credited to or charged against operations in the year in which the rates change. Non-monetary items that are measured in terms of historical cost in a foreign currency are translated using the exchange rates as at the dates of the initial transactions. Non-monetary items measured at fair value in a foreign currency are translated using the exchange rates at the date when the fair value was determined.

12
Fair Value Measurement
The methods and assumptions used by the Group in estimating the fair value of the financial instruments include the following: Cash and cash equivalents and short-term investments – Carrying amounts approximate fair values due to the relatively short-term maturity of these instruments. Debt securities – Fair values are generally based upon quoted market prices. If the market prices are not readily available, fair values are estimated using either values obtained from counterparties or independent parties offering pricing services, values based on adjusted quoted market prices of comparable investments or values computed using the discounted cash flow methodology. Equity securities - Fair values are based on quoted prices published in markets. Loans and receivables – Fair values of loans are estimated using the discounted cash flow methodology using the Parent‟s current incremental lending rates for similar types of loans. Mortgage loans – Fair values of loans on real estate are estimated using the discounted cash flow methodology using the Parent‟s current incremental lending rates for similar types of loans. Short-term investments – Carrying amounts approximate fair values. Others – Quoted market prices are not readily available for these assets. They are not reported at fair value and are not significant in relation to the Group‟s total portfolio of securities. Obligations to repurchase securities are recorded at cost which approximates fair value. Liabilities – Fair values are estimated using the discounted cash flow methodology using the Parent‟s current incremental borrowing rates for similar borrowings with maturities consistent with those remaining for the liability being valued. Except for the long-term fixed rates liabilities and floating rate liabilities with repricing periods beyond three months, the carrying values approximate fair values due to the relatively short term maturities of the liabilities or frequency of the repricing. Financial Instruments Date of recognition
Purchases or sales of financial assets that require delivery of assets within the time frame established by regulation or convention in the marketplace are recognized on the settlement date - the date that an asset is delivered to or by the Group. Securities transactions are also recognized on settlement date basis. Deposits, amounts due to banks and customers and loans are recognized when cash is received by the Group or advanced to the borrowers.
13
Initial recognition of financial instruments
All financial instruments, including trading and investment securities and loans and receivables, are initially measured at fair value. Except for financial assets and financial liabilities valued at FVPL, the initial measurement of financial instruments includes transaction costs. The Group classifies its financial assets in the following categories: financial assets at FVPL, HTM investments, AFS investments, and loans and receivables while financial liabilities are classified as financial liabilities at FVPL and financial liabilities carried at amortized cost. The classification depends on the purpose for which the investments were acquired and whether they are quoted in an active market. Management determines the classification of its investments at initial recognition and, where allowed and appropriate, re-evaluates such designation at every reporting date. Reclassification of financial assets A financial asset is reclassified out of the FVPL category when the following conditions are met:
the financial asset is no longer held for the purpose of selling or repurchasing it in the near term; and
there is a rare circumstance. A financial asset that is reclassified out of the FVPL category is reclassified at its fair value on the date of reclassification. Any gain or loss already recognized in the consolidated statement of comprehensive income is not reversed. The fair value of the financial asset on the date of reclassification becomes its new cost or amortized cost, as applicable. Determination of fair value The fair value for financial instruments traded in active markets at the statement of financial position date is based on their quoted market price or dealer price quotations (bid price for long positions and ask price for short positions), without any deduction for transaction costs. When current bid and asking prices are not available, the price of the most recent transaction is used since it provides evidence of the current fair value as long as there has not been a significant change in economic circumstances since the time of the transaction. For all other financial instruments not listed in an active market, the fair value is determined by using appropriate valuation techniques. Valuation techniques include net present value techniques, comparison to similar instruments for which market observable prices exist, options pricing models, and other relevant valuation models. ‘Day 1’ difference
Where the transaction price in a non-active market is different from the fair value from other observable current market transactions for the same instrument or based on a valuation technique whose variables include only data from observable market, the Group recognizes the difference between the transaction price and fair value (a „Day 1‟
14
difference) in the statement of comprehensive income. In cases where the transaction price used is made of data which is not observable, the difference between the transaction price and model value is only recognized in the statement of comprehensive income when the inputs become observable or when the instrument is derecognized. For each transaction, the Group determines the appropriate method of recognizing the „Day 1‟ difference amount. (a) Financial assets designated at fair value through profit or loss (FVPL) FVPL consists of securities held for trading and financial assets that are voluntarily designated as FVPL on trade date. The FVPL category includes government debt securities purchased and held principally with the intention of selling them in the near term. These securities are carried at fair market value, based primarily on quoted market prices, or if quoted market prices are not available, discounted cash flows using market rates that are commensurate with the credit quality and maturity of the investments. Realized and unrealized gains and losses on these instruments are recognized under the trading and foreign exchange profits accounts in the statement of comprehensive income. (b) Loans and receivables, amounts due from BSP and other banks, interbank loans receivable and securities purchased under resale agreements These are financial assets with fixed or determinable payments and fixed maturities that are not quoted in an active market. They are not entered into with the intention of immediate or short-term resale and are not classified as other financial assets held for trading, designated as AFS investments or financial assets designated at FVPL. (c) Held-to-Maturity (HTM) investments HTM investments are quoted non-derivative financial assets with fixed or determinable payments and fixed maturities for which the Group‟s management has the positive intention and ability to hold to maturity. Where the Group sells other than an insignificant amount of HTM investments or those close to maturity, the entire category would be tainted and reclassified as AFS investments. These investments are carried at amortized cost using the effective interest rate method, reduced by any impairment in value. Gains and losses are recognized in statement of comprehensive income when the HTM investments are derecognized or impaired, as well as through the amortization process. (d) Available-for-sale (AFS) investments AFS investments are those which do not qualify to be classified as designated as FVPL, HTM or loans and receivables. They are purchased and held indefinitely, but which the Group anticipates to sell in response to liquidity requirements or changes in market conditions. AFS investments are carried at fair market value. The effective yield component (including premium, discounts and directly attributable transaction costs) and foreign exchange restatement results of available-for-sale debt securities are reported in earnings. Dividends on AFS equity instruments are recognized in the statement of
15
comprehensive income when the entity‟s right to receive payment is established. The unrealized gains and losses arising from the recognition of fair value changes on AFS assets are reported as a separate component of capital funds in the statement of financial position. Impairment of Financial Assets The Group determines at each reporting date whether there is objective evidence that a financial asset may be impaired. Financial assets carried at amortized cost A financial asset or a group of financial assets is impaired and impairment losses are incurred if, and only if, there is objective evidence of impairment as a result of one or more events that occurred after the initial recognition of the asset (a „loss event‟) and that loss event has an impact on the estimated future cash flows of the financial asset or group of financial assets that can be reliably estimated. The Group first assesses whether objective evidence of impairment exists individually for financial assets that are individually significant, and individually or collectively for assets that are not individually significant. If it is determined that no objective evidence of impairment exists for individually assessed financial asset, whether significant or not, the asset is included in a group of financial assets with similar credit risk characteristics (i.e., on the basis of the Group‟s scoring process that considers asset term, industry and collateral) and that group of assets is collectively assessed for impairment. Those characteristics are relevant to the estimation of future cash flows for group of such assets by being indicative of the debtors‟ ability to pay all amounts due according to the contractual terms of the assets being evaluated. Assets that are individually assessed for impairment and for which an impairment loss is or continues to be recognized are not included in a collective assessment for impairment. If there is objective evidence that an impairment loss on loans and receivables carried at amortized cost has been incurred, the amount of the loss is measured as the difference between the asset‟s carrying amount and the present value of the estimated future cash flows (excluding future credit losses that have not been incurred) discounted at the financial asset‟s original effective interest rate. The carrying amount of the asset is reduced through use of an allowance account. The amount of loss is charged to current operations. If a loan or HTM investment has a variable interest rate, the discount rate for measuring any impairment loss is the current effective interest rate determined under the contract. If, in a subsequent year, the amount of the estimated impairment loss decreases because of an event occurring after the impairment was recognized, any amounts formerly charged are credited to „Provision for credit and impairment losses‟ in the statement of comprehensive income and the allowance account, reduced. The HTM investments, together with the associated allowance accounts, are written off when there is no realistic prospect of future recovery and all collateral has been realized.

16
The calculation of the present value of the estimated future cash flows of a collateralized financial asset reflects the cash flows that may result from foreclosure less costs for obtaining and selling the collateral, whether or not foreclosure is probable. Future cash flows in a group of financial assets that are collectively evaluated for impairment are estimated on the basis of the contractual cash flows of the assets and historical loss experience for assets with similar credit risk characteristics. Historical loss experience is adjusted on the basis of current observable data to reflect the effects of current conditions that did not affect the period on which the historical loss experience is based and to remove the effects of conditions in the historical period that do not exist currently. Estimates of changes in future cash flows for groups of assets are made to reflect and be directionally consistent with changes in related observable data from period to period (such as changes in unemployment rates, property prices, payment status, or other factors indicative of changes in the probability of losses in the group and their magnitude). The methodology and assumptions used for estimating future cash flows are reviewed regularly by the Group to reduce any differences between loss estimates and actual loss experience. When a loan is uncollectible, it is written off against the related allowance for loan impairment. Such loans are written off after all the necessary procedures have been completed and the amount of the loss has been determined. Subsequent recoveries of amounts previously written off are charged to income. Restructured loans Where possible, the Group seeks to restructure loans rather than to take possession of collateral. This may involve extending the payment arrangements and the agreement of new loan conditions. Once the terms have been renegotiated, the loan is no longer considered past due. Management continuously reviews restructured loans to ensure that all criteria are met and that future payments are likely to occur. The loans continue to be subject to an individual or collective impairment assessment, calculated using the loan‟s original effective interest rate. The difference between the recorded value of the original loan and the present value of the restructured cash flows, discounted at the original effective interest rate, is recognized in „Provision for credit losses‟ in the statement of comprehensive income. Assets Carried at Cost If there is objective evidence that an impairment loss on an unquoted equity instruments that are not carried at fair value because its fair value cannot be reliably measured, or on a derivative asset that is linked to and must be settled by delivery of such unquoted equity instrument has been incurred, the amount of the loss is measured as the difference between the asset‟s carrying amount and the present value of estimated future cash flows discounted at the current market rate of return for a similar financial asset.

17
AFS Investments
If an AFS investment is impaired, an amount comprising the difference between its cost (net of any principal payment and amortization) and its current fair value, less any impairment loss on that security previously recognized in profit or loss – is removed from equity and recognized in the statement of comprehensive income. Impairment losses on equity instruments recognized in the statement of comprehensive income are not reversed through the statement of comprehensive income. If, in a subsequent period, the fair value of a debt instrument classified as AFS investment increases and the increase can be objectively related to an event occurring after the impairment loss was recognized in profit or loss, the impairment loss is reversed through the statement of comprehensive income. Derecognition of Financial Assets and Liabilities Financial Assets. A financial asset (or, where applicable, a part of a financial asset or part of a group of similar financial assets) is derecognized when: the rights to receive cash flows from the asset have expired; the Group retains the right to receive cash flows from the asset, but has assumed an obligation to pay them in full without material delay to a third party under a „pass-through‟ arrangement; or the Group has transferred its rights to receive cash flows from the asset and either (a) has transferred substantially all the risks and rewards of the asset, or (b) has neither transferred nor retained substantially all the risks and rewards of the asset, but has transferred control of the asset.
Where the Group has transferred its rights to receive cash flows from an asset and has neither transferred nor retained substantially all the risks and rewards of the asset nor transferred control of the asset, the asset is recognized to the extent of the Group‟s continuing involvement in the asset. Continuing involvement that takes the form of a guarantee over the transferred asset is measured at the lower of the original carrying amount of the asset and the maximum amount of consideration that the Group could be required to repay. Where continuing involvement takes the form of a written and/or purchase option (including a cash-settled option or similar provision) on the transferred asset, the extent of the Group‟s continuing involvement is the amount of the transferred asset that the Group may repurchase, except that in the case of a written put option (including a cash-settled option or similar provision) on an asset measured at fair value, the extent of the Group‟s continuing involvement is limited to the lower of the fair value of the transferred asset and the option exercise price. Financial Liabilities. A financial liability is derecognized when the obligation under the liability is discharged or cancelled or expired. When an existing financial liability is replaced by another from the same lender on substantially different terms, or the terms of an existing liability are substantially modified, such an exchange or modification is treated as a derecognition of the original liability and the recognition of a new liability, and the difference in the respective carrying amounts is recognized in profit or loss.

18
Derivative Instruments
The Group enters into derivative contracts such as currency forwards and currency swaps to manage its foreign exchange exposure. These derivative financial instruments are initially recorded at fair value on the date at which the derivative contract is entered into and are subsequently remeasured at fair value. Any gains or losses arising from changes in fair values of derivatives (except those accounted for as accounting hedges) are taken directly to the statement of comprehensive income. Derivatives are carried as assets when the fair value is positive and as liabilities when the fair value is negative. Derivative instruments are booked at its notional amount under contingent account on trade date and subsequently measured using the mark to forward methods. Any gains/(losses) arising from the market valuation are booked under asset account “Derivatives with positive fair value“ if the market valuation is positive and under the liability account “Derivatives with negative fair value” if the market valuation is negative contra foreign exchange gain/(loss) account. For the purpose of hedge accounting, hedges are classified primarily as either: a) a hedge of the fair value of an asset, liability or a firm commitment (fair value hedge); or b) a hedge of the exposure to variability in cash flows attributable to an asset or liability or a forecasted transaction (cash flow hedge). The Group did not apply hedge accounting treatment for its derivative transactions. The Group has certain derivatives that are embedded in host financial contracts (such as structured notes, debt investments, and loan receivables) and non-financial contracts (such as purchase orders, lease contracts and service agreements). These embedded derivatives include credit default swaps (which are linked to a reference bond), and calls and puts in debt and equity securities; conversion options in loans receivable; and foreign-currency derivatives in debt instruments, lease contracts, purchase orders and service agreements. Embedded derivatives are separated from their host contracts and carried at fair value with fair value changes being reported through profit or loss, when the entire hybrid contracts (composed of both the host contract and the embedded derivative) are not accounted for as financial instruments at FVPL and when their economic risks and characteristics are not closely related to those of their respective host contracts. Offsetting financial instruments Offsetting of financial assets and financial liabilities are only made and the net amount are reported in the statement of financial position when there is a legally enforceable right to offset the recognized amounts and the Group intends to either settle on a net basis, or to realize the asset and the liability simultaneously. Fiduciary Activities Assets and income arising from fiduciary activities together with related undertakings to return such assets to customers are excluded from the financial statements where the Group acts in a fiduciary capacity such as nominee, trustee or agent.
19
Subsequent Events Any post-year-end event that provides additional information about the Group‟s position at the statement of financial position date (adjusting event) is reflected in the financial statements. Post-year-end events that are non adjusting events, if any, are disclosed in the Notes to the financial statements, when material. Impairment of Property and Equipment, Investment Property and Other Resources At each reporting date, the Group assesses whether there is any indication that the property and equipment and investment properties may be impaired. Where an indicator of impairment exists, the Group makes a formal estimate of recoverable amount. Where the carrying amount of an asset exceeds its recoverable amount, the asset is considered impaired and is written down to its recoverable amount. Recoverable amount is the higher of an asset‟s or cash-generating unit‟s fair value less costs to sell and its value in use and is determined for an individual asset, unless the asset does not generate cash inflows that are largely independent of those from other assets or group of assets. Investments in Subsidiaries The Group‟s investments in subsidiaries and entities in which the Group has control are accounted for under the cost method of accounting in the separate financial statements. These are carried in the statement of financial position at cost less any impairment in value.
Property and Equipment Property and equipment are carried at cost less accumulated depreciation and amortization and any impairment in value. When the assets are sold or retired, their cost and accumulated depreciation and amortization are eliminated from the accounts and any gain or loss resulting from their disposal is included in the statement of comprehensive income.
The initial cost of property and equipment comprises its purchase price and any directly attributable cost of bringing the asset to its working condition and location for its intended use. Expenditures incurred after the fixed assets have been put into operation, such as repairs and maintenance costs, are normally charged to profit and loss in the period in which the costs are incurred.
Depreciation and amortization is calculated on a straight-line basis over the estimated useful life (EUL) of the property and equipment as follows:
Number of Years
Buildings 10 - 30 Furniture, fixtures and equipment 5 - 10 Leasehold rights 10 - 30* Transportation equipment 7 - 10

20
*EUL shall depend on the length of the lease. It shall be the period of the lease or the EUL of the assets, as given, whichever is shorter.
The useful life and depreciation and amortization methods are reviewed periodically to ensure that the period and method of depreciation and amortization are consistent with the expected pattern of economic benefits from items of property and equipment. Investment properties Property acquired by the Group in settlement of loans through foreclosure or dation in payment, and that is not significantly occupied by the Group, is classified as investment property. Investment property comprises land and building. Investment properties are measured at their fair value as the deemed cost as allowed under PFRS 1 and PAS 40. Subsequent to initial recognition, investment properties are stated at cost less accumulated depreciation and impairment loss. Investment properties are derecognized when they have either been disposed of or when the investment property is permanently withdrawn from use and no future benefit is expected from its disposal. Any gains or losses on derecognition of an investment property are recognized in the profit and loss in the year of derecognition. Expenditures incurred after the fixed investment properties have been put into operation, such as repairs and maintenance costs, are normally charged to income in the period in which the costs are incurred. Depreciation is calculated on a straight-line basis over 10 to 30 years, which is the estimated useful life of the investment properties. Intangible Assets Computer software Acquired computer software licenses are capitalized on the basis of the costs incurred to acquire and bring to use the specific software. These costs are amortized on the basis of the expected useful lives (three to five years). Costs associated with developing or maintaining computer software programs are recognized as an expense as incurred. Income Taxes Income tax on the profit for the year comprises current tax only. Income tax is recognized in the statement of comprehensive income except to the extent that it relates to items recognized directly in equity. Current income tax is the expected tax payable on the taxable income for the year using tax rates enacted or substantially enacted as of the reporting date, and any adjustment to tax payable in respect to previous years. Deferred tax assets are recognized for the future tax consequences attributable to temporary differences between the carrying amounts of assets and liabilities for financial reporting purposes and the amount used for taxation purposes and the carry forward benefits of the net operating loss carryover (NOLCO) and the minimum corporate
21
income tax (MCIT) over the regular corporate income tax. The amount of deferred tax provided is based on the expected manner of realization or settlement of the carrying amounts of assets and liabilities, using tax rates that have been enacted or substantially enacted as of the reporting date. A deferred tax asset is recognized only to the extent that it is probable that future taxable profits will be available against which the asset can be utilized. Deferred tax assets are reduced to the extent that it is no longer probable that the related tax benefit will be realized. The carrying amount of the deferred tax asset is reviewed at each reporting date and reduced, if appropriate. Employee Benefits The Group maintains a defined contribution plan which provides for estimated pension benefits on its contributory retirement plan covering all regular employees. Leases (a) LBP Group is the lessee
(i) Operating lease - leases in which substantially all risks and rewards of ownership are retained by another party, the lessor, are classified as operating leases. Payments, including prepayments, made under operating leases (net of any incentives received from the lessor) are charged to the statement of comprehensive income on a straight-line basis over the period of the lease. (ii) Financial lease - leases of assets where the LBP Group has substantially all the risks and rewards of ownership are classified as finance leases. Finance leases are capitalized at the lease‟s commencement at the lower of the fair value of the leased property and the present value of the minimum lease payments. Each lease payment is allocated between the liability and the finance charges so as to achieve a constant rate on the finance balance outstanding. The corresponding rental obligations, net of finance charges, are included in deferred credits and other liabilities. The interest element of the finance cost is charged to the statement of comprehensive income over the lease period so as to produce a constant periodic rate of interest on the remaining balance of the liability for each period.
(b) LBP Group is the lessor
(i) Operating lease - properties leased out under operating leases are included in investment property in the statement of financial position. Rental income under operating leases is recognized in the statement of comprehensive income on a straight-line basis over the period of lease. (ii) Finance lease - when assets are leased out under a finance lease, the present value of the lease payments is recognized as a receivable. The difference between the gross receivable and the present value of the receivable is recognized as unearned income.
Lease income under finance lease is recognized over the term of the lease using the net investment method before tax, which reflects a constant periodic rate of return.
22
Revenue Recognition Interest income and fees which are considered an integral part of the effective yield of a financial asset are recognized using the effective interest method, unless collectibility is in doubt. Interest is recognized on impaired loans and other financial assets based on the rate used to discount future cash flows to their net present value. Dividend income is recognized when the right to receive payment is established. Gains or losses arising from the trading of securities and foreign currency are reported in the statement of comprehensive income. Generally, commissions, service charges and fees are recognized only upon collection or accrued where there is reasonable degree of certainty as to its collectibility. Commitment fees received to originate a loan when the loan commitment is outside the scope of PAS 39 are deferred and recognized as an adjustment to the effective interest rate. If the loan commitment expires, the fee is recognized as revenue on expiry. Borrowing Costs Borrowing costs are expensed when incurred. Changes in Accounting Policies and Disclosures New and amended Standards and Interpretations
The Group applied the following applicable new and revised accounting standards. Unless otherwise indicated, these new and revised accounting standards have no impact to the Group. Except for these standards and amended PFRS which were adopted as of January 1, 2014, the accounting policies adopted are consistent with those of the previous financial year. PAS 32, Financial Instruments: Presentation – Offsetting Financial Assets and Financial Liabilities (Amendments) The amendments clarify the meaning of “currently has a legally enforceable right to set-off” and also clarify the application of the PAS 32 offsetting criteria to settlement systems (such as central clearing house systems) which apply gross settlement mechanisms that are not simultaneous. The amendments have no impact on the Group‟s financial position or performance. PAS 36, Impairment of Assets – Recoverable Amount Disclosures for Non-Financial Assets (Amendments)
These amendments remove the unintended consequences of PFRS 13 on the disclosures required under PAS 36. In addition, these amendments require disclosure of the recoverable amounts for the assets or cash-generating units (CGUs) for which impairment loss has been recognized or reversed during the period. These amendments
23
are effective retrospectively for annual periods beginning on or after January 1, 2014 with earlier application permitted, provided PFRS 13 is also applied. The amendments have no impact on the Group‟s financial position or performance. Investment Entities (Amendments to PFRS 10, PFRS 12 and PAS 27)
These amendments provide an exception to the consolidation requirement for entities that meet the definition of an investment entity under PFRS 10. The exception to consolidation requires investment entities to account for subsidiaries at fair value through profit or loss. This amendment is not relevant to the Group since none of the entities in the Group qualifies as an investment entity under PFRS 10.
Annual Improvements to PFRS/PAS (2010-2012 cycle)
In the 2010-2012 annual improvement cycle, seven amendments to six standards were issued, which included an amendment to PFRS 13, Fair Value Measurement. The amendment to PFRS 13 is effective immediately and it clarifies that short-term receivables and payables with no stated interest rates can be measured at invoice amounts when the effect of discounting is immaterial. This amendment has no impact on the Group‟s financial position or performance. New Standards, Amendments and Interpretations not yet adopted
The Group intends to adopt the following standards when they become effective. Except as otherwise indicated, the Group does not expect the adoption of these new and amended standards to have significant impact on its financial statements. New Standards
PFRS 9, Financial Instruments – Classification and Measurement (2010 version) –
PFRS 9 (2010 version) reflects the first phase on the replacement of PAS 39 and applies to the classification and measurement of financial assets and liabilities as defined in PAS 39, Financial Instruments: Recognition and Measurement. PFRS 9 requires all financial assets to be measured at fair value at initial recognition. A debt financial asset may, if the fair value option (FVO) is not invoked, be subsequently measured at amortized cost if it is held within a business model that has the objective to hold the assets to collect the contractual cash flows and its contractual terms give rise, on specified dates, to cash flows that are solely payments of principal and interest on the principal outstanding. All other debt instruments are subsequently measured at fair value through profit or loss. All equity financial assets are measured at fair value either through other comprehensive income (OCI) or profit or loss. Equity financial assets held for trading must be measured at fair value through profit or loss. For FVO liabilities, the amount of change in the fair value of a liability that is attributable to changes in credit risk must be presented in OCI. The remainder of the change in fair value is presented in profit or loss, unless presentation of the fair value change in respect of the liability‟s credit risk in OCI would create or enlarge an accounting mismatch in profit or loss. All other PAS 39 classification and measurement requirements for financial liabilities have been carried forward into PFRS 9, including the embedded derivative separation rules and the criteria for using FVO. The adoption of the first phase of PFRS 9 will have an effect on the classification
24
and measurement of the Group‟s financial assets, but will potentially have no impact on the classification and measurement of financial liabilities.
PFRS 9 (2010 version) is effective for annual period beginning on or after January 1, 2015. This mandatory adoption date was moved to January 1, 2018 when the final version of PFRS 9 was adopted by the Philippine Financial Reporting Standards Council (FRSC). Such adoption, however, is still for approval by the Board of Accountancy (BOA). Philippine Interpretation IFRIC 15, Agreements for the Construction of Real Estate
This Interpretation covers accounting for revenue and associated expenses by entities that undertake the construction of real estate directly or through subcontractors. The Securities and Exchange Commission (SEC) and the FRSC have deferred the effectivity of this interpretation until the final Revenue standard is issued by the International Accounting Standards Board (IASB) and an evaluation of the requirements of the final Revenue standard against the practices of the Philippine real estate industry is completed. Adoption of the interpretation when it becomes effective will not have any impact on the financial statements of the Group. The following new standards and amendments issued by the IASB were already adopted by the FRSC but are still for approval by BOA. Amendments
PAS 16, Property, Plant and Equipment and PAS 38, Intangible Assets – Clarification of Acceptable Methods of Depreciation and Amortization
The revised PAS 16 and PAS 38 both establish the principle for the basis of depreciation and amortization as being the expected pattern of consumption of the future economic benefits of an asset. The amendments to PAS 16 explicitly prohibits revenue-based depreciation of property, plant and equipment while the amendments to PAS 38 introduce a rebuttable presumption that a revenue-based amortization method for intangible assets is inappropriate for the same reason that there are multiple factors that influence revenue and that not all these factors are related to the way the asset is used or consumed. The revised standards are effective for periods beginning January 1, 2016, with earlier application permitted. PAS 16, Property, Plant and Equipment and PAS 41, Agriculture – Change in Financial Reporting for Bearer Plants The amendments require entities to account for bearer plants in the same way as property, plant and equipment in PAS 16, Property, Plant and Equipment, because their operation is similar to that of manufacturing, bringing them within the scope of PAS 16, instead of PAS 41. The produce growing on bearer plants will remain within the scope of PAS 41. The amended standards are effective for annual periods beginning on or after January 1, 2016, with earlier application permitted. The amendments are not applicable to the Group.

25
PAS 27, Separate Financial Statements – Equity Method in Separate Financial Statements The amendments will allow entities to use the equity method to account for investments in subsidiaries, joint ventures and associates in their separate financial statements. Entities already applying PFRS and electing to change to the equity method in its separate financial statements will have to apply that change retrospectively. For first-time adopters of PFRS electing to use the equity method in its separate financial statements, they will be required to apply this method from the date of transition to PFRS. The amendments are effective for annual periods beginning on or after January 1, 2016, with early adoption permitted. These amendments will not have any impact on the Group‟s consolidated financial statements. PFRS 10, Consolidated Financial Statements and PAS 28, Investments in Associates and Joint Ventures – Sale or Contribution of Assets between an Investor and its Associate or Joint Venture These amendments address an acknowledged inconsistency between the requirements in PFRS 10 and those in PAS 28 (2011) in dealing with the sale or contribution of assets between an investor and its associate or joint venture. The amendments require that a full gain or loss is recognized when a transaction involves a business (whether it is housed in a subsidiary or not). A partial gain or loss is recognized when a transaction involves assets that do not constitute a business, even if these assets are housed in a subsidiary. These amendments are effective from annual periods beginning on or after January 1, 2016. Annual Improvements to PFRSs (2010 - 2012 cycle)
The Annual Improvements to PFRSs (2010 - 2012 cycle) which will take effect for annual periods beginning on or after January 1, 2015, contain non-urgent but necessary amendments to the following standards: PFRS 2, Share-based Payment – Definition of Vesting Condition The amendment revised the definitions of vesting condition and market condition and added the definitions of performance condition and service condition to clarify various issues. This amendment shall be prospectively applied to share-based payment transactions for which the grant date is on or after January 1, 2015. This amendment does not apply to the Group as it has no share-based payments. PFRS 3, Business Combinations – Accounting for Contingent Consideration in a Business Combination The amendment clarifies that a contingent consideration that meets the definition of a financial instrument should be classified as a financial liability or as equity in accordance with PAS 32. Contingent consideration that is not classified as equity is subsequently measured at fair value through profit or loss whether or not it falls within the scope of PFRS 9 (or PAS 39, if PFRS 9 is not yet adopted). The amendment shall be prospectively applied to

26
business combinations for which the acquisition date is on or after January 1, 2015. The Group shall consider this amendment for future business combinations. Revaluation Method (Amendments to PAS 16 and PAS 38 – Proportionate Restatement of Accumulated Depreciation and Amortization) The amendment clarifies that, upon revaluation of an item of property, plant and equipment, and intangible assets, the carrying amount of the asset shall be adjusted to the revalued amount, and the asset shall be treated in one of the following ways: a. The gross carrying amount is adjusted in a manner that is consistent with the
revaluation of the carrying amount of the asset. The accumulated depreciation or amortization at the date of revaluation is adjusted to equal the difference between the gross carrying amount and the carrying amount of the asset after taking into account any accumulated impairment losses.
b. The accumulated depreciation or amortization is eliminated against the gross
carrying amount of the asset. The amendments also clarify that the amount of the adjustment of the accumulated amortization should form part of the increase or decrease in the carrying amount accounted for in accordance with the standard. The amendment shall apply to all revaluations recognized in annual periods beginning on or after the date of initial application of this amendment and in the immediately preceding annual period. PAS 24, Related Party Disclosures – Key Management Personnel The amendments clarify that an entity is a related party of the reporting entity if the said entity, or any member of a group for which it is a part of, provides key management personnel services to the reporting entity or to the parent company of the reporting entity. The amendments also clarify that a reporting entity that obtains management personnel services from another entity (also referred to as management entity) is not required to disclose the compensation paid or payable by the management entity to its employees or directors. The reporting entity is required to disclose the amounts incurred for the key management personnel services provided by a separate management entity. The amendments are applied retrospectively and affect disclosures only. Annual Improvement to PFRSs (2011-2013 cycle)
The Annual Improvements to PFRSs (2011 - 2013 cycle) contain non-urgent but necessary amendments to the following standards: PFRS 1, First-time Adoption of Philippine Financial Reporting Standards – Meaning of ‘Effective PFRSs’ The amendment clarifies that an entity may choose to apply either a current standard or a new standard that is not yet mandatory, but that permits early application, provided either standard is applied consistently throughout the periods presented in the entity‟s
27
first PFRS financial statements. This amendment is not applicable to the Group as it is not a first-time adopter of PFRS. PFRS 13, Fair Value Measurement – Portfolio Exception The amendment clarifies that the portfolio exception in PFRS 13 can be applied to financial assets, financial liabilities and other contracts. The amendment is effective for annual periods beginning on or after July 1, 2014 and is applied prospectively. PAS 40, Investment Property The amendment clarifies the interrelationship between PFRS 3 and PAS 40 when classifying property as investment property or owner-occupied property. The amendment stated that judgment is needed when determining whether the acquisition of investment property is the acquisition of an asset or a group of assets or a business combination within the scope of PFRS 3. This judgment is based on the guidance of PFRS 3. This amendment is effective for annual periods beginning on or after July 1, 2014 and is applied prospectively. The amendment has no significant impact on the Group‟s financial position or performance. Annual Improvements to PFRSs (2012 - 2014 cycle)
The Annual Improvements to PFRSs (2012 - 2014 cycle) are effective for annual periods beginning on or after January 1, 2016 and are not expected to have a material impact on the Group. They include: PFRS 5, Non-current Assets Held for Sale and Discontinued Operations – Changes in Methods of Disposal The amendment is applied prospectively and clarifies that changing from a disposal through sale to a disposal through distribution to owners and vice-versa should not be considered to be a new plan of disposal, rather it is a continuation of the original plan. There is, therefore, no interruption of the application of the requirements in PFRS 5. The amendment also clarifies that changing the disposal method does not change the date of classification. PFRS 7, Financial Instruments: Disclosures – Servicing Contracts PFRS 7 requires an entity to provide disclosures for any continuing involvement in a transferred asset that is derecognized in its entirety. The amendment clarifies that a servicing contract that includes a fee can constitute continuing involvement in a financial asset. An entity must assess the nature of the fee and arrangement against the guidance in PFRS 7 in order to assess whether the disclosures are required. The amendment is to be applied such that the assessment of which servicing contracts constitute continuing involvement will need to be done retrospectively. However, comparative disclosures are not required to be provided for any period beginning before the annual period in which the entity first applies the amendments.

28
PFRS 7 – Applicability of the Amendments to PFRS 7 to Condensed Interim Financial Statements
This amendment is applied retrospectively and clarifies that the disclosures on offsetting of financial assets and financial liabilities are not required in the condensed interim financial report unless they provide a significant update to the information reported in the most recent annual report. PAS 19, Employee Benefits – Regional Market Issue regarding Discount Rate
This amendment is applied prospectively and clarifies that market depth of high quality corporate bonds is assessed based on the currency in which the obligation is denominated, rather than the country where the obligation is located. When there is no deep market for high quality corporate bonds in that currency, government bond rates must be used. PAS 34, Interim Financial Reporting – Disclosures of Information ‘Elsewhere in the Interim Financial Report’ This amendment is applied retrospectively and clarifies that the required interim disclosures must either be in the interim financial statements or incorporated by cross-reference between the interim financial statements and wherever they are included within the greater interim financial report (e.g., in the management commentary or risk report). Effective January 1, 2018
PFRS 9, Financial Instruments – Hedge Accounting and Amendments to PFRS 9, PFRS 7 and PAS 39 (2013 version)
PFRS 9 (2013 version) already includes the third phase of the project to replace PAS 39 which pertains to hedge accounting. This version of PFRS 9 replaces the rules-based hedge accounting model of PAS 39 with a more principles-based approach. Changes include replacing the rules based hedge effectiveness test with an objectives-based test that focuses on the economic relationship between the hedged item and the hedging instrument, and the effect of credit risk on that economic relationship; allowing risk components to be designated as the hedged item, not only for financial items but also for non-financial items, provided that the risk component is separately identifiable and reliably measurable; and allowing the time value of an option, the forward element of a forward contract and any foreign currency basis spread to be excluded from the designation of a derivative instrument as the hedging instrument and accounted for as costs of hedging. PFRS 9 also requires more extensive disclosures for hedge accounting. PFRS 9 (2013 version) has no mandatory effective date. The mandatory effective date of January 1, 2018 was eventually set when the final version of PFRS 9 was adopted by the FRSC. The adoption of the final version of PFRS 9, however, is still for approval by BOA. The adoption of PFRS 9 will have an effect on the classification and measurement of the Group‟s financial assets but will have no impact on the classification and measurement

29
of the Group‟s financial liabilities. The adoption will also have an effect on the Group‟s application of hedge accounting. PFRS 9, Financial Instruments (2014 or final version)
In July 2014, the final version of PFRS 9, Financial Instruments, was issued. PFRS 9 reflects all phases of the financial instruments project and replaces PAS 39, Financial Instruments: Recognition and Measurement, and all previous versions of PFRS 9. The standard introduces new requirements for classification and measurement, impairment, and hedge accounting. PFRS 9 is effective for annual periods beginning on or after January 1, 2018, with early application permitted. Retrospective application is required, but comparative information is not compulsory. Early application of previous versions of PFRS 9 is permitted if the date of initial application is before February 1, 2015. The adoption of PFRS 9 will have an effect on the classification and measurement of the Group‟s financial assets and impairment methodology for financial assets, but will have no impact on the classification and measurement of the Group‟s financial liabilities. The adoption will also have an effect on the Group‟s application of hedge accounting. The Group is currently assessing the impact of adopting this standard. The Group conducted an evaluation of the financial impact of the adoption of PFRS 9 based on the audited financial statements as of December 31, 2013 and decided not to early adopt PFRS 9 in its 2014 financial reporting. 3. Significant Accounting Judgments and Estimates
The preparation of the financial statements in compliance with PFRS requires the Group to make estimates and assumptions that affect the reported amounts of resources, liabilities, income and expenses and disclosure of contingent resources and contingent liabilities. Future events may occur which will cause the assumptions used in arriving at the estimates to change. The effects of any change in estimates are reflected in the financial statements as they become reasonably determinable. Estimates and judgments are continually evaluated and are based on historical experience and other factors, including expectations of future events that are believed to be reasonable under the circumstances. Judgments
In the process of applying the Group‟s accounting policies, Management has made the following judgments, apart from those involving estimations, which have the most significant effect on the amounts recognized in the financial statements: a. Operating lease commitments The entity has entered into commercial property leases on its investment property portfolio. The entity has determined that it retains all the significant risks and rewards of ownership of these properties which are leased out on operating leases.
30
b. Impairment losses on loans and receivables and HTM investments
The Group reviews its loans and receivables and HTM investments to assess impairment at least on an annual basis or earlier when an indicator of impairment exists. In determining whether an impairment loss should be recorded in the statement of comprehensive income, the Group makes judgments as to whether there is any observable data indicating that there is a measurable decrease in the estimated future cash flows from a portfolio of financial asset before the decrease can be identified with an individual asset in that portfolio. This evidence may include observable data indicating that there has been an adverse change in the payment status of borrowers in a group, or national or local economic conditions that correlate with defaults on assets in the group. Management uses estimates based on historical loss experience for assets with credit risk characteristics and objective evidence of impairment similar to those in the portfolio when scheduling its future cash flows. The methodology and assumptions used for estimating both the amount and timing of future cash flows are reviewed regularly to reduce any differences between loss estimates and actual loss experience. The carrying values of receivables from customers and HTM investments of the Group and the Parent are P498,001,532 and P496,290,816 as of December 31, 2014 and P363,315,524 and P361,103,483 as of December 31, 2013, respectively. c. Impairment of AFS investments
The Group determines that available-for-sale investments are impaired when there has been a significant or prolonged decline in the fair value below its cost. This determination of what is significant or prolonged requires judgment. In making this judgment, the Group evaluates among other factors, the normal volatility in price. In addition, impairment may be appropriate when there is evidence of deterioration in the financial health of the investee, industry and sector performance, changes in technology, and operational and financing cash flows. The carrying values of AFS investments of the Group and the Parent are P191,341,109 and P191,341,109 as of December 31, 2014 and P179,836,155 and P179,836,155 as of December 31, 2013, respectively. d. Classification under HTM investments The classification of non-derivative financial assets with fixed or determinable payments and fixed maturity as held-to-maturity requires significant judgment. In making this judgment, the Group evaluates its intention and ability to hold such investments to maturity. Further, the Group determines whether the investments are quoted or not; unquoted debt investments are classified under Loans and receivables. If the Group fails to keep these investments to maturity other than for specific circumstances – for example, selling an insignificant amount or close to maturity – it will be required to reclassify the entire held-to-maturity portfolio as available-for-sale. The investments would therefore be measured at fair value instead of amortized cost. The carrying values of held-to-maturity investments of the Group and the Parent are P95,814,860 and P95,025,587 as of December 31, 2014 and P40,904,585 and P40,101,183 as of December 31, 2013, respectively. e. Recognition of deferred tax asset
The Group cannot yet establish when it will realize its deductible temporary differences and carry forward benefits of NOLCO and MCIT. When the Group is already in a
31
positive tax position, the Management will review the level of deferred tax assets that it will recognize in the books. Estimation uncertainty
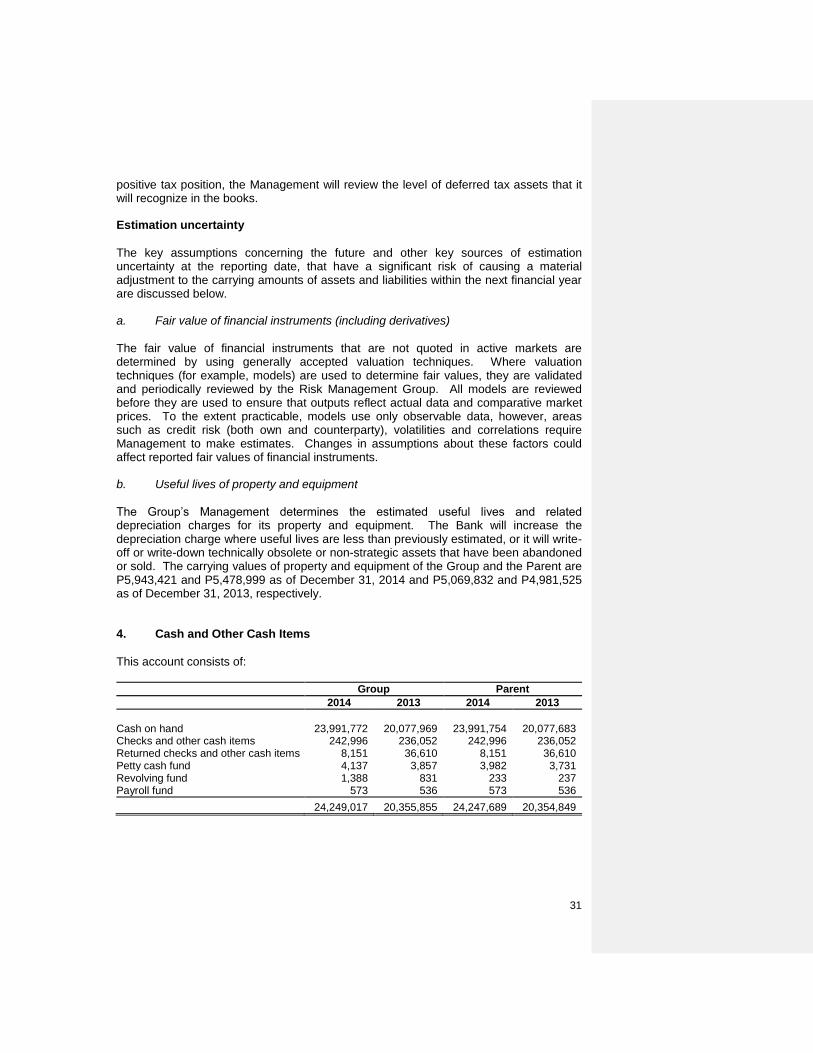
The key assumptions concerning the future and other key sources of estimation uncertainty at the reporting date, that have a significant risk of causing a material adjustment to the carrying amounts of assets and liabilities within the next financial year are discussed below. a. Fair value of financial instruments (including derivatives) The fair value of financial instruments that are not quoted in active markets are determined by using generally accepted valuation techniques. Where valuation techniques (for example, models) are used to determine fair values, they are validated and periodically reviewed by the Risk Management Group. All models are reviewed before they are used to ensure that outputs reflect actual data and comparative market prices. To the extent practicable, models use only observable data, however, areas such as credit risk (both own and counterparty), volatilities and correlations require Management to make estimates. Changes in assumptions about these factors could affect reported fair values of financial instruments. b. Useful lives of property and equipment The Group‟s Management determines the estimated useful lives and related depreciation charges for its property and equipment. The Bank will increase the depreciation charge where useful lives are less than previously estimated, or it will write-off or write-down technically obsolete or non-strategic assets that have been abandoned or sold. The carrying values of property and equipment of the Group and the Parent are P5,943,421 and P5,478,999 as of December 31, 2014 and P5,069,832 and P4,981,525 as of December 31, 2013, respectively. 4. Cash and Other Cash Items
This account consists of: Group Parent
2014 2013 2014 2013
Cash on hand 23,991,772 20,077,969 23,991,754 20,077,683 Checks and other cash items 242,996 236,052 242,996 236,052 Returned checks and other cash items 8,151 36,610 8,151 36,610 Petty cash fund 4,137 3,857 3,982 3,731 Revolving fund 1,388 831 233 237 Payroll fund 573 536 573 536
24,249,017 20,355,855 24,247,689 20,354,849

32
5. Due from Bangko Sentral ng Pilipinas
This account represents the Parent‟s demand and special deposits in local currency maintained with BSP to meet reserve requirements and to serve as clearing account for interbank claims consistent with BSP guidelines. 6. Due from Other Banks
This account consists of:
Group Parent
2014 2013 2014 2013
Deposit with local banks 216,299 119,205 122,502 69,267 Deposit with foreign banks 6,168,740 3,077,076 6,162,883 3,071,220
6,385,039 3,196,281 6,285,385 3,140,487
The Group maintains nostro accounts on global basis with 22 foreign depository banks totaling 28 and 30 bank accounts in 2014 and 2013, respectively, the most significant of which are as follows:
2014 2013
1. Wells Fargo Bank, N.A. 2. Standard Chartered Bank, N.Y.
1. Wells Fargo Bank, N.A. 2. Standard Chartered Bank, N.Y.
3. The Bank of New York 3. Standard Chartered Bank, Tokyo 4. Standard Chartered Bank, Frankfurt 4. Mizuho Corporate Bank
5. Mizuho Corporate Bank 5. The Bank of New York
Deposits with foreign banks as of December 31, 2014 include special deposit account with Standard Chartered Bank - Tokyo and Bank of Tokyo-Mitsubishi, UFJ amounting to JPY393.22 million and JPY0.13 million, respectively, which are restricted for disbursements on special lending projects. 7. Interbank Loans Receivables
This account consists of the Parent‟s loans receivable from domestic and foreign banks amounting to P17,243,602 and P7,036,608 as of December 31, 2014 and 2013, respectively. Interbank loans receivable carry interest rates at December 31, as follows:
2014 2013
Domestic 2.31% to 3.22% 2.00% to 2.75% Foreign 0.05% to 0.18% 0.05% to 0.35%

33
8. Securities Purchased under Agreements to Resell
This account consists of:
Group Parent
2014 2013 2014 2013
Government Securities Purchased under
Reverse Repurchase Agreement 56,390,000 6,122,000 56,390,000 6,122,000
56,390,000 6,122,000 56,390,000 6,122,000
Securities Purchased under Agreements to Resell of the Group carry interest rate at 4.00 per cent and 3.50 per cent as of December 31, 2014 and 2013, respectively. 9. Financial Assets at Fair Value Through Profit or Loss
This consists of:
Group Parent
2014 2013 2014 2013
Government Securities – Domestic 13,059,318 6,215 13,059,318 6,215 Government Securities – Foreign 399,972 260,099 399,972 260,099 Private Securities – Domestic 46,634 92,116 46,634 92,116 Derivative with positive fair value 1,306,916 1,988,647 1,306,916 1,988,647
14,812,840 2,347,077 14,812,840 2,347,077
Financial Assets at Fair Value Through Profit or Loss (FVPL) of the Group carry interest rates at December 31 as follows: 2014 2013
Domestic 1.62% to 4.17% 4.80% to 10.50% Foreign 7.25% to 7.39% 1.62% to 8.00%
Financial Assets at FVPL includes the foreign exchange (FX) risk cover of the Parent's borrowings from multilateral agencies amounting to P1.19 billion in 2014 and P1.95 billion in 2013 which is treated as a derivative financial instrument per BSP Monetary Board Resolution No. 1063 dated August 14, 2008. Under a Memorandum of Agreement between the National Government (thru the Department of Finance) and the Parent, the former shall guarantee and assume the FX risk relating to foreign currency denominated borrowings from multilateral agencies (i.e. World Bank, Asian Development Bank, JICA, etc.) which are relent in local currencies. The fair value changes on the FX risk cover are reported immediately in the statement of comprehensive income. As of December 31, 2014, the outstanding notional amount of the FX risk cover amounted to US$7.77 million and JPY8,392.67 million. Prior to 2007, the value of the FX risk cover as an option derivative varies on the movement of the foreign exchange rates of the Bills Payable. Beginning 2007, in accordance with Monetary Board Resolution No. 1063 dated August 14, 2008, the Bank
34
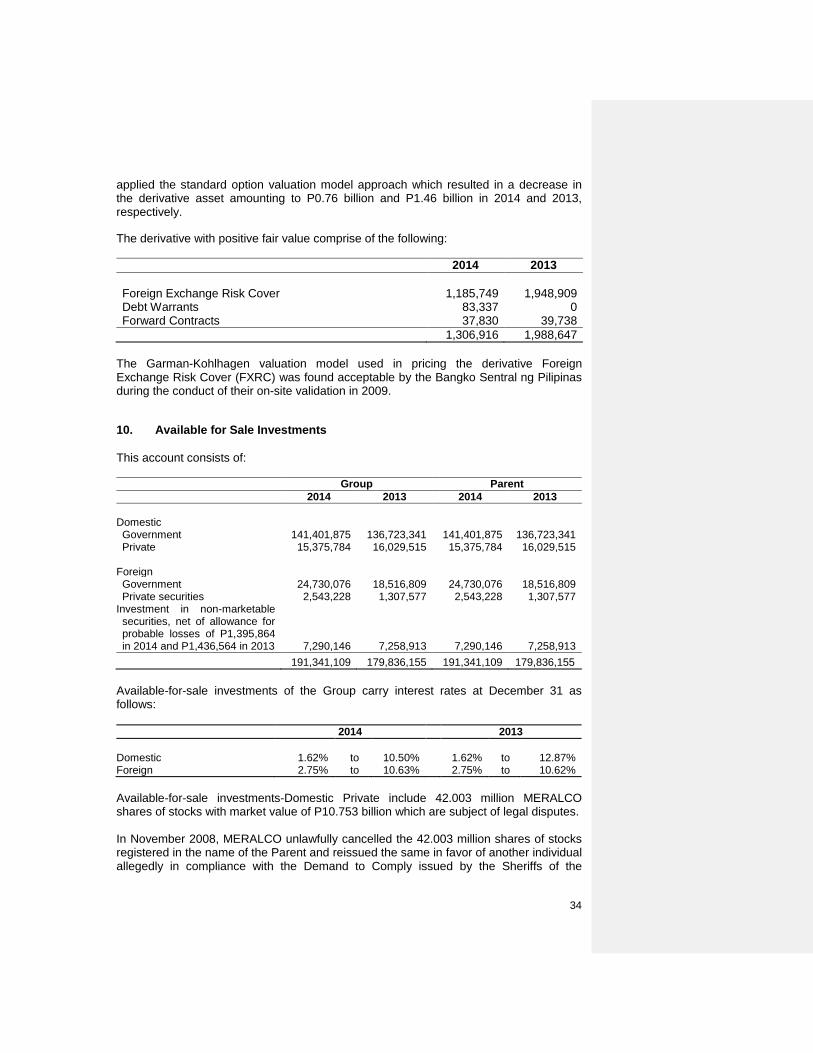
applied the standard option valuation model approach which resulted in a decrease in the derivative asset amounting to P0.76 billion and P1.46 billion in 2014 and 2013, respectively.
The derivative with positive fair value comprise of the following:
2014 2013
Foreign Exchange Risk Cover 1,185,749 1,948,909 Debt Warrants 83,337 0 Forward Contracts 37,830 39,738
1,306,916 1,988,647
The Garman-Kohlhagen valuation model used in pricing the derivative Foreign Exchange Risk Cover (FXRC) was found acceptable by the Bangko Sentral ng Pilipinas during the conduct of their on-site validation in 2009.
10. Available for Sale Investments
This account consists of:
Group Parent
2014 2013 2014 2013
Domestic Government 141,401,875 136,723,341 141,401,875 136,723,341 Private 15,375,784 16,029,515 15,375,784 16,029,515
Foreign Government 24,730,076 18,516,809 24,730,076 18,516,809 Private securities 2,543,228 1,307,577 2,543,228 1,307,577
Investment in non-marketable securities, net of allowance for probable losses of P1,395,864 in 2014 and P1,436,564 in 2013 7,290,146 7,258,913 7,290,146 7,258,913
191,341,109 179,836,155 191,341,109 179,836,155
Available-for-sale investments of the Group carry interest rates at December 31 as follows: 2014 2013
Domestic 1.62% to 10.50% 1.62% to 12.87% Foreign 2.75% to 10.63% 2.75% to 10.62%
Available-for-sale investments-Domestic Private include 42.003 million MERALCO shares of stocks with market value of P10.753 billion which are subject of legal disputes. In November 2008, MERALCO unlawfully cancelled the 42.003 million shares of stocks registered in the name of the Parent and reissued the same in favor of another individual allegedly in compliance with the Demand to Comply issued by the Sheriffs of the

35
Department of Agrarian Reform (DAR) Regional Adjudicator. Of these 42.003 million shares, 3.37 million shares had been negotiated by another party; 37.23 million shares remained quarantined at the Philippine Depository and Trust Corporation (PDTC); and another 1.4 million shares has not yet been lodged with PDTC. However, the execution sale which was the basis for the issuance of the Demand to Comply was null and void from the beginning because of the Supreme Court‟s Temporary Restraining Order (TRO) enjoining the sale and the Resolution quashing all acts done pursuant to the Adjudicator‟s Writ. On December 17, 2008, the DAR Adjudication Board so ordered and required: 1) For MERALCO to cancel the Stock Certificates issued in favor of another party; 2) To restore the ownership of the subject MERALCO shares of stock to the Land
Bank of the Philippines and to record the same in the Stock and Transfer Book of MERALCO; and
3) For the Philippine Stock Exchange, Inc. (PSE), the Philippine Depository and Trust Corporation (PDTC), the Securities Transfer Services, Inc. (STS), the Philippine Dealing System Holdings, Corp. and Subsidiaries (PDS Group) and any stockholder, dealer or agent of subject MERALCO shares to forthwith STOP: trading or dealing those shares and/or affecting settlement thereof, inter alia, so as to undo the foregoing contravening acts.
The Parent‟s shares of stock in MERALCO are not part of the Agrarian Reform Fund (ARF), a fund which is solely answerable to the obligation of the National Government pursuant to its Agrarian Reform Program. In accordance with Section 63 of Republic Act 6657 (Comprehensive Agrarian Reform Law), assets of the bank cannot be used to pay for land acquisition as this shall only be sourced from the ARF. In its December 14, 2011 Decision in G.R. No. 188376, the Supreme Court directed MERALCO to return to the Land Bank of the Philippines (LBP) 42,002,750 MERALCO shares of stock. The Supreme Court further declared that the MERALCO shares of stocks are corporates assets of LBP illegally taken to satisfy the payment of just compensation that should have been appropriated only from the ARF. This ruling has become final and executory on September 11, 2012 (Entry of Judgment). LBP immediately filed a motion before the Regional Agrarian Reform Adjudicator (RARAD) for the issuance of a writ of execution to implement the Supreme Court decision. This was, however, vigorously opposed by the other party. On April 1, 2013, the RARAD finally issued the Writ of Execution. As partial compliance, MERALCO delivered to LBP 38,635,950 shares including cash dividends in the total amount of P1,206,955,617.77; and property dividends consisting of 108,884,212 shares of stock in Rockwell Land Corporation.
Still undelivered are 3,366,800 shares, plus accrued cash dividends thereon, amounting to P161,303,398.00 as of September 30, 2014, plus 9,488,394 shares of stock in Rockwell Land Corporation as property dividends, and the unpaid dividends due from the 1,402,750 MERALCO shares amounting to P8,145,009.73. These 1.4 million shares are part of the 38.63 million shares restored to LBP, but certificated in the name of the other party before the Supreme Court decision was partially implemented.
36
To recover fully the MERALCO shares and dividends, LBP sent its June 18, 2014 Letter to the Office of the Regional Adjudicator Region IV – B (MIMAROPA) requesting the office to direct the Sheriff to perform all necessary acts for the full implementation of the April 1, 2013 Writ of Execution such as, but not limited to, the issuance of another Demand to Comply to be served upon MERALCO. LBP again sent the August 15, 2014 Letter to RARAD reiterating its request to expedite the full implementation of the Supreme Court‟s ruling in G.R. No. 188376 and to prevent further damage to LBP. On February 6, 2015, LBP received the January 24, 2014 Sheriff’s Report from the Sheriff of the Regional Adjudicator Region IV-B (MIMAROPA) regarding MERALCO‟s partial compliance of the December 14, 2011 Supreme Court Decision in G.R. No. 188376. LBP‟s June 18, 2014 Letter and August 15, 2014 Letter were not acted upon by the RARAD, and no further writ of execution or demand to comply were issued. Since RARAD no longer issued a writ of execution or demand to comply, LBP sent the February 11, 2015 Letter addressed to MERALCO to demand the delivery of the remaining 3,366,800 shares of stocks plus unpaid dividends. MERALCO failed to respond to LBP‟s demand. On account of the January 24, 2014 Sheriff’s Report and MERALCO‟s failure to respond to LBP‟s February 11, 2015 Letter, LBP prepared a petition for contempt against MERALCO and its representatives for failing to deliver the remaining 3,366,800 shares of stocks plus accrued dividends and the unpaid dividends due from the 1,402,750 MERALCO shares delivered to LBP, and to compel full compliance with the December 14, 2011 Supreme Court Decision.
On March 10, 2015, the petition was sent to the Office of the Government Corporate Counsel (OGCC) for review and signature. OGCC approved the filing of the petition before the Supreme Court. On April 14, 2015, the Petition to Cite Respondents in Indirect Contempt was filed before the Supreme Court. Parent‟s Accumulated market gains/losses on AFS government and private issues as of December 31, 2014 amounted to P15,856.43 million. Parent‟s Net unrealized gains/losses on AFS was P13,505.33 million. The difference in the amount outstanding of the local currency accumulated market gains/losses and net unrealized gains/losses on AFS as of December 31, 2014 in the amount of P2,351.10 million, represents the remaining unamortized portion of the net unrealized gain or loss, that has been recognized directly in equity when the Available-for-sale securities has been reclassified to Held to maturity securities on various dates. The said amount shall be continuously amortized to profit or loss over the remaining life of the Held-to-maturity securities. Total Investment in Non-Marketable Equity Securities (INMES) account of the Parent includes investment of US$143.15 million (P6,781.38 million) in Metro Rail Transit Corporation‟s (MRTC) preference shares and Unsecuritized Equity Rental Payments. In 2008, the National Government, as confirmed through Executive Order No. 855 dated January 18, 2010, instructed LBP and the Development Bank of the Philippines (DBP) to acquire majority interest in MRTC as a result of the recommendation made by the inter-agency Committee tasked to review the MRT III project. In the same year, the LBP
37
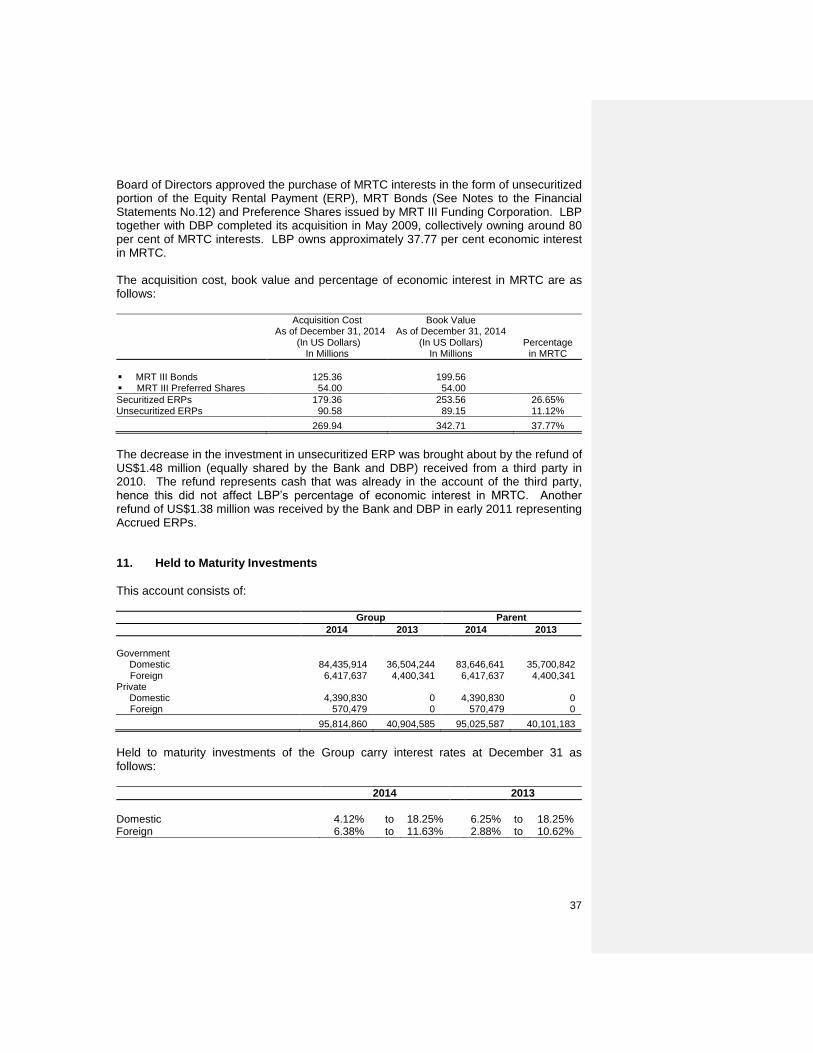
Board of Directors approved the purchase of MRTC interests in the form of unsecuritized portion of the Equity Rental Payment (ERP), MRT Bonds (See Notes to the Financial Statements No.12) and Preference Shares issued by MRT III Funding Corporation. LBP together with DBP completed its acquisition in May 2009, collectively owning around 80 per cent of MRTC interests. LBP owns approximately 37.77 per cent economic interest in MRTC. The acquisition cost, book value and percentage of economic interest in MRTC are as follows:
Acquisition Cost As of December 31, 2014
(In US Dollars) In Millions
Book Value As of December 31, 2014
(In US Dollars) In Millions
Percentage in MRTC
MRT III Bonds 125.36 199.56 MRT III Preferred Shares 54.00 54.00
Securitized ERPs 179.36 253.56 26.65% Unsecuritized ERPs 90.58 89.15 11.12%
269.94 342.71 37.77%
The decrease in the investment in unsecuritized ERP was brought about by the refund of US$1.48 million (equally shared by the Bank and DBP) received from a third party in 2010. The refund represents cash that was already in the account of the third party, hence this did not affect LBP‟s percentage of economic interest in MRTC. Another refund of US$1.38 million was received by the Bank and DBP in early 2011 representing Accrued ERPs. 11. Held to Maturity Investments
This account consists of:
Group Parent
2014 2013 2014 2013
Government
Domestic 84,435,914 36,504,244 83,646,641 35,700,842 Foreign 6,417,637 4,400,341 6,417,637 4,400,341
Private Domestic 4,390,830 0 4,390,830 0 Foreign 570,479 0 570,479 0
95,814,860 40,904,585 95,025,587 40,101,183
Held to maturity investments of the Group carry interest rates at December 31 as follows: 2014 2013
Domestic 4.12% to 18.25% 6.25% to 18.25% Foreign 6.38% to 11.63% 2.88% to 10.62%
38
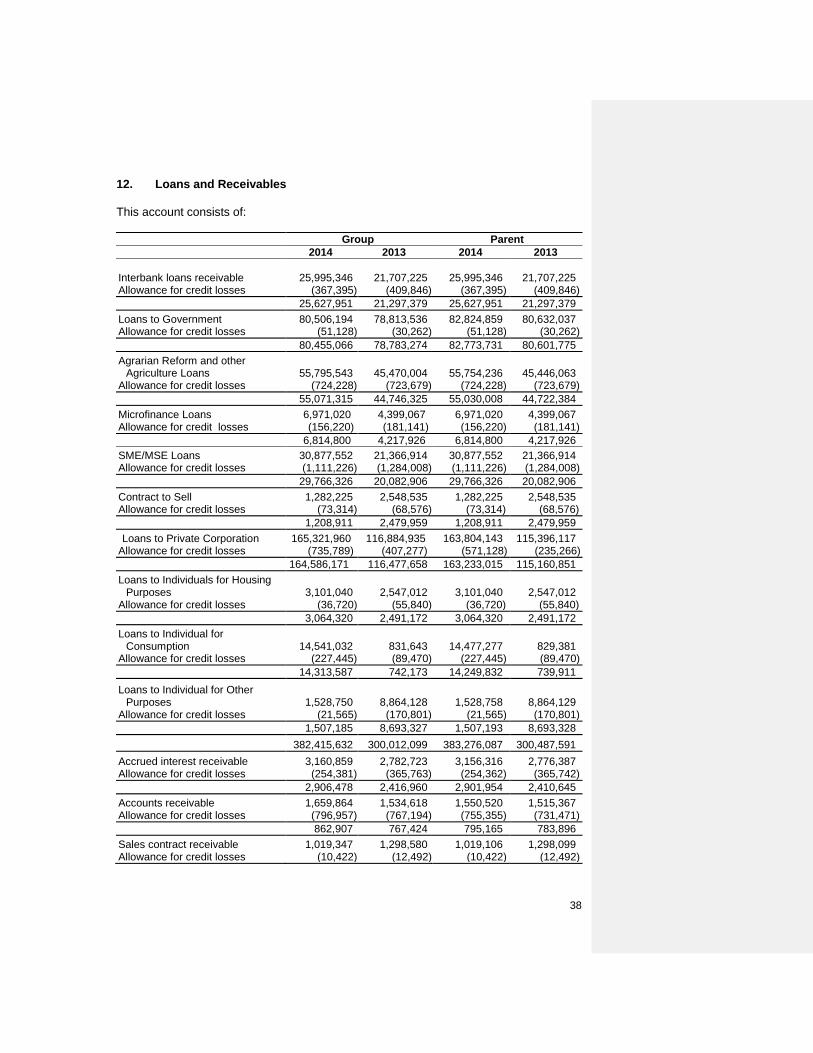
12. Loans and Receivables
This account consists of: Group Parent
2014 2013 2014 2013
Interbank loans receivable 25,995,346 21,707,225 25,995,346 21,707,225 Allowance for credit losses (367,395) (409,846) (367,395) (409,846)
25,627,951 21,297,379 25,627,951 21,297,379
Loans to Government 80,506,194 78,813,536 82,824,859 80,632,037 Allowance for credit losses (51,128) (30,262) (51,128) (30,262)
80,455,066 78,783,274 82,773,731 80,601,775
Agrarian Reform and other Agriculture Loans 55,795,543 45,470,004 55,754,236 45,446,063
Allowance for credit losses (724,228) (723,679) (724,228) (723,679)
55,071,315 44,746,325 55,030,008 44,722,384
Microfinance Loans 6,971,020 4,399,067 6,971,020 4,399,067 Allowance for credit losses (156,220) (181,141) (156,220) (181,141)
6,814,800 4,217,926 6,814,800 4,217,926
SME/MSE Loans 30,877,552 21,366,914 30,877,552 21,366,914 Allowance for credit losses (1,111,226) (1,284,008) (1,111,226) (1,284,008)
29,766,326 20,082,906 29,766,326 20,082,906
Contract to Sell 1,282,225 2,548,535 1,282,225 2,548,535 Allowance for credit losses (73,314) (68,576) (73,314) (68,576)
1,208,911 2,479,959 1,208,911 2,479,959
Loans to Private Corporation 165,321,960 116,884,935 163,804,143 115,396,117 Allowance for credit losses (735,789) (407,277) (571,128) (235,266)
164,586,171 116,477,658 163,233,015 115,160,851
Loans to Individuals for Housing Purposes 3,101,040 2,547,012 3,101,040 2,547,012
Allowance for credit losses (36,720) (55,840) (36,720) (55,840)
3,064,320 2,491,172 3,064,320 2,491,172
Loans to Individual for Consumption 14,541,032 831,643 14,477,277 829,381
Allowance for credit losses (227,445) (89,470) (227,445) (89,470)
14,313,587 742,173 14,249,832 739,911
Loans to Individual for Other Purposes 1,528,750
8,864,128 1,528,758
8,864,129 Allowance for credit losses (21,565) (170,801) (21,565) (170,801)
1,507,185 8,693,327 1,507,193 8,693,328
382,415,632 300,012,099 383,276,087 300,487,591
Accrued interest receivable 3,160,859 2,782,723 3,156,316 2,776,387 Allowance for credit losses (254,381) (365,763) (254,362) (365,742)
2,906,478 2,416,960 2,901,954 2,410,645
Accounts receivable 1,659,864 1,534,618 1,550,520 1,515,367 Allowance for credit losses (796,957) (767,194) (755,355) (731,471)
862,907 767,424 795,165 783,896
Sales contract receivable 1,019,347 1,298,580 1,019,106 1,298,099 Allowance for credit losses (10,422) (12,492) (10,422) (12,492)

39
Group Parent
2014 2013 2014 2013
1,008,925 1,286,088 1,008,684 1,285,607
Due from ARF 316,154 21,045 316,154 21,045
Unquoted debt securities 13,738,152 16,780,323 13,738,152 16,780,323 Allowance for credit losses (770,967) (766,807) (770,967) (766,807)
12,967,185 16,013,516 12,967,185 16,013,516
Lease contract receivable 1,730,336 1,922,660 0 0 Allowance for credit losses (20,945) (28,853) 0 0
1,709,391 1,893,807 0 0
402,186,672 322,410,939 401,265,229 321,002,300
Interest rates on loans in 2014 range from 1.337 per cent to 39.00 per cent for peso denominated loans and from 0.204 per cent to 30.00 per cent for foreign currency denominated loans. Unquoted debt securities of the Parent classified as loans consist of government and private securities amounting to P2,195.00 million and P10,722.74 million, respectively, as of December 31, 2014 and P4,460.71 million and P11,552.80 million, respectively, as of December 31, 2013. The account includes Metro Rail Transit Corporation‟s (MRTC) Bonds with book value of $199.56 million (P8,924.48 million) which form part of LBP‟s interests in the said company purchased in accordance with the approval of the Bank‟s Board of Directors in November 2008 and broken down as follows: Face Value Book Value
USD USD PHP
FX Regular 289.25 149.99 6,484.04 FCDU 115.57 54.57 2,440.44
404.82 194.56 8,924.48
Covered by Memorandum of Agreement (MOA) signed on August 22, 1988 between LBP and Bangko Sentral ng Pilipinas, the unpaid obligations of rural banks to BSP were converted into LBP equity contribution to said rural banks. Accordingly, these became non-interest bearing obligations of LBP with BSP and all expenses or losses, if any, which LBP may suffer under the conversion scheme, shall be for the account of BSP. Outstanding equity investments on closed rural banks and its corresponding borrowings account from BSP have been excluded from Unquoted Debt Securities Classified as Loans account and from the Bills Payable account, respectively, provided that these accounts have already been written-off by BSP. Allowance for credit losses The details of allowance for credit losses on loans of the Parent are:
2014 2013
Balance, January 1 3,248,889 4,214,884 Provision 0 1,274,712

40
Write-offs (560,159) (924,218) Transfers and other adjustments 651,639 (1,316,489)
Balance, December 31 3,340,369 3,248,889
As of December 31, 2014 and 2013, the breakdown of Gross Loans as to secured and unsecured follows:
Parent
2014 2013
Amount % Amount %
Secured loans: Guarantee of the Republic of the Philippines 64,885,108 16.78 59,069,775 19.45 Various guarantees 125,785,578 32.54 104,371,568 34.36 Various mortgages 94,176,989 24.36 70,091,303 23.08
284,847,675 73.68 233,532,646 76.89 Unsecured loans 101,768,781 26.32 70,203,834 23.11
Gross loan at amortized cost 386,616,456 100.00 303,736,480 100.00
Current banking regulations allow banks with no unbooked valuation reserves and capital adjustments to exclude from non-performing loan (NPL) classification those receivables from customers classified as loss in the latest examination of the BSP which are fully covered by allowance for credit losses, provided that interest on said receivables shall not be accrued. As of December 31, 2014 and 2013, the Parent‟s NPLs amounted to P6,821,304 and P7,317,991, respectively. Parent
2014 2013
Total NPLs 6,821,304 7,317,991 NPLs fully covered by allowance for credit losses (1,194,923) (1,312,686)
Net NPLs 5,626,381 6,005,305
Under banking regulations, NPLs shall, as a general rule, refer to loan accounts whose principal and/or interest is unpaid for thirty (30) days or more after due date or after they have become past due in accordance with existing rules and regulations. This shall apply to loans receivable in lump sum and loans receivable in quarterly, semi-annual, or annual installments, in which case, the total outstanding balance thereof shall be considered non-performing. Restructured loans which do not meet the requirements to be treated as performing loans are also part of the Parent‟s non-performing loans. 13. Investment in Subsidiaries
This account consists of the following investments in subsidiaries which are 100 per cent owned by the Parent and are accounted for at cost:
Name Amount
LBP Leasing Corporation 310,253
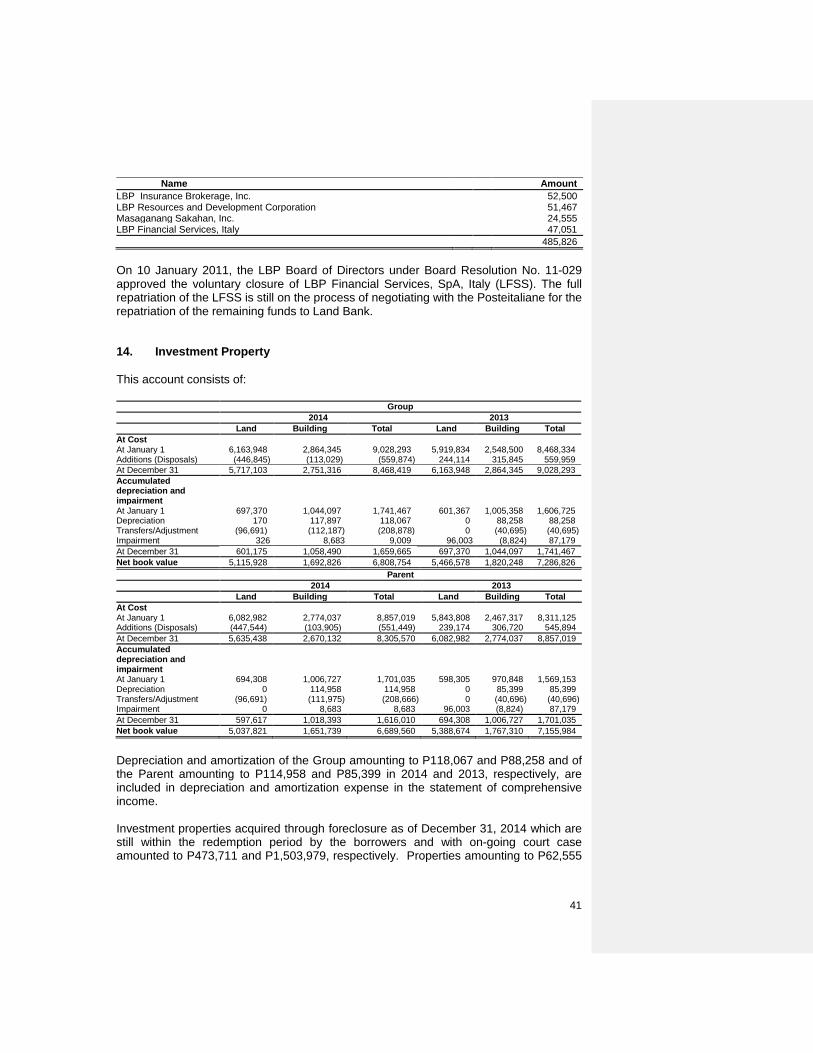
41
Name Amount
LBP Insurance Brokerage, Inc. 52,500 LBP Resources and Development Corporation 51,467 Masaganang Sakahan, Inc. 24,555 LBP Financial Services, Italy 47,051
485,826
On 10 January 2011, the LBP Board of Directors under Board Resolution No. 11-029 approved the voluntary closure of LBP Financial Services, SpA, Italy (LFSS). The full repatriation of the LFSS is still on the process of negotiating with the Posteitaliane for the repatriation of the remaining funds to Land Bank. 14. Investment Property
This account consists of:
Group
2014 2013
Land Building Total Land Building Total
At Cost At January 1 6,163,948 2,864,345 9,028,293 5,919,834 2,548,500 8,468,334 Additions (Disposals) (446,845) (113,029) (559,874) 244,114 315,845 559,959
At December 31 5,717,103 2,751,316 8,468,419 6,163,948 2,864,345 9,028,293
Accumulated depreciation and impairment At January 1 697,370 1,044,097 1,741,467 601,367 1,005,358 1,606,725 Depreciation 170 117,897 118,067 0 88,258 88,258 Transfers/Adjustment (96,691) (112,187) (208,878) 0 (40,695) (40,695) Impairment 326 8,683 9,009 96,003 (8,824) 87,179
At December 31 601,175 1,058,490 1,659,665 697,370 1,044,097 1,741,467
Net book value 5,115,928 1,692,826 6,808,754 5,466,578 1,820,248 7,286,826
Parent
2014 2013
Land Building Total Land Building Total
At Cost At January 1 6,082,982 2,774,037 8,857,019 5,843,808 2,467,317 8,311,125 Additions (Disposals) (447,544) (103,905) (551,449) 239,174 306,720 545,894
At December 31 5,635,438 2,670,132 8,305,570 6,082,982 2,774,037 8,857,019
Accumulated depreciation and impairment At January 1 694,308 1,006,727 1,701,035 598,305 970,848 1,569,153 Depreciation 0 114,958 114,958 0 85,399 85,399 Transfers/Adjustment (96,691) (111,975) (208,666) 0 (40,696) (40,696) Impairment 0 8,683 8,683 96,003 (8,824) 87,179
At December 31 597,617 1,018,393 1,616,010 694,308 1,006,727 1,701,035
Net book value 5,037,821 1,651,739 6,689,560 5,388,674 1,767,310 7,155,984
Depreciation and amortization of the Group amounting to P118,067 and P88,258 and of the Parent amounting to P114,958 and P85,399 in 2014 and 2013, respectively, are included in depreciation and amortization expense in the statement of comprehensive income. Investment properties acquired through foreclosure as of December 31, 2014 which are still within the redemption period by the borrowers and with on-going court case amounted to P473,711 and P1,503,979, respectively. Properties amounting to P62,555

42
are agricultural lands covered by the government‟s agrarian reform program. As of December 31, 2014 and 2013, the aggregate market value of the investment properties amounted to P8,837,640 and P9,747,624, respectively, for the Group and P8,702,231 and P9,610,693, respectively, for the Parent. Fair value has been determined based on valuations made by independent and/or in-house appraisers. Valuations were derived on the basis of recent sales of similar properties in the same area as the investment properties and taking into account the economic conditions prevailing at the time the valuations were made. 15. Property and Equipment
This account consists of:
Group
Land
Building Under
Construction Buildings
Leasehold Rights and
Improvements
Transportation and
Equipment Furniture and
Office Equipment
Transportation Equipment Under
Lease Others
Total
2014 2013
At Cost
At January 1 548,536 7,088 4,383,936 442,292 90,398 5,323,108 355,929 70,011 11,221,298 10,606,331
Additions 26,519 179,783 82,745 140,841 3,329 847,795 373,115 6,033 1,660,160 1,070,967
Disposals 0 0 (109) (3,763) (8,063) (189,897) 0 0 (201,832) (244,346)
Transfers (199) (46,500) 3,221 (18,726) (4,238) (193,965) (9,602) (278) (270,287) (211,654)
At December 31 574,856 140,371 4,469,793 560,644 81,426 5,787,041 719,442 75,766 12,409,339 11,221,298
Accumulated Depreciation, Amortization & Impairment loss
At January 1 0 0 1,874,130 193,989 62,834 3,683,584 261,325 61,681 6,137,543 5,833,257
Depreciation & amortization 0 0 91,120 43,761 1,669 340,767 29,222 4,273 510,812 524,792
Disposals 0 0 (83) (1,122) (7,755) (177,586) 0 0 (186,546) (224,998)
Transfers/Adjustments 0 0 (5,309) 5,545 301 (23,401) 9,576 (6,790) (20,078) 4,492
At December 31 0 0 1,959,858 242,173 57,049 3,823,364 300,123 59,164 6,441,731 6,137,543
Allow for Losses 0 0 7,214 137 2,825 7,450 0 6,561 24,187 13,923
Net book value 574,856 140,371 2,502,721 318,334 21,552 1,956,227 419,319 10,041 5,943,421 5,069,832
Parent
Land
Building Under
Construction Buildings
Leasehold Rights and
Improvements
Transportation and
Equipment
Furniture and Office
Equipment
Transportation Equipment Under
Lease Others
Total
2014 2013
At Cost
At January 1 548,536 7,088 4,303,623 442,119 74,168 5,292,232 295,340 57,878 11,020,984 10,421,728
Additions 26,519 179,783 73,621 140,801 2,165 845,377 0 0 1,268,266 1,054,758
Disposals 0 0 (109) (3,763) (8,063) (187,602) 0 0 (199,537) (244,134)
Transfers (199) (46,500) 3,221 (18,640) (4,237) (193,965) (9,602) (279) (270,201) (211,368)
At December 31 574,856 140,371 4,380,356 560,517 64,033 5,756,042 285,738 57,599 11,819,512 11,020,984
Accumulated Depreciation & Amortization
At January 1 0 0 1,844,306 193,903 54,078 3,660,195 215,260 57,794 6,025,536 5,729,652
Depreciation & amortization 0 0 87,860 43,653 198 339,223 25,350 0 496,284 516,099
Disposals 0 0 (83) (1,122) (7,755) (176,329) 0 0 (185,289) (224,958)
Transfers/Adjustments 0 0 (5,522) 5,631 302 (23,402) 9,576 (6,790) (20,205) 4,743
At December 31 0 0 1,926,561 242,065 46,823 3,799,687 250,186 51,004 6,316,326 6,025,536
Allow for Losses 0 0 7,214 137 2,825 7,450 0 6,561 24,187 13,923
Net book value 574,856 140,371 2,446,581 318,315 14,385 1,948,905 35,552 34 5,478,999 4,981,525
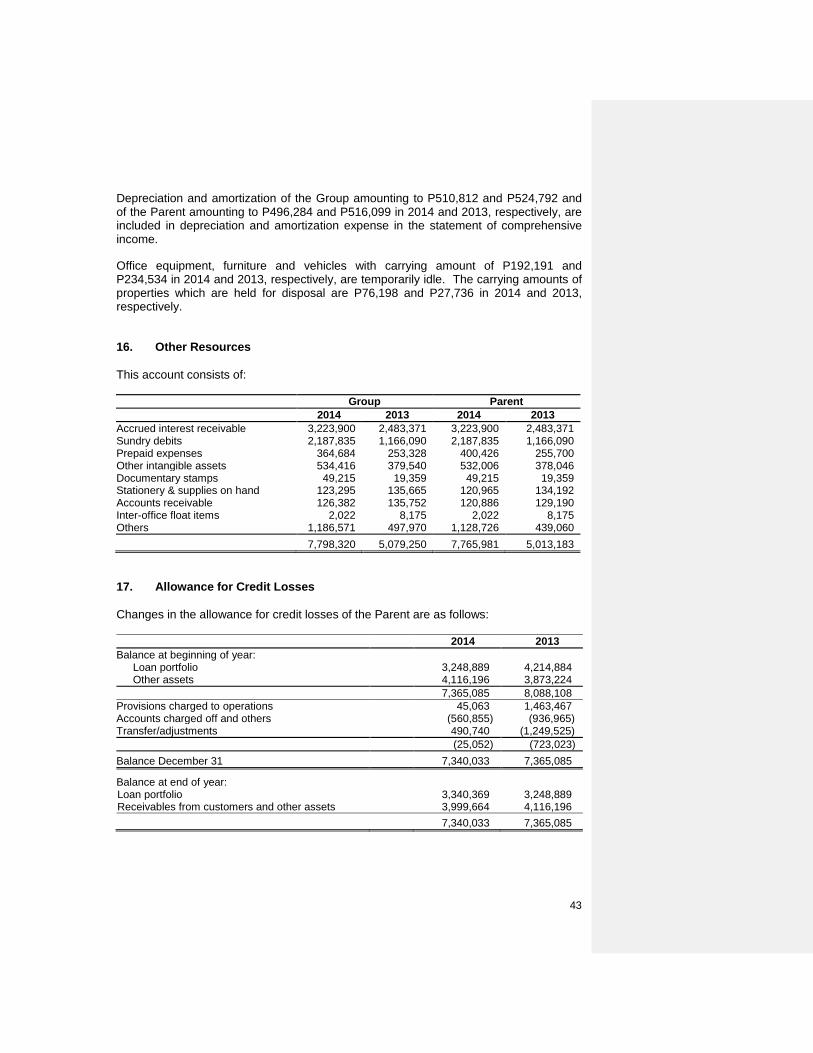
43
Depreciation and amortization of the Group amounting to P510,812 and P524,792 and of the Parent amounting to P496,284 and P516,099 in 2014 and 2013, respectively, are included in depreciation and amortization expense in the statement of comprehensive income.
Office equipment, furniture and vehicles with carrying amount of P192,191 and P234,534 in 2014 and 2013, respectively, are temporarily idle. The carrying amounts of properties which are held for disposal are P76,198 and P27,736 in 2014 and 2013, respectively. 16. Other Resources
This account consists of:
Group Parent
2014 2013 2014 2013
Accrued interest receivable 3,223,900 2,483,371 3,223,900 2,483,371 Sundry debits 2,187,835 1,166,090 2,187,835 1,166,090 Prepaid expenses 364,684 253,328 400,426 255,700 Other intangible assets 534,416 379,540 532,006 378,046 Documentary stamps 49,215 19,359 49,215 19,359 Stationery & supplies on hand 123,295 135,665 120,965 134,192 Accounts receivable 126,382 135,752 120,886 129,190 Inter-office float items 2,022 8,175 2,022 8,175 Others 1,186,571 497,970 1,128,726 439,060
7,798,320 5,079,250 7,765,981 5,013,183
17. Allowance for Credit Losses
Changes in the allowance for credit losses of the Parent are as follows: 2014 2013
Balance at beginning of year: Loan portfolio 3,248,889 4,214,884 Other assets 4,116,196 3,873,224
7,365,085 8,088,108
Provisions charged to operations 45,063 1,463,467 Accounts charged off and others (560,855) (936,965) Transfer/adjustments 490,740 (1,249,525)
(25,052) (723,023)
Balance December 31 7,340,033 7,365,085
Balance at end of year: Loan portfolio 3,340,369 3,248,889 Receivables from customers and other assets 3,999,664 4,116,196
7,340,033 7,365,085

44
With the foregoing level of allowance for credit losses, Management believes that the Parent has sufficient allowance to cover any losses that the Parent may incur from the non-collection or non-realization of its loans and receivables and other risk assets. The account includes provision for credit losses/impairment losses of P45,063 for the year detailed as follows: Parent
Loans and receivables 0
Other loans and receivables 10,073
Property and equipment 4,324
Others 30,666
45,063
18. Deposit Liabilities
This account consists of:
Group Parent
2014 2013 2014 2013
Domestic Demand deposits 392,016,125 348,115,219 392,226,721 348,297,024 Savings deposits 458,518,376 315,781,131 458,673,787 315,892,068 Time certificate of deposits 1,250,401 1,412,692 1,250,401 1,412,692 Long Term Negotiable
Certificate of Deposits 5,000,000 5,000,180 5,000,000 5,000,180
856,784,902 670,309,222 857,150,909 670,601,964
Foreign Savings deposit –FCDU/EFCDU 10,744,068 8,235,863 10,750,022 8,242,106 Time certificate of deposit-
FCDU/EFCDU 45,050,705 25,214,069 45,050,705 25,214,069
55,794,773 33,449,932 55,800,727 33,456,175
912,579,675 703,759,154 912,951,636 704,058,139
Domestic deposit liabilities earn annual fixed interest rates ranging from 0.25 to 3.50 per cent in 2014 and 0.18 to 5.37 per cent in 2013. Foreign deposit rates range from 0.15 to 2.50 per cent and from 0.13 to 2.45 per cent in 2014 and 2013, respectively.
19. Bills Payable
This account consists of: Group Parent
2014 2013 2014 2013
Bangko Sentral ng Pilipinas 97,860 98,049 97,860 98,049 Domestic borrowings 458,026 838,946 458,026 554,946 Foreign borrowings 19,685,242 22,917,368 19,685,242 22,917,368
20,241,128 23,854,363 20,241,128 23,570,363
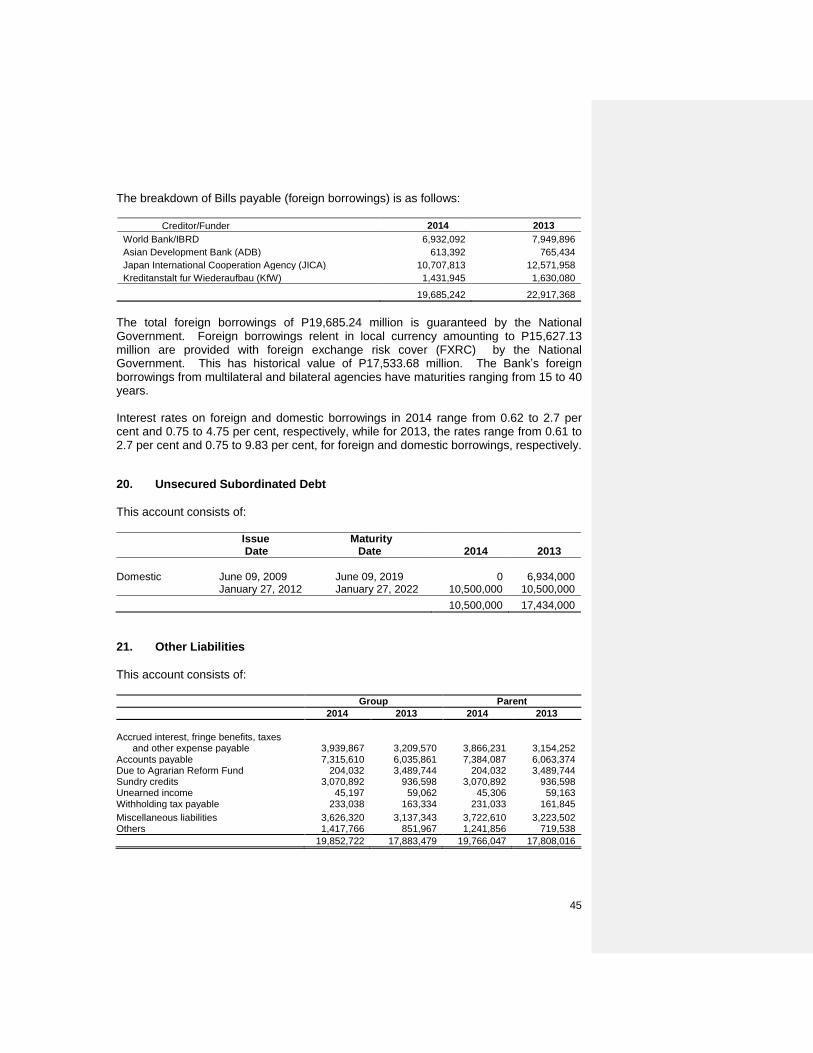
45
The breakdown of Bills payable (foreign borrowings) is as follows:
Creditor/Funder 2014 2013
World Bank/IBRD 6,932,092 7,949,896
Asian Development Bank (ADB) 613,392 765,434
Japan International Cooperation Agency (JICA) 10,707,813 12,571,958
Kreditanstalt fur Wiederaufbau (KfW) 1,431,945 1,630,080
19,685,242 22,917,368
The total foreign borrowings of P19,685.24 million is guaranteed by the National Government. Foreign borrowings relent in local currency amounting to P15,627.13 million are provided with foreign exchange risk cover (FXRC) by the National Government. This has historical value of P17,533.68 million. The Bank‟s foreign borrowings from multilateral and bilateral agencies have maturities ranging from 15 to 40 years. Interest rates on foreign and domestic borrowings in 2014 range from 0.62 to 2.7 per cent and 0.75 to 4.75 per cent, respectively, while for 2013, the rates range from 0.61 to 2.7 per cent and 0.75 to 9.83 per cent, for foreign and domestic borrowings, respectively.
20. Unsecured Subordinated Debt
This account consists of: Issue Maturity Date Date
2014
2013
Domestic June 09, 2009 June 09, 2019 0 6,934,000 January 27, 2012 January 27, 2022 10,500,000 10,500,000
10,500,000 17,434,000
21. Other Liabilities
This account consists of:
Group Parent
2014 2013 2014 2013
Accrued interest, fringe benefits, taxes and other expense payable 3,939,867 3,209,570 3,866,231 3,154,252
Accounts payable 7,315,610 6,035,861 7,384,087 6,063,374 Due to Agrarian Reform Fund 204,032 3,489,744 204,032 3,489,744 Sundry credits 3,070,892 936,598 3,070,892 936,598 Unearned income 45,197 59,062 45,306 59,163 Withholding tax payable 233,038 163,334 231,033 161,845
Miscellaneous liabilities 3,626,320 3,137,343 3,722,610 3,223,502 Others 1,417,766 851,967 1,241,856 719,538
19,852,722 17,883,479 19,766,047 17,808,016

46
22. Income and Other Taxes
Under Philippine tax laws, the Regular Banking Unit of the Parent is subject to percentage and other taxes (presented as Taxes and Licenses in the statement of comprehensive income) as well as income taxes. Percentage and other taxes paid consist principally of gross receipts tax and documentary stamp taxes. Income taxes include the corporate income tax and final withholding tax on gross interest income from government securities, deposits and other deposit substitutes. These income taxes and deferred tax benefits are presented in the statement of comprehensive income either Provision for or (Benefit from) Income Tax. Based on Republic Act 9337, which was passed into law in May 2005 and amended certain provisions of the National Internal Revenue Code of 1997, the normal corporate income tax rate is 30 per cent effective January 1, 2009. The interest allowed as deductible expense is reduced by an amount equivalent to 33 per cent of the interest income subjected to final tax. FCDU offshore income (income from non-residents) derived by depository banks under the expanded foreign currency deposit system is exempt from income tax while gross onshore income (income from residents) from other FCDUs and other depository banks under the Expanded Foreign Currency Deposit System, including interest income from foreign currency loans, is subject to 10 per cent final tax. Interest income derived by resident individual or corporation on deposits with other FCDUs and Offshore Banking Units (OBU) are subject to 7.5 per cent final tax. The provision for/(benefit from) income tax consists of:
Group Parent
2014 2013 2014 2013
Current: Normal income tax (NIT) 1,001,385 2,845,399 913,540 2,769,835 Minimum corporate income tax (MCIT) 0 0 0 0
1,001,385 2,845,399 913,540 2,769,835 Deferred 142,355 276,427 140,771 277,284
1,143,740 3,121,826 1,054,311 3,047,119
The reconciliation of the provision for income tax computed at the statutory tax rate and actual provision is as follows:
Group Parent
2014 2013 2014 2013
Statutory income tax 3,980,985 4,411,686 3,877,796 4,311,123 Tax effects of:
FCDU income (577,676) (536,930) (577,676) (536,930) Tax exempt & tax paid income (4,014,556) (3,415,292) (4,004,024) (3,404,370) Other deductible/Non-deductible expense 1,114 336,840 1,114 336,370 Non-deductible interest expense 1,323,537 1,204,892 1,323,537 1,204,892 Deferred tax asset 142,355 276,427 140,771 277,284 Others 287,981 844,203 292,793 858,750
1,143,740 3,121,826 1,054,311 3,047,119

47
There was no deferred tax asset recognized by the Parent for CY 2014. Subsidiaries recognized deferred tax assets of P65.171 million and P66.790 million for CY 2014 and CY 2013, respectively. Below are the temporary differences for which no deferred tax asset is recognized by the Parent since Management believes that it is not probable that future taxable profits will be available against which the asset can be utilized:
2014 2013
Allowance for credit losses 12,999,720 13,512,037
12,999,720 13,512,037
Report on the Supplementary Information Required Under Revenue Regulations (RR) No. 19-2011 and 15-2010
Supplementary information Under RR No. 19-2011 In addition to the required supplementary information under RR No. 15-2010, on December 9, 2011, the BIR issued RR No. 19-2011 (and as further amended by RR No. 2-2014 dated January 24, 2014) which prescribes the new annual income tax forms that will be used for filing effective taxable year 2011. Specifically, companies are required to disclose certain tax information in their respective notes to financial statements. For the taxable year December 31, 2014, the Parent Company reported the following revenues and expenses for income tax purposes: Revenues
Services/operations 18,313,106
Non-operating and taxable other income: Trading and securities gain 2,210,065 Service charges, fees and commissions 1,186,680 Profit from assets sold 202,521 Income from trust operations 158,022 Others 736,193
4,493,481
Expenses Cost of services: Compensation and fringe benefits 5,746,258 Others 5,571,174
11,317,432
Itemized deductions: Compensation and fringe benefits 1,467,818 Taxes and licenses 2,033,460 Security, messengerial and janitorial 590,748 Communications, light and water 388,309 Information technology expenses 366,144 Depreciation and amortization 247,580 Bad debts 565,750
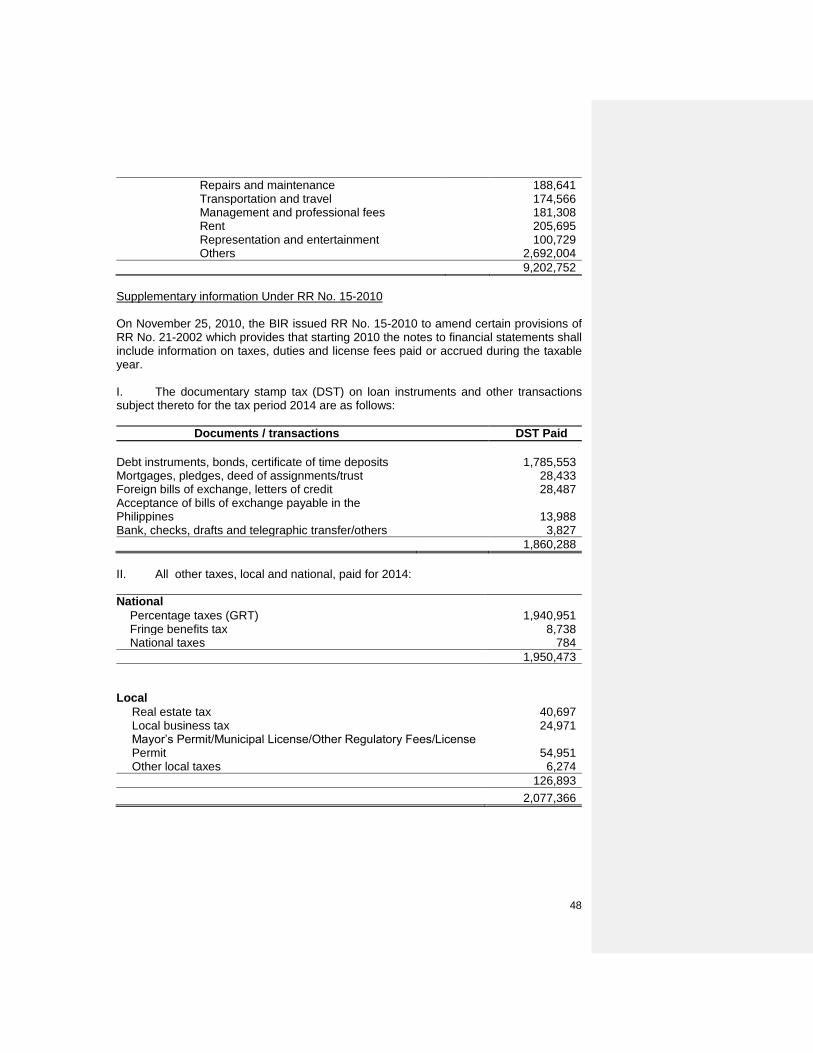
48
Repairs and maintenance 188,641 Transportation and travel 174,566 Management and professional fees 181,308 Rent 205,695 Representation and entertainment 100,729 Others 2,692,004
9,202,752
Supplementary information Under RR No. 15-2010 On November 25, 2010, the BIR issued RR No. 15-2010 to amend certain provisions of RR No. 21-2002 which provides that starting 2010 the notes to financial statements shall include information on taxes, duties and license fees paid or accrued during the taxable year. I. The documentary stamp tax (DST) on loan instruments and other transactions subject thereto for the tax period 2014 are as follows:
Documents / transactions DST Paid
Debt instruments, bonds, certificate of time deposits 1,785,553 Mortgages, pledges, deed of assignments/trust 28,433 Foreign bills of exchange, letters of credit 28,487 Acceptance of bills of exchange payable in the Philippines
13,988
Bank, checks, drafts and telegraphic transfer/others 3,827
1,860,288
II. All other taxes, local and national, paid for 2014: National
Percentage taxes (GRT) 1,940,951 Fringe benefits tax 8,738 National taxes 784
1,950,473 Local
Real estate tax 40,697 Local business tax 24,971 Mayor‟s Permit/Municipal License/Other Regulatory Fees/License Permit 54,951 Other local taxes 6,274
126,893
2,077,366
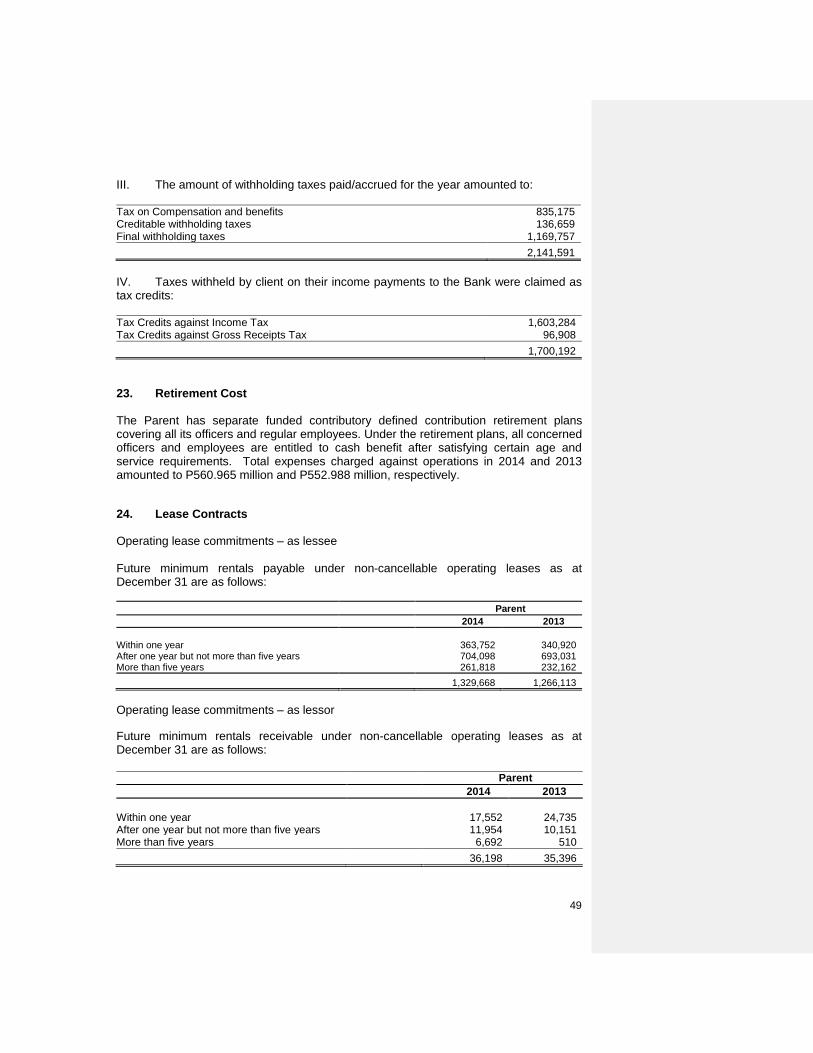
49
III. The amount of withholding taxes paid/accrued for the year amounted to: Tax on Compensation and benefits 835,175 Creditable withholding taxes 136,659 Final withholding taxes 1,169,757
2,141,591
IV. Taxes withheld by client on their income payments to the Bank were claimed as tax credits: Tax Credits against Income Tax 1,603,284 Tax Credits against Gross Receipts Tax 96,908
1,700,192
23. Retirement Cost
The Parent has separate funded contributory defined contribution retirement plans covering all its officers and regular employees. Under the retirement plans, all concerned officers and employees are entitled to cash benefit after satisfying certain age and service requirements. Total expenses charged against operations in 2014 and 2013 amounted to P560.965 million and P552.988 million, respectively.
24. Lease Contracts
Operating lease commitments – as lessee Future minimum rentals payable under non-cancellable operating leases as at December 31 are as follows:
Parent
2014 2013
Within one year 363,752 340,920 After one year but not more than five years 704,098 693,031 More than five years 261,818 232,162
1,329,668 1,266,113
Operating lease commitments – as lessor
Future minimum rentals receivable under non-cancellable operating leases as at December 31 are as follows:
Parent
2014 2013
Within one year 17,552 24,735 After one year but not more than five years 11,954 10,151 More than five years 6,692 510
36,198 35,396

50
25. Related Party Transactions
In the ordinary course of business, the Parent has loan transactions with certain directors, officers, stockholders and related interests (DOSRI). Existing banking regulations limit the amount of individual loans to DOSRI, 70 per cent of which must be secured by their respective deposits and book value of their respective investments in the Parent. In the aggregate, loans to DOSRI generally should not exceed the respective total unimpaired capital or 15 per cent of total loan portfolio, whichever is lower, of the Parent. BSP Circular No. 547 dated September 21, 2006 prescribed the DOSRI rules for government borrowings in government-owned or controlled banks. Said circular considered as indirect borrowings of the Republic of the Philippines (ROP), loans, other credit accommodations and guarantees to: (a) Government-Owned and Controlled Corporations (GOCCs); and (b) Corporations where the ROP, its agencies/departments/ bureaus, and/or GOCCs own at least 20 per cent of the subscribed capital stocks. Total outstanding DOSRI loans of the Parent as of December 31, 2014 amounted to P72,508 million of which P71,673 million are government borrowings covered by BSP Circular No. 547. The following are the significant transactions of the Parent with related parties:
2014 2013
Key Management
Personnel Subsidiaries
Others (GOCCs, Provident Fund and
Rural Banks) Total
Key Management
Personnel Subsidiaries
Others (GOCCs, Provident Fund and
Rural Banks) Total
Receivables from customers 30,033 2,411,294 71,673,465 74,114,792 24,758 1,911,545 64,439,892 66,376,195
Deposit liabilities 0 371,961 0 371,961 0 298,985 0 298,985
Other liabilities 0 551,593 0 551,593 0 472,500 0 472,500
30,033 3,334,848 71,673,465 75,038,346 24,758 2,683,030 64,439,892 67,147,680
The following are the significant transactions with subsidiaries:
2014 2013
Sales/(Purchases) (26,242) (24,168) Interest income 70,488 65,639 Interest expense (166,795) (169,755) Lease expense (44,553) (45,907) Other income 1,404 1,657 Other expenses (336,573) (32,139)
(502,271) (204,673)
Transactions with other related parties: Compensation of key management personnel:
Group Parent
2014 2013 2014 2013
Short-term employee benefits 133,614 121,113 115,809 106,421 Post-employment benefits 32,821 31,141 27,754 26,189

51
Group Parent
2014 2013 2014 2013
Other long-term benefits 45,243 37,428 45,243 37,428
211,678 189,682 188,806 170,038
Terms and conditions of transactions with related parties:
The sales to and purchases from related parties are made at normal market prices and settlement is made in cash. There have been no guarantees provided or received for any related party receivables or payables. For the years ended December 31, 2014 and 2013, the Group has not made any provision for doubtful accounts relating to amounts owed by related parties. This assessment is undertaken each financial year through examination of the financial position of the related party and the market in which the related party operates. 26. Trust Operations The Parent is authorized under its Charter to offer trust services and administer trust funds through its Trust Banking Group. The Parent accepts funds entrusted by clients and undertakes as trustee to invest such funds in acceptable securities or other investment outlets. Trust funds or assets under Management of the Parent under its trust operations amounted to P80,852,721 and P57,263,059 as at December 31, 2014 and 2013, respectively. Summary of Assets under Management is as follows:
2014 2013
Special Purpose Trust 2,424,237 3,246,336 Other Fiduciary Accounts 15,691,151 9,193,862 Agency 22,298,110 24,850,846 Trust 40,439,223 19,972,015
80,852,721 57,263,059
In compliance with the requirements of the General Banking Law, government securities with total face value of P950,000 in 2014 and P950,000 in 2013 are deposited with BSP as security for the Parent‟s faithful performance of its fiduciary obligation. 27. Derivative Financial Instruments
For Derivative instruments, fair values are estimated based on quoted market prices, prices provided by independent parties or values determined using accepted valuation models with observable inputs.

52
Freestanding Derivatives Currency Forwards
As of December 31, 2014, the outstanding notional amount of the currency sell forward/swap agreements with maturity of less than six months amounted to P19,006.00 million with market value of P19,027.35 million while the currency bought amounted to P670.80 million with a market value of P671.47 million. Over the Counter Interest Rate Option Contract Bought As of December 31, 2014, the outstanding notional amount of the debt warrants bought to mature on November 29, 2032 amounted to P68.91 million with market value of P83.34 million. Foreign Exchange (FX) Risk Cover
The foreign exchange risk cover on foreign borrowings is a derivative financial instrument per BSP Monetary Board Resolution No. 1063 dated August 14, 2008 and its fair value changes are reported in the statement of comprehensive income. As of December 31, 2014, the outstanding notional amount of the FX risk cover amounted to US$7.77 million and JPY8,392.67 million. Embedded Derivatives Embedded Credit Derivatives
This includes credit default swaps embedded in host debt instruments and with credit linkages to reference entities. Embedded Optionalities in Debt Investments This includes call, put, extension, and conversion options in debt securities and loan receivables. The embedded call, put and extension options are deemed to be closely related to their host contracts, while the put option embedded in a debt investment is not deemed to be significant. Embedded Currency Derivatives The Group has currency derivatives embedded in host non-financial contracts such as lease agreements and purchase orders. 28. Commitments and Contingent Liabilities
In the normal course of business, the Group makes various commitments and incurs certain contingent liabilities which are not presented in the financial statements. The Group does not anticipate material losses from these commitments and contingent liabilities.
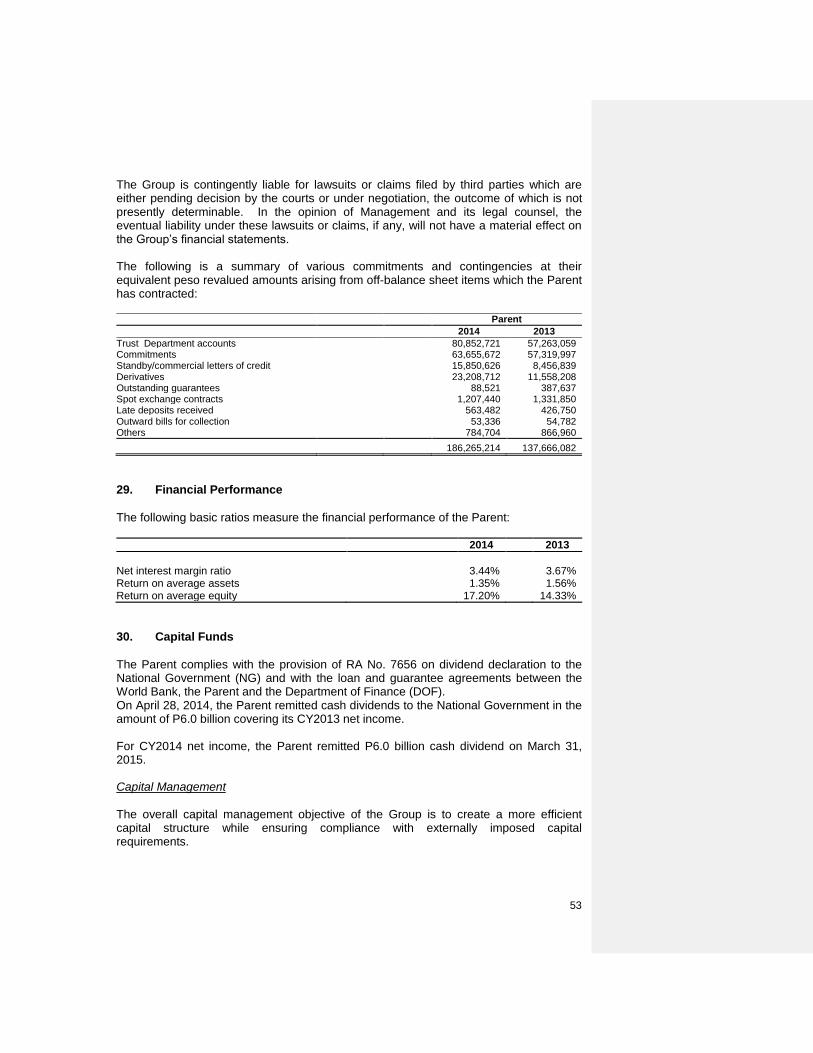
53
The Group is contingently liable for lawsuits or claims filed by third parties which are either pending decision by the courts or under negotiation, the outcome of which is not presently determinable. In the opinion of Management and its legal counsel, the eventual liability under these lawsuits or claims, if any, will not have a material effect on the Group‟s financial statements. The following is a summary of various commitments and contingencies at their equivalent peso revalued amounts arising from off-balance sheet items which the Parent has contracted:
Parent
2014 2013
Trust Department accounts 80,852,721 57,263,059 Commitments 63,655,672 57,319,997 Standby/commercial letters of credit 15,850,626 8,456,839 Derivatives 23,208,712 11,558,208 Outstanding guarantees 88,521 387,637 Spot exchange contracts 1,207,440 1,331,850 Late deposits received 563,482 426,750 Outward bills for collection 53,336 54,782 Others 784,704 866,960
186,265,214 137,666,082
29. Financial Performance
The following basic ratios measure the financial performance of the Parent: 2014 2013
Net interest margin ratio 3.44% 3.67% Return on average assets 1.35% 1.56% Return on average equity 17.20% 14.33%
30. Capital Funds
The Parent complies with the provision of RA No. 7656 on dividend declaration to the National Government (NG) and with the loan and guarantee agreements between the World Bank, the Parent and the Department of Finance (DOF). On April 28, 2014, the Parent remitted cash dividends to the National Government in the amount of P6.0 billion covering its CY2013 net income. For CY2014 net income, the Parent remitted P6.0 billion cash dividend on March 31, 2015. Capital Management
The overall capital management objective of the Group is to create a more efficient capital structure while ensuring compliance with externally imposed capital requirements.
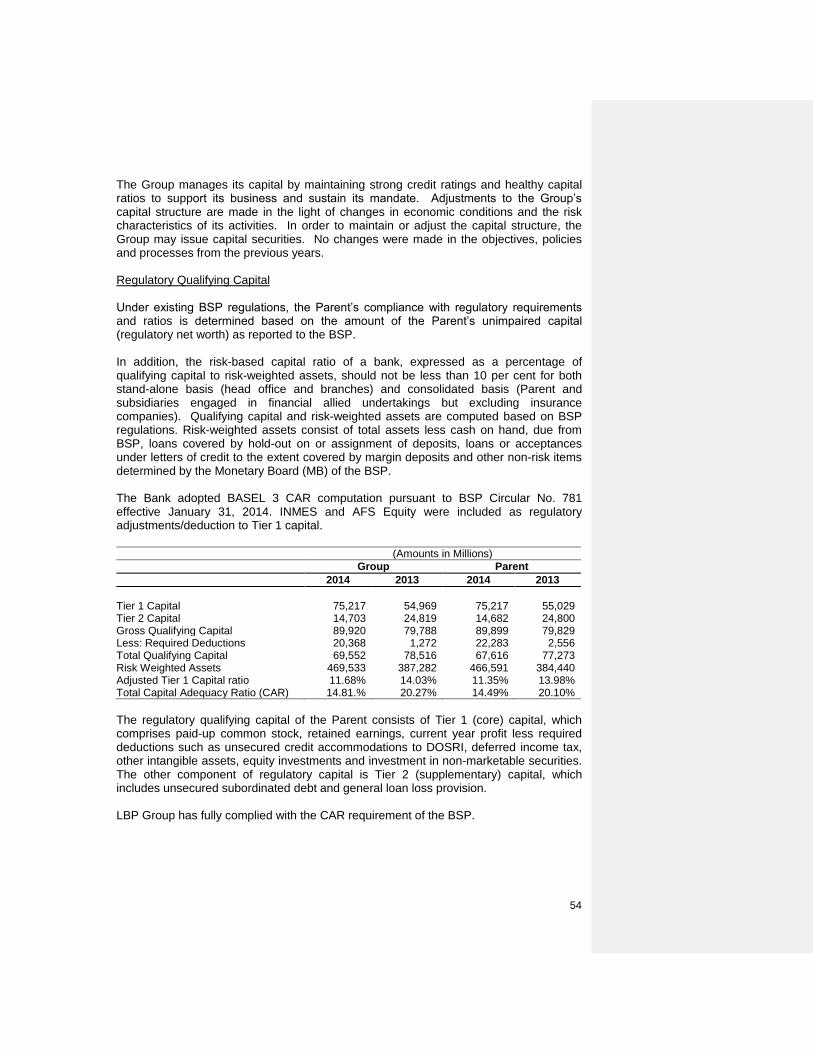
54
The Group manages its capital by maintaining strong credit ratings and healthy capital ratios to support its business and sustain its mandate. Adjustments to the Group‟s capital structure are made in the light of changes in economic conditions and the risk characteristics of its activities. In order to maintain or adjust the capital structure, the Group may issue capital securities. No changes were made in the objectives, policies and processes from the previous years. Regulatory Qualifying Capital Under existing BSP regulations, the Parent‟s compliance with regulatory requirements and ratios is determined based on the amount of the Parent‟s unimpaired capital (regulatory net worth) as reported to the BSP. In addition, the risk-based capital ratio of a bank, expressed as a percentage of qualifying capital to risk-weighted assets, should not be less than 10 per cent for both stand-alone basis (head office and branches) and consolidated basis (Parent and subsidiaries engaged in financial allied undertakings but excluding insurance companies). Qualifying capital and risk-weighted assets are computed based on BSP regulations. Risk-weighted assets consist of total assets less cash on hand, due from BSP, loans covered by hold-out on or assignment of deposits, loans or acceptances under letters of credit to the extent covered by margin deposits and other non-risk items determined by the Monetary Board (MB) of the BSP. The Bank adopted BASEL 3 CAR computation pursuant to BSP Circular No. 781 effective January 31, 2014. INMES and AFS Equity were included as regulatory adjustments/deduction to Tier 1 capital.
(Amounts in Millions)
Group Parent
2014 2013 2014 2013
Tier 1 Capital 75,217 54,969 75,217 55,029 Tier 2 Capital 14,703 24,819 14,682 24,800 Gross Qualifying Capital 89,920 79,788 89,899 79,829 Less: Required Deductions 20,368 1,272 22,283 2,556 Total Qualifying Capital 69,552 78,516 67,616 77,273 Risk Weighted Assets 469,533 387,282 466,591 384,440 Adjusted Tier 1 Capital ratio 11.68% 14.03% 11.35% 13.98% Total Capital Adequacy Ratio (CAR) 14.81.% 20.27% 14.49% 20.10%
The regulatory qualifying capital of the Parent consists of Tier 1 (core) capital, which comprises paid-up common stock, retained earnings, current year profit less required deductions such as unsecured credit accommodations to DOSRI, deferred income tax, other intangible assets, equity investments and investment in non-marketable securities. The other component of regulatory capital is Tier 2 (supplementary) capital, which includes unsecured subordinated debt and general loan loss provision. LBP Group has fully complied with the CAR requirement of the BSP.

55
31. Financial Risk Management RISK MANAGEMENT ORGANIZATION Risk Management and Good Governance
Risk Management is an integrative component of good governance which endeavors to ensure adequacy of policies, systems and procedures to manage risks. Risk management at Land Bank of the Philippines (LBP) completes the triumvirate that takes a close look at the controls of the Bank]. Together with internal audit and compliance, the synergy of the three functions provides credence to the role of the Bank‟s corporate governance in implementing an effective control framework. Oversight on all risk-related functions is a responsibility of the LBP Board of Directors (BoD). This responsibility is rendered by the Board through the Risk Oversight Committee (RiskCom), which evaluates and approves the Bank‟s risk management framework, policies and effectiveness of controls.
Risk Management Philosophy
LBP is a financial institution involved in providing banking products and services that expose it to a plethora of risks. While it recognizes all risks inherent in a financial institution, it manages closely those that have significant bearing on its balance sheet accounts. Risk management is embedded in all the business processes of the Bank and it ascertains that risk-taking is commensurate with its risk appetite. The management of risks is anchored on the Bank‟s vision, mission and strategic objectives, as well as its organizational structure, Information Technology (IT) infrastructure, control and communication processes, among others.
The Bank‟s approach to risk management is as follows:
The LBP Board, through the RiskCom, exercises oversight on all risk-related functions and activities of the Bank based on a top-down structure;
The Risk Management Group (RMG) is independent from risk-taking units and performs the oversight function for all major risk areas (credit, market, and liquidity, operational, and other bank-wide risks). RMG reports functionally to the RiskCom and administratively to the President & Chief Executive Officer (CEO) of the Bank; and
The Bank adopts the Integrated or Enterprise-wide approach in managing risks. Enterprise Risk Management (ERM) views the group-wide risks of the Bank from the top and analyzes and addresses identified risks together with the authorized risk taking units. Through ERM, risk analysis is strengthened as it takes a cross-functional perspective that reveals the interdependencies of the risks and facilitates risk treatment at the source.
Risk Exposures and Assessment
LBP recognizes the following risk exposures, the same exposures articulated in its 2014 Internal Capital Adequacy Assessment Process (ICAAP) Document.

56
RISK DESCRIPTION
1. Credit Risk A considerable percentage of the Bank‟s funds are deployed to
credit, being its core business. Credit risk arises from the failure of a counterparty to meet the terms or perform within the bounds of its contract with the Bank. Credit risk to LBP takes the form of Counterparty Credit Risk-Loans and Counterparty Credit Risk-Investments.
2. Market LBP treasury activities generally deal with Government Securities
(GS) and Foreign Securities, Equities, and Foreign Currencies that are classified as Held For Trading (HFT) or as Available For Sale (AFS). The values of these assets are subject to Mark-To-Market (MTM) or daily valuation to align with prevailing market prices and rates. These adjustments could result to a gain or loss for the Bank.
It is the risk of loss, immediate or over time, due to adverse fluctuations in price or market value of instruments, products, and transactions in the Bank‟s overall trading and investment portfolio. Failure to anticipate and manage fluctuations in the values of the Bank‟s investments could lead to economic losses.
3. Operational Risks
a. People Risk Under the Bank‟s ERM, People Risk consists of three risk components, particularly defined as follows:
1. Recruitment & Retention Risk - Difficulty of the Bank
to attract and retain competent employees that might lead to organizational dysfunction and low morale;
2. People Development & Performance Risk - Difficulty to develop and enhance employee skills and provide a
sound employee performance management system that may reduce employee motivation and may adversely impact the achievement of desired performance and conduct; and
3. Succession Planning Risk - Failure to create and
implement a feasible continuance plan for key Bank
positions and employees that might adversely affect the stability of organizational leadership and business continuity.
b. Process Risk Basel Committee defines Operational Risk as the risk of loss resulting from inadequate or failed internal processes, people, and systems. Process Risk, as one of the sources of Operational Risk, is the risk of loss caused by, but not limited to, inadequate or failed execution of the Bank‟s business processes, human error or negligence, fraud and malice.

57
c. System or MIS
Risk
IT Risk refers to the business risk associated with the use, ownership, operation, involvement and adoption of IT within the Bank. The following are the categories of IT Risk:
1. IT Management - Failure to effectively adopt identified
IT initiatives and administer IT resources may lead to lost business and hinder the achievement of the Bank‟s goals and objectives.
2. IT Confidentiality - Failure of information system to
adequately protect both IT data and IT infrastructure leads to or allows unauthorized access, or leads to destruction of information and information systems of the Bank.
3. IT Availability or Continuity - Failure to ensure
uninterrupted operations and immediate recovery from systems and implementation failures lead to losses of the Bank.
4. IT Integrity - Failure of information system to provide
accurate, reliable and timely financial and non-financial information when needed leads to operational inefficiencies or lost business opportunities.
5. Technology Implementation - Failure to adopt and
implement the appropriate approved system and technology to support business processes or major initiatives may lead to costly investments and work inefficiencies and may compromise product or service delivery. Not in LBP Risk dictionary but included in IT Risk Management Plan.
4. Strategic Risk Current and prospective impact on earnings or capital arising from adverse business decisions, improper implementation of decisions, or lack of responsiveness to industry changes. This risk is a function of the compatibility of an organization‟s strategic goals, the business strategies developed to achieve these goals, the resources deployed against these goals, and the quality of implementation.
The resources needed to carry out business strategies are both tangible and intangible. They include communication channels, operating systems, delivery networks, and managerial capacities and capabilities. The organization‟s internal characteristics must be evaluated against the impact of economic, technological, competitive, regulatory, and other environmental changes (BSP Circular No. 510, Series of 2006).
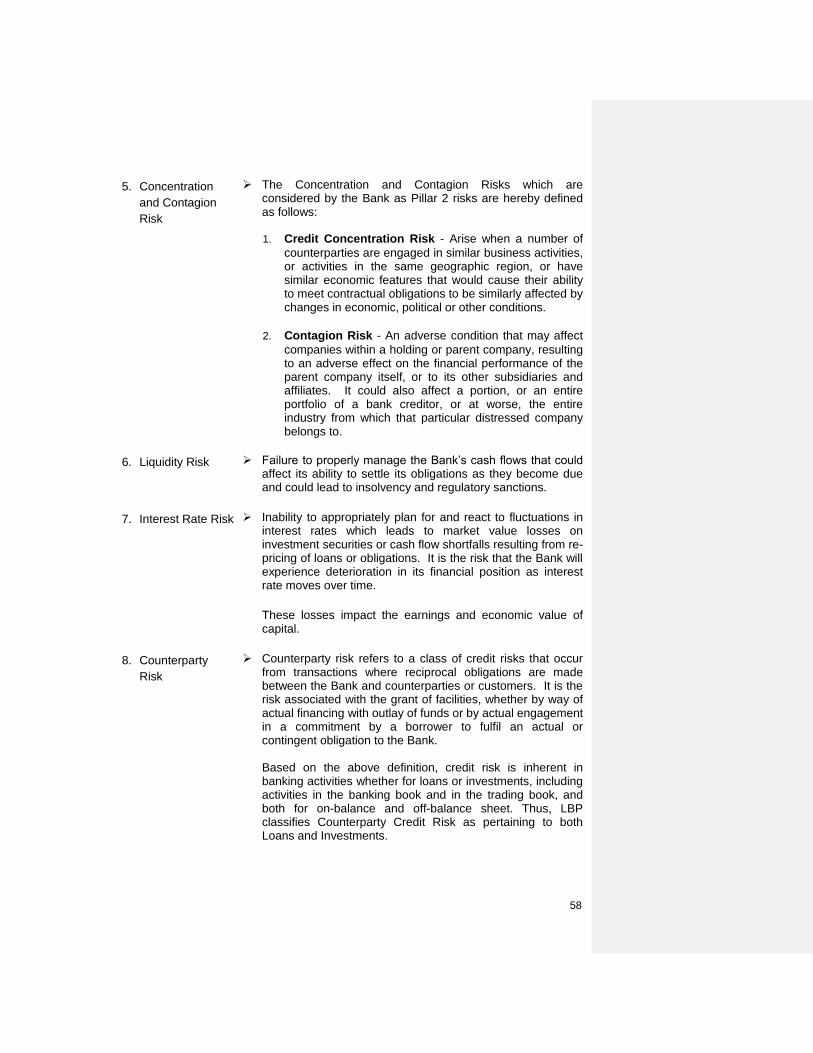
58
5. Concentration
and Contagion
Risk
The Concentration and Contagion Risks which are considered by the Bank as Pillar 2 risks are hereby defined as follows:
1. Credit Concentration Risk - Arise when a number of
counterparties are engaged in similar business activities, or activities in the same geographic region, or have similar economic features that would cause their ability to meet contractual obligations to be similarly affected by changes in economic, political or other conditions.
2. Contagion Risk - An adverse condition that may affect
companies within a holding or parent company, resulting to an adverse effect on the financial performance of the parent company itself, or to its other subsidiaries and affiliates. It could also affect a portion, or an entire portfolio of a bank creditor, or at worse, the entire industry from which that particular distressed company belongs to.
6. Liquidity Risk Failure to properly manage the Bank‟s cash flows that could affect its ability to settle its obligations as they become due and could lead to insolvency and regulatory sanctions.
7. Interest Rate Risk Inability to appropriately plan for and react to fluctuations in interest rates which leads to market value losses on investment securities or cash flow shortfalls resulting from re-pricing of loans or obligations. It is the risk that the Bank will experience deterioration in its financial position as interest rate moves over time.
These losses impact the earnings and economic value of capital.
8. Counterparty
Risk
Counterparty risk refers to a class of credit risks that occur from transactions where reciprocal obligations are made between the Bank and counterparties or customers. It is the risk associated with the grant of facilities, whether by way of actual financing with outlay of funds or by actual engagement in a commitment by a borrower to fulfil an actual or contingent obligation to the Bank.
Based on the above definition, credit risk is inherent in banking activities whether for loans or investments, including activities in the banking book and in the trading book, and both for on-balance and off-balance sheet. Thus, LBP classifies Counterparty Credit Risk as pertaining to both Loans and Investments.
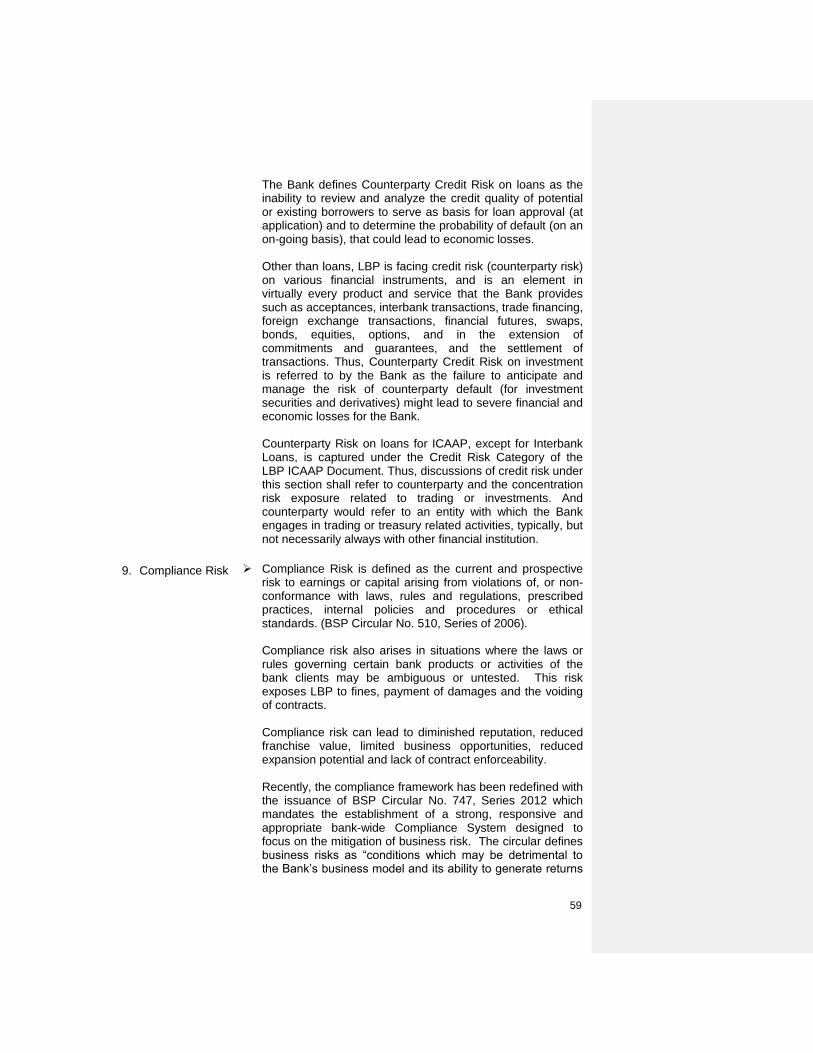
59
The Bank defines Counterparty Credit Risk on loans as the inability to review and analyze the credit quality of potential or existing borrowers to serve as basis for loan approval (at application) and to determine the probability of default (on an on-going basis), that could lead to economic losses.
Other than loans, LBP is facing credit risk (counterparty risk) on various financial instruments, and is an element in virtually every product and service that the Bank provides such as acceptances, interbank transactions, trade financing, foreign exchange transactions, financial futures, swaps, bonds, equities, options, and in the extension of commitments and guarantees, and the settlement of transactions. Thus, Counterparty Credit Risk on investment is referred to by the Bank as the failure to anticipate and manage the risk of counterparty default (for investment securities and derivatives) might lead to severe financial and economic losses for the Bank.
Counterparty Risk on loans for ICAAP, except for Interbank Loans, is captured under the Credit Risk Category of the LBP ICAAP Document. Thus, discussions of credit risk under this section shall refer to counterparty and the concentration risk exposure related to trading or investments. And counterparty would refer to an entity with which the Bank engages in trading or treasury related activities, typically, but not necessarily always with other financial institution.
9. Compliance Risk Compliance Risk is defined as the current and prospective risk to earnings or capital arising from violations of, or non-conformance with laws, rules and regulations, prescribed practices, internal policies and procedures or ethical standards. (BSP Circular No. 510, Series of 2006).
Compliance risk also arises in situations where the laws or rules governing certain bank products or activities of the bank clients may be ambiguous or untested. This risk exposes LBP to fines, payment of damages and the voiding of contracts.
Compliance risk can lead to diminished reputation, reduced franchise value, limited business opportunities, reduced expansion potential and lack of contract enforceability.
Recently, the compliance framework has been redefined with the issuance of BSP Circular No. 747, Series 2012 which mandates the establishment of a strong, responsive and appropriate bank-wide Compliance System designed to focus on the mitigation of business risk. The circular defines business risks as “conditions which may be detrimental to the Bank‟s business model and its ability to generate returns

60
from operations, which in turn erode its franchise value”.
Providing delineation between the risk program and the compliance program, BSP Circular No. 747, Series of 2012 refers to the risk program as covering “financial risks that arise from the balance sheet exposures of the institution”. On the other hand, compliance program will deal with business risks which shall include, but not limited to the following:
1. Reputation risk resulting from internal decisions that may harm the Bank‟s market standing.
2. Reputation risk resulting from internal decisions or practices that will eventually have an impact on the public‟s trust.
3. Legal risks insofar as changes in the interpretation or
provisions of the regulations will unswervingly affect the Bank‟s business goals.
4. Compliance risks resulting from bank activities that:
contradict existing regulations and identified best
practices reveal weaknesses in the implementation of
codes of conduct and standards of good practice
The categories of Compliance Risk are:
Regulatory Compliance Risk
Imposition of the appropriate sanction shall be based on the assessment of the strength and responsiveness of the whole compliance system to address business risks. A compliance system which shall be found to be significantly insufficient shall be considered as unsafe and unsound banking practice.
Anti-Money Laundering (AML) Compliance Risk
Enforcement of actions shall be imposed on the basis of the over-all assessment of the Bank‟s AML risk management system. Whenever a Bank‟s AML compliance system is found to be grossly inadequate, this may be considered as unsafe and unsound banking practice that may warrant initiation of prompt corrective action.

61
10. Reputation Risk Failure to establish and maintain an image of integrity and competence in doing business may result to loss of customers and even key employees.
In assessing the risk, the following factors were considered:
level of inherent risk (high, moderate or low) adequacy of risk management (strong,
acceptable or weak) trend or direction of risk (decreasing, stable or
increasing)
The impact of scenarios in Reputation Risk occurs through various degrees of loss of business, particularly in the loss of clients (depositors and borrowers) as well as the ability to generate new business and to raise needed capital. The impact can also be in the cost of doing business.
11. Event Risk Loss resulting from damages due to natural calamities such as typhoon, earthquake, flood and other weather disturbances and manmade risk events such as fire, vandalism and tampering of Automated Teller Machine (ATM), terrorism and holdup or robbery.
12. Legal Risk Unenforceable contracts or defective contracts, lawsuits and adverse judgments that may lead to financial losses to the Bank. The three categories of Legal risk are:
1. Contract – an agreement between two or more persons
which creates an obligation to do or not to do a particular thing. A contract entered into by the Bank becomes a risk if it is contrary to law, if it has technical defects and/or if parties entering into the contract lack legal capacity to do so.
2. Lawsuit – a process in law instituted by one party to compel another to do him justice. The following situations present in a lawsuit may eventually lead to an adverse judgment and could become a legal risk: varying interpretations loss of evidence delaying tactics of litigants late or non-submission of required pleadings failure to appear in proceedings unexpected adverse consequences from legal
proceedings

62
3. Adverse Judgment - unfavourable judgments against the
Bank. The term may also include judgments, though favourable to the Bank, cannot be enforced or executed due to the following reasons: enforcement subject to potential difficulties failure or refusal of judgment obligor to honour obligations judgment award not capable of satisfaction or execution
13. Trust Operations
Risk
Covers a wide array of potential risks that may arise from a trustee‟s fiduciary duties predicated on the principle of exercising utmost care and prudence in handling the business affairs of other people (trustors). A trust entity does not own the assets which its clients assign for proper management. Contracts clearly state that trust arrangements are not covered by the Philippine Depository Insurance Corporation (PDIC) and except for wilful fraud, gross negligence and evident bad faith, all losses with regard to the trust entity‟s investments are for the account of its clients. All arrangements in Trust are contractual in nature and therefore, LBP - Trust Banking Group‟s (LBP-TBG‟s) operation is exposed to legal risk per client. In addition, due to the trustee‟s fiduciary duties, numerous rules and regulations have been imposed by the BSP to improve controls and set basic standards in fiduciary practices. Further, the continuing additional and evolving rules, regulations and circulars from regulators such as, the BSP, the Securities Exchange Commission (SEC), the Insurance Commission (IC) and the Bureau of Internal Revenue (BIR), expose LBP-TBG operations to compliance and strategic risks.
Because a trust entity‟s operations are similar to a bank, all areas of risk associated with commercial banking operations in terms of operational and investment risks are also applicable to trust banking.
14. Subsidiaries Risk Risk on earnings and assets of LBP (direct impact) arising from reduced or decline in net income of LBP subsidiaries (sub-group basis).

63
CREDIT RISK MANAGEMENT
Credit risk is the risk that one party to a financial instrument will fail to discharge an obligation and cause the other party to incur financial losses. Overall credit risk management oversight is a function of the Board-level RiskCom. Credit Risk Assessment
Credit risk assessment is a function of the Bank‟s lending sector and is guided by established policies and procedures which are regularly reviewed and enhanced. In close coordination with the lending units, RMG issued twenty-five (25) credit policies, bulletins and executive orders in 2014, to complement update or enhance existing credit policies and guidelines. Consistent with good corporate governance, LBP manages credit risk by setting limits for individual borrowers and group of borrowers and industry segments. The Bank also monitors credit exposures, and continually assesses the credit quality of counterparties. Assessment of credit quality considers credit ratings of counterparties given by external credit assessment institutions such as Moody‟s, Fitch, Standard & Poor‟s and PhilRatings. The use of external credit ratings adheres to the BSP guidelines on the Implementation of the Revised Risk-Based Capital Adequacy Framework.” For foreign and financial institution accounts, the Bank downloads available extra credit ratings from Bloomberg. For all client types, credit risk management is supplemented by credit rating systems which were developed for Corporations, Small & Medium Enterprises, (SME), Financial Institutions, Cooperatives and Local Government Units (LGU). The ratings of clients are being used, among others, as basis for determining the credit worthiness of loan clients, independent review of the ratings after approval is done by RMG to support the Internal Credit Risk Rating System (ICRRS) ratings as required by BSP. For 2014, RMG completed the post-validation of five hundred sixty-five (565) ICRRS ratings of corporate clients. Implementation of the Credit Risk Engine System (CRES)
The Credit Policy & Risk Management Department (CPRMD) was able to obtain approval for recalibration of the credit rating scorecard for corporate clients from the Credit Committee (CRECOM) and the Investment & Loan Committee (ILC). The credit rating scorecard will be deployed upon due approval of the proposed implementing guidelines currently under review by lending units. The CPRMD is also conducting recalibration of the LGU credit rating scorecard to ensure its predictive capability following some changes in set parameters. Moreover, CPRMD continued the scoring of new livelihood accounts through the automated process from February 2014 onwards, albeit it likewise presented the recalibrated Livelihood Loans scorecard to the Branch Operations Committee (BOC) for its approval last 19 December 2014 to address parameter changes for Department of Education (DepEd) Livelihood Loan accounts.

64
Credit Risk Exposure and Credit-related Commitments
Credit risk with respect to derivative financial instruments is limited to those instruments with positive fair values, which are included under “Other Assets”. The Bank also makes available to its customers guarantees which may require LBP to make payments on behalf of these clients. Such payments are collected from customers based on the terms of the Letter of Credit. These guarantees expose the Bank to similar risks as loans and these are mitigated by the same control processes and policies. As a result, the maximum credit risk without taking into account the fair value of any collateral and netting arrangements is limited to the amounts on the balance sheet plus commitments to customers. The table below shows the maximum exposure to credit risk for the components of the Balance Sheets, including derivatives. The maximum exposure is shown net, after the effect of mitigation through the use of master netting and collateral arrangements.
Group Parent
2014 2013 2014 2013
On-Balance sheet financial assets
Cash and balances with BSP (excluding Cash on hand)
229,608,752 249,858,094 229,607,442 249,774,284
Due from banks 6,385,039 3,196,281 6,285,385 3,140,487 Interbank loans receivable 17,243,602 7,036,608 17,243,602 7,036,608 Securities purchased under agreements to
resell 56,390,000 6,122,000 56,390,000 6,122,000 Financial assets at fair value through profit
or loss-Held for trading 14,812,840 2,347,077 14,812,840 2,347,077 Available-for-Sale Investments 191,341,109 179,836,155 191,341,109 179,836,155 Held-to-maturity Investments 95,814,860 40,904,585 95,025,587 40,101,183 Loans and receivables 402,186,672 322,410,939 401,265,229 321,002,300
1,013,782,874 811,711,739 1,011,971,194 809,360,094
Off-Balance sheet items Financial guarantees 3,243,426 3,161,981 3,243,426 3,161,981 Loan commitments and
Contingent liabilities 76,351,393 63,002,492 76,351,393 63,002,492
79,594,819 66,164,473 79,594,819 66,164,473
Total Credit Risk Exposure 1,093,377,693 877,876,212 1,091,566,013 875,524,567
Where the financial instruments are recorded at fair value, the amounts shown above represent the current credit risk exposure but not the maximum risk exposure that could arise in the future as a result of change in values. The details on the maximum exposure to credit risk for each class of financial instrument are referred to in specific notes.
Risk concentrations of the maximum exposure to credit risk Concentrations arise when a number of counterparties are engaged in similar business activities, or activities in the same geographic region, or have similar economic features

65
that would cause their ability to meet contractual obligations to be similarly affected by changes in economic, political or other conditions. The Parent has established concrete guidelines and procedures relative to managing, monitoring and reporting large exposures and credit risk concentrations in accordance with the rules and regulations issued by the BSP. As of 31 December 2014, the Parent‟s qualifying capital covering credit risk is P67.616 billion. Based on the BSP definition, the Parent has set the benchmark for large exposures at P3.86 billion. On the other hand, the Parent‟s Single Borrower‟s Limit (SBL) is pegged at P19.432 billion for direct lending and P27.386 billion for wholesale lending. Overall credit risk management oversight is a function of the Board of Directors (BOD)-level Risk Management Committee. In general, mitigation measures on credit risks are implemented at various levels. However, oversight on credit risk management is vested on the Risk Management Group which is independent from the business function. This is critical in ensuring the integrity and objectivity of the credit risk assessment, pricing, and management process. The Parent ensures that the credit risks undertaken are commensurate with the risk appetite and the Parent‟s capacity to manage such risks. Thus, regular monitoring of both the level of risk and equity capital is undertaken to ensure that even in instances of major credit surprises, the Parent could sustain its operations in spite of the losses incurred and continue to be an efficient financial intermediary for development and institutional financing. The BSP considers that credit concentration exists when total loan exposure to a particular industry exceeds 30 per cent of total loan portfolio. As of 31 December 2014 and 2013, the Parent does not have credit concentration in any particular industry. As of December 31, 2014 and 2013, information on the concentration of credit as to industry based on carrying amount is shown below:
Parent
2014 2013
Amount % Amount %
Financial intermediation 45,463,808 11.8 31,254,583 10.3
Agriculture, hunting and forestry 64,446,378 16.7 53,637,349 17.7
Real estate, renting and business activities 48,350,833 12.5 40,405,973 13.3
Public administration and defense 40,297,169 10.4 42,427,725 14.0
Manufacturing 28,367,821 7.3 23,191,570 7.6
Community, social and personal services 7,035,615 1.8 10,908,453 3.6
Electricity, gas and water 56,315,845 14.6 46,781,383 15.4
Wholesale & retail trade, repair of motor vehicles, motorcycles & personal and household goods 26,155,457 6.8 17,768,695 5.8
Transport, storage and communication 31,430,663 8.1 20,487,987 6.7

66
Parent
2014 2013
Amount % Amount %
Construction 16,268,608 4.2 9,492,208 3.1
Private households 14,553,282 3.8 1,136,886 0.4
Hotel and restaurant 2,656,522 0.7 2,052,275 0.7 Others 5,274,455 1.3 4,191,393 1.4
386,616,456 100.0 303,736,480 100.0
Allowance for losses (3,340,369) (3,248,889)
383,276,087 300,487,591
Collateral and Other Credit Enhancements
The amount and type of collateral required depends on the type of borrower and assessment of the credit risk of the borrower. The Bank‟s revised Credit Manual provides the guidelines on the acceptability of collateral and maximum valuation for each type of collateral. The following are the main collaterals accepted by the Bank: For commercial lending – cash or GS, real estate properties, inventory, chattel;
and For retail lending – mortgage over residential properties.
The Bank also obtains guarantees from corporations which are counter-guaranteed by the Philippine National Government and other corporations accredited by LBP. In the case of agricultural and agri-related loans that are vulnerable to the effects of climate and weather disturbances, borrowers are encouraged to avail of guarantee and insurance mechanisms to shield them, as well as the Bank, from risk events. The Bank monitors the market value of collateral, requests additional collateral in accordance with the underlying agreement, and monitors the market value of collateral obtained during its review of the adequacy of the allowance for impairment losses. It is the Bank‟s policy to dispose of the foreclosed properties in an orderly fashion. The proceeds are used to reduce or repay the outstanding claim. In general, the Bank does not occupy foreclosed properties for business use. The Bank also makes use of master netting arrangements with counterparties. Credit Stress Testing
The Bank regularly conducts stress testing on its loan portfolio covering various scenarios arising from risk events with high probability of occurrence. Utilizing such scenarios, tests were done to determine their impact on the Bank‟s loan portfolio quality, credit risk weighted assets, and ultimately on its Capital Adequacy Ratio (CAR). The stress tests enabled the Bank to adopt applicable courses of actions to mitigate the resulting risks as well as to comply with regulatory requirements.

67
Credit Risk Weighted Assets (CRWA)
Gross CRWA as of 2014 aggregated to P418,189.230 million broken down as follows:
Nature of I tems Amount
(In million pesos)
Total Risk Weighted Assets (RWA) On-Balance Sheet 380,778.932
Total RWA Off-Balance Sheet 37,223.884
Total Counterparty RWA in the Banking Book (Derivatives & Repo-style Transactions)
0.000
Total Counterparty RWA in the Trading Book 186.414
Total Risk-Weighted Amount of Credit Linked Notes in the Banking Book 0.000 Total Risk-Weighted Securitization Exposures 0.000
418,189.230
LBP‟s Gross CRWA net of General Loan Loss Provision of P416,315.897 million. CRWA constituted 89.23 per cent of the aggregate RWA of P466,591.145 million Capital Adequacy Ratio (CAR). The stress tests enabled the Bank to adopt applicable courses of actions to mitigate the resulting risks as well as to comply with regulatory requirements. MARKET RISK MANAGEMENT
Market risk is the risk of financial loss arising from exposure to adverse changes in values of financial instruments caused by changes in market prices or rates, including interest rates, Foreign Exchange (Fx) rates, or stock prices that can change the value of financial products held by the Bank. Risk exposures differ depending on whether the exposures are calculated for financial accounting or under International Financial Reporting Standards (IFRS). The standardized approach is used in the calculation of capital charge for all risk exposures. The Basel II Pillar 3 disclosures are generally based on the measures of risk exposure used to calculate the regulatory capital required. The table below provides a breakdown of Market Risk Weighted Assets for market risk portfolio exposures calculated using the standardized approach. Market Risk Weighted Assets (MRWA)
As of 31 December 2014, the MRWA of the Bank stood at P6,043.368 million, broken down as follows:
Nature of I tems Amount
(In million pesos)
Interest Rate Exposure 1,778.538 Equity Exposure 83.300 FX Exposure 647.167 Options 3,534.363
6,043.368

68
The total MRWA represents 1.30 per cent of the aggregate RWA of P466,591.145 million. Market Risk Management Framework
LBP is exposed to market risks in both its trading and non-trading banking activities. The Bank assumes market risk in market making and position taking in GS and other debt instruments, equity, Fx and other securities, as well as, in derivatives or financial instruments that derive their values from price, price fluctuations and price expectations of an underlying instrument (e.g. share, bond, Fx or index). LBP exposure on derivatives is currently limited to currency swaps and currency forwards to manage Fx exposure. Although the Bank is also exposed to derivatives that are embedded in some financial contracts, these are considered insignificant in volume. The Bank uses a combination of risk sensitivities, Value-at-Risk (VaR), stress testing, capital adequacy ratio and capital metrics to manage market risks and establish limits. The LBP BoD, RiskCom and the Asset & Liability Committee (ALCO), define and set the various market risk limits for each trading portfolio. The Treasury & Investment Banking Sector (TIBS) particularly the Financial Markets Group (FMG), which manages the Bank‟s trading units and the Asset & Liability Management Group (ALMG), which manages the Bank‟s liquidity and reserve positions, conduct risk-taking activities within limits at all times and ensures that breaches are escalated to senior management for appropriate action. A management loss alert is activated whenever losses during a specified period equal or exceed specified management loss alert level. LBP controls and minimizes the losses that may be incurred in daily trading activities through the VaR and stop loss limits. Positions are monitored on a daily basis to ensure that these are maintained within established limits. Position Limits are also established to control losses but are subordinated to the VaR and Stop Loss Limits. Macaulay and Modified Duration are used to identify the interest rate sensitivity of the Bond Portfolio of the Bank. Moreover, Re-pricing Gap, Earnings-at-Risk (EaR) and Economic Value of Equity-at-Risk (EVE) are used to measure interest rate risk in the banking book. Managing Market Risk Components
The following discusses the key market risk components along with respective risk mitigation techniques: 1. Fx Risk Management
Currency risk is the risk that the value of a financial instrument will fluctuate due to changes in Fx rates. LBP views the Philippine PESO as its functional currency. Positions are monitored daily to ensure that these are within established limits. The following limits are set for foreign-currency related transactions:
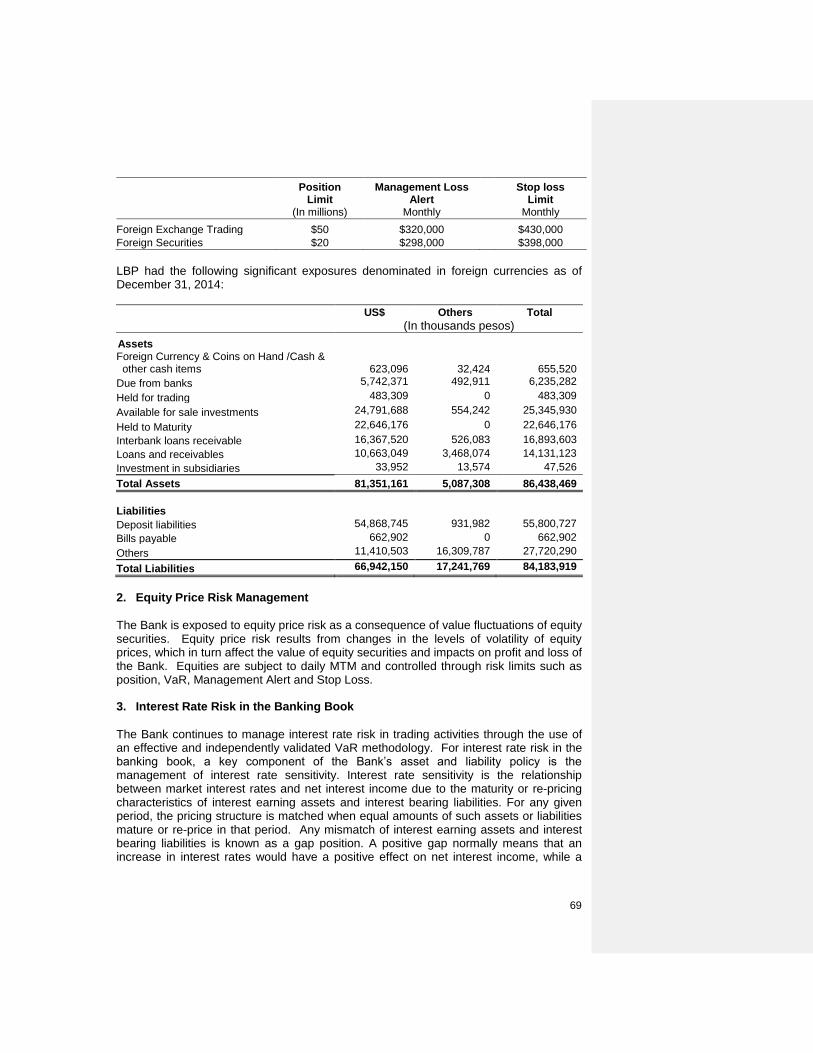
69
Position
Limit Management Loss
Alert
Stop loss Limit
(In millions) Monthly Monthly
Foreign Exchange Trading $50 $320,000 $430,000
Foreign Securities $20 $298,000 $398,000
LBP had the following significant exposures denominated in foreign currencies as of December 31, 2014:
US$ Others Total
(In thousands pesos)
Assets Foreign Currency & Coins on Hand /Cash & other cash items
623,096
32,424
655,520
Due from banks 5,742,371 492,911 6,235,282
Held for trading 483,309 0 483,309
Available for sale investments 24,791,688 554,242 25,345,930
Held to Maturity 22,646,176 0 22,646,176
Interbank loans receivable 16,367,520 526,083 16,893,603
Loans and receivables 10,663,049 3,468,074 14,131,123
Investment in subsidiaries 33,952 13,574 47,526
Total Assets 81,351,161 5,087,308 86,438,469
Liabilities
Deposit liabilities 54,868,745 931,982 55,800,727
Bills payable 662,902 0 662,902
Others 11,410,503 16,309,787 27,720,290
Total Liabilities 66,942,150 17,241,769 84,183,919
2. Equity Price Risk Management
The Bank is exposed to equity price risk as a consequence of value fluctuations of equity securities. Equity price risk results from changes in the levels of volatility of equity prices, which in turn affect the value of equity securities and impacts on profit and loss of the Bank. Equities are subject to daily MTM and controlled through risk limits such as position, VaR, Management Alert and Stop Loss. 3. Interest Rate Risk in the Banking Book
The Bank continues to manage interest rate risk in trading activities through the use of an effective and independently validated VaR methodology. For interest rate risk in the banking book, a key component of the Bank‟s asset and liability policy is the management of interest rate sensitivity. Interest rate sensitivity is the relationship between market interest rates and net interest income due to the maturity or re-pricing characteristics of interest earning assets and interest bearing liabilities. For any given period, the pricing structure is matched when equal amounts of such assets or liabilities mature or re-price in that period. Any mismatch of interest earning assets and interest bearing liabilities is known as a gap position. A positive gap normally means that an increase in interest rates would have a positive effect on net interest income, while a
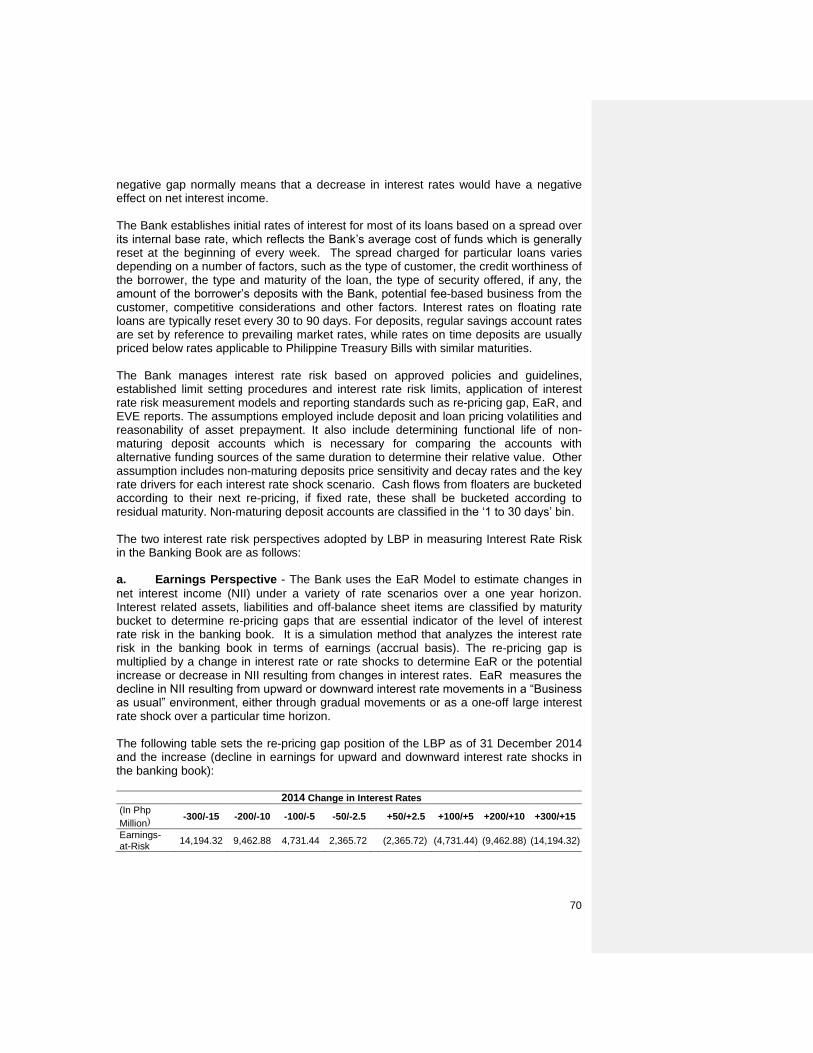
70
negative gap normally means that a decrease in interest rates would have a negative effect on net interest income. The Bank establishes initial rates of interest for most of its loans based on a spread over its internal base rate, which reflects the Bank‟s average cost of funds which is generally reset at the beginning of every week. The spread charged for particular loans varies depending on a number of factors, such as the type of customer, the credit worthiness of the borrower, the type and maturity of the loan, the type of security offered, if any, the amount of the borrower‟s deposits with the Bank, potential fee-based business from the customer, competitive considerations and other factors. Interest rates on floating rate loans are typically reset every 30 to 90 days. For deposits, regular savings account rates are set by reference to prevailing market rates, while rates on time deposits are usually priced below rates applicable to Philippine Treasury Bills with similar maturities. The Bank manages interest rate risk based on approved policies and guidelines, established limit setting procedures and interest rate risk limits, application of interest rate risk measurement models and reporting standards such as re-pricing gap, EaR, and EVE reports. The assumptions employed include deposit and loan pricing volatilities and reasonability of asset prepayment. It also include determining functional life of non-maturing deposit accounts which is necessary for comparing the accounts with alternative funding sources of the same duration to determine their relative value. Other assumption includes non-maturing deposits price sensitivity and decay rates and the key rate drivers for each interest rate shock scenario. Cash flows from floaters are bucketed according to their next re-pricing, if fixed rate, these shall be bucketed according to residual maturity. Non-maturing deposit accounts are classified in the „1 to 30 days‟ bin. The two interest rate risk perspectives adopted by LBP in measuring Interest Rate Risk in the Banking Book are as follows:
a. Earnings Perspective - The Bank uses the EaR Model to estimate changes in
net interest income (NII) under a variety of rate scenarios over a one year horizon. Interest related assets, liabilities and off-balance sheet items are classified by maturity bucket to determine re-pricing gaps that are essential indicator of the level of interest rate risk in the banking book. It is a simulation method that analyzes the interest rate risk in the banking book in terms of earnings (accrual basis). The re-pricing gap is multiplied by a change in interest rate or rate shocks to determine EaR or the potential increase or decrease in NII resulting from changes in interest rates. EaR measures the decline in NII resulting from upward or downward interest rate movements in a “Business as usual” environment, either through gradual movements or as a one-off large interest rate shock over a particular time horizon.
The following table sets the re-pricing gap position of the LBP as of 31 December 2014 and the increase (decline in earnings for upward and downward interest rate shocks in the banking book):
2014 Change in Interest Rates
(In Php
Million) -300/-15 -200/-10 -100/-5 -50/-2.5 +50/+2.5 +100/+5 +200/+10 +300/+15
Earnings-at-Risk
14,194.32 9,462.88 4,731.44 2,365.72 (2,365.72) (4,731.44) (9,462.88) (14,194.32)
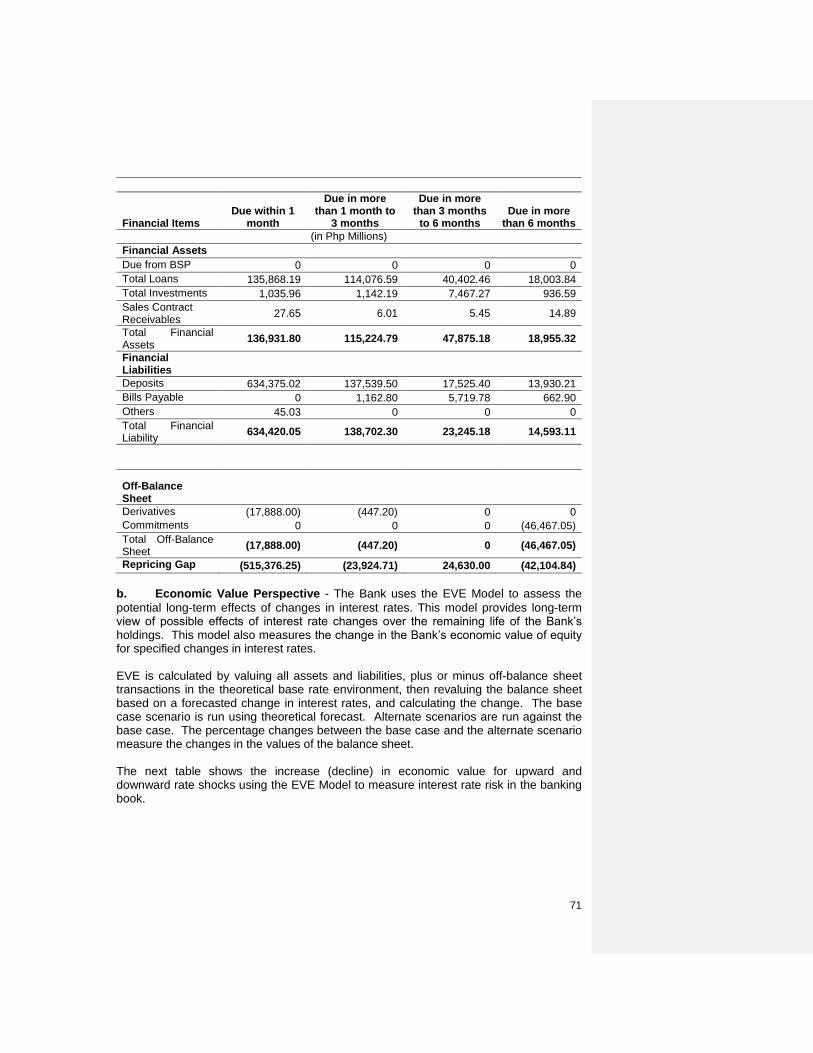
71
Financial Items
Due within 1
month
Due in more than 1 month to
3 months
Due in more than 3 months
to 6 months
Due in more
than 6 months
(in Php Millions)
Financial Assets
Due from BSP 0 0 0 0
Total Loans 135,868.19 114,076.59 40,402.46 18,003.84
Total Investments 1,035.96 1,142.19 7,467.27 936.59
Sales Contract Receivables
27.65 6.01 5.45 14.89
Total Financial Assets
136,931.80 115,224.79 47,875.18 18,955.32
Financial Liabilities
Deposits 634,375.02 137,539.50 17,525.40 13,930.21
Bills Payable 0 1,162.80 5,719.78 662.90
Others 45.03 0 0 0
Total Financial Liability
634,420.05 138,702.30 23,245.18 14,593.11
Off-Balance Sheet
Derivatives (17,888.00) (447.20) 0 0
Commitments 0 0 0 (46,467.05)
Total Off-Balance Sheet
(17,888.00) (447.20) 0 (46,467.05)
Repricing Gap (515,376.25) (23,924.71) 24,630.00 (42,104.84)
b. Economic Value Perspective - The Bank uses the EVE Model to assess the
potential long-term effects of changes in interest rates. This model provides long-term view of possible effects of interest rate changes over the remaining life of the Bank‟s holdings. This model also measures the change in the Bank‟s economic value of equity for specified changes in interest rates.
EVE is calculated by valuing all assets and liabilities, plus or minus off-balance sheet transactions in the theoretical base rate environment, then revaluing the balance sheet based on a forecasted change in interest rates, and calculating the change. The base case scenario is run using theoretical forecast. Alternate scenarios are run against the base case. The percentage changes between the base case and the alternate scenario measure the changes in the values of the balance sheet. The next table shows the increase (decline) in economic value for upward and downward rate shocks using the EVE Model to measure interest rate risk in the banking book.

72
2014 Change in Interest Rates (In million pesos)
Basis Points -300 -200 -100 -50 +50 +100 +200 +300
EVE 5,764 3,813 1,891 942 (935) (1,862) (3,696) (5,502)
Both viewpoints are assessed to determine the full scope of the Bank‟s interest rate risk exposure. Moreover, interest risk in the Bank is not managed in isolation. Interest risk measurement systems are integrated into the Bank‟s general risk measurement system and the results from models used are interpreted in relation with other risk exposures. The interest rate risk exposures of the LBP are measured and reported to the ALCO and RiskCom at least on a monthly basis under the earnings perspective through EaR Model and quarterly for the economic value perspective using EVE Model. Market Risk Measurement and Validation Models 1. VaR Analysis
VaR is a statistical approach for measuring the potential variability of trading revenue. It is used to measure market risk in the trading book under normal conditions, estimating the potential range of loss in the market value of the trading portfolio, over a one-day period, at the 99.00 per cent confidence level, assuming a static portfolio. This level implies that on 99 trading days out of 100, the MTM of the portfolio will likely either increase in value, or decrease in value by less than the VaR estimate; and that on 1 trading day out of 100, the MTM of the portfolio will likely decrease in value by an amount that will exceed the VaR estimate. VaR is calculated by simulating changes in the key underlying market risk factors (e.g., interest rates, interest rate spreads, equity prices, foreign exchange rates) to determine the potential distribution of changes in the market value of LBP‟s portfolios of market risk sensitive financial instruments. Daily VaR calculations are compared against VaR limits, the monetary amount of risk deemed tolerable by management. The VaR disclosure for the trading activities is based on Historical Simulation Model. Also for Equities, Fx and Foreign Securities trading portfolio, the internally developed Historical Simulation VaR Calculation Model is being used. The Bank however continuously pursues initiatives to improve processes in preparation to the bank‟s migration towards an Internal Model Approach for capital charging. The VaR disclosure is intended to ensure consistency of market risk reporting for internal risk management, for external disclosure and for regulatory purposes. The over-all VaR limit for the trading activities of LBP-FMG was set at P319 million (with a 99.00 per cent confidence level, and a one-day holding period) throughout 2014. 2. Back-Testing
Back-testing is the basic technique used in verifying the quality of risk measures used by the Bank. It is the process of comparing actual trading results with model-generated risk measures.
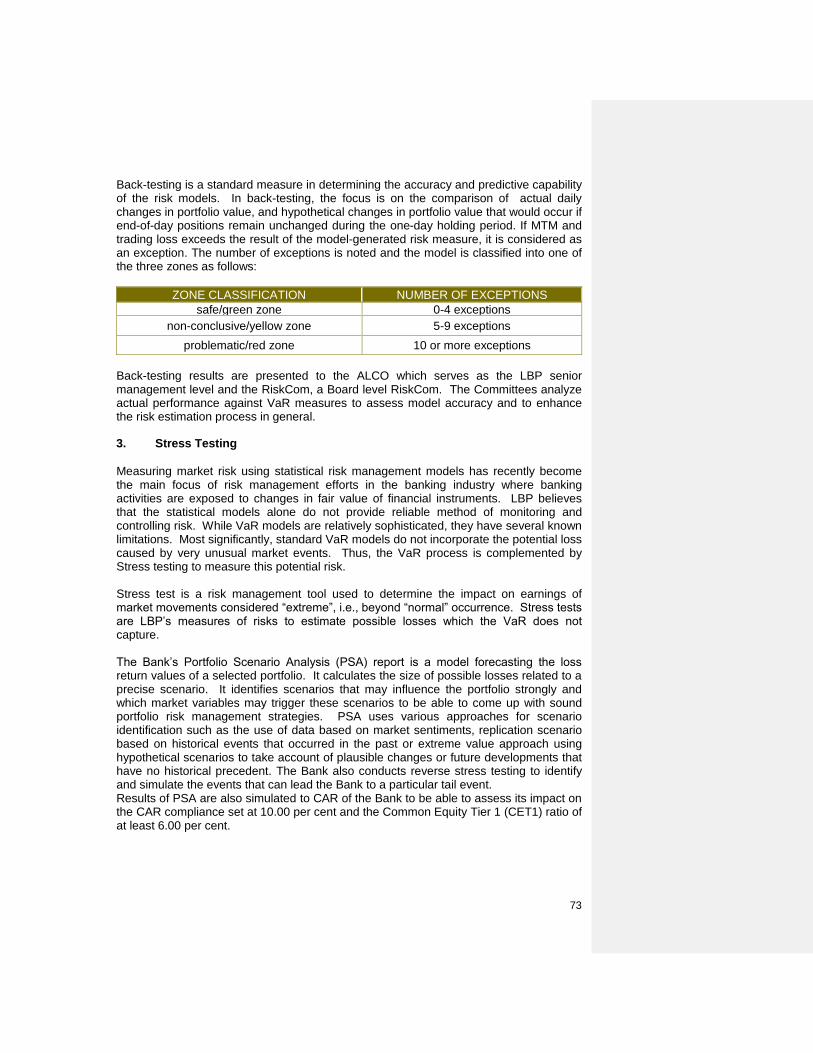
73
Back-testing is a standard measure in determining the accuracy and predictive capability of the risk models. In back-testing, the focus is on the comparison of actual daily changes in portfolio value, and hypothetical changes in portfolio value that would occur if end-of-day positions remain unchanged during the one-day holding period. If MTM and trading loss exceeds the result of the model-generated risk measure, it is considered as an exception. The number of exceptions is noted and the model is classified into one of the three zones as follows:
ZONE CLASSIFICATION NUMBER OF EXCEPTIONS
safe/green zone 0-4 exceptions
non-conclusive/yellow zone 5-9 exceptions
problematic/red zone 10 or more exceptions
Back-testing results are presented to the ALCO which serves as the LBP senior management level and the RiskCom, a Board level RiskCom. The Committees analyze actual performance against VaR measures to assess model accuracy and to enhance the risk estimation process in general. 3. Stress Testing
Measuring market risk using statistical risk management models has recently become the main focus of risk management efforts in the banking industry where banking activities are exposed to changes in fair value of financial instruments. LBP believes that the statistical models alone do not provide reliable method of monitoring and controlling risk. While VaR models are relatively sophisticated, they have several known limitations. Most significantly, standard VaR models do not incorporate the potential loss caused by very unusual market events. Thus, the VaR process is complemented by Stress testing to measure this potential risk. Stress test is a risk management tool used to determine the impact on earnings of market movements considered “extreme”, i.e., beyond “normal” occurrence. Stress tests are LBP‟s measures of risks to estimate possible losses which the VaR does not capture. The Bank‟s Portfolio Scenario Analysis (PSA) report is a model forecasting the loss return values of a selected portfolio. It calculates the size of possible losses related to a precise scenario. It identifies scenarios that may influence the portfolio strongly and which market variables may trigger these scenarios to be able to come up with sound portfolio risk management strategies. PSA uses various approaches for scenario identification such as the use of data based on market sentiments, replication scenario based on historical events that occurred in the past or extreme value approach using hypothetical scenarios to take account of plausible changes or future developments that have no historical precedent. The Bank also conducts reverse stress testing to identify and simulate the events that can lead the Bank to a particular tail event. Results of PSA are also simulated to CAR of the Bank to be able to assess its impact on the CAR compliance set at 10.00 per cent and the Common Equity Tier 1 (CET1) ratio of at least 6.00 per cent.

74
LIQUIDITY RISK MANAGEMENT Liquidity Risk Management Framework
The LBP Board exercises oversight through RiskCom and delegated the responsibility of managing the overall liquidity of the Bank to the ALCO. This Committee meets twice a month or more frequently as required by prevailing situations. It is responsible for effectively executing the liquidity strategy and overseeing the daily and long-term management of liquidity risk. ALCO delegates day-to-day operating responsibilities to the TIBS based on specific practices and limits established in governing treasury operations. The RMG through the Treasury Risk Management Department (TRMD) is responsible for the oversight of the Bank‟s liquidity risk positions and ensures that reports on the Bank‟s current risk are prepared and provided to ALCO and RiskCom in a timely manner. LBP‟s liquidity risk management process is consistent with the general risk management framework of the Bank covering risk identification, measurement and analysis, monitoring and control. The policies that govern liquidity risk management are reviewed and approved on a regular basis by ALCO and RiskCom. The Bank‟s liquidity policy is to maintain fund availability at all times and hence to be in a position to meet all of its obligations, in normal course of business. In managing its liquidity, LBP has the following sources of funding: cash from operations, stock of marketable assets, government and retail deposit sources, and various credit lines from banks. The ALMG submits to the TIBS Head and the President various daily Treasury Reports (which include the Bank‟s cash or near cash investments and other data related to liquidity) to assist senior management in decision making. The Bank‟s liquidity position is subjected to stress testing and scenario analysis to evaluate the impact of sudden stress events. The scenarios are based on historic events, case studies of liquidity crisis and models using hypothetical events. Liquidity Risk Measurement Models
The Bank considers liquidity risk based on Market and Funding Liquidity Risk perspective. Trading or market liquidity risk refers to inability to unwind positions created from market, exchanges and counterparties due to temporary or permanent factors. The Bank cannot easily eliminate or offset a particular position because of inadequate liquidity in the market. This may be associated with the probability that large transactions may have a significant effect on market prices that lack sufficient depth, or associated with structured or complex investments as the market of potential buyers is typically small. It is also the risk of an unexpected and sudden erosion of market liquidity as a result of sharp price movement or jump in volatility, or internal to the Bank such as loss of market confidence. This scenario is captured through stress testing or scenario analysis. Funding liquidity risk refers to current and prospective risk arising from the inability to meet investment and funding requirements arising from cash flow mismatches without
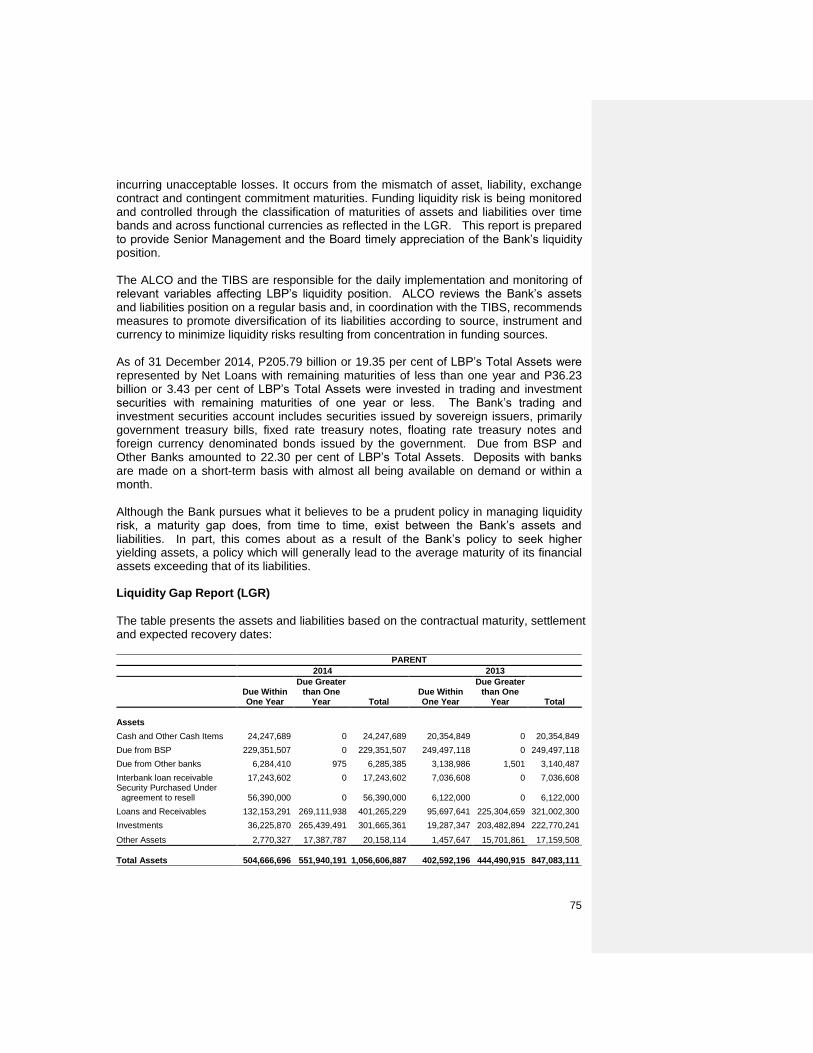
75
incurring unacceptable losses. It occurs from the mismatch of asset, liability, exchange contract and contingent commitment maturities. Funding liquidity risk is being monitored and controlled through the classification of maturities of assets and liabilities over time bands and across functional currencies as reflected in the LGR. This report is prepared to provide Senior Management and the Board timely appreciation of the Bank‟s liquidity position. The ALCO and the TIBS are responsible for the daily implementation and monitoring of relevant variables affecting LBP‟s liquidity position. ALCO reviews the Bank‟s assets and liabilities position on a regular basis and, in coordination with the TIBS, recommends measures to promote diversification of its liabilities according to source, instrument and currency to minimize liquidity risks resulting from concentration in funding sources. As of 31 December 2014, P205.79 billion or 19.35 per cent of LBP‟s Total Assets were represented by Net Loans with remaining maturities of less than one year and P36.23 billion or 3.43 per cent of LBP‟s Total Assets were invested in trading and investment securities with remaining maturities of one year or less. The Bank‟s trading and investment securities account includes securities issued by sovereign issuers, primarily government treasury bills, fixed rate treasury notes, floating rate treasury notes and foreign currency denominated bonds issued by the government. Due from BSP and Other Banks amounted to 22.30 per cent of LBP‟s Total Assets. Deposits with banks are made on a short-term basis with almost all being available on demand or within a month. Although the Bank pursues what it believes to be a prudent policy in managing liquidity risk, a maturity gap does, from time to time, exist between the Bank‟s assets and liabilities. In part, this comes about as a result of the Bank‟s policy to seek higher yielding assets, a policy which will generally lead to the average maturity of its financial assets exceeding that of its liabilities. Liquidity Gap Report (LGR)
The table presents the assets and liabilities based on the contractual maturity, settlement and expected recovery dates:
PARENT
2014 2013
Due Within One Year
Due Greater than One
Year Total Due Within One Year
Due Greater than One
Year Total
Assets
Cash and Other Cash Items 24,247,689 0 24,247,689 20,354,849 0 20,354,849
Due from BSP 229,351,507 0 229,351,507 249,497,118 0 249,497,118
Due from Other banks 6,284,410 975 6,285,385 3,138,986 1,501 3,140,487
Interbank loan receivable 17,243,602 0 17,243,602 7,036,608 0 7,036,608 Security Purchased Under agreement to resell 56,390,000 0 56,390,000 6,122,000 0 6,122,000
Loans and Receivables 132,153,291 269,111,938 401,265,229 95,697,641 225,304,659 321,002,300
Investments 36,225,870 265,439,491 301,665,361 19,287,347 203,482,894 222,770,241
Other Assets 2,770,327 17,387,787 20,158,114 1,457,647 15,701,861 17,159,508
Total Assets 504,666,696 551,940,191 1,056,606,887 402,592,196 444,490,915 847,083,111
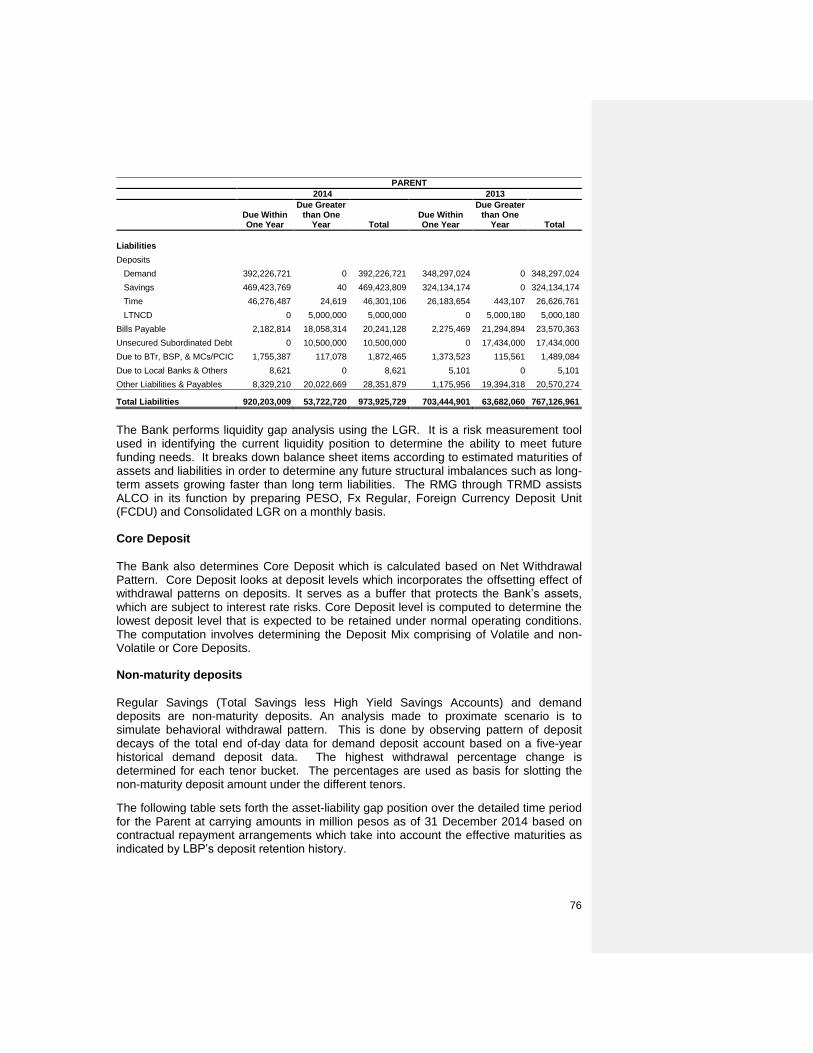
76
PARENT
2014 2013
Due Within One Year
Due Greater than One
Year Total Due Within One Year
Due Greater than One
Year Total
Liabilities
Deposits
Demand 392,226,721 0 392,226,721 348,297,024 0 348,297,024
Savings 469,423,769 40 469,423,809 324,134,174 0 324,134,174
Time 46,276,487 24,619 46,301,106 26,183,654 443,107 26,626,761
LTNCD 0 5,000,000 5,000,000 0 5,000,180 5,000,180
Bills Payable 2,182,814 18,058,314 20,241,128 2,275,469 21,294,894 23,570,363
Unsecured Subordinated Debt 0 10,500,000 10,500,000 0 17,434,000 17,434,000
Due to BTr, BSP, & MCs/PCIC 1,755,387 117,078 1,872,465 1,373,523 115,561 1,489,084
Due to Local Banks & Others 8,621 0 8,621 5,101 0 5,101
Other Liabilities & Payables 8,329,210 20,022,669 28,351,879 1,175,956 19,394,318 20,570,274
Total Liabilities 920,203,009 53,722,720 973,925,729 703,444,901 63,682,060 767,126,961
The Bank performs liquidity gap analysis using the LGR. It is a risk measurement tool used in identifying the current liquidity position to determine the ability to meet future funding needs. It breaks down balance sheet items according to estimated maturities of assets and liabilities in order to determine any future structural imbalances such as long-term assets growing faster than long term liabilities. The RMG through TRMD assists ALCO in its function by preparing PESO, Fx Regular, Foreign Currency Deposit Unit (FCDU) and Consolidated LGR on a monthly basis. Core Deposit
The Bank also determines Core Deposit which is calculated based on Net Withdrawal Pattern. Core Deposit looks at deposit levels which incorporates the offsetting effect of withdrawal patterns on deposits. It serves as a buffer that protects the Bank‟s assets, which are subject to interest rate risks. Core Deposit level is computed to determine the lowest deposit level that is expected to be retained under normal operating conditions. The computation involves determining the Deposit Mix comprising of Volatile and non-Volatile or Core Deposits. Non-maturity deposits
Regular Savings (Total Savings less High Yield Savings Accounts) and demand deposits are non-maturity deposits. An analysis made to proximate scenario is to simulate behavioral withdrawal pattern. This is done by observing pattern of deposit decays of the total end of-day data for demand deposit account based on a five-year historical demand deposit data. The highest withdrawal percentage change is determined for each tenor bucket. The percentages are used as basis for slotting the non-maturity deposit amount under the different tenors.
The following table sets forth the asset-liability gap position over the detailed time period for the Parent at carrying amounts in million pesos as of 31 December 2014 based on contractual repayment arrangements which take into account the effective maturities as indicated by LBP‟s deposit retention history.

77
Due within 3
mos.
Due more than 3 to 6 mos.
Due more than 6
mos. to 1 year
Due more than 1
year to 5 years
Due more than 5 years
Total
(In million pesos)
Financial Assets
Cash and Due from Banks 202,560 0 57,324 0 1 259,885
Total Loans 130,400 51,508 23,879 81,026 188,086 474,899
Total Investments 15,753 6,874 13,598 89,157 176,283 301,665
Other Assets 2,188 0 582 0 17,388 20,158
Total Assets 350,901 58,382 95,383 170,183 381,758 1,056,607
Financial Liabilities
Deposits 384,711 18,717 15,993 652 492,879 912,952
Borrowings 2,373 474 1,100 6,764 11,411 22,122
Other Liabilities and Unsecured Subordinated Debt 249 0 8,080 0 30,523 38,852
Total Capital 82,681 82,681
Total Liabilities & Capital 387,333 19,191 25,173 7,416 617,494 1,056,607
Asset & Liabilities Gap Position (36,432) 39,191 70,210 162,767 (235,736)
The LBP has established guidelines for liquidity risk limit setting to enable it to properly and prudently manage and control liquidity risk, consistent with the nature and complexity of its business activities, overall level of risk and its risk appetite. The Maximum Cumulative Outflow (MCO) limit set by the BoD is one of the tools used to manage and control the liquidity risk in the gap report of the Bank. It is a measure of the liquidity gap between maturing assets and liabilities. MCO limits put a cap on the total amount of negative gaps in the near time buckets. Financial Analysis is another liquidity risk measurement tool that calculates and compares liquidity and leverage ratios derived from information on the Bank‟s financial statements against set liquidity or leverage limits. The following table sets out the Bank‟s liquidity ratios as of the dates indicated:
31 December
2014
(Prudential)
2013
(Audited)
(In million pesos, except percentages)
Liquid Assets(1)
625,897.34 502,534.78
Financial Ratios:
Liquid Assets to Total Assets 59.55% 59.33%
Liquid Assets to Total Deposit 68.46% 71.38% 1. Note: Liquid Assets include Cash and other Cash Items, Interbank Loans, Government Securities and Tradable non-
Government securities and commercial paper
Liquidity Stress Test
The Bank examines several possible situations, usually worst case, most likely case and best case. It does Portfolio Stress Test and Liquidity Stress Test. Result of scenario analysis helps the Bank focus on the level of liquidity that could be reasonably built within a specified period to meet different situations. This also serves as guide for the
Formatted: Indent: First line: 2 ch
78
Bank in the limit setting process for the various ratios mentioned, for example, minimum liquid assets to volatile liabilities. LBP developed the Liquidity Stress Test to address the shortcoming of LGR Model. This is a risk management tool used to evaluate the potential impact on liquidity of unlikely, although plausible, events or movements in a set of financial variables. While such unlikely outcomes do not mesh easily with LGR analysis, analysis of these outcomes can provide further information on expected portfolio losses or cash flow over a given time horizon. Liquidity management is one of the fundamental preconditions to achieving all other banking activities - strategically mapped by ALCO, actively managed by the TIBS through the ALMG and overseen by the RMG through TRMD. LBP performs a comprehensive liquidity risk measurement and control using as tool the Consolidated LGR covering the entire LBP Group. Risk models used in liquidity risk management are subjected to independent model validation. The Internal Audit Group (IAG) is tasked to do model validation. An independent validation is also being done by the Basel Officer for Market who reports directly to the Head of the RMG. For this year, incorporated were latest enhancements made on the model as a result of independent model validation by a third party auditor. Liquidity Coverage Ratio (LCR)
LCR is designed to ensure banks maintain an adequate level of unencumbered high quality liquid assets to meet liquidity needs under an acute 30-day stress scenario. Under the Basel Committee‟s Basel III LCR rules, the LCR is to be calculated by dividing the amount of unencumbered cash and highly liquid, unencumbered government, government-backed and corporate securities by estimated net outflows over a stressed 30-day period. The net outflows are calculated by applying assumed outflow factors, prescribed in the rules, to various categories of liabilities, such as deposits, unsecured and secured wholesale borrowings, unused commitments and derivatives-related exposures, partially offset by inflows from assets maturing within 30- days. Pending issuance of BSP Circular and Guidelines for LCR, the Bank used an internally developed LCR model. In the meantime, the Bank has started mapping accounts that may be classified as “High Quality Liquid Assets” based on Basel III Requirements. The Bank has institutionalized other measures to properly manage liquidity risk as follows: 1. Active Board and Senior Management Oversight – The Board and Senior Management receives regular liquidity reports and updates to fully inform them of the level of liquidity risk assumed by the Bank and if activities undertaken are within the prescribed risk tolerance in accordance with approved guidelines, liquidity or funding policy (targets), risk limits. 2. Liquidity Risk Management Governance - The Board defines LBP‟s risk appetite and other key metrics that set the levels of acceptable liquidity risk that can be taken by the Bank. The Board also provides the final validation of proposed organizational and reporting structures for the management of liquidity risk. It is also responsible for ensuring that liquidity risk management strategies are implemented and followed. It
79
ensures that risk appetite is respected and delegates to ALCO the management and optimization of the bank‟s liquidity risk position.
The ALCO optimizes results within the risk appetite limit set by the Bank and takes decisions to manage liquidity risk and allocate resources to manage this risk. ALCO is responsible for ensuring that liquidity risk management strategies are applied. It reviews liquidity risk reports and monitors compliance with agreed risk appetite limits. It monitors the adequacy of the risk infrastructure, pre-validates (as well as maintains) risk indicators and models. The TIBS is responsible for managing the liquidity risk exposure that the bank generates. The TIBS ensures that ALCO decisions pertaining to the management of liquidity risk are implemented. The FMG and the ALMG take assets and liabilities positions by executing ALCO‟s decision. They also develop, calibrate and maintain LBP‟s liquidity risk indicators. The RMG through TRMD independently performs oversight function related to liquidity risk identification, measurement and analysis, monitoring and control. TRMD reports on the Bank‟s market risk exposure to ALCO and the RiskCom. The Financial Accounting Department (FAD) and Treasury Operations Department (TOD) provide the backroom support and are responsible in generating and reconciling LBP balance sheet. As such, FAD and TOD provide figures and various relevant reports to FMG, ALMG, and TRMD. 3. Liquidity Risk Approving Authorities – The Bank has identified approving levels and authorities in the formulation of risk management policies and procedures, risk measurement methodologies, limit setting and ratification of limit allocation, monitoring and control procedures. 4. Organized liquidity management methods – The Bank has established adequate
internal guidelines as well as administrative, accounting and review procedures. Each operating unit of the Bank is mandated to come up and regularly review and update its Operations Manual.
5. Documented Liquidity Risk Management Policies and Procedures – The Bank has established and documented all risk management policies and procedures which are subject to regular review and revised as needed. 6. Diversified funding sources – The Bank utilizes diversified funding sources that includes Government and Private deposits, Loans from multilateral and bilateral institutions (World Bank [WB], Asian Development Bank [ADB], Japan Bank for International Cooperation [JBIC] etc.), inventory of GS under AFS, credit lines with other banks, among others.
7. Statutory deposit with BSP – Under existing BSP regulations, non-FCDU deposit liabilities of the Bank are subject to unified reserve equivalent to 20.00% effective 30 May 2014 (Under BSP Circular #832). Government deposits are subject to an additional 30.00 per cent liquidity floor requirement for total reserves of 50.00 per cent.
8. Acquisition of an Asset and Liability Risk Management System (ALRMS) for full automation of ALRMS processes – The Bank has approved the acquisition of the ALRMS which would be facilitated with the hiring of an external consultant to assist the

80
Bank in the system development and production. The system when implemented shall allow the Bank to optimize the use of a dynamic system to manage not only liquidity risks but also other risks associated with the investment functions of the Bank.
9. Liquidity Contingency Plan (LCP) - To ensure that the Bank has sufficient liquidity at all times, the Bank formulated a liquidity contingency plan using extreme scenarios of adverse conditions and evaluates the Bank‟s ability to withstand these prolonged scenarios. The contingency plan focuses on the Bank‟s strategy for coordinating managerial action during a crisis and includes procedures for making up cash flow shortfalls in adverse situations.
The plan details the amount of funds (such as unused credit facilities) the Bank can access and the scenarios under which it could use them. This provides guidance for managing liquidity risks in the following market scenarios:
a. Ordinary course of business - In the ordinary course of its business activities, the Bank typically manages its liquidity risk by seeking to roll-over its deposited funds through the offering of competitive rates of interest, drawing upon its interbank credit lines or the early termination of Government Securities Purchased Under Reverse Repurchase Agreements (GSPURRA). b. Seasonal or Intermediation duration - The Bank manages its liquidity risk in the longer-term via the liquidation of marketable AFS category securities, the solicitation of government deposits and the use of derivative instruments in the swap market. c. Acute or institution specific – In acute or institution specific circumstances, the
Bank will seek to manage its liquidity risk by the proportional liquidation of AFS and HTM-GS, the non-renewal of maturing short-term loans, borrowings from the BSP and the PDIC using eligible securities as collateral and generating cash infusions through large deposits and the Government.
The LCP likewise contains guidelines on Business Resumption Plan towards a transition to normal liquidity condition. This plan defines expectations from various sectors during the transition period from crisis to normal condition.