notes to consolidated financial statements...consolidated financial statements issued domestically...
TRANSCRIPT

Bridgestone Corporation20
NOTE 1 NATURE OF OPERATIONS Bridgestone Corporation and its subsidiaries (hereinafter referred to collectively as the “Companies”) engage in developing, manufacturing and marketing tires and diversified products. The Companies market their products worldwide and operate manufacturing plants in every principal market. Development activities take place primarily in Japan, the United States of America (the “U.S.”) and Europe.
Tire operations include retread business, automotive maintenance and repairs, retail business and raw material supplies, as well as tire development, manufacturing and marketing. Diversified products include industrial products, chemical products, automotive components, construction materials, electronic equipment, bicycles and sporting goods.
NOTE 2 BASIS OF PRESENTATION OF CONSOLIDATED FINANCIAL STATEMENTSThe accompanying consolidated financial statements have been prepared in accordance with the provisions set forth in the Japanese Financial Instruments and Exchange Act and its related accounting regulations, and in accordance with accounting principles generally accepted in Japan (“Japanese GAAP”), which are different in certain respects as to the application and disclosure requirements of International Financial Reporting Standards (“IFRS”) and the accounting principles generally accepted in the U.S. (“U.S. GAAP”).
The consolidated financial statements are stated in Japanese yen, the currency of the country in which Bridgestone Corporation (the “Company”) is incorporated and operates. The translations of Japanese yen amounts into U.S. dollar amounts are included solely for the convenience of readers outside Japan and have been made at the rate of ¥109.56 to $1, the approximate rate of exchange on December 31, 2019. Such translations should not be construed as representations that the Japanese yen amounts could be converted into U.S. dollars at that or any other rate.
NOTE 3 SUMMARY OF SIGNIFICANT ACCOUNTING POLICIES(1) Consolidation
The consolidated financial statements include the accounts of the Companies in which the Company has effective control. All significant intercompany balances and transactions have been eliminated in consolidation. All material unrealized profits included in assets resulting from transactions within the Companies are also eliminated. Investments in affiliated companies, primarily those owned 20% to 50%, are accounted for under the equity method with appropriate adjustments for intercompany profits and dividends. Share of profit of entities accounted for using the equity method is included in other income (expenses) in the consolidated statements of income. The number of consolidated subsidiaries and affiliated companies for 2019 and 2018 is summarized below:
2019 2018
Consolidated subsidiaries 280 285
Affiliated companies 143 146
(2) Unification of accounting policies applied to foreign
subsidiaries for the consolidated financial statements
In May 2006, the Accounting Standards Board of Japan (the “ASBJ”) issued ASBJ Practical Issues Task Force (“PITF”) No. 18, “Practical Solution on Unification of Accounting Policies Applied to Foreign Subsidiaries for the Consolidated Financial Statements” which was subsequently revised in February 2010
and March 2015 to reflect revisions of the relevant Japanese GAAP or accounting standards in other jurisdictions. PITF No. 18 prescribes that the accounting policies and procedures applied to a parent company and its subsidiaries for similar transactions and events under similar circumstances should in principle be unified for the preparation of the consolidated financial statements. However, financial statements prepared by foreign subsidiaries in accordance with either IFRS or U.S. GAAP tentatively may be used for the consoli dation process, except for the following items that should be adjusted in the consolidation process so that net income is accounted for in accordance with Japanese GAAP, unless they are not material: (i) amortization of goodwill; (ii) scheduled amortization of actuarial gain or loss of pensions that has been recorded in equity through other comprehensive income; (iii) expensing capitalized development costs of R&D; and (iv) cancellation of the fair value model of accounting for property, plant and equipment and investment properties and incorporation of the cost model of accounting.
(3) Unification of accounting policies applied to foreign
affiliated companies for the equity method
In March 2008, the ASBJ issued ASBJ Statement No. 16, “Accounting Standard for Equity Method of Accounting for Investments” which was subsequently revised in line with the revisions to PITF No. 18 above. The standard requires adjustments to be made to conform the affiliate’s accounting policies for similar transactions and events under similar
NOTES TO CONSOLIDATED FINANCIAL STATEMENTSBridgestone Corporation and Subsidiaries
ANNUAL REPORT 2019 Financial Review 21
circum stances to those of the parent company when the affiliate’s financial statements are used in applying the equity method unless it is impracticable to determine such adjustments. In addition, financial statements prepared by foreign affiliated companies in accordance with either IFRS or U.S. GAAP tentatively may be used in applying the equity method if the following items are adjusted so that net income is accounted for in accordance with Japanese GAAP, unless they are not material: (i) amortization of goodwill; (ii) scheduled amortization of actuarial gain or loss of pensions that has been recorded in equity through other comprehensive income; (iii) expensing capitalized development costs of R&D; and (iv) cancellation of the fair value model of accounting for property, plant and equipment and investment properties and incorporation of the cost model of accounting.
(4) Cash equivalents
Cash equivalents are shortterm investments that are readily convertible into cash and that are exposed to insignificant risk of changes in value. Cash equivalents include highly liquid investments with original maturities of three months or less.
(5) Allowance for doubtful accounts
Allowance for doubtful accounts is established in amounts considered to be appropriate based on the Companies’ past credit loss experience and an evaluation of potential losses in the receivables outstanding.
(6) Inventories
Inventories are substantially stated at the lower of cost, determined by the average method, or net selling value. Meanwhile, inventories held by subsidiaries in the U.S. are substantially stated at the lower of cost, determined principally by the lastin, firstout method, or market value.
(7) Marketable and investment securities
Marketable and investment securities are classified and accounted for, depending on management’s intent, as follows: Availableforsale securities, which are not classified as neither of trading securities nor heldtomaturity debt, are reported at fair value, with unrealized gains and losses, net of applicable taxes, reported in a separate component of equity. Nonmarketable availableforsale securities are stated at cost determined by the movingaverage method. For otherthantemporary declines in fair value, investment securities are reduced to net realizable value by a charge to income.
(8) Property, plant and equipment
Property, plant and equipment are stated at cost. Depreciation of property, plant and equipment of the Company and its domestic subsidiaries is computed substantially by the decliningbalance method based on the estimated useful lives of the assets, while the straightline method is applied to property, plant and equipment of the Company’s overseas subsidiaries. Maintenance, repair and minor renewals are charged to income as incurred.
(9) Impairment of assets
Assets are reviewed for impairment whenever events or changes in circumstance indicate the carrying amount of an asset or asset group may not be recoverable. An impairment loss is recognized if the carrying amount of an asset or asset group exceeds the sum of the undiscounted future cash flows expected to result from the continued use and eventual disposition of the asset or asset group. The impairment loss would be measured as the amount by which the carrying amount of an asset or asset group exceeds its recoverable amount, which is the higher of the discounted future cash flows expected to result from the continued use and eventual disposition of the asset or asset group, or the net selling price at disposition.
(10) Goodwill
Goodwill recorded by subsidiaries, and the excess of cost of the Company’s investments in subsidiaries and affiliated companies over its equity at the respective dates of acquisition, are mainly being amortized on a straightline basis over a reasonable economical life of up to 20 years.
(11) Provision for sales returns
Provision for sales returns is estimated and recorded principally to provide for future losses on the return of snow tires.
(12) Provision for recall
In order to reserve for outlays related to the free inspections, repairs and replacement, etc. of the recalled bicycles and powerassisted bicycles, the estimated amount of future obligations is recorded.
(13) Provision for product warranties
Provision for product warranties, included in other liabilities, is estimated and recorded at the time of sale to provide for future potential costs, such as costs related to aftersales services, in amounts considered to be appropriate based on the Companies’ past experience.
NOTES TO CONSOLIDATED FINANCIAL STATEMENTS

Bridgestone Corporation22
(14) Provision for environmental remediation
In order to reserve for outlays legally required for removal and disposal of polychlorinated biphenyl (“PCB”) and other, the estimated amount of future obligations is recorded.
(15) Retirement and pension plans
The Company and its domestic subsidiaries have contributory funded defined benefit pension plans and unfunded retirement benefit plans for employees. Certain of the Company’s overseas subsidiaries have funded defined benefit pension plans and defined contribution pension plans. The Company accounts for the liability of retirement benefits based on the projected benefit obligations and plan assets at the balance sheet date. The projected benefit obligations are attributed to periods on a benefit formula basis or a straightline basis. Actuarial gains and losses and past service costs that are yet to be recognized in profit or loss are recognized within equity (accumulated other comprehensive income), after adjusting for tax effects and are recognized in profit or loss over 3 years to 13 years, respectively, no longer than the expected average remaining service period of the employees. Retirement allowances for directors are recorded as a liability at the amount that would be required if all directors retired at each balance sheet date.
(16) Asset retirement obligations
An asset retirement obligation is recorded for a legal obligation imposed either by law or contract that results from the acquisition, construction, development and normal operation of a tangible fixed asset and is associated with the retirement of such tangible fixed asset. The asset retirement obligation is recognized as the sum of the discounted cash flows required for the future asset retirement and is recorded in the period in which the obligation is incurred if a reasonable estimate can be made. If a reasonable estimate of the asset retirement obligation cannot be made in the period the asset retirement obligation is incurred, the liability should be recognized when a reasonable estimate of the asset retirement obligation can be made. Upon initial recognition of a liability for an asset retirement obligation, an asset retirement cost is capitalized by increasing the carrying amount of the related fixed asset by the amount of the liability. The asset retirement cost is subsequently allocated to expense through depreciation over the remaining useful life of the asset. Over time, the liability is accreted to its present value each period. Any subsequent revisions to the timing or the amount of the original estimate of undiscounted cash flows are reflected as an adjustment to the carrying amount of the liability and the capitalized amount of the related asset retirement cost.
(17) Leases
Finance (Capital) lease transactions are capitalized by recognizing lease assets and lease obligations in the balance sheet.
(18) Income taxes
The provision for income taxes is computed based on income before income taxes included in the consolidated statement of income. The asset and liability approach is used to recognize deferred tax assets and liabilities for the expected future tax consequences of temporary differences between the carrying amounts and the tax bases of assets and liabilities. Deferred income taxes are measured by applying currently enacted income tax rates to the temporary differences. A valuation allowance is provided for any portion of the deferred tax assets where it is considered more likely than not that they will not be realized.
(19) Foreign currency transactions
All shortterm and longterm monetary receivables and payables denominated in foreign currencies are translated into Japanese yen at the exchange rates at the balance sheet date. The foreign currency exchange gains and losses from translation are recognized in the consolidated statement of income.
(20) Foreign currency financial statements
The balance sheet accounts of the Company’s overseas subsidiaries are translated into Japanese yen at the current exchange rate at the balance sheet date except for equity, which is translated at the historical rate. Differences arising from such translation are shown as foreign currency translation adjustments under accumulated other comprehensive income in a separate component of equity. Revenue and expense accounts of the Company’s overseas subsidiaries are translated into Japanese yen at the average annual exchange rate.
(21) Derivatives and hedging activities
The Companies use derivative financial instruments to manage their exposures to fluctuations in foreign currency exchange rates, interest rates and commodity prices. Foreign currency forward contracts, currency swap contracts and currency option contracts are utilized by the Companies to reduce foreign currency exchange risks. Interest rate swaps are utilized by the Companies to reduce interest rate risks. Also, commodity swap contracts are utilized by the Companies to reduce commodity price risks. The Companies do not enter into derivatives for trading or speculative purposes. Derivative financial instruments are classified and accounted for as follows: (i) all derivatives are recognized as either assets or liabilities and measured at fair value, and gains or losses on derivative transactions are recognized in the consolidated statement of income; and (ii) for derivatives used for hedging purposes, if such derivatives qualify for hedge accounting because of high correlation and
NOTES TO CONSOLIDATED FINANCIAL STATEMENTS

ANNUAL REPORT 2019 Financial Review 23
effectiveness between the hedging instruments and the hedged items, gains or losses on derivatives are deferred until maturity of the hedged transactions. Foreign currency forward contracts which are designated as hedging exposure to variable cash flows of forecasted transactions are measured at fair value, and the unrealized gains or losses are deferred until the underlying transactions are completed. Other foreign currency forward contracts, currency swap contracts and currency option contracts employed to hedge foreign currency exchange exposures to changes in fair value and in cash flow are also measured at fair value but the unrealized gains or losses are recognized in income. Shortterm and longterm debt denominated in foreign currencies for which foreign currency forward contracts and currency swap contracts are used to hedge the foreign currency fluctuations are translated at the contracted rate if the foreign currency forward contracts and currency swap contracts qualify for hedge accounting. Interest rate swaps which qualify for hedge accounting and meet specific matching criteria are not remeasured at market value, but the differential paid or received under the swap agreements is recognized and included in interest expenses. The gains or losses on commodity swap contracts used to hedge fluctuations of commodity prices are recognized currently in income.
(22) Per share of common stock
Basic net income per share is computed by dividing net income available to common shareholders by the weightedaverage number of common stock outstanding for the period, retroactively adjusted for stock splits. Diluted net income per share reflects the potential dilution that could occur if securities were exercised or converted into common stock. Diluted net income per share of common stock assumes full conversion of the outstanding convertible notes and bonds at the beginning of the year (or at the time of issuance) with an applicable adjustment for related interest expense, net of tax, and full exercise of outstanding warrants and stock options. Cash dividends per share presented in the accompanying consolidated statement of income are dividends applicable to the respective fiscal years, including dividends to be paid after the end of the year.
(23) Reclassification
In preparing the consolidated financial statements, certain reclassifications and rearrangements have been made to the consolidated financial statements issued domestically in order to present them in a form which is more familiar to readers outside Japan. In addition, certain reclassifications have been made in the 2018 consolidated financial statements to conform to the classifications used in 2019.
(24) Changes in presentation
1. Changes Resulting from Adoption of the “Partial Amendments to Accounting Standard for Tax Effect Accounting,” etc.
The Company has adopted the “Partial Amendments to Accounting Standard for Tax Effect Accounting” (ASBJ Statement No. 28 on February 16, 2018), etc. from the beginning of this fiscal year. As a result, deferred tax assets are presented in investments and other assets, and deferred tax liabilities are presented in long term liabilities. As a result, on the consolidated balance sheet for the previous consolidated fiscal year, “Deferred tax assets” in “Current assets” decreased by ¥55,974 million, while “Deferred tax assets” in “Investments and other assets” increased by ¥32,545 million. Meanwhile, “Deferred tax liabilities” in “Current liabilities” decreased by ¥3,887 million and “Deferred tax liabilities” in “Longterm liabilities” decreased by ¥19,542 million. Hence, total assets decreased by ¥23,429 million due to the offset of deferred tax assets and deferred tax liabilities levied on the same taxable entity.
2. Consolidated Statement of Cash FlowsPrior to January 1, 2019, “Increase (decrease) in allowance for doubtful accounts” was disclosed separately in the cash flows operating activities section of the consolidated statement of cash flows. Since during this fiscal year ended December 31, 2019, the materiality of the amount decreased, such amount was included in “Other” in the cash flows from operating activities section of the consolidated statement of cash flows for the year ended December 31, 2019. The amount included in “Other” for the year ended December 31, 2018 was ¥5,774 million. Prior to January 1, 2019, “Share of (profit) loss of entities accounted for using equity method” was included in “Other” in the cash flows from operating activities section of the consolidated statement of cash flows. Since during this fiscal year ended December 31, 2019, the materiality of the amount increased, such amount was disclosed separately in the cash flows from operating activities section of the consolidated statement of cash flows. The amount included in “Other” for the year ended December 31, 2018 was ¥1,414 million. Prior to January 1, 2019, “Acquisition of subsidiaries” was included in “Other” in the cash flows from investing activities section of the consolidated statement of cash flows. Since during this fiscal year ended December 31, 2019, the materiality of the amount increased, such amount was disclosed separately in the cash flows from investing activities section of the consolidated statement of cash flows. The amount included in “Other” for the year ended December 31, 2018 was (¥2,368) million. Prior to January 1, 2019, “Purchase of treasury shares” was included in “Other” in the cash flows from financing activities section of the consolidated statement of cash flows. Since during this fiscal year ended December 31, 2019, the
NOTES TO CONSOLIDATED FINANCIAL STATEMENTS
Bridgestone Corporation24
materiality of the amount increased, such amount was disclosed separately in the cash flows from financing activities section of the consolidated statement of cash flows. The amount included in “Other” for the year ended December 31, 2018 was (¥8) million.
(25) Accounting Changes
1. Adoption of ASU No. 2014-09 “Revenue from Contracts with Customers”
Certain consolidated subsidiaries overseas which apply U.S. GAAP have adopted ASU No. 201409, “Revenue from Contracts with Customers” (May 28, 2014; hereinafter “ASU No. 201409”) from the beginning of fiscal 2019. ASU No. 201409 calls for an entity to recognize revenue to depict the transfer of promised goods or services to customers in an amount that reflects the consideration to which the entity expects to be entitled in exchange for those goods or services. Certain overseas subsidiaries adopted the method by which the cumulative effect of retrospectively applying this standard was recognized at the date of initial application. As a result, under current liabilities, other increased by ¥17,210 million and accrued expenses decreased by ¥19,980 million; under long term liabilities, other increased by ¥25,759 million and provision for product warranties decreased by ¥25,759 million; and retained earnings increased by ¥229 million at the beginning of fiscal 2019. This change in accounting policies has an immaterial effect on operating profit, ordinary profit and profit before income taxes of fiscal 2019. It also has an immaterial effect on net assets per share, basic earnings per share, and diluted earnings per share of fiscal 2019.
2. Adoption of IFRS 16 “Leases”Certain consolidated subsidiaries overseas which apply International Financial Reporting Standards (IFRS) have adopted IFRS 16 “Leases” (January 13, 2016; hereinafter “IFRS 16”) from the beginning of fiscal 2019. IFRS 16 requires lessees to recognize assets and liabilities for, in principle, all leases. Certain overseas subsidiaries adopted the method by which the cumulative effect of retrospectively applying this standard was recognized at the date of initial application. As a result, assets increased by ¥49,606 million, liabilities increased by ¥51,605 million, and retained earnings decreased by ¥1,998 million at the beginning of fiscal 2019. The increase in assets was mainly due to the increase in property, plant and equipment, and the increase in liabilities was mainly due to the increase in lease obligations. This change in accounting policies has an immaterial effect on operating profit, ordinary profit and profit before income taxes of fiscal 2019. It also has an immaterial effect on net assets per share, basic earnings per share, and diluted earnings per share of fiscal 2019.
(26) Accounting standards that have not been applied
Entries have been omitted due to low importance. Due to the voluntary adoption of IFRS from the first quarter of fiscal 2020, entries valid under nolonger used JGAAP and U.S. GAAP standards have been omitted.
NOTES TO CONSOLIDATED FINANCIAL STATEMENTS

ANNUAL REPORT 2019 Financial Review 25
NOTES TO CONSOLIDATED FINANCIAL STATEMENTS
NOTE 4 INVENTORIESInventories at December 31, 2019 and 2018, consist of the following:
2019 2018 2019
Millions of yen Thousands of U.S. dollars
Finished products ¥406,119 ¥407,609 $3,706,818
Work in process 39,361 37,904 359,265
Raw materials and supplies 150,944 171,721 1,377,729
Total ¥596,424 ¥617,234 $5,443,812
NOTE 5 MARKETABLE AND INVESTMENT SECURITIESInformation regarding each category of availableforsale securities at December 31, 2019 and 2018, is as follows:
Cost Unrealized
gainsUnrealized
losses Fair value Cost Unrealized
gains Unrealized
losses Fair value
2019 2018
Millions of yen
Securities Classified as:
Available-for-sale:
Equity securities ¥15,128 ¥73,826 ¥(1) ¥88,953 ¥25,675 ¥142,198 ¥(10) ¥167,863
Thousands of U.S. dollars
Securities Classified as:
Available-for-sale:
Equity securities $138,079 $673,841 $(9) $811,911
In addition to the above, the Companies have availableforsale securities classified as marketable securities under U.S. GAAP of ¥136,045 million ($1,241,740 thousand) and ¥143,854 million, respectively, for the years ended December 31, 2019 and 2018.
Availableforsale securities whose fair values are not readily determinable at December 31, 2019 and 2018, are as follows:
2019 2018 2019
Carrying amount Millions of yen Thousands of U.S. dollars
Available-for-sale:
Equity securities ¥6,028 ¥4,268 $55,020
Proceeds from sales of availableforsale securities for the years ended December 31, 2019 and 2018 are ¥87,092 million ($794,925 thousand) and ¥20,554 million, respectively. Gross realized gains on these sales, for the years ended December 31, 2019 and 2018, computed on the moving average cost basis, are ¥76,647 million ($699,589 thousand) and ¥16,238 million, respectively.
The information of availableforsale securities which were sold during the year ended December 31, 2019 is as follows:
Proceeds Realized gains Realized losses Proceeds Realized gains Realized losses
2019
Millions of yen Thousands of U.S. dollars
Securities Classified as:
Available-for-sale:
Equity securities ¥87,092 ¥76,647 ¥5 $794,925 $699,589 $46

Bridgestone Corporation26
Notes and accounts receivable and property, plant and equipment were pledged as collateral for certain bank loans. The aggregate carrying amount of the assets pledged as collateral for shortterm bank loans of ¥0 ($0) and longterm bank loans of ¥0 ($0) at December 31, 2019, is ¥494 million ($4,509 thousand). General agreements with respective banks provide, as is customary in Japan, that additional collateral must be provided under certain circumstances if requested by such banks and that certain banks have the right to offset cash deposited with them against any longterm or shortterm debt or obligation that becomes due and, in case of default and certain other specified events, against all other debt payable to the banks. The Company has never been requested to provide any additional collateral. Effective January 2020, BRIDGESTONE AMERICAS, INC. (“BSAM”) and its major subsidiaries in the U.S. entered into
separate eighteen amended and restated revolving credit agreements with a syndicate of banks providing an aggregate borrowing commitment of $1,100 million. The revolving credit agreement consists of two tranches, each of which has an aggregate borrowing commitment of $550 million, and expire in January 2021 and January 2022, respectively. These agreements contain certain customary affirmative and negative covenants, the most restrictive of which includes (i) the maintenance by BSAM and its major subsidiaries of their consolidated tangible net worth and (ii) restrictions on entering into additional debt arrangements and (iii) restrictions related to the sale of assets. The above agreements replaced the separate seventeen amended and restated revolving credit agreements, whose expiration dates are January 2020 and January 2021. As of December 31, 2019, BSAM’s outstanding balance under the seventeen amended and restated revolving credit agreements was $0.
NOTE 6 SHORT-TERM AND LONG-TERM DEBTShortterm debt at December 31, 2019 and 2018, consists of the following:
2019 2018 2019
Millions of yen Thousands of U.S. dollars
Shortterm bank loans, weighted average interest rate of 3.2% at December 31, 2019, and 3.8% at December 31, 2018 ¥ 73,057 ¥76,384 $ 666,822Commercial paper, weighted average interest rate of (0.4%) at December 31, 2019, and (0.3%) at December 31, 2018 58,696 20,955 535,743
Total ¥131,753 ¥97,339 $1,202,565
Longterm debt at December 31, 2019 and 2018, consists of the following:
2019 2018 2019
Millions of yen Thousands of U.S. dollars
Borrowings from banks, insurance companies and others, weighted average interest rate of 3.0% at December 31, 2019, and 3.0% at December 31, 2018, denominated mainly in Japanese yen, U.S. dollars and Euros:
Unsecured ¥ 37,938 ¥ 62,285 $ 346,276
0.2% yen unsecured straight bonds, due 2019 — 70,000 —
0.1% yen unsecured straight bonds, due 2022 40,000 40,000 365,097
0.2% yen unsecured straight bonds, due 2024 50,000 50,000 456,371
0.3% yen unsecured straight bonds, due 2027 60,000 60,000 547,645
0.1% yen unsecured straight bonds, due 2024 50,000 — 456,371
0.2% yen unsecured straight bonds, due 2026 50,000 — 456,371
0.4% yen unsecured straight bonds, due 2029 100,000 — 912,742
Obligations under finance leases 77,769 28,870 709,830
Total 465,707 311,155 4,250,703
Less current portion (15,783) (95,931) (144,058)
Long-term Debt, Less Current Portion ¥449,924 ¥215,224 $4,106,645
Annual maturities of longterm debt at December 31, 2019, are as follows:
Year ending December 31, Millions of yen Thousands of U.S. dollars
2020 ¥ 15,783 $ 144,058
2021 19,061 173,978
2022 70,909 647,216
2023 9,733 88,837
2024 106,137 968,757
2025 and thereafter 244,084 2,227,857
Total ¥465,707 $4,250,703
NOTES TO CONSOLIDATED FINANCIAL STATEMENTS

ANNUAL REPORT 2019 Financial Review 27
NOTES TO CONSOLIDATED FINANCIAL STATEMENTS
NOTE 7 RETIREMENT AND PENSION PLANSEmployees serving with the Company and its domestic subsidiaries are generally entitled to a lumpsum payment at retirement and, in certain cases, annuity payments at retirement, provided by funded defined benefit pension plans based on the rate of pay at the time of termination, years of service and certain other factors. There are defined contribution pension plans available for the employees as well provided by the Company and certain of its domestic subsidiaries.
Employees serving with certain of the Company’s overseas subsidiaries are entitled to either (1) funded defined benefit pension plans, corporate pension plans, lumpsum payment plans and others, or (2) defined contribution pension plans. There are escalated payment plans for voluntary retirement at certain specific ages prior to the mandatory retirement age.
(1) The changes in defined benefit obligation for the years ended December 31, 2019 and 2018, are as follows:
2019 2018 2019
Millions of yen Thousands of U.S. dollars
Balance at beginning of year ¥727,129 ¥797,016 $6,636,811
Service cost 15,043 15,568 137,304
Interest cost 19,466 18,475 177,674
Actuarial (gains) losses 69,729 (44,199) 636,446
Benefits paid (43,224) (46,309) (394,524)
Effect of foreign exchange translation (4,701) (12,743) (42,908)
Others 455 (679) 4,153
Balance at end of year ¥783,897 ¥727,129 $7,154,956
Service cost includes net periodic benefit costs of certain subsidiaries that have adopted a simplified method.
(2) The changes in plan assets for the years ended December 31, 2019 and 2018, are as follows:
2019 2018 2019
Millions of yen Thousands of U.S. dollars
Balance at beginning of year ¥586,842 ¥656,018 $5,356,353
Expected return on plan assets 27,965 30,835 255,248
Actuarial (losses) gains 66,589 (58,345) 607,786
Contributions from the employer 8,168 9,979 74,553
Benefits paid (38,727) (41,790) (353,477)
Effect of foreign exchange translation (4,454) (10,047) (40,654)
Others 127 192 1,159
Balance at end of year ¥646,510 ¥586,842 $5,900,968
Bridgestone Corporation28
NOTES TO CONSOLIDATED FINANCIAL STATEMENTS
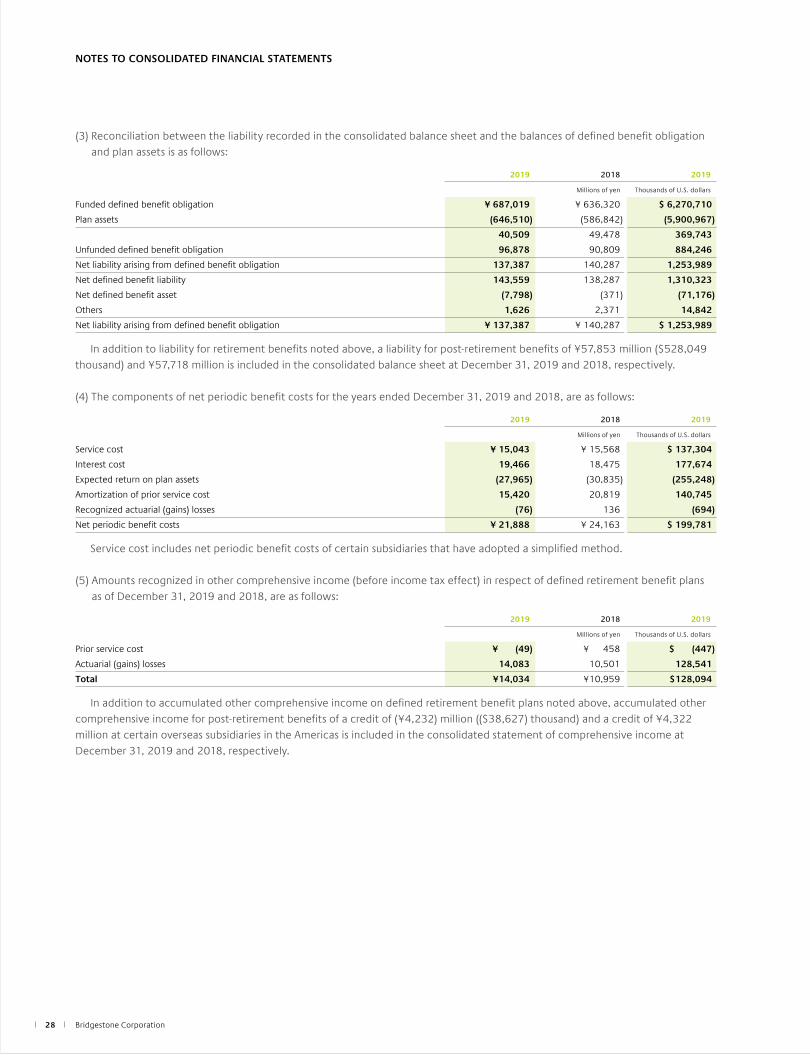
(3) Reconciliation between the liability recorded in the consolidated balance sheet and the balances of defined benefit obligation and plan assets is as follows:
2019 2018 2019
Millions of yen Thousands of U.S. dollars
Funded defined benefit obligation ¥ 687,019 ¥ 636,320 $ 6,270,710
Plan assets (646,510) (586,842) (5,900,967)
40,509 49,478 369,743
Unfunded defined benefit obligation 96,878 90,809 884,246
Net liability arising from defined benefit obligation 137,387 140,287 1,253,989
Net defined benefit liability 143,559 138,287 1,310,323
Net defined benefit asset (7,798) (371) (71,176)
Others 1,626 2,371 14,842
Net liability arising from defined benefit obligation ¥ 137,387 ¥ 140,287 $ 1,253,989
In addition to liability for retirement benefits noted above, a liability for postretirement benefits of ¥57,853 million ($528,049 thousand) and ¥57,718 million is included in the consolidated balance sheet at December 31, 2019 and 2018, respectively.
(4) The components of net periodic benefit costs for the years ended December 31, 2019 and 2018, are as follows:
2019 2018 2019
Millions of yen Thousands of U.S. dollars
Service cost ¥ 15,043 ¥ 15,568 $ 137,304
Interest cost 19,466 18,475 177,674
Expected return on plan assets (27,965) (30,835) (255,248)
Amortization of prior service cost 15,420 20,819 140,745
Recognized actuarial (gains) losses (76) 136 (694)
Net periodic benefit costs ¥ 21,888 ¥ 24,163 $ 199,781
Service cost includes net periodic benefit costs of certain subsidiaries that have adopted a simplified method.
(5) Amounts recognized in other comprehensive income (before income tax effect) in respect of defined retirement benefit plans as of December 31, 2019 and 2018, are as follows:
2019 2018 2019
Millions of yen Thousands of U.S. dollars
Prior service cost ¥ (49) ¥ 458 $ (447)
Actuarial (gains) losses 14,083 10,501 128,541
Total ¥14,034 ¥10,959 $128,094
In addition to accumulated other comprehensive income on defined retirement benefit plans noted above, accumulated other comprehensive income for postretirement benefits of a credit of (¥4,232) million (($38,627) thousand) and a credit of ¥4,322 million at certain overseas subsidiaries in the Americas is included in the consolidated statement of comprehensive income at December 31, 2019 and 2018, respectively.

ANNUAL REPORT 2019 Financial Review 29
NOTES TO CONSOLIDATED FINANCIAL STATEMENTS
(6) Amounts recognized in accumulated other comprehensive income (before income tax effect) in respect of defined retirement benefit plans as of December 31, 2019 and 2018, are as follows:
2019 2018 2019
Millions of yen Thousands of U.S. dollars
Unrecognized prior service cost ¥ (184) ¥ (135) $ (1,679)
Unrecognized actuarial (gains) losses (170,311) (184,393) (1,554,500)
Total ¥(170,495) ¥(184,528) $(1,556,179)
In addition to accumulated other comprehensive income on defined retirement benefit plans noted above, accumulated other comprehensive income for postretirement benefits of a credit of ¥2,806 million ($25,612 thousand) and a credit of ¥7,038 million at certain overseas subsidiaries in the Americas is included in the consolidated balance sheet at December 31, 2019 and 2018, respectively.
(7) Plan assetsa. Components of plan assets
Plan assets consisted of the following:
2019 2018
%
Debt investments 63% 64%
Equity investments 14 13
Cash and cash equivalents 5 4
Others 18 19
Total 100% 100%
b. Method of determining the expected rate of return on plan assets
The expected rate of return on plan assets is determined considering the longterm rates of return which are expected currently and in the future from the various components of the plan assets.
(8) Assumptions used for the years ended December 31, 2019 and 2018, are set forth as follows:
2019 2018
%
The Company and its domestic subsidiaries
Discount rate 0.5% to 0.6% 0.6% to 0.8%
Expected longterm rate of return on plan assets 2.5% 2.5%
Overseas subsidiaries
Discount rate 2.9% to 4.3% 3.7% to 4.4%
Expected longterm rate of return on plan assets 4.3% to 6.0% 4.3% to 6.0%
(9) Defined contribution pension plans
The Company and certain of its domestic and overseas subsidiaries paid costs for defined contribution pension plans of ¥10,750 million ($98,120 thousand) and ¥10,922 million, respectively, for the years ended December 31, 2019 and 2018.

Bridgestone Corporation30
NOTES TO CONSOLIDATED FINANCIAL STATEMENTS
NOTE 8 EQUITYSignificant provisions in the Companies Act of Japan (the “Act”) that affect financial and accounting matters are summarized below:(i) Dividends:The Act allows Japanese companies to pay dividends at any time during the fiscal year in addition to the yearend dividend upon resolution at the shareholders’ meeting. Additionally, for Japanese companies that meet certain criteria including having a Board of Directors, having independent auditors, having an Audit & Supervisory Board, and the term of service of the directors being prescribed as one year rather than the normal twoyear term by its articles of incorporation, the Board of Directors may declare dividends (except for dividends in kind) if the company has prescribed so in its articles of incorporation. The Board of Directors of companies with board committees (including appointment committee, compensation committee and audit committee) can also do so because such companies with board committees already, by nature, meet the above criteria under the Act, even though such companies have an audit committee instead of an Audit & Supervisory Board. The Company is organized as a company with board committees. The Act permits Japanese companies to distribute dividends in kind (noncash assets) to shareholders subject to certain limitations and additional requirements. Semiannual interim dividends may also be paid once a year upon resolution by the Board of Directors if the articles of incorporation of the company so stipulate. The Act continues to provide certain limitations on the amounts available for dividends or the purchase of treasury stock. The limitation is defined as the amount available for distribution to the shareholders, but the amount of equity after dividends must be maintained at no less than ¥3 million.
(ii) Increases/Decreases and Transfer of Common Stock, Reserve and Surplus:
The Act requires that an amount equal to 10% of dividends must be appropriated as a legal reserve (of retained earnings) or as additional paidin capital (of capital surplus) depending on the equity account charged upon the payment of such dividends until the aggregate amount of the legal reserve and additional paidin capital equals 25% of the common stock. Under the Act, the total amount of additional paidin capital and the legal reserve may be reversed without limitation. The Act also provides that common stock, the legal reserve, additional paidin capital, other capital surplus and retained earnings can be transferred among the accounts within equity under certain conditions upon resolution of the shareholders.(iii) Treasury Stock and Treasury Stock Acquisition Rights:The Act also provides for Japanese companies to repurchase/dispose of treasury stock by resolution of the Board of Directors. The amount of treasury stock purchased cannot exceed the amount available for distribution to the shareholders which is determined by a specific formula. Under the Act, stock acquisition rights are presented as a separate component of equity. The Act also provides that companies can purchase both treasury stock acquisition rights and treasury stock. Such treasury stock acquisition rights are presented as a separate component of equity or deducted directly from stock acquisition rights.(iv) Cancellation of Treasury Stock:The Company, as resolved at the Board of Directors meeting held on February 15, 2019, completed the cancellation of Treasury Stock pursuant to Article 178 of the Companies Act on January 21, 2020.(1) Book value of shares cancelled: ¥193,363 million
($1,765 million)(2) Kind of shares cancelled: Common shares of the Company(3) Total number of shares cancelled: 47,838,200 shares of
Treasury Stock of the Company
ANNUAL REPORT 2019 Financial Review 31
NOTES TO CONSOLIDATED FINANCIAL STATEMENTS
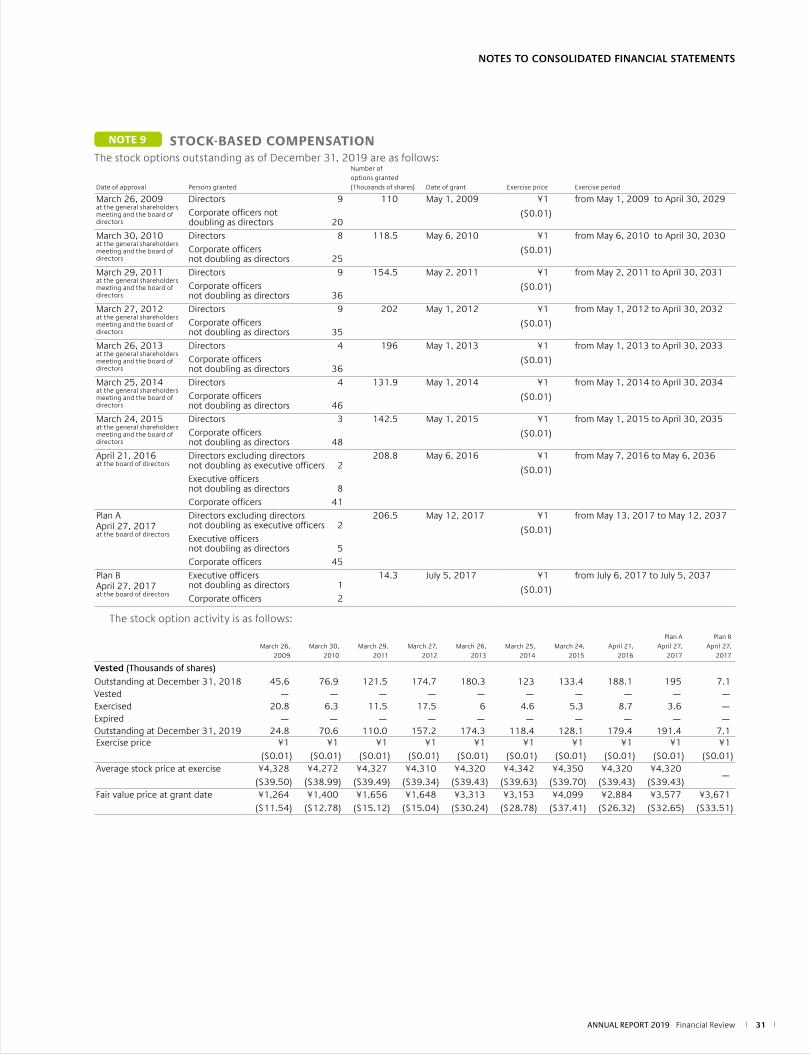
NOTE 9 STOCK-BASED COMPENSATIONThe stock options outstanding as of December 31, 2019 are as follows:
Date of approval Persons granted
Number of options granted (Thousands of shares) Date of grant Exercise price Exercise period
March 26, 2009at the general shareholders meeting and the board of directors
Directors 9Corporate officers not doubling as directors 20
110 May 1, 2009 ¥1
($0.01)
from May 1, 2009 to April 30, 2029
March 30, 2010at the general shareholders meeting and the board of directors
Directors 8Corporate officers not doubling as directors 25
118.5 May 6, 2010 ¥1
($0.01)
from May 6, 2010 to April 30, 2030
March 29, 2011at the general shareholders meeting and the board of directors
Directors 9Corporate officers not doubling as directors 36
154.5 May 2, 2011 ¥1
($0.01)
from May 2, 2011 to April 30, 2031
March 27, 2012at the general shareholders meeting and the board of directors
Directors 9Corporate officers not doubling as directors 35
202 May 1, 2012 ¥1
($0.01)
from May 1, 2012 to April 30, 2032
March 26, 2013at the general shareholders meeting and the board of directors
Directors 4Corporate officers not doubling as directors 36
196 May 1, 2013 ¥1
($0.01)
from May 1, 2013 to April 30, 2033
March 25, 2014at the general shareholders meeting and the board of directors
Directors 4Corporate officers not doubling as directors 46
131.9 May 1, 2014 ¥1
($0.01)
from May 1, 2014 to April 30, 2034
March 24, 2015at the general shareholders meeting and the board of directors
Directors 3Corporate officers not doubling as directors 48
142.5 May 1, 2015 ¥1
($0.01)
from May 1, 2015 to April 30, 2035
April 21, 2016at the board of directors
Directors excluding directors not doubling as executive officers 2Executive officers not doubling as directors 8Corporate officers 41
208.8 May 6, 2016 ¥1
($0.01)
from May 7, 2016 to May 6, 2036
Plan A April 27, 2017at the board of directors
Directors excluding directors not doubling as executive officers 2Executive officers not doubling as directors 5Corporate officers 45
206.5 May 12, 2017 ¥1
($0.01)
from May 13, 2017 to May 12, 2037
Plan B April 27, 2017at the board of directors
Executive officers not doubling as directors 1Corporate officers 2
14.3 July 5, 2017 ¥1
($0.01)
from July 6, 2017 to July 5, 2037
The stock option activity is as follows:
March 26, 2009
March 30, 2010
March 29, 2011
March 27, 2012
March 26, 2013
March 25, 2014
March 24, 2015
April 21, 2016
Plan A April 27,
2017
Plan B April 27,
2017
Vested (Thousands of shares)Outstanding at December 31, 2018 45.6 76.9 121.5 174.7 180.3 123 133.4 188.1 195 7.1Vested — — — — — — — — — —Exercised 20.8 6.3 11.5 17.5 6 4.6 5.3 8.7 3.6 —Expired — — — — — — — — — —Outstanding at December 31, 2019 24.8 70.6 110.0 157.2 174.3 118.4 128.1 179.4 191.4 7.1Exercise price ¥1
($0.01)¥1
($0.01)¥1
($0.01)¥1
($0.01)¥1
($0.01)¥1
($0.01)¥1
($0.01)¥1
($0.01)¥1
($0.01)¥1
($0.01)Average stock price at exercise ¥4,328
($39.50)¥4,272
($38.99)¥4,327
($39.49)¥4,310
($39.34)¥4,320
($39.43)¥4,342
($39.63)¥4,350
($39.70)¥4,320
($39.43)¥4,320
($39.43)—
Fair value price at grant date ¥1,264($11.54)
¥1,400($12.78)
¥1,656($15.12)
¥1,648($15.04)
¥3,313($30.24)
¥3,153($28.78)
¥4,099($37.41)
¥2,884($26.32)
¥3,577($32.65)
¥3,671($33.51)

Bridgestone Corporation32
NOTES TO CONSOLIDATED FINANCIAL STATEMENTS
NOTE 10 NET INCOME PER SHAREReconciliation of the differences between basic and diluted net income per share (“EPS”) for the years ended December 31, 2019 and 2018, is as follows:
Profit attributable to owners of parent Weightedaverage shares EPS
For the year ended December 31, 2019
Millions of yen Thousands of shares Yen U.S. dollars
Basic EPS
Net income available to common shareholders ¥292,598 722,557 ¥404.95 $3.70Effect of dilutive securities
Stock options 1,194Diluted EPS
Net income for computation ¥292,598 723,751 ¥404.28 $3.69
Profit attributable to owners of parent Weightedaverage shares EPS
For the year ended December 31, 2018
Millions of yen Thousands of shares Yen
Basic EPS
Net income available to common shareholders ¥291,642 751,761 ¥387.95Effect of dilutive securities
Stock options 1,299Diluted EPS
Net income for computation ¥291,642 753,060 ¥387.28
NOTE 11 RESEARCH AND DEVELOPMENT COSTSResearch and development costs are charged to income as incurred. Research and development costs are ¥105,283 million ($960,962 thousand) and ¥103,551 million for the years ended December 31, 2019 and 2018, respectively.

ANNUAL REPORT 2019 Financial Review 33
NOTES TO CONSOLIDATED FINANCIAL STATEMENTS
NOTE 12 OTHER INCOME (EXPENSES)Gain on sales of property, plant and equipment
Gain on sales of property, plant and equipment for the years ended December 31, 2019 mainly consists of gain on sales of land.
Gain on refund of PIS/COFINS for prior periods
During the year ended December 31, 2019, Brazil’s Supreme Federal Court decided to revise the method for calculating turnover, the figure on which an entity’s social contribution taxes (PIS/COFINS) are based. In response to this, the Companies’ overseas subsidiary Bridgestone do Brasil Industria e Comercio Ltda. recognized excess tax payments and their equivalent interest as income.
Gain on establishment in jointly controlled entity
BSAM formed TIREHUB, LLC (equitymethod affiliate) with THE GOODYEAR TIRE & RUBBER COMPANY by contribution in kind for operating wholesale distribution in the U.S. in July 2018. Based on U.S. GAAP, the Companies accounted for the gain as the amount of difference between the amount of investment and fair value amount of share acquisition.
Impairment loss
During the year ended December 31, 2019, the Companies grouped their assets for businesses in accordance with the classifications used for internal management. Assets to be disposed (assets that the Companies plan to dispose of through scrapping or sale) and idle assets were grouped on an individual basis. In the current period, for assets for business whose profitability has declined, assets to be disposed through planned scrapping or sale, and idle assets that are not expected to be used in the future, the carrying amounts were reduced to their recoverable amounts. As a result, the Companies recognized an impairment loss of ¥13,665 million. The loss consists of ¥6,099 million for machinery, equipment and vehicles, ¥4,064 million for buildings and structures, ¥1,537 million for land, ¥1,257 million for construction in progress, ¥536 million for other tangible fixed assets, and ¥172 million for other intangible fixed assets.
2018
Use Classification Location AmountMillions of yen
Assets for business Machinery, equipment and vehicles, Buildings and structures, Construction in progress, Tools, furniture and fixtures and others
Japan, Indonesia, China and others¥6,193
Assets to be disposed Machinery, equipment and vehicles, Buildings and structures, Land, Construction in progress and others
U.S. and others 6,556
Idle assets Machinery, equipment and vehicles and others China and others 916
The recoverable amounts of assets for business are principally measured by value in use, which is calculated by discounting future cash flows at a discount rate of 7.5% to 13.3%. The recoverable amounts of assets to be disposed and idle assets are measured at the net selling price. Assets to be scrapped are evaluated at memorandum value, and assets to be sold and idle assets are evaluated at the estimated selling price and other.
Loss related to recall
During the year ended December 31, 2019, the Companies conducted a recall of certain models of standard bicycles and power assist bicycles manufactured by Bridgestone Cycle Corporation, a Bridgestone consolidated subsidiary. The Companies recorded the expenses incurred for the inspections, repairs, etc. of the affected bicycles.

Bridgestone Corporation34
NOTE 13 INCOME TAXESThe Company and its domestic subsidiaries are subject to Japanese national and local income taxes which, in the aggregate, resulted in normal effective statutory tax rates of approximately 30.6% and 30.8% for each of the years ended December 31, 2019 and 2018, respectively.
The tax effects of significant temporary differences and tax loss carryforwards which resulted in deferred tax assets and liabilities at December 31, 2019 and 2018, are as follows:
2019 2018 2019
Millions of yen Thousands of U.S. dollars
Deferred Tax Assets:
Net defined benefit liability ¥ 50,469 ¥ 52,217 $ 460,652
Accrued expenses 31,513 28,899 287,632
Unrealized intercompany profits 21,283 21,680 194,259
Depreciation 17,081 17,321 155,906
Net operating loss carryforwards for tax purposes 42,797 43,235 390,626
Other 42,049 37,639 383,799
Less valuation allowance (51,034) (49,602) (465,809)
Total 154,158 151,389 1,407,065
Deferred Tax Liabilities:
Reserve for deferred gain related fixed assets for tax purposes (12,787) (11,578) (116,712)
Reserve for special account for tax purpose reduction entry of noncurrent assets (4,154) — (37,915)
Unrealized gain on availableforsale securities (18,478) (33,322) (168,657)
Depreciation (58,737) (43,045) (536,117)
Other (17,899) (25,469) (163,372)
Total (112,055) (113,414) (1,022,773)
Net deferred tax assets ¥ 42,103 ¥ 37,975 $ 384,292
A reconciliation between the normal effective statutory tax rates and the actual effective tax rates reflected in the accompanying consolidated statement of income is as follows:
2019
%
Normal effective statutory tax rate 30.6%
Expenses not deductible for income tax purposes and income not taxable—net 1.3
Tax credit for research and development costs of domestic companies (1.2)
Lower income tax rates applicable to income in certain consolidated subsidiaries (2.6)
Other—net (1.5)
Actual Effective Tax Rate 26.6%
For the year ended December 31, 2018, a reconciliation is not disclosed, since the difference is less than 5% of the normal effective statutory tax rate.
NOTES TO CONSOLIDATED FINANCIAL STATEMENTS

ANNUAL REPORT 2019 Financial Review 35
NOTES TO CONSOLIDATED FINANCIAL STATEMENTS
NOTE 14 FINANCIAL INSTRUMENTS1. Qualitative information on financial instruments
(1) Policies for using financial instrumentsThe Companies raise the necessary funds mainly by bank borrowings or issuance of bonds based on funding requirements of their business activities. The Companies invest temporary cash surpluses only in highly secured financial instruments. The Companies follow the policy of using derivative financial instruments not for speculative purposes, but for managing financial risks as described later.(2) Details of financial instruments used and the
exposures to riskReceivables, such as notes and accounts receivable, are exposed to customer credit risk. Receivables in foreign currencies are exposed to foreign currency exchange fluctuation risk. Marketable securities consist primarily of the reservation of receivables liquidation that are exposed to customer credit risk or certificates of deposit regarded as marketable securities in accordance with U.S. GAAP. Investments in securities consist primarily of equity securities of business partners and are exposed to market price fluctuation risk. Payment terms of payables, such as notes and accounts payable are approximately less than one year. Payables in foreign currencies are exposed to foreign currency exchange fluctuation risk. Borrowings, bonds and obligations under finance (capital) leases are mainly for the purpose of obtaining working capital and preparing for capital expenditures. Some of the borrowings and bonds with floating interest rates are exposed to interest rate fluctuation risk. Derivative transactions consist of the use of foreign currency forward contracts and currency option contracts for the purpose of hedging foreign currency exchange fluctuation risk on receivables, payables and forecasted transactions in foreign currencies; currency swap contracts for the purpose of hedging foreign currency exchange fluctuation risk and interest rate fluctuation risk on loans and borrowings in foreign currencies; interest rate swap contracts for the purpose of hedging interest rate fluctuation risk on borrowings; and commodity swap contracts for the purpose of hedging commodity price fluctuation risk. Hedging instruments and hedged items, hedge policy, assessment method for hedge effectiveness and others related to hedge accounting are described in Note 3. (21) “Derivatives and hedging activities” and Note 15 “Derivatives.”
(3) Risk management of financial instrumentsa. Management of credit risk The Companies regularly monitor the financial position of
significant customers and manage the due dates and the receivables balance of each customer to minimize the risk of default resulting from deterioration of customers’ financial position.
The Companies enter into derivative transactions only with highly rated financial institutions in order to minimize counterparty risk.
The maximum credit risk on December 31, 2019 is represented by the book value of the financial instruments exposed to credit risk on the consolidated balance sheet.
b. Management of market risk The Company and certain of its subsidiaries principally use
foreign currency forward contracts to hedge foreign currency exchange fluctuation risk identified by currency and on a monthly basis for receivables and payables in foreign currencies. Also, when receivables and payables in foreign currencies are expected from a forecasted transaction, foreign currency forward contracts and currency option contracts may be used. In addition, currency swap contracts are used to hedge foreign currency exchange fluctuation risk and interest rate fluctuation risk on loans and borrowings in foreign currencies; interest rate swap contracts are used to hedge interest rate fluctuation risk on borrowings; and commodity swap contracts are used to hedge commodity price fluctuation risk.
With respect to marketable and investment securities, the Company regularly monitors fair market values and financial positions of the issuers, with whom it has business relations, and appropriately reviews the status of these securities considering the relationships with the issuers.
Derivative transactions are carried out under internal regulations by the responsible divisions, and details of transactions are reported to the responsible corporate officers.
c. Management of liquidity risk in financing activities The Companies practice money management effectively by
recognizing the fund position beforehand based on cash flow projection. The Companies also strive to diversify sources of financing in order to reduce liquidity risk.

Bridgestone Corporation36
NOTES TO CONSOLIDATED FINANCIAL STATEMENTS
(4) Supplementary explanation on fair value of financial instrumentsFair values of financial instruments include market prices and values calculated reasonably when there is no market price. As variable factors are incorporated in calculating the relevant fair values, such values may change depending on the different assumptions. The contract amounts described in Note 15 “Derivatives” do not indicate the amounts of market risk related to derivative transactions.
2. Fair values of financial instruments
Carrying amount, fair value and unrealized gain (loss) of financial instruments as of December 31, 2019 and 2018, are as follows.Financial instruments whose fair values are not readily determinable are excluded from the following table.
Carrying amount
Fair value
Unrealized gain (loss)
Carrying amount
Fair value
Unrealized gain (loss)
2019
Millions of yen Thousands of U.S. dollars
(1) Cash and cash equivalents ¥ 435,319 ¥ 435,319 ¥ — $ 3,973,339 $ 3,973,339 $ —
(2) Notes and accounts receivable 583,223 5,323,320
Allowance for doubtful accounts*1 (21,378) (195,126)
561,845 561,845 — 5,128,194 5,128,194 —
(3) Marketable and investment securities 224,998 224,998 — 2,053,651 2,053,651 —
Total ¥1,222,162 ¥1,222,162 ¥ — $11,155,184 $11,155,184 $ —
(1) Shortterm debt ¥ 131,753 ¥ 131,753 ¥ — $ 1,202,565 $ 1,202,565 $ —
(2) Current portion of longterm debt 15,783 15,783 — 144,058 144,058 —
(3) Notes and accounts payable 376,435 376,435 — 3,435,880 3,435,880 —
(4) Income taxes payable 40,497 40,497 — 369,633 369,633 —
(5) Longterm debt 449,924 452,744 (2,820) 4,106,645 4,132,384 (25,739)
Total ¥1,014,392 ¥1,017,212 ¥(2,820) $ 9,258,781 $ 9,284,520 $(25,739)
Derivative transactions*2 ¥ (2,082) ¥ (2,082) ¥ — $ (19,003) $ (19,003) $ —
Carrying amount
Fair value
Unrealized gain (loss)
2018
Millions of yen
(1) Cash and cash equivalents ¥ 433,916 ¥ 433,916 ¥ —
(2) Notes and accounts receivable 601,418
Allowance for doubtful accounts*1 (21,730)
579,688 579,688 —
(3) Marketable and investment securities 311,717 311,717 —
Total ¥1,325,321 ¥1,325,321 ¥ —
(1) Shortterm debt ¥97,339 ¥ 97,339 ¥ —
(2) Current portion of longterm debt 95,931 96,036 (105)
(3) Notes and accounts payable 415,139 15,139 —
(4) Income taxes payable 15,073 15,073 —
(5) Longterm debt 215,224 15,735 (511)
Total ¥ 838,706 ¥ 39,322 ¥(616)
Derivative transactions*2 ¥ 4,732 ¥ 4,732 ¥ —
*1 This comprises the allowance for doubtful accounts with respect to notes and accounts receivable, shortterm loan receivable and others.*2 Receivables and payables arising from derivative transactions are presented net. If the net amount is a liability, it is written in parentheses ( ).*3 Prior to January 1, 2019, “Income taxes payable” was not presented separately. Since during this fiscal year ended December 31, 2019, the materiality of the amount
increased, such amount was presented separately. Presentation of fair values of financial instruments for the previous fiscal year have been changed accordingly.
ANNUAL REPORT 2019 Financial Review 37
NOTES TO CONSOLIDATED FINANCIAL STATEMENTS
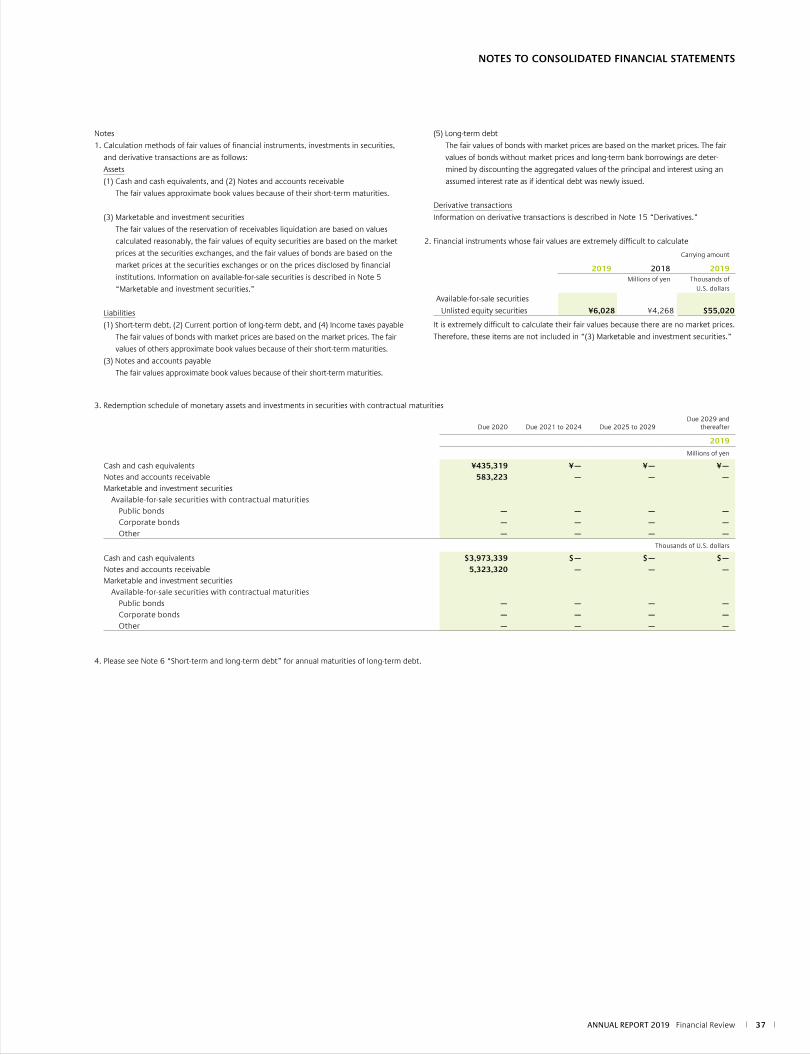
Notes
1. Calculation methods of fair values of financial instruments, investments in securities,
and derivative transactions are as follows:
Assets
(1) Cash and cash equivalents, and (2) Notes and accounts receivable
The fair values approximate book values because of their shortterm maturities.
(3) Marketable and investment securities
The fair values of the reservation of receivables liquidation are based on values
calculated reasonably, the fair values of equity securities are based on the market
prices at the securities exchanges, and the fair values of bonds are based on the
market prices at the securities exchanges or on the prices disclosed by financial
institutions. Information on availableforsale securities is described in Note 5
“Marketable and investment securities.”
Liabilities
(1) Shortterm debt, (2) Current portion of longterm debt, and (4) Income taxes payable
The fair values of bonds with market prices are based on the market prices. The fair
values of others approximate book values because of their shortterm maturities.
(3) Notes and accounts payable
The fair values approximate book values because of their shortterm maturities.
(5) Longterm debt
The fair values of bonds with market prices are based on the market prices. The fair
values of bonds without market prices and longterm bank borrowings are deter
mined by discounting the aggregated values of the principal and interest using an
assumed interest rate as if identical debt was newly issued.
Derivative transactions
Information on derivative transactions is described in Note 15 “Derivatives.”
2. Financial instruments whose fair values are extremely difficult to calculate
Carrying amount
2019 2018 2019Millions of yen Thousands of
U.S. dollars
Availableforsale securities
Unlisted equity securities ¥6,028 ¥4,268 $55,020
It is extremely difficult to calculate their fair values because there are no market prices.
Therefore, these items are not included in “(3) Marketable and investment securities.”
3. Redemption schedule of monetary assets and investments in securities with contractual maturities
Due 2020 Due 2021 to 2024 Due 2025 to 2029Due 2029 and
thereafter
2019
Millions of yen
Cash and cash equivalents ¥435,319 ¥— ¥— ¥—Notes and accounts receivable 583,223 — — —Marketable and investment securities
Availableforsale securities with contractual maturitiesPublic bonds — — — —Corporate bonds — — — —Other — — — —
Thousands of U.S. dollars
Cash and cash equivalents $3,973,339 $— $— $—Notes and accounts receivable 5,323,320 — — —Marketable and investment securities
Availableforsale securities with contractual maturitiesPublic bonds — — — —Corporate bonds — — — —Other — — — —
4. Please see Note 6 “Shortterm and longterm debt” for annual maturities of longterm debt.

Bridgestone Corporation38
NOTES TO CONSOLIDATED FINANCIAL STATEMENTS
The outstanding balances of derivative contracts which do not qualify for hedge accounting at December 31, 2019 and 2018, are as follows:
Contract amount Fair value Unrealized gain (loss)
2019
Millions of yen
Foreign Currency Forward Contracts:
Sell:
U.S. dollar ¥40,062 ¥ (386) ¥ (386)
Euro 23,590 (473) (473)
Hungarian forint 22,113 (115) (115)
Australian dollar 19,131 (679) (679)
Other 16,225 (494) (494)
Buy:
U.S. dollar 28,173 (13) (13)
Australian dollar 4,069 12 12
Canadian dollar 1,841 (34) (34)
Poland zloty 1,220 (24) (24)
Japanese yen 743 (1) (1)
Other 2,661 (7) (7)
Currency Swap Contracts:
Euro receipt, Japanese yen payment ¥83,364 ¥ 744 ¥ 744
Thai baht receipt, U.S. dollar payment 26,219 (1,711) (1,711)
U.S. dollar receipt, Japanese yen payment 26,066 1,887 1,887
Euro receipt, U.S. dollar payment 15,974 829 829
Russian ruble receipt, U.S. dollar payment 11,017 (1,046) (1,046)
Other 2,777 (79) (79)
Commodity Swap Contracts:
Natural rubber ¥ 4,689 ¥ 263 ¥ 263
NOTE 15 DERIVATIVESThe Companies enter into foreign currency forward contracts, currency swap contracts and currency option contracts to hedge foreign currency exchange risk associated with certain assets and liabilities denominated in foreign currencies. The Companies enter into interest rate swap contracts to manage their interest rate exposures on certain liabilities. In addition, the Companies enter into commodity swap contracts to hedge the risk of fluctuation of commodity prices for raw materials. All derivative transactions are entered into to hedge foreign currency, interest and commodity price exposures that arise in the course of the Companies’ business. Accordingly, the market risk in these derivatives is basically offset by opposite
movements in the value of hedged assets or liabilities. Because the counterparties to these derivatives are limited to major international financial institutions, the Companies do not anticipate any losses arising from credit risk. Derivative transactions entered into by the Companies have been made in accordance with internal policies which regulate the authorization and credit limit amounts. The contract or notional amounts of derivatives which are shown in the following table do not represent the amounts exchanged by the parties and do not measure the Companies’ exposure to credit or market risk.

ANNUAL REPORT 2019 Financial Review 39
NOTES TO CONSOLIDATED FINANCIAL STATEMENTS
Contract amount Fair value Unrealized gain (loss)
2018
Millions of yen
Foreign Currency Forward Contracts:
Sell:
U.S. dollar ¥58,056 ¥ 947 ¥ 947
Euro 17,694 384 384
Australian dollar 19,616 619 619
Poland zloty 10,076 (1) (1)
Other 35,191 314 314
Buy:
U.S. dollar 24,127 418 418
Australian dollar 2,038 (12) (12)
Poland zloty 891 (7) (7)
Japanese yen 1,806 (110) (110)
Colombian peso 3,174 306 306
Other 2,574 30 30
Currency Swap Contracts:
Euro receipt, Japanese yen payment ¥13,010 ¥ 220 ¥ 220
Thai baht receipt, U.S. dollar payment 26,876 (484) (484)
U.S. dollar receipt, Japanese yen payment 39,663 1,425 1,425
Euro receipt, U.S. dollar payment 16,257 345 345
Russian ruble receipt, U.S. dollar payment 5,799 201 201
Hungarian forint receipt, Euro payment 25,314 (235) (235)
Chinese yuan receipt, Japanese yen payment 9,727 (59) (59)
South African rand receipt, U.S. dollar payment 9,697 342 342
Other 6,064 (252) (252)
Commodity Swap Contracts:
Natural rubber ¥ 4,455 ¥ (197) ¥ (197)
Contract amount Fair value Unrealized gain (loss)
2019
Thousands of U.S. dollars
Foreign Currency Forward Contracts:
Sell:
U.S. dollar $365,663 $ (3,523) $ (3,523)
Euro 215,316 (4,317) (4,317)
Hungarian forint 201,835 (1,050) (1,050)
Australian dollar 174,617 (6,198) (6,198)
Other 148,092 (4,509) (4,509)
Buy:
U.S. dollar 257,147 (119) (119)
Australian dollar 37,139 110 110
Canadian dollar 16,804 (310) (310)
Poland zloty 11,135 (219) (219)
Japanese yen 6,782 (9) (9)
Other 24,288 (64) (64)
Currency Swap Contracts:
Euro receipt, Japanese yen payment $760,898 $ 6,791 $ 6,791
Thai baht receipt, U.S. dollar payment 239,312 (15,617) (15,617)
U.S. dollar receipt, Japanese yen payment 237,915 17,223 17,223
Euro receipt, U.S. dollar payment 145,801 7,567 7,567
Russian ruble receipt, U.S. dollar payment 100,557 (9,547) (9,547)
Other 25,347 (721) (721)
Commodity Swap Contracts:
Natural rubber $ 42,798 $ 2,401 $ 2,401
Bridgestone Corporation40
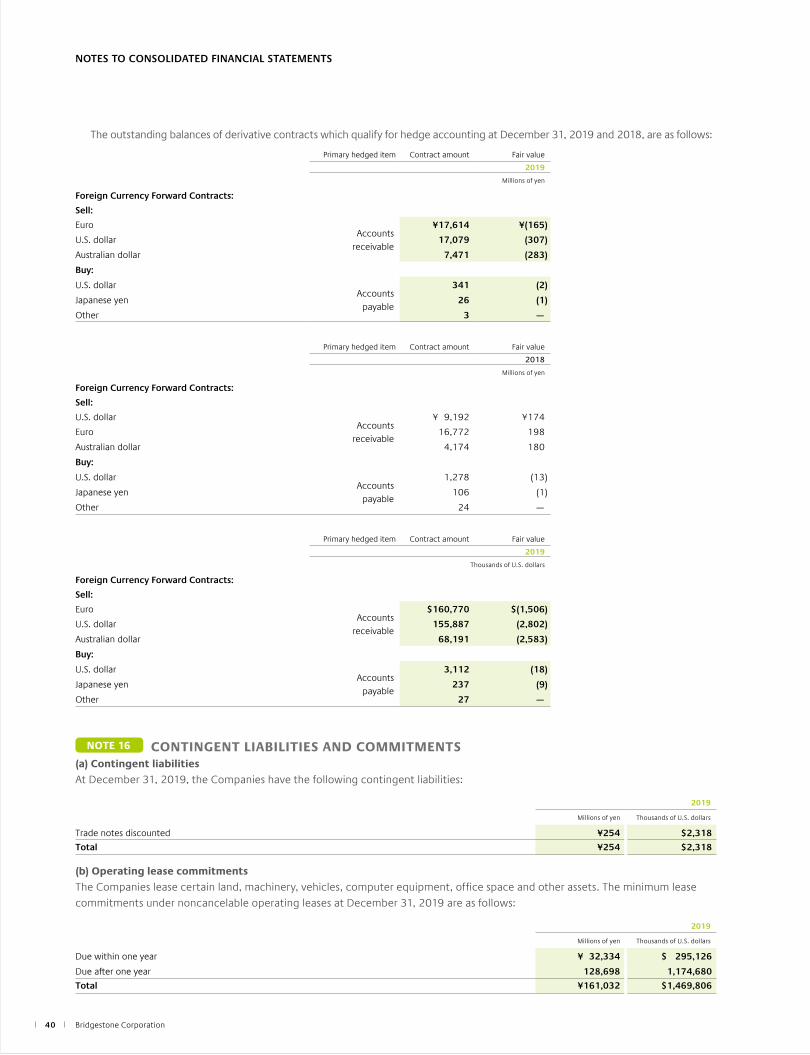
The outstanding balances of derivative contracts which qualify for hedge accounting at December 31, 2019 and 2018, are as follows:
Primary hedged item Contract amount Fair value
2019
Millions of yen
Foreign Currency Forward Contracts:
Sell:
EuroAccounts
receivable
¥17,614 ¥(165)
U.S. dollar 17,079 (307)
Australian dollar 7,471 (283)
Buy:
U.S. dollarAccounts
payable
341 (2)
Japanese yen 26 (1)
Other 3 —
Primary hedged item Contract amount Fair value
2018
Millions of yen
Foreign Currency Forward Contracts:
Sell:
U.S. dollarAccounts
receivable
¥ 9,192 ¥174
Euro 16,772 198
Australian dollar 4,174 180
Buy:
U.S. dollar Accounts
payable
1,278 (13)
Japanese yen 106 (1)
Other 24 —
Primary hedged item Contract amount Fair value
2019
Thousands of U.S. dollars
Foreign Currency Forward Contracts:
Sell:
EuroAccounts
receivable
$160,770 $(1,506)
U.S. dollar 155,887 (2,802)
Australian dollar 68,191 (2,583)
Buy:
U.S. dollarAccounts
payable
3,112 (18)
Japanese yen 237 (9)
Other 27 —
NOTES TO CONSOLIDATED FINANCIAL STATEMENTS
NOTE 16 CONTINGENT LIABILITIES AND COMMITMENTS(a) Contingent liabilities
At December 31, 2019, the Companies have the following contingent liabilities:
2019
Millions of yen Thousands of U.S. dollars
Trade notes discounted ¥254 $2,318
Total ¥254 $2,318
(b) Operating lease commitments
The Companies lease certain land, machinery, vehicles, computer equipment, office space and other assets. The minimum lease commitments under noncancelable operating leases at December 31, 2019 are as follows:
2019
Millions of yen Thousands of U.S. dollars
Due within one year ¥ 32,334 $ 295,126
Due after one year 128,698 1,174,680
Total ¥161,032 $1,469,806

ANNUAL REPORT 2019 Financial Review 41
NOTES TO CONSOLIDATED FINANCIAL STATEMENTS
NOTE 17 SEGMENT INFORMATIONFor the years ended December 31, 2019 and 2018
Under ASBJ Statement No. 17, “Accounting Standard for Segment Information Disclosures” and ASBJ Guidance No. 20, “Guidance on Accounting Standard for Segment Information Disclosures,” an entity is required to report financial and descriptive information about its reportable segments. Reportable segments are operating segments or aggregations of operating segments that meet specified criteria. Operating segments are components of an entity about which separate financial information is available and such information is evaluated regularly by the chief operating decision maker in deciding how to allocate resources and in assessing performance. Generally, segment information is required to be reported on the same basis as is used internally for evaluating operating segment performance and deciding how to allocate resources to operating segments.
1. Description of reportable segments
The Companies’ reportable segments are components of the Companies whose separate financial information is obtainable, and the Board of Directors and the Management Committee regularly consider these segments in order to decide the allocation of business resources and evaluate business performance.
The Companies’ reportable segments consist mainly of the Tire business that comprises the manufacture and sale of tires and tubes, sale of wheels and accessories, the manufacture and sale of retread material and services, auto maintenance, and Diversified products business that comprises Chemical and Industrial Products, BSAM Diversified Products*, sporting goods, bicycles, etc. Thus, the Companies have two reporting segments: Tires and Diversified products.* BSAM Diversified Products: A business under BSAM supplying commercial roofing
materials and others.
2. Methods of measurement for the amounts of sales
and income (loss), assets, and other items for each
reportable segment
The accounting policies for each reportable segment are consistent with those outlined in Note 3 “Summary of significant accounting policies.” Reportable segment income figures are on an operating income basis. Internal sales and transfers between segments are mainly based on prices for thirdparty transactions.
3. Information about sales and income (loss), assets, and other items by reportable segment
Tires Diversified products Total Reconciliations* Consolidated
Year ended December 31, 2019
Millions of yen
Net Sales:
External customers ¥2,944,120 ¥581,480 ¥3,525,600 ¥ — ¥3,525,600Intersegment 8,983 6,822 15,805 (15,805) —Total 2,953,103 588,302 3,541,405 (15,805) 3,525,600Segment income
(Operating income) ¥ 325,876 ¥ 165 ¥ 326,041 ¥ 57 ¥ 326,098Segment assets ¥3,546,260 ¥409,672 ¥3,955,932 ¥ (9,426) ¥3,946,506Other
Depreciation and amortization ¥ 202,045 ¥ 21,056 ¥ 223,101 ¥ — ¥ 223,101Amortization of goodwill 5,386 1,501 6,887 — 6,887Investment for equitymethod affiliates 46,382 423 46,805 34 46,839
Increase in property, plant and equipment and intangible assets 385,642 28,254 413,896 — 413,896
Bridgestone Corporation42
NOTES TO CONSOLIDATED FINANCIAL STATEMENTS
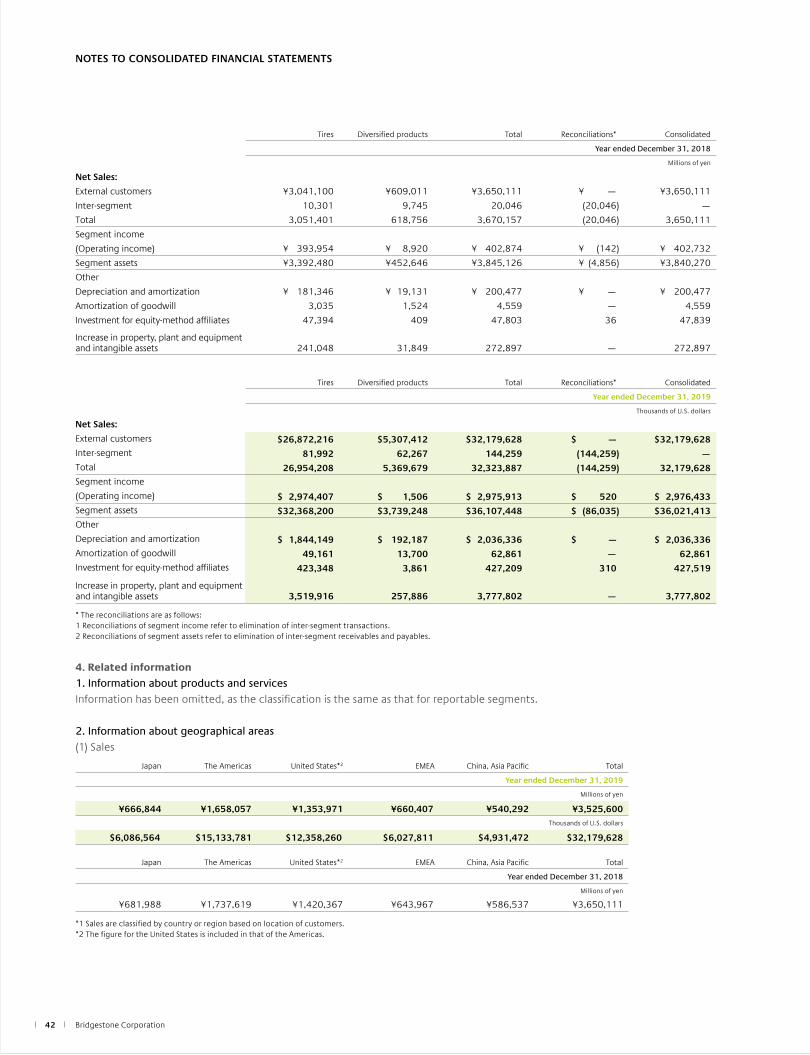
Tires Diversified products Total Reconciliations* Consolidated
Year ended December 31, 2018
Millions of yen
Net Sales:
External customers ¥3,041,100 ¥609,011 ¥3,650,111 ¥ — ¥3,650,111
Intersegment 10,301 9,745 20,046 (20,046) —
Total 3,051,401 618,756 3,670,157 (20,046) 3,650,111
Segment income
(Operating income) ¥ 393,954 ¥ 8,920 ¥ 402,874 ¥ (142) ¥ 402,732
Segment assets ¥3,392,480 ¥452,646 ¥3,845,126 ¥ (4,856) ¥3,840,270
Other
Depreciation and amortization ¥ 181,346 ¥ 19,131 ¥ 200,477 ¥ — ¥ 200,477
Amortization of goodwill 3,035 1,524 4,559 — 4,559
Investment for equitymethod affiliates 47,394 409 47,803 36 47,839
Increase in property, plant and equipment and intangible assets 241,048 31,849 272,897 — 272,897
Tires Diversified products Total Reconciliations* Consolidated
Year ended December 31, 2019
Thousands of U.S. dollars
Net Sales:
External customers $26,872,216 $5,307,412 $32,179,628 $ — $32,179,628Intersegment 81,992 62,267 144,259 (144,259) —Total 26,954,208 5,369,679 32,323,887 (144,259) 32,179,628Segment income
(Operating income) $ 2,974,407 $ 1,506 $ 2,975,913 $ 520 $ 2,976,433Segment assets $32,368,200 $3,739,248 $36,107,448 $ (86,035) $36,021,413Other
Depreciation and amortization $ 1,844,149 $ 192,187 $ 2,036,336 $ — $ 2,036,336Amortization of goodwill 49,161 13,700 62,861 — 62,861Investment for equitymethod affiliates 423,348 3,861 427,209 310 427,519
Increase in property, plant and equipment and intangible assets 3,519,916 257,886 3,777,802 — 3,777,802
* The reconciliations are as follows:1 Reconciliations of segment income refer to elimination of intersegment transactions.2 Reconciliations of segment assets refer to elimination of intersegment receivables and payables.
4. Related information
1. Information about products and servicesInformation has been omitted, as the classification is the same as that for reportable segments.
2. Information about geographical areas(1) Sales
Japan The Americas United States*2 EMEA China, Asia Pacific Total
Year ended December 31, 2019
Millions of yen
¥666,844 ¥1,658,057 ¥1,353,971 ¥660,407 ¥540,292 ¥3,525,600Thousands of U.S. dollars
$6,086,564 $15,133,781 $12,358,260 $6,027,811 $4,931,472 $32,179,628
Japan The Americas United States*2 EMEA China, Asia Pacific Total
Year ended December 31, 2018
Millions of yen
¥681,988 ¥1,737,619 ¥1,420,367 ¥643,967 ¥586,537 ¥3,650,111
*1 Sales are classified by country or region based on location of customers.*2 The figure for the United States is included in that of the Americas.

ANNUAL REPORT 2019 Financial Review 43
NOTES TO CONSOLIDATED FINANCIAL STATEMENTS
(2) Property, plant and equipment
Japan The Americas United States*1 EMEA China, Asia Pacific Total
Year ended December 31, 2019
Millions of yen
¥357,613 ¥602,700 ¥462,001 ¥228,440 ¥373,407 ¥1,562,160Thousands of U.S. dollars
$3,264,084 $5,501,095 $4,216,877 $2,085,067 $3,408,242 $14,258,488
Japan The Americas United States*1 EMEA China, Asia Pacific Total
Year ended December 31, 2018
Millions of yen
¥352,595 ¥578,631 ¥448,261 ¥184,346 ¥352,799 ¥1,468,371
*1 The figure for the United States is included in that of the Americas.
3. Information about major customersThe Companies are not required to disclose information on external customers since there are no sales to a single external customer amounting to 10% or more of the Companies’ net sales.
5. Information about impairment loss of property, plant and equipment
Tires Diversified products Reconciliations Consolidated
Year ended December 31, 2019
Millions of yen
Impairment loss of assets ¥ 8,493 ¥ 5,172 ¥— ¥ 13,665Thousands of U.S. dollars
Impairment loss of assets $77,519 $47,207 $— $124,726
6. Information about amortization of goodwill and unamortized balance
Tires Diversified products Reconciliations Consolidated
Year ended December 31, 2019
Millions of yen
Amortization ¥ 5,386 ¥ 1,501 ¥— ¥ 6,887
Unamortized balance 67,751 23,660 — 91,411Thousands of U.S. dollars
Amortization $ 49,161 $ 13,700 $— $ 62,861
Unamortized balance 618,392 215,955 — 834,347
Tires Diversified products Reconciliations Consolidated
Year ended December 31, 2018
Millions of yen
Amortization ¥ 3,035 ¥ 1,524 ¥— ¥ 4,559
Unamortized balance 15,884 25,498 — 41,382
NOTE 18 SUBSEQUENT EVENTS1. Cash dividend
On March 24, 2020, the shareholders of the Company approved payment of a cash dividend of ¥80.0 ($0.73) per share, or a total of ¥56,324 million ($514,093 thousand), to shareholders of record as of December 31, 2019.
2. Large-amount borrowing
To meet Group demand for working capital stemming from the impact of COVID19, the Company has made the following borrowing.(1) Lenders Bank of MUFG Bank, Ltd., Sumitomo Mitsui Banking Corporation, Mizuho Bank, Ltd.(2) Borrowing amount ¥200,000 million (total of the new borrowing from the above 3 banks)(3) Borrowing rate Fixed rate(4) Repayment terms Lumpsum repayment by repayment date(5) Borrowing date April 20–28, 2020(6) Repayment deadline April 20–28, 2021
Bridgestone Corporation44
NOTES TO CONSOLIDATED FINANCIAL STATEMENTS
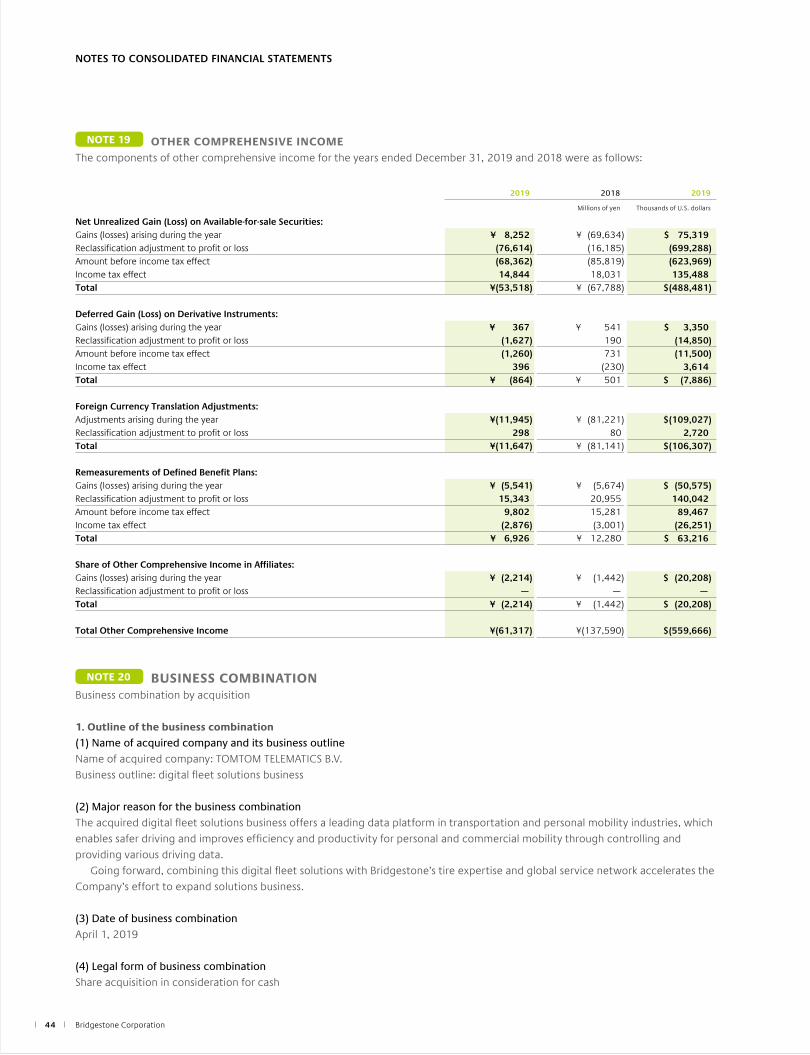
NOTE 20 BUSINESS COMBINATIONBusiness combination by acquisition
1. Outline of the business combination
(1) Name of acquired company and its business outlineName of acquired company: TOMTOM TELEMATICS B.V.Business outline: digital fleet solutions business
(2) Major reason for the business combinationThe acquired digital fleet solutions business offers a leading data platform in transportation and personal mobility industries, which enables safer driving and improves efficiency and productivity for personal and commercial mobility through controlling and providing various driving data. Going forward, combining this digital fleet solutions with Bridgestone’s tire expertise and global service network accelerates the Company’s effort to expand solutions business.
(3) Date of business combinationApril 1, 2019
(4) Legal form of business combinationShare acquisition in consideration for cash
NOTE 19 OTHER COMPREHENSIVE INCOMEThe components of other comprehensive income for the years ended December 31, 2019 and 2018 were as follows:
2019 2018 2019
Millions of yen Thousands of U.S. dollars
Net Unrealized Gain (Loss) on Available-for-sale Securities:Gains (losses) arising during the year ¥ 8,252 ¥ (69,634) $ 75,319Reclassification adjustment to profit or loss (76,614) (16,185) (699,288)Amount before income tax effect (68,362) (85,819) (623,969)Income tax effect 14,844 18,031 135,488Total ¥(53,518) ¥ (67,788) $(488,481)
Deferred Gain (Loss) on Derivative Instruments:Gains (losses) arising during the year ¥ 367 ¥ 541 $ 3,350Reclassification adjustment to profit or loss (1,627) 190 (14,850)Amount before income tax effect (1,260) 731 (11,500)Income tax effect 396 (230) 3,614Total ¥ (864) ¥ 501 $ (7,886)
Foreign Currency Translation Adjustments:Adjustments arising during the year ¥(11,945) ¥ (81,221) $(109,027)Reclassification adjustment to profit or loss 298 80 2,720Total ¥(11,647) ¥ (81,141) $(106,307)
Remeasurements of Defined Benefit Plans:Gains (losses) arising during the year ¥ (5,541) ¥ (5,674) $ (50,575)Reclassification adjustment to profit or loss 15,343 20,955 140,042Amount before income tax effect 9,802 15,281 89,467Income tax effect (2,876) (3,001) (26,251)Total ¥ 6,926 ¥ 12,280 $ 63,216
Share of Other Comprehensive Income in Affiliates:Gains (losses) arising during the year ¥ (2,214) ¥ (1,442) $ (20,208)Reclassification adjustment to profit or loss — — —Total ¥ (2,214) ¥ (1,442) $ (20,208)
Total Other Comprehensive Income ¥(61,317) ¥(137,590) $(559,666)

ANNUAL REPORT 2019 Financial Review 45
NOTES TO CONSOLIDATED FINANCIAL STATEMENTS
(5) Name of the company after the combination WEBFLEET SOLUTIONS B.V.
(6) Ratio of voting rights acquired100%
(7) Basis for determining of the acquirerThe Company’s subsidiary, BRIDGESTONE EUROPE NV/SA acquired shares for a cash consideration.
2. The period for which the operations of the acquired company are included in the consolidated financial statements
From April 1, 2019 to December 31, 2019
3. Acquisition cost of the acquired company and related details of each class of consideration
Consideration for acquisition (Cash): ¥113,575 million ($1,036,647 thousand)Total acquisition cost: ¥113,575 million ($1,036,647 thousand)
4. Major acquisition-related costs
Advisory cost and others: ¥1,620 million ($14,786 thousand)
5. Amount of goodwill incurred, reasons for the goodwill incurred, and the method and period of amortization
(1) Amount of goodwill incurred¥56,078 million ($511,847 thousand)
(2) Reason for the goodwill incurredExpected synergies arising from the acquisition
(3) Method and period of amortization Amortized on a straightline basis up to 20 years
6. The assets acquired and the liabilities assumed at the acquisition date
Millions of yen Thousands of U.S. dollars
Current assets ¥ 7,368 $ 67,251
Noncurrent assets 68,628 626,396
Total assets ¥75,996 $693,647
Current liabilities ¥ 3,510 $ 32,037
Long term liabilities 14,990 136,820
Total liabilities ¥18,500 $168,857
7. Amount allocated as intangible assets other than goodwill, the classification and the weighted average amortization
periods
ClassificationAmount
(Millions of yen)Amount
(Thousands of U.S. dollars)
The weighted average amortization periods
(years)
Customer relationships ¥41,105 $375,183 15
Technologies 22,421 204,646 9
Trademarks 3,338 30,467 9
8. Estimate of amount of impact on consolidated statements of income for the fiscal year ended December 31, 2019, if this
business combination had been completed as of January 1, 2019, the beginning of the current fiscal year and calculation
method thereof
The information is omitted because the impact on the consolidated statements of income for the fiscal year is insignificant