notes to consolidated financial statements currency financial statements the balance sheet accounts...
TRANSCRIPT

Notes to Consolidated Financial Statements Unicharm Corporation and Subsidiaries Years Ended March 31, 2013 and 2012 1. BASIS OF PRESENTING CONSOLIDATED FINANCIAL STATEMENTS
The accompanying consolidated financial statements have been prepared in accordance with the provisions set forth in the Japanese Financial Instruments and Exchange Act and its related accounting regulations and in conformity with accounting principles generally accepted in Japan (“Japanese GAAP”), which are different in certain respects as to application and disclosure requirements of International Financial Reporting Standards. In preparing these consolidated financial statements, certain reclassifications have been made to the consolidated financial statements issued domestically in order to present them in a form that is more familiar to readers outside Japan. In addition, certain reclassifications have been made in the 2012
consolidated financial statements to conform to the classifications used in 2013.
The consolidated financial statements are expressed in
Japanese yen, the currency of the country in which Unicharm Corporation (the “Company”) is incorporated and operates. The translations of Japanese yen amounts into U.S. dollar amounts are included solely for the convenience of readers outside Japan and have been made at the rate of ¥94 to $1, the approximate rate of exchange at March 29, 2013. Such translations should not be construed as representation that the Japanese yen amounts could be converted into U.S. dollars at that or any other rate.
2. SUMMARY OF SIGNIFICANT ACCOUNTING POLICIES a. Consolidation
The consolidated financial statements include the accounts of the Company and its 43 (40 in 2012) subsidiaries (together, the “Group”). A subsidiary is excluded from the scope of consolidation for the year ended March 31, 2013 as mentioned below.
Under the control or influence concept, those companies in
which the Company, directly or indirectly, is able to exercise control over operations are fully consolidated, and those companies over which the Group has the ability to exercise significant influence are accounted for by the equity method.
The changes to the consolidation scope at March 31, 2013,
compared with the scope applicable at March 31, 2012 are as follows:
Unicharm Nonwoven (Tianjin) Co., Ltd., Unicharm Packaging Material (Tianjin) Co., Ltd. and Unicharm Consumer Products (Jiangsu) Co., Ltd. were newly incorporated and included in the consolidation scope at March 31, 2013.
Hartz-B2E LLC is excluded from the scope of consolidation,
because it is a small sized company and the effect on the accompanying consolidated financial statements would not be material in terms of total assets, net sales, or net income and retained earnings corresponding to the Company’s share of the Company.
Investment in two affiliates is accounted for by the equity
method. The reporting period of other consolidated subsidiaries and
equity method affiliates is the same as the Company’s reporting period. However, twenty-two overseas subsidiaries and one domestic subsidiary close accounts on December 31 and one affiliate accounted for by the equity method close accounts on September 30. In the consolidated financial statements, therefore, the Company uses the financial statements of these subsidiaries as of December 31, and adjusts for material transactions that occurred during the three month period
between December 31 and March 31. For UBS Corporation, which is an affiliate accounted for by the equity method, pro forma financial statements as of March 31 are used.
The difference between the cost of the Company’s investments in subsidiaries and affiliates accounted for by the equity method and its equity in the net assets at the respective dates of acquisition, goodwill or negative goodwill, is amortized over the effective investment period, calculated on an individual basis, using the straight-line method up to a maximum of 20 years.
All significant intercompany balances and transactions have been eliminated in consolidation. All material unrealized profit included in assets resulting from transactions within the Group is eliminated.
All assets and liabilities of the consolidated subsidiaries are measured at fair value as of the acquisition date. b. Cash Equivalents
Cash equivalents are short-term investments that are readily convertible into cash and that are exposed to insignificant risk of changes in value.
Cash equivalents include time deposits, certificates of deposit, commercial papers and bond funds, all of which mature or become due within three months of the date of acquisition. c. Inventories
Inventories held for sale in the ordinary course of business are measured at the lower of cost determined mainly by the average method, or net selling value, which is defined as the selling price less additionally estimated manufacturing costs and estimated direct selling expenses. The replacement cost may be used in place of the net selling value, if appropriate. d. Allowance for Doubtful Accounts
The allowance for doubtful accounts is determined based on the historical experiences of the Company and its subsidiaries as well as our best estimate of the amount of probable credit losses in the outstanding receivables.
31
e. Marketable and Investment Securities
Marketable and investment securities are classified and accounted for, depending on management’s intent, as follows: (1) held-to-maturity debt securities, which are expected to be held to maturity with the positive intent and ability to hold to maturity, are reported at amortized cost, and (2) available-for-sale securities, which are not classified as the aforementioned securities, are reported at fair value, with unrealized gains and losses, net of applicable taxes, reported in a separate component of net assets.
Non-marketable available-for-sale securities are stated at cost determined by the moving-average method.
For other than temporary declines in fair value, investment securities are adjusted to net realizable value through income. f. Property, Plant and Equipment
Property, plant and equipment are stated at cost. Depreciation of property, plant and equipment of the Company and its domestic subsidiaries is computed by the straight-line at rates based on the estimated useful lives of the assets.
The range of useful lives is principally from 2 to 60 years for buildings and structures and from 2 to 40 years for machinery and equipment.
Capitalized lease assets are depreciated over their respective contract periods using the straight-line method assuming no residual value. g. Software
Software is carried at cost less accumulated amortization, which is calculated using the straight-line method. The useful lives are principally 5 years. h. Long-lived Assets
The Group reviews its long-lived assets for impairment whenever events or changes in circumstance indicate the carrying amount of an asset or asset group may not be recoverable. An impairment loss would be recognized if the carrying amount of an asset or asset group exceeds the sum of the undiscounted future cash flows expected to result from the continued use and eventual disposition of the asset or asset group. The impairment loss would be measured as the amount by which the carrying amount of the asset exceeds its recoverable amount, which is the higher of the discounted cash flows from the continued use and eventual disposition of the asset or the net selling price at disposition. i. Retirement and Pension Plans
The Company and certain consolidated subsidiaries have contributory funded defined benefit pension plans and unfunded retirement benefit plans for employees. Certain overseas consolidated subsidiaries have defined contribution pension plans.
The Company and certain consolidated subsidiaries account for the provision for retirement benefits based on projected benefit obligations and plan assets at the balance sheet date. j. Research and Development Costs
Research and development costs are charged to income as incurred. k. Leases
All finance leases are capitalized and related lease assets and lease obligations are recognized in the balance sheets.
l. Income Taxes
The provision for income taxes is computed based on the pretax income included in the consolidated statements of income. The asset and liability approach is used to recognize deferred tax assets and liabilities for the expected future tax consequences of temporary differences between the carrying amounts and the tax bases of assets and liabilities. Deferred taxes are measured by applying currently enacted tax laws to the temporary differences. m. Foreign Currency Transactions
All short-term and long-term monetary receivables and payables denominated in foreign currencies are translated into Japanese yen at the exchange rates at the balance sheet date. The foreign exchange gains and losses from translation are recognized in the consolidated income statement to the extent that they are not hedged by forward exchange contracts.
n. Foreign Currency Financial Statements
The balance sheet accounts of the consolidated foreign subsidiaries are translated into Japanese yen at the exchange rates in effect as of the balance sheet date except for equity, which is translated at the historical rate.
Differences arising from such translation were presented as "Foreign currency translation adjustments" in a separate component of net assets.
Revenue and expense accounts of consolidated foreign subsidiaries are translated into yen at the average exchange rates prevailing during the year. o. Derivatives and Hedging Activities
The Group uses derivative financial instruments to manage its exposure to fluctuations in foreign exchange. Foreign exchange forward contracts and currency options are utilized by the Group to reduce foreign currency exchange risks. The Group does not enter into derivatives for trading or speculative purposes.
Derivative financial instruments and foreign currency transactions are classified and accounted for as follows: (a) all derivatives are recognized as either assets or liabilities and measured at fair value, and gains or losses on derivative transactions are recognized in the consolidated statements of income and (b) for derivatives used for hedging purposes, if derivatives qualify for hedge accounting because of high correlation and effectiveness between the hedging instruments and the hedged items, gains or losses on derivatives are deferred until maturity of the hedged transactions.
The foreign currency forward contracts and currency options are utilized to hedge foreign currency exposures in procurement of raw materials from import purchases. Trade payables denominated in foreign currencies are translated at the contracted rates if the forward contracts qualify for hedge accounting. Forward contracts applied for forecasted transactions are measured at fair value, and the unrealized gains/losses are deferred until the underlying transactions are completed.
32

p. Per Share Information Basic net income per share is computed by dividing net
income available to common shareholders by the weighted-average number of common shares outstanding for the period, retroactively adjusted for stock splits.
The weighted-average number of common shares used in the computation was 184,479,315 shares for 2013, and 186,144,881 shares for 2012.
Diluted net income per share reflects the potential dilution that could occur if securities were exercised or converted into common stock (including subsidiaries’ common stock). Diluted net income per share of common stock assumes full conversion of the outstanding convertible notes and bonds at the beginning of the year (or at the time of issuance) with an applicable adjustment for related interest expense, net of tax, and full exercise of outstanding warrants.
Cash dividends per share presented in the accompanying consolidated statements of income are dividends applicable to the respective years including dividends to be paid after the end of the year. q. Provision for Bonuses
Provision for bonuses is stated at the estimated amount of the bonuses to be paid to employees based on their services provided for the fiscal year.
r. New Accounting Standard Not Yet Adopted
Accounting Standard for Retirement Benefits On May 17, 2012, the ASBJ issued ASBJ Statement No. 26, “Accounting Standard for Retirement Benefits” and ASBJ Guidance No. 25, “Guidance on Accounting Standard for Retirement Benefits,” which replaced the Accounting Standard for Retirement Benefits that had been issued by the Business Accounting Council in 1998 with an effective date of April 1, 2000, and the other related practical guidance, which was amended from time to time through 2009. To meet the objectives of improving on the quality of existing financial reporting disclosures and maintaining consistency with international convergence trends, those revisions are focused on 1) the accounting treatment of actuarial gains and losses and prior service costs, 2) the calculation method for the projected retirement obligation and service costs; and 3) improvement of the related disclosure. The Company will apply the revised accounting standard from the end of the fiscal year 2014, except for the revision of the calculation method for retirement benefit obligations and service costs which will be adopted from the beginning of the fiscal year 2015. The Company is currently in the process of measuring the effects of applying the revised accounting standard.
33

3. MARKETABLE AND INVESTMENT SECURITIES
Marketable and investment securities at March 31, 2013 and 2012 consisted of the following:
Millions of yen Thousands of
U.S. dollars 2013 2012 2013 Current: Government and corporate bonds ¥- ¥900 $- Negotiable certificates of deposit - 2,500 - Non-current: Marketable equity securities ¥16,813 ¥11,487 $178,859 Government and corporate bonds 2,452 2,428 26,083 Trust fund investments and other 230 228 2,446 Total ¥19,494 ¥14,143 $207,380 The carrying amounts and aggregate fair values of marketable and investment securities at March 31, 2013 and 2012 were as follows: Millions of yen
March 31, 2013 Cost Unrealized
gains Unrealized
losses Fair
value Securities classified as: Available-for-sale: Equity securities ¥4,383 ¥11,294 ¥54 ¥15,623 Debt securities and other 12,212 191 - 12,403 Held-to-maturity 2,452 34 30 2,455
Total ¥19,046 ¥11,519 ¥84 ¥30,481 Millions of yen
March 31, 2012 Cost Unrealized
gains Unrealized
losses Fair
value Securities classified as: Available-for-sale: Equity securities ¥4,401 ¥6,124 ¥53 ¥10,472 Debt securities and other 20,008 16 - 20,024 Held-to-maturity 3,327 - 183 3,144
Total ¥27,736 ¥6,140 ¥236 ¥33,640 Thousands of U.S. dollars
March 31, 2013 Cost Unrealized
gains Unrealized
losses Fair
value Securities classified as: Available-for-sale: Equity securities $46,622 $120,153 $573 $166,202 Debt securities and other 129,918 2,023 - 131,941 Held-to-maturity 26,074 362 317 26,119
Total $202,614 $122,538 $890 $324,262
34

Available-for-sale securities and held-to-maturity securities whose fair value is not readily determinable as of March 31, 2013 and 2012 were as follows: Carrying Amount
Millions of yen
Thousands of U.S. dollars
2013 2012 2013 Available-for-sale: Equity securities ¥401 ¥385 $4,267 Held-to-maturity (Commercial paper) - 400 - Total ¥401 ¥785 $4,267
Proceeds from sales of available-for-sale securities for the years ended March 31, 2013 and 2012 were ¥30 million ($316 thousand) and ¥38 million, respectively. Gross realized gains and losses on these sales, as determined by the moving-average cost, were ¥6 million ($64 thousand) and ¥8 million ($90
thousand) respectively for the year ended March 31, 2013. Gross realized gains and losses on these sales, as determined the moving average cost, were ¥9 million and ¥0 million, respectively, for the year ended March 31, 2012.
The carrying amounts of debt securities by contractual maturities for securities classified as available-for-sale and held-to-maturity at March 31, 2013 and 2012 were as follows:
Millions of yen Thousands of
U.S. dollars
March 31, 2013 Available-
for-sale Held-to maturity
Available- for-sale
Held-to maturity
Due in one year or less ¥- ¥- $- $- Due after one year through five years - 452 - 4,807 Due after five years through ten years - 1,000 - 10,638 Due after ten years - 1,000 - 10,638 Total ¥- ¥2,452 $- $26,083 Millions of yen
March 31, 2012 Available-
for-sale Held-to maturity
Due in one year or less ¥- ¥900 Due after one year through five years - - Due after five years through ten years - 1,427 Due after ten years - 1,000 Total ¥- ¥3,327 4. INVENTORIES
Inventories at March 31, 2013 and 2012 consisted of the following:
Millions of yen Thousands of
U.S. dollars 2013 2012 2013 Merchandise and finished products ¥26,255 ¥18,068 $279,306 Work in process 862 682 9,167 Raw materials and supplies 17,669 14,911 187,969 Total ¥44,786 ¥33,661 $476,442
35
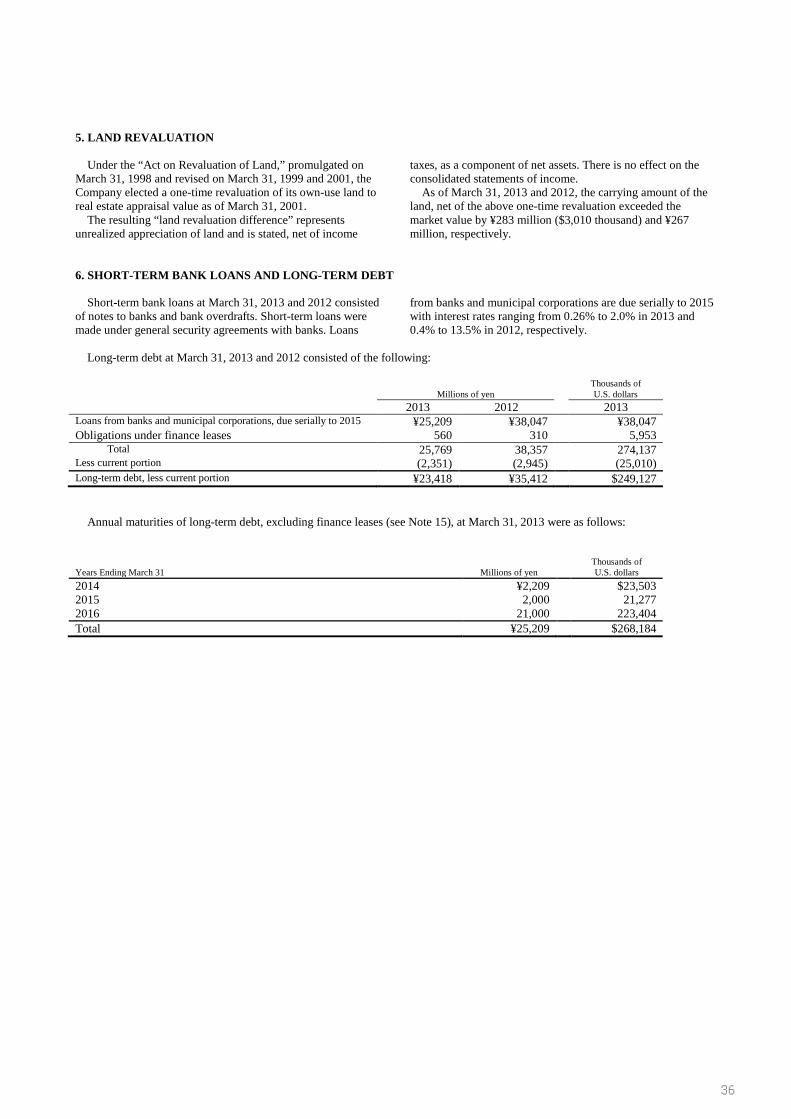
5. LAND REVALUATION
Under the “Act on Revaluation of Land,” promulgated on March 31, 1998 and revised on March 31, 1999 and 2001, the Company elected a one-time revaluation of its own-use land to real estate appraisal value as of March 31, 2001.
The resulting “land revaluation difference” represents unrealized appreciation of land and is stated, net of income
taxes, as a component of net assets. There is no effect on the consolidated statements of income.
As of March 31, 2013 and 2012, the carrying amount of the land, net of the above one-time revaluation exceeded the market value by ¥283 million ($3,010 thousand) and ¥267 million, respectively.
6. SHORT-TERM BANK LOANS AND LONG-TERM DEBT
Short-term bank loans at March 31, 2013 and 2012 consisted of notes to banks and bank overdrafts. Short-term loans were made under general security agreements with banks. Loans
from banks and municipal corporations are due serially to 2015 with interest rates ranging from 0.26% to 2.0% in 2013 and 0.4% to 13.5% in 2012, respectively.
Long-term debt at March 31, 2013 and 2012 consisted of the following:
Millions of yen Thousands of
U.S. dollars 2013 2012 2013 Loans from banks and municipal corporations, due serially to 2015 ¥25,209 ¥38,047 ¥38,047 Obligations under finance leases 560 310 5,953
Total 25,769 38,357 274,137 Less current portion (2,351) (2,945) (25,010) Long-term debt, less current portion ¥23,418 ¥35,412 $249,127
Annual maturities of long-term debt, excluding finance leases (see Note 15), at March 31, 2013 were as follows:
Years Ending March 31 Millions of yen Thousands of
U.S. dollars 2014 ¥2,209 $23,503 2015 2,000 21,277 2016 21,000 223,404 Total ¥25,209 $268,184
36

7. CONVERTIBLE BONDS
The Company has issued the bonds as follows:
Millions of yen Thousands of
U.S. dollars Issuance
date Interest rate Security Maturity
date 2013 2012 2013
Convertible bonds due in 2013
September 24, 2010
- Unsecured September 10, 2013
¥16,233 ¥34,585 $172,692
Convertible bonds due in 2015
September 24, 2010
- Unsecured September 10, 2015
37,100 46,000 394,681
Total - - - ¥53,333 ¥80,585 $567,373 (Note 1) The details of convertible bonds issued are as follows: Bonds and notes Convertible bonds due in 2013 Convertible bonds due in 2015 Type of stock Common stock Common stock Issue price of acquisition rights
No cost No cost
Issue price of stock ¥3,883.3 ¥3,883.3 Number of stocks subject to acquisition rights
8,884,196 11,845,595
Total amount of issue ¥34,672,500,000 ¥46,000,000,000 Total amount of stock acquisition rights exercised
-
-
Percentage of stock acquisition right granted
100.0
100.0
Exercisable period October 8, 2010 – September 10, 2013
(at local time where the request for exercise will be received)
October 8, 2010 – September 10, 2015
(at local time where the request for exercise will be received)
* Exercise of a stock acquisition right causes the corresponding bond to be cancelled in lieu of a cash payment of purchase of shares, and the amount of the convertible bonds with stock acquisition rights is the same as the amount of issuance.
During the fiscal year ended March 31, 2013, stock acquisition rights were executed and the related convertible bonds were converted to common stock without any cash settlement. As a result, the convertible bond balance decreased by ¥27,196 million ($289,323 thousand), consisting of ¥17,928 million ($190,731 thousand) of disposal of treasury stock and ¥9,267 million ($98,592 thousand) of gain on disposal of treasury stock, which was recorded as capital surplus. (Note 2) Repayment schedule of convertible bond:
Millions of yen
March 31, 2013
Due in one year or less
Due after one year through two years
Due after two years through three years
Due after three years through four years
Due after four years through five years
¥16,233 - ¥37,100 - -
Thousands of U.S. dollars
March 31, 2013
Due in one year or less
Due after one year through two years
Due after two years through three years
Due after three years through four years
Due after four years through five years
$172,692 - $394,681 - -
37

8. RETIREMENT AND PENSION PLANS
The Company and domestic subsidiaries have severance payment plans for employees, directors and corporate auditors.
Under most circumstances, employees terminating their employment are entitled to retirement benefits determined based on the rate of pay at the time of termination, years of service and certain other factors. Such retirement benefits are made in the form of a lump-sum severance payment from the
Company or from certain subsidiaries and annuity payments from a trustee. Employees are entitled to larger payments if the termination is involuntary, by retirement at the mandatory retirement age, by death, or by voluntary retirement at certain specific ages prior to the mandatory retirement age.
The provision for employees’ retirement benefits at March 31, 2013 and 2012 consisted of the following:
Millions of yen Thousands of
U.S. dollars 2013 2012 2013 Projected benefit obligation ¥38,803 ¥35,340 $412,797 Fair value of plan assets (31,983) (27,288) (340,242) Unrecognized prior service cost (131) (155) (1,390) Unrecognized actuarial loss (9,379) (10,890) (99,783) Prepaid pension cost 5,616 5,747 59,742
Provision for retirement benefits ¥2,926 ¥2,754 $31,124
The components of net periodic benefit cost for the years ended March 31, 2013 and 2012 were as follows:
Millions of yen Thousands of
U.S. dollars 2013 2012 2013 Service cost ¥1,800 ¥1,633 $19,147 Interest cost 588 614 6,254 Expected return on plan assets (779) (600) (8,286) Amortization of prior service cost 50 21 534 Recognized actuarial loss 1,459 1,109 15,524
Net periodic benefit cost ¥3,118 ¥2,777 $33,173
Assumptions used for the years ended March 31, 2013 and 2012 were set forth as follows: 2013 2012 Discount rate 1.4% 1.4% Expected rate of return on plan assets 3.0% 3.0% Amortization period of prior service cost 5 years 5 years Amortization period of actuarial gain/loss 10 years 10 years Amortization method of projected benefit obligation The straight-line method The straight-line method
38

9. NOTES RECEIVABLE AND PAYABLE March 31, 2013 and 2012 fall on bank holidays. The following notes receivable and payable matured on that date were accounted for as if they were settled on that date:
Millions of yen Thousands of
U.S. dollars 2013 2012 2013 Notes receivable ¥156 ¥214 $1,664 Notes payable 380 423 4,046 10. STOCK OPTIONS
The Company recognized and allocated share-based compensation costs for the years ended March 31, 2013 and 2012 as follows:
Millions of yen
Thousands of U.S. dollars
2013 2012 2013 Cost of sales ¥105 ¥217 $1,114
Selling, general and administrative expenses 235 424 2,500
Total ¥340 ¥641 $3,614
The stock options at March 31, 2013 were as follows: Unicharm Corporation
Meeting date
Persons granted
Number of options granted
Date of grant
Conditions for vesting
Service period
Exercisable period
September 16, 2010 (2010 Stock Option)
9 company’s directors 1 subsidiaries’ director 1,651 company’s employees 1,397 subsidiaries’ employees
Common stock 2,594,700 shares (*1)
November 1, 2010
(*2) (*3)
From November 1, 2010 to September 30, 2012
From October 1, 2012 to September 30, 2016
(*1)The number of stock options is converted into the number of shares. (*2) The market price of the Company’s common stock at the time of stock option exercise must be at least ¥4,800 (In the event that it becomes necessary to adjust this
value, the adjustment shall be conducted in a uniform and predetermined manner). (*3) A Stock option rights holder must, at the time of the stock option exercise, hold a position within Unicharm or its affiliates as a director or employee. However,
Unicharm’s Board of Directors may approve the exercise of stock options by directors who have resigned due to the expiration of one’s term or employees who have retired due to reaching the mandatory retirement age.
The activities of the stock option during the year ended March 31, 2013 were as follows:
Unicharm Corporation 2010 Stock Option (Shares) Non-vested: April 1, 2012—Outstanding 2,561,100 Granted - Forfeited 9,000 Vested 2,552,100 March 31, 2013—Outstanding - Vested: April 1, 2012—Outstanding - Vested 2,552,100 Exercised 1,231,800 Forfeited -
March 31, 2013—Outstanding 1,320,300 Exercise price ¥3,287 ($35) Average stock price at exercise ¥5,179 ($55) Fair value price at grant date ¥513
($5)
39

11. SELLING, GENERAL AND ADMINISTRATIVE EXPENSES
Selling, general and administrative expenses for the years ended March 31, 2013 and 2012 consisted of the following:
Millions of yen Thousands of
U.S. dollars 2013 2012 2013 Sales promotion ¥70,137 ¥57,409 $746,143 Advertising 15,796 13,705 168,047 Shipping and storage expenses 24,337 21,468 258,900 Employees’ salaries 16,536 13,807 175,912 Depreciation and amortization 2,050 1,464 21,814 Other 38,684 34,701 411,521 Total ¥167,540 ¥142,554 $1,782,337 12. GAIN ON SALE OR LOSS ON DISPOSAL OF PROPERTY, PLANT AND EQUIPMENT
Gain on sale of property, plant and equipment for the years ended March 31, 2013 and 2012 consisted of the following:
Millions of yen Thousands of
U.S. dollars 2013 2012 2013 Gain on sale of property, plant and equipment Buildings and structures ¥21 ¥- $220 Machinery and equipments 13 8 144 Others 8 0 84 Total ¥42 ¥8 $448 Loss on disposal and sale of property, plant and equipment for the years ended March 31, 2013 and 2012 consisted of the following:
Millions of yen Thousands of
U.S. dollars 2013 2012 2013 Loss on disposal of property, plant and equipment Buildings and structures ¥24 ¥64 $250 Machinery and equipments 530 753 5,644 Removal costs 2 43 17 Others 46 59 488 Loss on sale of property, plant and equipment Buildings and structures 3 30 34 Machinery and equipments 11 3 113 Others 1 383 15 Total ¥617 ¥1,335 $6,561
40
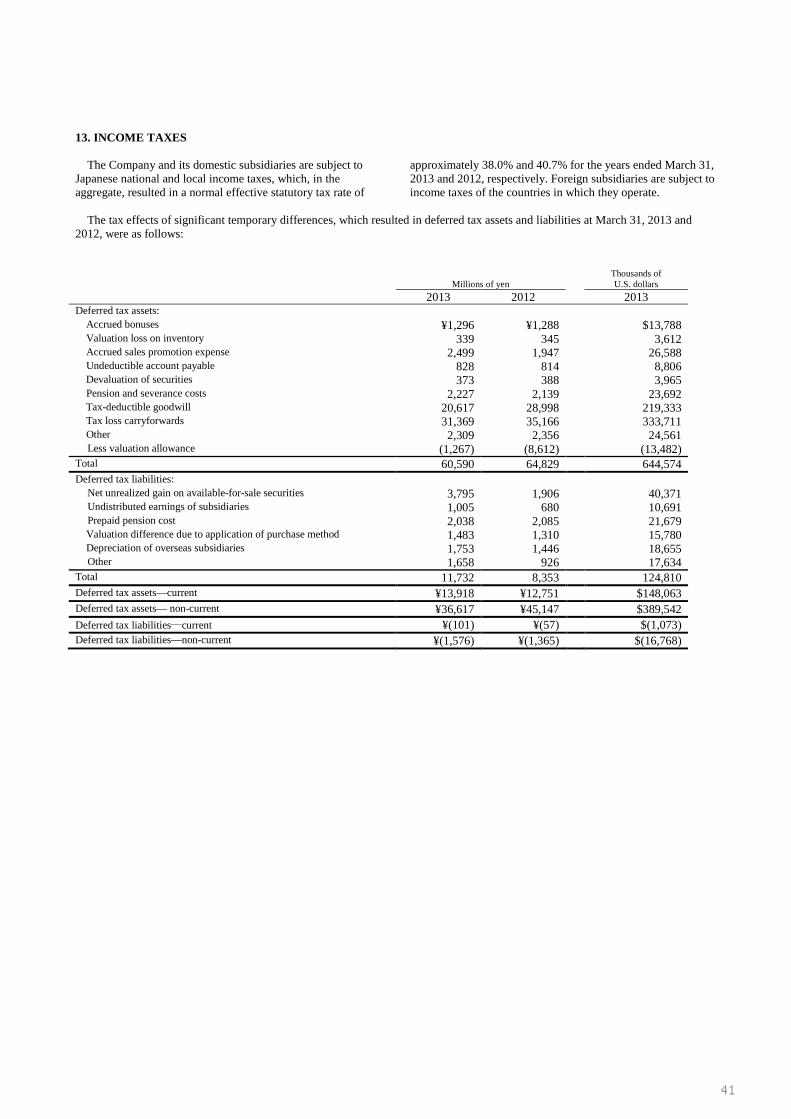
13. INCOME TAXES
The Company and its domestic subsidiaries are subject to Japanese national and local income taxes, which, in the aggregate, resulted in a normal effective statutory tax rate of
approximately 38.0% and 40.7% for the years ended March 31, 2013 and 2012, respectively. Foreign subsidiaries are subject to income taxes of the countries in which they operate.
The tax effects of significant temporary differences, which resulted in deferred tax assets and liabilities at March 31, 2013 and
2012, were as follows:
Millions of yen Thousands of
U.S. dollars 2013 2012 2013 Deferred tax assets: Accrued bonuses ¥1,296 ¥1,288 $13,788 Valuation loss on inventory 339 345 3,612 Accrued sales promotion expense 2,499 1,947 26,588 Undeductible account payable 828 814 8,806
Devaluation of securities 373 388 3,965 Pension and severance costs 2,227 2,139 23,692
Tax-deductible goodwill 20,617 28,998 219,333 Tax loss carryforwards 31,369 35,166 333,711
Other 2,309 2,356 24,561 Less valuation allowance (1,267) (8,612) (13,482) Total 60,590 64,829 644,574 Deferred tax liabilities: Net unrealized gain on available-for-sale securities 3,795 1,906 40,371 Undistributed earnings of subsidiaries 1,005 680 10,691 Prepaid pension cost 2,038 2,085 21,679 Valuation difference due to application of purchase method 1,483 1,310 15,780 Depreciation of overseas subsidiaries 1,753 1,446 18,655 Other 1,658 926 17,634 Total 11,732 8,353 124,810 Deferred tax assets—current ¥13,918 ¥12,751 $148,063 Deferred tax assets— non-current ¥36,617 ¥45,147 $389,542 Deferred tax liabilities―current ¥(101) ¥(57) $(1,073) Deferred tax liabilities—non-current ¥(1,576) ¥(1,365) $(16,768)
41

A reconciliation between the normal effective statutory tax rates and the actual effective tax rates reflected in the accompanying consolidated statements of income for the years ended March 31, 2013 and 2012 was as follows:
2013 2012
Normal effective statutory tax rate 38.0 % 40.7 % Amortization of goodwill 2.0 2.7 Lower income tax rates applicable to income in certain foreign countries (7.7 ) (10.3 ) Dividends 0.6 0.1 Valuation allowance (10.8 ) (14.8 ) Income tax – refunded (0.3 ) (0.7 ) Effects of the merger - - Sale of investment in an affiliate - - Corporate income tax credit (0.6 ) 0.5 Effects of corporate income tax rate changes 3.0 12.7 Other (0.2 ) 1.7 Actual effective tax rate 23.9 % 32.6 %
On December 2, 2011, the “Act for Partial Revision to the Income Tax Act, etc. for the Purpose of Creating a Taxation System
Responding to Changes in Economic and Social Structures” (Act No. 114 of 2011) and the “Act on Special Measures for Securing Financial Resources Necessary to Implement Measures for Reconstruction following the Great East Japan Earthquake” (Act No. 117 of 2011) were promulgated. Consequently, the corporate tax rate will be reduced and a special recovery tax will be imposed. In accordance with this tax reform, the effective statutory tax rate, which is used to measure deferred tax assets and deferred tax liabilities, has been reduced from 40.7% to 38.01% for temporary differences that are expected to be eliminated during the period from April 1, 2012 through March 31, 2015 and 35.64% for temporary differences that are expected to be eliminated on or after April 1, 2015.
42
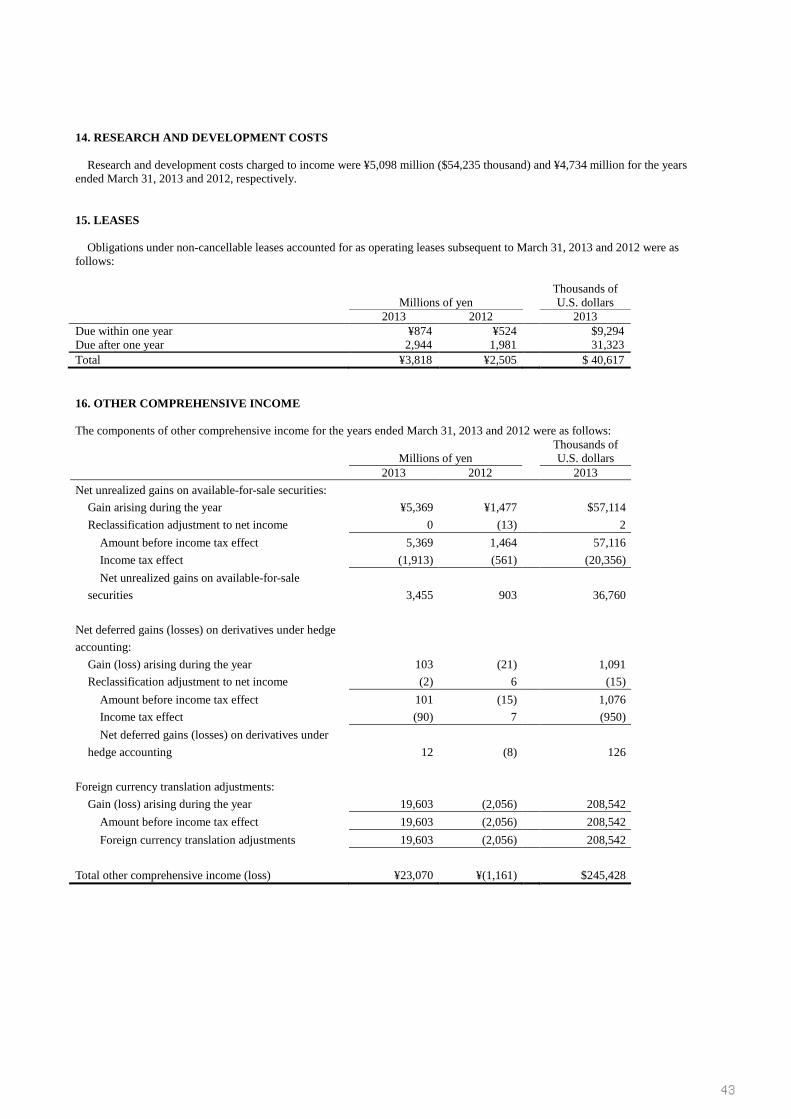
14. RESEARCH AND DEVELOPMENT COSTS
Research and development costs charged to income were ¥5,098 million ($54,235 thousand) and ¥4,734 million for the years ended March 31, 2013 and 2012, respectively. 15. LEASES
Obligations under non-cancellable leases accounted for as operating leases subsequent to March 31, 2013 and 2012 were as follows:
Millions of yen Thousands of
U.S. dollars 2013 2012 2013 Due within one year ¥874 ¥524 $9,294 Due after one year 2,944 1,981 31,323 Total ¥3,818 ¥2,505 $ 40,617 16. OTHER COMPREHENSIVE INCOME The components of other comprehensive income for the years ended March 31, 2013 and 2012 were as follows:
Millions of yen
Thousands of U.S. dollars
2013 2012 2013 Net unrealized gains on available-for-sale securities:
Gain arising during the year ¥5,369 ¥1,477 $57,114 Reclassification adjustment to net income 0 (13) 2 Amount before income tax effect 5,369 1,464 57,116 Income tax effect (1,913) (561) (20,356) Net unrealized gains on available-for-sale securities
3,455 903
36,760
Net deferred gains (losses) on derivatives under hedge accounting:
Gain (loss) arising during the year 103 (21) 1,091 Reclassification adjustment to net income (2) 6 (15) Amount before income tax effect 101 (15) 1,076 Income tax effect (90) 7 (950) Net deferred gains (losses) on derivatives under hedge accounting
12 (8)
126
Foreign currency translation adjustments:
Gain (loss) arising during the year 19,603 (2,056) 208,542 Amount before income tax effect 19,603 (2,056) 208,542 Foreign currency translation adjustments 19,603 (2,056) 208,542
Total other comprehensive income (loss) ¥23,070 ¥(1,161) $245,428
43

17. FINANCIAL INSTRUMENTS AND RELATED DISCLOSURES 1. Disclosure on Financial Instruments (1) Policy for financial instruments
With respect to fund management, cash surpluses, if any, are invested in low risk financial assets. The Company determines which way to fund through reviewing financial conditions and market circumstances and, based on these, puts them into practice. Derivatives are used, not for speculative purposes, but to avoid the market risk of fluctuation in foreign exchange rates associated with forecast transactions in foreign currencies and receivables and payables denominated in foreign currencies.
(2) Nature and risk of financial instruments and risk management system Receivables such as trade notes and trade accounts are exposed to customer credit risk. With regard to such risk the sales
administration department monitors major customers periodically and controls the collection dues and outstanding balances per customer in order to identify doubtful receivables resulting from deterioration of customers' financial positions at an early stage.
Furthermore trade receivables denominated in foreign currency due from overseas subsidiaries are exposed to currency risk. The Company hedges the position, net of payables, using foreign exchange forward contracts, if necessary.
Investment securities held by the Company and certain consolidated subsidiaries, which consist of equity securities held for the purpose of business or capital alliances and debt securities classified as available-for-sale securities, are exposed to the market risk due to fluctuation in market prices.
With regard to the equity securities held for the purpose of business alliance, fair values are periodically reported at the board meetings. The Company limits the debt securities included in marketable and investment securities to the highly rated bonds in accordance with the Company's fund management policy; therefore, the credit risk associated with those securities is limited.
Payables—notes payable, accounts payable trade and accrued income taxes—mostly have payment due dates within one year. A portion of the trade payables denominated in foreign currencies that is stemmed from importing of raw materials is exposed to foreign currency exchange risk, while it is hedged through using forward foreign currency contracts when necessary. Long-term debt and Convertible bonds are taken out principally for the purpose of investment and facilitation of funds. Debt with variable interest rates is exposed to interest rate fluctuation risk. The Group manages its liquidity risk by holding adequate volumes of liquid assets along with adequate financial planning made by Accounting Control & Finance Division based on reports from relevant departments.
Derivative contracts employed by the Company and certain consolidated subsidiaries are foreign exchange forward contracts for the purpose of hedging the market risk due to fluctuation in foreign exchange rates associated with the trade receivables and payables denominated in foreign currencies. The derivative transactions are executed and controlled in accordance with the internal rule and used for hedging actual transactions. For hedging instruments, hedged items, hedge method and hedge effectiveness of hedge accounting, please see Note 18 “DERIVATIVES.”
(3) Supplementary explanation about fair value of financial instruments
Where no market price information is available, management uses certain assumptions to determine the fair value of those financial instruments. Accordingly, the value of these instruments would vary if different assumptions were used. Note that contract amounts of derivatives presented in Note 18 “DERIVATIVES” do not represent volume of underlying market risk of the derivative transactions.
44
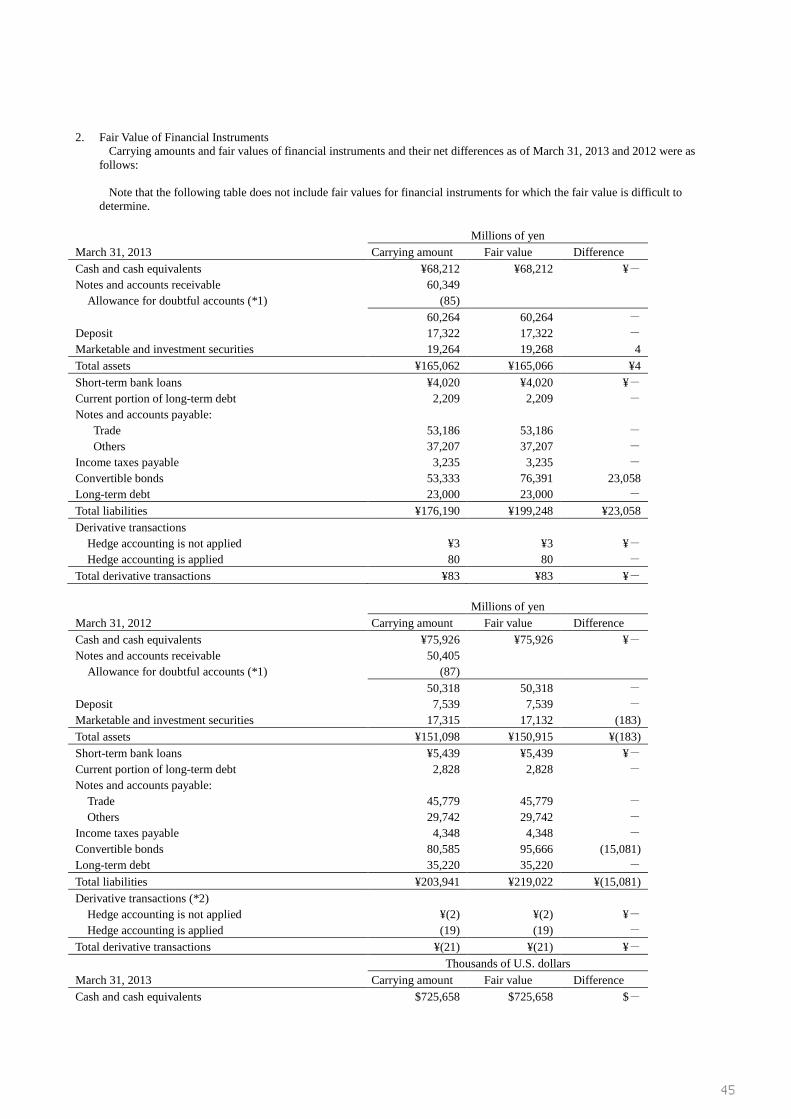
2. Fair Value of Financial Instruments Carrying amounts and fair values of financial instruments and their net differences as of March 31, 2013 and 2012 were as
follows: Note that the following table does not include fair values for financial instruments for which the fair value is difficult to
determine.
Millions of yen March 31, 2013 Carrying amount Fair value Difference Cash and cash equivalents ¥68,212 ¥68,212 ¥- Notes and accounts receivable 60,349 Allowance for doubtful accounts (*1) (85) 60,264 60,264 - Deposit 17,322 17,322 - Marketable and investment securities 19,264 19,268 4 Total assets ¥165,062 ¥165,066 ¥4 Short-term bank loans ¥4,020 ¥4,020 ¥- Current portion of long-term debt 2,209 2,209 - Notes and accounts payable: Trade 53,186 53,186 -
Others 37,207 37,207 - Income taxes payable 3,235 3,235 - Convertible bonds 53,333 76,391 23,058 Long-term debt 23,000 23,000 - Total liabilities ¥176,190 ¥199,248 ¥23,058 Derivative transactions
Hedge accounting is not applied ¥3 ¥3 ¥- Hedge accounting is applied 80 80 -
Total derivative transactions ¥83 ¥83 ¥-
Millions of yen March 31, 2012 Carrying amount Fair value Difference Cash and cash equivalents ¥75,926 ¥75,926 ¥- Notes and accounts receivable 50,405 Allowance for doubtful accounts (*1) (87) 50,318 50,318 - Deposit 7,539 7,539 - Marketable and investment securities 17,315 17,132 (183) Total assets ¥151,098 ¥150,915 ¥(183) Short-term bank loans ¥5,439 ¥5,439 ¥- Current portion of long-term debt 2,828 2,828 - Notes and accounts payable: Trade 45,779 45,779 -
Others 29,742 29,742 - Income taxes payable 4,348 4,348 - Convertible bonds 80,585 95,666 (15,081) Long-term debt 35,220 35,220 - Total liabilities ¥203,941 ¥219,022 ¥(15,081) Derivative transactions (*2)
Hedge accounting is not applied ¥(2) ¥(2) ¥- Hedge accounting is applied (19) (19) -
Total derivative transactions ¥(21) ¥(21) ¥- Thousands of U.S. dollars March 31, 2013 Carrying amount Fair value Difference Cash and cash equivalents $725,658 $725,658 $-
45

Notes and accounts receivable 642,014 Allowance for doubtful accounts (*1) (908) 641,106 641,106 - Deposit 184,279 184,279 - Marketable and investment securities 204,933 204,978 45 Total assets $1,755,976 $1,756,021 $45 Short-term bank loans $42,762 $42,762 $- Current portion of long-term debt 23,503 23,503 - Notes and accounts payable: Trade 565,808 565,808 -
Others 395,821 395,821 - Income taxes payable 34,412 34,412 - Convertible bonds 567,373 812,674 (245,301) Long-term debt 244,681 244,681 - Total liabilities $1,874,360 $2,119,661 $(245,301) Derivative transactions
Hedge accounting is not applied $37 $37 $- Hedge accounting is applied 851 851 -
Total derivative transactions $888 $888 $- (*1) Allowance for doubtful accounts corresponding to notes and accounts receivable is deducted. (*2) Receivables and payables arising from derivative transactions are shown in net amount. (Note 1) Calculation method of the fair value of financial instruments and securities and derivative transactions Asset:
“Cash and cash equivalents” and "Notes and accounts receivable” The carrying amount is presented as the fair value since these balances are routinely settled in the short term, and as such the fair
value is considered to approximate the carrying value. “Marketable and investment securities” The fair values of equity securities are estimated based on quoted market prices for these instruments, and the fair values of debt
securities are determined based on the prices obtained from the financial institutions with which they are transacted. For further information, please see Note 3 "MARKETABLE AND INVESTMENT SECURITIES."
Liabilities:
“Short-term bank loans,” “Notes and accounts payable” and “Income taxes payable” The carrying amount is presented as the fair value since these balances are routinely settled in the short term, and as such the fair
value is considered to approximate the carrying value.
“Convertible bonds” The fair value of bonds issued by the Company is measured at the quoted market price.
“Long-term debt” The fair value of long-term debt is based on the present value of the total of principal and interest discounted by the interest rate to
be applied if similar new loans were entered into. However, the fair value of long-term debt with variable rates is based on the book value, since the variable rates are renewed periodically, so the carrying amounts approximate the fair value.
46

Derivative transactions: Please see Note 18 “DERIVATIVES.”
(Note 2) Carrying amounts of financial instruments for which fair value cannot be reliably measured were as follows:
Millions of yen Thousands of
U.S. dollars 2013 2012 2013 Unlisted equity securities ¥401 ¥385 $4,267
These items are not included in above “Marketable and investment securities” since no market price is available and it is extremely difficult to identify the fair value. (Note 3) Repayment schedule of monetary receivables and securities with contractual maturities is as follows: Millions of yen
March 31, 2013
Due in one year or less
Due after one year through five years
Due after five years through ten years
Due after ten years
Cash and cash equivalents ¥68,212 ¥- ¥- ¥- Notes and accounts receivable 60,349 - - - Marketable and investment securities:
Held-to-maturity debt securities: Debt securities - 452 1,000 1,000 Total ¥128,561 ¥452 ¥1,000 ¥1,000
Thousands of U.S. dollars
March 31, 2013
Due in one year or less
Due after one year through five years
Due after five years through ten years
Due after ten years
Cash and cash equivalents $725,658 $- $- $- Notes and accounts receivable 642,014 - - - Marketable and investment securities:
Held-to-maturity debt securities: Debt securities - 4,807 10,638 10,638 Total $1,367,672 $4,807 $10,638 $10,638
Millions of yen
March 31, 2012
Due in one year or less
Due after one year through five years
Due after five years through ten years
Due after ten years
Cash and cash equivalents ¥75,926 ¥- ¥- ¥- Notes and accounts receivable 50,405 - - - Marketable and investment securities:
Held-to-maturity debt securities: Commercial paper 400 - - - Debt securities 500 - 1,427 1,000 Total ¥127,231 ¥- ¥1,427 ¥1,000
47

18. DERIVATIVES
The Group enters into foreign exchange forward contracts and currency options to hedge foreign exchange risk associated with certain assets and liabilities denominated in foreign currencies.
Most derivative transactions are entered into to hedge foreign currency exposures incorporated with its business. Accordingly, market risk in these derivatives is basically offset by opposite movements in the value of hedged assets or liabilities. The Group does not hold or issue derivatives for trading purposes.
It is also the Group’s policy to use derivatives only for the purpose of mitigating market risks associated with investment securities.
Because the counterparties to these derivatives are limited to major international financial institutions, the Group does not anticipate any losses arising from credit risk.
Derivative transactions entered into by the Group have been made in accordance with internal policies which regulate the authorization and credit limit amounts.
Contract amounts, fair values, and gains and losses on derivative transactions were as follows:
a. Derivatives to which hedge accounting is not applied: Millions of yen Thousands of U.S. dollars 2013 2013
Contract amount
Fair
value
Unrealized gain/loss
Contract amount
Fair
Value
Unrealized
gain Foreign exchange forward contracts—
(Exchange-traded) Selling USD
¥200
¥(3)
¥(3)
$2,126
$(30)
$(30)
(Exchange-traded) Buying USD
906
6
6
9,641
63
63
(Exchange-traded) Buying DKK
66
0
0
701
4
4
Total ¥1,172 ¥3 ¥3 $12,468 $37 $37 Millions of yen 2012
Contract amount
Fair
value
Unrealized gain/loss
Foreign exchange forward contracts—
(Exchange-traded) Selling USD
¥150
¥0
¥0
(Exchange-traded) Buying USD
615
(2)
(2)
Total ¥765 ¥(2) ¥(2) The fair value is determined based on the prices presented from the financial institutions with which derivatives are transacted.
48

b. Derivatives to which hedge accounting is applied: At March 31, 2013 Millions of yen
Hedge accounting method Type of derivatives Major hedged item
Contract amount
Contract amount due
after one year Fair value Deferred hedging accounting method
Foreign exchange forward contracts: Selling CAD
Accounts payable ¥585 ¥- ¥20
Deferred hedging accounting method
Currency option contracts: Buying USD
Accounts payable 763 - 67
Deferred hedging accounting method
Currency option contracts: Buying EUR
Accounts payable 1,105 - 134
Deferred hedging accounting method
Foreign exchange forward contracts: Buying Yen
Accounts payable 1,078 - (141)
Total ¥3,531 ¥- ¥80 At March 31, 2012 Millions of yen
Hedge accounting method Type of derivatives Major hedged item
Contract amount
Contract amount due
after one year Fair value Deferred hedging accounting method
Foreign exchange forward contracts: Selling CAD
Accounts payable ¥338 ¥- ¥4
Deferred hedging accounting method
Foreign exchange forward contracts: Buying Yen
Accounts payable 90 - (1)
Deferred hedging accounting method
Currency option contracts: Buying USD
Accounts payable 263 - 4
Deferred hedging accounting method
Currency option contracts: Buying EUR
Accounts payable 990 - (26)
Total ¥1,681 ¥- ¥(19) At March 31, 2013 Thousands of U.S. dollars
Hedge accounting method Type of derivatives Major hedged item
Contract amount
Contract amount due
after one year Fair value Deferred hedging accounting method
Foreign exchange forward contracts: Selling CAD
Accounts payable $6,224 $- $218
Deferred hedging accounting method
Currency option contracts: Buying USD
Accounts payable 8,115 - 709
Deferred hedging accounting method
Currency option contracts: Buying EUR
Accounts payable 11,758 - 1,421
Deferred hedging accounting method
Foreign exchange forward contracts: Buying Yen
Accounts payable 11,466 - (1,497)
Total $37,563 $- $851 The fair value is determined based on the prices presented from the financial institutions with which derivatives are transacted.
49

19. PER SHARE INFORMATION a. Basis for the computation of net asset per share at March 31, 2013 and 2012 was as follows:
Millions of yen Thousands of
shares
Yen
U.S. dollars At March 31, 2013
Net asset
Number of shares of common stock
Asset per share
Net asset ¥329,201 206,945 Stock acquisition rights Minority interests Number of treasury stock Net asset attributable to common stock
677 38,756
- 289,768
- -
16,532 190,413
¥1,522
$16.19
Millions of yen Thousands of
shares
Yen At March 31, 2012
Net asset
Number of shares of common stock
Asset per share
Net asset ¥243,207 206,945 Stock acquisition rights Minority interests Number of treasury stock Net asset attributable to common stock
959 29,174
- 213,074
- -
22,698 184,247
¥1,156
b. A reconciliation of the differences between basic and diluted net income per share (“EPS”) for the years ended March 31, 2013
and 2012 was as follows:
Millions of yen Thousands
of shares Yen U.S. dollars
Year Ended March 31, 2013 Net income Weighted-average
shares EPS Basic EPS—Net income available to common shareholders ¥43,122 184,479 ¥233.75 $2.49 Effect of dilutive securities—Adjustment of warrants of company (35) 21,128 Diluted EPS—Net income for computation ¥43,087 205,607 ¥209.56 $2.23
Millions of yen Thousands
of shares Yen
Year Ended March 31, 2012 Net income Weighted-average
shares EPS Basic EPS—Net income available to common shareholders ¥26,982 186,145 ¥144.95 Effect of dilutive securities—Adjustment of warrants of company (58) 20,884 Diluted EPS—Net income for computation ¥26,924 207,029 ¥130.05
50

20. SUBSEQUENT EVENTS (1)Appropriations of Retained Earnings
The following appropriations of retained earnings at March 31, 2013 were approved at the Board of Directors of the Company meeting held on May 31, 2013:
Millions of yen Thousands of
U.S. dollars Year-end cash dividends, ¥17 ($0.18) per share ¥3,237 $34,436 (2)Execution of stock acquisition rights a.Convertible bonds due in 2013
On April 8, 2013, the Company executed 120% call options stipulated in the issue conditions of the convertible bonds with stock acquisition rights (the “Convertible Bonds”) due in 2013 which were issued on September 24, 2010 and decided to make an advance-redemption of all the remaining Convertible Bonds by May 10, 2013. The Convertible Bonds remaining at March 31, 2013 in the carrying amount of ¥16,233 million ($172,692 thousand) were fully converted into shares by May 7, 2013, which was the final due date for conversion and consequently 4,176,874 treasury stock shares were disposed of. b.Convertible bonds due in 2015
On September 24, 2013, the Company executed 120% call options stipulated in the issue conditions of the convertible bonds with stock acquisition rights (the “Convertible Bonds”) due in 2015 which were issued on September 24, 2010 and decided to make an advance-redemption of all the remaining Convertible Bonds by October 25, 2013. 21. RELATED PARTY TRANSACTIONS (1) Transactions of the Company with related parties for the years ended March 31, 2013 and 2012 were as follows: a. Takahara Kosan K.K.
Takahara Kosan K.K. is directly owned 20.0% share by Mr. Takahisa Takahara, President and Chief Executive Officer of the Company, 1.0% by Mr. Keiichiro Takahara, Founder &Director of the Board of the Company, 44.5% directly owned by their close relatives, and another 34.5% indirectly owned by their close relatives.
Millions of yen Thousands of
U.S. dollars 2013 2012 2013 Insurance premium ¥46 ¥40 $485 Prepaid expenses 1 0 12 b. Unitec Corporation
Unitec Corporation is directly owned 0.7% share by Mr. Takahisa Takahara, 1.5% by Mr. Keiichiro Takahara’s close relatives, and another 97.8% indirectly owned by Mr. Keiichiro Takahara’s close relatives.
Millions of yen Thousands of
U.S. dollars 2013 2012 2013 Rental expenses ¥11 ¥11 $120 (2) Transactions of the consolidated subsidiaries of the Company with related parties for the year ended March 31, 2013 and 2012
were as follows: Takahara Kosan K.K.
Millions of yen Thousands of
U.S. dollars 2013 2012 2013 Rental expenses ¥119 ¥119 $1,266
51

22. SEGMENT INFORMATION 1. Overview of reportable segments
The Group’s reportable segments are components for which separate financial information is available, and whose operating results are reviewed regularly by the Board of Directors in order to determine allocation of management resources and assess segment performance.
The Group’s reportable segments consist of Personal care business, Pet care business, and Other business. Each business segment operates its own business with the comprehensive strategies including Japan and overseas business by segments.
Therefore, the Personal care business, the Pet care business and Other business constitute the Company’s reportable segments.
The Personal care business manufactures and sells baby care products, feminine care products, health care products and clean-and-fresh products. The Pet care business manufactures and sells pet food products and pet toiletry products. The Other businesses manufacture and sell industrial materials.
2. Methods of measurement for the amounts of sales, profit (loss), assets, and other items for each reportable segment
The accounting policies for the reportable segments are basically the same as policies described in “Summary of Significant
Accounting Policies.” Intersegment sales and transfer prices are mainly based on current market price. 3. Information about sales, profit (loss), assets, liabilities and other items is as follows. Millions of yen 2013 Reportable segment
Personal care
Pet care
Others
Total Eliminations or
Corporate
Consolidated Sales to customers ¥417,187 ¥73,183 ¥5,401 ¥495,771 ¥- ¥495,771 Intersegment sales - - 24 24 (24) -
Total sales ¥417,187 ¥73,183 ¥5,425 ¥495,795 ¥ (24) ¥495,771 Segment profit (Operating profit) ¥55,478 ¥3,618 ¥361 ¥59,457 ¥31 ¥59,488 Segment assets ¥417,923 ¥83,708 ¥23,819 ¥525,450 ¥9,605 ¥535,055 Other: Depreciation ¥14,453 ¥2,183 ¥178 ¥16,814 ¥- ¥16,814
Amortization of goodwill 1,370 2,870 - 4,240 - 4,240 Increase in tangible fixed assets and intangible fixed assets
50,920 1,325 95 52,340 - 52,340
Millions of yen 2012 Reportable segment
Personal care
Pet care
Others
Total Eliminations or
Corporate
Consolidated Sales to customers ¥362,885 ¥59,558 ¥5,948 ¥428,391 ¥- ¥428,391 Intersegment sales - - 21 21 (21) -
Total sales ¥362,885 ¥59,558 ¥5,969 ¥428,412 ¥ (21) ¥428,391 Segment profit (Operating profit) ¥48,215 ¥3,173 ¥487 ¥51,875 ¥26 ¥51,901 Segment assets ¥332,205 ¥96,878 ¥25,147 ¥454,230 ¥18,268 ¥472,498 Other: Depreciation ¥11,920 ¥1,213 ¥124 ¥13,257 ¥- ¥13,257
Amortization of goodwill 833 3,066 - 3,899 - 3,899 Increase in tangible fixed assets and intangible fixed assets
42,588 26,785 126 69,499 - 69,499
52

Thousands of U.S. Dollars 2013 Reportable segment
Personal care
Pet care
Others
Total Eliminations or
Corporate
Consolidated Sales to customers $4,438,165 $778,539 $57,459 $5,274,163 $- $5,274,163 Intersegment sales - - 253 253 (253) -
Total sales $4,438,165 $778,539 $57,712 $5,274,416 $ (253) $5,274,163 Segment profit (Operating profit) $590,194 $38,493 $3,837 $632,524 $333 $632,857 Segment assets $4,445,990 $890,512 $253,389 $5,589,891 $102,186 $5,692,077 Other: Depreciation $153,759 $23,221 $1,896 $178,876 $- $178,876
Amortization of goodwill 14,567 30,535 - 45,102 - 45,102 Increase in tangible fixed assets and intangible fixed assets
541,703 14,100 1,009 556,812 - 556,812
Note: Corporate assets included in “Eliminations or Corporate” amount to ¥47,272 million ($502,890 thousand) and ¥55,591 million for the years ended March 31, 2013 and 2012, respectively. Such assets consist of cash and cash equivalents, marketable securities and investment securities held by the Company. (Related Information) 1. Information on Products and Services
Information on products and services is omitted since the similar information is disclosed in above segment information.
2. Geographical Information (1) Sales
Millions of yen 2013
Japan China Others Total ¥236,993 ¥72,287 ¥186,491 ¥495,771
Millions of yen 2012
Japan China Others Total ¥229,083 ¥56,346 ¥142,962 ¥428,391
Thousands of U.S. dollars 2013
Japan China Others Total $2,521,207 $769,011 $1,983,945 $5,274,163
Note: Sales are divided to each country on areas based on the customer's location. (2) Tangible fixed assets
Millions of yen 2013
Japan China Others Total ¥44,494 ¥43,328 ¥75,307 ¥163,129
Millions of yen
2012 Japan China Others Total
¥40,766 ¥25,337 ¥50,718 ¥116,821
Thousands of U.S. dollars 2013
Japan China Others Total $473,343 $460,938 $801,137 $1,735,418
53
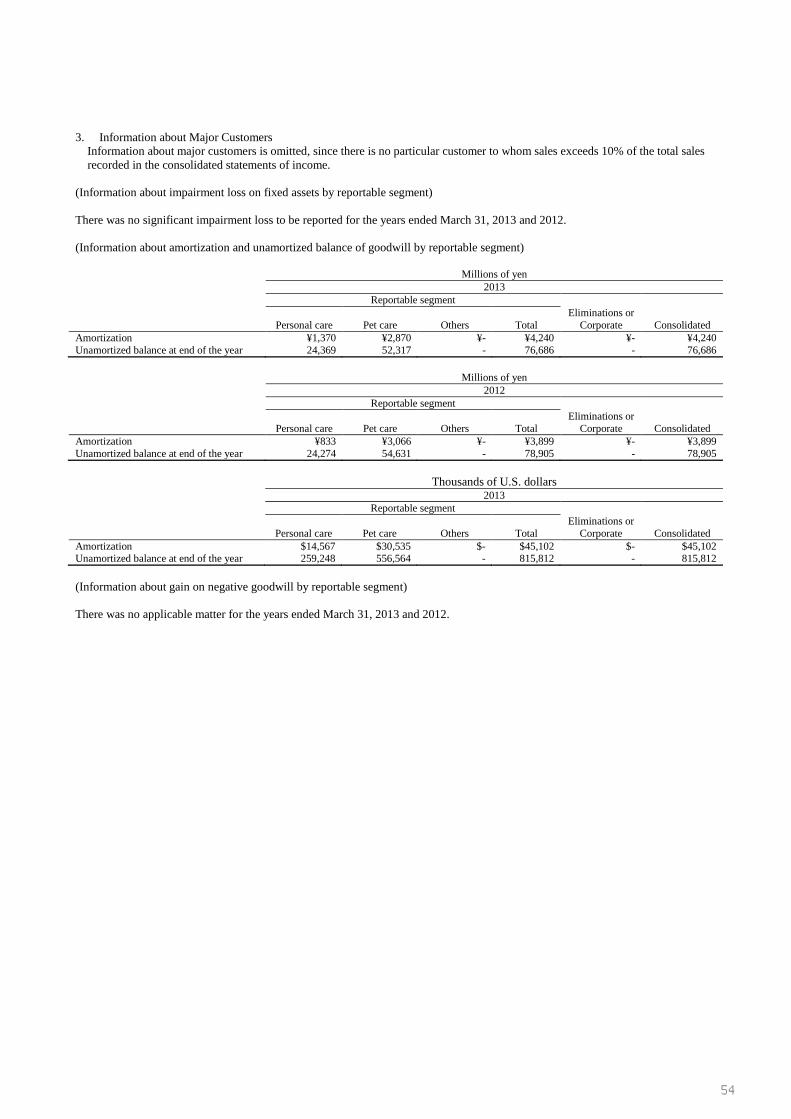
3. Information about Major Customers Information about major customers is omitted, since there is no particular customer to whom sales exceeds 10% of the total sales recorded in the consolidated statements of income.
(Information about impairment loss on fixed assets by reportable segment) There was no significant impairment loss to be reported for the years ended March 31, 2013 and 2012. (Information about amortization and unamortized balance of goodwill by reportable segment) Millions of yen 2013 Reportable segment
Personal care
Pet care
Others
Total Eliminations or
Corporate
Consolidated Amortization ¥1,370 ¥2,870 ¥- ¥4,240 ¥- ¥4,240 Unamortized balance at end of the year 24,369 52,317 - 76,686 - 76,686 Millions of yen 2012 Reportable segment
Personal care
Pet care
Others
Total Eliminations or
Corporate
Consolidated Amortization ¥833 ¥3,066 ¥- ¥3,899 ¥- ¥3,899 Unamortized balance at end of the year 24,274 54,631 - 78,905 - 78,905 Thousands of U.S. dollars 2013 Reportable segment
Personal care
Pet care
Others
Total Eliminations or
Corporate
Consolidated Amortization $14,567 $30,535 $- $45,102 $- $45,102 Unamortized balance at end of the year 259,248 556,564 - 815,812 - 815,812 (Information about gain on negative goodwill by reportable segment) There was no applicable matter for the years ended March 31, 2013 and 2012.
54

55
56