notes - cities21 - cities21 · web viewfor nearby cities with more srp commuters, a...
TRANSCRIPT

Sustainable Suburb Silver Bullet:
PRT Shuttle + New Mobility Halves SOV CommutesSuburban Palo Alto Multi-Modal Demand AnalysisProfessional Report for the Electric Power Research Institute
September 1, 2003 Version
Author: Steve Raney, Cities21.org
1487 Pitman Ave., Palo Alto, CA 94301, (650) 329-9200. [email protected].
Masters Candidate, U.C. Berkeley City and Regional Planning Department
Abstract
A Personal Rapid Transit (PRT) "shuttle" system is proposed for Palo Alto's Stanford Research
Park (SRP), complementing and significantly increasing the attractiveness of commuter rail,
carpool, vanpool, bicycle, and bus commutes for the center's 20,000 employees. PRT provides
non-stop, no-wait, 30 mph service over the commute's last two miles, and services mid-day trips.
In addition to PRT, a very comprehensive "door to door mobility" service is proposed, supplying
both high tech (web/cellular) and "high touch" (personal) solutions to meet SRP employees'
complex transportation needs. University of California Researcher Susan Shaheen defines "new
mobility" service as "a new transportation approach that focuses on pairing clusters of smart
technologies with existing transportation options to create a coordinated, intermodal
transportation system that could substitute for the traditional auto."
A complex travel demand analysis was conducted on a sample of suburban employees, of which
89 % drive alone. When presented with a hypothetical commute alternative scenario, where PRT
solved the "last mile" problem and new mobility services solved specific objections, drive alone
commutes dropped by 44% to only 45%. Extrapolating to the entire office park, 6,600 cars per
day are removed, freeing 50 acres of parking for reclamation, conservatively worth $150M. It
Introduction / Summary Chapter Page 1 of 187

appears possible to eliminate traffic congestion and air pollution without lifestyle sacrifice -- a
result consistent with the Bush administration's energy policy philosophy. Commuters intend to
take 1.32 PRT trips per day for a total of 26,000 trips per day for the entire job center. At $0.75
fare, $5M annual fare box revenue is produced. Additional revenue sources and cost savings
total $16.9M per year, profitably covering PRT capital, operating, and maintenance costs. The
model for Palo Alto plausibly translates to other job-rich suburbs served by trunk line transit.
Proposed are new applications of cellular location tracking technology and Wi-Fi (802.11)
enabled handsets to increase the competitiveness of suburban commute alternatives. Cellular
phones evolve to become a commuter's "command center", an integral part of the workday. The
following applications are proposed: A) "TrakRide" to improve the reliability of carpool
rendezvous and increase courteous, punctual behavior. B) "NextTrain" to improve the reliability
of train-shuttle connections. C) "HomeSafe" to verify that carpools amongst strangers operate
safely. D) "QuickCar" to provide five-minute access to cars for centralized car sharing and
emergency ride home, using "wireless door key." E) "SpyKids" to maintain secure custody of
children during unaccompanied shuttle trips. F) "NextSpace" to direct commuters to available
parking spaces, with wireless access to automated, shared parking lots. A central database,
known as "Big Sister," maintains personal data to support these applications.
Author's Notes
Major changes in this version include
Major revisions to the Parking Appendix
Addition of the Workforce Housing, Toxic Hazards, and Economics appendices.
Improvements based on the recommendations from a review of the June 25 draft by
Professor Robert Cervero, Professor Jerry Schneider, and EPRI's Jim Galanis.
Introduction / Summary Chapter Page 2 of 187

Introduction / Summary Chapter
Goals
The over-arching research goal is to solve, rather than simply understand, the vexing problem of
how to remove a significant number of cars from job-rich suburbs. In the San Francisco Bay
Area, suburban office park commute mode is roughly divided as follows: 78% drive alone, 16%
shared ride, and 3% transit. [RIDES] Removing cars allows for the reclamation of parking lots for
more productive use, enabling densification and intensification of land use. We hope to find
better alternatives for office park employees in a manner that is attractive to real-estate owners
and employers. Numerous additional benefits accrue from removing cars: reduced traffic
congestion, air pollution, and toxic runoff.
To remove cars, we must first understand which techniques best motivate commuters to forego
single occupancy vehicle (SOV) driving. One proven transportation demand management
(TDM) technique is to charge for parking (or provide a parking cash-out). The impact of paid
parking varies as a function of the viability of local commute alternatives and size of the parking
charge. Shoup found a 13 percent drive alone reduction:
"After cashing out, the solo-driver share at the eight [Southern California] firms
[surveyed in this study] fell from 76 percent to 63 percent. The carpool share rose from
14 percent to 23 percent, the transit share rose from 6 percent to 9 percent, and the
combined walk and bicycle share rose from 3 percent to 4 percent." [Shoup]
Unfortunately, this technique remains economically and politically impractical for suburban
office parks, where adjacent "free-parking" office parks would enjoy an immediate competitive
advantage.
While less effective than paid parking, employers have also reported success in reducing parking
demand by providing a combination of four tools: transportation allowance (subsidizing transit
fares and vanpooling), guaranteed ride home, on-site ridematching, and a supportive cultural
Introduction / Summary Chapter Page 3 of 187

environment. This combination has never reduced suburban solo commuting by more than 10
percent.
For this research, we explored whether commuters could be WILLINGLY coaxed away from
driving alone in large numbers. We proposed a 20-station personal rapid transit (PRT) "shuttle"
system for Palo Alto's Stanford Research Park (SRP) major employment center, complementing
and significantly increasing the attractiveness of commuter rail, carpool, vanpool, bicycle, and
bus commutes. PRT provides non-stop, no-wait, 30 mph service for the commute's last two
miles, and services mid-day trips. In addition to PRT, our proposal includes a very
comprehensive "door to door mobility" service supplying both high tech (web/cellular) and "high
touch" (personal) solutions to meet workers' complex transportation needs. Our objective was to
determine if a few limited, cost-effective changes could have a large impact on commuting
patterns.
Our research scenario takes place in Year 2008, when we felt safe in assuming: a) PRT
technology had been commercialized; b) cellular infrastructure had continued its breakneck
technological progression; and c) Silicon Valley's economy was once again thriving, increasing
traffic congestion back to Year 2000 levels.
The Bush Administration's controversial energy policy contained the concept that U.S. citizens
wanted ample, inexpensive energy entailing no personal sacrifice. Likewise, our proposed
solution represents a "no sacrifice" approach to reducing auto dependence.
This proposal is complex and contains many concepts. The reader should not expect to
enthusiastically embrace each of these concepts, just as the reader probably does not agree with
all the ideas encompassed by current suburban development patterns.
Promising results from 62 surveys
62 SRP employees completed our Year 2008 Scenario survey. For each survey response, we
spent 39 minutes educating the participant. The respondent group skewed towards driving
Introduction / Summary Chapter Page 4 of 187

alone, with 89% choosing this option (and 9.6% carpool), more auto-centric than typical for Bay
Area suburban commuters. When presented with our Year 2008 hypothetical commute
alternative scenario, only 45.6% chose to drive alone (32.1% carpool, 15.5% commuter rail,
4.2% bus, and 2.6% bike/walk). Extrapolating these results to the entire 20,000-employee office
park is not statistically valid, but does provide a rough order of magnitude of the potential
impact. Roughly 6,600 cars per day would disappear from the research park, freeing 50 acres of
parking for new development (at 350 square feet per parking space), conservatively worth
$3M/acre = $150M. A 6,600-car reduction would also be very beneficial in reducing traffic
congestion and air pollution.
Survey participants chose to take 1.32 PRT rides per day, both commute and lunchtime trips.
Invoking the "order of magnitude" extrapolation from 62 survey participants to the entire
research park, PRT patronage would be more than 26,000 rides per day. At the $0.75 fare used
in the survey, annual fare box revenue is more than $5M. Additional revenue sources and cost
savings total $16.9M per year, profitably covering PRT capital, operating, and maintenance
costs. Please see the Economics Appendix for further details on cost/revenue.
With its closely spaced stations, the PRT system puts everyone in the research park within a
quarter mile of a PRT station, where they have rapid access to a commuter rail station (Caltrain's
California Avenue station). U.C. Berkeley City and Regional Planning Professor Robert
Cervero's study of rail land value impacts demonstrates more than 100% increase in land value
for office parcels within 1/4 mile of a commuter rail stations in business districts in Santa Clara
County, where SRP resides. [Value Added] Because PRT provides access to trunk line transit but
shields employees from the noise generated from immediate proximity to commuter rail, SRP
land could command an even higher premium. In essence, SRP and surrounding parcels become
a large-scale transit village where driving is optional within the village.
The Texas Transportation Institute's (TTI's) Year 2002 Urban Mobility Study concluded that
there is no "silver bullet" to reduce congestion, "Transit improvements, better operations,
adjusted work hours, telecommuting and a range of other efficiency options do not seem to offer
the promise of large increases in person carrying capacity for the current system." [TTI] Our
Introduction / Summary Chapter Page 5 of 187

report contradicts TTI's dreary conclusion by revealing a plan that can reduce congestion
profitably and can be replicated at a large number of office locations.
Stanford Research Park
Stanford Research Park (SRP), located in Palo Alto, California, is counted among the world’s
leading scientific research employment centers. Also known as the “parent of Silicon Valley,”
SRP has served as a model for numerous succeeding office parks. The 1,000-acre park boasts
161 buildings serving 160 companies, the twenty largest of which account for more than 90
percent of the park’s 20,000 employees. Employers cover a broad spectrum of activities: energy
research, personal computer manufacturing, medical systems, defense, bioscience, technology
law, management consulting, information systems, electronic commerce, veterans’ hospital, and
research laboratories. In Year 2000, Palo Alto claimed 60,000 residents and 90,000 jobs, for a
substantial jobs/housing imbalance.
SRP is owned by Stanford University. Office lease profits from the park subsidize university
housing and academic programs. As one tenant explained it, Stanford imposes a "40/40/20" rule
on office developments, 40% of total area must be dedicated to landscaping, 40% to parking, and
up to 20% for one or two-story buildings.
For the purposes of this paper, we consider SRP to be "greater SRP", encompassing two
additional office "super blocks," twelve adjacent blocks of convenient retail, and the Caltrain
commuter rail station.
SRP experiences significant traffic congestion, and its Page Mill Road / El Camino Real
intersection is Palo Alto's busiest, with 43,000 car trips per day for all directions combined.
Stanford finds it hard to add new development to SRP because of traffic impacts requiring
significant mitigation.
Considering transportation and land use, Stanford is arguably the most progressive landowner in
Silicon Valley. Stanford negotiated two major General Use Permits with Santa Clara County
Introduction / Summary Chapter Page 6 of 187

that allowed millions of square feet of new in-fill development on Stanford lands in exchange for
verifiable proof of "no net increase in auto trips." Stanford is a major residential builder and a
leader in providing "workforce preference" housing (preference for short commutes). In
addition, Stanford charges for parking on much of its land and runs one of the most successful
bus shuttles in the Bay Area.
Santa Clara County alone boasts 11 other major job centers. For the country as a whole, Joel
Garreau defines suburban edge cities as having 5M square feet of office plus significant retail,
and identifies 185 such cities that are larger than Memphis. [Edge City] Should the transformative
model for SRP work, then it may spread rapidly throughout these U.S. edge cities.
Commute Shed [RANEY]
To better understand employee commute patterns, a GIS commute shed map was created,
mapping 8,200 home addresses of SRP workers to a one-fifth mile grid. At first glance, the SRP
worker commute origination pattern, or "commute shed," reveals a sprawling commute pattern
with some commuters traveling 76 congested miles from Central Valley towns of Manteca and
Tracy (not shown in the map within this paper). However, 47% of employees live with a two-
mile radius of a connecting commuter rail station (two miles is a popular measure of an easily
biked distance).
Current commuter rail time from the main San Francisco "4th and King" station to California
Avenue (the SRP station) is 65 minutes. Improved “Baby Bullet” Caltrain service, scheduled to
begin in a few years, promises to reduce this time significantly, increasing the competitiveness
compared to driving alone.
In addition, 28% of SRP workers live within a five-mile radius and 49% live within a ten-mile
radius of SRP. New Santa Clara and San Mateo County "bus preference service" (queue
jumping and signal pre-emption) along El Camino Real will dramatically reduce the speed gap
for bus versus auto for these short commutes.
Introduction / Summary Chapter Page 7 of 187

The probability of successfully forming a carpool is related to the number of workers who live
nearby - the more workers, the more likely a carpool may be formed. From the commute shed
map below, which encompasses about 40% of SRP employees, it is apparent that there is a
"proximity gradient" that is a function of driving distance from SRP.
From a Mountain View neighborhood with a six-mile commute to SRP, there are 127 potential
carpool members within a ten-block reach (encompassing one square mile). For the 13-mile San
Carlos-SRP commute, there are about 29 potential members within a ten-block reach. From
Danville, a 48-mile drive to SRP, there are only 40 prospects within a 25 square mile area.
Introduction / Summary Chapter Page 8 of 187
FIGURE 1 Stanford Research Park Commute Shed Map.
Legend: brown 1/5 mile grid cells contain 1 person, blue cells contain 2 people, green cells contain 3 or 4 people, yellow cells contain 5 to 18 people. Red lines are selected bus routes. The black rail line is Caltrain commuter rail. Thick blue-purple highways designate HOV lanes. Please see http://www.cities21.org/final_map.htm for larger versions of the map. The actual printed map is 36” x 36” at 600 DPI and covers roughly four times more area.
Introduction / Summary Chapter Page 9 of 187

Large five project study
While I personally accounted for the majority of hours on the study, the overall study was a large
team effort. Thirteen people (primarily volunteers) spent 20 or more hours on the project and
four of those (Forrest Deuth, Jeral Poskey, Jim Galanis, and David Maymudes) contributed more
than 100 hours apiece. Volunteers were motivated by an interest in sustainability or PRT (or
both). In all, the study took more than 2,500 hours to complete.
The five projects comprising the study are:
1. GIS commute shed map. To better understand employee commute patterns, create a
map of 8,200 employee addresses collected from large SRP employers, "geocoded" to a
1/5 mile grid. [RANEY]
2. Full scale PRT model. To rapidly educate survey participants about PRT, create a 33'
long x 16' high x 3' wide lightweight, portable replica of elevated PRT guideway. [FSM]
3. SRP virtual city animation. To further educate survey participants about PRT, model
SRP in three dimensions on the computer, replicating buildings and streets. Use video
game production techniques to create a real-time, interactive, immersive world. Add in
the PRT system with accurate simulation depicting intricate vehicle choreography and
varying demand levels.
4. Interview research. Conduct 13 in-depth, one-hour interviews to understand commuter
attitudes and reaction to the PRT shuttle + new mobility concept. Iteratively refine new
mobility features.
5. Survey research. Conduct 62 elaborate surveys comprised of a 15-minute educational
segment, a customized commute comparison, and a 25-minute survey featuring insights
from the interview research.
As we designed the five projects, we met with various industry leaders, and prepared a rough
budget for the study assuming outside consultants were used. The budget came to $325,000:
$50,000 for the GIS commute shed map; $50,000 for the full scale PRT model; $75,000 for the
SRP virtual city animation; and $150,000 combined for the interviews and surveys.
Introduction / Summary Chapter Page 10 of 187

PRT – rapid local shuttle
Personal Rapid Transit (PRT) is a new transit concept under development by two companies,
Taxi 2000 (the Skyweb Express system) and Advanced Transport Systems (the ULTra system).
The former has a 60' test track with one vehicle, and the later has a 1 km test track with three
vehicles. Both companies are at least two years away from commercialization.
PRT consists of many lightweight, driverless, three-person electric vehicles traveling on elevated
"rail" 16' above the ground. Transit stops are located near building entrances. Frequent stops are
situated along the route to minimize walking once the trip ends. Transit stop tracks are separated
from the main track - vehicles turn off onto a siding to pick up and drop off passengers. Because
of these turn-offs, vehicles travel non-stop to the destination at 30 mph, bypassing intermediate
stops and speeding at twice the average speed of autos on the congested SRP roads below. For
more background details on PRT, please see these references. [PRT]
Passengers travel alone or with people of their choosing. Vehicle weight minimization greatly
reduces the size of the elevated rail and supporting columns, dramatically reducing construction
cost and right of way acquisition (a rule of thumb is that guideway cost is proportional to the
square of vehicle weight). Vehicles flow through the rail almost like data packets on the Internet,
anticipating demand so that wait time is eliminated. In addition to improving commute
alternatives, the PRT shuttle eliminates mid-day stranding caused by many commute
alternatives, by providing efficient transit to adjoining shops and restaurants – based on the
nature of demand.
Introduction / Summary Chapter Page 11 of 187

A complete PRT grid network covering the entire Bay Area (costing billions of dollars) would
provide a very attractive, self-sufficient commute alternative; however, a five-mile PRT shuttle
system, as proposed for SRP, is a more realistic objective in today’s political climate. PRT as a
feeder/circulator provides a transportation means to a real-estate end: to intensify land use within
sprawling, parking lot laden office parks whose growth is gated by auto congestion.
A rough, preliminary 20-station PRT shuttle system is shown below. Highway 101 lies above
the map to the northeast and Highway 280 below to the southwest. The Caltrain station is in the
upper left corner, adjacent to California Avenue retail. The system consists of a one-way "figure
8", with a distance-reducing "shortcut" located in the middle portion of the 8, connecting HP
East and HP West. The top loop of the 8 is shown as a solid line, the bottom dashed. This
indicates that the top loop may be commercially viable by itself, creating the intriguing
possibility of building only the top loop to prove the economics before completing the entire
system. The bottom portion of the map resides on a hill that presents a challenge to bike riders.
Introduction / Summary Chapter Page 12 of 187

Introduction / Summary Chapter Page 13 of 187

D2D Mobility - New Mobility Company
University of California Researcher Susan Shaheen defines "new mobility" as “pairing clusters
of smart technologies with existing transportation options to create a coordinated, intermodel
transportation system that could substitute for the traditional auto.” [Shaheen] This section
summarizes required features for an SRP new mobility service. Later chapters will show how
these features are justified by our research.
For the interview and survey research, we invented a hypothetical Year 2008 new mobility
service:
Our imaginary company is called D2D MOBILITY. We provide you with door-to-door
mobility from home to work and back, and errands in-between! We are a partnership of
concerned organizations working to make commute alternatives as convenient and flexible as
driving alone. Partners include transit agencies; City of Palo Alto; Stanford; large local
employers; and key service providers including a cellular phone service, local taxi company,
car sharing service, a rental car firm, bicycle coalition, and ridesharing agency. Additional
partners deliver groceries, meals, dry cleaning, and photos, to name but a few.
The D2D partnership implies an enthusiastic commitment to SOV reduction by all parties,
otherwise, organizations won't join. The existence of this high powered "supportive policy
context" is crucial to changing the drive alone culture. [MOBILITY] SRP's large number of workers
provides sufficient scale for D2D services to run efficiently.
Interview research was instrumental in refining D2D high tech application concepts. In order to
work synergistically with the PRT shuttle, D2D relies on the widespread deployment of next
generation cellular phones with GPS location tracking and WiFi communications. D2D
cellular/web applications include:
NextTrain – improve the reliability of train/shuttle connections.
TrakRide – improve the reliability of carpool rendezvous, institutionalizing courteous,
punctual behavior.
HomeSafe – verify carpoolers reach home safely.
Introduction / Summary Chapter Page 14 of 187

QuickCar – centralized car sharing/loaners and emergency ride home. Drive the car
away less than 5 minutes after placing a request.
Customer support – context based phone support utilizing commuter's stored profile and
current geographical location.
MatchRide – improved carpool matchmaking using web dating services.
Big Sister database and location tracking – when Big Sister is watching, commute
reliability increases, congestion decreases, and safety increases.
Effortless PRT shuttle ticketing – WiFi credit card debiting coupled with default
destination selection based on commuter's history.
While significant engineering is involved, no single application requires more than a "person
year" to implement.
High touch (personal) D2D solutions consist of:
Commute community – organically grown web chat problem-solving knowledge base.
Customer support – your "reliable backup" eliminates rare "nightmare" commutes.
Neighborhood commute coordinators – encouragement and handholding.
Comprehensive, Integrated Mobility
The following diagram illustrates how PRT + D2D improve commutes, for a representative set
of commuting scenarios:
Introduction / Summary Chapter Page 15 of 187

first mile
Comprehensive, Integrated Mobility
Centralized Cars:share, rent, ride home
Delivery services, Personal activities, Business services
Train
first mile Bus
Walk
Bike, scooter
Short carpool pick up
first mileLong carpool•Web/wireless coordination•Supportive policy context
•Improved match-making•Shared parking
(Smart jitney)
PRT shuttle system
The above "PRT-centric" new mobility diagram is an evolution of the "carsharing-centric"
diagram from [Mobility].
The PRT shuttle system solves the "last mile" problem, efficiently connecting different commute
alternatives to SRP offices. The shuttle system is shown as a stylized oval with green circles
representing stations. Of critical importance, the shuttle blankets SRP with high quality transit.
The last mile problem manifests itself in many similar ways. First, to remove many cars from
SRP, the last mile problem must be solved with a high capacity system, capable of moving 4,000
or more people per hour. In addition, last mile solutions must be as fast as a car to compete with
driving alone. Thus, for a shuttle to attract lunchtime business, there must be no waiting (see
further details in the Interviews Chapter). Likewise, to distribute carpool members to different
office campuses within the research park, a very high level of service is required – problems with
traditional transit transfers discourage technology workers. And lastly, connections to
emergency ride home services must also be very rapid. Bus shuttle systems are a very successful
part of our current transit landscape, but they cannot be called upon to meet the last mile
challenge to serve finicky technology workers.
Consultants agree that the last mile problem is real. Cambridge Systematics, a well-known
transportation consulting firm, recently prepared a market analysis for San Mateo County, which
Introduction / Summary Chapter Page 16 of 187

adjoins Santa Clara County. [CamSys] At a meeting with the analysis team, they indicated their
conclusion that solving the last mile problem was of even more importance than improvements
proposed to the commuter rail trunk line service.
Granzow and Schmidt also prepared an analysis of why workers in the Caltrain corridor refused
to take transit. One of their conclusions was that there were too few houses and jobs close
enough to Caltrain. [CH2M HILL]
Train and bus commuters face the "first mile" problem as well: how to get to the train station or
bus stop in their home city. A solution for the last mile (and mid-day stranding) often provides
sufficient motivation for commuters to solve the first mile problem.
For commuters living one to three miles from the edge of SRP, the shuttle enables commuting
via foot, bicycle, electric bicycle, scooter, and, possibly, by Segway. Palo Alto and its adjacent
cities (Menlo Park, Los Altos, and Mountain View) feature attractive, tree-lined residential
neighborhoods that are conducive to human-powered commuting. In fact, Palo Alto pioneered
Western U.S. suburban bike paths. The research park, though attractively landscaped, is a
hostile, hilly environment for pedestrians and cyclists. The four and six-lane roads promote
auto-dominance, creating a noisy and dangerous environment. In actual fact, sidewalks were
originally outlawed within SRP. The shuttle enables commuting under human power for the
enjoyable portion of short commutes, switching to PRT to avoid the disagreeable last mile.
Eventually computer-dispatched smart jitneys (commuter vans) may ply suburban collector roads
to bring commuters to the edge of SRP for ensuing PRT distribution. Jitneys are especially
effective for regularly sweeping through low-density suburban residential corridors and solving
the first mile problem. Advanced jitney service is an active area of U. C. Berkeley and PATH
research [Y.B. Yim, Round] , so more details really aren’t needed here. Jitneys were NOT specified as
commute alternative options in the survey.
For the study, carpooling breaks down into two main scenarios with different first-mile concerns.
The first is a shorter commute of 4 to 15 miles where the driver picks up a passenger from the
Introduction / Summary Chapter Page 17 of 187

same part of town. If there is a rendezvous problem in the morning, then both drivers simply
drive alone at their own pace – missing the carpool does not have a large time or convenience
impact. The second carpool type is for longer commutes where three people converge on a
rendezvous point such as a shopping center parking lot and then share a car from that point.
Carpool members are strangers who are matched by MatchRide. Previously, workers sought
workers at the same company (or an adjacent firm). This made finding a carpool partner within
reasonable home proximity a significant challenge (please refer to the previous Commute Shed
section). By providing efficient distribution, PRT breaks this restriction. Carpoolers travel to
the edge of the employment center, park at the most convenient employer lot, and then ride PRT
to reach their workplaces. With 20,000 workers serving as potential carpool matches, the spatial
analysis improves dramatically.
By rapidly connecting an entire major employment center, PRT provides sufficient scale for
centralized commute services such as “guaranteed ride home”, car sharing (including station car
programs), and car rental.
Best of Urban and Suburban
Introduction / Summary Chapter Page 18 of 187

Best of Urban and Suburban
Old transit village 64 acres
New retailPersonal Activities: Quality schools, day care, hiking, parks, movies, grocery, banks, restaurants, cafes, bars, grocery, gym, massage, yoga, dentist, etc.
PRT shuttle system
New transit village 1280 acres
New housingJobs
JobsBusiness Services: Banks, PC store, copy center, FedEx, video conference, legal and accounting services, etc.
More productive / shorter commute
Delivery Services: Dry cleaning, grocery, meals, shoe repair, photos, produce, etc.
Train
Immediate, auto-free access
In mixed-use Central Business Districts, jobs, housing, and shops are all within convenient
walking distance. In many suburbs, only an auto can provide an effective link between these
three main real-estate uses. The PRT shuttle offers the promise of making these uses more
rapidly accessible than via auto.
While not representing the ideal transit village a New Urbanist would design on a 1,280 acre
greenfield, our proposed remedy for an existing suburban office park will create a very lively
environment to work and live in. New high density in-fill housing for SRP workers inside the
research park could reduce the jobs/housing imbalance, reduce long commutes, and provide a
rich set of personal and business services, including top ranked public schools and hiking trails.
University of Washington Professor Emeritus Jerry Schneider first introduced the concept of a
large transit village or "Extended Transit-Oriented Development" where PRT serves as "Feeder-
Distributor-Circulator" to trunk line transit. Schneider drew inspiration from Roxanne Warren's
"Urban Oasis" concept, where a low-cost cable driven people mover extends the reach of
commuter rail. [Schneider, Warren]
Introduction / Summary Chapter Page 19 of 187

Jeffrey Tumlin of Nelson Nygaard Associates (formerly with Stanford’s Transportation
Department) underscores the effectiveness of in-fill housing: "The most cost-effective peak hour
trip reduction in the Bay Area is to provide housing for workers." Robert Cervero reinforces the
significance of the opportunity: "Parking lot laden office parks are one of our biggest blights, but
they also represent our largest opportunity for in-fill development because of their inefficient use
of land." HR Magazine found that 36% of workers would be willing to take a 10% pay cut or
more for a shorter commute. [HR Magazine]
Some of the issues related to adding housing within SRP are explored in appendices on Smart
Parking, Workforce Housing, and Toxic Release Risk Management. While addressing these
issues adds complexity to the overall proposal, this added complexity creates more synergistic
benefits.
A typical transit village, as defined by Peter Calthorpe, is a half-circle of radius 1,000 feet
emanating from a rail station, an insignificant blip amidst low density suburbia. [Calthorpe]
PRT+D2D creates a "walkable" area 20 times the size.
In summary, the PRT+D2D proposal creates numerous benefits for SRP employees: reduced cost
of car ownership; improved commute options featuring reduced stress, increased sleep, and
increased productive time; increased access to attractive housing; increased vitality in the area
surrounding the workplace; and psychic benefits from helping the environment.
Demand Analysis Methodology
The forecasting of multi-modal alternatives, when PRT+D2D does not exist, is quite challenging.
No methodology will produce a definitive answer, so best attempts should be made to find the
"least flawed" methodology.
Consulting firm Cambridge Systematics points out flaws with the dominant transportation
planning/forecasting paradigm:
Introduction / Summary Chapter Page 20 of 187

Few transit agencies do true strategic planning, at least as commonly undertaken in the
private sector. The most significant divergences include the absence of modern market
research techniques and neglect in the positioning of service vis-à-vis its competing
modes. While these elements are ubiquitous in the strategies of private sector companies,
they appear to be rare or absent among transit agencies in the United States. Transit
agencies commonly conduct only on-board surveys and use the results to refine services.
Yet the vast pool of potential riders are those not riding, and it is their needs that are not
being served by the current transit service. [CamSys]
Shaheen's Carlink research [Shaheen] provides a key baseline methodology. Her challenge was to
gauge reaction to carsharing by potential riders with no foreknowledge of carsharing, which was
not operational anywhere in the U.S. at that time. Participants spent considerable time being
exposed to and learning about carsharing. Her "drive clinic" took participants through a
complete car sharing experience, enabling a fair evaluation of the service. For our study, we
visually simulated portions of the commuter PRT experience via the full scale PRT model and
virtual city animation, then used narrative descriptions to convey the D2D features.
Whereas Shaheen uses sociologically based research, we use Silicon Valley-style "new
technology product research", which is quite similar. In Shaheen's research, she was able to
provide a complete, working carsharing experience. Our research deals with a service at a much
less concrete stage. We design and improve the service features as the research progresses. We
began with an examination of commuter attitude literature, followed by interview research to
further inform our customer understanding.
We iteratively designed and refined a comprehensive service to overcome commuter issues,
using our understanding of state-of-the-art technology. We start with a rough solution that
meets our personal commuting needs, then interview feedback accelerates the selection of
effective features. Customers provide amazing insights. During his class lectures, Berkeley
Professor Robert Cervero emphasizes the importance of "sweating" the details, “the difference
between a good and bad transit system often boils down to getting the details right.” This is a
study of how to get those details right.
Introduction / Summary Chapter Page 21 of 187

During the research, it was necessary for the team to have the following experience: high-tech
product management, business sense, transportation expertise, local Palo Alto knowledge, survey
research knowledge, and computer hardware / software / communications expertise.
Like Shaheen, we spent considerable effort developing educational materials so that potential
riders without foreknowledge could quickly provide valid feedback. Because our interviews
corroborated the attitudinal literature, we felt confident that we could write a fair survey from
which to collect valid results. By exposing survey participants to the detailed problems of
commute alternatives, we were working extremely hard to convince people to drive alone.
Within the survey, we also aggressively tackled the "Social Desirability Effect," the tendency for
survey participants to overstate their willingness to use environmentally beneficial commute
alternatives. Most of the findings from the interviews were incorporated directly into survey
questions.
Our survey "gap analysis" allowed us to rate the effectiveness of specific D2D features, which
was invaluable. The last two questions gauged the cumulative impact of service offering on the
respondent, requiring the participant to state preference for shuttle and commute alternatives.
Previous PRT travel demand analyses have estimated mode splits for large Minneapolis, Los
Angeles, and Gothenburg (Sweden) PRT configurations at 50, 34, and 40 percent respectively.
These large system forecasts are not applicable for PRT forecasting in a small system, suburban
journey-to-work context. [Irving, Navin, Andréasson] Tegner's PRT demand forecast for a five kilometer
PRT shuttle for Huddinge, Sweden (the site of the first and largest IKEA) shows public transit
mode share increasing from 7% to 22% with the addition of PRT. Since two-thirds of trips are
for shopping and European transit attitudes differ from the States, this important study is not
applicable to SRP. [Tegner]
Important Conclusions
Introduction / Summary Chapter Page 22 of 187

Creating a willing reduction in suburban office park autos is possible, but requires
significant effort and innovation. Provided a higher level of service is provided than is
currently available, many people will be willing to undertake a slightly longer commute
via an alternative in order to obtain increased productive time and reduced stress.
By solving the critical last mile problem, PRT shuttle service is an enabler of commute
alternatives, but not a cure-all. PRT by itself will not address enough of the myriad of
individual commuter issues to attract significant ridership.
For commute alternatives to compete with the aspects of driving alone that are taken for
granted, matching new mobility features must be developed. Compounding the
challenge, the process of "giving up something you already have" and use habitually is
problematic. [Shaheen Meeting] Replacing a drive alone feature with an equally good commute
alternative feature is not attractive to people, because of the hassle involved with
switching modes and creating a new habit.
The interviews reinforced the complexity of the challenge. Each commuter has a unique
basket of attitudes/issues with differing levels of importance attached to each. There is
no "one size fits all" solution. Solutions that work for some have no impact on others.
In a meeting, Susan Shaheen emphatically agreed with our premise that a comprehensive
solution was required.
PRT + D2D feels like it is almost too complicated of a solution, and the question arises:
Has our love of technology caused us to layer in unnecessary features? No! The
preceding bullets in this section provide justification for a complex solution.
Nonetheless, the gap analysis does provide some guidance as to how to prioritize D2D
features.
Given a last mile solution, short distance carpools become viable.
Innovations
The study methodology introduced a number of original contributions in the forecasting of new
transportation service:
Rapid education tools including the full scale PRT model and the SRP virtual city
animation.
Introduction / Summary Chapter Page 23 of 187

The GIS commute shed map analytical tool, the development of which also contributed to
the discourse on data protection and privacy.
The use of new technology product research techniques where interviews iteratively
improved D2D features.
A unique web-based survey based on a number of novel details: A) providing full
disclosure of the behavioral issues within the text of the survey – providing participants
with rich, educational text so they could quickly reach the same level of understanding
that had taken us months to achieve. B) three-fold questions conducive to gap analysis,
presenting the problem, the proposed solution, and requesting comments. C) customized
commute comparison of driving alone versus a multimodal alternative originating from
their own home. D) elaborate protocol with scheduling, greeting, three exhibits,
clipboard data collection with negotiated alternative selection, extensive interaction with
educators, e-mailed comparison, web-based survey, and free lunch incentive.
New concepts arose from the study:
The huge, 1,280-acre suburban transit village - a detailed extension of Jerry Schneider's
Extended Transit-Oriented Development concept.
Comprehensive, integrated suburban mobility centered on a PRT shuttle – a detailed
evolution of the carsharing-centric new mobility scheme from [Mobility].
Wireless commute assistant with the following new applications: NextTrain, TrakRide,
HomeSafe, QuickCar, MatchRide, Big Sister, effortless PRT ticketing.
Larger candidate pool increases carpool formation (proximity analysis)
D2D Mobility corporation, a powerful Transportation Management Association and
ridesharing agency that creates cultural support for commute alternatives.
Paid, shared, automated parking scheme for large office parks
Centralized car sharing/loaners
The theory of the "casual suburban bike commuter"
Short carpools and short multimodal transit commutes can compete
Train/carpool time advantage graphs. Commuters are willing to undergo a 30% time
penalty in order to take a commute alternative.
Affluent workers' need for "time stamps" to prove workaholism
Introduction / Summary Chapter Page 24 of 187

NEXT STEPS
Were there the ability to implement this solution wholly in the private sector, capturing
"supernormal" profits, no further research would be required. The business case is sufficiently
strong to go forward. Time would be better spent implementing and debugging both PRT and
D2D software applications, iterating solutions with early adopters.
However, a PRT + D2D implementation such as this requires a public/private partnership, which
creates many policy challenges that serve as barriers to implementation. One possible sequence
towards realizing PRT+D2D for SRP would be:
Obtain powerful political backing
Conduct a follow-on travel demand analysis
Conduct a planning study
Hold a design competition
The most influential entities are large local players, the political hierarchy, the transit
subsystem, and the housing subsystem. The four main local players are Stanford, Palo Alto,
SVMG, and SRP employers. The political hierarchy runs from city council and the two adjacent
neighborhood associations all the way up to the U.S. Congress. The transit subsystem includes
VTA, Caltrain, MTC, TALC, Caltrans, BAAQMD, and the EPA. The housing subsystem
includes developers, HUD, Non-Profit Housing Association of Northern California, ULI, and
additional advocacy organizations.
Within the public sector, the risk/reward tradeoff is much different than in the private sector, so a
higher level of certainty is required to prove the efficacy of PRT+D2D. Thus, a second travel
demand analysis study should be conducted to increase certainty. The second study could
utilize a less biased research organization, improve on the methodology, study a larger sample,
and select survey subjects at random. It must be underscored that there is no accepted method to
precisely forecast demand for PRT+D2D. This study should target SRP companies in the
information technology and computer fields, to provide balance against the research company
Introduction / Summary Chapter Page 25 of 187

focus of this study. There may also be a chance to incorporate the SRP PRT system into the
next VTA transit forecast, by adding this PRT alignment to VTA's model.
A planning study should determine a PRT system alignment, explore urban design issues as
well as "pedestrian-ization," and enhance the understanding of SRP system economics covered in
the Economics Appendix. The alignment should include input from SRP employers and
neighborhood associations. The urban design issues associated with placing PRT near the
California Avenue retail area should be studied. Issues of how to landscape SRP to allow
workers to reach neighboring corporate campuses from PRT stations should be explored. More
refined quantification of increased employee retention, advertising revenue, and retail sales
should be undertaken. Reduced utility placement costs should also be quantified. Once the
economics are understood, power players should form a consensus as to how the system should
be funded.
Last, a design competition should be held to select a PRT vendor. [Cities21] The competition
should narrow the selections down to a handful of vendors and then independently analyze each
system. The European Parliament's Research Directorate's PRT vendor comparison study may
be useful in reducing the cost of the analysis. BART's upcoming Group Rapid Transit
Investigative Study has shown an inexpensive method whereby consultants review cost data and
structural/seismic designs from vendors.
REFERENCES
[Andréasson] Andréasson, Ingmar. PRT, a suitable transport system for urban areas in
Sweden? KFB-rapport, Volume 38. Swedish Transport and Communications Research
Board. 1998.
[CamSys] Technical Memorandum #3, Market Analysis, Prepared for San Mateo County
Transit District by Cambridge Systematics, December, 2002.
[Calthorpe] The Next American Metropolis. Ecology, Community, and the American
Dream. Peter Calthorpe, Princeton Architectural Press, 1993.
Introduction / Summary Chapter Page 26 of 187

[CH2M HILL] “Promoting reduced private car dependency under conditions of sprawl: a
pragmatic strategy for the near term,” E. Granzow, James Schmidt, J. Cooper, T. Ryley,
and A. Smith. Presentation at the 80th Annual Meeting of the Transportation Research
Board, Washington, DC, 7-11 January 2001. I also spoke by phone with Schmidt.
[Cities21] Page Mill Corridor Commuter-centric Transformation, Preliminary Concept
Proposal, 1/29/01, Steve Raney. http://www.cities21.org/pageMillTransformation.pdf.
[Edge City] Edge City: Life on the New Frontier (1991), by Joel Garreau.
[FSM] Pictures of the full scale model can be found at:
http://www.cities21.org/PRTmodel/UCTC.htm. FSM assembly instructions (by Rob
Means) can be found at: http://www.electric-bikes.com/FSM-asm.htm.
[HR Magazine] 2001 Career Builder Survey, October 2001.
[Irving] Irving, Jack H. Fundamentals of Personal Rapid Transit. Lexington Books,
Lexington, MA, 1978.
[Mobility] New Mobility: Using Technology and Partnerships To Create More Efficient,
Equitable, and Environmentally Sound Transportation. Deborah Salon, Daniel Sperling,
Susan Shaheen, Daniel Sturges, Institute of Transportation Studies, University of
California, Davis.http://database.path.berkeley.edu/imr/papers/UCD-ITS-RR-99-1.pdf .
[Navin] Navin, Francis. Time Costs in Personal Rapid Transit. In J.E. Anderson, et al.
Personal Rapid Transit II., University of Minnesota, Minneapolis, MN, 1974.
[PRT] 1) PRT technology overview:
http://www.ceworld.org/ceworld/Presentations/TransportationInfrastructure/Schneider.cfm , 2) The FAQ
is very helpful: http://www.taxi2000.com/.
[RANEY] Privacy-Protecting Commute Shed Study, Steve Raney, TRB Conference
Proceedings 2003. Web link: http://www.cities21.org/CommuteShed_TRB_111502.doc .
[RIDES] Rides for Bay Area Commuters – 2002 Commute Profile.
http://www.rides.org/main/commuteprofile_2002.htm
[Round] Future Ride: Adapting New Technologies to Paratransit in the United States,
UCTC Working Paper #306. Alfred Round, Robert Cervero. University of California
Transportation Center, Berkeley, CA 94720.
[Schneider] Describing and Illustrating the Extended Transit-Oriented Development (E-
TOD) Concept, Jerry Scheider: http://faculty.washington.edu/jbs/itrans/e-tod.htm .
Introduction / Summary Chapter Page 27 of 187

[Shaheen] Dynamics in behavioral adaptation to a transportation innovation : a case study
of Carlink--a smart carsharing system, by Susan A. Shaheen, 1999.
[Shaheen Meeting] From meetings with Susan Shaheen, February 4, 2003 and January 8,
2002.
[Shoup] Donald C. Shoup, Evaluating the Effects of Cashing Out Employer-Paid
Parking: Eight Case Studies, Transport Policy 4 (October 1997): 201-16.
http://www.sppsr.ucla.edu//dup/people/faculty/Shoup%20Pub%201.pdf .
[Tegner] Personal Automated Transit for King's Curve, Sweden. A PRT system
evaluation with the EDICT project. Goren Tegnér, Ingmar Andréasson.
[TTI] Texas Transportation Institute's 2002 Urban Mobility Survey:
http://mobility.tamu.edu/ums/study/front_and_back/big_picture.stm
[Value Added] "Transit's Value-Added: Effects of Light and Commuter Rail Services on
Commercial Land Values", Robert Cervero and Michael Duncan, prepared for ULI, July
2001: http://www.rtd-denver.com/Projects/TOD/Rail_Transits_Added_Value.pdf . A
similar paper was also presented as a Transportation Research Board paper in January
2002. Analysis of 1200 land sales of commercial, retail, and office space. Average
value per square foot was $17 in 1998/1999. Premium for being within a 1/4 mile of a
Caltrain station and a mixed use / central business district was $25. Impact of being near
light rail was only $4.
[Warren] THE URBAN OASIS: Guideways and Greenways in the Human Environment,
Roxanne Warren, 1997, McGraw-Hill. Reviews and information about the book can be
found at: http://faculty.washington.edu/~jbs/itrans/oasis.htm .
[Y.B. Yim] “Smart Buses and Shuttles Enable New Transit Connections,” U.C. Berkeley
ITS Review Online, http://www.its.berkeley.edu/publications/ITSReviewonline/december2002/smarttransit.html . See
also "Integrated Smart Feeder/Shuttle Bus Service, Avishi Ceder and Y.B. Yim, TRB
2003 Conference Proceedings.
Introduction / Summary Chapter Page 28 of 187

Introduction / Summary Chapter Page 29 of 187

Interviews Chapter
Commute Attitudes
Before interviews were undertaken, a literature review was conducted to provide baseline
understanding of commute issues. Carpool psychology literature reveals a large number of
complex factors to overcome to reduce driving alone. Each person will have a different set of
relevant factors with a different importance attached to each. Thus “high touch” (personal)
solutions are required that address an individual’s specific context. Each SOV commuter that is
a candidate for commute alternatives can be imagined as presenting a prioritized list of
objections to overcome. Bonnano found the following to be important: confidence in the driver
(some drivers only feel safe when they drive), ability to use travel time in productive activities,
percent of time carpooler has to drive (driving load), in-vehicle comfort, and cell phoning in car
(disruptive to other passengers). The U.S. Census found: “Many candidates will have
reservations about participating in carpooling if they feel themselves in danger of becoming
committed to a carpool with objectionable fellow-riders.” In addition, issues include riding with
the opposite sex, riding with someone of different socioeconomic class, messy people,
irreconcilable political differences, type of radio music, and preference to open/close the
window.
Voorhees found that psychological profiles of carpoolers were statistically significant. Hard-
core non-carpoolers object to relying on others and having others rely on them. They have a
high psychological need for independence. Attanucci found impersonal ridematching programs,
matching total strangers, are destined to fail. The great majority of existing carpools are formed
among coworkers who work in the same building. Only a large individual employer can offer
meaningful, efficient, and responsive carpooling support services. Bonsall found “The reduced
personal flexibility associated with organized ride-sharing schemes makes them an unattractive
option to all but a minority of commuters.” Wood found “For short journeys (< 5 km) the
inconvenience of carpooling is greater than the savings. A diversion of 1 km to pick up a
passenger was perceived to be about as undesirable as driving an extra 5 km.”
Interviews Chapter Page 30 of 187
Shaheen found 53% of bay area commuters don’t like their commute mode and 50% find using a
car is aggravating, implying that commuters are ready for a competitive solution. Shaheen has
also found that giving up the personal trunk storage space in a car was important. [Car sharing]
Analysis of affluent technology workers has not been emphasized in commuter behavior
literature. The cushy, cocoon-like tech worker drive alone experience in a fine German sedan
provides many pleasant subtleties such as status, "quiet time," leather seat smell, lumbar
adjustment, stereo system quality, hands free cell phone, and large trunk storage space. The
pleasant experience makes it that much harder to entice these workers into alternatives.
One common Silicon Valley dinner party topic has never been reported, the concept of the "time
stamp." Competitive workers strive to show proof of being the first worker to start and the last
worker to stop every day. The macho urge to sacrifice personal life for company results in no
end of gamesmanship. Thus commute alternatives must provide a way to earn early and late
time stamps.
Interviews: Methodology
"Round I" of the interviews began with seven hour-long interviews with commute alternative
takers, conducted November 15-16, 2002. Commuting details and attitudes were elicited, then a
PRT-based commute alternative was proposed. Detailed reactions to morning, mid-day, and
evening trip making were recorded. The first round emphasized commute problems with some
exploration of new mobility solutions.
Each one-hour interview was scripted to follow an interview guide. In appreciation for their
participation, interviewees received two free lunches at their cafeteria – sufficient to ensure
cooperative participants, while insufficient to bias the answers. I found that conducting three or
Interviews Chapter Page 31 of 187

four interviews per day and then writing up the interviews was quite draining – five interviews
would have been too much.
The interviews (and later, the surveys) assumed a year 2008 commute landscape as follows: a)
Caltrain baby bullet is as fast as a car during peak hours, b) auto congestion back at Year 2000
levels, but not at the trendline for the nightmarish ABAG 2020 forecast, c) El Camino bus
preference service will be only 20% slower than equivalent auto trips, d) VTA will provide a
Foothill Expressway SRP commuter bus, e) No new HOV lanes, and f) California Avenue retail
expands to serve SRP needs better, de-generating some errands with new stores.
To remove some of my obvious bias from the interview process, I worked with a consumer
technology market researcher, Janis Hom, who helped to refine the interview guide and
conducted four of the interviews (I was present to probe, answer questions, and describe PRT).
Janis has conducted more than 300 such interviews in her career and has been brand manager for
6 out of 10 of the top selling children’s educational software titles. Janis brings a healthy
skepticism to PRT, questioning how it is possible to modify consumer behavior. She helped me
to refine my own interviewing technique, catching me in a "telling instead of listening" mode
where I was verbally suggesting what a participant should be thinking and then waiting for them
to nod their head in agreement.
Alternative takers understand the limitations of commute alternatives much better than drive
alone commuters, so we started with alternative commuters. From these customers, new mobility
solutions were designed to address their issues. I recorded and then took notes with my
interpretations; I didn't transcribe word for word.
The second round of interviews was conducted March 25-26, 2003 with six drive alone
commuters. This round served as a practice run for the upcoming survey research (with a less
elaborate protocol), eliciting reactions to new mobility solutions to commute problems.
Interviews Chapter Page 32 of 187
The commute alternative issues arising from Round I informed the interviews in Round II.
Many drive alone commuters do not know about all the problems they will face in trying
alternatives, only hardened veterans know these things.
Interview Subjects
For the Round I interviews, seven subjects had research-oriented jobs with a company given the
simple alias "Research1." Research1 has somewhat more predictable commute hours than is
typically assumed for Silicon Valley companies. Participants were selected by Research1's
Human Resources Department. Selection criteria was a long commute via a commute
alternative, so subjects were selected based one Human Resources staff member's informal
knowledge of various employee's commuting patterns. Participation was voluntary; subjects
were given a short study description, including an explanation of PRT, so undertook the
interview with some foreknowledge. Research1 undertakes substantial research, so employees
are generally enthusiastic about participating in research. Research1's support for the interviews
was obtained through two meetings.
The seven Round I subjects were “BerkBART,” who commutes 50 miles from Berkeley via
BART and DB Express bus; “DanPool,” who commutes from Danville in a 3-person carpool,
“SJpool,” who carpools 22 miles with his wife from San Jose; “DubSOV” who drives 47 miles
alone from Dublin after peak traffic has subsided; “PleasPool,” who commutes 42 miles via early
morning 3-person carpool from Pleasanton; and “FreBus,” who commutes from Fremont by DB
Express bus; and "SFpool," who carpools 40 miles from San Francisco with one to two riders.
For the Round II interviews, the six subjects worked for a different company, Research2, with
similar characteristics to that of Research1. Research2's support was obtained through one
meeting combined with mention of Research1's participation. Research2's commute coordinator
selected employees based on his informal knowledge of employees and the provided criteria of
"short, drive-alone commutes."
Interviews Chapter Page 33 of 187

Mountain View participants were mtnSOV (6 miles), mtnSOV2 (4 miles), and mtnBike (2.5
miles), the later commuting via bike to work. Redwood City, Sunnyvale, and San Carlos
commuters were redSOV (9 miles), sunSOV (8 miles), and carlosSOV (10 miles).
Commute Issues
The interviews provided a rich set of findings, supported with concrete details that assist in
understanding. Many of the interview findings led directly to survey questions. In the sections
below, curly braces, {}, link findings to questions.
As SJpool points out, commute alternatives entail a significant lifestyle choice, coupled with a
high degree of patience.
Higher priority issues
Having productive time is more important for tech workers than the general population. Says
DubSOV:
“Productive time is key. First let’s define levels of productive time. A) I get paid to invent
things, to solve problems. So my most productive time is thinking time, when I might jot
some things down on a paper pad. B) next is high bandwidth e-mail time where I might be
writing a long e-mail or working on a document, C) next is checking voice mail and e-mail
without answering back. D) talking on the phone might be as productive as #B, but my cell
connection is usually so noisy that it’s hard to have a productive conversation. In my SOV
commute, I do #C, so I don’t actually have super productive time when I’m driving.”
DubSOV’s productivity maximizing commute would be via A) a complete Bay Area PRT
network providing direct home to work service with no transfers or B) a self-driving automatic
car. BerkBART and DubSOV are willing to undergo a slower but more productive alternative
compared to SOV. For some, this is a real trade-off. The repeated catchphrase that indicates
productive time is “time goes fast.” {Survey questions #7, 28, 37}
Interviews Chapter Page 34 of 187

Sleep (or just relaxing with eyes closed) counts as productive time for DanPool, DubSOV,
PleasPool, and FrePool. Note that sleeping on transit like BART, where your stop is not the last
on the line, has a slight stress component as people are anxious about sleeping through their stop.
On express buses, the culture tends to be supportive to the point where people look out for each
other. But PleasPool only feels safe sleeping in a carpool, not on the bus. {Survey questions #7,
28, 37}
Transfers are problematic. Says BerkBART: “When I’m on the train or bus, I’m not aware of
time passing. When I’m transferring, I’m very aware of time. It’s a nonlinear time function for
me. I hate to wait, just like everyone else. I’ll optimize away from train to bus transfers.”
Transfer time is low productivity time. Says PleasPool, “The bus is not as flexible. A carpool
waits 5 minutes for you, the bus won’t. The bus introduces stress in making a connection.”
{Contrasting PRT shuttle benefits emphasized in pre-survey education and in survey page 1}
Shuttle buses are loathed. The two main feeder services serving SRP are the Deer Creek
Shuttle and VTA Bus Route # 88. Neither of these services is anywhere close to serving the
stated needs of SRP commuters. The two bus shuttles represent two of the largest obstacles to
reducing drive alone commutes. While raving about the friendly and accommodating bus
drivers, participants complain about time penalty, infrequent schedule, ride quality, exhaust
fumes, cost, and noisy students. Another potential complaint that didn't arise but may be lurking
under the surface is the annoyance of squeaks/rattles. {Contrasting PRT shuttle benefits
emphasized in pre-survey education and in survey page 1}
Time penalty: MtnBike complains about the time it takes to travel the last mile from the
Caltrain station. The wait for the shuttle is too long and then the trip is too long. Says
CarlosSOV, "It takes as long to get from the Caltrain station to my office via Deer Creek
Shuttle as it does to get from San Carlos to the Caltrain station."
Infrequent schedule: CarlosSOV has only a few times a day when she can take a bus
shuttle to Caltrain. Caltrain runs much more frequently than do the shuttles, making it
hard for CarlosSOV to make the connection, especially when leaving early. Conversely,
the "always available" PRT shuttle is very enabling to her.
Interviews Chapter Page 35 of 187
Ride quality & exhaust fumes: CarlosSOV: "Deer Creek Shuttle is worse than Line 88
for both exhaust and for ride quality. The exhaust is really bad, I get dizzy. Deer Creek
buses have worse suspension. Line 88 takes fewer turns because it is bigger."
Cost: Given the low frequency and slow trip speed, CarlosSOV objects to paying the
$1.40 one-way Line 88 cost.
Noisy students: SunSOV complains that high school kids crowd the Line 88 bus,
leaving little for commuters and creating a "zoo-like" atmosphere.
Squeaks/rattles: The rattling of shuttle buses increase my stress level, and I don't think
I'm the only one who feels this way. Compared to driving in a well-made sedan, shuttles
are poorly constructed.
At another major Bay Area suburban job center, Bishop Ranch, a lunchtime 15-passenger shuttle
bus for transporting workers to the adjacent shopping center was halted due to poor ridership. In
1995, the shuttle carried only 420 passengers per month, requiring a subsidy of $10 per trip. In
addition, Walnut Creek's Route 104 was also cited as a shuttle that was intended to bring office
workers to downtown retail, but had failed. Lunchtime service was cut back to 40-minute
headways. [Adaptive Transit] Workers place a very high value on their lunchtime "free time," so
waiting for a shuttle bus that then makes additional stops is not something that tech workers will
abide.
The rare, truly horrible commute experiences, such as "4 hours to go 9 miles," live in the
memories of commuters for the rest of their lives, coloring their attitudes. It is hard to overstate
the damage such anomalous commutes cause. When commute alternatives work, you don't have
to think about them. {Survey questions #15, 25, 34}
I had a nightmare commute yesterday. I missed the Line 88 bus and it took forever to
recover. I was attempting to leave early to make it home for my daughter's softball game,
so it was very important to me to get home. I called the SamTrans (transit agency) 800
number and they were helpful. They suggested a bus for me to take. But, it went by on
the neighboring street without my knowing it. The bus route map for that line shows two
different routes that it takes, and I guessed wrong. I finally caught the next bus. I figured
that Redwood City was a transit hub, so I got off there to make a bus connection home.
Interviews Chapter Page 36 of 187
But that stop actually had very few connections. The commute ended up taking from 2:30
to 6:30, and I missed the softball game. Knowing that I missed buses and made bad
decisions just ate at me as the hours went by. I was angry, stressed, and frustrated. –
CarlosSOV.
Motion sickness was a concern for 4 out of 7 Round I people, with bus travel contributing to a
far higher level than carpooling. Where reading is limited, productivity is reduced. Two
mentioned pleasure reading as counting as productive time. {Survey question #31}
Stress is a major issue for DubSOV, BerkBART, PleasPool, and FreBus. Adding carpool
members can reduce driving load, which two believe reduces stress. “I hate to drive. It is
unnerving. I hate tailgaters,” – BerkBART. {Survey question #7, 28, 37}
“Stop and go traffic is frustrating. I’d rather take a longer route for a smooth ride. A major
benefit of HOV lanes for me is eliminating stop and go driving. The big thing is that reduced
stress puts ‘fewer miles on me.’ Stress savings is the big thing. Driving alone was rough. I
got to work and didn’t feel ready to work. When I got home after my SOV commute, I was
exhausted. I’ll never drive by myself again.” – PleasPool.
Cost. DubSOV compares out of pocket expense and finds SOV is much cheaper than transit: $5
in SOV gas per day versus $15 for a BART/bus commute. In contrast, economists calculate a
$32.90 SOV cost, at $0.35/mile fully depreciated cost over 94 miles. Alternately, three others
find compelling carpool cost savings: “Carpooling means less wear and tear on my car,” -
DanPool. “I mostly carpool to reduce gas and toll charges,” – SFpool. {See the section entitled
Survey Criticisms}
Time-savings – DanPool saves no time carpooling vs. SOV in the AM, and 15-20 minutes in the
evening. SJpool rejected a bus alternative because it added 30 minutes per direction. {See the
sections entitled Train Time Advantage and Carpool Time Advantage}
Compatible carpool mates. Whereas carpooling ride matching may be more of a mixed bag
across the Bay Area, our interviewees repeatedly described a homogenous, professional group of
Interviews Chapter Page 37 of 187

people within the research park who were all superficially compatible. Thus SRP seems to have
an advantage in forming carpools. (DanPool and SJpool). {Survey question #12, 13}
SFpool, a female who carpools with co-workers, indicates compatibility can be complex:
“I don’t know if I’d carpool with strangers. I’m looking for people who are close to my
age, not irritating, live within 5 minutes of my house, provide parking at their house.
Someone I feel comfortable with – not a CEO where I’d have to be ‘on’ first thing in the
AM. I wouldn’t feel comfortable alone with a strange male in the car. A capability to
anonymously screen people with a photo and description could assist my selection. I’d
seek out 20-something women.”
SJpool reinforces the gender-based safety issue, stating that males are OK alone with strangers
where females are not. A stranger carpool of 2 men and 1 woman can still work. In contrast,
PleasPool is quite willing to carpool with strangers and indicated that she would not search
through personal information to select carpoolers, even if it was provided. {Survey question
#13}
MtnSOV explained compatibility as follows, “If you provide a carpool member who is
dependable, reliable, and compatible, then I’ll carpool. The social aspect is important."
Relying on others and having others rely on them. Says BerkBART: “Regarding Vanpools. It is
hard to meet at a certain time. I’ve heard that it is a hassle. You’re hostage to schedule’s of
others.” DubSOV had same issues, “I wouldn’t want to be part of a group and have the group
depend on me.” {Survey question #15, 16}
Fear of being stranded at work at night. The need for an emergency ride home is uniformly
rare. Stranding came up only once in six years for one person. Research1’s emergency ride
home program is used only two or three times per month by all 1,000 Research1 employees
(SJpool). Though it occurs rarely, the associated anxiety is real, large, and lurking in the
subconscious. Being stranded is perceived as creating a slow, problematic commute home –
there is a penalty associated with missing the normal commute. Where a “solid” alternative
exists, anxiety is lessened. {Survey question #51, 52}
Interviews Chapter Page 38 of 187

A major challenge is serving evening activities in the origination cities. If, instead, activities are
captured within SRP or if commuters can connect to their auto in their home city before starting
their journey to their activity, then there is no problem. But, where the first evening destination
is an activity that is a half-mile or more away from home, then commuting alone to work
provides a car to access both the activity and home. Once the evening activity is over, tired
commuters need to get home from the activity as fast as by car, and "non-PRT" suburbs have no
alternative to satisfy this need. RedSOV brought out this challenge for his scheduled large-
group athletic activity. {Survey question #54}
Compounding RedSOV's evening activity problem, he requires personal storage of a large
equipment duffle bag that cannot easily be transported via commute alternatives. {Survey
questions 57, 58}
Medium priority items
Convenience of carpool drop-offs and pickups. DanPool: “Now that we have a carpool of 3
and we’re looking for a 4th, we’re looking for a convenient drop-off location close to the two
companies.” SFpool: “Members living close to my house are more desirable.” {Survey
questions #9, 10}
Forced socializing in a carpool. DubSOV indicates he seeks a solitary commute to stew in his
own thoughts. For him, SOV or anonymous public transit works well. An objection to
carpooling is obligatory chit-chat in the car, which undercuts productive time. “Carpooling
creates a social expectation that public transit doesn’t.” For San Francisco Bay Bridge "casual
carpooling," the default social protocol is no socializing. [Casual Carpooling] As a variation on this
theme, SFpool had one carpooler who gabbed so much that she had to tell him to zip it. {Survey
question #3, 4}
Carpooling environment: a) radio station selection, b) politics. “I prefer no political talk
because we have differing views. We are different ages. I prefer superficial chit-chat and that’s
Interviews Chapter Page 39 of 187

it. When we listened to news and talked about what they were saying, that didn’t work well.” -
PleasPool. , c) safe driving – DanPool’s had to gently “fire” a person who had one too many
near-accidents, d) comfortable car – more space is better. {Survey question #12, 13}
Finding a seat in transit. This ends up being a comfort issue. {Survey question #21}
Concerns that PRT will not deliver as well as promised. Vehicles won’t be waiting at the
station, resulting in waiting time. The PRT system might have insufficient capacity. {We
attempted to "reassure away" this doubts with pre-survey education and survey page 1. Our
attempt was to exclude issues of technical feasibility from this study, focusing on commuter
travel demand.}
Carpool meeting spots. Having a safe, reliable, no-tow lot is important says PleasPool. One
possible win-win solution is designating normally surplus parking spaces at shopping centers for
carpools. Malls could provide parking permits and surveillance in exchange for a promise from
carpoolers to vacate the spaces on peak holiday shopping days.
Carpool critical mass. Having four members provides access to HOV-2 lanes when two
members are out. (DanPool)
Private, personal time alone is very necessary for some. RedSOV spends time driving alone
talking to himself. "I talk about what I’m working on and about what I have to do. Mentally
changing states from working to not working is a big deal for me. I mull over work for five
minutes on the way home, then I eventually have to change my mental state and get mentally
prepared to exercise." {Survey question #6, 27, 36}
Commute Observations
People with long commutes do NOT endure stop and go SOV commutes during peak hours.
They almost always find some method of avoidance. The pain point varies by person. So, the
folks who are undergoing stop and go during peak are traveling shorter distances. Says
Interviews Chapter Page 40 of 187
DubSOV, “I shift my work schedule to avoid the AM peak. I depart at 9:30 AM after the HOV
lanes open up. I also telecommute two or three days per week.” Says PleasPool, “All East Bay
folks commuting to Palo Alto seem to carpool. I know 10 people who carpool or use some other
commute alternative. The one person I know who drives alone avoids peak hour traffic. One
couple even carpools to San Jose, then the one remaining person drives alone to SRP.”
The convenience retail in the California Avenue area of SRP is not a popular destination for
participants and parking is a hassle. Says DanPool: “Research1 is somewhat of an island. I
don’t get out much for lunch, so I can’t come up with very creative restaurant suggestions when
a visitor comes to work.” Adds PleasPool: “With the parking problems at CA Ave, even if I had
my car, I’d take PRT so I wouldn’t have to search around for parking spaces. Saving myself that
stress is good.” MtnBike concurs, "If PRT was available, my routine would change a bit. I’d go
out to lunch with friends. Parking is a hassle at California Avenue." Given PRT, participants
usually indicated a greater willingness to frequent this area for lunch, and some indicated they
would also partake of light grocery shopping at the market by the Caltrain station on their way
home. {Survey question #52}
Convenient at-work services such as fresh produce, dry cleaning, photo processing, shoe repair,
and eyeglass repair did not score highly. These services may need to evolve to maximize their
potential. Says SunSOV, "The old dry cleaning delivery service was bad and expensive. I
haven’t tried purpletie.com yet, using a dry cleaner in Sunnyvale is more convenient." But,
delivery services such as fresh flowers, film processing, produce, greeting cards, drugstore
staples, and groceries were of interest to her. A conversation with the owner of a Palo Alto dry
cleaning facility provided some insight. The dry cleaning business is based on trust that builds
over time and builds faster with face-to-face contact. Once trust builds up, customers provide
expensive, higher profit garments to be cleaned. {Survey question #52}
There is a rough order of transit preference with Caltrain the most desired, BART the next
most, and express bus following. This was roughly true for all. Says BerkBART: “the DB
Express is pretty fast, so Caltrain probably couldn’t be any faster, but Caltrain is more civilized.”
One of the main preference factors is that Caltrain is more conducive to productive time.
Interviews Chapter Page 41 of 187

“Caltrain is better than BART for reading and editing documents because of higher seats. With
BART, people can be a little noisy. Caltrain has more professional people. People in suits.” -
BerkBART. {Survey question #21}
Commute conclusions:
Provided that a large list of requirements are satisfied, people WILL carpool short
distances (six miles, for instance). A carpool commute between two neighbors living 10
blocks away (proximity made possible by PRT), utilizing PRT for the last mile and mid-
day trips, utilizing TrakRide to eliminate uncertainty, and exploiting MatchRide to form a
compatible match, makes short carpools workable.
Somewhat surprisingly, people WILL undertake short multimodal transit commutes
featuring a single stop, three-minute Caltrain ride (provided PRT then takes them to
work). MtnBike was one such person. This market was previously restricted because of
slow bus shuttle service.
Soccer moms are renowned for needing to drive alone because of their varied schedules
and complex trip chaining. Surprisingly, our Round 2 soccer mom loved her hypothetical
alternative, commenting that it improved her quality of life. CarlosSOV chose to
commute via Caltrain + PRT five times per week. She would save 20 minutes each way
by avoiding the Deer Creek shuttle and associated transfer time. Timing-wise, this
speedup eliminated time periods where her daughter was home alone, providing a large
family benefit. On days when CarlosSOV needs to cart her daughter around in, she'll
park and ride at the San Carlos Caltrain station to have immediate access to a car upon
arrival. CarlosSOV loves to read and the Caltrain commute provides precious minutes of
reading time.
Round 2 participants were currently commuting 7 times out of 30 daily commutes per
week using commute alternatives. When provided with a PRT+D2D based alternative,
participants stated they would take commute alternatives 24 times out of 30 per week.
This represented a drive alone decrease from 77% to 20%. This small sample raised
our expectations for a large drive alone decrease from the surveys. For Round 2
Interviews Chapter Page 42 of 187

participants, PRT+D2D alternatives were slower than driving alone, but never by more
than 100%. Participants had explored transit alternatives in the past, but these were
always more than 100% slower, sometimes 250% slower. Thus transit options without
PRT were not competitive. The increased competitiveness of PRT+D2D alternatives
made the difference.
Interview Finding Validation.
I met with Susan Shaheen on 2/4/03 and received partial validation on the study approach and
encouragement about some of the proposed solutions to commute issues. In the next chapter, on
new mobility, I will highlight places where Shaheen weighed in with an opinion.
Cambridge Systematics Methodology [CamSys]
I also met with Principal Chris Wornum of consulting firm Cambridge Systematics (CamSys) on
April 24, 2003 and received additional partial validation. CamSys has prepared market analyses
for San Diego and Santa Clara County's northern neighbor, San Mateo County. Our approach
had much in common with the attitudinally-based market research employed CamSys. Wornum
endorsed our emphasis on solving the last mile problem and commented, "I'm much less
skeptical about the ridership potential of PRT for these types of applications than I used to be."
Because CamSys could most easily work with (and improve upon) our methodology for a
follow-on PRT+D2D study, it is worthwhile to comment on their approach. CamSys applies
advanced market research / product positioning techniques to transportation mode choice
modeling. Their mode choice model comprehends both traditional socioeconomic measure as
well as attitudinal variables.
They first compile a detailed profile of the needs and wants of auto and transit users via surveys.
Mode choice is revealed from respondent selections between modal alternatives for actual trips
Interviews Chapter Page 43 of 187

taken by each individual. In their San Diego strategic plan, for example, they collected 750
surveys. They measure traveler attitudes based on "zero to ten" ratings of statements such as:
I would change my form of travel to get more productive time
I don’t mind traveling with people who are different than me
I don’t mind if the train or bus runs behind schedule
I need to have flexibility to make trips during the day
I would switch modes if it would help the environment
These questions are then factored into 8 attitudinal dimensions: flexibility/speed, sensitivity to
personal travel experience, safety, environmental concerns, cost, crowds, and stress.
From the attitudinal profiles, they group travelers in market segments containing similar mode
choice characteristics:
Road Runners – the most demanding travelers.
Cautious Runabouts – high safety concern
Intrepid Trekkers – dominated by male full-time workers, need flexibility and speed.
Flexible Flyers – lower income part-time 30-something workers less sensitive to their
travel experience.
Conventional Cruisers – students and others who are sensitive to their personal travel
experience
Easy-Goers – low income, least demanding travelers, most transit dependent. Seniors
and students.
CamSys then creates a fine-grained geographic distribution of these market segments, enabling
the predicted impact of transit improvement investments in specific locations.
As far as CamSys forecasting PRT+D2D demand, their model has never been validated on
commute alternatives with the highly competitive characteristics we provide and our alternatives
may have some unique attitudinal characteristics that should be added.
REFERENCES
Interviews Chapter Page 44 of 187

[Adaptive Transit] Adaptive Transit: Enhancing Suburban Transit Services. Robert
Cervero, John Beutler. UCTC Working Paper #424. University of California
Transportation Center, Berkeley, CA 94720.
[Attanucci] Analysis of Carpooling Behavior and the Formultion of Carpool Incentive
Programs, Attanucci, 1974.
[Bonnano] Consumer Demand for Automated Private Travel: Extrapolations from
Vanpool User Experiences. Bonnano, Sperling, and Kurani. UCD-ITS-RR-93-22.
[Bonsall] Carpooling in the USA: A British Perspective. P.W. Bonsall, 1979.
[Caltrans] Caltrans 2001 Bay Area HOV Report: http://www.dot.ca.gov/dist4/d4hwops/01HOVReport/01HOV_intro.htm
[CamSys] a) San Diego MTDB Strategic Plan case study:
http://www.camsys.com/CaseStudies/San%20Diego/SanDiegoCaseStudy.htm , b)
TransitWorks, An Innovative strategy developed by the San Diego MTDB for increasing
the role public transportation plays in meetng our regions's mobility needs over the next
20 years, http://www.sdcommute.com/MPs/TransitFirst/PDFs/FinalReport.pdf , c)
samTrans San Mateo County Transit Market Analysis, Technical Memorandum #3, by
Cambridge Systematics, Summer 2003. d) meetings with Chris Wornum, Principal, June
18, 2002 and April 24, 2003.
[Casual Carpooling] “What are casual carpools?” - http://www.environmentaldefense.org/article.cfm?
ContentID=1363 , http://www.100megsfree4.com/farshores/ncpool.htm - “Carpooling Could Be Out-Of-This
World”, RIDES report on casual carpooling: http://www.rides.org/main/casualcarpool.99.pdf .
[CENSUS] Census Use Study and the County of Los Angeles present Carpool, an
approach to large-scale carpooling using DIME technology. 1974.
[Cervero Meeting] Various meetings over the past 2 1/2 years.
[Naisbitt] Megatrends.
[RIDES] Rides.org 2001 Bay Area Commute Survey.
[Shaheen] Dynamics in behavioral adaptation to a transportation innovation : a case study
of Carlink--a smart carsharing system, by Susan A. Shaheen, 1999.
[Shaheen Meeting] From meetings with Susan Shaheen, February 4, 2003 and January 8,
2002.
[Shoup] Shoup, Donald C.. Cashing out employer-paid parking : final report /, prepared
by Donald C. Shoup. Washington, DC : Federal Transit Administration, Office of
Interviews Chapter Page 45 of 187

Technical Assistance and Safety ; Springfield, Va. : Available through the National
Technical Information Service, [1992] 141, [9] p. : ill. ; 28 cm. AND Shoup, Donald
C.. Evaluating the effects of parking cash out : eight case studies /, prepared by Donald C.
Shoup. Berkeley : University of California Transportation Center, [1997] 1 v. (various
pagings) ; 28 cm. Series title: Working paper / University of California Transportation
Center ; no. 377, Working paper (University of California (System). Transportation
Center) ; no. 377.
[Voorhees] A Study of Techniques in to Increase Commuter Vehicle Occupancy on the
Hollywood Freeway, Final Report. Voorhees, 1974.
[Wood] Carpooling, Travel to Work at an Isolated Site. K. Wood, 1979.
Interviews Chapter Page 46 of 187
D2D New Mobility Chapter
As previously mentioned in the Introduction / Summary Chapter, D2D Mobility is our
hypothetical coalition / company - a "Transportation Management Association (TMA) on
steroids" with full support from the relevant power structure. The first third of this chapter
covers high touch (personal) D2D services, the last two-thirds covers high tech services.
D2D High Touch Features
TMA helps to provide supportive policy context
The TMA will be structured as a non-profit Transportation Management Association, comprised
of representatives of employers within the park. TMAs are formed when a group of employers
band together to manage transportation demand. In Emeryville, the 17 largest employers in the
city participate to run the Emeryville bus shuttle system. The city itself is also a member, with
the same stature as the other companies. Because of the employer membership, TMAs are
naturally more responsive to employees than public agencies. For the SRP TMA, Stanford and
Palo Alto also should have seats, with Stanford receiving special status. The TMA will oversee a
secure commuter database (Big Sister) and create an office park-wide culture supportive of
commute alternatives. As part of that culture, executives need to frequently use their bully pulpit
to encourage the effort. A TMA will increase cooperation and community building within SRP.
SFpool gives an example of her company providing a supportive culture on days when she was
a carpool passenger, “Sometimes I borrowed a carpool member’s car, other times I borrowed
from another person at my company. Some were friends, some were higher up in the org chart
than me. The company contributed to making these adjustments, but most companies probably
wouldn’t be as flexible or encouraging.”
Interviews Chapter Page 47 of 187

Customer Support: Your Guaranteed Backup
Currently, with commute alternatives, problematic and even nightmarish commutes occur.
Commuters are on their own to work their way out of such anomalous situations. Because of this
possibility, interviews indicated there is a lurking fear of being stuck in the middle of a trip. In
reaction to this concern, we made sure to define D2D customer phone support "as your
guaranteed backup" – terminology supplied by MtnSOV. So rather than the commuter being
responsible for resolving problematic situations, D2D promises to get commuters to their
destinations, serving as the last line of defense. In the surveys we attempted to state this
guarantee strongly to mitigate this concern. {Survey questions #16, 25, and 34}
From an implementation standpoint, when a commuter calls from a GPS-enabled D2D cell
phone, customer support will know the commuter's location and commuting preference profile.
For typical journey to/from work situations, the profile information will reveal the likely
destination of the commuter. With this contextual information, customer support will be able to
rapidly devise a strategy to help commuters reach their destination.
MtnSOV expressed the concern thusly, "Having others depend on me in the carpool is a concern.
What if my car breaks down (flat tire), and then what if carpool members lose their job because
my car dies? Having D2D step in and solve these problems is key." MtnSOV appreciated D2D
taking the responsibility off her shoulders.
As previously covered in the Interview Chapter, CarlosSOV had a nightmarish four-hour, nine-
mile commute. Not only will D2D eliminate her problem by suggesting the right bus to take, but
customer service can track the "pain level" of CarlosSOV and decide to escalate the solution (for
instance, ordering a taxi) after a certain number of unproductive minutes pass. Customer service
must understand that a single nightmarish commute risks losing CarlosSOV to driving alone
forever, making it cost-effective to solve the problem at any cost. Part of CarlosSOV's
nightmare was the stress of attempting to clumsily solve her own problems. Customer service
can readily ascertain optimal solutions and communicate this to CarlosSOV, eliminating her
Interviews Chapter Page 48 of 187

stressful uncertainty while increasing her confidence. D2D would haven gotten CarlosSOV to
her daughter's softball game, albeit a bit late.
Communications
Broadband at home. Every tech worker who needs to work at home has DSL or cable
modem, so there is nothing new to bring about. Companies appear to be financing home
laptops, but not monthly communications bills. Broadband is a crucial enabler, making
home office work as productive as office work, enabling commuters to leave work on a
regular schedule to take commute alternatives and then carry on with work at home.
DanPool: “If I didn’t have my home office setup, then I’d probably have some situations
where I’d have to miss my carpool, stay at work, and find a way home.”
To achieve maximum productivity on train/bus/carpool, some tech workers require
reliable wireless connectivity, the higher the bandwidth the better. Further details are
provided in the section entitled “Knowledge Base: Recommended Gadgets" below.
Cell phoning in transit or carpool is problematic. Internet Instant Messaging (IM), a
rapid-fire typed computer dialog between two or more people, is a more effective private
real-time two-way communications medium for within carpools and public transit. More
like a phone conversation than an e-mail, IM is more readily adoptable by 20-somethings
who don’t have entrenched e-mail habits for slowly typing thoughtful prose. IM
surpasses cell phoning because a) it does not annoy other passengers, b) it is impervious
to train hum, annoying chatter, and other noises that can disrupt cell phone calls, c)
varying cellular signal strength causes voice to cut in and out (DubSOV refuses cell
phoning for this reason). Says SFpool,
“I use IM more than phone. Having IM and e-mail during my commute would be
huge. This would be a fantastic capability for some of my co-workers as well. It
is rude to talk on the cell phone while carpooling. I need a laptop keyboard. A
Blackberry has a toy keyboard and I need accurate, rapid typing for IM."
Interviews Chapter Page 49 of 187

I had thought that “business class” train sections could be configured with noise dampened cell
phone booths, but IM seems like a far simpler solution. WiFi wireless networks inside trains
would be a big plus over cellular modems.
Commute Community {Survey questions #16, 25, and 34}
Neighborhood Commute Coordinators
Reducing drive alone commutes is a battle won one person at a time, addressing specific
individual objections. A network of volunteer neighborhood commute coordinators are
necessary to provide hand-holding, support, and local expertise to tech workers. For outlying
cities, one commute coordinator for each city is fine. For nearby cities with more SRP
commuters, a coordinator per zip code is necessary. The coordinators should have the following
attributes: highly persuasive, upbeat and encouraging, creative problem solver, a “green”
mentality, effective advocate, and good communication skills. They should serve as: A) the best
resource to go to for commute alternatives from their city to SRP and B) a collector and
prioritizer of local barriers to be overcome. Their most important service will be guiding tech
workers through the first two weeks of a commute alternative (akin to detox), providing follow-
up and encouragement. RIDES could train and oversee coordinators.
Susan Shaheen validated the idea that there are high first week barriers to switching away from
driving alone, and that assistance is required to get people through the transition. Shaheen's
variation entails providing a "mobility counselor / manager." Her drive clinic experience
convinced her that people do need lots of handholding to try a new mode, and they really need
someone to listen to their personal story during the handholding. Drive clinic participants often
began by feeling naturally resistant to car sharing, but the clinic showed how easy it is to use car
sharing, so participants were eventually won over. For commercial carsharing ventures, Shaheen
recommends two levels of handholding: a) provide a free one-week trial, and b) provide 800#
support with low wait time. [Shaheen Meeting]
Knowledge Base
Interviews Chapter Page 50 of 187
Another high-touch tactic creates a web-based commuting community for support,
information, and problem solving. For a drive alone tech worker to switch, that person needs to
become a commute problem-solving expert, which probably isn’t worth an individual’s time.
However, a web community can share expertise, reducing individuals' learning curves. Chat
forums based on city of residence and major knowledge areas will be provided, with
neighborhood coordinators monitoring. The knowledge base will efficiently address repetitive
issues related to comfort, gadgets, behavior, and local context. More details on this sub-service
are provided in a following section.
SunSOV agrees it is hard to become a commute expert and was enthusiastic about the commute
community, "It is hard to figure out VTA bus route 22 connections, and hard to find a commute
alternative that works well."
CarlosSOV believes the web chat community, "will be great! I can be anonymous and ask dumb
questions. It won’t be embarrassing. It isn’t personal. This is a big advantage. I'm already a
participant on a web gardening chat service."
The topics covered by the knowledge base address many interviewee commute issues raised in
the Interviews Chapter, related to comfort, productivity (via gadgets), and behavior.
Knowledge Base: Comfort
Bus & carpool motion sickness. Discuss alternative remedies besides Dramamine: wrist
bands, acupressure, diet, ginger, peppermint oil, etc.
Special shaped pillows for carpool passenger comfort.
Knowledge Base: Recommended Gadgets
Noise canceling headphones to cancel out BART vehicle hum and other techniques to
create a more private experience while participating in commute alternatives. (DubSOV)
Interviews Chapter Page 51 of 187
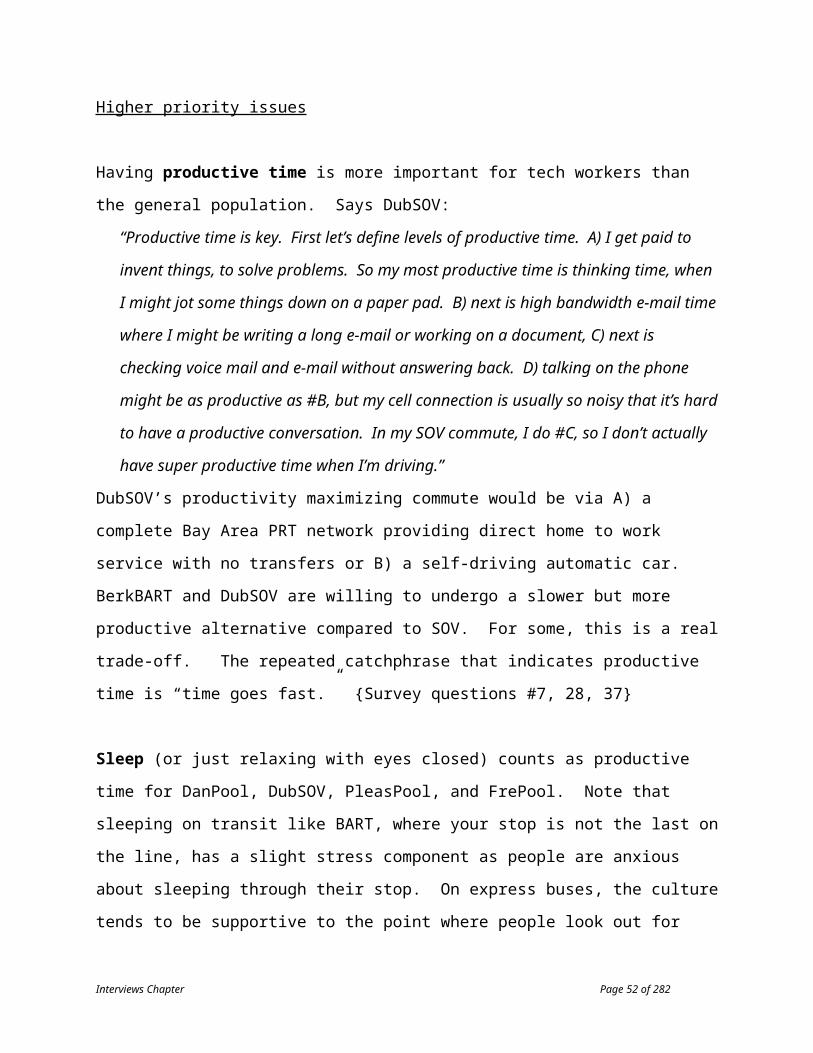
Improving cell phone reception. There are a number of independent wireless information
sites to partner with to provide this content: A) Handset signal enhancers. B) Rate wireless
carriers for the best coverage / signal strength for specific commutes. C) Advise corporate
facilities managers on in-building cellular base stations (Nextel places special emphasis on
indoor reception).
Laptop recommendations. Emphasis on laptops and configuration settings for rapid
hibernation, rapid wake-up, and improved battery life. (DubSOV)
Logitech Io pen remembers your scribbled notes and uploads these to your PC. Great for
jotting notes and transferring them. (DubSOV)
D2D would offer loaner solutions with an option to buy: MP3 players, etc. Gadget suppliers
would pay to advertise / join D2D.
Knowledge Base: Carpool Behavior / Rules of Etiquette
First time carpoolers should be provided with a “standard carpool protocol,” that they can
evolve with their carpool. The rules would be something like: “The default radio program,
unless otherwise specified, is the ‘Morning Edition’ news show on public radio. No open
windows without permission, no heavy perfume, no smoking, no cell phones. And no
running errands or stopping for gas once the passengers are in the car.” [Casual Carpooling]
A variation of the standard protocol is the “quiet protocol,” which emphasizes productive
time over chit-chat. There is already a precedent for silence in Bay Bridge casual
carpooling. A very important choice between standard and quiet could be made during
ridematching.
Carpool members should expect to become friendly acquaintances, not friends. Members
might possibly get together socially once per year so that spouses can meet. (DanPool)
"Cars should be kept in clean condition. Everyone should provide a packet of Kleenex and
wet wipes. Hand lotion is not required. Allowing pets in the car is a major issue." –
MtnSOV.
MatchRide: Improved Ridematching
Interviews Chapter Page 52 of 187

The RIDES matchmaking service provides too little information (and no personal information) to
make an informed decision. Better models are plentiful. Match.com, lavalife.com,
americansingles.com, heartclick.com, datemeister.com, and other web dating services provide
more rich textual detail combined with photos. For carpool matching, a facial photo and an auto
photo should be combined with a rich personal profile based on items in the Interviews Chapter.
These services allow prospects to anonymously reject bad matches without causing any hurt
feelings.
D2D High Technology Features
Wireless Commute AssistantBig Sister knows where & who you are
NextTrain
TrakRide for carpools
QuickCar, < 5 minutes
HomeSafe, SpyKids
NextSpace for parking
Wi-Fi
Customer support
Trip planning
Order a PRT vehicle
Shared parking entry, QuickCar key
Easy PRT ticketing
Improved indoor reception
GPS
We are in the midst of accelerating cell phone innovation. The July 2003 issue of Business 2.0
(business2.com), described cellular as the "Next Big Thing," the next technology likely to
produce the most jobs and innovation in the coming years. There are 1.2 billion cell phones,
one for every 5 people on the planet. By 2006, there will be 2.0 billion cell phones. One-third of
cell phone users upgrade to a new handset every year. High data bandwidth cellular technology
Interviews Chapter Page 53 of 187

is on the horizon, known respectively as "3G" and "4G." The latest handsets are adding personal
digital assistant features. Computing power is increasing, reaching ever closer to becoming a
"personal computer in your hand." New hardware such as GPS and WiFi is being added. In our
Year 2008 scenario, we believe the capabilities of the handset will enable improvements in the
commute alternative experience.
The applications in the diagram above are explained in subsequent sections. These are
preliminary specifications for applications that have not yet been developed, but appear to be
relatively straightforward to implement. The topmost applications (NextTrain - Order a PRT
Vehicle) rely on GPS technology. The bottommost applications (Shared Parking Entry -
Improved Indoor Reception) rely on WiFi. For details on Shared Parking Entry and NextSpace,
please see the Parking Appendix sections entitled "Parking Automation" and "Implementation."
A word of warning, everyone who has reviewed this material has been able to brainstorm new
cellular applications for PRT+D2D – the field appears to be wide open, with no end of features
in sight.
Big Sister Database
To best serve finicky tech workers, personal information databases must be created and
commuter whereabouts must be tracked (using cellular “geolocation” technology). DubSOV
reacted negatively to this tracking, saying it was reminiscent of “Big Brother.” So, regrettably,
we must define a new term to position this effort against Big Brother. Whereas in Orwell’s
book, “1984,” Big Brother tracked personal information to reduce personal liberty, “Big Sister,”
uses modern technology to preserve Mother Earth. Big Sister has a gentle hand, but knows when
to be nosy to be of assistance to commuters. Big Sister increases commuter safety with her
ability to verify that someone reached their destination, especially when a carpool with strangers
is involved. Associated databases and software applications must be designed to be both
interoperable and secure. Other respondents were enthusiastic about the tracking. SJpool: “a
service that tracks you would be fine.” As an aside, RIDES keeps no information on carpools
once they’re formed.
Interviews Chapter Page 54 of 187

Privacy Concerns
Privacy concerns abound for Big Sister. For protection, this service must be "opt-in" with
independently run data protection audits and a consent requirement for each new use of personal
data.
Cellular Location Based Services for Tracking
This section introduces cellular Location Based Services technology, which is used in most of
the high technology solutions in this chapter.
A Federal Communications Commission mandate has forced all cellular carriers to provide
emergency services that determine cell phone location. As part of fulfilling this "E-9-1-1"
requirement, carriers will make geolocation software interfaces available to application
providers. For D2D, this ability to track commuters enables some new solutions that allow
commute alternatives to better address the superior convenience and flexibility of driving alone.
The FCC mandates location accuracy of 150 meters for 95% of cell phone calls by 2003, with
further accuracy increases required by 2005.
Location is determined with trilateration algorithms where the handset collects and processes
signals from GPS satellites and/or cellular base stations. There are many techniques to
determine location, providing tradeoffs among important attributes. Key attributes include time
to first fix, availability, accuracy, cellular network bandwidth required, handset cost burden, and
base station cost burden, with the first four attributes carrying the most importance for tracking
applications and the later two having a strong impact on the rate of adoption. Time to first fix,
which measures the startup time to calculate the first position, should be small for tracking
applications where a commuter's position must be determined immediately after application
initialization. Some rudimentary GPS solutions require a large startup time, taking several
minutes to provide a position fix. Availability measures whether or not a location can be
Interviews Chapter Page 55 of 187

determined. Availability in indoor settings, where signal strength is lower, is important for
commuter tracking applications. Accuracy measures the distribution of calculated locations
against true locations. The distribution of positional errors in X and Y dimensions typically
comprises an elliptical pattern. For tracking applications, the relative accuracy amongst
successive fixes is important. Most cellular location solutions require new cellular handsets
featuring new chipsets and antennae.
GPS Problems
Basic GPS technology isn't well suited for cellular location based services. Aside from the
aforementioned problem with slow time to first fix, GPS requires unimpeded "line of sight"
access from satellites to the handset, creating problems when handsets are indoors in residential
areas and in urban downtowns with tall buildings (urban canyons).
Recent innovations have reduced the power consumption of GPS chipsets and improved the
processing power within the handset. Some former solutions had required raw GPS data
collected at the handset to be sent to a carrier's server for processing into longitude/latitude.
Because tracking applications request location frequently, high communications bandwidth
overhead cannot be tolerated.
Hybrid Assisted GPS
One of most promising techniques for tracking applications is called Hybrid Assisted
GPS/Cellular Ranging and is provided by Qualcomm's SnapTrack subsidiary. The solution
provides first position fix in a maximum of 12 seconds (1 second in a line of sight outdoor
environment). Availability is high within indoor settings. Accuracy is 30 meters indoors and 5
meters outdoors. A "location server" assists the handset's GPS calculation by sending
intermediate calculations to the handset, reducing the handset's required GPS signal strength and
processing power. Hybrid means the solution combines GPS and cellular base station
measurements to calculate location, further increasing accuracy and availability. Once an initial
Interviews Chapter Page 56 of 187

position fix is calculated, the handset is self-tracking and does not require location server
assistance. [SnapTrac] [A-GPS]
Slow Adoption
E 9-1-1 adoption in the U.S. has been very slow. One industry analyst predicts it will take
millions of dollars to implement, with limited payback. [Instat] As a result, carriers have asked for
extensions for meeting their deadlines. In Year 2003, it is very, very hard to find a carrier with a
desirable geolocation system and a working test area with which to prototype geolocation
applications. Some carriers have created partially functioning location servers that can be used
to verify the API protocol, but provide random positions. Carriers are regularly asking for
extensions to the Year 2003 requirements, and some are paying fines for non-compliance.
Software Development Issues
On Saturday, being Palo Alto resident, I found myself in a café, accidentally sitting next to four
wireless programmers from a company called pathbreaker.com. They filled me in as follows:
Some handset operating systems are still a bit primitive. Tracking applications require
multitasking to enable tracking as a background process. These limitations will disappear
with time.
Short Message Service (SMS) response time varies from carrier to carrier. T-Mobile is
very responsive, with only a 60 second lag from sending to receiving a message. Some
other carriers are quite slow, especially during peak time.
The standard location API is called GPS-1 and is pretty reasonable to work with.
Location apps are simple to program. The harder part is working with wireless carriers to
obtain external access to location data.
Better in-office reception
Interviews Chapter Page 57 of 187

The additional challenge in cellular geolocation tracking applications is that the cellular data
network must have high availability within business campuses, requiring small cellular base
stations to improve signal quality. Such base stations are readily available and used in offices
already, but they are not yet pervasive. Part of the motivation is to replace wired business
phones with cell phones.
Another approach to improving indoor cellular telephony uses WiFi enabled phones. These
phones switch from cellular to WiFi for voice/data communications within corporations with
specially configured WiFi networks. Cisco is promoting this solution.
TrakRide
Now that a description of Location Based Services has been provided, we can describe D2D
commute tracking applications. The first is the wireless carpool assistant, known as TrakRide.
TrackRide is a virtual (automated) carpool coordinator who helps make things run more
smoothly, reliably, and precisely while off-loading some time-consuming tasks. The assistant
provides two-way communication via cellular Short Message Service (SMS) and the Web.
Many features are implemented with single click operations.
Whereas current transportation tracking applications, such as those provided by NextBus, track
transit vehicles, TrakRide tracks individual people.
TrakRide requires an advanced cell phone with GPS and WiFi, something all cell phone users
should have by Year 2008. Interviewees explicitly rejected the idea of a putting TrakRide on a
personal digital assistant (PDA). DanPool explained, “Every two months there is an emergency
for the other two guys and the carpool has to be delayed 20 minutes. There is only an
intermittent need for proactive action, so don’t make me wear a new device like a wireless PDA
– use my existing cell phone.”
Benefits
Interviews Chapter Page 58 of 187

The main benefits provided are increased commute reliability, considerateness, safety, and time
utilization.
TrakRide serves as a "security blanket" for carpoolers, who typically encounter a major
carpooling problem every 2 months, and a minor irritant about once per week. Even with this
intermittent problem pattern, the assistant is always alert and immediately available to solve
problems and provide information when something goes wrong. A previously independent drive
alone commuter, who switches to carpooling, finds herself dependent on her carpool partners of
uncertain reliability. TrakRide removes this uncertainty, making the carpooling experience more
palatable to switchers. TrakRide provides a frequently updated graphical depiction of the status
of the partners, somewhat analogous to bus stop "time to next bus" displays.
In carpooling, being on time at the pickup spot is the considerate thing to do. TrakRide monitors
progress to the pickup spot, graphically highlighting laggards with red dots on-route. Thus,
positive and negative performance feedback is glaringly apparent, naturally generating increased
social pressure to be punctual. TrakRide also tracks performance over time and can tag laggards
for automatic reminders to get them going a few minutes early. Monthly performance tracking
can also be used to implement reward/punishment regimes, such as collecting $2 for each failure
from a laggard and transferring that money to the carpooling partners, rewarding them for
putting up with the laggard.
Without TrakRide, improving punctuality often requires personal confrontation. Some existing
carpools implement a "5 minutes late cut-off rule." In the morning, if a carpooler is 5 minutes
late to the rendezvous spot, other members leave without the laggard. TrakRide provides a
gentler method to encourage courteousness by providing a standardized, impersonal measuring
system.
In addition, TrakRide facilitates the considerate action of informing other members that the
carpool will be delayed a certain number of minutes. TrakRide reduces an individual's ability to
make up excuses for tardiness. Says DanPool, "I don't need a reminder to leave. Back when I
Interviews Chapter Page 59 of 187

first started carpooling, I beeped my watch 10 minutes before leaving. But now my internal
"commuting clock" is very reliable. I only need confirmation that others are moving reliably
towards the carpool meeting point. One of my carpool members needs special nudging about
once every 10 days."
Time utilization is an issue at the end of the workday, before the evening pickup. TrakRide will
also track the end of day race to the meeting point, which will require PRT shuttle trip tracking /
scheduling, like NextTrain. Says PleasPool, “Making things a little smoother would be great. If
I knew someone was running even a few minutes behind, and I’m in the middle of something,
then that few minutes would buy me enough time to finish what I’m doing, rather than thinking
‘Oh Gosh I have to shut down cause I don’t want someone to wait.’” The benefit is in knowing
exactly when to shut down and reducing stress in wondering whether everyone else is shutting
down.
MtnSOV asked for early/late notification. She felt there was no need to communicate when the
race to the meeting point is on-schedule. She felt the ability to make the most of the last three
minutes of the day was a useful service, but not a major requirement.
A rough TrakRide "value-of-time" analysis for tech workers follows. Workers value their time
at 100% of their salary during work, 50% during commute, 200% during lunchtime. "Uncertain"
time consists of waiting for a commute alternative connection without knowing exactly when or
if it will arrive. Time appears to pass three times slower during uncertainty. For a $50/hour tech
worker, it is important to know, "May I finish the last e-mail of at the end of the day before my
carpool leaves?" Amassing three minutes of additional productive e-mail time every three
working days, works out to roughly 100 days * 3 minutes = 300 minutes = 5 hours. 5 hours at
$50/hour = $250 per year. Likewise, it is important to know "Will my morning carpool
rendezvous be on time?" If the worker undergoes two minutes of uncertain waiting time, this
seems like six regular commuting minutes. TrakRide eliminates this uncertainty, converting
what seems to be a six minute wait back to a two-minute wait under certainty. Saving four
commute-time minutes per day computes to 4 minutes per day * 250 work days per year = 1,000
minutes per year. 1,000 minutes * $25/hour commute time value = $416 per year.
Interviews Chapter Page 60 of 187
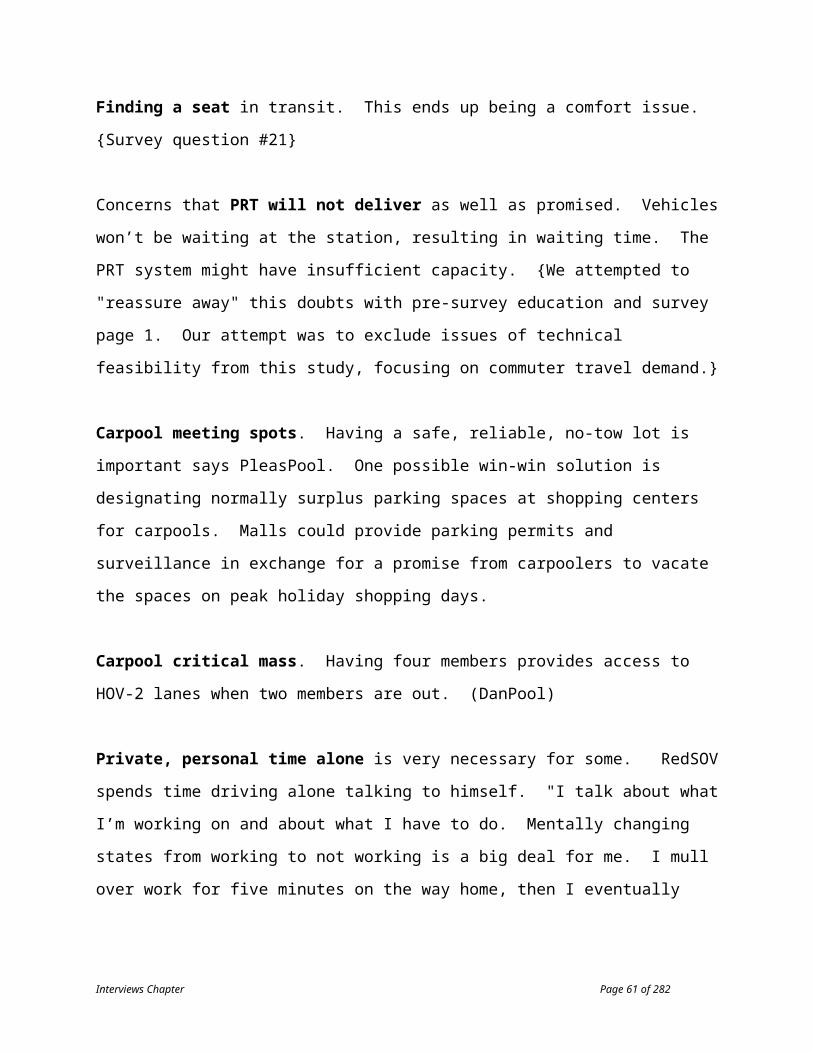
On-route commuter tracking: How it works
Let's take for example a three-person (A, B, and C) carpool with a one-way travel distance of
about 30 miles. For the morning pickup, all three drive alone to a shopping center parking lot
and then carpool from there. A, B, and C are in a daily race against time to get to the meeting
point on time. Person A drives 10 minutes to the shopping center, B drives 7 minutes, and C
drives 3 minutes. Scheduled pickup time at the shopping center is 7:30AM. Person A needs to
leave her home at 7:20AM. She has a history of being late, so TrakRide sends reminder SMS
messages at 7:10 and 7:15AM to nudge her to her car.
The cellular handset graphical user interface is shown in the following figure, showing snapshots
at 7:20, 7:25, 7:29, and 7:32AM. Person A departs on time, but B departs 2 minutes late:
A
pick up
B
C
7:20AM: on time
A
pick up
B
C
7:29AM: 2 min late
A
pick up
B
C
7:25AM: 2 min late
A
pick up
B
C
7:32AM: arrival
TrakRideAM pickupA: 10 minB: 7 minC: 3 min
SMS nudge toA at 7:10, 7:15
A departs OKB is 2 min lateC delays 2 min
Interviews Chapter Page 61 of 187

The handset display shows the previous paths that A, B, and C have taken to access the pickup
point. A, B, and C all see the same display as the pickup process progresses. At 7:20, all three
are on time, at home, and A is ready to depart.
At 7:25, B is still at home, even though he should have left at 7:23, so his dot his shown in red to
indicate tardiness, and the carpool is shown as being 2 minutes late. A's progress towards the
shopping center is apparent.
C should normally depart at 7:27, but C sees that the carpool is 2 minutes late and has another
cup of coffee. At 7:29, C departs. A and B have made progress and B is still depicted as tardy.
At 7:32AM, everyone has arrived at the meeting point.
The handset display does not need to provide a detailed map showing streets, so the larger screen
of a personal digital assistant is unnecessary. The handset display shows progress towards the
meeting point. Alternately, this could be shown with a "percent of trip complete" display or a
forecasted "minutes left" display. From a human perception standpoint, the mental model is one
of carpool members traveling from different parts of town, so a graphical representation with
some directional indication is appropriate. However, a simple "etch-a-sketch" style
representation is fine. This allows for very simple software programming of the display, as it
becomes a simple task of converting longitude/latitude into X,Y display coordinates and then
plotting.
A rough sketch of software control flow over time for this example is shown below. TrakRide
has an application server that receives and distributes information to/from A, B, and C.
Interviews Chapter Page 62 of 187

It must be noted that TrakRide will induce some excessive speeds as tardy members attempt to
reduce their lateness, turning their red dot to green. Likewise, there will be times when a
punctual commuter departs home at the appropriate time, only to encounter traffic delays that
make them late. These unlucky, yet courteous, commuters should receive a "punctual" score for
that trip, even though they arrive late.
The trip duration parameter (10, 7, and 3 minutes in our example) may be adjusted based on
historical results or by individual commuters via the web. This parameter data is stored by Big
Sister, and retrieved daily by the TrakRide application server.
Additional TrakRide Features
Customized traffic advisory. A radio traffic report provides a mass of data for
commuters to sort through, every 10 minutes. A customized advisory gives you the
single piece of data you need, when you want it. SFpool asks for advance notice of
baseball games that create major traffic increases and the sending of accident reports
specific to the car’s current location and route. Starting just before the first morning
departure, TrakRide will check traffic on the carpool's route to work (via the Caltrans
Interviews Chapter Page 63 of 187

traffic information server), identifying incidents that may create a high impact on the
commute. Where a highway is closed and attractive alternate routes do not exist,
TrakRide may offer the following three options: a) a web chat so carpool members can
determine how to proceed, b) delay carpool in 15 minute chunks until traffic improves
and automatically inform managers of the delay, and c) a voice conference call to allow
members to decide how to proceed.
When a member knows in advance that they will be late, reschedule/delay carpool by X
minutes. “A service that allowed you to handle a last second delay would be effective. I
need to be notified in time to make a change.” – SFpool. TrakRide provides easy,
reliable communications with other carpool members. With a three or four-person
carpool, the logistics of manually contacting each member to delay the carpool by five
minutes requires significant effort, especially if people are hard to reach. TrakRide
automates this process, and can even request an SMS receipt indicating that the member
has read the message. DanPool: “A single click or phone sequence that I could dial that
could broadcast a message, retry as needed, and confirm receipt would be a good thing.”
Members may also indicate "go without me today."
Tight integration with guaranteed ride home / car loaner services to provide a convenient
way home in the evening when the carpool is missed.
Pleasant reminders via SMS rather than with an annoying phone call with a ring.
Commuters may choose how to set their handset to react when an SMS message arrives,
such as by vibrating. Commuters can schedule their own helpful reminders. TrakRide
will also automatically schedule reminders for habitually tardy performers. “Sometimes
I’d rather e-mail than call. I don’t want to wake the driver up. Just get the data to that
person and let them check it if they want, don’t annoy them.” - SFpool.
Easy connection to D2D human customer support. Support will have each commuter's
current location and personal commuting context information available during telephone
support calls.
NextTrain
Interviews Chapter Page 64 of 187

NextTrain tracks a "race" between a train and a commuter to a meeting point at the local
commuter rail station. In this race, the commuter should always win with some time to spare.
Whereas NextBus tracks large transit vehicles and TrakRide tracks people, NextTrain tracks
large transit vehicles, PRT vehicles, and people.
How it works
Consider, for example, a commuter attempting to catch a 6:35PM commuter rail train home. The
train is on time. The train is traveling Southbound, stopping at stations RC (Redwood City), MP
(Menlo Park), and Univ (University Avenue, Palo Alto), before finally arriving at CA (California
Avenue, Palo Alto). The commuter works in the research park. Her desk is a one-minute walk
from a convenient PRT station.
Once per minute, the commuter's NextTrain handset application queries the NextTrain
application server for the train's predicted arrival time at CA. This parameter is called "TR" for
Train. The NextTrain application server in turn receives frequent updates from Caltrain's train
location server. For purposes of this example, TR is 6:35 PM, the train is on schedule.
The time for the commuter to travel from desk to the train station is called TTAT for Time To
Access Train. This parameter varies for commuters at different locations throughout the research
park, in our example the time is calculated as the sum of:
1 minute to walk from desk to PRT station
1 minute wait at the PRT station to wait for and enter a vehicle
4 minute PRT trip from the office station to one of the two CA Avenue PRT stations
1 minute to exit the PRT vehicle, walk to the train, and enter the train
2 minutes of "slack" in anticipation that something might take longer,
For a TTAT of 9 minutes. The 1 minute PRT wait will actually be a dynamic calculation based
on current and anticipated demand around the time of departure.
The time for a commuter to leave from their desk for home is called LV, for Leave. LV is
calculated as TR – TTAT. In this example, we have 6:35 – 9 minutes = 6:26.
Interviews Chapter Page 65 of 187

For this example, the commuter will have set up NextTrain to cause her cellular handset to play a
single tone at 5 and then 2 minutes to LV. NextTrain will check whether sufficient PRT
vehicles are available at the origination station at time [LV – 4 minutes], understanding current
status of demand at that station. Should there be a vehicle deficit, NextTrain will order a PRT
vehicle to be sent to that station.
Example handset displays are shown below:
NextTrainTR
6:356:306:25
LVTM
RC MP UNIV CA • Commuer vs. train “race”– Commuter must win!
• 6:35PM train is on time• Every 30 sec, recalculate
– TTA: time train arrives, via Train Location Server
– TTAT: time to access train = 1 min walk + 1 min wait + 4 min PRT + 1 min walk to train + 2 min slack
– LV = TTA - TTAT – PRT wait = fcn(demand)
• Small beep @ 2, 5 min to LV• NextTrain orders PRT
vehicle 2 min before LV
Time: 6:24PM2nd train arrives 6:50PM
TR
6:356:306:25
TM
UNIV CA
Time: 6:31PM, 2:00 minutes slack2nd train arrives 6:51PM
E-shuttle
In the topmost handset display (6:24PM), the top horizontal line shows a timeline from about
6:25 to 6:35. TM indicates the current time, which is 6:24. LV is 6:26, and TR is shown as 6:35.
The second horizontal line shows a simple Caltrain map showing RC, MP, Univ, and CA
stations, demarcated by green circles. The white circle shows the train's current position. At the
bottom, in text, information is provided about the train that will follow the desired train, should
the desired train be missed.
Interviews Chapter Page 66 of 187

In the bottommost handset display (6:31PM), the top horizontal timeline shows TM at 6:31 and
TR still steady at 6:35. The commuter has now left her desk, walked to the PRT station, boarded
a vehicle, and is on route. The race between the commuter and the train is shown graphically.
The middle horizontal line shows the train map, showing the train position relative to Univ and
CA. The bottommost horizontal line shows a PRT shuttle map with green stations and the
commuter's vehicle in white. At the bottom of the display, in text, the amount of slack is shown.
The handset displays are updated every 30 seconds.
In the unlikely case where the commuter leaves as directed, but still misses her train, NextTrain
will ensure that she gets home as conveniently as possible, and will provide compensation, such
as a free lunch or a few free PRT trips. Before switching to a commute alternative, solo drivers
never even had a connection to miss. But missed trains could cause a switcher to revert back to
driving alone, so D2D will take such incidents very seriously. Unlike current transit systems,
D2D has the advantage of being able to instantly identify customers missing connections.
For the morning connection to Caltrain, MtnBike also has a race against the train to the train
station. "If I got notifications that the train was late, this would allow me to stay inside my
house. I don't need a reminder when things are going well, but I do need to know when things
are out of sync."
QuickCar: car loaners, car sharing / emergency ride home
With D2D, separate programs for corporate loaner cars, car sharing, car rental, and
corporate/government emergency ride home all merge into a single, centralized service with
20,000 potential customers. Cars might be stored at two locations near the top and bottom tips
of the Figure 8. Centralized programs provide scale economies by requiring fewer cars with less
management overhead. The central loaner program also provides mid-day auto availability for
business meetings and urgent trips home to care for a sick child.
Interviews Chapter Page 67 of 187

Guaranteed ride home – Some Round 1 long distance carpool interviewees asked to be
switched to another carpool with open seats for the anomalous ride home, when a
connection to the standard carpool cannot be made. Respondents desired access to higher
speed HOV lanes even in unusual situations. A variant of the typical “missed my ride”
scenario is when a company shuts down early because of a facilities problem or an
unusual holiday schedule. DanPool expressed a similar need to borrow a rider from other
carpools to qualify for the HOV lane, providing a combined vision of carpoolers
dynamically shifting between cars. TrakRide, interfacing to Big Sister’s matchmaking
database, facilitates development of such a service. The matchmaking database provides
the capability to “introduce” the alternate carpool with digital pictures and descriptive
paragraphs, allowing anonymous rejection of an offered carpool because of a scary
looking member. “You won’t be picking up a complete stranger. People could even
provide a corporate ID before they got into the car.” – SJpool. Likewise the
matchmaking service is capable of selecting only acceptable carpools to shift into, based
on a given set of preferences, such as “female-only.” This feature arose from the
interviews but was NOT included in the surveys.
Round 1 interviewees felt unsure of how to use Research1’s ride home loaner program.
There were differing understandings of how the program worked: who signed for
permission and how much it cost – most would look to other alternatives first. Company-
run car loan programs necessarily receive just a few hours of oversight per month. A
centrally run program has sufficient scale for strong marketing communications and
educational programs, and full-time, dedicated staff.
CarlosSOV, a mother with a young daughter, felt commute alternatives were acceptable,
"as long as guaranteed ride home is very reliable. " This led to our promise that
commuters can order a car via phone or web, take PRT to a central car share/loan
location, and drive away within 5 minutes – from anywhere inside the research park. "If
it takes 10 minutes to get to the ride, that is no good."
WiFi enabled cell phones enable effortless, wireless door lock opening. The matching
WiFi enabled loaner car polls for a unique WiFi cell phone ID, causing the door to
unlock. For cars without WiFi door locks, a WiFi key lock box will be provided at the
car share lot.
Interviews Chapter Page 68 of 187
Future All-encompassing Wireless Commute Assistant
This section contains new ideas that have NOT been validated by surveys.
The techniques demonstrated with NextTrain for calculating TTAT can be applied to
TrackRide's evening pickup monitoring, and can also facilitate more complex morning carpool
choreography, where passengers may access a carpool pickup spot via transit. Over time,
NextTrain, TrakRide, and QuickCar should merge into an all-encompassing wireless commute
assistant.
Such a Commute Assistant would have the following features (and many more):
Be a "smart alarm clock." Rail and bus commuters fear falling asleep and missing their
stop. The Commute Assistant can wake commuters when they are three minutes from
their train station / bus stop, irregardless of the time. This is preferable to commuters
manually setting their watch alarms to beep in a certain number of minutes, as the transit
system might be delayed on-route, and their watch would wake them earlier than is
desirable. {this came from a Round 1 interview}
As part of preventing CarlosSOV's nightmare commute, proactively detect when
commuters miss connections, then take corrective steps. Don't wait for a call.
"HomeSafe" verifies that a carpooler arrives home safely via geolocation cross checked
against scheduled arrival time. HomeSafe may also be optionally configured to ask the
commuter for a password upon arrival, providing a second level of protection. A third
level could even be added, requiring the commuter to snap a cell phone picture of
themselves and send it to Big Sister. When a commuter has not reached home within a
certain number of minutes after scheduled arrival, HomeSafe gets into action: a) sends
SMS query, "are you OK?", b) eventually calls police. HomeSafe's unnecessary nagging
of late commuters who get stuck in traffic is a reassuring feature; Big Sister's concern for
commuters in non-threatening situations increases confidence that Big Sister will be there
vigilantly when danger lurks. {In Shaheen Meeting, she mentioned safety considerations
score highly in carpool focus groups, for both women AND men. Even U.C. Davis
Interviews Chapter Page 69 of 187
students, representing a somewhat homogenous community, are loathe to step into a car
with a stranger. HomeSafe lessens this safety issue.}
SpyKids: expedited, secure child PRT drop-off, using geolocation coordination.
Reduces the need for parents to accompany children to destinations within SRP. The
parent authorizes the receiving person (for instance, a day care center worker) to pick up
their child at a destination PRT station. The parent puts the child into the PRT vehicle at
an origination station. During the PRT ride, the child is in the custody of D2D. SpyKids
will NOT drop the child off at the destination station unless the receiving person, as
verified by cell phone WiFi identification, is present. In the case of a missed connection,
D2D will re-circulate the child on the system, either bringing the child back to the parent,
re-trying the drop-off, or bringing the child to a safe, D2D monitored location. Parents
may track the entire trip. Video feed from PRT stations and vehicles is available during
the trip. Voice communications with the child can be undertaken.
Trip planning like 511.com. Algorithms will use your current location and preferences
to make smarter selections with less commuter data entry.
Real-time PRT vehicle booking. You may request a PRT vehicle from your desk, two
minutes before you reach the PRT station platform, increasing the chances of zero wait at
the origination station.
Effortless PRT ticketing and destination selection
Two Round 1 interviewees emphasized their expectation for a seamless ticketing experience
between different transit operators. In the Bay Area, TransLink is the name of the system
destined to unite transit ticketing across transit agency boundaries. Due to the requirement for a
D2D WiFi enabled cell phone, D2D can go one step further, eliminating ticketing and destination
selection in many instances.
Because it provides direct point to point service, PRT requires the specification of destination
station before a vehicle departs a station. The 19 stations in the research park system may evoke
images of a proprietary ticketing mechanism with a "pick a station" touch screen user interface
Interviews Chapter Page 70 of 187

(possibly requiring two screens to navigate), but this will not have to be the case. In this
scenario, the commuter would have to struggle to find their payment mechanism and to select
their destination every time.
Instead, commuter cell phones can identify a commuter to a fare gate, and Big Sister can retrieve
that commuter's trip-making context, suggesting the likely destination station. If no changes are
required, this can all occur with no physical effort by the commuter. Thus this very
personalized fare gate system reduces transaction time and hassle.
The typical fare gate interaction is as follows:
A commuter walks up to an entrance gate at a PRT station with cell phone in brief case or
pocket. The gate is constantly listening for commuters.
The commuter's cell phone announces that the commuter has arrived.
The gate hears the announcement, retrieves trip making patterns, selects the most likely
destination, and displays the information on a computer monitor that is visible to the
commuter.
In most cases, the commuter agrees with the suggested destination station and boards the
appropriate vehicle. When the commuter prefers another destination, they select it from
the display.
Once the vehicle is on-route, the commuter's credit card is debited.
Wireless Payment
The enabling technology is provided by a new series of cell phones. Bluetooth and WiFi
(802.11) provide short-distance wireless communications featuring seamless connections and
data transfer between devices. Ericsson, Nokia, Motorola, and Cisco are four of many
companies that have announced plans to provide cellular handsets featuring at least one of these
communications protocols. One of the uses Nokia promised for their phones was that of a
"universal ticket" providing entrance to transit and cultural events. At this date, powerful
Interviews Chapter Page 71 of 187

interests such as Visa and Nokia are competing over credit card settlement procedures,
presumably this will be resolved well before Year 2008.
Individual Trip Making Paterns
Most commuters will only use between three and six of the 19 stations on a regular basis.
For example, the patterns of BerkBART are as follows:
If he appears in the proximity of the Caltrain station between 5AM and 11AM, then he is
going to go to his job site, EPRI.
If he appears in the proximity of the EPRI station between 10AM and 2PM, then he'll go
to 1 of the following PRT stations: {Agilent (to access Frye's computer store), CA Ave
(for lunch), Caltrain (for lunch), BofA (for banking or for lunch)}.
If he appears in the proximity of {Agilent, CA Ave, Caltrain, BofA} between 10AM and
3PM, then he's going to go back to EPRI.
If he appears in the proximity of the EPRI station between 3PM and 7PM, then he's going
to Caltrain.
Gate Handset Wireless Protocol
Gate Handset communication initiates when the handset comes within range of the gate and
begins as follows:
Gate "I'm looking for D2D members"
Handset "I'm a D2D member, with ID 12345"
Gate 1) Retrieves 12345's trip making patterns
2) Selects most likely destination for 12345
3) Displays "for XX345, destination is Caltrain East"
Interviews Chapter Page 72 of 187

New Mobility Policy Issues
Unwillingness to pay
CarlosSOV explained that she was not willing to pay for D2D services. She understood that by
foregoing driving alone, she was creating an external economic benefit for other citizens, not
herself, "Don’t make me pay for the right to do good for society and avoid the environmentally
worse option. Transit should cost less than a car – reward me.” The low-cost competition from
driving alone takes away some of the ability to charge for D2D.
Intuitively, we believe there is a financially quantifiable commute benefit for providing better
commute alternatives, but it is hard to measure. Employees may be more likely to stay with their
current SRP employer than take a job elsewhere. Employees might accept $X per year less
salary for an SRP PRT+D2D job compared to another job that is similar in all other dimensions.
REFERENCES
[A-GPS] Position Determination Using Hybrid GPS/Cellphone Ranging, N.F. Krasner,
G. Marshall, W. Riley, ION GPS-2002, September 2002.
www.snaptrack.com/AtWork/ion2002_pos_determination.pdf
[Casual Carpooling] “What are casual carpools?” - http://www.environmentaldefense.org/article.cfm?
ContentID=1363 , http://www.100megsfree4.com/farshores/ncpool.htm - “Carpooling Could Be Out-Of-This
World”, RIDES report on casual carpooling: http://www.rides.org/main/casualcarpool.99.pdf .
[Instat] Location-based Services: Finding Their Place in the Market, Instat Report #
IN030357WI, February 2003, instat.com.
[SnapTrack] An Introduction to SnapTrack Server-Aided GPS Technology, Mark
Moeglein, Norman Krasner. ION GPS-98, Sept. 15-18, 1998, pp. 333-342. Web link:
http://systems.cs.colorado.edu/grunwald/MobileComputing/Papers/snaptrack-overview.pdf .
Interviews Chapter Page 73 of 187

Survey Chapter
This chapter provides an in-depth explanation of the survey, covering logistics, protocol, design,
results, criticisms, and implications.
Survey: Logistics
Getting a company to participate in the survey was a large undertaking. Luckily, I enjoyed a
lengthy informal relationship with one research park company, the Electric Power Research
Institute (EPRI). EPRI has more of an interest in PRT than other research park companies
because PRT is a large consumer of electricity and EPRI’s corporate mission is to conduct
energy research. EPRI made important contributions to the preliminary demand analysis
projects: Facilities Manager Harry Beck contributed employee address information for the GIS
commute shed map. Market Researcher Jim Galanis brokered a relationship with IDEO Design
that led to their consulting on the full scale model. Galanis donated weekend time to help
photograph building facades for the 3D virtual city flythrough. In addition, EPRI Human
Resources staff set up six one-on-one interviews with EPRI employees for the interview
research.
In order to secure EPRI’s participation in the survey, Galanis set up a presentation with Director
of New Technology, Steve Gehl. This successful meeting led to a follow up presentation with
Chief Operating Officer Ric Rudman. Rudman, an engineer, was enthusiastic about the overall
vision for PRT within the research park. The presentation emphasized EPRI’s previous informal
participation. The 15-minute meeting concluded with Rudman agreeing to three “asks”: a) for
EPRI to make the demand analysis a small, zero-budget EPRI project, b) for EPRI personnel to
assist with survey set up activities, and c) for EPRI to motivate 50+ employees to participate in
New Mobility Chapter Page 74 of 187

the survey. In essence, Rudman was generously signing up for a major disruption at EPRI on
April 30th, 2003.
With the COO’s backing in hand, follow up negotiations with cafeteria, facilities, IT, and HR
went smoothly. The cafeteria was prepared to collect printouts from the last page of the survey,
permitting employees to purchase a lunch worth $8. An advance of $400 for 50 lunches was
provided. The objective was to make processing and accounting easy for cafeteria staff while
ensuring that EPRI employees had actually completed all the questions in the survey before
becoming entitled to the free lunch. Part of this objective is based on the fact that the survey
requires about 25 minutes to complete – longer than is desirable for a voluntarily taken survey.
We felt that the $8 lunch would serve as a positive motivator to get someone who was stalled
and/or bored 15 minutes into the survey to persevere in completing the survey. From the
interview research, we had found the employees responded favorably to free lunches.
Corporate facilities managers do not take lightly to requests to set up 33’ long by 16’ high
structures on their property, particularly given the liability issues involved. In a meeting with the
Facilities Manager, he was shown digital pictures of the structure, a conservative structural
analysis (concluding that the model could withstand 21 mph winds), and proof of a $1 million
commercial liability insurance policy. The Facilities Manager was swayed and he provided
some personnel to assist with setting up and tearing down the unwieldy model, which typically
features an uneasy two-minute period when the columns are attached to the guideway and moved
from horizontal to vertical orientation. Facilities also provided office space for the 3D virtual
city animation (which runs on a PC) and wall space for printed PowerPoint slides, two additional
items that survey participants encountered.
The main objective with the Information Technology (IT) Department was to set up a simple
process whereby 50 or more EPRI employees could schedule themselves for 15-minute time
slots in advance of April 30th. The IT department and I explored various free web-based
solutions to no avail (for some inexplicable reason, back office application companies are now
charging for their services). Finally, Excel’s “shared, simultaneous access” feature provided a
workable solution. A spreadsheet allowing for two people to sign up for each fifteen-minute
New Mobility Chapter Page 75 of 187

time slot from 6:45AM to 2:00PM was created and placed on a network file server that all
employees could access. 66 employees signed up without requiring any technical assistance
whatsoever. A scheduling system that required multiple e-mails or phone calls per person would
have been unacceptable. The spreadsheet was constructed as follows:
Questions? Contact Jim Galanis xXXXX
April 30 Electric Shuttle Survey ScheduleTwo people every 15 minutes
Person 1 e-mail Person 2 e-mail
6:45AM [email protected] [email protected]
7:00 AM
7:15 AM
7:30 AM
IT staff also provided access to a PC with web access and a printer, within short walking distance
of the office space Facilities had provided. IT’s PC was used to calculate and e-mail commute
comparison scenarios to employees.
HR staff sent out e-mails requesting employee participation in the survey, with a live link to the
shared Excel scheduling spreadsheet. Those e-mails are shown in the Survey Appendix, Part A.
The first draft of these e-mails was created by myself, edited by EPRI’s Galanis, then sent on to
HR, who then sent back their version for approval before broadcasting the message. Response to
the e-mail requests was rapid. From the 1,000-person company, we saw 30 signups in the 24
working hours between the first message and the second message, which introduced the free
lunch offer. By the end of the second day, the schedule was completely full.
New Mobility Chapter Page 76 of 187

The logistics of the survey were substantial, requiring many meetings, phone calls, and e-mails;
surprisingly, they went off without a hitch. EPRI personnel were uniformly helpful – a few
uncooperative individuals could have complicated the process.
Survey protocol
The survey regimen exposed participants to a variety mix-media educational tools: the full scale
model, virtual city animation, printed Powerpoint slides, interactive question and answer with
experts, and a web-based survey with substantial educational content.
The survey emphasized how technology benefited individual commuters; that is, we educated
people on benefits in their context, rather than providing in-depth technological explanations.
We called PRT a “rapid electric shuttle,” a more benefit oriented and application specific
description.
On the morning of April 30th, we rushed over to set up in time for the first participant at 6:45AM.
The survey protocol had the feeling of a busy industry tradeshow, and went as follows:
Greeting and Full Scale Model
Approximately two people arrived at the lawn by Building two within a five-minute window
every 15 minutes. We had asked people to arrive five minutes early, but arrival times were
somewhat random. A couple of people griped that they had to wait too long, but they still
participated. Two well-trained “educators” took turns greeting people and leading them through
a ten-minute educational session.
Jeral Poskey has been involved in PRT for a number of years and serves as the Director of
Business Development for PRT vendor Taxi 2000. Jeral has a smooth interpersonal style.
Rather than being too ardent of a PRT advocate, Jeral had a measured presentation approach. He
New Mobility Chapter Page 77 of 187

was interested in obtaining accurate results; he had no interest in over-stating PRT ridership.
Jeral is one of the transportation industry's most experienced people for answering random
participant questions about PRT.
Rob Means has also been involved in PRT advocacy for a number of years. Rob runs an electric
scooter business, so has a broad perspective on green transit options. Rob, too, presented a fair
portrayal of PRT. In overhearing Rob’s presentation, it was clear that he had taken the survey
himself beforehand and had a good understanding how the survey was carefully trying to not
over-sell PRT. Given SRP's engineering culture, some curious participants had many technical
questions to ask about PRT. After a couple of questions, Rob did a great job of focusing
attention back on the benefits of the proposed solution and on the individual’s personal commute
context. Many well-intentioned PRT advocates would not have been appropriate for this type of
survey as their ardent enthusiasm would not have presented a balanced view. Rob and Jeral
were probably the two best survey educators available in California.
Rob and Jeral were provided with a short overview script for how the protocol worked and what
to emphasize when. They did a fine job following it. We were very fortunate to have two such
top-notch people at our disposal.
Full Scale Model
The educators took participants on a walking educational tour. The first stop was at the full scale
model, which had been set up on the lawn by Building 2. Participants were taken to walk under
the guideway. Educators explained that this was the full scale of the elevated shuttle system; that
the rubber tires, propulsion, third rail, brakes, and control system hardware were attached to
bogies inside the horizontal cylinder. At first glance, some people wondered whether the shuttle
was a “pneumatic tube” transit scheme.
New Mobility Chapter Page 78 of 187

PRT full scale model by Building 2
Demographic Information
From the full scale model display, participants walked to the office space housing the 3D virtual
city. On that walk, educators used a clipboard to take down demographic information about each
participant, using a one page pre-survey instrument. Information collected included e-mail,
home address (with last two address digits zeroed to protect privacy: 1487 Pitman becomes 1400
Pitman), commute distance, morning commute origination departure time, gender, and current
commute mode split. This instrument can be found in the Survey Appendix, Part B.
Animations and Benefits
Once participants arrive at the office space, educators show them a PRT animation for downtown
Minneapolis (created by Taxi 2000). This animation demonstrates some important PRT
concepts such as ten-foot separation between vehicles, vehicle capacity to hold three people,
easy-to-use "smartcard swipe" fare box interface, and intermediate station bypass. Next,
educators interactively demonstrate the 3D PRT Virtual City of the research park, taking a trip
from one station to EPRI. Employees could easily recognize the EPRI campus, with its
distinctive architecture. The virtual city helped participants place the electric shuttle system in
a specific Palo Alto context. Next, educators took participants through some printed PowerPoint
slides. These reinforced electric shuttle benefits (high level of service: no waiting, faster than a
car, reduced mid-day stranding), showed the “figure 8” PRT alignment serving the research park,
New Mobility Chapter Page 79 of 187

introduced the concept of D2D new mobility, and provided instructions to wait for an e-mail
with a live survey link, and advice on how to collect on the free lunch. During this time,
participants asked free form questions. There were a few larger groups of 3, 4, and even 5
people that were educated. The more people in the group, the more questions that were asked at
the end. So the process exceeded 10 minutes for these groups. Before participants left,
educators negotiated with participants to select the best commute alternative mode for
comparison. The intent was to select the most time-competitive alternative, provided that
commuters weren’t strongly predisposed against it. This alternative was noted on the pre-survey
instrument.
Commute Comparisons
Meanwhile, I periodically collected pre-survey instruments from the educators, and created
commute comparison scenarios commuting from home address to EPRI via both driving alone
and the selected alternative. I provided a specialized version of a transit trip planning service, a
variation of the Bay Area's own "TakeTransit Trip Planner” service provided by 511.com. I
experimented with web services such as the aforementioned Trip Planner, but found that it did
not cover Santa Clara County. Nor is there a web commute service that can easily select time-
optimized commute trips. I experimented with using 800 numbers provided by VTA, samTrans,
SF Muni, and RIDES. The customer service representatives were also not conditioned to create
optimized commute trips. SF Muni personnel used a PC-based algorithm that came up with an
objectionably poor commute alternative that backtracked 70 minutes across SF with multiple
transfers to arrive at a distant Caltrain station.
I soon found that I could answer the questions faster myself via the web, especially for the
simple question of locating the closest train station to someone’s house. I used a combination of
"maps.yahoo.com" (slightly faster than mapquest.com) and the transit agency’s web station
guide to make this calculation. TakeTransit Trip Planner will hopefully evolve to ascertain
optimal commute options efficiently. My specialized task was complicated because I assumed
Year 2008 transit infrastructure. BART’s web system was the most efficient for my purposes.
Their “Find a Station” service allows a person to enter in a home address and have BART find
New Mobility Chapter Page 80 of 187

the closest station and then provide driving directions. It would be terrific if other services could
eventually provide the same service, working across all train stations. San Francisco commute
alternatives using BART and connecting to Caltrain at Millbrae were surprisingly frequent.
For the drive alone commute, I verified the pre-survey instrument’s drive alone time. Some
participants did not supply drive time, so I calculated it from scratch. I used maps.yahoo.com to
come up with an initial time estimate. If the commuter traveled during peak hours, I subtracted a
minute per mile on highways. This was a rough rule of thumb supplied by VTA. It is especially
valid given my assumption that Year 2008 traffic is as bad as Year 2000 traffic was. These
calculations could be eased by having access to the MTC's extensive Bay Area travel network
model.
I also used samTrans/Caltrain, VTA, and BART web sites to calculate commute alternative trip
costs. For Caltrain, I assumed commuters purchased a monthly pass, which brings commute cost
down considerably. EPRI does not provide Commuter Checks, pre-tax purchase of transit fare,
so that potential savings was not included. Drive alone cost was calculated at $0.35 per mile,
and an explanation of the basis for this costing was provided.
Once a custom commute comparison was complete, I’d e-mail it to the person with a live link to
the survey. A backlog developed in the creation of custom commute scenarios. The backlog
was flushed out about 24 hours after the last participant finished. One example is provided
below:
Greg,
Your comparison scenario is:
Home: 1400 Pitman St., San CarlosCommute Distance: 13.7 miles, lv 7:30AMDrive alone commute time: 27 minutes Cost at $0.35 per mile (gas + insurance + depreciation + maintenence + car registration): roundtrip = 14 * 2 * 0.35 = about $10 per day.
ALTERNATIVE:
1) 0.4 mile trip to Caltrain San Carlos. You can drive (and park), bike, or walk. Walking takes about 6 minutes, depending on your speed. Driving and parking would take about 2 minutes.
New Mobility Chapter Page 81 of 187

2) Wait at the Caltrain station 2 minutes. 3) 17 minute caltrain ride. 4) Take electric shuttle to epri, 1 minute walk, 4 minute trip. total time, walking to caltrain: 32 minutes. Cost: $1.50 for roundtrip electric shuttle. Using caltrain $57 monthly pass, $2.30 per day rountrip.Total: $3.80 per day
Please take the survey at http://www.cities21.org/epri.htm
The pre-survey instrument data was hand-entered into an Excel spreadsheet for later “joining”
with the web survey data.
Survey
Partipants received an e-mail with their custom commute comparison at their desk, clicked on
the live link to the SurveyMonkey survey, and took the survey. Upon completion, they printed
out the last page and then took that page to the cafeteria for their free $8 lunch.
Participants generally spent 10 minutes on education (not counting access and egress) and 25
minutes on the survey. Including time spent setting up the full scale model, our survey team
spent 40 minutes in support of each survey, a very labor intensive process.
Of the 66 participants who undertook the educational program, 62 completed the web-based
survey, a 94 percent response rate.
Protocol Improvements
A post-survey debriefing meeting was held. It generated the following suggestions:
The team was scheduled from 6:45AM until 2:30PM without breaks. EPRI’s Galanis
brought people food, but the pace was exhausting. Next time, we’ll schedule from
7:30AM until 2:00PM with 15-minute breaks every two hours. We’ll allow three people
per 15-minute time slot, instead of two, so we’ll actually process more people in less time
with less exhaustion.
New Mobility Chapter Page 82 of 187

We’ll attempt to have a second person creating commute alternative scenarios so that we
don’t get so backlogged.
On the day before, we’ll e-mail participants the pre-interview instrument, so that they
may print it out and fill it in ahead of time, providing a time savings to educators.
We did conclude that Rob and Jeral were exceptional educators and that exceptional
interviewers make a huge difference.
We’ll do a better job of setting participants expectations that they may have to wait once
they arrive for the survey. We’ll ask people to arrive 2, rather than 5, minutes early.
Survey Design
A number of web-based survey systems were analyzed. SurveyMonkey.com appeared to
provide the best combination of features, ease of use, and price. For a survey with “branching,”
the cost is only $19.95 per month. SurveyMonkey support staff provided a high level of support,
providing “hooks” to undocumented features and post-processing the survey database to hide the
e-mail names from public viewing.
Unlike a typical survey with short questions, our survey questions attempted the complex task of
educating commuters about the problems they were likely to face. Our questions often led off
with sentences or even paragraphs of educational content before the question was posed.
Because of this, the survey takes about 25 minutes to complete, which is longer than ideal, but an
artifact of presenting a fair portrayal of commuting challenges.
Before the interview research increased our optimism, our expectation had been that PRT + D2D
would reduce the number of autos per 100 workers in suburban office parks from 85 per 100
(78% drive alone, 3% transit, and 16% shared ride) to 70 per 100 (60% drive alone, 15% transit,
21% shared ride). For comparison, Shoup’s research showed the implementation of an $8 per
day parking fee for Los Angeles workers facing poor transit options would reduce nominal drive
alone mode share by more than 30%. The interview research indicated the potential for
significantly fewer cars per 100 employees, with a higher shared ride market share.
New Mobility Chapter Page 83 of 187

The main thrust of the survey design came from the interview research and the attitudinal
literature. EPRI’s Galanis assisted in the design of the survey and provided extensive feedback
on question wording. Once the survey design was nearing completion, Jeral and Rob “pre-
tested” the survey. The lack of pre-testing on non-PRT experts was risky, but did not have an
impact.
The pre-survey education and survey questions attempted to "reassure away" likely technical
objections. The attempt was to focus on the impact of the product offering, not on whether the
promises about the state of technology in Year 2008 were true. This objective was accomplished
to a large extent, although there were a number of skeptical comments about system cost.
Susan Shaheen found that for her car sharing research, she had to have ready answers for the
objections that came up during her car sharing drive clinic. Her insight reinforced our desire to
conduct a very thorough survey and provide solutions (answers) to most commuting problems.
[Shaheen meeting]
Survey branching
The survey begins with 1) a review of some of the benefits of PRT + D2D, 2) requests an e-mail
address for an eventual data “join” with the pre-survey instrument data, and 3) a query as to the
participant’s best commute alternative. The survey then presents the participant with a set of
questions tailored to their particular commute alternative. The relative complexity of carpooling
attitudes requires more questions than the other modes. Biking/walking is next in complexity.
The train and bus attitudinal issues are very similar.
A flow chart depicting the survey is shown below:
New Mobility Chapter Page 84 of 187

P e rso n a l S u pp o rt
R e lia b ility
C o m p a tib ility
P ro x im ity
P e rs o na l T im e
C h it-ch a t
Carpool
P e rso na l T im e
R e lia b ility
E xp e rie n ce
Train
P e rso na l T im e
R e lia b ility
E xp erie n ce
Bus
P e rso n a l S u pp o rt
E xp e rie n ce
S a fe ty
W e ath e r/S u n lig h t
S tren u ou sne ss
Bike/W alk
C o m m u te A lte rn ative?
e -m a il ad d re ss
F re e lu n c h!
T im e tra de o ff
C o m m u te m o d e s p lit
E le c tric S h u ttle R ide s p er W ee k
P e rso n a l S tora ge
D a y E nd A c tiv it ie s
S tra nd in g
Once the mode-specific questions have been asked, participants return to issues that all
commuters face, regardless of mode. Three main issues are addressed, then the participant states
the number of PRT rides they plan to take, and their planned new commute mode split assuming
PRT + D2D is available.
Three questions per issue
Each commuting issue is presented as a series of three questions. The first presents the
attitudinal problem and asks how important the problem is. The second frames a solution to the
problem, and asks how effective the solution is in addressing the problem. The third question
requests comments about the problem/solution. These comments serve two uses. First, the
comments provide clarifying nuggets of insight about the problem/solution. Second, many
subjects want to ensure that their voice is heard, so the comment box satisfies that need. We
anticipated that some of the problem/solution pairs would be frustrating to some respondents;
comments allowed participants to express their complaints about the survey, inducing them to
complete the survey.
New Mobility Chapter Page 85 of 187

The problem/solution question pair for each attitudinal issue allows for “gap analysis” to visually
examine the importance of problems and the effectiveness of proposed solutions. Where an
issue is judged an important problem with an ineffective solution, then there is a service gap that
needs to be better filled.
The scale for numerical responses about importance and effectiveness was chosen to be 0 to 10,
a scale popularized by Cambridge Systematics, providing more nuanced response than a typical
1 to 5 scale. The zero value is important for the following reason. The value ‘0’ has a clear
analogy to “not at all important” and “not at all effective;” whereas the value ‘1’ implies a small
amount of importance or effectiveness.
The complete text of the survey can be seen in the Survey Appendix, Part C. 62 respondents
completed the survey, out of the 66 who participated in the educational program. 56 took
advantage of the free lunch.
Results: Carpooling Gap Analysis
Gap analysis is prevalent in a number of disciplines. The Boston Consulting Group is said to
have invented this technique.
Gaps are constructed as follows. From the set of participants provided with the carpooling
alternative, we select those that chose to carpool 60% or more of the time. Gap Importance is the
percent of these 60%+ carpoolers who rate the importance of the problem above average ( >=
6 ). Gap Effectiveness is constructed by examining the resultant set of 60%+ carpoolers with
importance >= 6, and finding the percent of those where the solution is relatively effective.
Relatively effective is defined as
if (effectiveness >= importance – 2) then
solution is relatively effective.
New Mobility Chapter Page 86 of 187

There is no unique method to construct gap measures. Results are shown below:
The three most important problems were well solved. The least important problem, carpool chit-
chat, was poorly solved. The proposed chit-chat solution may be implemented with a small
engineering effort as part of MatchRide development, so probably should be implemented
despite its low importance.
While not as illuminating compared to one-on-one, interactive interview research, the survey's
text entry questions were still quite useful. A sample of supporting responses is provided below.
The TrakRide service described in question #16 ran into some skepticism from two different
respondents:
1) "That is certainly a creative solution to the problem. However, human nature being
what it is, I have no doubt that this would continue to be a problem regardless of the
sophistication of services D2D offers!" 2) "Schedule flexibility seems to be ignored and
people are assumed to be punctual. This raises skepticism." Early adopters might be
able to change this respondent's opinion.
New Mobility Chapter Page 87 of 187

Another person reacted very favorably to the concept,
"I would welcome any assistance in this area - I can never seem to leave work on time
even with a 2nd job waiting. There's always one more thing to do. Your ideas of
electronic notification for carpoolers and electronic nagging of stragglers is fabulous!"
Another person questioned our ridesharing matchmaking service (MatchRide) from question
#13.
"There will be some pet peeves that people have that they won't find out about others
until after a while and it can get them frustrated. If the person has to keep on going
through the process of finding someone compatible, they might eventually give up on
that." Another drive alone preferring person felt the matchmaking service was too
complicated. Some skepticism arose over the proposed rules of etiquette, "Rules are
very necessary. However, it is my experience that people ignore all kinds of rules more
and more in our society. (Driving rules, for example, or the unspoken rules of courtesy,
which seem to have vanished with the introduction of the cell phone.)"
On the favorable side of improved matchmaking, one respondent provided a useful suggestion,
"Sounds like it would work for most but I'd hesitate. My concern is safety. I don't want
my picture out there and just anyone knowing where I live and that I'm not at home
during certain hours, etc. I would like to know alot more about others before I'm willing
to give as much information about myself." This suggests that some people would like to
screen people who have interest in them before releasing their picture and contact
information.
Some felt the quiet carpool etiquette protocol from question #4 wasn't practical,
"Can you really enforce this? I believe the chit-chat problem depends almost entirely on
the individuals involved. In general where there are two or more people, they will talk.
Specifying a quiet car would select people who prefer not to talk. Chit-chat usually
occurs even then, but since quiet has been requested, it's easier to bring an unwanted
conversation to a close." Others weren't very sympathetic to this issue, "People who
have problems with this should get over it...."
New Mobility Chapter Page 88 of 187

Some expressed their favorable reaction to personal support (question #19),
"A customer support operation is key to providing a successful system. I would want a
help desk - a place to vent, offer suggestions, learn the drill, get tips, and request
recourse. The volunteers can gather feedback, anticipate situations, and offer solutions
at the stage things are more easily addressed. They should be a rider's advocate."
Another emphasized another aspect, "Information is power! Personal experience and
support are priceless. Being able to research these issues would be a huge help!"
The favorable disposition towards replacing private drive alone with productive time (question
#7) was favorably commented by one commuter, "I would love to be able to use my commute
time constructively. Driving myself wastes 40-60 minutes every day."
One respondent felt the PRT shuttle was freeing,
"With the availability of electric shuttle I would actually get more done because I would
leave work at lunch time to a) have lunch offsite or b) do an item on my to-do list! That
would be a very freeing thing -- I hate to leave once I've gotten to work just because of
the driving and parking hassle."
DanPool comments about carpooling proximity solution (question # 10) with drop-off at a
central PRT station:
“It would open up a broader range for carpool matching. Right now, if we can’t have a
carpool with people who work right across the street, then it’s probably more hassle then
it’s worth. In the early days of my carpool, we had one person who worked on the other
side of foothill expressway, and getting across foothill for the pick-ups and drop-offs was
not very convenient when the lights were long. You could have meeting spots / park ‘n
ride lots for centralized carpooling that everyone could feed into. Everyone could go to a
central place & meet their carpool.”
New Mobility Chapter Page 89 of 187

Results: Train Gap Analysis
The important reliability problem was poorly solved. Some respondents request NextBus-style
electronic signs in train stations. The switch from private drive alone time to productive time on
the train was judged an unimportant problem with an effective solution: "If I can get 60 minutes
of work done rather than drive for 45 minutes, that is a benefit. Working on CalTrain is
relatively easy." The importance of train experience problems was low; comments reinforced
the idea that Caltrain is the most "civilized" transit experience in the Bay Area. A gap analysis
chart is shown below:
0% 10% 20% 30% 40% 50% 60% 70% 80% 90% 100%
Experience / Support
Private time /productive time
Reliability / NextTrain
Results: Train preference: Gap analysis EffectivenessImportance
Results: Combined Gap Analysis
Whether they were presented with carpool, train, bus, or bike/walk as a commuter alternative, all
respondents faced the same set of three problem/solution question pairs at the end of the survey.
New Mobility Chapter Page 90 of 187

For commuters who stated their preference to take commute alternatives 60% or more of the
time: stranding (very important) was well solved, complex end of day trip chaining (important)
was poorly solved, and trunk storage (moderately important) was moderately well solved:
0% 10% 20% 30% 40% 50% 60% 70% 80%
Trunk storage / duffle
Day end activity / ?
Stranding / loaner + ridehome
Alternative preference: combined gaps EffectivenessImportance
There weren't any surprising suggestions for how to solve the day end activity problem (question
#54/55), but one respondent supplied an interesting application for improved ridesharing
matchmaking, "It's very possible in the driver-match exercise that I would find someone who
would have the same activities (or proximate ones). With that kind of screening ahead of time,
this might actually turn out to be a benefit of the program rather than a hindrance. It would be
worth exploring."
Results: Train Time Advantage
Participants who preferred train to driving alone were presented with commute comparison
scenarios where the train alternative had a relatively small time dis-advantage of about 20 to 30
New Mobility Chapter Page 91 of 187

percent compared to driving alone. For instance, a 27-minute drive alone commute translated
into a 32-minute train commute (using PRT for the last mile). A 65-minute drive alone commute
translated into an 85-minute train commute.
Participants were explicitly asked in Question #64 to state the time advantage / dis-advantage
between driving alone and the alternative that would make them indifferent. This question was
poorly designed, produced bizarre results, and was discarded.
A graph of train preferrer time advantage is shown below:
Time advantage for people who prefer train to drive alone
-25
-20
-15
-10
-5
0
5
0 10 20 30 40 50 60 70
Door to Door Drive Alone Time (minutes)
Tim
e A
dvan
tage
(min
utes
)
Participants who had train as their best alternative but chose to drive alone had a similar
distribution of train time dis-advantage. When presented with this small time dis-advantage,
more people than not chose train over driving alone. In today’s commuting world without PRT,
the train commute time dis-advantage is larger and other attitudinal irritants are more
pronounced, resulting in lower train mode share. Why will people incur a time penalty?
Because of increased productive and reduced stress.
New Mobility Chapter Page 92 of 187

Santa Clara County Valley Transit Authority's Senior Transportation Planner Chris Augenstein
validated this 30 percent time dis-advantage, "In our forecasting model, if the door to door transit
time is within 30 percent of driving alone, then forecast high transit mode share. This share
drops off rapidly once you get past 30 percent." [Augenstein]
The 13 interview respondents indicated a greater stated willingness to incur a time penalty to
avoid auto rips, generally varying from a 25% to 100% time penalty. Remarks CarlosSOV, "I
love to read. I would trade a 30-minute auto commute with NPR on the radio for a 45 minute
Caltrain reading session with a 15-minute connection any day." This represents a willingness to
undergo a 100% time penalty.
The graph above describes the revealed preference of commuters about their time tradeoff.
Question #64 attempted to ascertain commuters stated preference about time tradeoff for their
chosen commute alternative. The assumption was the some commuters would be willing to
incur a larger time penalty than revealed to take the train. Question #64 resulted in some bizarre
results, where commuters revealed they'd be willing to incur a 10-minute time penalty to take the
train while stating that the train had to be 10 minutes faster from them to choose it over driving
alone. This question appears to have been poorly worded, and has been discarded.
Besides the influence of productive time and stress reduction, Susan Shaheen believes that the
choice of commute alternatives provides a healing and somewhat hidden psychic benefit, IE
there is also a "willingness to be green." [Shaheen Meeting]
Results: carpool time advantage
For carpooling, the door-to-door time dis-advantage compared to driving alone is mostly
accounted for by the extra time to pick up passengers:
New Mobility Chapter Page 93 of 187

Time advantage: prefer carpool to drive alone
-20
-15
-10
-5
0
5
10
0 10 20 30 40 50 60 70
Door-to-Door Drive Alone Time (minutes)
Tim
e ad
vant
age
(min
utes
)
Results: Bicycling
From interview research, I found a difference between “casual” bikers and “hard-core” bikers,
with casual bikers representing a new market that really cannot currently commute into the
research park. PRT allows casual bikers to enjoy a leisurely, aerobic commute on quiet, tree-
lined residential streets to the edge of the research park, where the PRT shuttle then whisks them
to their office, avoiding the unpleasant biking experience within the research park. Within the
research park, cars travel up to 50mph and there are strenuous hills. On the other hand, hard-
core bikers do not require assistance from PRT as they are willing to sweat and own rain suits.
Hopefully the reader can deduce some of the "casual biking theory" nuance in Survey Questions
39-50.
In the survey, there were only three participants who examined the bike/walk alternative. All
were more than 2 miles away from the research park’s edge, so weren’t ideal to become casual
bike commuters. Two out of three stated their preference to switch to a bike commute. One
switcher preferred a 32-minute bike + PRT commute to a 12-minute (4 mile) drive alone
New Mobility Chapter Page 94 of 187
commute. Gap analysis showed that the solution solved this person’s needs, the largest of which
was to avoid strenuous biking. Surprisingly, the other switcher preferred a 55-minute bike +
PRT commute to a 25-minute (nine-mile) drive alone commute, viewing the cost savings and
increased exercise this alternative offered favorably. Still, this biker belongs solidly in the "hard-
core" camp. The commuter who rejected the biking option fit the casual biker profile. His 4.5
mile commute was too long to enable a bike + PRT commute that left him sweat-free. He also
mentioned, "I don't like fighting cars and smelling their exhaust."
I believe I have a new and correct theory of casual bike commuting that cannot be substantiated
with this tiny amount of data, but should be explored further. Interview anecdotes add further
color to this casual biking portrait. Goodman reinforces some of the value-of-time concepts that
underscore this theory:
"Under pleasant conditions, cycling can have positive value, but under unpleasant or
unsafe conditions (for example, cycling along a busy highway), time spent cycling has
costs two or three times higher than time spent driving." [Goodman]
MtnSOV has done some casual biking even though she has a six-mile commute. A safe and
pleasant route to work is of high importance. She loves taking a protected bike path that is not
attached to a road, and avoids Foothill Expressway with its 50 mph cars. Foothill Expressway is
quite popular with many bikers, but mtnSOV judges it unsafe. The noise and fumes on Foothill
are not a big obstacle. MtnSOV will only bike when it is light out, there is no rain, and the
temperature is mild.
MtnBike takes a 2.5 mile bike commute for relaxation, not for a workout. She mentally
organizes her day on the way to work, and unwinds on the way home. She rides a Schwinn
Cruiser bike, built for comfort, not speed. A special bike basket carries her things. She has a
special yellow rain outfit and the bike's fenders are very helpful when it rains. She utilizes a
dedicated, car-free bike path for some of the trip (which she enjoys), which reduces her commute
distance compared to driving. She likes riding on residential streets, but believes arterial streets
such as Page Mill Road and Foothill Expressway are unsafe, "some drivers are cell phoning."
New Mobility Chapter Page 95 of 187

CarlosSOV was very helpful in defining the casual biking concept, pointing out that strenuous
uphill biking, especially when it induces sweat, is objectionable. Like MtnSOV and MtnBike,
Carlos SOV speaks fondly of "peaceful, joyful," dedicated bike paths where there is no chance of
getting hit by a car.
California's most famous bicycle advocate and a former member of many bicycle advocacy
groups and advisory committees, Ellen Fletcher, sums up Palo Alto casual biking thusly:
"An efficient transit feeder system blanketing SRP would enable bicycle + bike locker + PRT shuttle mixed mode commuting into the SRP. In the past, Palo Alto residents had voiced 4 main objections to commuting into the SRP via bike. With the shuttle helping out, these objections are reduced.1) Some residents objected to the distance, especially when commuting from Crescent Park or Charleston all the way to Roche, EPRI, and Xerox PARC South of Foothill Expressway. With the shuttle, residents can ride to the CA Ave. Caltrain station, park their bikes in a state-of-the-art bike locker, and take the shuttle the rest of the way. 2) Some residents indicated the hill South of Hanover was too steep, and made some folks come into work sweaty. With shuttle, a shorter commute ride is possible, using shuttle to scale the hill. 3) Some potential bikers were discouraged by the noise and speed of cars whizzing alongside the Page Mill bike lane. By mixing quiet, relaxing, tree-lined Palo Alto residential bike riding with zero pollution shuttle within the Page Mill area, residents enjoy a better overall commute than via auto. If you make it better to ride a bike than drive a car, people will take it from there. 4) Potential bikers had expressed a desire to get off their corporate campuses during lunchtime, but had limited time for biking. The shuttle provides a way for folks to get off campus at lunch, using the monorail to access California Avenue retail, Fry's, and Palo Alto Square." [Bicycle]
Bus commuters.
Only three survey respondents compared bus to driving alone, choosing bus 2, 3, and 4 days per
week. No important conclusions could be drawn from this small sample.
New Mobility Chapter Page 96 of 187
Results: Mode Split and PRT ridership
Participants’ current drive alone mode share is 87%. Their stated commute mode split in a
PRT+D2D world is 45% drive alone, 32% shared ride, and 15% train (6% bus, 3% bike/ped). It
is unwise to extrapolate from 62 respondents to a 20,000 employee research park, except to
understand the order of magnitude of the change that may be possible. Assuming 2.2 people per
shared ride vehicle, this mode shift would remove 6,600 autos from the research park.
Calculations are provided in a sub-section below. At 350 square feet per parking space, this
accounts for 50 acres. The land in Stanford Research Park is very conservatively valued at
$3M/acre, for a total value of $150M for the reclaimed parking. This valuation covers the $50M
capital cost that PRT proponents project. If this land were in-filled, even more ridership would
be generated.
Combining commute and lunchtime trips, employees indicated they will take 1.32 PRT rides per
day. Extrapolating to 20,000 employees yields 26,000 rides per day and about $5 million/year in
fare box revenue. Participants had no adverse comments about a $0.75 fare. PRT proponents
project lower than $5 million/year annual operating and maintenance costs.
Calculations
Our 62 respondents have the following current mode split:Initial mode split
Drive alone 89.0%
Carpool 9.6%
Train 0.0%
Bus 0.0%
Bike/walk 1.5%
Total 100.0%
For the 62 respondents who explored PRT+D2D scenarios, their current mode split results in
93.4 cars per 100 employees:
89 + 9.6/2.2 = 93.4
New Mobility Chapter Page 97 of 187

When presented with PRT+D2D base alternatives, resultant mode split is:
Resultant mode split
Drive alone 45.6%
Carpool 32.1%
Train 15.5%
Bus 4.2%
Bike/walk 2.6%
Total 100.0%
This results in 60.2 cars per 100 employees:
45.6 + 32.1/2.2 = 60.2.
The difference in cars per 100 people is 33.2. For a 20,000-employee office park, the difference
is 20,000 * 33.2 / 100 = 6,640 cars.
Criticisms
A larger sample of SRP workers would have been more convincing than a sample of only 62
from a single employer. Because of the hypothetical nature of the study, based on a number of
questionable assumptions, there is no way to obtain statistically significant and definitive results.
However, surveying at least one more employer for another 60 employees would be very
informative. Entreaties were made to 5 other companies in the research park, without success.
Some companies in the research park conduct long-term research with 5 to 10 year
development programs, while others deliver products much more frequently. EPRI falls in the
long-term research category. It would be interesting to see if the results translate to companies
with a shorter development horizon. These companies may have workers with slightly different
commute characteristics, such as an increased need to work overtime to deliver new products on
time. On account of this, this group might be inclined to drive alone more than researchers.
New Mobility Chapter Page 98 of 187

Our stereotypical Silicon Valley worker is a single, 20-something workaholic alpha male with
a short commute. Additional characteristics include: high psychological need for independence,
high cell phone usage, and high stress level. We didn't come across any employees who fit the
stereotype in the interviews and surveys. This group deserves some attention.
There were only three participants each taking the bike/walk and bus options. More participants
trying these two branches would be very informative. As of now, it is hard to draw any
significant conclusions.
In a typical academic study attempting to obtain statistically significant results, a control group
would be used. As this study used a product marketing approach, there was no need for a control
group.
The study assumed a Year 2008 commute landscape as follows: a) Caltrain Baby Bullet service
operating as fast as a car during peak hours, b) auto congestion back at Year 2000 levels, but not
at the trendline for the nightmarish ABAG 2020 forecast, c) El Camino bus preference service
operating at only a 20% time dis-advantage compared to driving alone, d) VTA will provide a
Foothill Expressway SRP commuter bus from Los Altos, e) no new HOV projects will be
funded, f) California Avenue retail expands to serve SRP needs better, de-generating some
errands with new stores, g) continued progression of cellular/wireless technology. One thing is
very certain, these assumptions will be wrong!
The survey team was biased in favor of PRT. Unfortunately, there does not seem to be an easy
way to fund PRT research through standard transportation funding mechanisms; therefore,
enthusiastic PRT volunteers are the only people who are willing to undertake such research.
Given our acknowledged bias, we took great pains to conduct fair interviews and surveys,
expending considerable effort to explain to people why they should continue to drive alone.
Individual commute scenario time comparisons may have been incorrectly calculated. I intend
to have VTA analyze a sample of the scenarios and provide an opinion as to their accuracy.
New Mobility Chapter Page 99 of 187

There were about 10 San Francisco commuters who will be well served by the imminent opening
of BART to Millbrae Caltrain. I found out after the survey that the transfer time between BART
and Caltrain will probably be five minutes longer than I anticipated – BART runs at 15-minute
intervals and Caltrain runs at many different intervals during peak, there is no schedule
coordination.
Commute scenario cost comparisons were biased against driving alone. Auto costs were
calculated using full costs ($0.35 per mile), including insurance, depreciation, registration, and
maintenance. A more balanced survey would have included both full and variable (primarily
gas) costs, and indicated that most commuters base their cost comparison on "out of pocket"
costs. [Transit Metropolis]
Normally, commuters perceive an extra dis-utility from waiting and transferring involved in
commute alternatives. Because of our cellular commuter tracking applications that eliminate
uncertainty, our survey assumed away this dis-utility.
We also believe the "one alternative compared to driving alone" was too simple for some
commuters who needed to compare three modes.
The psychology of commuting is quite complex and there is no way to cover it all in a 25-minute
survey. It can be argued that the questions emphasize the wrong attitudinal issues and have
completely left out some important items. Examples of missing items to be considered for a
follow-on survey:
Professor Cervero cited a finding where transit riders resisted climbing stairs, such as
they might encounter taking PRT.
The Chalmers University (Sweden) thematic study of PRT used a virtual reality
simulation of PRT. One conclusion was that riding in a wide Taxi 2000-style vehicle on
a narrow guideway produced some fear of heights and fear of the vehicle tipping over.
[Chalmers]
One survey respondent mentioned a concern with public transit over being exposed to
colds from sneezing, coughing public passengers.
New Mobility Chapter Page 100 of 187

Another respondent pointed out that the challenge of dropping off school children was
missing. Question #54 (end of day activities) is a good place to include this.
D2D's HomeSafe application wasn't mentioned, but could be perceived as very important
by safety-conscious commuters.
And one survey participant chided us for not stressing the reduced auto wear and tear that
carpooling provides.
Items that increased the stated shift away from driving alone:
1. Survey participants self-selected themselves. Whereas these participants had a
surprisingly high current drive alone mode share of 87%, in all probability these people
were more interested than the average EPRI employee in finding a way to get out of their
car. In addition, the average one way commute distance of this group, 19 miles, is longer
than that of the typical Santa Clara County commuter who travels 14 miles one way. [RIDES
2002] One potential would be to collect the attitudinal factors used in Cambridge
Systematics San Mateo (adjacent county to Santa Clara) model to ascertain whether the
attitudes of these to employers were relatively normal or if there is an attitudinal
predisposition to avoid driving alone. While this approach seems promising, it would
add a large amount of questions and time to the survey, increasing the chances of a
discouraged participant who won't complete the survey or an impatient participant who
won't take the time to provide their best thinking in answering the questions.
2. The phenomenon of the Social Desirability Effect states that survey participants will
tend to overstate their adoption of technologies that produce a social benefit. In Question
1, we attempt to counter this effect as follows: “For 80% of employees in Year 2003,
commuting by driving alone is the best choice to meet their needs. In this survey, please
provide us with your most thoughtful answers and opinions. There is a tendency to feel
PRESSURE to embrace new things – we’d prefer that you take a skeptical view and point
out flaws.”
Items that decreased the resulting shift away from driving alone:
1. Jeff Tumlin, Principal Consultant at Nelson Nygaard Associates, points out that the
replacement of a San Francisco bus route with a much slower old-fashioned streetcar
New Mobility Chapter Page 101 of 187

generated a large increase in ridership. There is a novelty factor that may serve to
increase ridership, so that once a PRT system is built, people may ride it simply for the
novelty. However, this may be more applicable for a stronger tourist community such as
San Francisco.
2. A few participants indicated that they refused to believe in our hypothetical scenario.
This “over-thinking” reflects negatively on PRT and D2D. Our instructions to counter
the Social Desirability Effect (see above) may have been too discouraging. For instance,
two participants didn't believe car sharing was possible: A) "This alternative does not
seem plausible -- loaner car is a target for theft or irresponsibility." B) "Drive away in 5
minutes? I doubt it. Plus the loaner parking lot may be a long way from my destination
and take a big chunk out of my 30 to 60-minute lunch. Loaner cars add to the overall
system cost."
3. The Tipping Point shows that a critical mass can be achieved where once a certain
commute alternative market share is reached, interaction and cultural effects may take
over, introducing an even larger shift away from driving alone. [Tipping]
4. Some of the participants may not have chosen their most realistic alternative, because
they were more interested in exploring a more whimsical alternative, resulting in a less
competitive alternative. Likewise, if our interceptors had more time to work with
people, the negotiation might have led to a different and more competitive alternative.
IMPLICATIONS
Many people with the carpool option prefer to carpool only two or three days per week, this adds
a new requirement to the carpool matchmaking application, the ability to do a great job
assembling "part-time carpools."
Creating a sizable reduction in driving alone commuting to suburban office parks is possible,
but very hard. On top of the technical hurdles lie political hurdles which must also be
overcome.
New Mobility Chapter Page 102 of 187

PRT shuttles may contribute to a sizable reduction in drive alone commutes, but are not
sufficient in and of themselves because solving only the last mile problem leaves many other
problems unsolved. Thus, the new mobility features described in this paper are also required. A
conclusion that a very comprehensive service is required is also valid.
Given the current sub-optimal transit options and the visceral reaction commuters had about bus
shuttles, current investments in improving bus shuttle frequency, speed, and ride quality should
be pursued. The more of the attitudinal details that can be addressed, the more successful bus
shuttles will be. Further study is required to ascertain how much improved bus shuttles can help,
but the conclusion is definitely that level of service needs to be improved. Transportation
consulting money spent on bus shuttles is well spent.
It should be underscored that this study does not lead to the conclusion that investments in
existing commute alternatives will not be effective. In fact, there might be some combination of
existing modes combined with advanced new mobility that creates an intermediate sized
reduction in driving alone, say a 5% reduction. However, the author is skeptical that there is any
way to dramatically reduce driving alone by 30% or more without a very high quality solution to
the last mile problem.
Ridesharing services such as Rides for Bay Area Commuters should implement improved
matchmaking services immediately. Current systems are lacking. It can be argued that
romantic matchmaking services should be given a chance to bid for this business, as their
expertise is very appropriate.
Wireless geolocation-enabled tracking applications are necessary, easy to implement, but hard
to bring about politically. The economic externalities require political creativity to overcome.
The "casual biker theory" appears to be correct and deserves further study.
New Mobility Chapter Page 103 of 187

Bus agencies operating commute buses should conduct research on the efficacy of motion
sickness remedies and should promote them (see question 31). Only a small number of current
bus riders need to participate in such a study to achieve useful results.
As far as advocating PRT + D2D to the masses, there is a large educational component that is
required. The immersive educational techniques used in the survey protocol should translate
well for promotional advocacy. Should a PRT + D2D ballot initiative be brought forth, avid
volunteers could set up at a large apartment buildings, offices, and shopping centers, collecting
signatures. Those same citizens could also take the survey, creating a valuable patronage
forecast for the initiative location. So the signature collection process could actually be used to
create a demand analysis that further strengthens the initiatives case. The drawback to this
approach is that it is so labor intensive and requires such talented volunteer signature collectors.
But, it fosters an in-depth image of the service.
REFERENCES
[Augenstein] Meetings with VTA's Chris Augentstein, 4/11/02 and 4/28/03.
[Bicycle] http://www.cities21.org/paSupport.htm#Fletcher
[Chalmers] "PRT - a Suitable Transport System for Urban Areas in Sweden? A thematic
research programme," performed during the years 1994-97 at Chalmers University of
Technology. Program Director: Dr Ingmar Andreasson, LogistikCentrum AB.
http://www.zeenergy.net/leantransit/kfbR98_38.pdf , Chalmers University of
Technology, SE-412 96 Gothenburg, Sweden • Phone: +46 - (0)31 772 1000.
[Goodman] Rachel Goodman, "A Traveler In Time: Understanding Deterrents to
Walking to Work", World Transport Policy and Practice, Volume 7, Number 4, 2001, 40-
54. http://ecoplan.org/wtpp/
[Shaheen] Dynamics in behavioral adaptation to a transportation innovation : a case study
of Carlink--a smart carsharing system, by Susan A. Shaheen, 1999.
[Shaheen Meeting] From meetings with Susan Shaheen, February 4, 2003 and January 8,
2002.
New Mobility Chapter Page 104 of 187

[Tipping] The Tipping Point: How Little Things Can Make a Big Difference. by
Malcolm Gladwell. Publisher: Little Brown & Company; (February 2000). ISBN:
0316316962.
[Transit Metropolis] The Transit Metropolis: A Global Inquiry, Robert Cervero. Island
Press, 1998.
New Mobility Chapter Page 105 of 187

PART A: EPRI e-mails in support of the April 30 survey:
From: Smith, Carole
Sent: Thursday, April 24, 2003 1:48 PM
<< EPRI bulletin is a web-based company newsletter >>
EPRI BULLETIN ARTICLE
Research on futuristic electric transit being conducted at EPRI Palo Alto EPRI is conducting an in-depth "electric shuttle demand analysis" for Stanford Research Park that will
take a hard look at our very specific commute challenges. The study explores new electric transit
technology that could reduce traffic and commute time into Stanford Research Park, accounting for the
delicate psychology of suburban commuting. A picture of the new transit can be found at:
< http://www.cities21.org/prtStation.jpg > .
Employees invited to participate in study
On Wednesday, April 30, EPRI-sponsored research on the futuristic electric transit will be conducted in
the lower courtyard/covered patio area. Employees are invited to come by to check out the display and be
a part of the research. To participate in a short educational program/survey, sign up online for a 15-
minute time-slot at <\\uscapf01\cifproject\April30schedule.xls> . (Enter your name and email address.)
The electric transit study is being done in conjunction with U.C. Berkeley Transportation Planning
Professors; Palo Alto design firms IDEO, Mindtribe, and Velocity 11; Palo Alto transportation non-profit
Cities21 (part of the San Francisco Foundation); national transportation non-profit the Advanced Transit
Association; and the Anthony-Maymudes Foundation.
Please contact Jim Galanis, 650-855-XXXX for questions.
From: Smith, Carole
Sent: Friday, April 25, 2003 11:04AM
Survey Chapter Page 106 of 187

ALL PALO ALTO EMAIL
To: All Palo Alto Employees
From: Jim Galanis, M&CR
Re: Your Participation in EPRI Research on Futuristic Electric Transit
EPRI is conducting an in-depth "electric shuttle demand analysis" for Stanford Research Park that will
take a hard look at your own very specific commute challenges. The study explores new electric transit
technology that could reduce traffic and commute time into Stanford Research Park, accounting for the
delicate psychology of suburban commuting.
On Wednesday, April 30, EPRI-sponsored research on this futuristic electric transit will be conducted in
the lower courtyard/covered patio area. Employees are invited to check out the display and participate in
a short educational program/survey. Please sign-up in advance for a 15-minute survey time-slot -- just
click on this link and enter your name and email address in a time slot convenient for you: <\\uscapf01\
cifproject\April30schedule.xls>.
See today's EPRI Bulletin or contact Jim Galanis for more information.
Carole Smith
Employee Communications Specialist
EPRI Bulletin Editor 650-855-XXXX
From: Smith, Carole
Sent: Monday, April 28, 2003 11:06 AM To: All EPRI Palo Alto Employees
From: Carole Smith, Jim Galanis, M&CR
Re: FREE LUNCH! Future Transit Research EPRI is conducting an in-depth "electric shuttle demand analysis" to evaluate commute alternatives in
Stanford Research Park. One portion of the study features a “full size replica” of the shuttle, recently
displayed on the Building 2 lawn. (http://www.cities21.org/PRTmodel/030423-005sm.jpg)
On Wednesday, April 30, EPRI-sponsored research will be conducted in the lower courtyard/covered
patio area between buildings 2 and 3. Employees are invited to check out the display and participate in a
short educational program/survey. Please sign-up in advance for a 15-minute survey time-slot -- just click
Survey Chapter Page 107 of 187

on this link and enter your name and email address in a time slot convenient for you: \\uscapf01\cifproject\
April30schedule.xls. SURVEY PARTICIPANTS WILL RECEIVE AN $8 CAFETERIA LUNCH!
See the EPRI Bulletin (http://inside.epri.com/bulletin) or contact Jim Galanis for more information.
Carole Smith
Employee Communications Specialist
EPRI Bulletin Editor
650-855-XXXX
From: Galanis, James [mailto:[email protected]]Sent: Tuesday, April 29, 2003 12:53 PMTo: All survey participantsCc: [email protected]: Instructions for tomorrow's electric shuttle transportation survey
Dear Survey Participants:
First off, thank you in advance for you participation in the EPRI and Cities21 co-sponsored electric shuttle
transportation survey! Early reaction from pre-tests shows that respondents found the exercise both stimulating and
educational. We hope you will agree.
Below are a few things you need to know in advance of tomorrow’s survey:
1) Before taking the survey, please note the following about your daily commute: 1) the total time in minutes that it
takes from your home doorstep to your office entrance and 2) the total number of miles required. Both estimates
should be calculated regardless of the transportation mode(s) employed (e.g. car, bus, etc).
2) The survey consists of two parts: 1) a brief, 10-minute “exposure” to a full-scale model (located on grass
between Building 2 and Lobby 1) and 2) a follow-up web survey (20 minutes).
3) For the hosted 10-minute exposure, to ensure scheduling efficiency, please arrive five minutes before your
scheduled time (to confirm, please check the spreadsheet in which you originally entered your time). Having
completed the 10-minutes exposure, please then proceed to the covered garden area at the corner of Buildings 2 and
3 for further instructions.
Survey Chapter Page 108 of 187
Should you have any questions about the survey or process, please do not hesitate to call me (xXXXX) or Steve
Raney of Cities21 (650-400-XXXX)
Again, thank you for your assistance in this effort.
Best regards,
Jim Galanis, Marketing & Client Relations
From: Galanis, James [mailto:[email protected]]Sent: Thursday, May 01, 2003 10:29 AMTo: All survey participantsCc: [email protected]: Electric Shuttle Survey
All:
On behalf of Steve Raney and Cities21 (survey sponsor), I am grateful for your participation in
yesterday's survey. Your feedback will critically inform Cities21 planners in their quest to improve local
area transportation alternatives. To those who have not yet received the URL with their customized
commute alternative, please note that you will receive it today or tomorrow. Please contact me by close of
business Monday if you have not.
Thank you again and best regards,
Jim Galanis, Marketing & Client Relations
Survey Chapter Page 109 of 187

PART B: Demographics Clipboard Instrument
Demographics
Name / E-mail: _________________________________________________________
Home address: (zero out last two digits. 1487 Pitman becomes 1400 Pitman)
______________________________________________________________________
Commute distance: __________________________
AM leave for work time: _______________________
Current commute mode split: (20% Caltrain, 20% carpool, 60% drive alone)
______________________________________________________________________
Appendix: Survey Page 110 of 187

If driving alone: Given a super-duper connecting rapid shuttle, what do you think the
most competitive commute alternative will be?
Carpool Train Bus Bike/Walk
Gender: male female
Appendix: Survey Page 111 of 187

PART C: SURVEYMONKEY SURVEY
TITLE: EPRI SRP Electric Shuttle + D2D Survey
<Questions marked with a ‘*’ are mandatory response>
PAGE 1: Introduction
Thank you for participating in our short educational program, featuring the 3D animation and full size monorail
model (click for a picture).
Our survey should take 30 minutes or less to complete. Some alternatives are shorter than others. Print out the last
page to receive your free lunch.
Below is the hypothetical scenario for you to keep in mind during the survey:
Our imaginary company is called D2D MOBILITY. We provide you with door-to-door mobility from home to work
and back, and errands in-between! We are a partnership of concerned organizations working to make commute
alternatives as convenient and flexible as driving alone. Partners include transit agencies; City of Palo Alto;
Stanford; large local employers; and key service providers including a cellular phone service, local taxi company,
car sharing service, a rental car firm, bicycle coalition, grocery service, RIDES ridesharing service, Waiters on
Wheels, and PurpleTie.com (web based pickup/delivery of dry cleaning, photos, etc.).
The YEAR IS 2008, but you haven’t aged! You still have the same job, live in the same place, and the people
around you are the same. The economy has picked up, to the point where traffic is back to the peak level we saw in
Year 2000. So traffic is worse than it is today, but we haven’t hit complete gridlock. Gas prices are the same. The
High Occupancy Vehicle lane network is the same, Caltrain and bus service are faster and more frequent. A few new
bus routes have been added. If you didn’t own a cell phone in 2003, you own one now, and have it nearby at all
times. The cell phone works reliably everywhere, including building interiors.
A RAPID ELECTRIC, ELEVATED SHUTTLE services Stanford Research Park buildings, connecting with buses,
Caltrain, bike/carpool parking, California Avenue stores, YMCA, banks, Fry’s, and Stanford hiking trails. New
California Avenue enterprises have sprung up to serve your errands and activities more ably (including day care).
The shuttle system provides the fastest way to get around, faster than via car. The three-person vehicles are always
waiting for you at convenient stations – there is no waiting. The vehicles travel non-stop to your destination,
Appendix: Survey Page 112 of 187

avoiding the auto traffic below. You either ride alone or with people you choose. Stations are located in the middle
of corporate campuses, not down by the street. The vehicles are comfortable, quiet, smooth-riding, and exhaust-free.
The system is safer than driving on the streets below and can robustly withstand large seismic events.
LET'S BEGIN THE SURVEY!
Please provide your e-mail address. This is the way we track your specific commute details. Our PRIVACY
POLICY: we may send you up to three e-mail messages about the survey; for instance, to compliment you for a
valuable survey comment or to provide a web link to the final demand analysis report. We will not give your e-mail
address out to any third parties. We will not contact you about anything except the survey.
* 1. Please enter your e-mail address ____________________________
Over the last six months, we’ve conducted in-depth interviews about commuting with Stanford Research Park
employees. From these interviews, we’ve developed some proposed solutions to commuting problems that were
described. You may find that you'll know more about commuting after taking this survey.
For 80% of employees in Year 2003, commuting by driving alone is the best choice to meet their needs. In this
survey, please provide us with your most thoughtful answers and opinions. There is a tendency to feel PRESSURE
to embrace new things – we’d prefer that you take a skeptical view and point out flaws.
* 2. You have received an e-mail message comparing one of four commute alternatives to driving alone. (Whether
you currently drive alone or use a commute alternative, please proceed with the survey.)
Which commute alternative was provided? Carpool Train Bus Bike/walk <SurveyMonkey jumps to the
appropriate page>
PAGE 2: Carpool
* 3. CHIT-CHAT Problem: Unlike public transit, carpooling usually creates an expectation for chit-chat. For some,
this means awkward silence or forced conversation. For others, it means forcing yourself to be cheerful when you're
not a morning person. In considering carpooling, how important of a concern is addressing the chit-chat problem? (0
= not at all important, 10 = extremely important): 0 1 2 3 4 5 6 7 8 9 10
* 4. CHIT-CHAT Solution: With D2D’s ridematching service, you may specify a “quiet car” that is free from chit-
chat, freeing you for activities like working, napping, or relaxing. The "quiet car" rule is used successfully in Bay
Bridge "casual carpooling." How effective do you believe this solution will be in solving the chit-chat problem? (0 =
not at all effective, 10 = extremely effective): 0 1 2 3 4 5 6 7 8 9 10
Appendix: Survey Page 113 of 187

5. OPTIONAL: Comments about the chit-chat problem/solution? <free-form multi-line text entry>
* 6. PERSONAL TIME Problem: When you drive alone, you can engage in a variety of private behaviors: sing off-
key opera at the top of your voice, talk to yourself, make intimate cell phone calls, etc. When you carpool, you lose
that freedom. For many people working in stressful jobs, the drive alone to work is where they "psych up" for the
day. The drive home is where they "decompress" from their workday and transition to a different state of mind.
Some have characterized this time as "the only time I have to myself." In considering carpooling, how important of a
concern is addressing the personal time problem? (0 = not at all important, 10 = extremely important): 0 1 2 3 4 5 6
7 8 9 10
* 7. PERSONAL TIME Solution: Being a carpool passenger can provide more productive use of time than driving
alone. You can jot notes down on paper, close your eyes and practice relaxation breathing, take a nap to increase
your energy level, etc. Many people find being a passenger reduces their stress. How effective do you believe this
solution will be in solving the personal time problem? (0 = not at all effective, 10 = extremely effective): 0 1 2 3 4
5 6 7 8 9 10
8. OPTIONAL: Comments about the personal time problem/solution? <free-form multi-line text entry>
* 9. PROXIMITY Problem: There are multiple arrangements of carpools and vanpools to choose from, depending
on the number of people you share a ride with, and how complicated pick-up and drop-offs are.
Many short distance (less than 15 miles) carpools consist of housemates commuting to the same office location.
Many long distance carpools (more than 15 miles) consist of people commuting to the same office location. Some of
these long distance carpools feature three carpoolers who drive from 5 to 10 minutes in the morning to park at a
shopping center, then get into a single car to carpool to work.
If you want to form a carpool/vanpool, it is often hard to find people who live nearby, work at the same office
location (or at an adjacent office), and share compatible hours. Often, people are unwilling to carpool with workers
from other companies within the research park, because this entails making drop-offs, stopping at extra stop lights,
and even backtracking. There are 20,000 workers in Stanford Research Park, but people often limit their ridesharing
search to the 500 to 2,000 employees who work at their office location.
In considering carpooling, how important of a concern is addressing the proximity problem? (0 = not at all
important, 10 = extremely important): 0 1 2 3 4 5 6 7 8 9 10
Appendix: Survey Page 114 of 187

* 10. PROXIMITY Solution: For short distance carpools, D2D promotes the formation of two-person carpools
comprised of acquaintances living within 10 blocks, working anywhere in the research park. With 20,000 employees
to choose from, there are plenty of neighbors to choose from. Passengers are picked up at their residence. On the
way to work, the car is parked in a convenient parking lot, and the two people may use the electric shuttle to travel
to their offices.
For long distance carpools, the solution works in the same way – the electric shuttle provides 20,000 employees to
rideshare with, probably shortening the morning pick-up distance.
We won't delve into other ridesharing scenarios in this section, but keep in mind their are other forms that may work
for you, such as driving your toddler to a day care facility, and taking a vanpool with 5 other parents from there. In
considering carpooling, how effective is this solution in addressing the proximity problem? (0 = not at all effective,
10 = extremely effective): 0 1 2 3 4 5 6 7 8 9 10
11. OPTIONAL: Comments about the proximity problem/solution? <free-form multi-line text entry>
* 12. COMPATIBILITY Problem: There are many potential “social” problems with carpooling: driving habits,
radio tastes, political views, social differences (gender, financial status, etc), smoking, heavy perfume,
cramped/messy cars, cell phone use, temperature/window opening preferences. There have been carpools where
members were "fired." In considering carpooling, how important of a concern is addressing the compatibility
problem? (0 = not at all important, 10 = extremely important): 0 1 2 3 4 5 6 7 8 9 10
* 13. COMPATIBILITY Solution: D2D will provide a sophisticated ridematching system, similar to dating services
like match.com and datemeister.com. Each potential carpooler will provide: a picture; personal, job, and car
descriptions; various preferences; and work start/end time. You will be able to anonymously screen and reject
incompatible people, without causing hurt feelings. Your preferences will exclude very incompatible people from
viewing your information; for instance, many women prefer not to carpool with men and would exclude men from
accessing their information. If you'd like, D2D will subsidize a "get to know you" lunch between yourself and a
potential carpooler to ensure compatibility. Your goal is to find a pleasant acquaintance, not a best friend. Stanford
Research Park employees provide a large, well-educated pool of people to select from. D2D will provide
commonsense “rules of carpool etiquette” about windows, smoking, cell phones, stopping for gas, and default radio
station, that serve as a starting point for courteous interaction. Carpools join and break as people change jobs, work
hours, and after-work activities, so you might use the ridematch system once every 12 to 24 months. How effective
do you believe this solution will be in solving the compatibility problem? (0 = not at all effective, 10 = extremely
effective): 0 1 2 3 4 5 6 7 8 9 10
14. OPTIONAL: Comments about the compatibility problem/solution? <free-form multi-line text entry>
Appendix: Survey Page 115 of 187

* 15. RELIABILITY Problem: With a carpool, you have rely on someone to get to work and vice versa. Would you
be concerned about getting a flat tire, causing someone else to be late for work? Carpoolers are typically reliable
within a couple of minutes in the morning. For the ride home, more things come up that vary the schedule. You
might find yourself torn between completing a last e-mail or packing up and leaving. You might consistently cause
someone to wait a couple of minutes or vice versa. In considering carpooling, how important of a concern is
addressing the reliability problem? (0 = not at all important, 10 = extremely important): 0 1 2 3 4 5 6 7 8 9 10
* 16. RELIABILITY Solution: Year 2008 cell phones have a graphical display and can provide your precise current
location to D2D. These features help D2D help you. D2D can automatically nudge people to make their carpool
connection via automatic reminders and by checking location to make sure people have moved from their desk. The
nudges will come silently to the cell phone as short text messages - they will be persistent, but not annoying. You
will be able to monitor the progress of carpoolers. The uncertainty of whether to work on that last e-mail will be
eliminated – you’ll know if the other carpooler has left their desk. If one person will be 5 or 10 minutes late, they
can touch a few buttons on their cell phone (or use the web) to reliably notify the other person, even if something
comes up at the last second.
If you get a flat tire, touch a few buttons on the cell phone and easily notify bosses, order a tow truck, etc. D2D is
your trusted backup, taking final responsibility to get people to/from work, including dispatching taxis or any of a
number of creative solutions.
In addition, your company is a member of D2D and is culturally supportive of carpooling. Your company
encourages carpoolers to leave at the same time every time, which may mean bringing work home at night. Your
company might supply a laptop but have you pay for a broadband home internet connection. How effective do you
believe this solution will be in solving the reliability problem? (0 = not at all effective, 10 = extremely effective): 0
1 2 3 4 5 6 7 8 9 10
17. OPTIONAL: Comments about the reliability problem/solution? <free-form multi-line text entry>
* 18. PERSONAL SUPPORT Problem: Changing away from driving alone is hard. You’ll face a number of
problems, some of which may require considerable time and effort to solve. It is as if you have to become a
“commute alternatives” expert. Some have described the switch away from driving alone as a lifestyle change. Some
of the problems you may face might include: how do I make the carpool environment the most
comfortable/productive for me? How do I resolve an interpersonal issue within the carpool? Is there someone I can
talk to about their carpooling experiences before I make the leap? In considering carpooling, how important of a
concern is addressing the personal support problem? (0 = not at all important, 10 = extremely important): 0 1 2 3 4
5 6 7 8 9 10
Appendix: Survey Page 116 of 187

* 19. PERSONAL SUPPORT Solution: D2D will organize volunteers in your city who are committed to providing
the personal touch to encourage you. They will be selected for their listening and people skills. They will have some
great tips for you from their experience and will personally ensure that your first week of carpooling is successful,
checking up on your experience with phone calls. In addition, D2D will sponsor a web-based “commute
community” where you can anonymously post questions and have employees help you. People who have invested
the time to solve commute problems tend to be very happy to share their insight with others, in order to prevent
others from exerting time and effort to research a solution. If you want advice on the best personal, portable audio
device, this is the place. If you need to vent, this is the place. How effective do you believe this solution will be in
solving the personal support problem? (0 = not at all effective, 10 = extremely effective) 0 1 2 3 4 5 6 7 8 9 10
20. OPTIONAL: Comments about the personal support problem/solution? <free-form multi-line text entry>
<SurveyMonkey jumps to Page 6: combined>
Page 3: Train
* 21. TRAIN EXPERIENCE Problem: Changing away from driving alone is hard. You’ll face a number of
problems, some of which may require considerable time and effort to solve. It is as if you have to become a
“commute alternatives” expert. Some have described the switch away from driving alone as a lifestyle change.
Taking the train entails riding with strangers, which is uncomfortable for some folks. From previous research, we’ve
found that folks rate the Caltrain experience high compared to BART and bus. Caltrain riders are more “considerate
and upscale” than BART or bus riders. They are less likely to carry on a loud conversation, use audio headsets that
“leak” out music, or convey a distracting odor. You should expect to experience a handful of unsettling train
experiences every year.
You will not be expected to strike up a conversation with the person next to you, nor are you required to make eye
contact with other train passengers – public transit does not create a social expectation.
Caltrain is significantly noisier than riding inside a car. The seats are comfy with a high backrest that facilitates
reading. 2/3 of folks sit next to someone, and 1/3 have a private seat. You can assume you’ll be able to find a seat
and not have to stand. Driving to Caltrain and parking may be a hassle.
Your first few experiences with Caltrain may be stressful, as you struggle to get the hang of things. Once you do,
taking Caltrain won’t require much thought.
Appendix: Survey Page 117 of 187
In considering the train, how important of a concern is addressing problems with the train experience? (0 = not at all
important, 10 = extremely important): 0 1 2 3 4 5 6 7 8 9 10
* 22. TRAIN EXPERIENCE - PERSONAL SUPPORT Solution: D2D will organize volunteers in your city who are
committed to providing the personal touch to encourage you. They will be selected for their listening and people
skills. They will have some great tips for you from their experience and will personally ensure that your first
Caltrain week is successful, checking up on your experience with phone calls.
In addition, D2D will sponsor a web-based “commute community” where you can anonymously post questions and
have employees help you. People who have invested the time to solve commute problems tend to be very happy to
share their insight with others, in order to prevent others from exerting time and effort to research a solution. For
example, if you want advice on the best personal, portable audio device, this is the place. If you need to vent, this is
the place. How effective do you believe this solution will be in solving the chit-chat problem? (0 = not at all
effective, 10 = extremely effective):
0 1 2 3 4 5 6 7 8 9 10
23. OPTIONAL: Comments about the train experience problem / personal support solution?
<free-form multi-line text entry>
* 24. RELIABILITY Problem: With Caltrain, you have to rely on Caltrain's schedule. Trains are typically reliable
within a couple of minutes. Every once in a while, there’s an equipment problem that delays your commute.
Scheduled transit also brings about the “cutting it too close” problem, where you leave for a the train too late or get
delayed on-route, missing your train by seconds. When you get to the station, there’s the added stress of not
knowing when your train will arrive. In considering the train, how important of a concern is addressing the
reliability problem? (0 = not at all important, 10 = extremely important): 0 1 2 3 4 5 6 7 8 9 10
* 25. RELIABILITY Solution: In Year 2008, Caltrain provides frequent service, operating every 15 minutes during
commute time, and every 20 minutes during mid-day and in the evening to 10:30PM.
Your D2D enabled cell phone smoothes away some problems via silent, short text messages. You are notified of
train delays, often before you leave for the train. You can also configure your D2D phone to “nudge” you to leave
for the train and/or to monitor the train’s progress so that you’ll know when you REALLY have to put down your
morning paper and coffee and hustle out your front door. For your trip home, your D2D phone will calculate when
you need to shut down your computer to hop on the electric shuttle to connect to Caltrain. These services are also
available via the web. Year 2008 cell phones know your precise current location – this is communicated to D2D to
assist your commute.
Appendix: Survey Page 118 of 187

When there is a major train delay, D2D is your trusted backup, taking final responsibility to get people to/from
work, including dispatching taxis or any of a number of creative solutions.
In addition, your company is a member of D2D and is culturally supportive of Caltrain commutes. Your company
encourages you to leave work at a regular hour to catch the train, which may mean bringing work home at night.
Your company might supply a laptop but have you pay for a broadband home internet connection. How effective do
you believe this solution will be in solving the reliability problem? (0 = not at all effective, 10 = extremely
effective):
0 1 2 3 4 5 6 7 8 9 10
26. OPTIONAL: Comments about this reliability problem/solution? <free-form multi-line text entry>
* 27. PERSONAL TIME Problem: When you drive alone, you can undertake a variety of private behaviors: sing
off-key opera at the top of your voice, talk to yourself, make intimate cell phone calls, etc. When you take Caltrain,
you (hopefully) lose that freedom. For many people working in stressful jobs, the drive alone to work is where they
"psych up" for the day. The drive home is where they "decompress" from their workday and transition to a different
state of mind. Some have characterized this time as "the only time I have to myself." In considering the train, how
important of a concern is addressing the personal time problem? (0 = not at all important, 10 = extremely important):
0 1 2 3 4 5 6 7 8 9 10
* 28. PERSONAL TIME Solution: Being a Caltrain passenger can provide more productive use of time than driving
alone. You can jot notes down on paper, close your eyes and practice relaxation breathing, take a nap to increase
your energy level, etc. Many people find being a passenger reduces their stress. How effective do you believe the
solution will be in solving the personal time problem? (0 = not at all effective, 10 = extremely effective): 0 1 2 3 4
5 6 7 8 9 10
29. OPTIONAL: Comments about this personal time problem/solution? <free-form multi-line text entry>
<SurveyMonkey jumps to Page 6: Combined>
Page 4: Bus
* 30. BUS EXPERIENCE Problem: Changing away from driving alone is hard. You’ll face a number of problems,
some of which may require considerable time and effort to solve. It is as if you have to become a “commute
alternatives” expert. Some have described the switch away from driving alone as a lifestyle change.
Appendix: Survey Page 119 of 187
Taking the bus entails riding with strangers, which is uncomfortable for some folks. From previous research, we’ve
found that folks rate commute buses (like DB Express) and El Camino Real buses differently. Commute bus riders
are more “considerate and professional” than El Camino bus riders. They are less likely to carry on a loud
conversation, use audio headsets that “leak” out music, or convey a distracting odor. You should expect to
experience a handful of unsettling El Camino bus experiences every year.
On the El Camino bus, there is no social expectation - you will not be expected to strike up a conversation with the
person next to you, nor are you required to make eye contact with other bus passengers. However, because of
regular ridership leading to social familiarity, some folks enjoy the option of playing cards or chatting on commute
buses.
Commute bus seats are very comfortable. El Camino bus seats are less so.
Bus riders sometimes find that their ability to read is hindered by minor motion sickness brought on by the motion
of the bus.
Your first few experiences with the bus may be stressful, as you struggle to get the hang of things. Once you do,
taking the bus won’t require much thought. In considering the bus, how important of a concern is addressing
problems with the bus experience? (0 = not at all important, 10 = extremely important): 0 1 2 3 4 5 6 7 8 9 10
* 31. BUS EXPERIENCE - PERSONAL SUPPORT Solution: D2D will organize volunteers in your city who are
committed to providing the personal touch to encourage you. They will be selected for their listening and people
skills. They will have some great tips for you from their experience and will personally ensure that your first bus
week is successful, checking up on your experience with phone calls.
In addition, D2D will sponsor a web-based “commute community” where you can anonymously post questions and
have employees help you. People who have invested the time to solve commute problems tend to be very happy to
share their insight with others, in order to prevent others from exerting time and effort to research a solution. If you
want advice on the best personal, portable audio device, this is the place. If you need to vent, this is the place.
Interested in motion sickness remedies (wrist bands, acupressure, diet, ginger, peppermint oil, etc), this is the place.
How effective do you believe this solution will be in solving the bus experience problem? (0 = not at all effective,
10 = extremely effective): 0 1 2 3 4 5 6 7 8 9 10
32. OPTIONAL: Comments about the bus experience problem / personal support solution? <free-form multi-line
text entry>
Appendix: Survey Page 120 of 187

* 33. RELIABILITY Problem: Taking the bus, you have to rely on the bus's schedule. Buses are typically reliable
within a couple of minutes. Every once in a while, there’s an equipment problem that delays your commute.
Scheduled transit also brings about the “cutting it too close” problem, where you leave for the bus too late or get
delayed on-route, missing your bus by seconds. When you get to the bus stop, there’s the added stress of not
knowing when your bus will arrive. In considering the bus, how important of a concern is addressing reliability? (0
= not at all important, 10 = extremely important): 0 1 2 3 4 5 6 7 8 9 10
* 34. RELIABILITY Solution: In Year 2008, El Camino buses operate frequently during commute hours and less
frequent service during mid-day and to 11PM. However, commute buses operate on a restricted schedule - you only
have two or three schedule choices, and they are not available if you work late.
Your D2D enabled cell phone smoothes away some problems via silent, short text messages. You are notified of bus
delays, often before you leave for the bus. You can also configure your D2D phone to “nudge” you to leave for the
bus and/or to monitor the bus's progress so that you’ll know when you REALLY have to put down your morning
paper and coffee and hustle out your front door. For your trip home, your D2D phone will calculate when you need
to shut down your computer to hop on the electric shuttle to connect to the bus. These services are also available via
the web. Year 2008 cell phones know your precise current location – this is communicated to D2D to assist your
commute.
When there is a major bus delay, D2D is your trusted backup, taking final responsibility to get people to/from work,
including dispatching taxis or any of a number of creative solutions.
In addition, your company is a member of D2D and is culturally supportive of bus commutes. Your company
encourages you to leave work at a regular hour to catch the bus, which may mean bringing work home at night.
Your company might supply a laptop but have you pay for a broadband home internet connection. How effective do
you believe this solution will be in solving the reliability problem? (0 = not at all effective, 10 = extremely
effective): 0 1 2 3 4 5 6 7 8 9 10
35. OPTIONAL: Comments about the reliability problem/solution? <free-form multi-line text entry>
* 36. PERSONAL TIME Problem: When you drive alone, you can undertake a variety of private behaviors: sing
off-key opera at the top of your voice, talk to yourself, make intimate cell phone calls, etc. When you take the bus,
you (hopefully) lose that freedom. For many people working in stressful jobs, the drive alone to work is where they
"psych up" for the day. The drive home is where they "decompress" from their workday and transition to a different
state of mind. Some have characterized this time as "the only time I have to myself." In choosing the bus, how
important of a concern is addressing the personal time problem? (0 = not at all important, 10 = extremely important):
0 1 2 3 4 5 6 7 8 9 10
Appendix: Survey Page 121 of 187

* 37. PERSONAL TIME Solution: Being a bus passenger can provide more productive use of time than driving
alone. You can jot notes down on paper, close your eyes and practice relaxation breathing, take a nap to increase
your energy level, etc. Many people find being a passenger reduces their stress. How effective do you believe this
solution will be in solving the personal time problem? (0 = not at all effective, 10 = extremely effective): 0 1 2 3 4
5 6 7 8 9 10
38. OPTIONAL: Comments about the personal time problem/solution? <free-form multi-line text entry>
<SurveyMonkey jumps to Page 6: Combined>
Page 5. Bike/Walk
In year 2008, sufficient bike lockers will be provided for Palo Alto, Mountain View, Los Altos, and Menlo Park
bikers, at convenient electric shuttle station locations for "bike -> electric shuttle -> office" commutes.
* 39. STRENUOUSNESS Problem: Some bike commuters prefer a shorter trip than the one they face from their
home to their office. Some bike commuters feel that that hill Southwest of Hanover is too steep, and it would make
them sweat, which they prefer not to do. Some explain that commute is about transportation and is separate from
their workout, which is all about sweating. These same considerations apply to pedestrian commuters. In
considering biking or walking, how important of a concern is addressing the strenuousness problem? (0 = not at all
important, 10 = extremely important):
0 1 2 3 4 5 6 7 8 9 10
* 40. STRENUOUSNESS Solution: Use bike to navigate thru residential streets and then use the electric shuttle to
traverse the research park. This shortens bike commute distance and eliminates strenuous hill climbing within the
research park. How effective do you believe this solution will be in solving the strenuousness problem? (0 = not at
all effective, 10 = extremely effective): 0 1 2 3 4 5 6 7 8 9 10
41. OPTIONAL: Comments about the strenuousness problem/solution? <free-form multi-line text entry>
* 42. WEATHER/SUNLIGHT Problem: In the past 50 years, Palo Alto averages 34 days with rainfall greater than
0.1” (a sprinkle) and 10 days with rainfall greater than 1/2" (a shower). Thus, biker commuters face a few days of
rain every year. Likewise, sunrise and sunset do not always accommodate bikers who prefer to ride when the sun is
out. November thru February is stingy with evening daylight; sunset falls between 4:55PM and 5:57PM. March and
October are on the edge of darkness, depending on when workers leave the office; sunset occurs at about 6:21PM.
October thru February fails bikers who desire sunlight before 7:00AM. Winter temperatures may be unpleasant for
Appendix: Survey Page 122 of 187

some bikers. Some summer temperatures may be too hot, depending on commute time. These same considerations
apply to pedestrian commuters. In considering biking or walking, how important of a concern is addressing the
weather/sunlight problem? (0 = not at all important, 10 = extremely important): 0 1 2 3 4 5 6 7 8 9 10
* 43. WEATHER/SUNLIGHT Solution: There are a number of solutions: A) Drive to work on dark or rainy days,
and bike ride on more pleasant days. B) Your employer is a member of D2D, so might support shorter winter work
hours (possibly provided that you continue your work when you get home), C) Make the investment in rain gear
and/or high-powered bike lighting. How effective do you believe this solution will be in solving the weather/sunlight
problem? (0 = not at all effective, 10 = extremely effective): 0 1 2 3 4 5 6 7 8 9 10
44. OPTIONAL: Comments about the rain/darkness problem/solution? <free-form multi-line text entry>
* 45. SAFETY Problem: Some potential bikers/walkers are discouraged by the noise and speed of cars on El
Camino, on Page Mill, on Foothill, and in the rest of the research park. You should expect that sleepy drivers won't
see you a few times per year - a defensive approach is recommended. In considering biking or walking, how
important of a concern is addressing the safety problem? (0 = not at all important, 10 = extremely important): 0 1 2
3 4 5 6 7 8 9 10
* 46. SAFETY Solution: Use bike to navigate through quiet residential streets and then use the electric shuttle to
safely traverse the research park. How effective do you believe this solution will be in solving the safety problem?
(0 = not at all effective, 10 = extremely effective): 0 1 2 3 4 5 6 7 8 9 10
47. OPTIONAL: Comments about the safety problem/solution? <free-form multi-line text entry>
* 48. BIKE/WALK EXPERIENCE Problem: Changing away from driving alone is hard. You’ll face a number of
problems, some of which may require considerable time and effort to solve. It is as if you have to become a
“commute alternatives” expert. Some have described the switch away from driving alone as a lifestyle change.
Biking and walking to work is rare, accounting for less than 1% of commutes to the research park.
Your first few experiences with biking or walking may be stressful, until you get the hang of things.
In considering biking or walking, how important of a concern is addressing problems with the biking/walking
experience? (0 = not at all important, 10 = extremely important): 0 1 2 3 4 5 6 7 8 9 10
* 49. BIKING/WALKING EXPERIENCE - PERSONAL SUPPORT Solution: D2D will organize volunteers in
your city who are committed to providing the personal touch to encourage you. They will be selected for their
Appendix: Survey Page 123 of 187
listening and people skills. They will have some great tips for you from their experience and will personally ensure
that your first bike/walk week is successful, checking up on your experience with phone calls.
In addition, D2D will sponsor a web-based “commute community” where you can anonymously post questions and
have employees help you. People who have invested the time to solve commute problems tend to be very happy to
share their insight with others, in order to prevent others from exerting time and effort to research a solution. If you
want advice on the best rain gear, bike route (did we mention the area's extensive network of bike paths?), bike
accessories, this is the place. If you need to vent, this is the place. How effective do you believe this solution will be
in solving the biking/walking experience problem? (0 = not at all effective, 10 = extremely effective): 0 1 2 3 4 5 6
7 8 9 10
50. OPTIONAL: Comments about the bike/walk experience problem and the personal support solution? <free-
form multi-line text entry>
Page 6. Combined
Section 6 covers issues shared by all commute alternatives. The section ends with summarizing questions.
* 51. STRANDING Problem: Driving alone to work provides freedom to run errands at lunch, drive to a business
meeting, make an emergency trip home, work late and then zoom home after a long day, and take a car ride
somewhere on an impulse. On the days you take a commute alternative, you have much less of this freedom. In
considering commute alternatives, how important of a concern is addressing stranding? (0 = not at all important, 10
= extremely important):
0 1 2 3 4 5 6 7 8 9 10
* 52. STRANDING Solution: The electric shuttle eliminates some of this stranding, connecting you to California
Avenue stores, YMCA, banks, Fry’s, and Stanford hiking trails. New enterprises have sprung up on California
Avenue to better serve your needs.
D2D provides inexpensive loaner cars, rented by the hour + mileage. You can reserve one on the web, take the
elevated shuttle to a loaner car lot, and drive away - all in less than 5 minutes. For business meetings, your company
will fund the loaner. You can rent anything from a gas/electric hybrid car to a luxury sedan (additional cost applies).
If an important work project keeps you working late, you can drive a car home and bring it back the next day – when
you work late, you aren’t penalized with a convoluted trip home. You pay only for gas for these rides home.
Some convenient services bring items such as dry cleaning to your workplace, eliminating the need for some trips.
Because your company is a member of D2D, the culture is supportive of commute alternatives. Co-workers will
Appendix: Survey Page 124 of 187

more readily drive you places.
How effective do you believe this solution will be in solving the stranding problem? (0 = not at all effective, 10 =
extremely effective): 0 1 2 3 4 5 6 7 8 9 10
53. OPTIONAL: Comments about the stranding problem/solution? <free-form multi-line text entry>
* 54. DAY END ACTIVITIES Problem: You have one or more activities you do after work. Can you carpool home,
then go to your activities? You can change clothes at home and keep any gear for your activity in your car’s trunk. If
so, then the commute alternative doesn't present a day end problem. Or, is your activity located somewhere where
you wouldn’t first stop at home? Can you get a ride to your activity via commute alternative, but then will it be
inconvenient to get home from the activity? Before-work activities may present the same sort of problem. In
considering a commute alternative, how important of a concern is addressing this day end activity problem? (0 = not
at all important, 10 = extremely important):
0 1 2 3 4 5 6 7 8 9 10
* 55. DAY END ACTIVITIES Solution: There may be no solution for you. Driving alone could be your best option
on your activity days. If this is the case, select a low effectiveness score below. If you can think up a solution in your
context, select high effectiveness, and describe in the comments. Effectiveness of this solution? (0 = not at all
effective, 10 = extremely effective): 0 1 2 3 4 5 6 7 8 9 10
56. OPTIONAL: Comments about day end activities problem/solution? <free-form multi-line text entry>
* 57. PERSONAL STORAGE Problem: Is your car interior or trunk filled with personal items, gear for your
activities, tools for your hobby, or an emergency kit for natural disasters? Is it a problem to be without these items?
In considering a commute alternative, how important of a concern is addressing personal storage problem? (0 = not
at all important, 10 = extremely important): 0 1 2 3 4 5 6 7 8 9 10
* 58. PERSONAL STORAGE Solution: Carry these items around with you in a big duffle bag or store one set in
your car and one set at work. How effective do you believe this solution will be in solving the personal storage
problem? (0 = not at all effective, 10 = extremely effective): 0 1 2 3 4 5 6 7 8 9 10
59. OPTIONAL: Comments about the personal storage problem/solution? <free-form multi-line text entry>
* 60. ELECTRIC SHUTTLE RIDES PER WEEK: How many electric shuttle trips will you take per week?
Example: On Monday, you connect to/from Caltrain to work via electric shuttle: 2 trips. On Tuesday you drive alone
Appendix: Survey Page 125 of 187

to work, and take the electric shuttle to/from California Avenue for lunch: 2 more trips. Weekly total is 4 trips.
_______________________
61. OPTIONAL: Comments about # of E-Shuttle rides per week? <free-form multi-line text entry>
* 62. COMMUTE "MODE SPLIT": What percent of the time will you drive alone to work? Example: drive alone 4
out of 5 days per week and take an alternative 1 out of 5 days per week: 80%. If you work more or less than 5 days
per week, please select other and do the math (you might want to show your work in the comment field below). If
you bike or walk, but avoid rain or darkness, please adjust your mode split accordingly. (See question #42 for details
about weather/sunlight.)
0 % (0 out of 5 days)
20% (1 out of 5 days)
40% (2 out of 5 days)
60% (3 out of 5 days)
80% (4 out of 5 days)
100% (5 out of 5 days)
Other (please specify)
63. OPTIONAL: Comments about commute "mode split"? <free-form multi-line text entry>
* 64. "TIME TRADEOFF": For you to be indifferent between driving alone and the chosen commute alternative,
how much slower or faster would the alternative have to be?
For example, Person A places a high value on reading while taking the train. Given a 30 minute drive alone
commute, Person A prefers a 40 minute train ride, is indifferent to a 45 minute train ride, and prefers the 30 minutes
driving alone to a 50 minute train commute. Thus, Person A's answer is "alternate is 10 min slower."
Person B places a high value on personal time while driving alone. Given a 30 minute drive alone commute, Person
B prefers a 15 minute train ride, is indifferent to a 20 minute train ride, and prefers a 30 minute drive alone commute
to a 25 minute train ride.
alternate is 60 min faster alternate is 50 min faster alternate is 40 min faster alternate is 30 min faster alternate is 25 min faster alternate is 20 min faster alternate is 15 min faster alternate is 10 min faster alternate is 5 min faster alternate is 0 min faster alternate is 5 min slower alternate is 10 min slower alternate is 15 min slower alternate is 20 min slower alternate is 25 min slower
Appendix: Survey Page 126 of 187

alternate is 30 min slower alternate is 40 min slower alternate is 50 min slower alternate is 60 min slower Other (please specify)
65. OPTIONAL: Comments about the "time tradeoff"? <free-form multi-line text entry>
66. OPTIONAL: Did we miss any major issues that need to be addressed to make your commute alternative more
attractive? Any general comments you'd like to end with? <free-form multi-line text entry>
Page 7. Thanks!
Thanks from the electric shuttle demand analysis project team: The Electric Power Research Institute; U.C. Berkeley
Transportation Planning Professors; Palo Alto design firms IDEO, Mindtribe, and Velocity 11; Palo Alto
transportation non-profit Cities21 (part of the San Francisco Foundation); national transportation non-profit the
Advanced Transit Association; geographic information systems experts GreenInfo Network; and the Anthony-
Maymudes Foundation.
Please print out this page and bring it to the EPRI cafeteria for your FREE $8 LUNCH for completing the survey!
To assist our bookkeeping, please print your name below (in pen) in front of cafeteria staff.
Free lunch offer expires May 7 - please use this right away!
Your name: _________________________________
Appendix: Survey Page 127 of 187

Appendix: Survey Page 128 of 187

Appendix: Smart Parking:
Fifty-Cent, Gated, TMA-Operated Parking
This appendix explores several components of parking. While Stanford Research Park (SRP) is
the focus, each component applies to other large office parks that are served by a PRT shuttle.
This scheme is intended to be a credible conceptual start that could serve as the basis for a full
parking study and design.
Willson’s studies of five suburban office parks found an average of 49 percent empty parking
spaces at peak utilization. [SUBURBAN] When the early research parks were built, land was
inexpensive, so surface parking was preferred.
Politically, the parking scheme will be advanced as part of a larger real-estate development
effort. To come about, this larger proposal will require enthusiastic support from employers. A
Transportation Management Agency (TMA) is required to share and control all parking lots
within SRP. Automation and sheer scale drive costs down.
This parking proposal's details are explained in the sections entitled: Calculating Parking Demand, Fifty-Cent Daily
Parking, Parking Automation, Implementation, Policy Options, Capital Costs, Zoning, and Phasing.
Because of the large real-estate benefit that is provided by eliminating parking spaces, obtaining a precise
instantaneous count of the number of vehicles in each lot is essential. To reclaim spaces, vehicles will be directed to
use parking lots at the edges of the research park, freeing up larger areas of parking within the middle of SRP; thus,
unrestricted parking is not desirable.
Calculating Parking Demand
ULI’s Shared Parking report calculates realistic parking space requirements, useful for
understanding the parking impact of potential projects (such as affordable housing) within SRP.
Appendix: Smart Parking Page 129 of 187

Given SRP's high real estate value, proving that existing parking may be reclaimed and
minimizing construction of new spaces assists project feasibility. At a very coarse level, ULI’s
report indicates two land use clusters: {office, retail} and {residential, restaurants, cinemas,
hotels}, with complimentary parking accumulation.
Parking accumulation, the number of vehicles parked at a given time, is graphed below for
various land uses by hour of the day relative to their individual peak in the following chart. As
to the composition of office parking accumulation, today’s workers may be physically on site
only 70 percent or 80 percent of the time. For instance, an employee with two weeks of
vacation, two weeks of paid holidays and sick time, and permission to telecommute one day per
week is only on site: 192 out of 260 weekdays per year, or 74 percent of the time. Likewise,
some office park workers work swing and graveyard shifts, reducing the demand for daytime
spaces. In addition to workers, Willson’s suburban office park study found an average of seven
percent of spaces taken by transient parkers. [SUBURBAN]
“Office” is for suburban office buildings, size 50,000 to 675,000 square feet. Within SRP, we would expect more workaholism, stretching the office peak to the right. Monday-Thursday Cinema is shown, not the
Appendix: Smart Parking Page 130 of 187

Friday peak. “Residential” denotes suburban multifamily housing, 64 to 740 dwelling unit projects. [data
summarized from SHARED]
There are also seasonal variations, with retail/office peak in fall/winter, and other uses peaking in summer. ULI also
studied the effects of captive markets for mixed-use areas, where people walk from activity to activity. Parking
requirements were reduced by an average of 61 percent for CBD and 28 percent for non-CBD, with a large
variation.
ULI presents a cookbook methodology for calculating parking requirements, providing tables
that can be entered into a spreadsheet for the calculations:
1. Calculate peak parking demand for each use, based typically on the square footage of the
use, multiplied by a peak parking demand factor. [SHARED, page 1] For a generic 1983 office,
3.0 spaces should be provided per 1,000 square feet gross leasable area (GLA). To allow
for the tighter packing of cubicles these days, the ITE Parking Generation Manual should
be consulted.
2. Reduce each peak parking demand for non-auto mode split. Multiply these peak parking
spaces per use by a mode split factor. ULI assumes 90 to 100 percent “total” auto mode
share for suburban office parks. Santa Clara County Mode split from the Year 2002
RIDES Commute Survey is drive alone: 78 percent, carpool: 16 percent, transit: 3.0
percent. Assuming 2.2 carpoolers per carpool, there are 78 + 16 / 2.2 = 85.3 cars per 100
employees, for a factor of 0.853. PRT+D2D reduces this factor to roughly 0.602.
(Within the Survey Chapter, see the section entitled "Results: Mode Split and PRT
ridership.")
3. Adjust downward for complimentary land uses within walking distance. ULI does not
provide guidance for on-site capture, so the ITE Trip Generation manual should be used
to adjust up or down from ULI’s 28 percent suburban capture figure. With PRT, the
adjustment becomes more liberal because short duration “PRT + feet” trips also de-
generate auto trips.
4. For each month, for both weekdays and Saturdays, for each hour, for each use, calculate
Appendix: Smart Parking Page 131 of 187
Adjusted peak parking demand for a use multiplied by
Monthly peak demand per use [SHARED, pg 86, exhibit C2] multiplied by
Hourly accumulation factor [SHARED pg 47, exhibit 28]
= demand per “month, day, hour, and use”
Sum up demands “per month, day, hour, and use” for each hour and take the maximum.
ULI’s study calibrated the findings against 17 existing developments to validate accuracy.
Observed peak accumulations were generally much less than estimated shared peak, though were
slightly more in 4 out of 17 cases. Calthorpe Associates’ Tim Rood reports ULI time-of-day
utilization curves are regularly accepted by developers for sizing parking areas. [ALTERNATIVES]
Compared to zoning requirements or summing single use demands, shared parking demand
provided a significant savings. Three of the best results are shown:
Sum of single Zoning Adjust for Percent Savings
Mixed uses use accumulation Requirements Sharing Gross to shared
Office/Hotel/entertainment 1236 1452 990 46
Office/retail/hotel/entertainment 8316 9610 4242 179
Office/retail/entertainment 5099 5157 3755 47
[Table2: data summarized from SHARED. “Adjust for Sharing” adjusts the summed accumulation down via step 1 above.]
Judicious selection of the mix really helps. Assuming $3M price per acre and 325 square feet
per space, the second project’s shared demand saves 40 acres or $120M compared to required
zoning. Assuming $600 per space annual costs, $3.2M per year in expenses for operations and
maintenance is eliminated. [ENO, RUSSO, TUMLIN] ULI advocates using their methodology as the basis
for parking ordinances.
For the 20,000 employee SRP with PRT+D2D and paid parking, parking demand is calculated as
roughly 10,000 parking spaces. This is calculated as the product of 20,000 workers * 0.602
autos per workers (from the Survey Chapter) * 0.80 parking accumulation (workers are on-site
during daytime hours 80% of the time) * 1.07 (7 percent transient parkers). (The calculation
Appendix: Smart Parking Page 132 of 187

comes to 10,306 workers, and is rounded down to 10,000.) Currently, there is about 1 parking
space per employee in the research park: 20,000 spaces in all. Given the huge parking savings
that is achievable, it is understandable that landowners might want to preserve a fraction of these
unused spaces so that if the land use eventually changes to a more intensive use (such a building
use changing from software development to a call center, or a two-story building being replaced
by a four-story building), the landowner has sufficient parking.
Landowner / Tenant Considerations
The Eno Foundation’s Parking conveys some of the old mindset:
“It is not practical to provide parking on the assumption that every space will be fully
utilized. Some reserve capacity is needed to allow for cruising vehicles in search of a
space, vehicles un-parking, and for peak surges. Thus, a design safety factor should be
applied to account for these conditions. A design safety factor of 10 percent is suggested
for most land uses.”
The above analysis comprehends only cruising reserves for individual lots; centrally controlling
all spaces in the research park allows for a much smaller reserve, because all lots will not
simultaneously experience peaking. As parking is reclaimed and availability tightens, large
electronic message boards as well as the NextSpace cellular application will display the
number of available spaces within each lot, allowing drivers to select open lots, eliminating the
need cruise for 1 or 2 open spaces in a packed lot.
For a typical company parking lot with X spaces, a company would like to reserve Y spaces for
employees to ensure that each employee has a convenient parking space. This leaves Z = X – Y
free parking spaces to be used by non-company employees. For instance, carpoolers may prefer
to park at the parking lots closest to the edges of the research park and disperse via PRT, rather
than traversing the congested intersections necessary to access an interior company lot. The
electronic message boards will display parking availability based on the Z free parking spaces.
Using D2D WiFi cell phones for wireless parking lot entry (see electronic toll collection
technology section below), the parking management system can track the lot utilization by both
Appendix: Smart Parking Page 133 of 187

employees and non-employees. In this manner, edge parking lots will fill up first, leaving the
interior lots less occupied at the start of the day.
In addition, "full space-navigated parking" technology, such as has been implemented in
Stuttgart, is readily deployable. Infrared readers for each parking space provide a full/available
status, allowing drivers to be directed to open spaces, eliminating cruising. This appendix does
not attempt to include this technology in the analysis, but a larger parking study might. [See
DAMBACH for details]
Fifty Cent Daily Parking
As previously mentioned in the Introduction Chapter, charging $8 per day or more for suburban
office parking will produce a marked reduction in drive alone commutes. Many transportation
policy experts advocate paid parking to expose the true costs of driving to suburban commuters.
However, charging $8 per day or more is not currently feasible, because SRP would become
much less competitive to prospective tenants than other office locations with free parking.
An automated SRP parking system allows for small daily charges to be implemented
economically. A $0.25 or $0.50 daily parking charge should not be objectionable to affluent
SRP workers and is not expected to cause a noticeable commute mode shift. A small daily
parking charge represents a tiny fraction of a worker's income. In addition, the promise of a
beneficial PRT shuttle system should make SRP employees more willing than other suburban
workers to undertake daily parking payments. The charge could begin as $0.25, phasing in to a
higher level after six months of operation.
Though small, a $0.50 charge adds up to annual office park revenue of $1.7M, very significant in
defraying the costs of the automation system. The proposed system does not require paid
parking; however, it is economically appropriate to charge parking facility users for the system.
Appendix: Smart Parking Page 134 of 187

Becoming an innovator in suburban parking should serve the TMA well. The transportation
establishment strongly desires paid parking, and any charge, no matter how small, could lead to
paid parking slowly spreading across suburban workplaces. Thus, the TMA should find grant
funding sources favorably disposed towards TMA proposals.
Parking Automation
The automation system design arises from a set of goals that are influenced by trends, available
technology, special cases, and capital/operating costs.
Background
The sheer scale of SRP facilitates implementation of a state-of-the-art parking system with high
level of service (LOS) and compelling economics. A successful implementation should "sweat
the details." A phased, collaborative approach is advised. (See separate Phasing section below.)
Converting from unrestricted parking to automated, gated operation is a significant task,
requiring additional expenses that are avoided when building from scratch. Most SRP lots allow
rapid, unconstrained access and egress; consequently, a reservoir of spaces to buffer human
interaction with ticket machines is missing. In many of these lots, an average gate interaction
time of three seconds would have the undesirable result of backing up traffic into street bike
lanes during AM peak. Adding more gated lanes to solve queuing problems is an expensive
option that is not explored further. For reference, free flowing access lanes serve 500 cars per
hour, exit lanes serve 250-400 cars per hour. In converting from unconstrained to gated, the
concern is usually more with entering, rather than exiting, cars. [MCGANN]
There are 132 SRP parking lot access points, counting by hand from a high definition aerial
photograph. Many transient parkers visit SRP parking lots less than five times per year.
"Transient" visitors include spouses, lunch visitors, job seekers, vendors, and training
participants.
Appendix: Smart Parking Page 135 of 187

Parking system goals
Driver-friendly transition from free to paid parking. Minimize hassles with gates.
Manage access/egress queues so that traffic flows smoothly.
Understanding that high income, credit card-toting technology workers are relatively easy
to serve, ensure that temporary visitors and Spanish-speaking, cash-only contractors also
have successful interactions.
Enhance SRP security, while allowing individual companies the flexibility to "layer in"
additional security measures.
Successfully support the few high turnover sites within the greater research park such as
the movie theatre, Federal Express drop off, Bank of America, Wells Fargo Bank, and
Frye’s Electronics computer store.
Minimize capital and operational costs.
Minimize disruption during system installation – minimize asphalt and concrete projects
that tie up lots.
Operate most lots without parking enforcement.
Automation Trends
Parking technology is undergoing a renaissance, thanks to new ITS (Intelligent Transportation
Systems) technology. Each year performance is improving and price is dropping. New
technologies are being validated as reliable, user-accepted, and cost-effective. The optimal SRP
automation system will evolve as each year passes.
Automation technologies
No matter which automation technologies are deployed, the goal is to rapidly identify either the
vehicle or the driver. Once a unique identification number is known, then centralized control
and billing can occur. D2D uses WiFi cell phone identification as the primary method for this
parking scheme, as well as for PRT wireless ticketing and car sharing door lock control. WiFi
Appendix: Smart Parking Page 136 of 187

cell phones enable the counting of passengers per car, allowing carpooling performance to be
readily tracked. Other identification methods include transponders, license plate recognition,
keypads, and keycards.
Transponders are now common in the Bay Area, used in the FasTrack electronic bridge toll
collection system. Transcore is the leading vendor in this space. They provide "Intellitag" credit
card-sized, battery-free variants of the bridge toll transponders. Intellitags cost $22 apiece, read
at slower speeds than 25 mph, and are well suited for parking lot operation.
License plate recognition (LPR) technology uses image processing to identify vehicles by their
license plate numbers. A PC with a "frame grabber" card connects to video cameras focused on
license plates. Once a video image is captured, algorithms detect the edges of the plate and then
extract numbers and letters from within this area. In California, about ten percent of cars do not
have front bumper plates, so LPR systems must scan rear bumpers. LPR systems often capture
images and illuminate bumpers using the infrared spectrum, to prove high accuracy during night
time and overcast conditions. Out-of-state and dirty plates tend to frustrate these systems. For
maintenance, video camera lenses require periodic cleaning. [LPR]
Keypads allow drivers to roll down their windows and key in access codes to enter parking lots.
Keycards require drivers to roll down their windows and insert a keycard into a reader box.
More primitive parking automation is accomplished via ticket dispensers/collectors.
Gates enable all automation approaches and eliminate the need
for parking lot enforcement patrolling by keeping freeloaders
out.
On access a liquid crystal display (LCD) indicates available
spaces and provides feedback that the driver has been identified. On egress, the LCD indicates
fare payment.
Appendix: Smart Parking Page 137 of 187

A turnaround in front of the access gate must be provided for the case when the lot is full.
System Software technology
Access and egress hardware supports tickets, key cards, credit cards, or transponders – often
intermixed as optional modules in the same machine. It should also be simple and inexpensive
to install a ruggedized WiFi module. Once an identification system exists, the central control
software can operate in many flexible ways, billing immediately or billing monthly using “credit
card on file” for instance. Identification opens up new applications, such as automated time
keeping for hourly workers.
One of the main benefits of automation is real-time reporting. An accurate parking count by
hour can be generated with the click of a mouse. European-style “number of open spaces”
electronic message boards are enabled with automation. Drivers are thus better guided as
parking availability tightens.
Reporting also enables close monitoring of parking utilization and demand reduction programs.
All the hardware is self-diagnosing. In the control room, equipment anomalies and “out of
tickets” events are signaled with audible alarms to facilitate rapid human response and high
system "up time." McGann’s parking control software features an interactive system map with
moving gates and gate open/close override, anomalous event handling, credit card processing,
car counts, revenue tracking, and central pricing control.
The control software can be customized in many ways. Central control room personnel can
manage gates and intercom for a particular lot, or provide that same control to individual
company security personnel via web access. Customization serves companies with a wide range
of preferences. Innovative, custom pricing strategies are also easily implemented.
Central parking control can readily be combined with PRT system control in a single, small
facility.
Appendix: Smart Parking Page 138 of 187

Implementation
The proposed system uses WiFi cell phones as the primary technology, license plate image
processing as the secondary technology, keypad entry as the third technology, and verbal
interchange as a last resort. Maintenance-intensive ticket dispensers are not required.
A strict access policy, much stricter than most employers currently implement, is described to
demonstrate how unauthorized access is prevented, demonstrating that very high security may be
provided by automation. Such a strict access policy might be desirable during times of high
terror threat alert. In addition, for advocacy purposes, a security-enhancing policy is a good
starting point for discussions with SRP Facilities Managers. The automation system will support
many different access policies, with more relaxed policies being easier to implement. In
actuality, the TMA will set parking lot access policies, and different parking lots may have
different security policies.
The strict access policy will permit entry only to SRP employees in good standing and to pre-
authorized transient visitors. Pre-authorization will be granted by a secure web application,
where SRP employees will grant access to visitors, typically providing a WiFi handset ID or the
license plate number of the entering vehicle. In addition, the authorizer sets the starting time and
duration for permissible access. Some visitors may not know their license plate in advance; for
example, training program visitors who rent cars at San Jose Airport the morning of their visit.
In these cases, the web-based pre-authorization application will provide a unique ID number that
can be forwarded to the visitor for their keypad entry at the access gate. For a vendor who will
be working on site for a few weeks, a single pre-authorization transaction will grant privileges
for the entire duration.
The TMA and individual companies will set the rules about visitor payment: whether companies
will pay for visitors, whether visitors will pay, or whether visitors will be provided with free
parking. During pre-authorization, pre-payment may be easily arranged.
Appendix: Smart Parking Page 139 of 187

Two cumulative hours of free parking per day will be permitted for employees and transient
parkers, after which a $0.50 parking charge will apply. Two hours provides a simple solution
for pickup by spouse, job seekers, and vendor visits, handling most of the 7% transient parkers.
Access
As previously mentioned, large electronic message boards and NextSpace guide drivers to open
parking spaces within SRP.
At the access gate, the first step is to identify the driver. If a successful WiFi identification is
made, then Big Sister grants entrance to known SRP employees and people who have been pre-
authorized based on their WiFi ID.
Multiple cars arriving at the access gate will simultaneously attempt to communicate with the
access PC. The WiFi unit closest to the PC will be granted communications access.
If there is no WiFi-based admission, license plate recognition is tried. If a license plate is
successfully read and the plate has been pre-authorized, then entrance is granted and the LCD
also indicates that access has been granted. Otherwise, the Access Denied message, "Access
Denied, press '1' to speak to central control," is displayed. In the case where an SRP employee
does not have a working WiFi handset, Big Sister will also permit entrance based on a license
plate search.
Combined WiFi and license plate identification should compute within 0.5 seconds, ensuring that
entrance queues do not develop and back traffic up into the street.
If identification fails, the gate's LCD shows, "Enter authorization code for access. Press '1' to
speak to central control." The driver may then enter an authorization code at the gate's keypad
or speak with central control. Central control personnel will be able to view a video image of
license plates that cannot be read, for secondary plate verification. For a visitor, central control
will obtain the name of the SRP employee the driver is attempting to contact, and will verify
Appendix: Smart Parking Page 140 of 187

authorization before admitting the driver. During peak hours, central control will instruct drivers
to leave the parking lot entrance during the authorization process so as to not back up traffic.
Individual parking lots may augment access security. For instance, gate personnel may be
layered into the access protocol, with central security information made available at the gate.
Gate staffing can be quickly added or eliminated, allowing rapid response to varying national
terror threat warning levels.
The access system hardware is diagramed in the figure below:
The ruggedized PC controls operation and interface for Gate, LCD, Keypad, Speaker,
Microphone, WiFi communications, and the video grabber. The PC, LCD, Keypad, Speaker,
and Microphone are located in the "middle," 25 feet before the gate and 20 feet after the video
camera. A Stop Sign combined with the LCD directs drivers to stop there to be identified. The
25 foot Gate/Stop Sign separation provides sufficient space for turnarounds. The video camera
connects to the video grabber via an analog cable (a wireless connection would be preferable).
The PC contains WiFi communications and the video grabber card. A large communications
"pipe" connects this PC to the employer's network. The speaker and microphone are used for
verbal communications with central control.
Appendix: Smart Parking Page 141 of 187

Egress
At the egress gate, WiFi and LPR identification is attempted.
First, if a successful identification is made and the driver / vehicle has parked for a cumulative
total of less than two hours that day, then there is no charge and exit is granted. The LCD
shows, "Have a nice day."
Second, if the driver / vehicle is identified with a stay longer than two hours, and $0.50 payment
can be made, exit is granted and the LCD shows, "$0.50 charged to account # xxxx 1234. Have
a nice day." A similar SMS message is sent to the driver's WiFi handset. Payment is possible
for SRP employees who have Big Sister credit card accounts available for charges, and for pre-
authorized IDs. $0.50 charges are logged each day and cleared once a month.
If the first and second cases do not hold, then the LCD shows, "Please enter exit code, press 1 to
contact central control." If the driver supplies a valid exit code, then exit is granted. Otherwise,
a verbal interchange with central control via the microphone/speaker pair is required. Depending
on policy, the driver can either be granted exit or instructed to obtain authorization. With this
high security system, any valid entrant should have a valid exit method.
Exit lane hardware is the same as found in entrance lanes.
Implementation: Retail Areas
Initially, for high turnover retail establishments, extra care will be taken to ensure the system
operates smoothly, preventing loss of customers. Parking attendants or mobile, meter-checking
personnel will enforce two-hour, gateless parking.
SRP employees may be tempted to park all day in these two-hour spaces. Enforcement will
prevent this. Un-gated all-day spaces may be specially signed and painted for employees. Large
Appendix: Smart Parking Page 142 of 187

areas of all-day spaces that also serve retail, such as required at Palo Alto Square, should be
gated (but would also allow two-hour free parking). To allow for movie viewing, the TMA
would probably adjust the Palo Alto Square lot to have three hours of free parking.
The unattended Caltrain California Avenue station parking lot currently has a $1 per day charge.
This can be kept as is, or made part of the TMA system with either a $0.50 or $1 charge.
Implementation: Security
The TMA provides the scale to implement high security in a cost-efficient manner. The gates
discourage unintended use of lots. The parking system, using PRT as a distributor, allows the
consolidation of evening parking into fewer lots, with more concentrated security. In addition,
software algorithms similar to HomeSafe can be used to reduce evening parking lot assaults by
tracking the walk from the office to vehicle.
Individual companies can opt to join a centralized security system, or can provide their own,
assuming the intercom and web-based gate control tasks for their lots from the central security
system.
Special case: equipment anomaly
When a system malfunction occurs, such as a computer glitch or power outage, exit gates will
open until a solution is achieved. In the interim, personnel from nearby offices should staff
access gates. To reduce downtime, a maintenance contract with expedited service is essential.
Policy Options
Parking automation provides many possibilities to reward or penalize different behaviors.
Automation also allows a high level of flexibility, where differing policies may be implemented
at different parking lots and land uses.
Appendix: Smart Parking Page 143 of 187

TrakRide can communicate to other PRT+D2D systems such as the parking system and
NextSpace to ensure that carpools and vanpools receive preferential treatment. For instance, a
TMA policy might provide carpools with free parking, waiving the $0.50 per day charge. For
high-demand parking lots at the edges of SRP, NextSpace could reserve spaces for carpools and
employees, guiding drive-aloners to lots in the middle of SRP.
Likewise, the TMA could decide to discourage mid-day cold start trips (when the vehicle sits for
more than 1 hour before being re-started) by directing the parking system to add charges for
multiple exits per day.
As yet another example, transient parkers could be granted ten free visits, after which $0.50 per
day parking charges would apply.
SRP Workforce Housing Parking
Assuming in-fill housing is built for employees, residential parking cost should be “unbundled”
from rent. Exposing the hidden cost reduces demand, sometimes shrinking two car households
down to a single car. [RUSSO] The cost of parking for new residential construction within SRP
should reflect market conditions. Full cost residential parking is $8 or more per day. [Tumlin] SRP
employee residents could stow their less frequently used cars at lower cost within gated SRP
office lots.
Residential spillover
With TMA parking pricing at $0.50 per day, there is little chance of SRP employees parking in
nearby Palo Alto residential neighborhoods to save money. Should such spillover ever become a
problem, residential parking permits could be used to discourage such behavior. [BART]
Capital Costs
Automation capital costs of $4.9M are detailed in the table below:
Appendix: Smart Parking Page 144 of 187
Costs NotesParking study $200,000 McGann control SW $400,000 264 PCs: video, LCD, SW, etc. $1,056,000 @ $4,000. SeeCar SWSoftware customization $200,000 One person year.264 gates, including concrete $792,000 @ $3,000. Amano AGP 1700.264 vid. cam., mounts, lights, cabling $528,000 @ $2,000, includes illumination132 entrance/exit modifications $264,000 @ $2,000 for re-striping, signing132 network/power cable sets $396,000 @ $3,0003 large electornic message boards $90,000 @ $30,000Merge some parking lots Concrete $500,000 @ $30,000. Landscaping $500,000 Weak GuesstimateTotal $4,926,000
Many quantities are multiples of the 132 access driveways in the park. Prominent electronic message boards are placed at Page Mill/El Camino, Page
Mill/Foothill, and Arastadero/Foothill. Where two parking lots are within 30 feet of each other, they may be joined by
two asphalt lanes for about $30K. [LORAL]
Cost of hardware for the ruggedized PC is less than $2,000. National Instruments sells inexpensive ruggedized PCs.
It is possible to connect the access/egress PC to an employer network via WiFi, reducing the complications of cabling above and below asphalt, but this presents more of a security challenge.
Zoning
EPA’s Parking Alternatives collects some of the best U.S. parking ordinances from Coral
Gables, FL; Schaumburg, IL; West Palm Beach, FL; Montgomery County, MD; and Long
Beach, CA. Palo Alto should adopt portions of these in their zoning. Key points include:
Parking maximums rather than minimums
Reductions for mixed use, sharing, TDM, and proximity to transit
Bicycle parking requirements
Incentives for peak season retail workers to park farther off-site
In-lieu parking fees which go towards public parking
Appendix: Smart Parking Page 145 of 187
More importantly, Palo Alto should adopt ULI’s parking demand calculations to accurately
determine parking requirements. Planning department personnel should provide these
calculations as a service for proposed projects. Simple calculations such as Shaumberg’s “5.0
required parking spaces per 1,000 square feet NFA for 0-1,000,000 square foot NFA retail uses,”
do not reflect true parking demand and should not be used.
Palo Alto should add a Parking Element to their General Plan, setting broad goals to:
Minimize costs for parking construction, operations and maintenance
Reduce parking to operate with greater allowable floor area ratio (FAR), increasing
leasable space
Improve the urban environment by preserving open space and limiting impervious
surfaces
Encourage attractive, pedestrian-friendly urban design
Promote non-automobile modes of transportation
Phasing
SRP corporate Facility Managers are crucial to the scheme’s success. They will aide in the
design of the system, scheduling the phases, and assisting in mid-course implementation
modifications.
Start with a few corporate campus parking lots, and gradually expand the scheme. Start with
$0.25 daily parking fee, and increase this to $0.50 after six months. Willson urges caution in
modifying behavior: [BART]
Allow behavior to adjust over time
Allow for incremental refinement
Provide advance notice of changes
Provide grace periods [BART]
Appendix: Smart Parking Page 146 of 187

REFERENCES
[ALTERNATIVES] Parking Alternatives: Making Way for Urban Infill and Brownfield
Redevelopment, http://www.smartgrowth.org/pdf/PRKGDE04.pdf. EPA document 231-
K-99-001, Dec ’99.
[BART] Parking Management Toolkit: Strategies for Action in BART Station Areas.
(Oct 2000), Richard Willson. And: Parking Policy Development Workbook, August ’99.
[DAMBACH] Dambach's individual parking space monitoring and guidance system:
http://www.tcsintl.com/single_space.htm. Directs cars to available parking spaces.
[EMPLOYER-PAID] Proceedings of the Commuter Parking Symposium, December 6-7,
1990, Seattle, Washington, Supported by the Urban Mass Transportation Administration
and Federal Highway Administration, Employer-paid Parking: The Influence of Parking
Prices on Travel, Shoup & Willson. http://www.bts.gov/NTL/DOCS/cps.html.
[ENO] Weant, Robert A.. Parking /, Robert A. Weant and Herbert S. Levinson. Westport,
Conn. (P.O. Box 2055, Westport, 06880) : Eno Foundation for Transportation, c1990. xv,
335 p. : ill. ; 28 cm.
[LPR] "License Plate Recognition – A Tuturial,"
http://www.licenseplaterecognition.com/. White paper by Yoram Hofman, Hi-Tech
solutions, www.htsol.com .
[RUSSO] Planning for Residential Parking: A Guide For Housing Developers and
Planners, by The Non-Profit Housing Association of Northern California. Report author
is Ryan Russo, Berkeley City Planning grad who now works at Nelson Nygaard:
http://dcrp.ced.berkeley.edu/students/rrusso/parking/Developer%20Manual/index.htm .
[SUBURBAN] Willson, Richard. Suburban parking economics and policy : case studies
of office worksites in Southern California. Washington, D.C. : Federal Transit
Administration, University Research and Training Program.
Commuter Check: http://www.commutercheck.com/
Parking (magazine), Jan/Feb 2001, Acess and Revenue Control: Are you still doing business the old
fashioned way? David Uchic, pg 22-25.
Appendix: Smart Parking Page 147 of 187

Shoup, Donald C.. Cashing out employer-paid parking : final report /, prepared by Donald C. Shoup.
Washington, DC : Federal Transit Administration, Office of Technical Assistance and Safety ; Springfield,
Va. : Available through the National Technical Information Service, [1992] 141, [9] p. : ill. ; 28 cm.
Shoup, Donald C.. Evaluating the effects of parking cash out : eight case studies /, prepared by Donald C.
Shoup. Berkeley : University of California Transportation Center, [1997] 1 v. (various pagings) ; 28 cm.
Series title: Working paper / University of California Transportation Center ; no. 377, Working paper
(University of California (System). Transportation Center) ; no. 377.
Transcore transponder technology: http://www.transcore.com/
Interviews
[IPD] http://www.ipd-global.com/home.html, president, Dilip L. Nandwana, President.
International Parking Design, 11/16/01
[KROLL] Mark Kroll, 11/21/01 EVP Sares-Regis Group of Northern California (large
developer) Foster City, CA; Chair of the Residential Council of the Urban Land Institute;
Stanford Consulting Associate Professor of CE 248: Real Estate Finance and Land
Development.
[LORAL] Brian Peoples, 11/29/01, Manager of Long Range Planning and Real Estate
(1M square feet in Palo Alto), Loral Space Systems, Palo Alto. Founder, Buspool.org
vanpooling service.
[MCGANN] Mcgann & Associates, 11/21/01, 900 Doolittle Dr Suite 8A, San Leandro,
CA 94577. Steve San Filippo. http://www.mcgannsoft.com/pages/home.html, Makers
of parking lot control SW and installers of various brands of automation equipment such
as TransCore and Amano. The run many parking lots. They supply equipment to UC
Berkeley parking lots.
[TUMLIN] – Jeff Tumlin, various, Partner, Nelson Nygaard Associates, SF.
Appendix: Smart Parking Page 148 of 187

Appendix: Local Workforce Housing Preference
(For In-Fill Housing Within SRP)
Housing preference is an increasingly popular city planning topic and is developing into a
specialty area within the profession. Many cities are asking for housing preferences, especially
for public employees, but the area is immature. Environmental Impact Reports prepared for
major residential projects increasingly have a Fair Housing Impact Analysis section.
In-fill housing within office parks has huge potential benefits: locating housing next to jobs will:
decrease commute times and particulate/greenhouse emissions
allow workers to walk and bike to work
reduce regional pressure to growth outside of inner-ring suburbs
preserve the greenbelt
enable new, lucrative in-fill real-estate development
make office parks less deserted at night and on the weekend
permit shared parking between complimentary office and residential uses
allow land-constrained upscale cities like Palo to meet their state mandated "fair share"
housing element goals while protecting high-priced detached single family homes.
Unlike the draconian Pullman company towns of yesteryear, workforce housing within office
parks should improve employee quality of life while keeping employers out of the housing
development business.
The Fair Housing Act (FHA) permits thoughtful plans for local workforce preference housing.
Understandably, developers resist pioneering such preferences; accordingly, the public sector
should shoulder some of the initial burden until the model is proven. Instead of piecemeal
evolution of preferences, a larger policy debate should be initiated. A specific proposal is
presented for Stanford Research Park (SRP) in-fill housing, but the scheme is applicable to other
residential projects in job-rich suburbs.
Appendix: Workforce Housing Page 149 of 187

Introduction
Jeffrey Tumlin of Nelson Nygaard Associates (formerly with Stanford’s Transportation
Department) underscores the effectiveness of in-fill housing: “The most cost-effective peak hour
trip reduction in the Bay Area is to provide housing for workers. Stanford makes money on the
housing when they match housing and jobs. This trip reduction measure has a negative cost.
Worker housing generates off-peak trips, which are not a problem in Palo Alto. Stanford's
overall traffic reduction program for the 1989 General Use Permit was ten times more effective
than anywhere else in the South Bay.” In contrast to most transportation demand reduction
strategies, local workforce housing is profitable, making it a very effective strategy. The
potential number of housing units that can be built in support of this strategy is staggering.
Within SRP alone, 80% of the land is dedicated to landscaping and parking.
Adding mixed uses to an existing sprawling office park like SRP is nontrivial because it was
never planned for mixed use. Luckily, SRP’s pioneering stature also means it is one of the oldest
parks around. Many of the buildings will be torn down upon lease expiration and can be
replaced with new (and innovative) development. The potential to mix exists, and parking
reduction can free up sizeable acreage. [Tumlin]
Rough, "order of magnitude" calculations help illustrate the huge impact. Silicon Valley
workers, on average, have a 28-mile round trip daily commute. [RIDES] For each 1,000 workers
who can be moved into workforce housing enjoying auto-free commutes, 28,000 daily vehicle
miles of travel are eliminated from Santa Clara County. At an average fuel economy of 28 mpg
(passenger vehicle fleet is currently about 28.0 mpg, light trucks / SUVs are about 20.7 mpg),
this saves more than 1,000 gallons of gasoline per day. At 20 pounds of greenhouse gas (CO2)
produced per gallon, this represents a reduction of 20,000 pounds per day. [EPA BWC]
For SRP, the City of Palo Alto and Stanford have both been working together towards adding
240 or more new units of housing within the research park. On Sept 6, 2001, the San Francisco
Appendix: Workforce Housing Page 150 of 187

Chronicle newspaper reported that a proposed Stanford/Palo Alto development agreement,
"could lead to construction of 240 units of new housing. ‘There is a tremendous jobs-housing
imbalance in Palo Alto,’ said Palo Alto City Manager Frank Benest, ‘SRP is a tremendous
generator of jobs, and we think this would be a great opportunity to bring people closer to their
jobs.’” Benest indicated that, until recently, Stanford had never conceived of housing within
SRP; however, a valuable Palo Alto commitment to not “down-zone” office park land brought
Stanford around. [CITY MGR] Recently, a new, but similar agreement calls for 250 units of housing
within SRP. [PA Weekly] Stanford has entered into two long-term land use agreements with Santa
Clara County. These "General Use Permits," unique within Santa Clara County, permit large
construction programs, provided "no new net trips" are added to the areas in question, requiring
significant transportation demand reduction.
Evidence points that there is high demand housing that reduces commutes. HR Magazine found
that 36% of workers would be willing to take a 10% pay cut or more for a shorter commute. [HR
Magazine]
Silicon Valley Housing Crisis
A broad consensus exists about the linked crisis of affordable housing and traffic congestion in
Silicon Valley. From 1992 to 1999, Silicon Valley added 200,000 jobs and only 38,000 housing
units. [USNEIGHBOR] Says Carl Guardino, President of Silicon Valley Manufacturing Group,
“having workers travel 2-5 hours a day because they can’t afford to live in the Santa Clara
Valley results in increased air pollution, traffic congestion, stress and lack of community
involvement among the valley’s workers.” [USNEIGHBOR] Roche Bioscience President James
Woody indicated the priorities for all Silicon Valley companies was “recruiting and retaining
extraordinarily talented and innovative people. We want a really good quality of life. We want a
really engaging, enterprising atmosphere here in the region.” He then expressed a strong interest
in transportation, housing, and education problems that reduce quality of life. “Transportation is
a problem. Because of the cost of housing, my employees have to live farther out and commute
in, and it’s getting tougher.” [SJ Mercury News]
Appendix: Workforce Housing Page 151 of 187
Developer Resistance
Lender support will permit developers to initiate housing preference projects. The FHA
introduces an element of risk. Shannon Dodge of the Nonprofit Housing Association of
Northern California explains, “Developers will stay away from company housing because they
could be sued.” [DODGE] In addition to risk mitigation, educational outreach to developers will be
necessary. Says ULI's Mark Kroll, “There will be some resistance from developers who don’t
understand.” [KROLL]
Organization of this Appendix
First, four existing preference examples are explored. Second, additional programs are listed,
showing the prevalence of preferences. Third, the SRP proposal is provided, divided into policy
formation, city actions, and implementation details. Finally, many FHA legal issues are
explored, complete with boilerplate legal prose.
Four Workforce Preference Examples
Applicable preference schemes for ground lease, rental, and for sale housing are explored in this
section. The SRP proposal uses elements from these examples, with some modifications.
Stanford Faculty/Staff Ground Lease Housing – [STANFORD]
Stanford has 842 faculty/staff ground lease homes on campus, with more than 300 planned over
the next 10 years. Founder Leland Stanford specified that University land could not be sold,
therefore the houses and condominiums are sold, but the ground beneath is leased.
Stanford provides the housing to senior faculty and staff. Faculty is either tenured or has a 3
year or greater appointment. Staff is restricted to those at the top of the salary curve. Top
Appendix: Workforce Housing Page 152 of 187

Stanford Hospital doctors also qualify. As the Legal Issues section below will show, these elitist
preferences run afoul of the Fair Housing Act (FHA), but the FHA does not apply to university
housing. [RAWSON]
Additional lease restrictions ensure that this housing is the lessee's principle residence. Only the
faculty/staff member signs the lease, even though a spouse may have a larger financial interest.
Pricing is set by Stanford, working upon recommendations from local realtors. Stanford prices
low enough to provide a bargain, but high enough to avoid the IRS, which tests for market value,
and could rule that a subsidy for below market housing is employee compensation. [Real estate agent –
name witheld]
EVICTION POLICY: (Eviction policies are important for creating programs that work for many
years.) Once the lessee ceases primary residence or fails eligibility criteria, they must vacate
within 2 years. Upon death of a professor, surviving spouse DOES have survivorship rights.
But, if there is no surviving spouse or domestic partner, then the professor’s estate must vacate
within 2 years.
Stanford West Apartments - [STANFORD]
Stanford West is a 628 unit project with apartments and townhomes. Apartments are prioritized
based on the following priority scheme:
First Priority: Employed by Stanford
1A) Stanford faculty
1B) Stanford public safety officers
1C) Stanford staff
Second Priority
2A) Stanford Hospital employees
2B) Stanford Visiting Fellows
Appendix: Workforce Housing Page 153 of 187

2C) Stanford Shopping Center & Stanford Research Park employees
Below market rate units are also covered by this priority scheme. Because units are offered to
the general public (shopping center and SRP employees) the FHA does apply to these units.
[RAWSON]
EVICTION POLICY: “Each household will be re-qualified annually. Leases will not be
renewed for those who no longer qualify. Upon retirement, a lessee is no longer eligible.”
Novato For Sale Housing
The Novato General Plan was modified to encourage housing preferences:
Novato General Plan, Chapter 3, Housing: “Housing Preferences. Consider preparing an
ordinance that establishes preferences for Novato residents, public employees, single-
parent heads of households, and for those employed in Novato in renting or purchasing
affordable housing units.” [NOVATO]
In Novato, there are 9 tiers in the Hamilton Airfield preference scheme, for public employees
and for workers to live in the city. There is no provision to evict people who cease to meet
eligibility requirements, or to limit resale to persons who are eligible for Novato’s preference.
However, deed restrictions (control of use and occupancy of property by future owners and/or
control over subletting written into the deed) are used regularly to restrict resale of affordable
housing to qualified low income persons, so could be used to limit resale to persons eligible for
preference. HUD’s Bay Area Teacher Housing manuscript encourages deed restrictions,
pointing out that that the clear benefits of preference housing compensate for restrictions. It is
also possible to assess newly ineligible homeowners (for instance, if someone switches jobs from
Novato to Healdsburg) with a tax based on their greater traffic impact, providing further
motivation to live near work.
Out of State Example
Appendix: Workforce Housing Page 154 of 187
Other states are also tackling workforce preference. Two large developments near White Plains,
New York, offer preferences for affordable residences, offsetting the Westchester County
$520,000 median home price:
"Green Ridge offers a 125-unit home ownership plan with a preference for those who
work in New Castle, Mount Kisco and the Town of Bedford. Green Ridge, as Stone Creek
has done before, addresses a critical shortage of workforce housing that threatens the
quality of life in New Castle and the surrounding community, while at the same time
maximizing land for open space." [Green Ridge]
Other Bay Area Preference Housing Programs
To underscore how prevalent housing preference is, there are 17 Bay Area cities with housing
preferences and another three with programs under consideration. Some are taking small steps
with programs encompassing only a few units. Others like San Jose, Sunnyvale, Milpitas, and
Novato have large programs. Some preference schemes are simple; others have up to 9 priority
tiers:
City Preference Notes
Corte Madera Public employees Below Market Rate (BMR) program
Cupertino School district, city employees BMR program
Larkspur Public employees BMR program
Los Altos Teachers Under consideration for 12 units
Menlo Park Public employees Under consideration.
Mill Valley 4 tier system for public employees 12 condos
Milpitas Work/live in town for 1/3 of units
Mtn View Teachers, public safety workers Funded by housing impact fee
Mtn View Work/live in town BMR program
Novato 9 tiers of preferences 1/3 out of 650 affordable units
Oakland Teachers
San Anselmo Public employees BMR program
Appendix: Workforce Housing Page 155 of 187

San Carlos Work/live in town 16 unit affordable complex
San Jose Teacher
San Mateo City, school employees First time homebuyer
SF Teachers 43 apartments
San Rafael Public employees BMR program
Stanford Faculty / Staff Ground lease w/ eviction
Stanford Stanford, Palo Alto, Menlo Park tiers Rentals w/ eviction
Sunnyvale Public emps, teachers, child care teachers
Sunnyvale Work/live in town $120K condos
Tiburon City workers a few rental condos
Walnut Creek Work/live in town. Part of housing element. Under consideration. Cities shown in italics are currently considering adopting preference housing.
Local Workforce Preference Implementation Proposal
Establish the Basis for Local Preference
Task an organization such as City of Palo Alto or SVMG to prepare a policy paper.
Resultant paper should include model policies.
Convene a small meeting of experts to formulate policy. Targets could include {Rawson,
Kroll, Jones, Berkeley Professors, ULI, SVMG, City of Palo Alto, Stanford, Mid
Peninsula Housing Coalition, Peninsula Interfaith Action (strong housing advocates),
HUD, etc.}
Obtain a HUD endorsement.
Publish the document. The goal of the policy is to "make it safe" for developers support
local housing preferences in their projects, by eliminating risk and uncertainty. In
serving as a voice for developers, ULI's blessing of the policy is of utmost importance.
Publicize the policy widely. Evangelize developers, lenders, and cities.
Ensure that one or two academic papers are presented at influential ULI and APA
conferences.
Appendix: Workforce Housing Page 156 of 187

Palo Alto City Planning for Local Preference
The City should provide a finding of that local workforce housing preference serves a
compelling city interest (see Sunnyvale's example below).
The City must indemnify Stanford against FHA liability (see Novato's example below).
The public sector must undertake this risk because developers and lenders will not.
The City should require a fair housing analysis for SRP projects. Within the fair
housing analysis, sufficient demographic detail should be prepared to support the tiered
preference scheme below. A specific plan would provide an umbrella for preference. In
that the City's vital interests are well served by SRP housing, creative mechanisms should
be explored fund these studies. The Housing Fund might be an appropriate source.
Likewise, external regional benefits accrue from innovative housing development within
office parks, so regional funding mechanisms should also be explored.
The City should amend the general plan to accommodate in-fill housing and workforce
housing preference.
SRP Local Preference Implementation Details
Stanford should express a willingness to implement local workforce housing preference,
provided the City enables such a scheme and the items above come into being. In
essence, Stanford should lay out a progressive vision, setting a challenge for Palo Alto to
answer. Palo Alto will have to fight the political battles. As always in local city politics,
proposing any new idea can lead to a bruising battle. Stanford should stake out the
"good-guy" position early on with statement such as, "Stanford would like to create the
most innovative office park in the U.S., and take a huge bite out of Palo Alto's huge
jobs/housing imbalance. We are prepared to produce substantially more affordable
housing than is required by local code. We are committed to reducing average commute
vehicle miles traveled. We will pioneer a model for inner ring suburb in-fill
development, easing the demand for sprawl and greenbelt erosion." - A position that is
very hard to disagree with.
Stanford should request traffic mitigation credits against their current General Use
Permit for housing units provided under the scheme.
Appendix: Workforce Housing Page 157 of 187

Tiered preference priorities as follows: 1) SRP workers, 2) Palo Alto public employees,
3) Stanford and Palo Alto workers, 4) Persons working in the Caltrain & El Camino bus
commute shed - working within 1/3 mile of a train station or bus stop.
100% of the units should be covered by the preference scheme.
Eviction: Offer both rental apartments and more permanent ground lease units. For both
types of dwellings, review eligibility every 12 months, like Stanford West. For the
ground lease units, allow spouse / domestic partner survivorship rights like Stanford
Faculty/Staff Housing, otherwise, force the premises to be vacated within 2 years.
20% or more of units should be affordable. Typically, 15% of Palo Alto multifamily
housing is dedicated for affordability. ABAG, in their recent recommendations for Bay
Area housing elements, has argued for 50% affordable housing, covering a spectrum of
very low, low, and moderate income housing. The affordable component brings low-
income minority hourly workers to the park, better matching Santa Clara County
diversity, allowing 100% preference under the FHA.
Undertake aggressive outreach to Latinos and African Americans. Some on-site
amenities could also be provided to show an unusual sincerity in creating an inviting
environment for Latinos and African Americans, such as ethnic design elements and
educational programs. This outreach is important in meeting FHA legal requirements.
If workforce housing is scarce, and employers are amenable, then employers could potentially
pay to reserve high priority housing preference slots. Under the FHA, they would need to
commit to a housing mix matching the affordability of the entire project. This implies that
employers would house everyone from salaried executives to hourly administrative staff to
contract cafeteria workers, groundskeepers, & security personnel. Lockheed Facilities Manager
Brian Peoples believes that employers will pay $200 or more per year per slot, “The program
will be simple to administer. It simply becomes an economic calculation.” [LOCKHEED]
Legal Issues with Local Worker Preference Housing
Fair Housing Act – [FHA]
Appendix: Workforce Housing Page 158 of 187
The federal Fair Housing Act states, “it is illegal for anyone to advertise or make any statement
that indicates a limitation or preference based on race, color, national origin, religion, sex,
familial status, or handicap.” Based on existing case law, preferences based on where a
person works are allowed, subject to conditions detailed below. Special preferences for
“protected classes” such as homeless and disabled are permitted.
The bias towards wealthy Caucasians and Asians
From the Year 2000 Census, racial/ethnic split by percent:
Palo Alto
City
Santa Clara
County
White 72.8 44.2
Asian 17.2 25.4
Hispanic 4.6 24.0
African American 2.0 2.6
Other 3.4 3.8
Palo Alto's population is 58,598, Santa Clara County's population is 1,682,585.
Within SRP, affluent knowledge workers are primarily white and Asian. Palo Alto racial/ethnic
composition is a good approximation of SRP composition. Under the FHA, the “disparate
impact” test looks at demographics, specifically, how this scheme relates to the county, Santa
Clara County, SRP is situated in. If housing were to be provided primarily to whites and Asians,
then the scheme would be in violation of the FHA. Santa Clara County Hispanics would receive
very little benefit from the scheme.
Yet another test for worker-housing preference is whether the scheme reinforces historical
discrimination: has there been a pattern of job discrimination in the past that helped to create
this distribution? If so, then a “neutral” scheme (matching existing county ethnic mix) would
serve to perpetuate discrimination. “You can have a colorblind program that still has the affect
of favoring whites and Asians,” states Mike Rawson of the California Affordable Housing Law
Project.
Appendix: Workforce Housing Page 159 of 187

Mark Kroll disagrees with the county-based disparate impact test, claiming that if prevailing Palo
Alto inclusionary requirements (15% below market rate) are followed, a project will go
unchallenged. Both because SRP is a very high profile location and because the scheme strives
for 100% preference, a stricter standard should be followed. By increasing inclusionary housing
from 15% to 20%, the proposal makes an especially sincere commitment to city and regional fair
share housing goals. In addition, potential ethnic imbalance is mitigated by aggressive minority
outreach. Outreach programs are a recognized method to address FHA concerns, but the courts
have not ruled on their level of importance.
Proving compelling societal interest
If a FHA test fails, a compelling need must be shown to allow the preference. Four examples are
cited below.
An applicable Palo Alto example is the January 2001 survey that found that 43 percent of
teachers did not plan to stay with the Palo Alto school district for more than five years, because
of high housing costs. Hard local data provides a solid case for teacher preference housing. [PA
TEACHER]
For Stanford Research Park, employee preference can be justified based on keeping Palo Alto
competitive as an employment center. CEO testimony could help establish a compelling interest
– there is rampant evidence of jobs being relocated out of Santa Clara County and the Bay Area.
Arguments about the high cost of employee turnover for specialized knowledge workers should
also buttress the case. Within SRP, the cost of replacing a highly skilled worker often exceeds
$150,000. [TURNOVER] Employee replacement costs include:
Recruiting Fees or Salaried Recruiter
Staff time spent interviewing new candidates
Advertising the position
Compensation Package enhancements
Relocation
Appendix: Workforce Housing Page 160 of 187

Downtime when position is vacant
Overtime/inefficiency of other staff
New employee training & trainer’s time
New employee inefficiencies
In addition to competitiveness, environmental arguments can also hold sway. For Milpitas
worker housing preference, their Fair Housing Analysis adopted a finding that having people
work and live nearby was better for the environment. The courts will probably defer to cities on
this, even though the benefit is to affluent white/Asian technology workers. However, this
argument is untested in court. [RAWSON] Novato provides an example of language for this finding:
"Because of the extremely high costs of market rate ownership and rental housing in the
County of Marin, the City of Novato … faces a severe impediment in its ability to recruit
and retain qualified employees due to the lack of affordable housing for such employees
within or near their jurisdictions. This circumstance negatively impacts regional
transportation, the jobs/housing balance and the ability of the City … to assure their
residents of adequate level of public services, including public safety and emergency
services." [Novato]
The City of Sunnyvale’s teacher preference scheme provides an example of appropriate language
and early HUD endorsement:
The preference for school district employees, city employees and child care center
teachers that serve Sunnyvale is narrowly tailored and based on the acute housing crisis
for which there are no feasible alternatives other than to implement preferences. The
city then provides specifics about median income & housing prices, vs. the salaries of
these special classes of folks.
The City of Sunnyvale deems it a compelling and legitimate interest in having local
public school district employees, city employees and child care center teachers live in or
near Sunnyvale to enhance the quality of our residents' and children’s lives in the
community, to participate and be actively involved in community activities and events to
Appendix: Workforce Housing Page 161 of 187
benefit residents and children and to provide valuable local resources for residents and
children in Sunnyvale.
The City of Sunnyvale Consolidated Plan 2000-2005 approved by the U.S. Department of
Housing and Urban Development (HUD) identifies a high priority need for affordable
housing for low and moderate income renters and homeowners. [Sunnyvale]
Preference Limits
The more narrow the preference, the greater the burden to prove a broader preference would not
attain the same goal. Says Rawson, “The FHA requires a good reason for preferences. You must
show there is no less discriminatory method to accomplish the objective.” For instance, a
preference for teachers is narrower than a preference for public employees, so has to clear a
higher bar. Likewise, a preference for public employees is narrower than a preference for low-
income workers. To support narrow preferences, Fair Housing Analyses should be prepared,
citing detailed demographics.
For example, Sunnyvale shied away for public employee preference until a more detailed study
could justify it:
The Below-Market-Rate Program gives priority to households who have lived in the City for
at least two of the last four years and households who have worked in the City for at least
two years. The City can give preferences to these same groups with revenues from a housing
impact fee. The Nexus Analysis specifically concluded that housing should be provided for
workers and, therefore, giving preference to this group can be easily justified. Housing for
existing residents is also justifiable in that existing residents who move into new affordable
housing would free up units for new workers. However, the City cannot give preference to
community-serving employees such as teachers and public safety workers as allowed under
the BMR Program. These are narrowly defined groups and the City Attorney has advised
that if the City wishes to establish priorities for them, there would have to be a Nexus
Analysis that is as specific as possible as to the justification for favoring these groups over
other groups. [Sunnyvale]
Appendix: Workforce Housing Page 162 of 187

A common method to address narrow preferences subject to challenge is to apply them to only a
portion of the housing. In Milpitas and Novato, the worker housing preference is applied only to
1/3 of housing units. In Novato, the City Attorney’s arguments to limit the preferences won out
over city council objections, in a spirited debate. [Novato] For SRP's 100% preference, a more
rigorous fair housing analysis should be undertaken.
Complicating matters, preferences sometimes limit funding sources for affordable housing
production. From a commentary on Mountain View's programs:
It should also be noted that, typically, an affordable housing project will receive funding
from several sources. Other sources of funding (such as Federal CDBG and HOME
grants) limit the City's ability to give preferences. With these Federal grants, preferences
can be given to people who have lived in Mountain View at least six months or have
worked in Mountain View for one year. Therefore, if housing impact fees are combined
with CDBG or HOME funds to produce housing, the Federal preference policies would
apply. [Sunnyvale]
A further complication has occurred in Novato: people who do not work complain that
workforce housing is discriminatory. For non-working households, living within SRP is not
desirable. However, Novato has separate jobs and housing areas, so accommodating non-
workers is a larger issue. Within SRP, there may be an argument to house retired veterans who
require rapid access to SRP's Veterans Administration Hospital.
Evictions
HUD actively endorses evictions and deed restrictions to force newly ineligible occupants out of
preference housing. Unfortunately, an eviction has never been challenged in court – there is no
precedent. People who enter into preference housing generally appreciate the intent of the
program, so cooperate when their circumstances change.
Appendix: Workforce Housing Page 163 of 187

ULI's Kroll believes Stanford Faculty/Staff and Stanford West evictions will not hold up in court
if they are ever challenged. For instance, a Stanford West tenant and SRP employee, might find
a better job in Menlo Park, actually reducing commute distance, and yet be subject to eviction.
Lack of precedent creates uncertainty [Rawson]
Because these issues have yet to be argued in court, there is a cloud of uncertainty over
preferences keeping developers and bankers away. HUD Counsel has issued a few opinions on
preferences, but not a comprehensive issues study. Even if HUD prepares such a report, there is
no guarantee the courts will rule in the same way.
While housing nonprofits and activist groups probably will not sue, tort lawyers with fair
housing expertise cannot be trusted to support these preferences. It is probable that compelling
circumstances will cause lawsuits, especially on projects brought forth by deep-pocketed
developers. One example follows:
East Palo Alto is a lower-income, higher-crime neighbor city to Palo Alto. A single East
Palo Alto mom is bootstrapping herself up the corporate ladder and finds the perfect new
housing unit in SRP at a price she can afford that will enable her to leave her crime-
ridden neighborhood. But, the preference scheme denies her. The case will be
positioned as housing for the technology elite, and will resonate nationwide.
Because the first implementation of a office park workforce preference could create a fast
spreading trend, organizations such as the NAACP Legal Defense Fund are more likely to fight
this preference. Early outreach could be conducted to bring such organizations on-board by
providing a win-win implementation scheme (high affordability component and minority
outreach). [RAWSON]
EIRs and Fair Housing Analyses
A new area of planning practice is emerging, Fair Housing Analyses. As of now, the practice is
unstructured. There is almost no literature on the subject. Standards for these reports should be
Appendix: Workforce Housing Page 164 of 187

developed by government and planning associations. All large housing projects, whether for-
profit or nonprofit, should reduce the threat of lawsuits by this analysis. Local governments are
beginning to ask for these analyses for their own protection. For large job-creating projects,
jobs-housing imbalance analysis is now standard part of the EIR; Fair Housing should attain the
same stature within the EIR.
City Takes On Liability
Because of the external economic benefit combined with lack of precedent, the public sector
should indemnify developers. For the Novato Hamilton Airfield project,
"… the City … shall defend, hold harmless, and indemnify the Developer … from any
costs or liabilities arising out of a legal challenge to the adoption, provisions, or
implementation of this Plan." [Novato]
References
[FHA] - http://www.hud.gov/fhe/fheact.html
[Green Ridge] "Green Ridge, Not Just a Development … a New Direction,"
http://www.greenridgenow.com/html/greenridge.html .
[HUD] HUD’s “Bay Area Teacher Housing, Resources and Models for Developing
Affordable Housing for Teachers In the San Francisco Bay Area
[Novato] a) discussion of limiting preferences to 1/3 of units:
http://www.ci.novato.ca.us/minutes/CC010410.htm MINUTES OF REGULAR
MEETING OF THE CITY COUNCIL, CITY OF NOVATO, CALIFORNIA, APRIL 10,
2001. b) final results, including indemnification of the developer for fair housing liability
by the city: http://www.ci.novato.ca.us/docs/hf/resident.pdf . C) General Plan:
http://www.ci.novato.ca.us/cd/gp/GPCHAP3.HTML .
[PA TEACHER] “District talks teacher housing,” Palo Alto Daily News, Jan 12, 2001.
Appendix: Workforce Housing Page 165 of 187

[PA Weekly] June 11, 2003, "New Mayfield deal is struck,"
http://www.paweekly.com/paw/paonline/news/2003_06_11.mayfieldpost11.shtml
[SJ Mercury News] San Jose Mercury newspaper, January 1, 2001. Page 1, Business
Section.
[STANFORD] Faculty/Staff Housing: http://fsh.stanford.edu/programs/eligibility.html,
http://fsh.stanford.edu/programs/lease.html , http://www.scrl.org/newfshousing.htm,
Stanford West: http://stanfordwest.stanford.edu/
[Sunnyvale] June 19, 2001, City of Sunnyvale Options for Affordable Housing for
Teachers and City Employees. http://www.ci.sunnyvale.ca.us/200106/rtcs/01-220.asp
[TURNOVER] gone: http://www.advantagehiring.com/newsletter/n99Q4_1.htm ,
http://www.weda.org/topics_turnover-costs.html
[USNEIGHBOR] http://www.usneighbor.org/realestate/affordable.htm Silicon Valley
Housing Crisis
Interviews
[BINGER] Gary Binger, Urban Land Institute, 11/19/01. Former head of ABAG
Planning.
[CITY MGR] Palo Alto City Manager Frank Benest, 12/11/01
[DODGE] Shannon Dodge, 10/15/01, Non-Profit Housing Association of Northern
California, http://www.nonprofithousing.org/ .
[EPA BWC] From EPA's Best Workplaces for Commuters, program overview
presentation, slide 5: http://www.commuterchoice.gov/resource/progoverview.ppt
[ETZEL] Professor Fred Etzel, various times, http://landuseprof.com/, Smart Growth
Law Toolkit Course, UC Berkeley City Planning Department.
[HR Magazine] 2001 Career Builder Survey, October 2001.
[JONES] Tom Jones, 12/1/01, Executive Director, California Futures Network, Oakland,
CA. Contributor to HUD’s Bay Area Teacher Housing paper.
[KROLL] Mark Kroll, 11/21/01 EVP Sares-Regis Group of Northern California (large
developer) Foster City, CA, 650 378 2800; Chair of the Residential Council of the Urban
Appendix: Workforce Housing Page 166 of 187

Land Institute; Stanford Consulting Associate Professor of CE 248: Real Estate Finance
and Land Development.
[LOCKHEED] Brian Peoples, 11/29/01. In 2001, Brian was Facilities Manager for Loral
Space Systems on San Antonio Road. Brian also runs buspool.org.
[RAWSON] Mike Rawson, 11/26/01, California Affordable Housing Law Project of the
Public Interest Law Project, 449 15th Street #301, Oakland, CA 94612, 510-891-9794,
[TUMLIN] Jeff Tumlin, various, Partner, Nelson Nygaard Associates, SF.
Appendix: Workforce Housing Page 167 of 187

Appendix: Toxic Release Risk Management
Introduction
Stanford Research Park (SRP) contains two superfund sites and 21 additional toxic groundwater
sites. These resulted from printed circuit board manufacturing and gas station operations that
were discontinued more than 15 years ago. Brownfield development and groundwater issues are
well understood, to the point where one of the superfund sites is being transformed into a public
soccer field. One environmental obstacle remains, accidental atmospheric toxin release risk,
which prevents in-fill housing within SRP. The main hurdles are the lack of examples of this
type of development and government’s refusal to endorse and “jumpstart” this concept – lenders
won’t lend against a new real-estate concept, so "getting the first one built" is hard.
Compounding matters, this development creates a sizable regional economic benefit that cannot
be easily captured by cost-bearing companies.
Alza Corporation's unsuccessful attempt in the 80's to improve their SRP hazardous materials
facility has influenced the current Silicon Valley Manufacturing Group (SVMG) and Palo Alto
Fire Department positions against this type of in-fill. The Bay Area Air Quality Management
District (BAAQMD) is also pre-disposed against such efforts.
A careful, broad political/planning effort should be able to modify opposing viewpoints to a
more nuanced risk-based approach, while still encompassing the important original concerns.
Historical Perspective
Alza Corporation's Influential Experience in the 80's.
Appendix: Toxic Releases Page 168 of 187

Alza Corporation, an international pharmaceutical company, was a long time SRP tenant. In the
80's Alza planned to expand within SRP. Alza operated an older hazardous materials (hazmats)
storage facility and trucked out hazardous waste products past neighboring residences. Alza
proposed to simultaneously upgrade to a higher capacity hazmats facility with augmented safety
technology and to eliminate trucked waste. The plan backfired.
The adjacent "College Terrace" neighborhood had been oblivious to the old hazmat facility.
Once public hearing notices went out for the new facility, "residents went berserk." A petition
campaign attempted to stop the new facility. Residents also suddenly became more cognizant of
noise, generating many noise-related complaints. With their newfound hazmat awareness,
residents demanded to know if Alza "was poisoning their kids" any time steam escaped from the
plant. Palo Alto's Fire Department, the party responsible for hazmats in the city, experienced a
huge increase in workload caused by citizen requests for reports.
During public outreach sessions, Alza explained one industrial process that produced methylene
chloride, a carcinogen. The alternative was to produce acetone, an explosive. Alza preferred
producing the carcinogen with tight controls. Residents made what were perceived by Alza to be
unreasonable demands, "you have smart scientists, you should figure out how to not use either.”
Alza's attorneys spent a year on the project, but, in the end, decided to never attempt to locate
close to residences again. Alza moved their hazmat plant to Mountain View's Shoreline Office
Park, farther away from residents. They felt "driven out of Palo Alto," and have moved almost
all of their operations out of SRP.
In addition, locating hazards near sensitive populations such as children increases reporting
requirements, producing substantial cost increases. A State of California Risk Mananagement
and Prevention Plan (RMPP) is required whenever a hazard is located with 1,000 feet of a school
or day car center. Furthermore, Accidental Release Prevention Program paperwork must be
filed. In addition, residents must be notified about certain corporate actions. Public notifications
generate time-consuming questions from concerned local residents and increase the risk of
lawsuits.
Appendix: Toxic Releases Page 169 of 187

For Alza's Vallejo hazmat plant, the company purchased open space as a buffer zone to ensure
that residential development could not approach their plant.
Alza's representative, Nancy Noe, a former SVMG committee member, explained further
reservations to placing residents near industrial uses. "People who move next to an airport can
become strident NIMBYs a few years later. The same could very easily be true for housing in
the office park. Existing companies don’t want new limits placed on their activities. Proximity
to children adds significant Hazmat reporting, safety redundancy, specialty insurance, and public
interaction costs."
Effects of the Alza experience
As a result, SVMG has adopted a blanket policy against adding children anywhere near hazard-
producing facilities. Says an SVMG committee chair, "There is a huge compatibility issue with
adding housing to SRP because of hazardous point sources. Folks have been beaten up over this
issue in the past – no one is looking to take this on again.”
Likewise the Palo Alto Fire Department prohibits in-fill housing, but does admit to some
discretion:
In general the Fire Department does not support the placement of day care facilities or
housing in areas zoned for industrial uses that could include the use and storage of
hazardous materials. There are zoning restrictions that may apply. Additionally, such an
arrangement could create emergency response or evacuation issues. It’s possible that these
and other concerns could be mitigated, but it would depend on the circumstances.
The Santa Clara Muslim Community Association Project
One other well-known Silicon Valley project faced the same set of issues. The Santa Clara
Muslim Community Association project put a childcare center and school in an industrial park.
BAAQMD and SVMG opposed the project based on concerns about potential accidental
releases, but it was ultimately approved by the city.
Appendix: Toxic Releases Page 170 of 187
Political Backdrop
Regarding adding housing within SRP, the City (except for the Fire Department), Stanford,
residents, and the EPA are for housing; ULI is conflicted; and SVMG and BAAQMD are
opposed.
Stanford and Palo Alto have signed an agreement intending to add 240 housing units to SRP
starting in 10 years.
Adjacent residents have taken a progressive stand and are for dense housing within the research
park; however, they would oppose any new hazard-producing companies within SRP. There is
no "memory" of Alza's proposal. The perception is that SRP has grown progressively less
hazardous as office uses have replaced industrial uses.
ULI's Kroll is supportive of the SRP housing concept, but questions feasibility, "Developers
almost have a moral issue. The recent petroleum refinery hazardous releases makes folks
scared." (There have been eight Bay Area hazardous releases in the last 18 months at
Richmond, Martinez, and Benecia refineries.) "In Houston, residents have higher cancer rates
near plants. Banks won't be able to finance housing in SRP." ULI's Binger led an effort to
reduce developer risk associated with California's strict environmental laws (CEQA). A
revolving developer fund to finance preliminary planning and environmental impact analysis has
been proposed to decrease the risk of discovering expensive environmental "gotchas" late in
projects.
Toxic Point Sources are NOT an Obstacle
For SRP, the BAAQMD Toxic Air Contaminant Control Program Year 2000 Annual Report
shows only three companies, out of 160, have toxic point sources.
Appendix: Toxic Releases Page 171 of 187

The EPA's Jim Hanson explains how these point source emissions are not a major obstacle,
“Many of the Silicon Valley facilities have exhaust systems that capture and vent
chemicals used in research and manufacturing. Depending on the concentrations and
chemicals, some must be controlled with air scrubbing systems, while some probably are
not. There is a standard methodology of modeling the air flow and dispersion of these
toxics. While adding housing to an 'office-only' office park is less risky than adding
housing next to light manufacturing or bioscience research, predictable emissions are not
a huge concern."
BAAQMD's Brian Bateman continues,
“Routine emissions are generally not a problem for day care or housing. I don’t think that
the companies in the SRP would be required by our programs to install additional controls
because of a daycare center. The only possible exception to this would be where a daycare
center or school was added within the boundaries of an existing facility, and that receptor
site was not considered in a prior health risk assessment, and consideration of that receptor
would yield an unacceptable health risk due to routine and predictable emissions. This is
only a remote possibility - these facilities generally have not presented risk problems in the
past.”
Accidental Toxic Releases Are the Main Problem
Explains BAAQMD,
“We face a serious challenge where we have a desperate need for more housing near
jobs and services, provided residents aren’t exposed to health threats or nuisances.
Accidental releases, more than known point sources, are where the issue has been made
in the past.”
Appendix: Toxic Releases Page 172 of 187

One of the main analytical tests is whether children are located sufficiently far away so that they
face no serious health effects from a "Level 2 Exposure," an accidental one-hour toxic leak.
Companies are motivated to conduct safe operations in order to protect their own employees,
honor statutory requirements, avoid negative media coverage, and fulfill conditions attached to
pollution liability insurance policies. Preventative maintenance, containment design, operator
training, waste-stream management, and pre-emergency planning play important roles in safety.
Recommendations
Before such housing can go through the standard city planning process, four items are necessary:
Leadership
Regarding toxic release trade-offs relating to in-fill housing within office parks, there is no
precedent, no national policy, no local policy, no academic research, no cookbook approach, and
no private sector motivation to innovate. In short, there is no leadership on this issue. Without
leadership, this issue cannot be resolved. First and foremost, a leader must come forth.
Desk Study
Next, an inexpensively produced "toxic release risk contour" map should be produced showing
the most promising locations for housing. Much of SRP land abuts residences, so should share
the same (presumably safe) risk profile as the existing residences. The map can be produced by
an environmental expert examining hazmat business plans (available from the Fire Department)
and making some informed estimates given an understanding of air flow patterns within SRP.
This preliminary environmental analysis fulfills part of the recommendation from ULI's Binger.
Working Group
Appendix: Toxic Releases Page 173 of 187

An important demonstration of leadership is to form a working group of interested parties.
These could be selected from: {Silicon Valley Toxics Coalition, SVMG, BAAQMD, Fire
Deptartment, Stanford, Palo Alto Planning Department, EPA, Santa Clara County HazMats
Department, neighborhood associations, ULI, pollution liability insurers, housing advocates, and
toxin-producing SRP companies}. While not representing an obvious choice, one of the new
"business-empathetic" environmental non-profits (such as The Reason Foundation's
NewEnvironmentalism.org) could assist the working group, or even take a leadership role. Their
emphasis on innovation and "red-tape" reduction is well-aligned with this issue.
BAAQMD and SVMG should be urged to amend their blanket anti-housing policies to a risk-
based approach. SVMG will see firsthand that the neighborhood associations are now more
comfortable with environmental risk.
The working group should issue a short paper on this subject.
Quantify new costs and match costs to funding sources
It is unfair for toxin-producing companies to undertake increased costs in order to enable a
benefit that accrues to the city and region, but that is the implication of current hazmat policy.
These companies will have to undertake increased costs for detailed analysis, insurance,
regulatory paperwork, "public interface," etc.
Instead, additional costs should be estimated and apportioned to beneficiaries.
Funding for innovative development requires creativity. For example, valuable local workforce
housing preference "slots" could be allocated to toxin-producing companies in exchange for their
bearing new costs (See Workforce Housing Appendix). Likewise, the State Air Resources Board
may someday create an emissions trading program, and, when that day comes, BAAQMD will
ensure that smart growth savings are included – allowing a 6,600 daily car reduction within SRP
Appendix: Toxic Releases Page 174 of 187

to fund innovations. In addition, EPA's Brownfield program and MTC's TLC/HIP mechanisms
may be applicable.
INTERVIEWS, November, 2001
Frank Benest, Palo Alto City Mgr
Henry Hilken, Senior Scientist, Planning Department, Bay Area Air Quality Management
District, UCB DCRP grad.
Brian Bateman, Director Toxics Programs, Bay Area Air Quality Management District.
Ted Smith, Executive Director, Silicon Valley Toxics Coalition, svtc.org.
Jim Hanson, Brownfields Manager, EPA San Francisco Field Office.
Bud Mission, Facilities Director, Roche Bioscience / SVMG Land Use Committee.
Jeffrey Tumlin, Principal, Nelson Nygaard Associates (formerly from Stanford
Transportation Dept).
Gary Binger Director, ULI California Smart Growth Initiative.
Palo Alto Fire Department Hazardous Materials Inspector, Joe Fong.
Palo Alto Fire Department Environmental Protection Coordinator, Dan Firsth.
Julia Levin, California Policy Coordinator, Union of Concerned Scientists. Patricia
Moynahan, Transportation Issues (formerly with EPA on toxics).
Nancy Noe, Alza. SVMG Land Use Committee
Pria Graves, College Terrace Neighborhood Association
Mark Kroll, EVP Sares-Regis Group of Northern California (large developer) Foster
City, CA; Chair of the Residential Council of the Urban Land Institute; Stanford
Consulting Associate Professor of CE 248: Real Estate Finance and Land Development.
Kevin Smith, BC Environmental, a pollution liability insurance broker.
REFERENCES
Appendix: Toxic Releases Page 175 of 187

BAAQMD CEQA Guidelines, April 1996, Revised December 1999. Available on
reference at Berkeley CED Library.
BAAQMD Toxic Air Contaminant Control Program Annual Report, Appendix B1: Data
Summaries by County/City: http://www.baaqmd.gov/permit/toxics/report.htm. Citizens may
also submit a BAAQMD “Public Records Request” (see their web), to get the most recent
emissions inventory data for specific facilities.
Land Recycling and the Creation of Sustainable Communities, Chapter VI: Brownfields:
Perception versus Reality; Chapter VII: Tools and Lessons, George B. Brewster.
California Real Property Journal, Spring ’99, “The Brownfield Toolbox”, Brian
Haughton.
Silicon Valley Toxics Coalition, Web Maps Section shows Contaminated Groundwater
Sites: http://www.svtc.org/resource/maps/index.html:
To prepare an accidental releases risk assessment: A) The Santa Clara County
Department of Public and Environmental Health has the CalARP (accidental release
program) reports. Companies have to have large quantities of solid or gaseous chemicals
to require this program. Within SRP, Agilent is probably the only company. Along with
the inventory comes a risk assessment. These are costly reports. B) BAAQMD has risk
management plans required by the Clean Air Act. C) City of Palo Alto Fire Prevention
Bureau, has HazMat Business Plans: inventory of toxics in quantities > 55 gallons, plus
some gases in excess of a certain threshold. Warning: "There is no integration between
regulatory efforts. The large threshold reports might just have inventory, but not talk
about releases. Even for the HazMat business plans, if you have 54 gallons of something
that is really dangerous & volatile, then could have a big problem. The inventory reports
don’t tell you what a company is doing with the material. Use is pretty darned important
part of risk. In the HazMat report, some chemicals are not volatile – IE they’ll never
release into the air. Like a solid." [Source withheld].
UC Berkeley Office of Environmental Health and Safety: Air Toxics Program Page:
Guidelines for Minimizing Toxic Air Contaminant Emissions from Laboratories, Revised
11/96. http://www.ehs.berkeley.edu/pubs/helpsheets/03TACGLs.html
February 19, 2002 City of Palo Alto Staff Report on 2475 Hanover Street
http://www.cityofpaloalto.org/cmrs/CMR100-02/172-02.pdf . Mentions that Alza
Appendix: Toxic Releases Page 176 of 187

Corporation's malfunctioning storage activities led to chloroform contamination in
groundwater and soil.
April 20, 1992 City Council Minutes. Of note, Councilman Simitian and Zoning
Administrator Lytle (both have advanced politically) discuss Alza's reservations about
allowing childcare centers within SRP:
http://www.city.palo-alto.ca.us/clerk/minutes/1992/19920420.html
Appendix: Toxic Releases Page 177 of 187

Appendix: Economics
This appendix explores system costs, annual revenue, additional revenue, and environmental
benefits.
System Costs
An SRP PRT system could be funded via a combination of different methods: equity, private
sector debt, and public sector debt. Because the financial structure is uncertain, there is no way
to estimate the annual amortized cost of capital cost funding. Costs break down as follows:
COSTS $MPRT capital costs 50.0
Shared, automated parking 4.9
Annual PRT O&M 3.0
PRT Costs
The Advanced Transit Association's (ATRA's) Technology Evaluation of 14 PRT systems (either
proposed or under development) prepared a costing for a 10-km, 20-station, 100 vehicle system.
Their costing averaged estimates supplied by different vendors. Using ATRA unit costs, but
adding more vehicles to service SRP at a higher level of service, the following rough cost
estimate arises:
Componenet Unit Cost Number Total (k$)Guideway - straight 2,300 k$/km 8 $18,400Guideway - curved 3,400 k$/km 2 6,800Vehicle 38 k$ each 300 11,400Stations 250 k$ each 20 5,000TOTAL $41,600
Appendix: Economics Page 178 of 187

PRT costs come to less than $10M/mile, closer to roller coaster costs than those of a $80M/mile
airport people mover. ATRA's estimates do not include control system software development
cost or associated safety certification costs. [ATRA] The first system will also require "tear-down"
insurance to ensure that a failed PRT system can be demolished even if the PRT vendor goes
bankrupt – with PRT, this expense is small. Thus it is safer to quote $50M as the capital cost for
the SRP PRT system.
Shared, automated parking
Please see the cost estimate from the Parking Appendix. Additional landscaping costs to
pedestrian-ize SRP may arise from planning studies. Government funding, such as MTC's
Transportation for Livable Communities capital program, is available for such landscaping.
PRT annual Operations and Maintenance.
ATRA's report did not provide specific estimates for O&M because the PRT vendors did not
supply concrete numbers, choosing only to boast about the superiority of their designs compared
to traditional heavy APM systems. [ATRA] $3M per year is a conservative guesstimate to cover
electricity, personnel, and replacement parts for vehicles. It is envisioned that the system is run
24x7, operated by one to two staffers.
Annual Revenue
ANNUAL REVENUE $M/yearPRT farebox $4.9
Caltrain increment 2.7
Ads - personal + wraps 3.5
6,600 parking space reduction 4.0
Eliminate bus shuttles 0.3
$0.50 daily smart parking 1.3
Appendix: Economics Page 179 of 187
Use guideway to house utilities 0.3
Total $16.9
PRT farebox revenue
PRT farebox revenueTrips per day 26,000Fare per trip $0.75Workdays per year 250 farebox revenue $4,875,000
Caltrain Increment
Within the Oakland Airport Connector (OAC) people mover EIR, the financial analysis showed
that the APM covered annual O&M (not capital costs). The crux of the financial argument was
that the OAC connected to existing BART capacity, and increased ridership on BART with no
additional cost. Thus OAC captured the new BART ridership revenue as an OAC revenue
stream. [BART OAC EIR] For the SRP PRT shuttle, Caltrain ridership will also increase using existing
capacity without additional cost. Therefore, it makes sense to use the same technique that BART
used (provided Caltrain is an enthusiastic member of D2D Mobility).
Caltrain incrementSRP workers 20,000.00new caltrain riders, % 14.5%new caltrain riders 2,900.00@ $78 per month, annual incremental revenue $2,714,400
The average 14-mile one-way Santa Clara County Commute [RIDES] encompasses three Caltrain
fare zones, requiring a $78 per month Caltrain pass.
Advertising Revenue
$3.5M in ad revenue is a preliminary guesstimate for ad revenues from PRT station ads, cab
wrap ads, and personalized advertising within PRT vehicles. The wireless, effortless PRT
ticketing identifies commuters to the system, allowing for personalized advertising on LCD
Appendix: Economics Page 180 of 187

screens within vehicles. Readers should imagine tasteful personal ads such as where individual
amazon.com book buying preferences are retrieved and a two-minute book review is played
during the last mile. There are 6.5M trips per year for in-vehicle ads.
The elevated PRT system crosses over Palo Alto's busiest intersection, El Camino Real and Page
Mill Road. The intersection's 43,000 auto trips per day calculates to more than 11M auto trips
per year. Assuming drivers see three cab wrap ads per trip, this results in 33M "impressions" per
year. Palo Alto features an affluent technology worker demographic that is attractive to
advertisers.
This guesstimate should be solidified through a meeting with ClearChannel / Gannet Outdoor
about outdoor advertising and Yahoo and/or Amazon about personalized ads. ATRA Chairman
Tom Richert found the SRP PRT opportunity roughly equivalent to an outdoor-only estimate by
Gannet for a proposed 1996 six-mile San Diego PRT network. The San Diego system had two
highway crossings above I-5, each with over 200,000 people passing each day. Tom observed
that compelling billboard opportunities are scarce in Palo Alto, so there may be a premium on ad
pricing that works in SRP's favor. [RICHERT]
6,600 parking space reduction
Russo, Tumlin, and Eno Foundation give differing annual costs for a single parking space.
Russo's $798 per year per space calculation arise from $10,000 surface parking space land cost in
Bay Area suburbs at 7% interest – operations and maintenance is not included. [Russo] Tumlin
calculates true cost parking pricing (including all imaginable costs) at $12 per day / $4,380 per
year. [Tumlin] The Eno Foundation's 1990 $600 annual average surface parking space cost
emphasizes operations and maintenance costs. [Eno] Thus, the opportunity cost for a 350 square
foot parking space within SRP is at least $600 per year.
Parking Savings# spaces saved 6,600Annual cost per space $600 total $3,960,000
Appendix: Economics Page 181 of 187

The parking appendix demonstrates the potential to save more than 6,600 parking spaces within
SRP.
Eliminate Bus Shuttles
The PRT shuttle eliminates the need for the Caltrain Deer Creek Shuttle as well as employer-
sponsored shuttles for HP, Agilent, and SAP provided by CommuteSmart. Bus shuttles cost
more than $100,000 per year to staff and operate. [Tumlin]
$0.50 per day SRP parking
The calculations for the number of cars that park per day as well as the motivation to charge
$0.50 per day for parking within SRP is given in the Parking Appendix.
# days 250
# parkers per day 10,000
Revenue per parker per day $0.50
Annual revenue $1,250,000
Use guideway to house utilities
SRP Facilities Managers have reacted favorably to the possibility of bringing in fiber cabling via
the PRT guideway. The current method requires tearing up the parking lot to place new cabling.
A change in telephone companies often requires such a disruption.
Additional Revenue
50 acre housing profit
Appendix: Economics Page 182 of 187

acres 50square feet = acres * 43,500 2,175,000s.f. housing @ 50% floor area ratio (current is 40%) 1,087,500Total profit at $300 per square foot $326,250,000
David Mogavero of Sacramento’s Mogavero Notestine Associates (architects, planners,
developers) asserts Palo Alto housing has a burdened multi-family construction cost of $200 per
square foot generating $300 per square foot in gross profit.
Office and residential land value appreciation
In the Introduction / Summary Chapter, Cervero's research showing 100% office land value
increase within a quarter mile of a Caltrain station featuring mixed use. This leads to an
increase in the value of Stanford's holdings by $1B or more. [Value Added]
U.C. Berkeley City and Regional Planning Professor Robert Cervero's study of rail land value
impacts demonstrates more than 100% increase in land value for office parcels within 1/4 mile of
a commuter rail stations in business districts in Santa Clara County, where SRP resides. [Value Added]
Reduced Employee Turnover
reduced employee turnoverworkers 20,0001% of workers 200Cost to replace a worker $100,000 value of a 1% reduction in turnover $20,000,000
Further study is required to quantify the reduction in employee turnover and recruitment
advantage provided by a PRT office park. A one percent reduction in turnover comes to $20M
per year. [Turnover]
35% retail sales increase
Appendix: Economics Page 183 of 187

This comes from Roxanne Warren's Urban Oasis, applying results from a Tom Richert's paper
from an APM conference. [Warren] Parking lots by California Avenue retail establishments are full
at lunchtime. PRT will bring new customers.
50% cellular market share per year
This is a very speculative section. D2D could anoint one or two cellular carriers as preferred
providers within SRP. These carriers could then invest to provide high quality reception within
office buildings. Such a preferential status would convey significant value, some of which D2D
could reclaim. A 100% market share scenario is provided below. ARPS stands for Annual
Revenue Per Subscriber:
value of 100% cellular market shareWorkers 20,000.00ARPS per month 50.00annual revenue 12,000,000.00
The infrastructure costs for the carrier should also be included.
Cellular Tracking App Revenue
The D2D tracking software applications will be able to fund themselves.
39.5% of workers are willing to pay for cellular tracking apps:
New carpoolers (17%)
Half of old carpoolers (8%),
New Caltrain riders (14.5%)
cellular tracking app revenueworkers 20,000.00workers willing to pay $5/mo for cellular tracking apps 0.40ARPS - $5 per month $60annual revenue $474,000
Appendix: Economics Page 184 of 187

ARPS for tracking applications includes both a monthly D2D subscription fee and data network
charges.
Exclusive delivery franchises
D2D may be able to gate access to 20,000 workers, charging exclusive franchise fees to various
services in order to bring in additional revenue.
Environmental Benefits
Rough, "order of magnitude" calculations help illustrate the impact of removing 6,600 autos. To
simplify calculations, we'll make the incorrect and oversimplifying assumption that there is no
first mile auto travel for new partakers of commute alternatives. Silicon Valley workers, on
average, have a 28-mile round trip daily commute. [RIDES] Average fuel economy is assumed to
be 28 mpg (passenger vehicle fleet is currently about 28.0 mpg, light trucks / SUVs are about
20.7 mpg). 20 pounds of greenhouse gas (CO2) are produced per gallon of gas consumed. [EPA
BWC]
Reduced vehicle miles traveled (VMT)# cars removed 6,600# miles roundtrip commute VMT / day 28VMT reduced per day 184,800VMT reduced per year (250 working days) 46,200,000Gallons of gas saved per year (6,600 * 250) 1,650,000Greenhouse (cardon dioxide) gas reductionDaily pounds CO2 saved (20 lbs per 6,600 gallons) 132,000Annual pounds CO2 saved (20 * 6,600 * 250) 33,000,000
INTERVIEWS
[RICHERT] Tom Richert, Chairman, Advanced Transit Association. Various meetings.
[TUMLIN] Jeff Tumlin, various, Partner, Nelson Nygaard Associates, SF.
Appendix: Economics Page 185 of 187

.
REFERENCES
[ATRA] Personal Automated Transportation: Status and Potential of Personal Rapid
Transit. A report by the Personal Rapid Transit Technical Committee of the Advanced
Transit Association. Information on the entire document:
http://www.advancedtransit.org/pub/2002/prt/index.htm . Technology Evaluation - A
comparison of PRT systems in development. (97 pages, pages 88-92 have cost
information.) http://www.advancedtransit.org/pub/2002/prt/tech6.pdf
[BART OAC EIR] BART-Oakland International Airport Connector Final Environmental
Impact Report/Final Environmental Impact Statement, March 2002, "The FEIR/FEIS is
available at selected local libraries in Oakland, Alameda, and San Leandro. Copies of the FEIR/FEIS and
all documents referenced in the FEIR/FEIS are available for public review at the BART Planning
Department, 3rd Floor, 212 9th Street, Oakland, CA, 94607 and at the Federal Transit Administration, 201
Mission Street, Room 2210, San Francisco, CA, 94105." BART OAC web:
http://www.bart.gov/about/projects/airport.asp .
[ENO] Weant, Robert A.. Parking /, Robert A. Weant and Herbert S. Levinson. Westport,
Conn. (P.O. Box 2055, Westport, 06880) : Eno Foundation for Transportation, c1990. xv,
335 p. : ill. ; 28 cm.
[EPA BWC] From EPA's Best Workplaces for Commuters, program overview
presentation, slide 5: http://www.commuterchoice.gov/resource/progoverview.ppt
[TURNOVER] http://www.weda.org/topics_turnover-costs.html
[RIDES] Rides for Bay Area Commuters – 2002 Commute Profile.
http://www.rides.org/main/commuteprofile_2002.htm
[RUSSO] http://dcrp.ced.berkeley.edu/students/rrusso/parking/Developer%20Manual/Costs/ways_to_communicate_costs.htm
[Value Added] "Transit's Value-Added: Effects of Light and Commuter Rail Services on
Commercial Land Values", Robert Cervero and Michael Duncan, prepared for ULI, July
2001: http://www.rtd-denver.com/Projects/TOD/Rail_Transits_Added_Value.pdf .
[Warren] THE URBAN OASIS: Guideways and Greenways in the Human Environment,
Roxanne Warren, 1997, McGraw-Hill. Reviews and information about the book can be
found at: http://faculty.washington.edu/~jbs/itrans/oasis.htm .
Appendix: Economics Page 186 of 187

Introduction / Summary Chapter Page 187 of 187