note: signal is reduced by - city of fort collins, colorado
TRANSCRIPT
1
Topics
• Policy and Perspective
• How It Works
• Price, Privacy and Health
• Customer Choice
• Web Portal
• Demand Response

Policy and Perspective:Supporting Community Goals
2

3
Reducing Local Greenhouse Gas Emissions
• Fort Collins is a national leader in reducing local greenhouse (GHG) emissions.
• City Council policies support GHG reduction goals.• 2008 Climate Action Plan• 2009 Energy Policy
• Policy helps advance economic and environmental sustainability.

Council Goals
2008 Climate Action Plan
• By 2020, 20% GHG reduction below 2005 levels, 80% by 2050
• Advanced Metering first proposed in Climate Action Plan
4

Council Goals
Energy Policy
5
Council Goals
Energy Policy
6
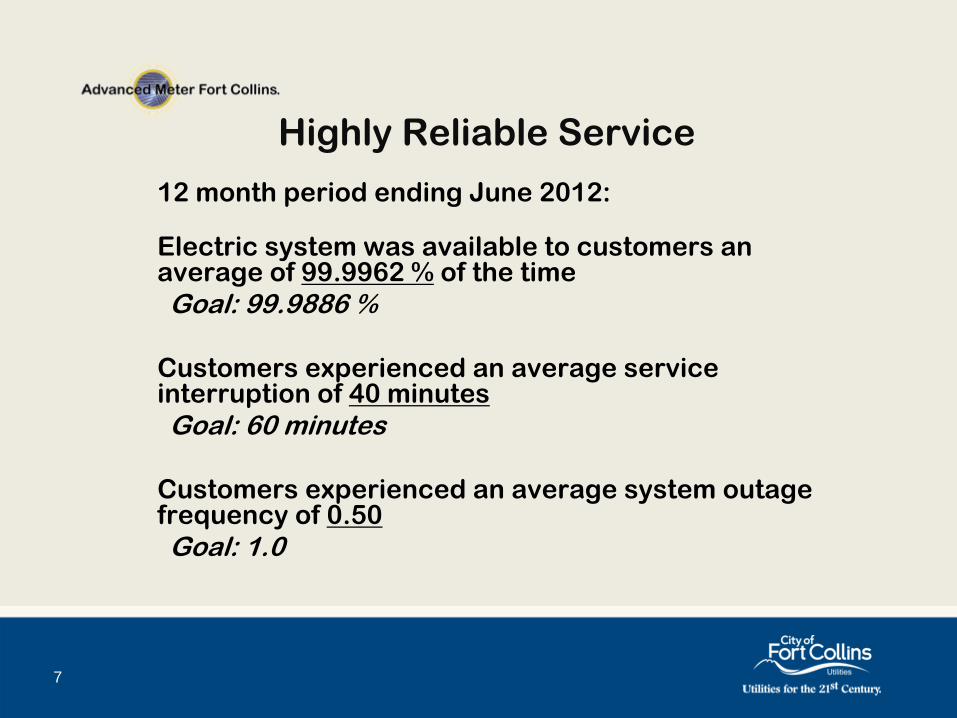
Highly Reliable Service
12 month period ending June 2012:
Electric system was available to customers an average of 99.9962 %
of the time Goal: 99.9886 %
Customers experienced an average service interruption of 40 minutesGoal: 60 minutes
Customers experienced an average system outage frequency of 0.50Goal: 1.0
7
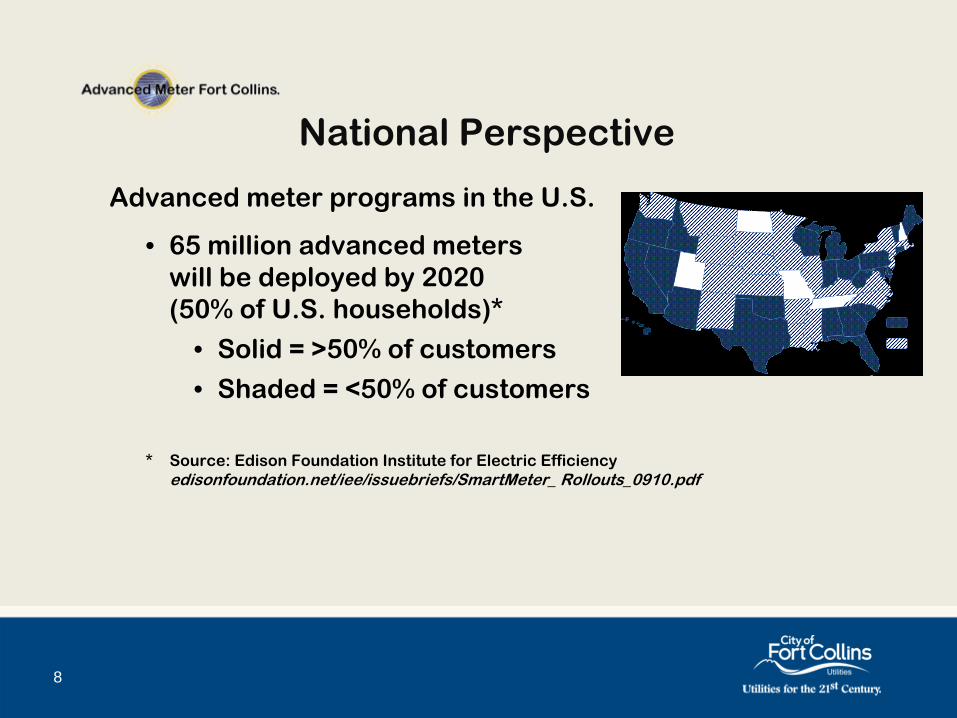
National Perspective
Advanced meter programs in the U.S.
• 65 million advanced meters will be deployed by 2020 (50% of U.S. households)*
• Solid = >50% of customers
• Shaded = <50% of customers
8
*
Source: Edison Foundation Institute for Electric Efficiency edisonfoundation.net/iee/issuebriefs/SmartMeter_ Rollouts_0910.pdf

9
Regional AMI ProjectsPoudre Valley REA –
Fort Collins/Loveland -
200936,000 Landis & Gyr
automated meters
Fort Collins Loveland Water District/South Fort Collins Sanitation District -
2010Sensus
& FlexNet14,000 automated meters
Cheyenne Light, Fuel & Power -
201038,000 Elster meters
Black Hills Energy –
Pueblo -
200856,500 Elster meters750,000 utility customers in Colorado, Iowa, Kansas, Montana, South Dakota, Wyoming
Xcel Energy –
2008 50,000 meters
City of Fountain -
2011Cooper meters
Colorado Springs -
2009530,000 Landis & Gyr
meters
Investing in the Future
AMI communication system• lays the foundation for future
technologies and programs• provides efficiencies today
10
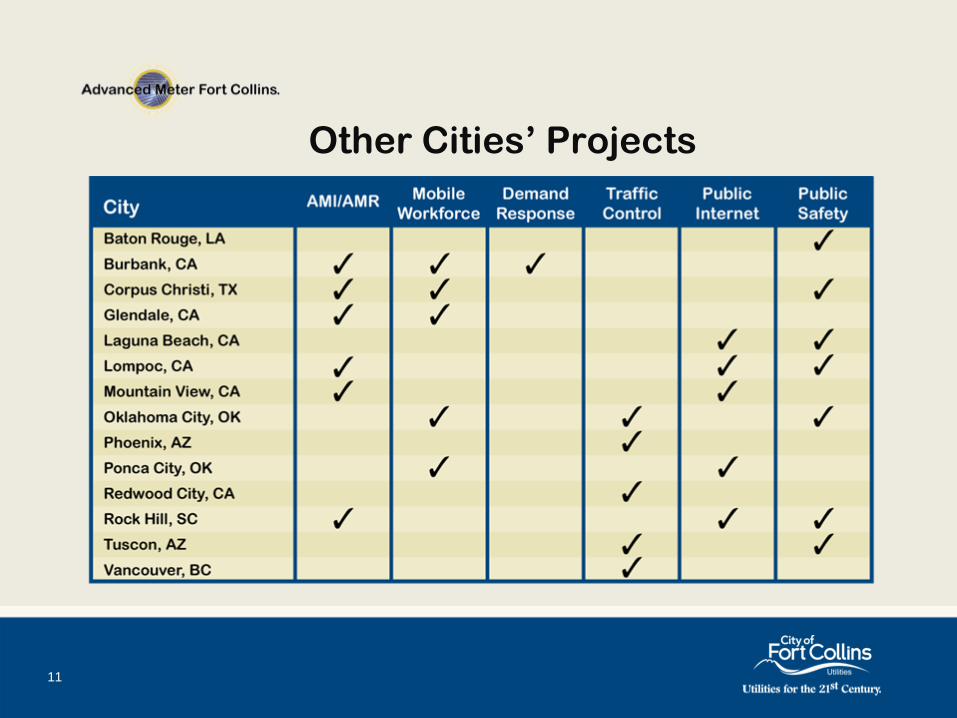
Other Cities’
Projects
11
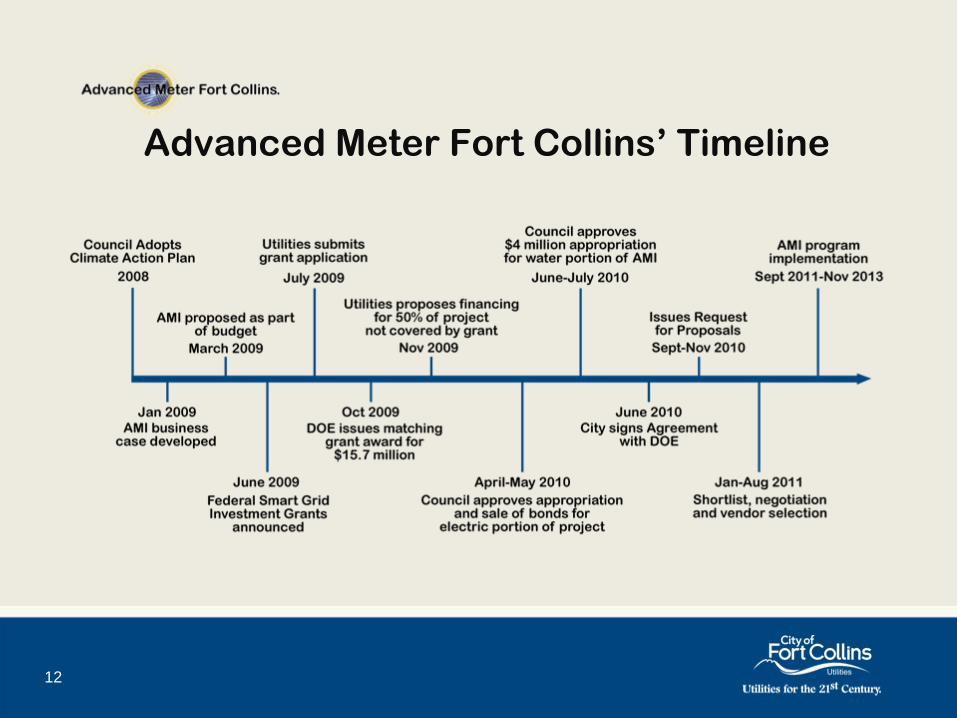
Advanced Meter Fort Collins’
Timeline
12
How It Works: Investment to Maximizes Benefits of Emerging Technologies.
13

New Electronic Electric and Water Meters
• replace mechanical meters• enable two-way digital
communication between the meter and the utility
• give customers data to better understand and manage utility use and costs
• allow Utilities to provide better service to the community
14
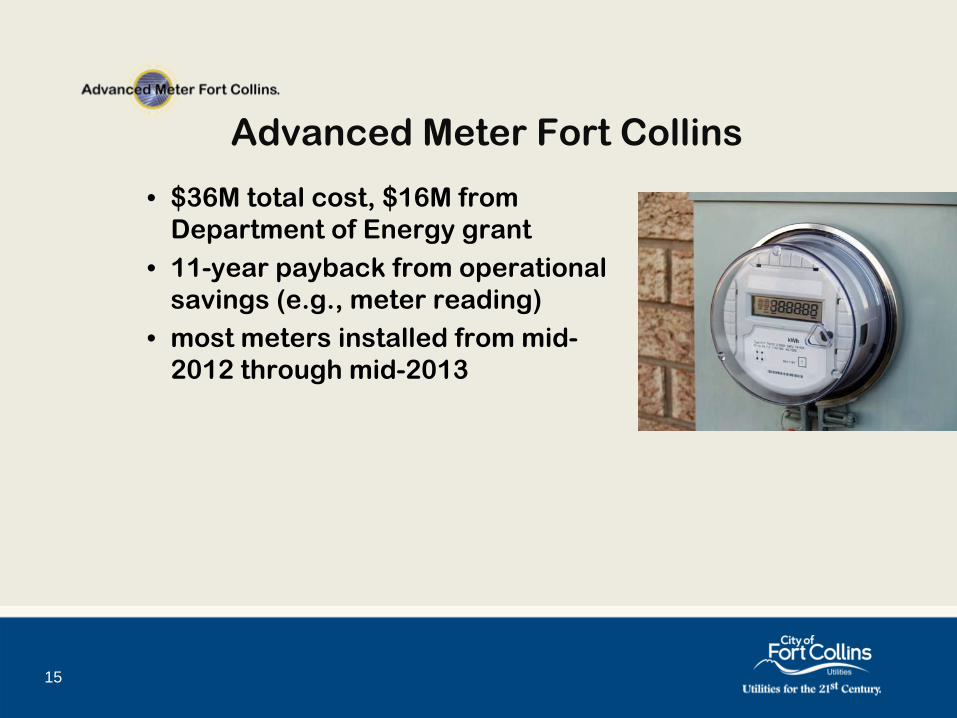
Advanced Meter Fort Collins
• $36M total cost, $16M from Department of Energy grant
• 11-year payback from operational savings (e.g., meter reading)
• most meters installed from mid-
2012 through mid-2013
15
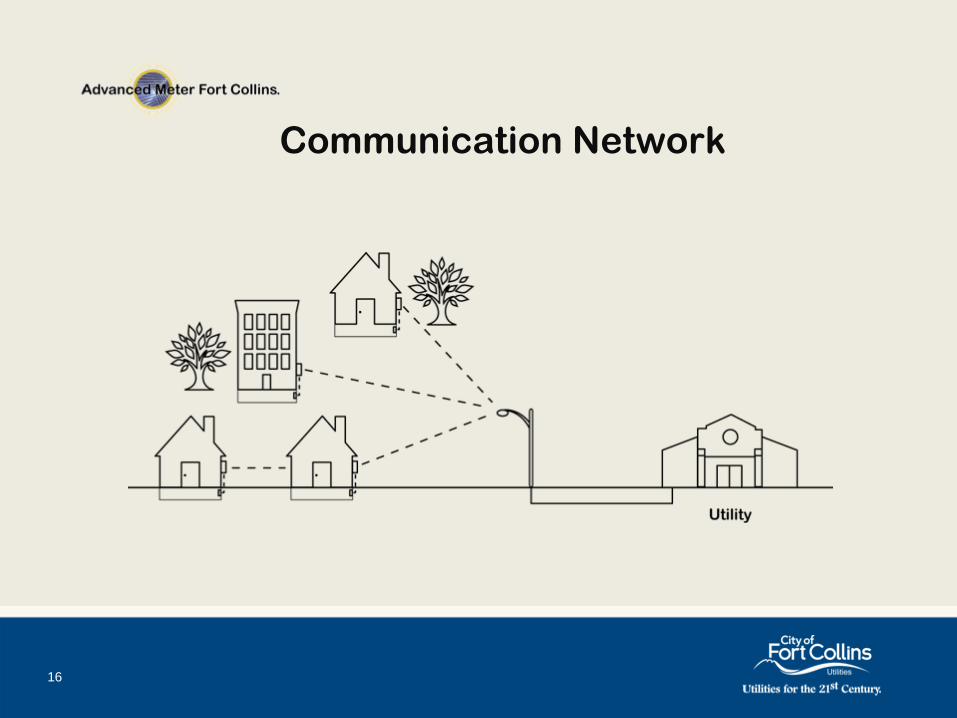
Communication Network
16

End-to-End
Network
• A field proven, end-to-end network
• Authentication
•
Confidentiality
•
Data integrity
•
Reliability
•
Security
17

Typical Home Wireless Network
• Functions like home wireless computer network.
• Wireless devices make up home Local Area Network.
• The LAN connects to the rest of the world through a Wide Area Network (WAN).
18
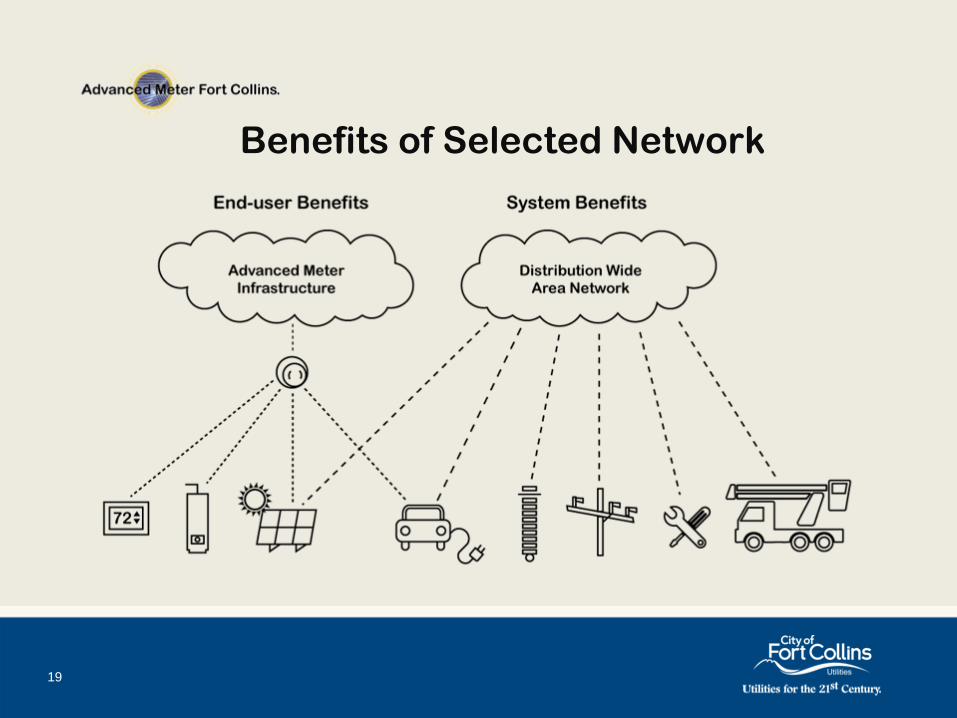
Benefits of Selected Network
19
Questions:•Price •Privacy •Health
20
21
Price/Cost
• Utilities prepared a positive business case using nationally recognized analysis methods.
• reviewed/validated • Claims of inaccuracy have proved
unwarranted by independent laboratories.
• Remote meter reading reduces operational costs.
• Remote outage notification speeds repair and reduces vehicle trips.
Privacy and Security
• Utilities adheres to strict policies to protect customer information.
• Federal: “Red Flags Rules of the FACT Act”• Colorado Open Records Act• internal policies
• Security • Detailed and confidential
cyber security plan adopted.
22

Health
• There appears to be no health reason to avoid the use of smart meters.”
- Excerpt from Dr. Bruce Cooper, Health District of Northern Larimer County, based on his review of various studies
• Levels are significantly less than those from cell phones, microwaves, wireless routers, cordless phones and other common devices.
• Meters transmit only occasionally via a brief signal.
23
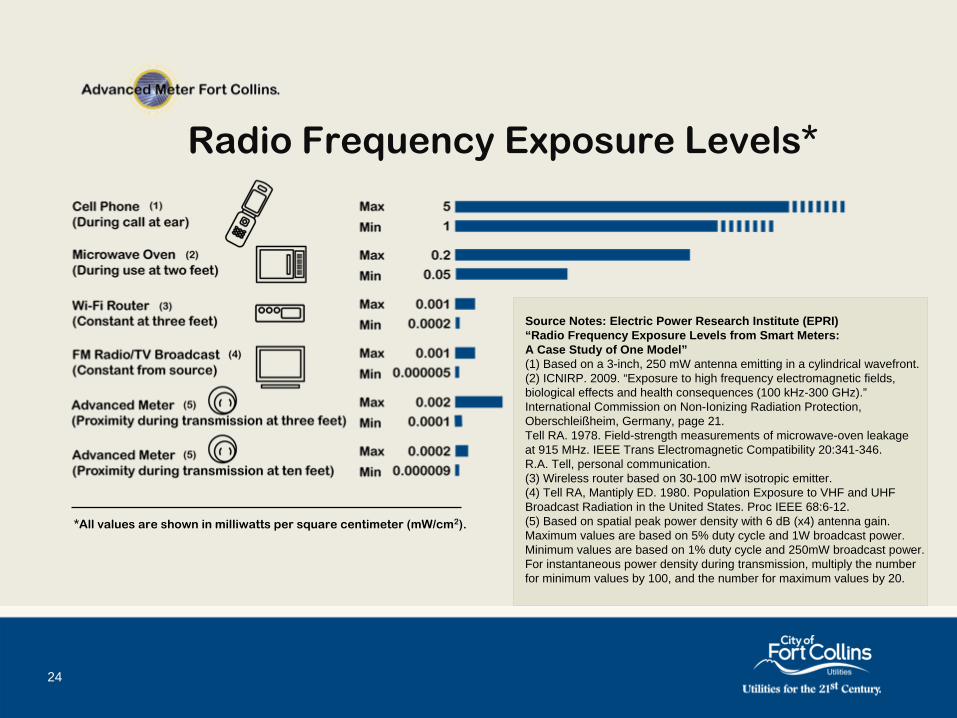
Radio Frequency Exposure Levels*
24
Source Notes: Electric Power Research Institute (EPRI) “Radio Frequency Exposure Levels from Smart Meters: A Case Study of One Model”(1) Based on a 3-inch, 250 mW antenna emitting in a cylindrical wavefront.(2) ICNIRP. 2009. “Exposure to high frequency electromagnetic fields, biological effects and health consequences (100 kHz-300 GHz).” International Commission on Non-Ionizing Radiation Protection, Oberschleißheim, Germany, page 21.Tell RA. 1978. Field-strength measurements of microwave-oven leakage at 915 MHz. IEEE Trans Electromagnetic Compatibility 20:341-346. R.A. Tell, personal communication.(3) Wireless router based on 30-100 mW isotropic emitter.(4) Tell RA, Mantiply ED. 1980. Population Exposure to VHF and UHF Broadcast Radiation in the United States. Proc IEEE 68:6-12.(5) Based on spatial peak power density with 6 dB (x4) antenna gain. Maximum values are based on 5% duty cycle and 1W broadcast power. Minimum values are based on 1% duty cycle and 250mW broadcast power. For instantaneous power density during transmission, multiply the number for minimum values by 100, and the number for maximum values by 20.
*All values are shown in milliwatts
per square centimeter (mW/cm2).
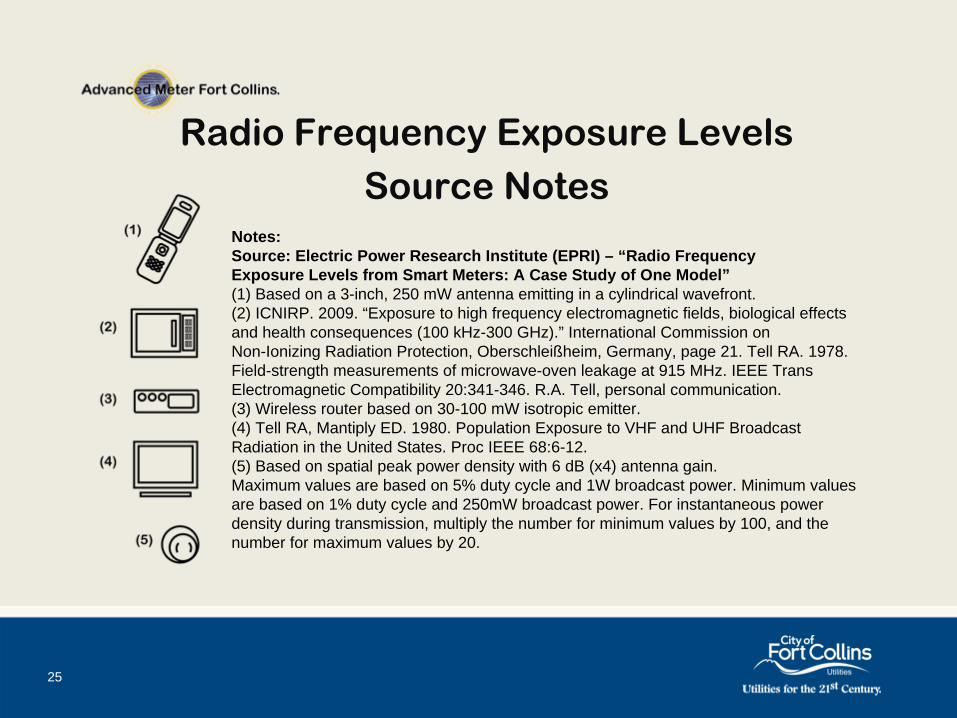
Radio Frequency Exposure LevelsSource Notes
25
Notes:Source: Electric Power Research Institute (EPRI) – “Radio Frequency Exposure Levels from Smart Meters: A Case Study of One Model”(1) Based on a 3-inch, 250 mW antenna emitting in a cylindrical wavefront.(2) ICNIRP. 2009. “Exposure to high frequency electromagnetic fields, biological effects and health consequences (100 kHz-300 GHz).” International Commission on Non-Ionizing Radiation Protection, Oberschleißheim, Germany, page 21. Tell RA. 1978. Field-strength measurements of microwave-oven leakage at 915 MHz. IEEE Trans Electromagnetic Compatibility 20:341-346. R.A. Tell, personal communication.(3) Wireless router based on 30-100 mW isotropic emitter.(4) Tell RA, Mantiply ED. 1980. Population Exposure to VHF and UHF Broadcast Radiation in the United States. Proc IEEE 68:6-12.(5) Based on spatial peak power density with 6 dB (x4) antenna gain. Maximum values are based on 5% duty cycle and 1W broadcast power. Minimum values are based on 1% duty cycle and 250mW broadcast power. For instantaneous power density during transmission, multiply the number for minimum values by 100, and the number for maximum values by 20.

0.000201
0.0000220.000001
0.000011 0.000002
-4 -2 0 2 4 6 8 10 12
Radius (ft) from Meter
3.5 Years
68 Days
1.7 Years
19 Years
32 Years
4 2
Meter RF Exposure Comparison
Note: Signal is reduced by meter socket and wall
Cell phone exposure:
-
5 Minutes at 1 cm from ear
-
0.013816 mW
/ cm2
1)
Values calculated by FCU for meter RF power density are shown in
mW/cm2, and are calculated based on 0.1% transmit duty cycle (86 seconds per day) and 250mW transmit power.
2)
Cell phone 50mW transmit power based on FCC data for HTC Thunderbolt smart phone.
How long does it take to receive the same time-averaged RF exposure from the advanced metering system that you would receive from one cellular Phone Call?
Customer Choice: Information and Technology for Customer Choices.
27

New Electronic Meters
• Can provide a wealth of information if the customer chooses
• Can be programmed to:
• communicate daily total usage
• communicate detailed usage –
every 15 minutes
• integrate with a Home Area Network
• be completely “silent”
–
just like today
28
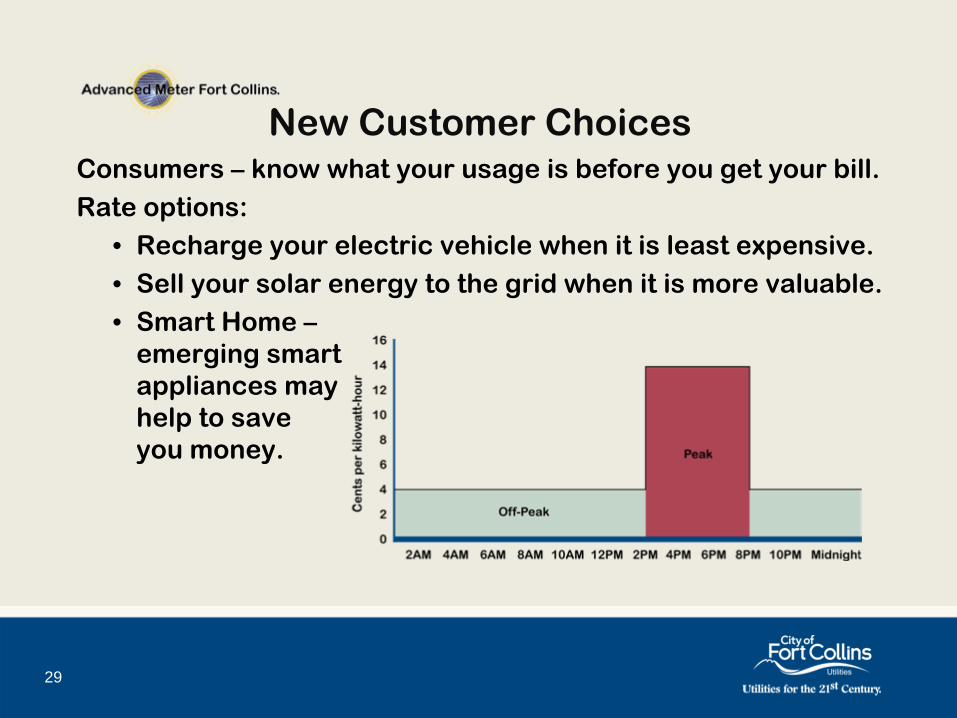
New Customer ChoicesConsumers –
know what your usage is before you get your bill.Rate options:
• Recharge your electric vehicle when it is least expensive.• Sell your solar energy to the grid when it is more valuable.• Smart Home –
emerging smart appliances may help to save you money.
29
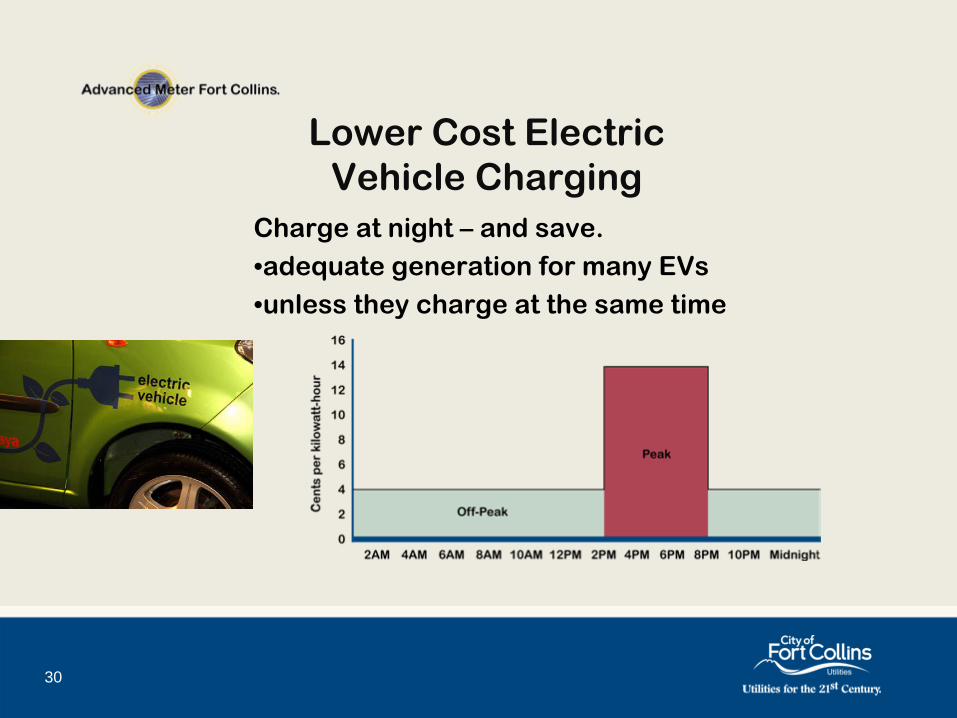
Lower Cost Electric Vehicle Charging
Charge at night –
and save.•adequate generation for many EVs•unless they charge at the same time
30
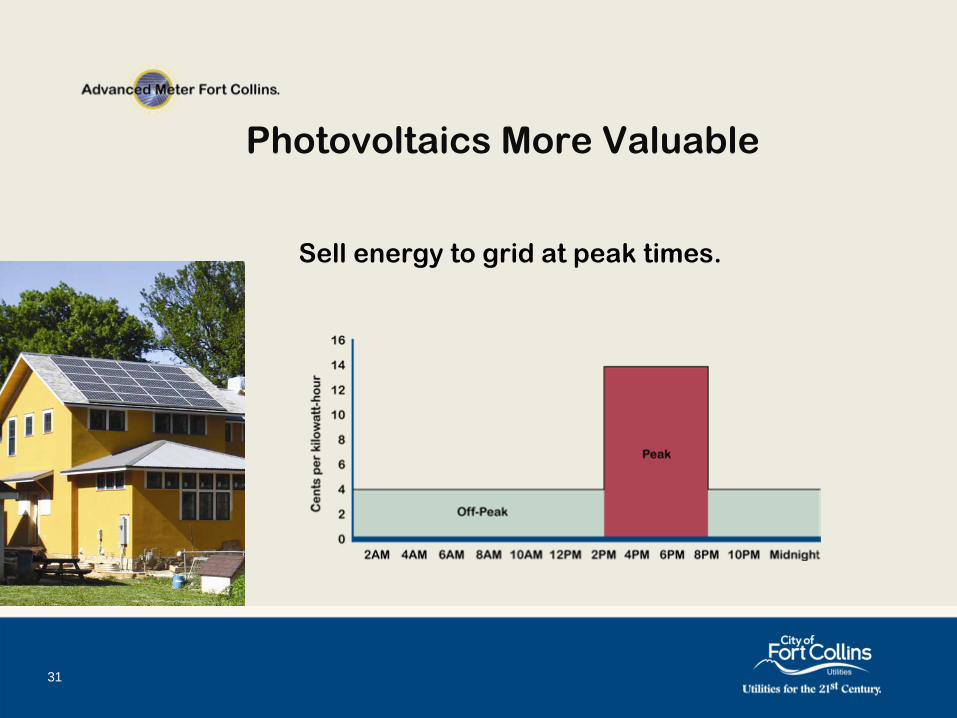
Photovoltaics
More Valuable
31
Sell energy to grid at peak times.
Local EnergyClouds with a solar lining
• Solar energy (photovoltaic)
is getting cheaper, so more people are installing panels.
• When a cloud passes between
the sun and a solar panel, output
can drop in seconds, creating imbalance in the grid.
• Balancing the grid traditionally means adding standby generators (e.g., peaking generators).
• With advanced meters, it will be possible to solve this problem and balance the grid with existing load and generation –
saving money.
32
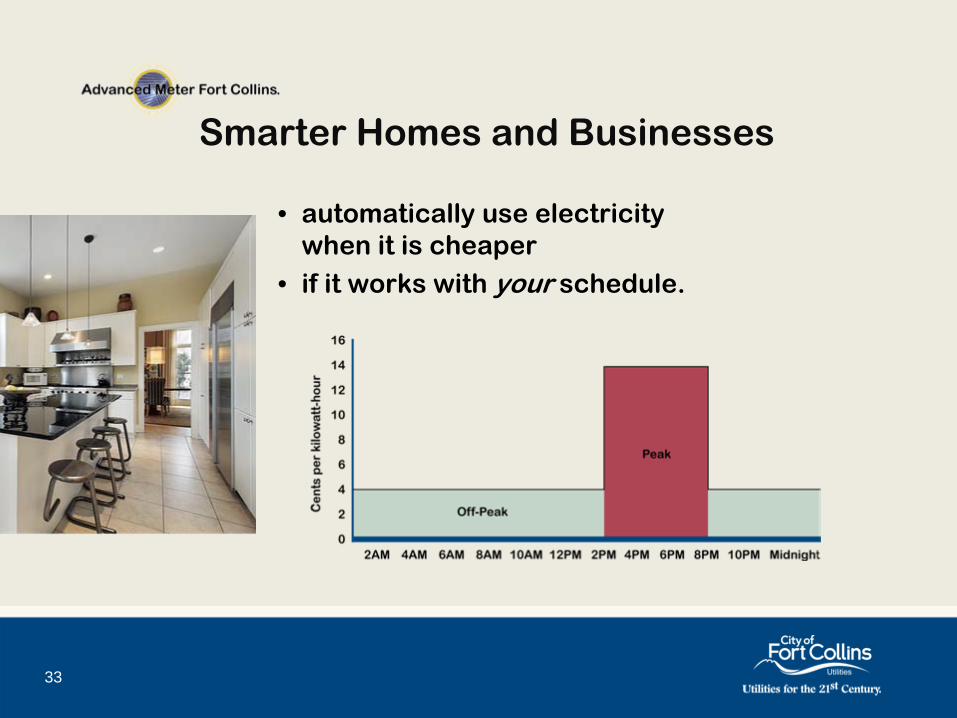
Smarter Homes and Businesses
• automatically use electricity when it is cheaper
• if it works with your schedule.
33
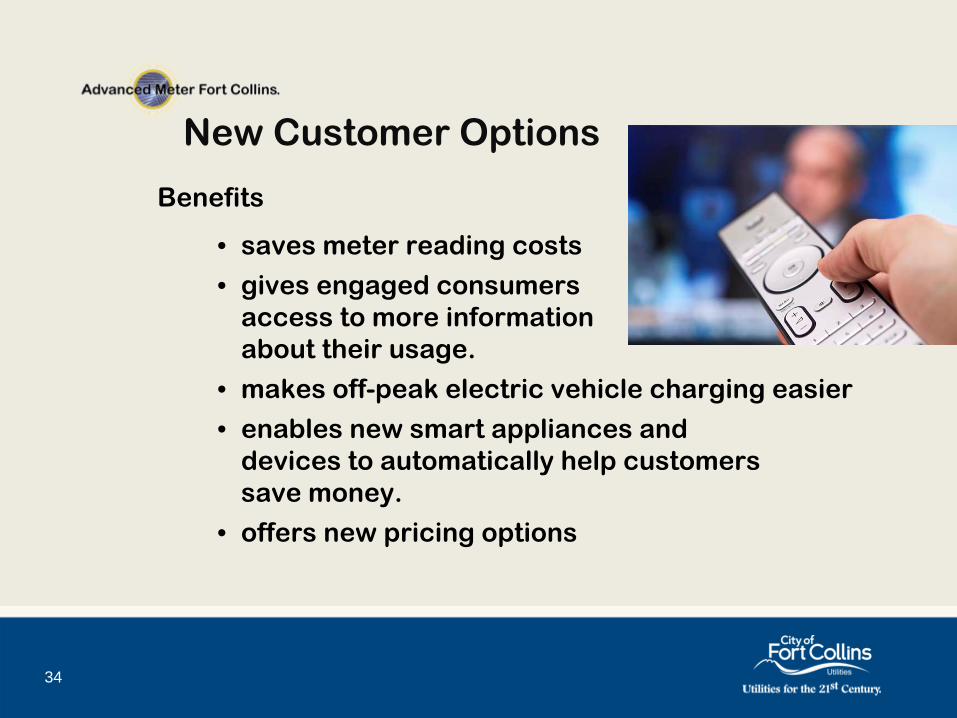
New Customer Options
Benefits
• saves meter reading costs
• gives engaged consumers access to more information about their usage.
• makes off-peak electric vehicle charging easier
• enables new smart appliances and
devices to automatically help customers
save money.
• offers new pricing options
34

Web Portal: Online Link dataand support
35
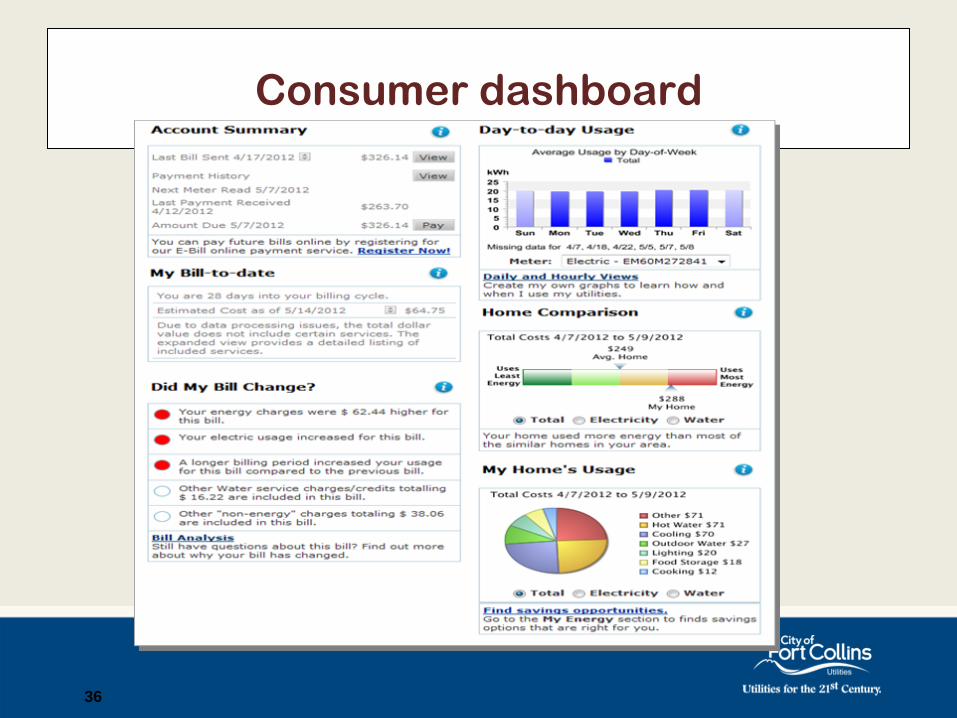
Consumer dashboard
36
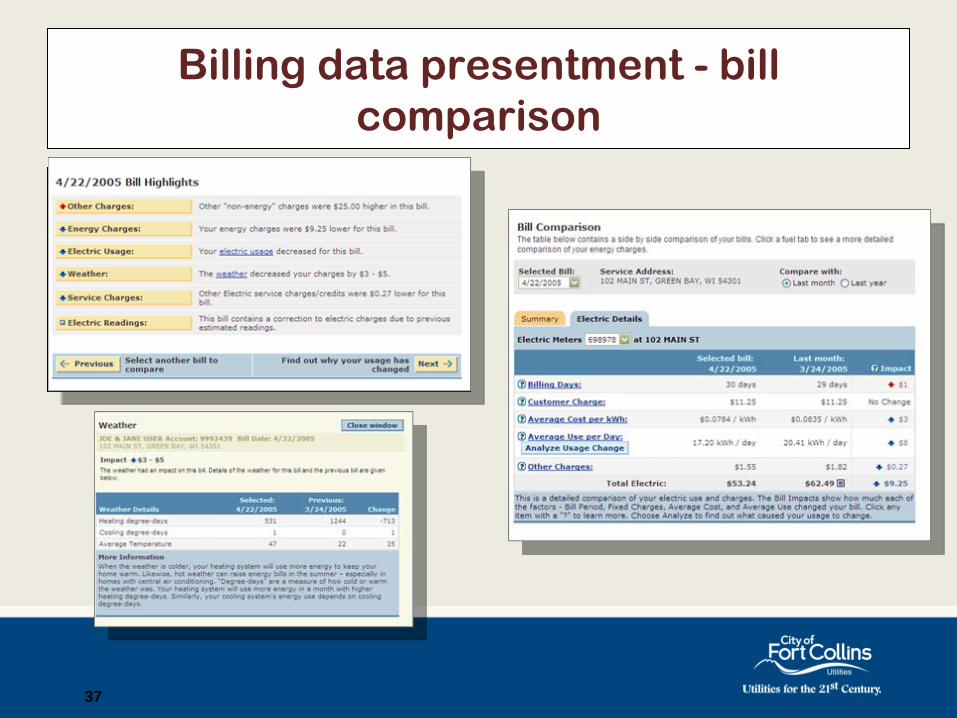
Billing data presentment -
bill comparison
37

Billing data presentment –
bill history
• Multiple views• Configurable• Monthly charts• Action links
38
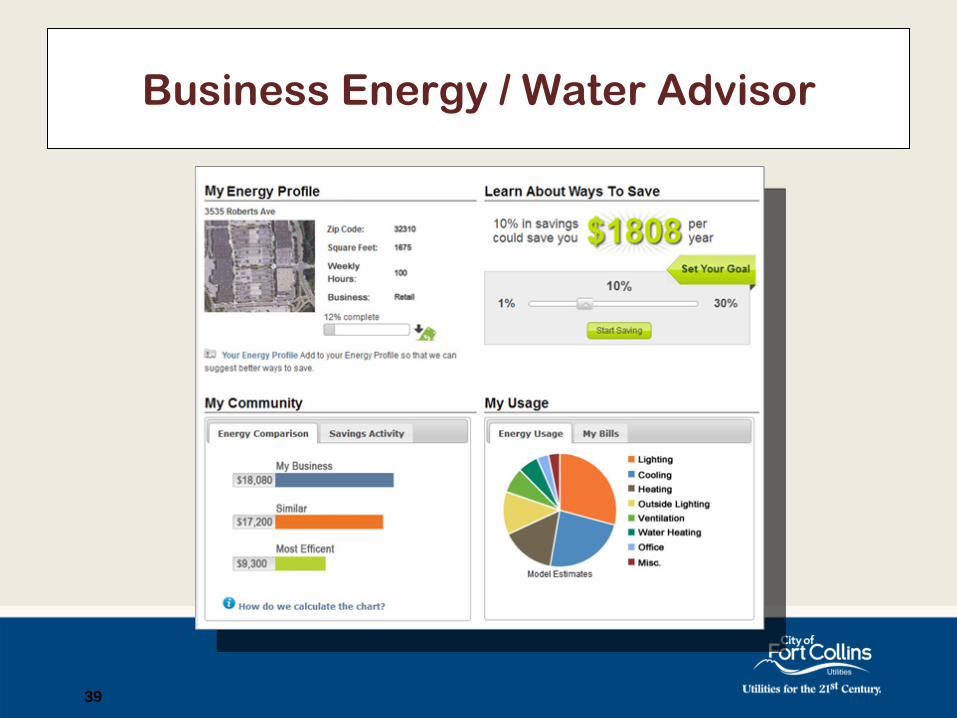
Business Energy / Water Advisor
39

Business Energy Analysis Model
40
•Uses data from a range of different sources: utilities, government labs, etc
•Analyzes the heating and cooling loads using local weather conditions
•Modeling for most common business appliances and equipment
•Selects and analyzes energy efficiency measures
•Calibrated for local conditions

Solution Overview Business energy/ water advisor module
• Specially designed for small & mid-size Businesses– 40+ business segments
• Office, Retail, Restaurant, Education, Grocery, Services, etc.
– 500 to 100,000 square feet– Modeling for most common business
appliances and equipment– Renters or Owners
41
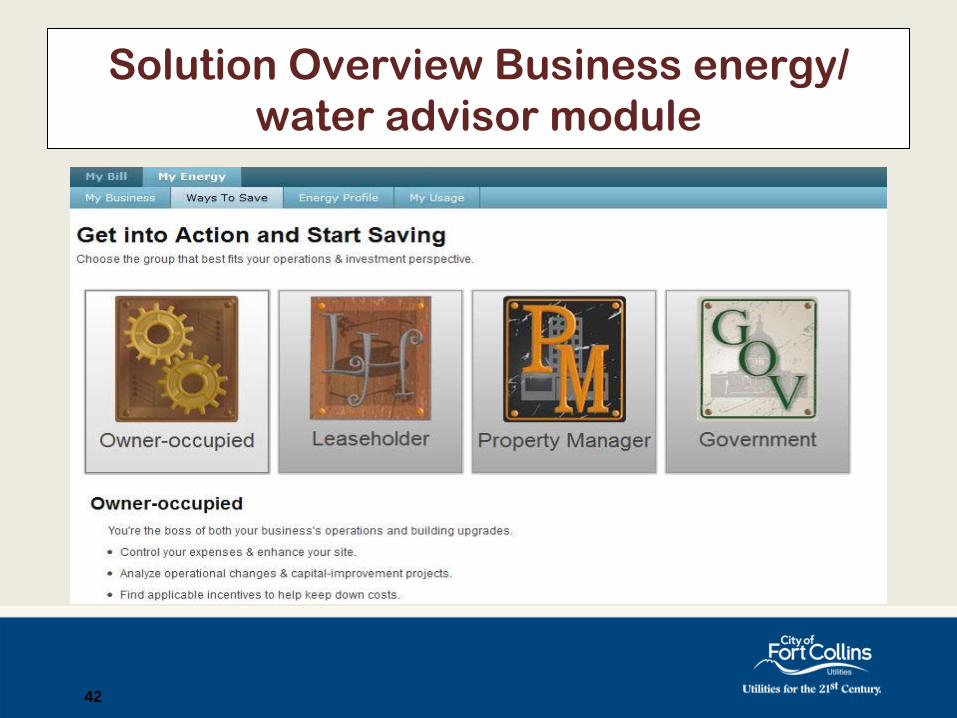
Solution Overview Business energy/ water advisor module
42
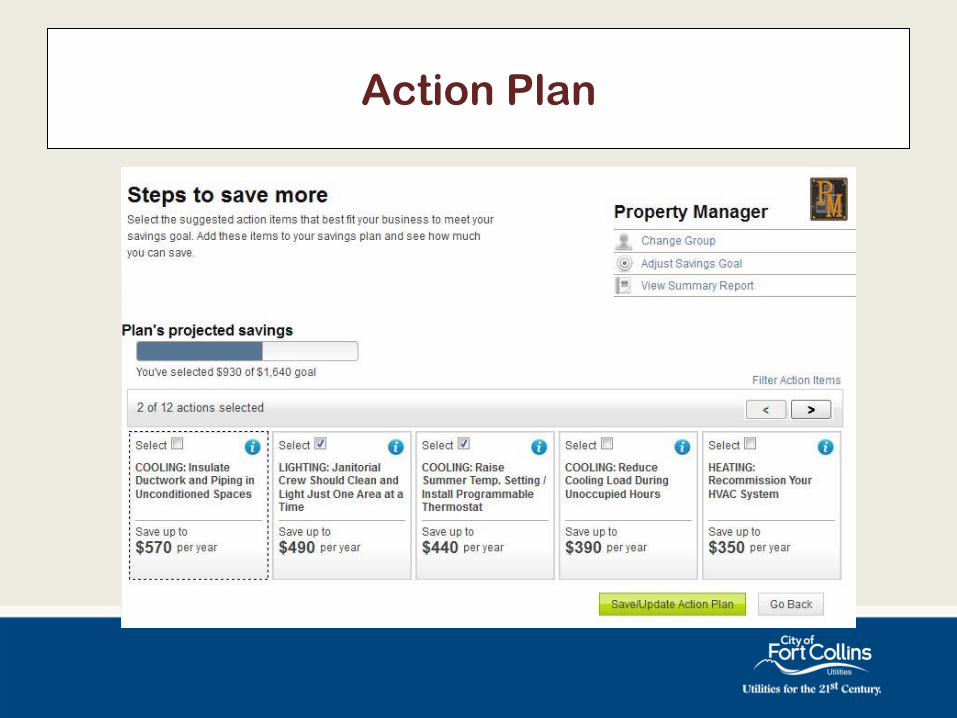
Action Plan
Demand Response: Enhanced options to control costs and use
44
45
Demand Response
Under construction
46
Serving Fort Collins Businesses & Homes
Visit: fcgov.com/advancedmeter