note: on january 3, 2013, mr. evan sponagle, author of ...files.export.gov/x_859357.pdf · note: on...
TRANSCRIPT
2013
Note: On January 3, 2013, Mr. Evan Sponagle, author of this report, allowed CS Rio to post it at Commerce’s Export.gov webpage as an IMI report.
The Brazilian Oil Pre-Salt Program: Update, Opportunities and Special Themes
Evan Sponagle (+5521) 2512-
2741

1
1
Executive Summary
The scope of this report is aimed at exploring attractive investment opportunities for players (both local and international) targeting the oil services industry in the vast pre-salt Brazilian offshore oil exploration and production sectors. We analyze the current state of critical sub-sectors whose potential future growth prospects are directly correlated to the expressive demand of oil exploration and production needs in the country over the next decade. While a significant array of oil services will be demanded to garner all the production potential of the Brazilian pre-salt fields, we concentrate our focus on two essential sectors going forward: ROV (Remotely-operated vehicles) Service Industry and the Naval Construction Industry – both poised for potentially exponential demand in the coming years. We conclude the potential of these industries as follows:
• ROV Service Industry
• Naval Construction Industry
In addition to sizing, analyzing the current state and measuring the future growth potential of these industries in Brazil, we attempt to measure not only the considerable opportunities for players wishing to enter and/or expand existing capabilities but also identify potential setbacks, bottlenecks and delays which the industry as a whole is currently exposed to. Concurrently to the significant technological challenges in exploration and bottlenecks due to the Brazilian industry’s relative inexperience in this field, we have analyzed an issue which we believe may impact production, and perhaps more importantly, delivery schedules going forward: the perceived highly-aggressive local content requirements. We address current, specific Brazilian tax exemption laws (REPETRO) and how any future changes in these exemptions could impact investment attractiveness. Finally we describe the financing alternatives available in both local and hard currencies. Clearly, these three special themes are not the only ones worthy of analysis, however, we believe they are
especially critical to new entrants in this complex and highly competitive market.
The full development potential of the Brazilian pre-salt fields remains a source of considerable debate worldwide and, as such, the verdict concerning its eventual success rate is still out. According to sources, both local and international, a gamut of testing, and even simultaneous, challenges must be overcome. These challenges are summarized as follows:
• Technological feasibility: the commercial recovery of hydrocarbons at ultra-deep levels (up to 5,000-plus meters) over a vast expanse should prove a daunting
challenge for producers;
• Exploration and extraction costs: Unparalleled in the oil history, the extraction of oil at these ultra-deep levels should prove highly costly (over double the current extraction of conventional oil recovery);
• Location and infrastructure disadvantages: Depth levels coupled with distance from shore may result in logistics bottlenecks down the road;
• Installed capacity bottlenecks: It remains to be seen whether a severe shortage of existing manpower, a still-anemic naval industry, the lack of experience
of building essential production units, such as FPSO’s and a still-underdeveloped supply chain able to comply with high local content requirements may lead to production and delivery delays over the coming decade.
The Brazilian Oil Pre-Salt Fields
Total Area: 149,000 Km2
Granted Area: 45,615 Km2 (30.6%)
Ungranted Area: 103,385 Km2 (69.4%)
Petrobras Stake: 39,615 Km2 (26.6%)
Green: Exploration Blocs
Yellow: Ring Fence
Orange: Transfer of Rights Area
Blue: Pre-Salt Reservoirs
Source: Petrobras

2
2
Pre-Salt Fields Dimensions The Brazilian Oil Pre-Salt Fields: A Brief Overview:
The expression "pre-salt" makes reference to an aggregation of rocks located offshore in a large portion of the Brazilian coast and with potential to generate and accumulate oil. It was called pre-salt because it forms a rock interval that ranges under an extensive layer of salt which, in certain areas of the coast, can be as much as 2,000 meters thick. The total depth of these rocks can be as much as
7,000 meters.
Source: Petrobras
Dimensions of the Lula (ex-Tupi) Oil Pre-Salt Field
Source: Petrobras
LULA
The pre-salt fields measure 800 kilometers in length and 200 kilometers in width. It is approximately 340 kilometers to the Brazilian coast line. These oil fields cover a total area of 149,000 square kilometers, of which 45,615 square kilometers have already been granted (30.6%). Petrobras’ stake of these granted fields is equal to 39,615 square kilometers, or 26.6% of total fields. Oil field areas yet to be granted equal 103,385 square kilometers or 69.4% of total area.
The first pre-salt results indicated very significant volumes. Initial drilling commenced in the Santos basin in 2004. The first field, Tupi (later renamed Lula) located in the Santos Basin, has recoverable volumes estimated at 5 to 8 billion barrels of oil equivalent or roughly 50% of current reserve levels of 15 billion boe. Meanwhile, the Guará well, also in the Santos Basin, is estimated at 1.1 to 2 billion barrels of light oil and natural gas. The Lula oil field is a vast oil field located in the Santos Basin, 250 kilometers (160 miles) off the coast of state of Rio de Janeiro. It is considered to be the Western Hemisphere's largest oil discovery of the last 30 years. The Lula oil field discovery represented the largest find globally since the Kazakh Kashagan discovery in 2000. While the first of the region’s exploratory blocs, the Lula field is expected to increase Brazilian oil production in up to 70%. By year-end 2011, the Lula field averaged oil production of 2,084,262 barrels/day), natural gas excluding liquefied gas (60,664,000 cubic meters) and oil and gas (2,465,828 barrels of oil equivalent). Should the Lula field achieve the 5 billion boe target, it would make it twice the size of the Roncador, previously Brazil's largest field.

3
3
In January 2008 Petrobras announced the discovery of the Jupiter field, a huge natural gas and condensate field which could equal the Lula oil field in size. It lies 37 kilometers (23 miles) east of the Lula field.
According to Petrobras, pre-salt reserves are estimated at between 70 billion and 100 billion boe. If this full potential is realized, this would represent a 4- to 5-fold increase in relation to current reserve levels. This possible increase, if fully realized, could catapult Brazil into the 6th largest global oil producer (currently 14th largest).
It is expected that Brazilian oil production should rise approximately 108% (CAGR of 8.5%) from 2,022 kbpd in 2011 to 4,200 kbpd in 2020. The participation of pre-salt production is expected to rise from 5% in 2011 to 30% in 2016 and 58% in 2020.
Brazil’s track record in deep water oil production is undeniable, as seen in the graph aside. Inexistent in 1980, deep water oil production has grown exponentially since 1990. While total oil production rose 10-fold since 1980, equivalent to a compounded annual growth rate of 8.4%, deep water oil production increased dramatically 38-fold or 20% per annum since 1990.
While the discovery of these massive pre-salt oil fields and Brazil’s proven track record so far in exploring, lifting and producing deep water oil reserves bodes well for the Brazilian oil industry, the sheer technological challenge of exploring and lifting such ultra-deep oil should put the even the largest, most experienced and technologically innovative global players to the extreme test.
Lula (ex-Tupi) & Jupiter Oil Pre-Salt Field Potential
Lula Oil Potential
Source: Petrobras
Source: Petrobras
To fully explore this potential over the next decade, Petrobras, in its 2012-2016 Business Plan, unveiled a highly aggressive investment program. Up through 2016, Petrobras will invest US$236.5 billion of which US$140 billion, or 60%, in Exploration and Production activities. Of the 980 projects encompassed in its Capex program, 833 projects, valued at US$209 billion, are already being implemented. A residual 147 projects worth US$28 billion are currently under study.

4
4
Of the total E&P investment for the period, 32% and 67% of exploration and production development capex respectively are earmarked for pre-salt activities.
2012-2016 Petrobras Business Plan
Source: Petrobras
Brazilian Oil Pre-Salt Fields Depth
Source: ANP, Petrobras, the Economist, Various
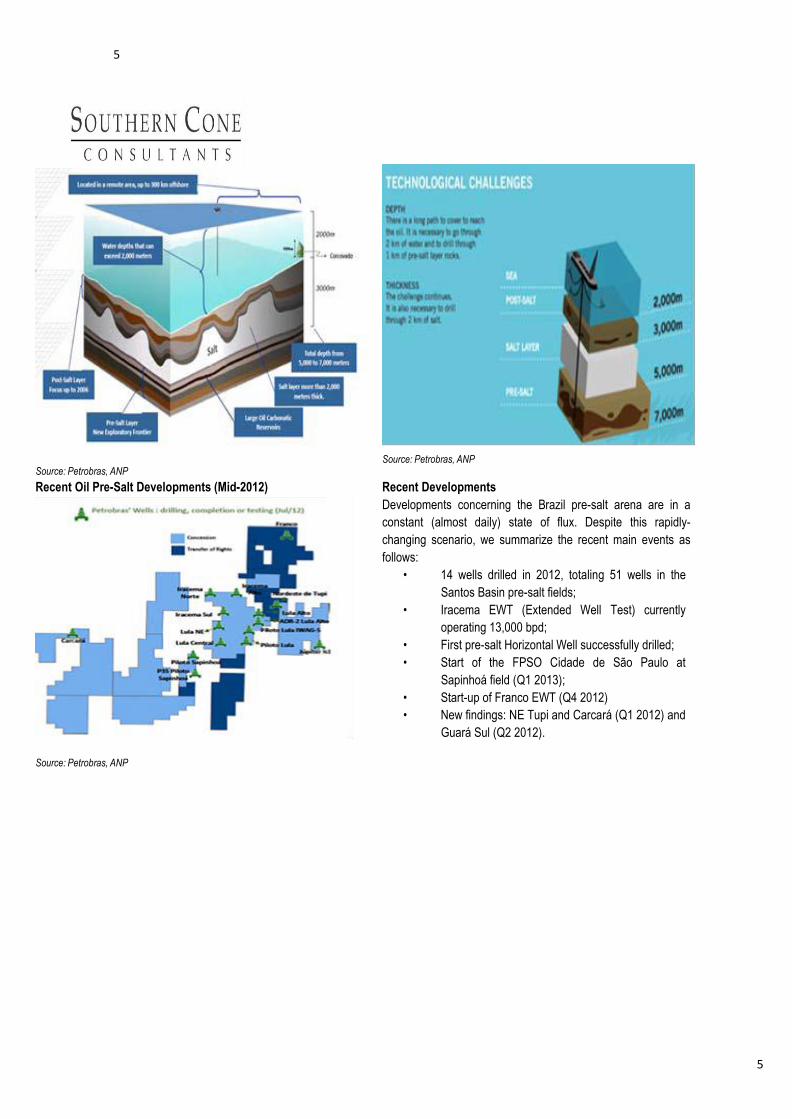
Exploration and development of the pre-salt oil fields may still be in its infancy, but they are among the most complex ever drilled – located in 7,000 ft of water with reservoirs buried underneath salt layers up to 6,500-ft thick. These characteristics present a multifaceted deepwater scenario that is bringing new challenges to Brazilian exploration and production. The illustration aside highlights the extreme depths of the pre-salt reserves in relation to other reserves worldwide. The depths of the Brazilian pre-salt reserves are significantly deeper than the Macondo oil field in the Gulf of Mexico (slightly over 5,000 meters) and the Magnus oil field in the North Sea, at slightly over 2,500 meters).
Reservoirs in this domain are complex heterogeneous layered carbonates, which makes accurate reservoir characterization very challenging. Drilling these wells is proving to be extremely difficult with low penetration rates. In addition, the pre-salt environment is very corrosive with significant amounts of carbon dioxide (CO2) and hydrogen sulfide (H2S) present. This places a high demand on special cement and metallurgy throughout the drilling and completion process.
In order to fully explore the potential of the pre-salt reserves, even the largest, most experienced and technologically advanced global producers such as Halliburton, Schlumberger/ Baker Hughes and FMC Technologies, among others, will be put to the extreme test. The introduction of new innovative technologies will become an absolute prerequisite over the coming decade.
5
5
Source: Petrobras, ANP
Recent Oil Pre-Salt Developments (Mid-2012)
Source: Petrobras, ANP
Source: Petrobras, ANP
Recent Developments
Developments concerning the Brazil pre-salt arena are in a
constant (almost daily) state of flux. Despite this rapidly-
changing scenario, we summarize the recent main events as
follows:
• 14 wells drilled in 2012, totaling 51 wells in the
Santos Basin pre-salt fields;
• Iracema EWT (Extended Well Test) currently
operating 13,000 bpd;
• First pre-salt Horizontal Well successfully drilled;
• Start of the FPSO Cidade de São Paulo at
Sapinhoá field (Q1 2013);
• Start-up of Franco EWT (Q4 2012)
• New findings: NE Tupi and Carcará (Q1 2012) and
Guará Sul (Q2 2012).

6
6
New Production Units: 2012-2014
Local Content
Project Capacity 1st Oil Hull Top S ide/I ntegration Commit. Target
FPS O Baleia Azul 100 kbpd Aug 2012 Existing SBM (Singapore) 0 0
(FPS O Cid. Anchieta)
Bauna & Piracaba 80 kbpd Oct 2012 Jurong (Singapore) Odebrecht & Teekay (Singapore) 0 0,07
(FPS O Cid. I tajaí)
Sapinhoa Pilot 120 kbpd Jan 2013 Cosco Shipyard (China) SchahinModec (Brasfels) 0,3 0,5
(FPS O Cid. S ão Paulo)
Lula NE Pilot 120 kbpd May 2013 Keppel Shipyard (Singapore) QGOG/SBM (Brasfels) 0,3 0,65
(FPS O Cid. Paraty)
Sapinhoa Norte 150 kbpd Sept 2014 QGOG/SBM (China) QGOG/SBM (SBM/BRASA) 0,3 0,65
(FPS O Cid. I lhabela)
Lula-Iracema Sul 150 kbpd Nov 2014 Cosco Shipyard (China) Not Defined 0,3 0,65
(FPS O Cid. Mangaratiba)
Rigs
Papa-Terra 140 kbpd July 2013 Cosco Shipyard (China) Quip (Rio Grande) 0 0,7
(P-63)
Roncador Module III 180 kbpd Sept 2013 EAS (Brazil) Quip (Rio Grande) 0 0,788
(P-55)
Papa-Terra Natural Gas Oct 2013 Floatec/Brasfels Floatec/Brasfels 0 0,7
(P-61)
Parque das Baleias 180 kbpd Jan 2014 Queiroz Galvão (Rio Grande) Queiroz Galvão (Rio Grande) 0 0,63
(P-58)
Roncador Module IV 180 kbpd Mar 2014 Camargo Corra/ESA Camargo Corra/ESA 0 0,63
(P-62)
Source: Petrobras
In order to fully explore the potential of the Brazilian pre-salt oil fields, over 20 oil services companies – among them some of the largest global players – have already established research and development centers at the Federal University of Rio de Janeiro (UFRJ) in a high-tech park of 350,000 square meters. This area entered into high gear in 2007 and ranks among the largest oil “think tanks” in the world.
Once fully operational in 2014, it is expected that the UFRJ Technological Center will receive investments of R$500 million and employ approximately 5,000 researchers.

7
7
Pre-Salt Technology Companies In Rio de Janeiro
2003 19 R$500 Million 5,000 Initial Year Companies Investments Researchers

8
8
Focus Industries
ROV (Remotely-Operated Vehicles)
SHIPBUILDING

9
9
Brazilian ROV Service Market
One of the chief beneficiaries of ultra-deep water oil exploration in Brazil is the ROV (Remotely-operated vehicles) segment. The oil and gas sector is the largest single market for the ROV industry, with underwater vehicles currently being used for a wide spectrum of activities across all life-of-field phases in the offshore arena: the drilling and development of wells; installation and construction of production facilities; inspection, repair and maintenance; and decommissioning. ROVs are submersible vehicles operated by technicians from a control van, typically onboard a floating drilling rig or surface vessel. They are piloted by means of a microprocessor-based control system through an armored electrical fiber-optic umbilical. ROVs are used to perform a variety of offshore oilfield tasks in water depths that preclude the use of manned diving. As a result, demand for ROV’s manufacturers is intrinsically linked to deepwater oil exploration worldwide.
In order to replace depleting reserves, the oil and gas industry has been characterized by a move to ever deeper waters. This has coincided with ROVs becoming an ever more useful technology with their ability to work in depths inaccessible to divers. The demand profile by depth anticipates that large rises in demand for work class ROVs capable of operating in depths greater than 1,000 meters.
The ROV industry is relatively new: during the 1970s there were only three ROVs worldwide yet as deepwater exploration intensified worldwide, the industry has grown very aggressively since the 1980s. Deep and ultra-deepwater activity will be the main source of demand for ROVs in the coming years. A large proportion of expected growth in deepwater activity will be concentrated in Africa and Latin America, where rises in ROV demand of 126% and 157% are forecast respectively until 2015. Nigeria and Angola in West Africa and Brazil in Latin America will be chiefly responsible for such increases in demand. Brazil, in particular, exemplifies the nature and profile of deepwater demand.
Remotely Operated Vehicles (ROVs) fall into 2 categories:
Work Class ROVs and Observation ROVS
• Work Class ROVs : These powerful deepwater ROVs have 5 and 7 function robotic arms (manipulators) and depending on the tools installed can be used for various subsea interventions and surveys. Current Petrobras contracts require that the Work Class ROVS to have at least 150 horsepower and be able to lift a payload of a minimum of 200 kilos. Typical tasks include cutting cables, opening and closing valves, and survey of pipelines.
• Observation ROVs : These smaller and less powerful ROVs, as their name implies, are principally used for
observation and inspection. In some cases they may be outfitted with a small manipulator and inspection equipment.
Both Work class and Observation ROVs may be deployed either on fixed platforms or other vessels such as Anchor Handling Tugs (AHT), Diving Support vessel (DSV), Pipe Laying Support vessel (PLSV) or specialized ROV Support Vessels (RSV). Petrobras typically contracts one work class ROV for each fixed platform. The Specialized vessels normally have two work class vehicles and an observation vehicle aboard.
In addition to assisting in the exploration of new oil fields, maintenance needs of existing equipment are also vital for the ROV industry since the future demand for ROVs is also linked to the amount of physical seabed infrastructure. Existing oil and gas infrastructure is subject to more exacting inspection, repair, and maintenance routines in which ROVs perform many pivotal tasks. Therefore, this market will continue to grow even as the industry matures.
10
10
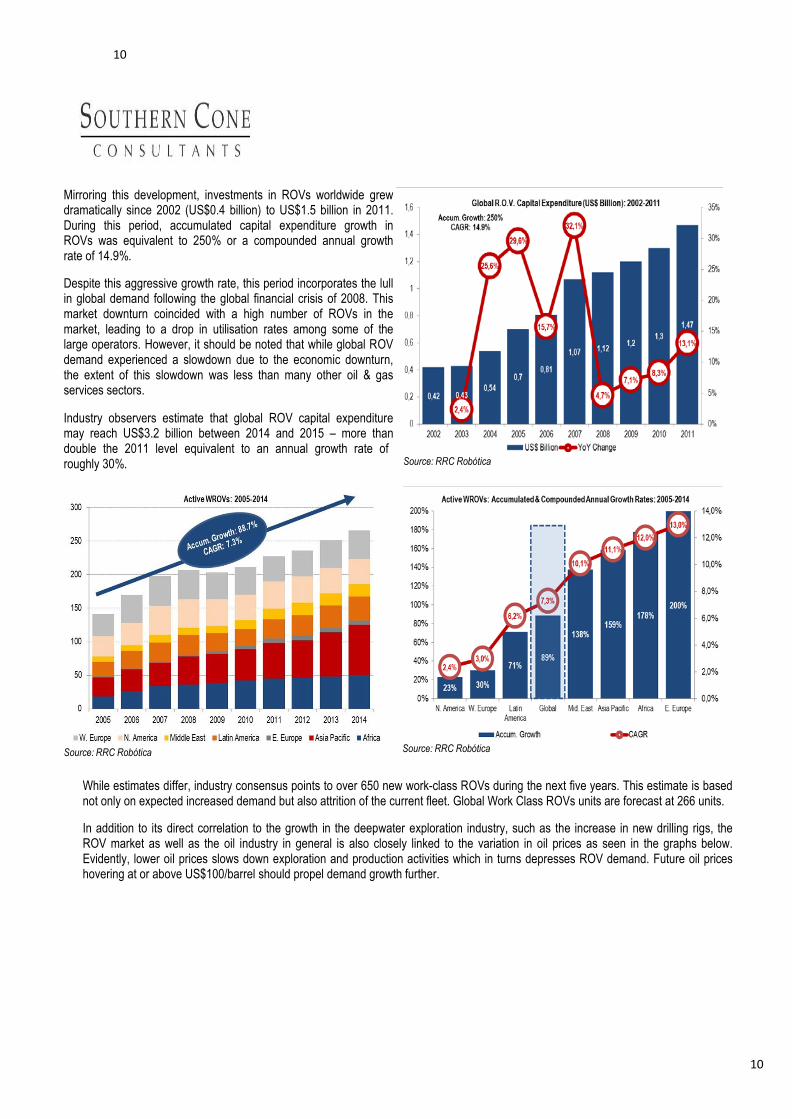
Mirroring this development, investments in ROVs worldwide grew dramatically since 2002 (US$0.4 billion) to US$1.5 billion in 2011. During this period, accumulated capital expenditure growth in ROVs was equivalent to 250% or a compounded annual growth rate of 14.9%.
Despite this aggressive growth rate, this period incorporates the lull in global demand following the global financial crisis of 2008. This market downturn coincided with a high number of ROVs in the market, leading to a drop in utilisation rates among some of the large operators. However, it should be noted that while global ROV demand experienced a slowdown due to the economic downturn, the extent of this slowdown was less than many other oil & gas services sectors.
Industry observers estimate that global ROV capital expenditure may reach US$3.2 billion between 2014 and 2015 – more than double the 2011 level equivalent to an annual growth rate of roughly 30%. Source: RRC Robótica
Source: RRC Robótica Source: RRC Robótica
While estimates differ, industry consensus points to over 650 new work-class ROVs during the next five years. This estimate is based not only on expected increased demand but also attrition of the current fleet. Global Work Class ROVs units are forecast at 266 units.
In addition to its direct correlation to the growth in the deepwater exploration industry, such as the increase in new drilling rigs, the ROV market as well as the oil industry in general is also closely linked to the variation in oil prices as seen in the graphs below. Evidently, lower oil prices slows down exploration and production activities which in turns depresses ROV demand. Future oil prices hovering at or above US$100/barrel should propel demand growth further.
11
11
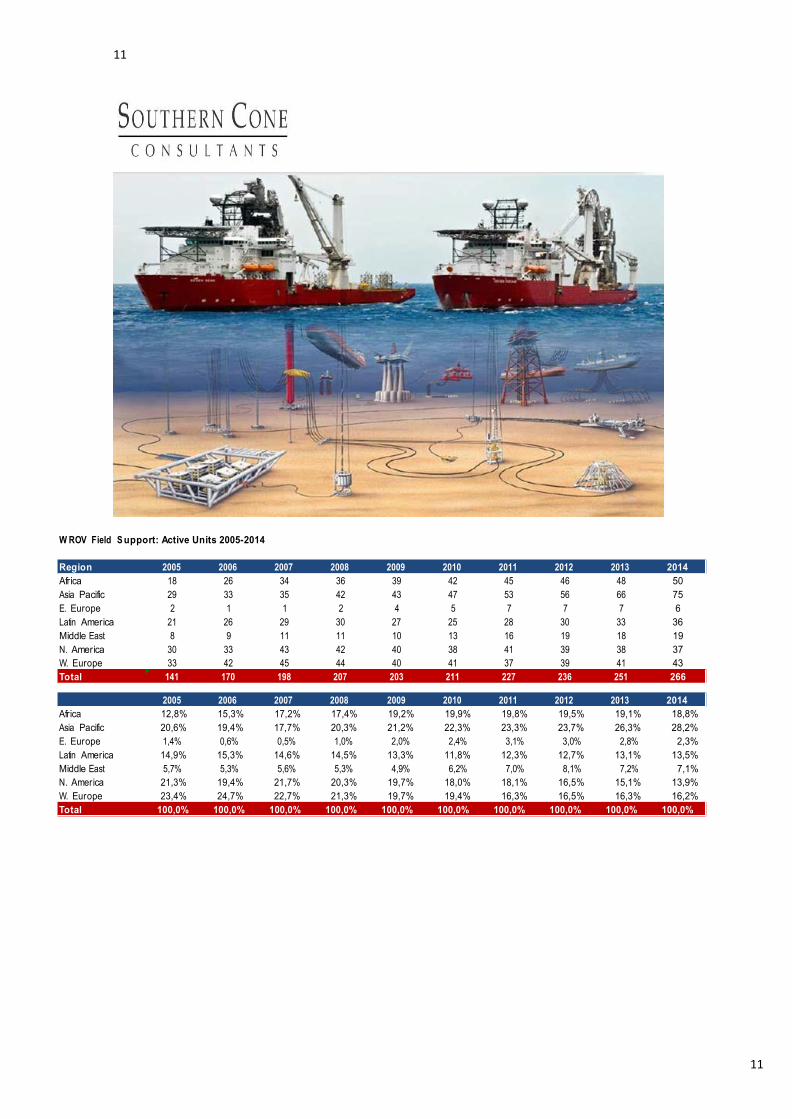
W ROV Field S upport: Active Units 2005-2014
Region 2005 2006 2007 2008 2009 2010 2011 2012 2013 2014
Africa 18 26 34 36 39 42 45 46 48 50
Asia Pacific 29 33 35 42 43 47 53 56 66 75
E. Europe 2 1 1 2 4 5 7 7 7 6
Latin America 21 26 29 30 27 25 28 30 33 36
Middle East 8 9 11 11 10 13 16 19 18 19
N. America 30 33 43 42 40 38 41 39 38 37
W. Europe 33 42 45 44 40 41 37 39 41 43
Total 141 170 198 207 203 211 227 236 251 266
2005 2006 2007 2008 2009 2010 2011 2012 2013 2014
Africa 12,8% 15,3% 17,2% 17,4% 19,2% 19,9% 19,8% 19,5% 19,1% 18,8%
Asia Pacific 20,6% 19,4% 17,7% 20,3% 21,2% 22,3% 23,3% 23,7% 26,3% 28,2%
E. Europe 1,4% 0,6% 0,5% 1,0% 2,0% 2,4% 3,1% 3,0% 2,8% 2,3%
Latin America 14,9% 15,3% 14,6% 14,5% 13,3% 11,8% 12,3% 12,7% 13,1% 13,5%
Middle East 5,7% 5,3% 5,6% 5,3% 4,9% 6,2% 7,0% 8,1% 7,2% 7,1%
N. America 21,3% 19,4% 21,7% 20,3% 19,7% 18,0% 18,1% 16,5% 15,1% 13,9%
W. Europe 23,4% 24,7% 22,7% 21,3% 19,7% 19,4% 16,3% 16,5% 16,3% 16,2%
Total 100,0% 100,0% 100,0% 100,0% 100,0% 100,0% 100,0% 100,0% 100,0% 100,0%

12
12
Source: RRC Robótica Source: RRC Robótica
Examples of Deepwater ROVs
Source: ROVWorld, Oceaneering, Fugro
As the future of the offshore oil & gas industry lies in the deepwater subsea developments and major discoveries such as those recently announced off Brazil, in the Gulf of Mexico and West Africa, these regions should represent the highest-growth opportunities for the ROV industry. High expectations concerning the future of deepwater oil exploration in the pre-salt fields has made Brazil a major center for ROV operations and companies. Large-scale offshore projects have drawn all the major global ROV players. Mostly operating out of Brazil’s oil capital – the city of Macae in the state of Rio de Janeiro, companies such as Subsea 7, Fugro, DOF Subsea, and Oceaneering have established new bases in the region in the last five years.
Between 2011 and 2016, ROV demand from Brazil may conservatively increase by 70% or 11.2% p.a. from a current 158 units to a range between 200-250 ROVs. By 2020, ROV demand
may rise by an additional 120 ROV, bringing the total to a potential Source: Petrobras, Brasil Energia 274 ROV units.

13
13
A good example of market demand is the mid-2011 milestone US
$1 billion Petrobras contract awarded to Subsea 7 for a Subsea Umbilical, Riser and Flowline (SURF) project for four decoupled riser systems to be installed in the Guará-Lula NE fields located in theSantos Basin, offshore Brazil (see graph aside).
This is the largest engineering, procurement, installation and commissioning (EPIC) SURF contract awarded to date in Brazil. The Guará-Lula NE project is based oninstalling four very large submerged buoys (each weighing around 2,000 tons) approximately 250 meters below the surface, along with twenty seven steel catenary risers (SCRs) of 3.9 kilometers.
Subsea 7 US$1 Billion SURF Contract

14
14
Considering that overwhelmingly, the greatest ROV demand in Brazil is from Petrobras (88% of total ROVs), Petrobra’s massive five- year investment program of US$250 billion (roughly 50% for E&P activities) is a highly encouraging sign for future ROV demand. Petrobras has indicated that it plans to place long term contracts on a total of 40 new deepwater drilling rigs for deployment exclusively in Brazil. Considering that each drilling rig carries on average 2 ROVs, this represents a potential demand for 80 new ROVs.
12 of the 40 new drilling rigs are currently under construction by Mitsui in the Far East. Contracts for 24 ROVs to service these 12 rigs are currently in the tender process. Approximately, 56 further ROVs will be required for the remaining 28 rigs Petrobras has indicated will still be required.
The Brazilian ROV market is fragmented with all major global players present and an increasing amount of local producers. Despite this fragmentation, the 75% of the total Brazilian ROV market is currently dominated by three major producers – Subsea 7 (35.9% market share including subsidiary i-Tech), Oceaneering (22.3% market share) and Fugro (16.3%). Other key participants are Technip and DOF Subsea. These five players account for approximately 95% of the Brazilian ROV market.
While most international ROV service providers do not furnish detailed regional revenue breakdowns, the ones we found place Brazilian revenue contribution between 5%-7% between 2009 and 2011 (Oceaneering) and up to 12%-13% (Subsea 7). These contribution levels should increase in the coming years, in our view.
There are a total of 86 ROVs deployed in support of deepwater drilling operations. the ROV market associated with drilling operations is controlled by I-Tech and Oceaneering. These two companies control 83% of the market. On the other hand, the vessel ROV market (68 units) is dominated by Subsea 7, Fugro and DOF Subsea which together share 73% of this market segment.
As seen in the graphs on the following page, Petrobras is, and should continue to be, overwhelmingly the greatest source of ROV demand commanding an outsized overall 88% demand market share. While all ROV companies maintain good relationships with Petrobras, price is the key driver to win contracts and as such, Petrobras is attempting to “commoditize” the ROV market by inviting new entrants in an effort to reduce prices. However, not only have newcomers struggled to build up their presence but have also encountered significant entry barriers in this highly competitive and expensive market.
The average cost of an observation ROV varies between US$ .3 and US$1 million and the cost of a work class ROV varies between
US$ 2 and US$5 million. The current day rate for the ROV package and operators, depending the service and equipment required, varies between US$5,500 for one vehicle and 12 hours service on a drill rig to US$ 35,000 for multiple ROVs and 24 hours on board an RSV vessel.

15
15
ROV Market Data

16
16
Brazilian Shipbuilding
Given the discovery of massive, deepwater pre-salt fields and the highly-aggressive investment program announced by Petrobras, all players and sectors in the oil and gas industry have been expanding operations and reviewing strategies to meet the explosive growth over the next 10 years. This is particularly true and challenging for the local shipbuilding industry – clearly slated to be one of the most demanded sectors in the coming years.
The Brazilian shipbuilding industry, fomented by the Kubitschek Administration in the 1950s, was based on an industrial shipbuilding policy strongly linked to the policies of the Merchant Marine Administration. This strategy involved the creation of internal demand for maritime transport services, which for its part, was dependent on the ability of local shipyards to deliver vessels to local shipping companies.
A market reserve was created that prioritized imported cargo transport, public-sector company cargoes or cargoes financed by public funds. In
early 1970s, the Merchant Marine Fund was established as was a special tax called “The Additional Freight Charge for the Renewal of the Merchant Marine” (AFRMM). Successive plans were launched thereafter to foment the local shipbuilding industry. These policies and incentives were successful, yet short-lived. By late 1970s, Brazil was the second-largest shipbuilding nation in the world.
However, unlike Japan and South Korea – the largest vessel exporters – Brazilian shipbuilders developed an over-dependency on local demand which in turn were financed by AFRMM funds. As a result, the Asian shipbuilders control approximately 75% of the global market while the Brazilian shipyards (particularly those located in the state of Rio de Janeiro which focused on oceanic maritime vessels) entered a down cycle together with their only clients – the local shipping industry.
Brazilian Shipyards

17
17
The Brazilian shipbuilding industry reached its peak by mid-1980s. Since then, a continual decline nearly brought about the near deactivation of the sector toward the end of the 1990s. This period was marked by grave hardship, shipyard shutdowns, low production levels and massive layoffs. As a result, only a handful of shipyards managed to remain active and continue vessel construction, with production at levels below their installed capacities.
During the years of sector deregulation (first half of the 1990s), the local vessel fleet owners revised their long-term strategies which lead to the cancellation of vessel orders from local shipyards, on the one hand, and the leasing of foreign vessels to maintain or expand activities during the transition to the new competitive environment.
In 1998, production levels were rekindled due to the demands of PETROBRAS to increase their offshore oil production. The first vessels produced in this new phase were support vessels for rigs and oil production platforms. Later, in 2001, PETROBRAS launched its Program for the Modernization of the Supply Vessels Fleet, named PROMEF, including the standards for international competition - a requirement for Brazilian flag ships, which stimulated local construction of these ships and was the first move for the reactivation of the sector.
The success of PROMEF has now initiated its second phase. It was then decided that the Brazilian companies would participate in the construction of a variety of marine platforms, supplying some of the modules for platforms built from oil tanker hulls converted into floating production units abroad (FPSOs). Assembly of these modules in the platforms and the finalization of the production units would start to be conducted in Brazil as well, as decided by the Federal Government in 2003. Later, the ordering of large, semi-submersible platforms, partially or completely built in Brazil, contributed to the reactivation of a number of shipyards and attracted foreign investments. The national content on these platforms has progressively increased, which is bringing about a very positive impact on the Brazilian manufacturing of goods and equipment. In 2006, TRANSPETRO (Petrobras subsidiary) selected, by way a public tender, the shipyards that would build the first 26 new oil tankers for the modernization and expansion of the fleet. This changed the scale of the Brazilian shipbuilding industry, ensuring the activity of the shipyards and generating thousands of new opportunities for skilled jobs.
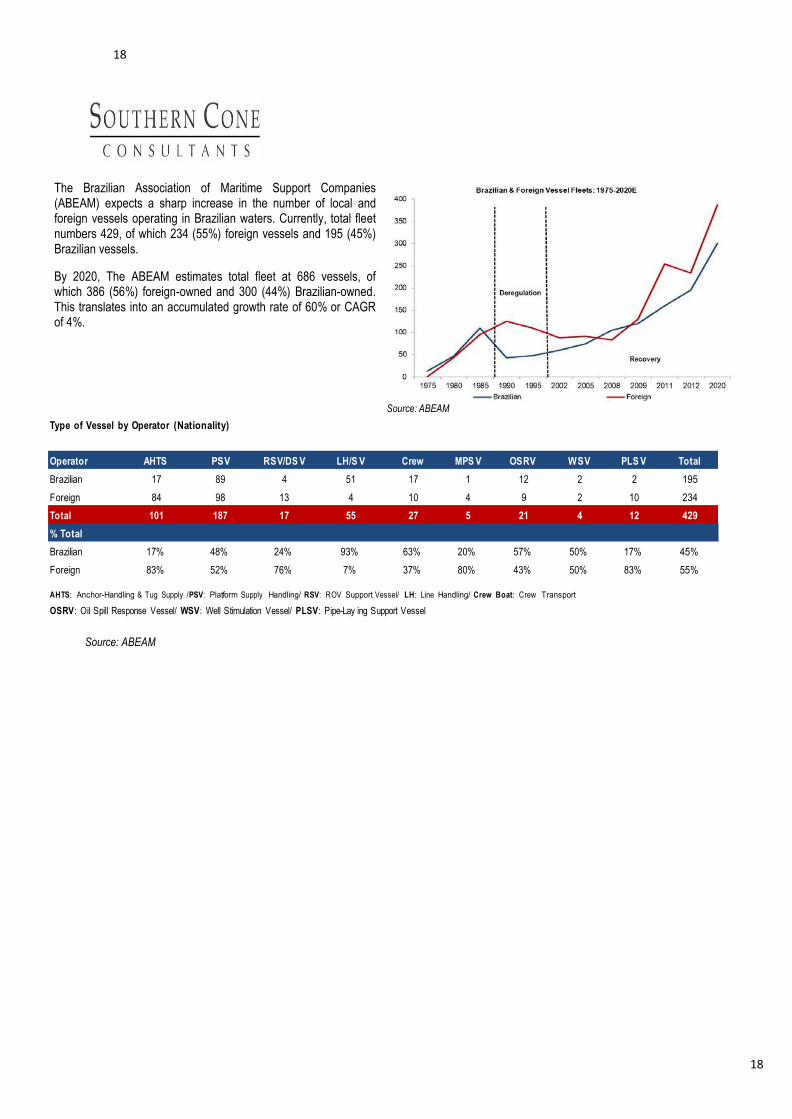
The graph aside illustrates vessel construction in Brazil since 1975. Since its inception in the 1950s, the shipbuilding industry peaked in 1985. Sector deregulation between 1990 and
1995 caused local deliveries to fall significantly, declining by an impressive 61% in 1990. The 1985 delivery level was only matched in 2008 with 105 deliveries.
The effects of deregulation are clearly seen in the graph below: the deregulation years witnessed a sharp drop in Brazilian-made vessels with foreign vessels taking up the slack. A gradual recovery path commenced in 1997 with the passing of the Shipyard Modernization Law # 9.432.
18
18
The Brazilian Association of Maritime Support Companies (ABEAM) expects a sharp increase in the number of local and foreign vessels operating in Brazilian waters. Currently, total fleet numbers 429, of which 234 (55%) foreign vessels and 195 (45%) Brazilian vessels.
By 2020, The ABEAM estimates total fleet at 686 vessels, of which 386 (56%) foreign-owned and 300 (44%) Brazilian-owned. This translates into an accumulated growth rate of 60% or CAGR of 4%.
Type of Vessel by Operator (Nationality)
Source: ABEAM
Operator AHTS PS V RS V/DS V LH/S V Crew MPS V OS RV W S V PLS V Total
Brazilian 17 89 4 51 17 1 12 2 2 195
Foreign 84 98 13 4 10 4 9 2 10 234
Total 101 187 17 55 27 5 21 4 12 429
% Total
Brazilian 17% 48% 24% 93% 63% 20% 57% 50% 17% 45%
Foreign 83% 52% 76% 7% 37% 80% 43% 50% 83% 55%
AHTS: Anchor-Handling & Tug Supply /PSV: Platform Supply Handling/ RSV: ROV Support Vessel/ LH: Line Handling/ Crew Boat: Crew Transport
OSRV: Oil Spill Response Vessel/ WSV: Well Stimulation Vessel/ PLSV: Pipe-Lay ing Support Vessel
Source: ABEAM

19
19
FPSO (OSX1) Drilling Rigs
AHTS PSV RSV
Mini-Supply Crew Boat UT
OSRV WSRV PSLV

20
20
Source: Petrobras
Additionally, to further stimulate production, Petrobras created the EBN (Empresa Brasileira de Navigação). Unlike Promef where Transpetro (Petrobras’ transport arm) contracts the shipyard directly, through EBN, Petrobras makes a contract with the ship owner who is responsible for choosing the shipyard in Brazil where the vessel will be built. In EBN1, 19 vessels were chartered for delivery between 2011 and 2014. In EBN2, 20 vessels are scheduled for delivery between 2013 and 2017. The program requires that the ship be registered under the Brazilian flag throughout the duration of the contract, which is for 15 years.
Petrobras Fleet Growth Programes with Brazilian Vessels
Petrobras’ 2012-2020 fleet demand is highly aggressive. By 2020, the company expects to add 88 tanker vessels, 198 large supply boats, 38 production units and 48 drilling rigs (of which 33 to be built by local shipyards). The Merchant Marine Fund is a clearly defined and well-regulated legal system for shipbuilding financing in place for over 50 years. Historically, the Fund’s annual loan disbursements for shipbuilding activities, covers up to 90% of shipbuilding investment needs. Between 2001 and 2011, annual disbursements rose almost six-fold, equivalent to an annual loan disbursement of 21%. Administered by the Ministry of Transport, the Merchant Marine Fund built and/or modernized eight shipyards. The Program for Modernization and Expansion of the Fleet (PROMEF) is rapidly evolving, reversing a decades-long crisis in the Brazilian shipbuilding industry. The last tanker delivered before Promef was in 1997. During the last eight months, three new tankers were delivered. In the second phase (PROMEF II), in progress, two units are currently in advanced construction in three shipyards. Source: SINAVAL
PROMEF 1 & 2 EBN 1 & 2
49 Vessels Until 2020 39 Vessels Until 2017
14 S uezmax 12 Products
8 Aframax 8 L&G
4 Panamax 3 Bunkers
26 Products
6 Bunkers
7 L&G
3 Delivered Vessels & 22 in Advanced Construction
24 Vessels in Hiring Phase or I nitial Construction Phase
2 Vessels in Advanced Construction
37 Vessels in Hiring Phase or I nitial Construction Phase
Source: Petrobras

21
21
Challenges for the Pre-Salt Brazilian Shipbuilding Industry: FPSOs & Drilling Rigs
Considering the ultra-deep waters nature of the pre-salt fields, specific exploration vehicles are critical for the success of the this venture. Specifically, for the Brazilian oil program, this entails the ability to deploy highly sophisticated and costly equipment such as FPSOs and drilling rigs. The ability to deliver these equipments in a cost-effective and timely fashion is crucial for this endeavor. In the following pages, we analyze the ability of local shipyards to fulfill these daunting requirements.
Roughly 72% (1.5 million boe/d) of all E&P
activities within the Brazilian oil and gas sector are located in deep or ultra-deep waters, leaving 28% of activities to shallow water and onshore E&P. As a result, the main exploration platform used in the Brazilian deep and ultra- deep oil fields is the FPSO. These vessels are particularly effective in remote or deepwater locations where seabed pipelines are not cost effective. FPSOs eliminate the need to lay expensive long-distance pipelines from the processing facility to an onshore terminal.
Source: OSX
Single unit FPSO costs approximately US$ 0.7-1.5 billion. Currently, the highest price paid for a FPSO in operation in Brazil was the Maersk-built structure for roughly US$1 billion for Statoil. Petrobras is the biggest FPSO operator worldwide, and currently has three new FPSO's under construction. The construction of huge vessels like the FPSO often occurs at different locations. The construction of the hull, building of topside or platform modules as well as the assembly can happen at different shipyards. Brazilian shipyards are operating at full capacity, and are by international operators often criticised for not being sufficiently efficient. According to industry sources, only 10% of the current 40 shipyards in Brazil are able to construct and deliver FPSOs.
There are approximately 21 FPSO's operating in Brazil, some under Brazilian flag, but most under international flag. The question of flag is particularly important as international vessels operating in Brazilian waters have to be re-contracted on a yearly basis. If a Brazilian flag carrying vessel with similar capabilities as an international vessel are available, the contractor are forced to contract the Brazilian flag carrying vessel, disregarding costs. Petrobras announced in September 2009, the strategy to hire 28 new drilling rigs to be built in Brazil, with increasing national content, and to be used for ultra deep water exploration, including the fields located in the pre-salt layer. The rigs are planned to be delivered between 2013 and 2018. The volume of orders will not only make feasible the expansion and upgrading of existing shipyards, as well as the creation of new, modern shipyards in Brazil. It is expected that the investment in new and existing yards will lead to the implementation of a new Brazilian naval industry that can compete with the best international shipyards in the offshore
industry segment.
22
22
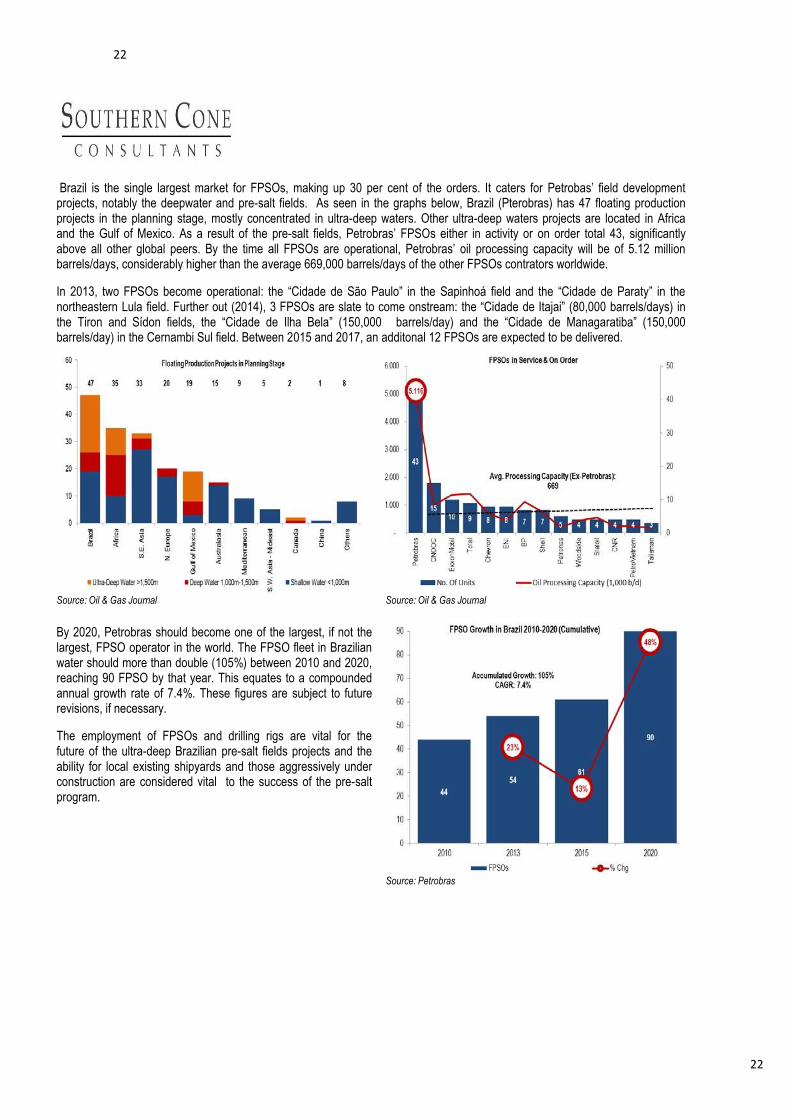
Brazil is the single largest market for FPSOs, making up 30 per cent of the orders. It caters for Petrobas’ field development projects, notably the deepwater and pre-salt fields. As seen in the graphs below, Brazil (Pterobras) has 47 floating production projects in the planning stage, mostly concentrated in ultra-deep waters. Other ultra-deep waters projects are located in Africa and the Gulf of Mexico. As a result of the pre-salt fields, Petrobras’ FPSOs either in activity or on order total 43, significantly above all other global peers. By the time all FPSOs are operational, Petrobras’ oil processing capacity will be of 5.12 million barrels/days, considerably higher than the average 669,000 barrels/days of the other FPSOs contrators worldwide.
In 2013, two FPSOs become operational: the “Cidade de São Paulo” in the Sapinhoá field and the “Cidade de Paraty” in the northeastern Lula field. Further out (2014), 3 FPSOs are slate to come onstream: the “Cidade de Itajai” (80,000 barrels/days) in the Tiron and Sídon fields, the “Cidade de Ilha Bela” (150,000 barrels/day) and the “Cidade de Managaratiba” (150,000 barrels/day) in the Cernambi Sul field. Between 2015 and 2017, an additonal 12 FPSOs are expected to be delivered.
Source: Oil & Gas Journal Source: Oil & Gas Journal
By 2020, Petrobras should become one of the largest, if not the largest, FPSO operator in the world. The FPSO fleet in Brazilian water should more than double (105%) between 2010 and 2020, reaching 90 FPSO by that year. This equates to a compounded annual growth rate of 7.4%. These figures are subject to future revisions, if necessary.
The employment of FPSOs and drilling rigs are vital for the future of the ultra-deep Brazilian pre-salt fields projects and the ability for local existing shipyards and those aggressively under construction are considered vital to the success of the pre-salt program.
Source: Petrobras

23
23
An equally daunting task for the Brazilian shipbuilding industry should be the initial construction of drilling rigs. As of 2016, Petrobras will operate with an estimated 33 Brazilian-built rigs. Of these 33, five will be built be Ocean Rig – still in negotiations with shipyards Mauá and Eisa. The remaining 28 should be provided by Sete Brasil – a consortium composed by four leading local pension funds and four top-rated financial institutions. Seven of the Sete Brasil drilling rigs will be constructed at the Atlantico Sul shipyard (EAS) beginning next year. The remaining 21 rigs are currently under negotiation with five shipyards. With an average 62% local content, Sete Brasil has earmarked US$27 billion for this undertaking. Leased to Petrobras for 15 years, the first rig is slated for delivery in 2015 and the last, 2020.
The Sete Brasil orders will foster the establishment of two new shipyards (Jurong Aracuz and EEP) and help consolidate and expand four other shipyards (OSX, BrasFels, ERJ2 and EAS).
Brazilian Drilling Rigs
However, there are concerns and doubts about the viability of Brazilian shipyards to construct and deliver these structures in a timely fashion. Most skeptics believe that these new yards should experience significant difficulties in delivering the vessels on schedule due to these yards not being sufficiently technologically mature given that this type of construction in Brazil is unprecedented.
Undoubtedly, the construction of Brazilian-made rigs will rely on cooperation from foreign, established players. For example, EAS has a contract underway witth Norway’s LMG Marin to oversee engineering details and monitor construction details of the rigs. In addition, EAS contracted IHI Marine United Inc. (IHIMU), the offshore shipbuilding division of Ishikawajima-Harima Heavy Industries, based in Japan and controlled by the Mitsui group. IHIMU will be the EAS’ consultant shipyardand will provide operational technical consulting services for all vessels produced in the yard.
Sete Brasil Drilling Scenario Red: Contracted
Blue: Under Negotiation
Source: Sete Brasil
24
24
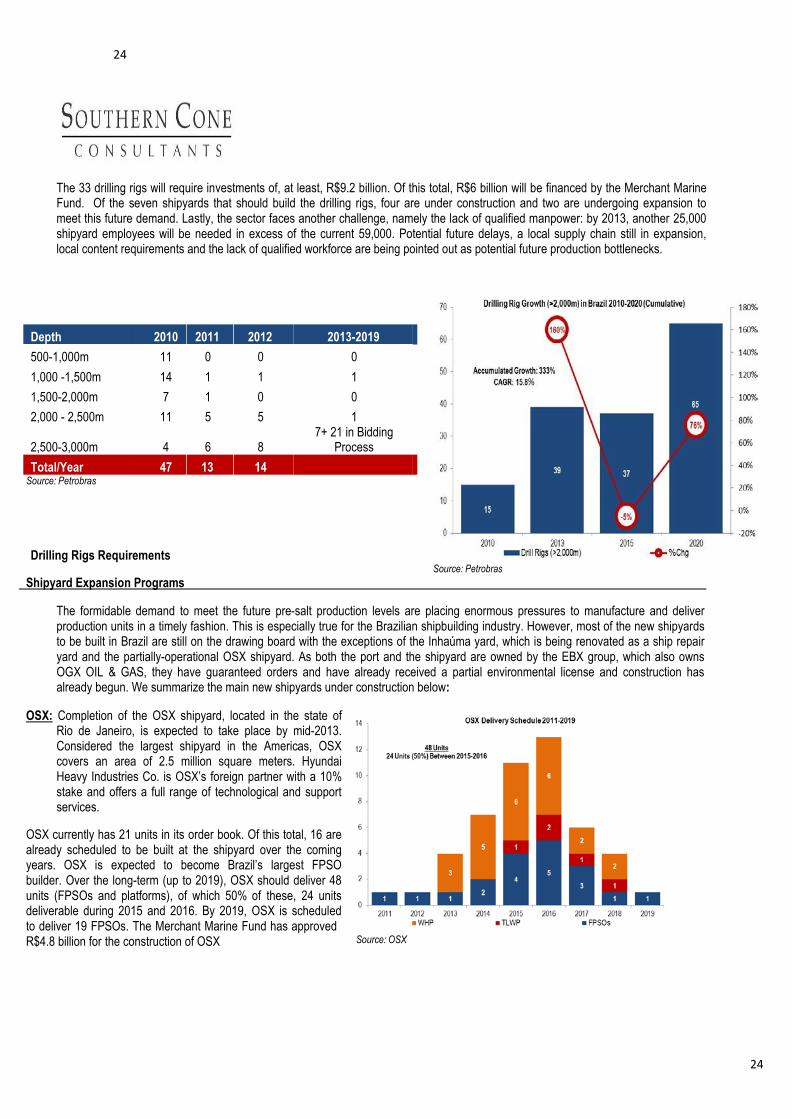
Depth 2010 2011 2012 2013-2019
500-1,000m 11 0 0 0
1,000 -1,500m 14 1 1 1
1,500-2,000m 7 1 0 0
2,000 - 2,500m
2,500-3,000m
11
4
5
6
5
8
1 7+ 21 in Bidding
Process
Total/Year 47 13 14 Source: Petrobras
The 33 drilling rigs will require investments of, at least, R$9.2 billion. Of this total, R$6 billion will be financed by the Merchant Marine Fund. Of the seven shipyards that should build the drilling rigs, four are under construction and two are undergoing expansion to meet this future demand. Lastly, the sector faces another challenge, namely the lack of qualified manpower: by 2013, another 25,000 shipyard employees will be needed in excess of the current 59,000. Potential future delays, a local supply chain still in expansion, local content requirements and the lack of qualified workforce are being pointed out as potential future production bottlenecks.
Drilling Rigs Requirements Source: Petrobras
Shipyard Expansion Programs
The formidable demand to meet the future pre-salt production levels are placing enormous pressures to manufacture and deliver production units in a timely fashion. This is especially true for the Brazilian shipbuilding industry. However, most of the new shipyards to be built in Brazil are still on the drawing board with the exceptions of the Inhaúma yard, which is being renovated as a ship repair yard and the partially-operational OSX shipyard. As both the port and the shipyard are owned by the EBX group, which also owns OGX OIL & GAS, they have guaranteed orders and have already received a partial environmental license and construction has already begun. We summarize the main new shipyards under construction below:
OSX: Completion of the OSX shipyard, located in the state of
Rio de Janeiro, is expected to take place by mid-2013. Considered the largest shipyard in the Americas, OSX covers an area of 2.5 million square meters. Hyundai Heavy Industries Co. is OSX’s foreign partner with a 10% stake and offers a full range of technological and support services.
OSX currently has 21 units in its order book. Of this total, 16 are already scheduled to be built at the shipyard over the coming years. OSX is expected to become Brazil’s largest FPSO builder. Over the long-term (up to 2019), OSX should deliver 48 units (FPSOs and platforms), of which 50% of these, 24 units deliverable during 2015 and 2016. By 2019, OSX is scheduled to deliver 19 FPSOs. The Merchant Marine Fund has approved R$4.8 billion for the construction of OSX Source: OSX

25
25
• Jurong Aracruz (EJA): Belonging to Jurong Shipyard, a member of the Sembcorpmarine (SCM) group of Singapore, EJA specializes in shipbuilding and having an integrated concept forconstructing and repairing ships, will focus on offshore constructions, such as support vessels, drilling rigs and production. The Jurong Aracruz yard already has its environmental license but is still clearing its industrial area of unwanted vegetation and has not officially begun to build its infrastructure. which will be operational from June 2013 and be completed in late 2014. Currently, the shipyard is in the earthmoving phase and in the process of contracting the construction of the breakwater, quay and dry dock. The cranes and warehouses are in the final engineering stage. Occupying an area of 825 thousand square meters, the venture will be installed in the state of Espirito Santo with an investment estimated at R$ 1 billion out of the company’s own equity. Even before beginning to operate, the yard already has an order for a drill ship and is negotiating a contract with Sete Brasil for another five drilling rigs.
• EEP: During the same year of 2013 the Enseada do Paraguaçu shipyard (EEP), situated in the state of Bahia, wil partially
begin its activities.The unit will be fully completed in 2014. Construction began last July after completion of earthmoving operations. The investment in the project is approximately R$ 2 billion. Of this total, approximately R$ 1.7 billion will come from the Merchant Marine Fund. When operating at full capacity, EEP should process up to 36 thousand tons of steel per year. Formed by Odebrecht, OAS and UTC, the yard will have Kawasaki Heavy Industries (KHI) as its technology partner, with a 30% shareholding.
Source: ABEAM
26
26
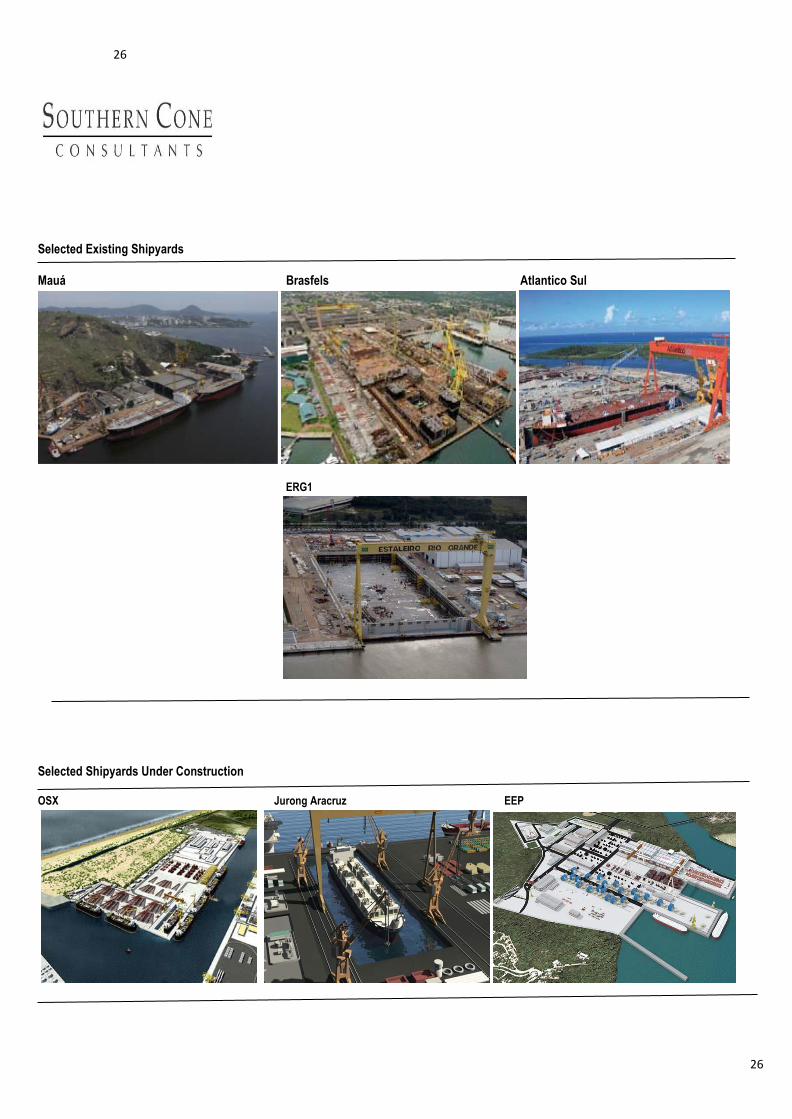
Selected Existing Shipyards
Mauá Brasfels Atlantico Sul
Selected Shipyards Under Construction
ERG1
OSX Jurong Aracruz EEP

27
27
Special Themes: Local
Content Requirements
REPETRO Tax Regime
Financing Availability
28
28
Local Content Requirements in Brazil
The Brazilian government has passed legislation requiring oil companies to purchase goods and services domestically in order to stimulate the country's struggling naval sector, but these requirement may yet backfire on the government’s ambitious plan to develop the massive pre-salt reserves. The federal government has been imposing local content requirements on oil companies since 1999, but the pre-salt offshore oil discoveries of 2007 increased pressure on the local oil services industry. Production in these reserves will depend on sophisticated technologies, but local oil services companies are hard-pressed to meet this potentially exponential demand.
The issue of local content is already a contentious one and should accelerate going forward. Staunch supporters, such as President Dilma Roussef and Petrobras President Graça Foster are steadfast in maintaining current local content legislation as this measure would generate significant employment, allow for technology transfer and modernize the Brazilian naval industry. The government's challenge is to ensure that inefficient local suppliers don't permanently handicap the country's oil industry. In the worst case scenario, this protective posture could create a privileged, inefficient industry at the expense of Petrobras and Brazil. While the government should stimulate local industry and extract improvements, some industry observers fear that it might protect it, shielding it from international competition.
Critics, however (some local), take a different view. A litany of concerns and doubts are being aired which may lead to a potential revision of local content legislation down the road. Bogged down by local content requirement could potentially lead to derailing Petrobras’ production and delivery schedule thus retarding the exploration of the pre-salt fields.
Among the criticisms:
• Brazilian oil services producers are less efficient and more costly than their international peers. A heaavy tax burden, high
borrowing costs, bureaucracy, scarce skilled manpower and above-average infrastructure costs result in higher charges without necessarily ensuring higher quality. On average, Brazilian producer charge approximately 55% more than their international peers;
• Brazilian producers lag behind international peers. While foreign players already have developed technological expertise, local
producers are only beginning this process. Given the technological challenges of exploring the ultra-deep pre-salt fields, we expect that the learning curve should be slow and very gradual and fraught with potential setbacks;
• Brazil has a very severe scarcity of skilled manpower to fulfill Petrobras’ future demand. From engineers to welders, the
shipyards, both operational and under construction, may experience future setbacks and delay;
• The Brazilian naval history does not have a long-term track record of oil-related shipbuilding. In particular, no Brazilian shipyard has ever built a FPSO. The 63% local content requirement for FPSO should only exacerbate the potential problem. While some critics believe that existing and new shipyards should have the necessary infrastructure to deliver production units in a timely fashion, the scarcity of manpower and the rapid development of the supply chain could hinder future production;
• A recent study undertaken by the Federal University of Rio de Janeiro (UFRJ) revealed that local industry is able to fully supply
only five of the 24 categories considered essential for exploration and production. The remaining 19 categories present obstacles such as higher prices than international peers, delivery issues or quality compliance requirements.
Already, the local content requirement has produced a significant setback for Petrobras. EAS (Estaleiro Atlântico Sul), located in the state of Pernambuco, was awarded with a contract to produce no less than 22 tankers. The first ship, the João Cândido, should have been delivered in September 2010;however, it only took to water last May, after a delay of almost two years.
Clearly, the issue of local content should increasingly become a source of urgent discussion for the industry. How this plays out could have significant repercussions for Petrobras aggressive timetable for production and delivery of pre-salt equipment.

29
29
Equipment
Price Differential
Reference
Pumps
100% to 200% Higher
China
Basic Engineering 100%to 150% Higher Netherlands
Heat Exchangers 40% to 70% Higher Europe
Production Tubes 40% to 90% Higher Japan
Ship Boilers 40% to 60% Higher China
Ship Steel Sheets 25% to 40% Higher Asia
Petrobras has to purchase 65 percent of its equipment from domestic suppliers to meet local content rules set out by former President Luiz Inacio Lula da Silva. And drilling vessels built in Brazil should be made of mostly local content. Brazilian manufacturers, however, are struggling to deliver equipment as quickly and cheaply as more- established, overseas suppliers. All of Brazil's shipyards are fully booked, with backlogs. Reports are that Petrobras wants to lower the share of locally-produced content it uses in its supplies and services because many Brazilian companies can't meet demand fast enough.
Local content laws affect the offshore industry in several ways, with higher costs, longer delivery schedules and below-standard quality. While the bidding process of Round 8 is still undefined, the local content requirement has risen round after round from a low of 25% for exploration in Round 1 to and expected 79% by Round 10.
Source: ABEAM, SINAVAL
Source: ANP * Round 8 requirements still undefined The Brazilian shipyards’ (both existing and under construction) scramble to hire personnel cannot be overstated. It is expected that by 2015 (see graph aside), manpower needed at the shipyards is expected to grow
11-fold in relation to 2000, equivalent to a very aggressive componded annual growth rate of 36.7%.
The issue of manpower scarcity is closely linked to local content requirements, since the inability to fill these employment requirements coupled with the expected learning curve by the local supply chain should result in the main cause for delivery delays and possible setbacks for Petrobras’ timetable. In addition to these potential production bottlenecks, local products are expected to be costlier than their international peers. As seen in the graph below, local prices are between 25% (ship steel sheets) to as much as 200% higher than similar products in Asia and Europe.
In addition to cost overrruns and other factors, locally-made parts, equipment and machinery for the naval industry can be traced to the Brazilian tax regime. The corporate tax burden in Brazil is significantly higher than its international peers, such as the U.K., Norway, South Korea and China. While the tax burden in these nations vary between 4% and 8.7%, the corporate tax burden in Brazil is as high as 37.1%. This tax structure obviously makes Brazil less competitive than its international peers.
Price Differential Between Brazilian & Foreign Suppliers
Source: Exame, The Economist, Various
Source: Various

30
30
REPETRO Tax Regime
REPETRO, the special tax regime for importing and exporting goods for the exploration and drilling of oil and gas (created in 1999), aims at bringing foreign assets to Brazil enjoying a suspension or even an exemption of taxes. The creation of normative devices, as well as the management of the REPETRO model, are under the exclusive responsibility of the Brazilian Internal Revenue Services. The REPETRO model is important for the development of the area of E&P of oil and gas, but not completely effective. It is necessary to change it or create a new model based on a new perspective of the customs treatment of the activities of exploration and production, minimizing administrative procedures relating to export and import operations. Exemptions include import taxes (II), taxes on industrialized goods (IPI), PIS, Cofins and the Merchant Marine tax contribution..
Currently, the REPETRO model essentially benefits the first chain of production in the E&P segment. The main beneficiary is Petrobras which operates more than 90% of exploration and production concessions in the country. As a result, the bulk of these exemptions benefitted the construction of oil rigs and platforms abroad. Due to the lack of a local track record and given the overvalued local currency, imports became increasingly attractive. For example, of the 22 exploration platforms ordered in the past four years, only three are being built in Brazil.
Total REPETRO tax exemptions are not readily available and estimates differ very significantly. Since its inception, conservative sources place accumulated exemptions at approximately R$50 billion while other sources believe these accumulated exemptions could be as high as R$150 billion.
Whatever the actual figure, the REPETRO tax exemption regime is clearly the largest in Brazil. Estimated at roughly 21% of total Brazilian tax exemptions between 2005 and 2010, the REPETRO program surpasses the tax exemptions of the Zona Franca de Manaus (The Manaus Export Tax Exemption Program).
Source: Ministry of Finance, ABDI, Various
Despite controversies arising from various corners in the local production chain, the Federal Government announced earlier this year that it will be revising the REPETRO tax regime. The general idea is to prolong the existing regime and include all sectors involved in the production chain. In large part, the continuance and upward revision of REPETRO is aimed at aiding Petrobras to promptly fulfill its aggressive 5-year investment plan. Initially scheduled to last until 2005, REPETRO has been extended until 2020. Although official sources are not available, a study by research institute IPEA estimates that a more-inclusive REPETRO revision could benefit up to 3,400 industrial and services companies.
However, local suppliers, point to irregularities and loopholes in the REPETRO regime. They claim that at its inception (1999), the local oil industry was in its infancy and few goods and equipments were produced locally – a bottleneck since solved. Furthermore, they call attention to the significant changes in the global oil industry since then. At the end of the 90s, the barrel of oil hovered around US$20. As a result, at the time REPETRO was established, the perspective of exploring and producing oil in Brazil was not so clear or lucrative, thus increasing exploration risk. Now bordering US$100/barrel, local suppliers believe that producers are able to lock in significantly margins, thus minimizing the need for tax exemptions.
Lastly, local suppliers call attention to blatant transgressions provided by existing REPETRO loopholes. Currently, the Brazilian IRS is not able to adequately monitor the REPETRO program. Companies import screws, tubes and other materials readily available in the local market. These products do not appear in foreign trade accounting data. Gross irregularities have also been committed through the import of items totally unrelated to E&P activities, such as hygiene products and intimate apparel. According to official sources, greater monitoring of products benefitting from REPETRO and a suspension of those imported products readily found in the local market should be implemented.

31
31
.
Financing Availabilty
Financing alternatives for the shipbuilding industry in Brazil:
1 -The Fundo da Marinha Mercante (Merchant Marine Fund) thru the BNDES provide the financing in local currency for the
Brazilian shipbuilding industry. This financing is basically subsidized by the Brazilian federal government at extremely favorable
terms and conditions. The interest rates, fees and tenors vary on the types of financing sought and cover all aspects of the
shipbuilding industry. For more precise and up to date information we recommend to consult with the BNDES and/or local agent
bank. Also, consult the BNDES site www.bndes.gov.br .
2- We also found a rarely known alternative offered by the United States federal government: US Department of
Transportation/Maritime Administration (MARAD). “The Federal Ship Financing Program provides for a full faith and credit guarantee
by the United States Government to promote the growth and modernization of the U.S. merchant marine and U.S. shipyards.
The program, established pursuant to 46 USC Chapter 537, provides for a full faith and credit guarantee by the U.S. Government of
debt obligations issued by (1) U.S. or foreign ship owners for the purpose of financing or refinancing either U.S. flag vessels or
eligible export vessels constructed, reconstructed or reconditioned in U.S. shipyards and (2) U.S. shipyards for the purpose of
financing advanced shipbuilding technology and modern shipbuilding technology of a privately owned general shipyard facility
located in the U.S. The Program is administered by the Secretary of Transportation acting by and through the Maritime
Administrator. Under the Federal Credit Reform Act of 1990, appropriations to cover the estimated costs of a project must be
obtained prior to the issuance of any approvals for Title XI financing.”
This program has following terms and conditions: Financing will cover up to 87.5% of total package; Maturities up to 25 years;
attractive low fixed or floating rates. There are some application and investigation fees be paid up front to initiate due diligence
process. Guarantee fee: 0.5% to 1.0% of average amount of outstanding obligations; fee determined based upon borrower’s
financial condition; present value of cumulative annual fees due to initial closing and fee can be financed. Recommend visit the site
www.marad.dot.gov for updated information.
During our investigation we found that a Brazilian shipbuilder was approved by MARAD in 2011 to finance the construction of 5
vessels with US shipyard. The amount financed is over U$ 240 million at very low rates and long tenor. These vessels are under
contract with Petrobras and will enter Brazil under the REPETRO program.
The Export - Import Bank of the United Sates (Exim Bank) also provides long term financing under their guarantee program for the
construction of vessels by a US based shipyard. The Exim Bank will cover up to 85% of the construction costs with US content.
Under their long term program the bank can offer tenors above 10 years with attractive low fixed or floating rates. Application fee or
good faith deposit of U$5,000 to start a due diligence process is charged. Exim Bank exposure fee, this fee is subject to negotiation
depending on structure and guarantees offered by borrower. Exim Bank commitment fee of 0.125% is charged on the undisbursed
amount of the credit facility. Guarantees are usually the lien of the equipment financed plus the aval of the borrower. It is
recommended that borrower use an Exim Bank agent bank to facilitate the solicitation of an Exim line of credit. Visit the Exim site
www.exim.gov for updated information.
Financing alternatives for the ROV Service Industry:
The main manufacturers/suppliers of ROVs and equipment to Brazil are based abroad since Brazil does not have local
manufacturers. Suppliers are mostly based in the United States, United Kingdom, Canada, Norway and Singapore. However, as of
this writing, we understand that a major US based ROV supplier will study manufacturing in Brazil to adhere to the “national content”
rule with the advent of the first, 100% Brazilian, ROV operator having won a 24 vehicle Petrobras contract.
We have found that the best alternative for financing the purchase of ROVs and related equipment is the thru the suppliers’ country
of origin Export Credit Agencies (ECA’s): The Export – Import bank of the United States (Ex-Im Bank); Export Credits Guarantee
Department of the UK (ECGD); Export Development Canada (EDC); The Norwegian Guarantee Institute for Export Credits (GIEK)
etc. Again we recommend that you consult the agencies’ sites for updated information or consult with an agent bank from the
country of origin of the supplier.
------------------x-------------------x------------------x---------------------x-----------------------x--------------------------------x-----------------------------x------

31
31
For additional information on Brazil’s oil and gas sector, please contact the U.S. Commercial Service, Rio de Janeiro,
Brazil: [email protected] and visit our energy webpage for additional reports, power point presentations, and
other useful materials: http://export.gov/brazil/industryhighlights/energy/eg_br_051813.asp