note 58p. - eric · note. available feom. edrs price descriptors. abstract. document resume. he 008...
TRANSCRIPT
ED 135 300
AUTHORTITLE
INSTITUTIONPUB DATENOTEAVAILABLE FEOM
EDRS PRICEDESCRIPTORS
ABSTRACT
DOCUMENT RESUME
HE 008 666
Kirschner, Alan H.Annual Statistical Report of the MemberInstituticns.United Negro College Fund, Inc., New York, N.Y.Jan 7758p.United Negro College Fund, Inc., 500 E. 62nd Street,New York, N.Y. 10021
MF-$0.83 HC-$3.50 Plus Postage.Academic Rank (Professional) ; Alumni; Annual Reports;Caucasian Students; *College Faculty; CollegeFreshmen; *College Students; *Degrees (Titles) ;*Educational Finance; Expenditures; Females;Financial Support; Fringe Benefits; GeographicDistribution; Graduate Students; Income; Males;National Surveys; *Negro Colleges; *Negro Education;Negro Students; Private Colleges; Private FinancialSupport; School Surveys; Student Costs; *StudentEnzollment; Student Financial Aid; Student TeacherRatio; Tables (Data) ; Teacher Salaries
The annual statistical report is a corppilation of themcst recent statistical information on the Fund's 41 members. All ofthe member institutions are private, accredited, predominantly blackcolleges and universities; they comprise all of the institutions inthat class in the United States except Hampton Institute and MeharryMedical College. Data were obtained from questionnaires sent annuallyto the members. Some data are expressed as indexes, with the baseyear 1960-70. The information, largely arranged in tabular form,include enrollment (graduate students, white students, male andfemale students, first-time freshmen, geographical distribution, andcomparison with national private enrollments), degrees granted;faculty (totals, by degree, student-faculty ratio, and compensation);and institutional and student finance. (Author/MSE).
**********************v************************************************Documents acquired by ERIC include many informal unpublished
* materials not available from other sources. ERIC makes every effort ** to obtain the best copy available. Nevertheless, items of marginal *
* reproducibility are often encountered and this affects the quality *
* of the micrcfiche and hardcopy reproductions ERIC makes available *
* via the ERIC Document Reproduction Service (EPRS). EDRS is not* responsible for the quality of the original document. Reproductions ** supplied by EDRS are the best that can be made frcm the original.***********************************************************************

;44
tt4.
;14^
S PAW TkIf A.IT 1,1 Al Tv,f nt:(AT,ON F autYar.ONCILDor A
UNITED NEGRO COLLEGE FUND
UNCF
STATISTICAL REPORT
OF THE
MEMBER INSTITUTIONS
1976
Alan H. KirschnerDirector of Research
United Negro College Fund, Inc.
January, 1977
500 East 62nd StreetNew York, New York 10021
3

TABLE OF CONTENTS
Page
INTRODUCTION 1
ENROLLMENT 4
Fall 1976 Enrollment 4
UNCF and Private UndergraduateEnrollments Nationally 4
Craduate Student Enrollment 7
White Students 8
Male-Female 8
First-Time Freshmen 9
Geographical Distribution 9
DECREES GRANTED 18
Undergraduate and Graduate Degrees 18
Degrees Granted by Major 20
Career Patterns 23
FACULTY 25
Total Faculy 25
Faculty by Degree 25
Student-Faculty Ratio 27
Faculty Compensation 28
INSTITUTIONAL AND STUDENT FINANCES 30
Operating Revenues and Expenditures 30
Endowment 33
Parental Income 35
Average Charge to Students 35
Student Financial Aid 36
UNCF Campus Campaigns 40
Alumni Giving 40
APPENDIX A: UNCF Member Iostitution Participation inthe Dual DegIcc Engineering Program 42
APPENDIX B: List of UNCF Member Institutions 46
4

INTRODUCTION
The United Negro Colle.ge Fund's Annual Statistical Report is
a compilation of the most recent statistical information on its
forty-one member institutions. All of the member institutions are
private, accredited, predominantly black colleges and universities.
Thirty-nine f the member institutions offer bak., ,Lanreate degree
programs while two (Atlanta University and the Interdenominational
Theological Center) offer graduate degree studies exclusively.
Several o the member institutions, including Fisk, Tusker,ee and
Xavier. offer graduate programs in addition to their undergraduate
curricula.
The member colleges and universities of the United Negro College
Fund comprise all of the private, fully-accredited, predominantly black
colleges and universities in the nation except Hampton Institute and
Meharry Medical College.
The forty-one UNCF member institutions have special significance
because of their traditional and continuing role in educating minority
group students for productive and creative participation in American
life. During the past century, the private black colleges have provided
education otherwise unavailable to thousands of able and deserving
youths. The alumni of these institutions comprise most of the black
leadership in America today.
Method:
The statistical information included was obtained from the UNCF
-1-
5

questionnaires which are sent annually to each of the member institu-
tions.
The data in thi.. report are frequently expressed as index
numbers usually with the year 1969-70 as the base. An index number
expresses the percentage relationship between data for a given year
and the corresponding data for the base year. The index numbers
are determined from the "mean" or average data per institution. For
example, if the average enrollment per institution was 1,000 in
1969-70 and 1,500 in 1975-76, then the index number would increase from
100 in 1969-70 to 150 in 1975-76, an increase of 50%.
There were a total of 36 UNCF institutions (34 undergraduate,
two graduate) in 1969-70 and 41 UNCF institutions (39 undergraduate,
two graduate) in 1974-75 and 1975-76. The'averages and index numbers
in the report reflect the differences in the number of member institu-
tions in different years.
Enrollment data used in the report is based on the fall of each
academic year to facilitate comparisons with other institutions.
Fall enrollment data excludes summer school students and stu-
dents who did not enroll until the spring semester. Total enrollment
at UNCF institutions, including summer school and additional spring
semester students, is approximately 50,000 students.
Acknowledgements
Acknowledgement is gratefulAy given to Mr. Christopher F. Edley,
-2--

Executive Director of the Untied Negro College Fund, for his thought-
ful interest and advice; to Mrs. Yvonne Parris for proofreading and
typing the report; and to the numerous personnel at the member
institutions who responded to the UNCF Questionnaire.
Alan H. KirschnerDirector of ResearchUnited Negro College Fund, Inc.
7
-3-

ENROLLMENT
The abilil to attract students is one of the most significant
marks of a healthy college or univarsity. Diversity in terms of geo-
graphic and racial mix ure also significant factors. Conversely,
declining enrollment is probably the most important indication of
impending or actual distress. In this section we review trends in
enrollment at the United Negro College Fund institutions from 1969
to 1976.
Fall 1976 Enrollment
Total enrollment at UNCF colleges and universities rose 7.5%
between 1975 and 1976 - from 42,040 to 45,214.1
The growth was
pervasive, as more than three-quarters of the momber institutions
experienced enrollment increases (Table I).
UNCF enrollment exceeded the national percentage increase for
private colleges and universities. Preliminary data released by the
National Center for Education Statistics inclicate that private
college and university enrollments nationally increased 1.9% between
fall 1975 and fall 1976, compared to the 7.5% increase reported by
',Ale private Llack colleges and universities comprising the UniteU
Negro Cnliege Fund.
UNCF and Privcte Undergraduate Enrollment Nationally
As shown in Table II, fall undergraduate enrollments at United
Negro College Fund institutions rose 5% between 1969-70 and 1975-76.
1
Total enrollment including summer school and additional snringsemester students is approximately 50,000.
-4--

Compared to the slight (1%) decrease in undergraduate inrollments at
private colleges and universities nationally, the Increase in UNCF
enrollments belies the often stated assumption that the utility of
black colleges would diminish as black enrollment developed a more
national pattern.
9
-5--

TABLE I
Fall Enrollment - UNCF institutions1975 & 176
(Index Number: 1975...100)
UNCF1975 1926INSTITUTIONS
ATLANTA UNIVERSITY 1,090 1,163
BARBER-SCOTIA COLLEGE 458 526
BENEDICT COLIEGE 1,624 1,982
BENNETT COLLECP 539 618
BETHUNE-COOKMAN COLLEGE 1,499 1,515
BISHOP COLLEGE 1,344 1,285
CLAFLIN COLLEGE 923 995
CLARK COLLEGE 1,633 1,749
DILLARD UNIVERSITY 1,192 1,152
FISK UNIVERSITY 1,380 1,277
FLORIDA MEMORIAL COLLEGE 507 402
HUSTON-TILLOTSON COLLEGE 676 677
INTERDENOM. THEO. CENTER 201 227
JARVIS CHRISTIAN COLLEGE 398 526
JOHNSON C. SMITH UNIVERSITY 1,318 1,599
KNOXVILLE COLLEGE 1,045 825
LANE COLLEGE 505 701
LEMOYNE-OWEN COLLEGE 1,073 1,067
LIVINGSTONE COLLEGE 839 909
MILES COLLEGE 1,327 1,314
MOREHOUSE COLLEGE 1,353 1,405
MORRIS BROWN COLLEGE 1,435 1,539
OAKWOOD COLLEGE 1,022 1,137
PAINE COLLEGE 755 776
PAUL QUINN COLLEGE 484 537
PHILANDER SMITH COLLEGE 543 744
RUST COLLEGE 699 842
SAINT AUGUSTINE'S COLLEGE 1,529 1,641
SAINT PAUL'S COLLEGE 564 626
SHAW UNIVERSITY 1,432 1,416
SPEEMAN COLLEGE 1,238 1,284
STILLMAN COLLEGE 778 858
TALLADEGA COLLEGE 546 620
TEXAS COLLEGE 531 715
TOUGALOO COLLEGE 792 916
TUSKEGEE I',STITUTE 3,361 3,590
VIRGINIA JNION UNIVERSITY 1,233 1,424
VOORHEE' COLLEGE 1,007 1,050
WILBERIJRCE UNIVERSITY 1,113 1,107
WILEY COLLEGE 625 589
XAVT R UNIVERSITY 1,429 1,889
TOTAL 42,040 5,214
INDEX 100 107.5
-6-
1 0

TABLE. I
Underp:aduate Fall Enrollm-nt: UNCF in6titutions and Private Collew.s andUniversities Nationally
(index Numbers: 19((.'-70 100)
Type of Enrollment
UNCEUndergraduates
1Private CollegeUndergraduates
T = TotalM
=
Mean orIndex
33J1( 72
969-70
984 IOU
100
Average Per institution
1Privat_e Higher Education, Association
3(.) 2
1974-75
1 (106 102
99
1402619
American Colteges, 1976,
1 042
p.8.
Graduate Student Enrollment
Enrollment of i;raduate students has increased 11% on UNCF campuses
between 1969-70 and 1975-76. Atlanta University and Interdenominational
Theological Center, UNCF's two gl-aduate universities, experienced the
largest increases (Tabl( III).
TABLE lIT
Graduate Student EnrollmentUNCF Institutions
(1,m1ex Numbers: 1969-70 = 100)
[INCE Institutions 1969-70
1
105
99
Atlanta UniversityFisk UniversityI.T.C.
Stillman CollegeTuskegee instituteVirginia Union UniversityXavier Linversity
INDEX
1,025
27
142
0
231
28
90
1 543
1975-76
1,119
86
235
32
131
18
100 111
-7-

Wit t I ildt.tit
Thl. I'll I -"t IMO ()I itnriir 10: Wh t 11NC1 otnpwic:; in-
croal..ed tenfold ketwoon 1969-10 ond 19P) -76. Only 17 white stwlents
were enrolled at UNCF institutions in tlw rall of 1969, compared with
199 in the 1:111 id 1975 (Table 1V). Special pror,rams
'lit white students anc.ounteil for !much of the I uu& nit t I it .'It ft 1.
enrollment.
TABLE IV
White Students or ''NCF Campuses
(Index Num' -,, 1(10)
1969-70
Mtstn
Taite Students
Male Female
1.975-i6
Index Tot al Mean
±1L 399j10Index
1000
:lre women ,.ttend UNCF institutions than men, but the difference
is narrowin. In 1969-70, 42::" of the student pumilation was male and
5r female. In 1975-76, 46';. of UNCF students were male, 54 female
(See Tible V'.
Fall, 1969
Fall 1975
TABLE V
UNCF Students By SexFall, 1969 & Fall, 1975
I
Male Female
,
Male Female
14 863 20,152 42.4 57.6
19,435 22,476 46.4 53.6
1 2-8-
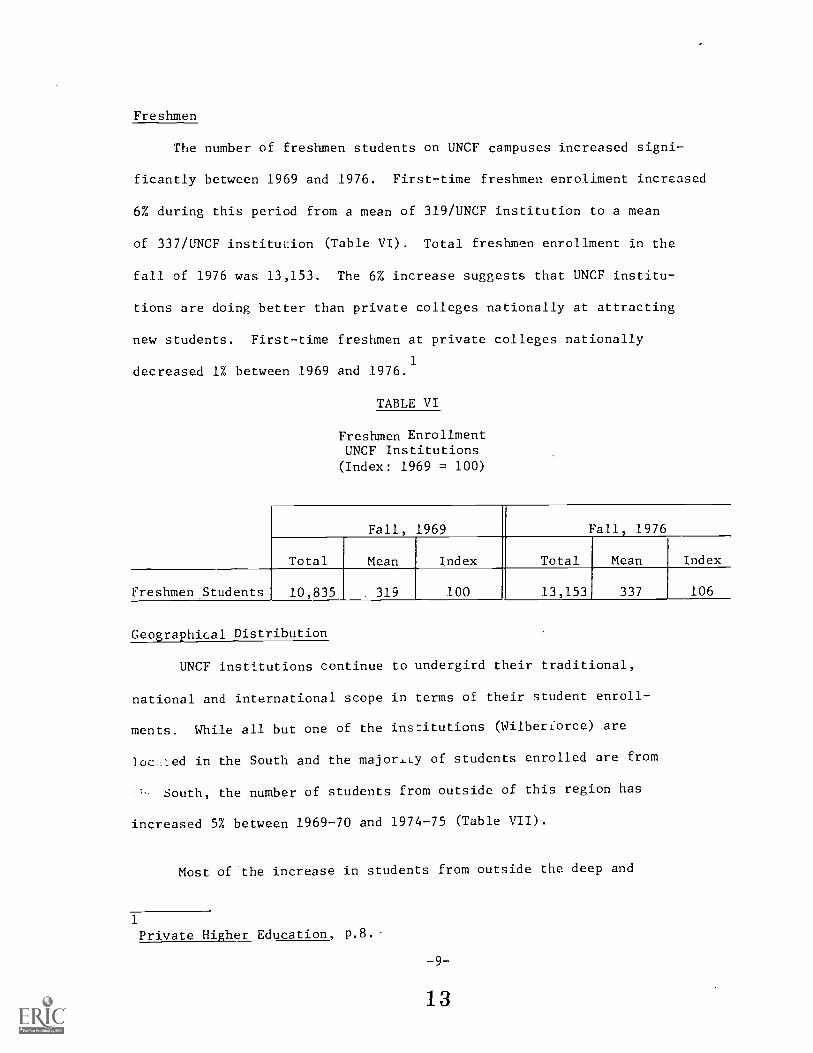
Freshmen
The number of freshmen students on UNCF campuses increased signi-
ficantly between 1969 and 1976. First-time freshmen enrollment increased
6% during this period from a mean of 319/UNCF institution to a mean
of 337/UNCF instituLion (Table VI). Total freshmen enrollment in the
fall of 1976 was 13,153. The 6% increase suggests that UNCF institu-
tions are doing better than private colleges nationally at attracting
new students. First-time freshmen at private colleges nationally
1decreased 1% between 1969 and 1976.
TABLE VI
Freshmen EnrollmentUNCF Institutions(Index: 1969 = 100)
Fall, 1969 Fall, 1976
Total Mean Index Total Mean Index
Freshmen Students 10,835 319 100 13,153 337 106
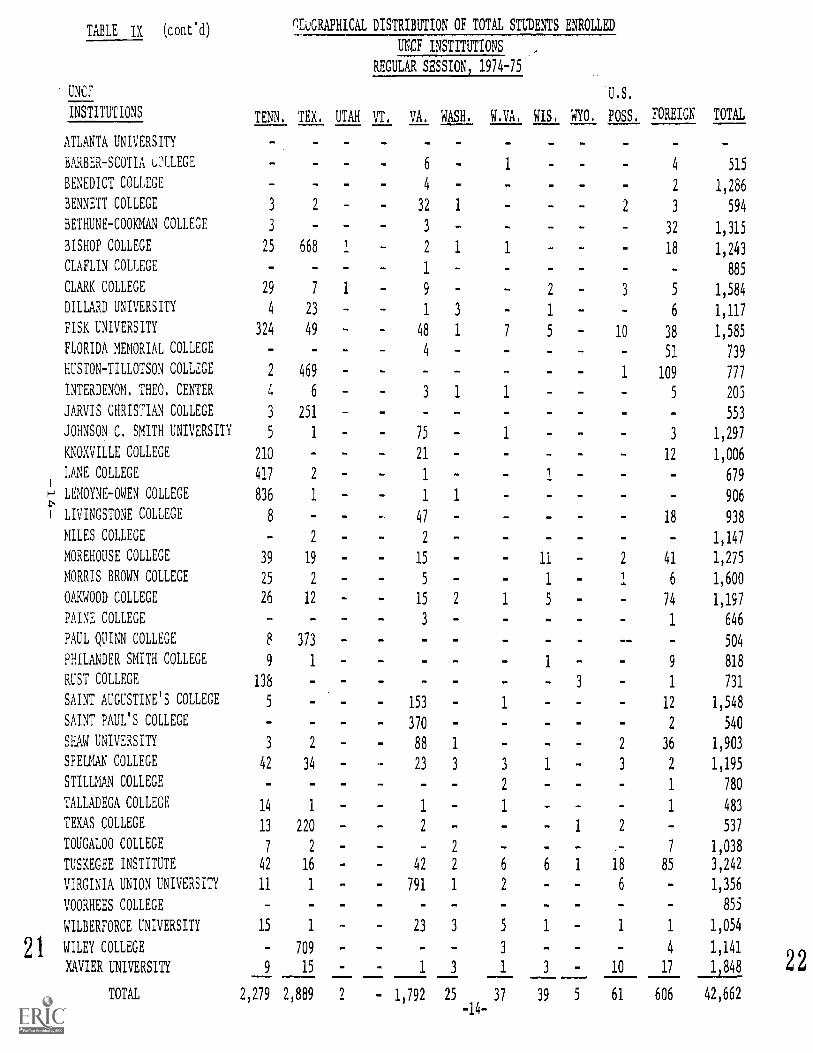
Geographical Distribution
UNCF institutions continue to undergird their traditional,
national and international scope in terms of their student enroll-
ments. While all but one of the institutions (Wilberiorce) are
loc.,-.:ed in the South and the majoriLy of students enrolled are from
South, the number of students from outside of this region has
increased 5% between 1969-70 and 1974-75 (Table VII).
Most of the increase in students from outside the deep and
1
Private Higher Education, p.8.-
-9-
13

border South between 1969-70 and 1974-75 are from states as distant
as California (which experienced an 80% increase in students attend-
ing UNCF institutions); Connecticut (with an 85% increase); Illinois
(157%) ; and Michigan (84%). (See Tables IX and X for enrollment by
state and by city.)
Foreign students who have for many years been attracted to UNCF
schools, are accelerating their enrollment. In the past six years
there has been a 20% increase in the enrollment of foreign students
(Table VIII). In 1975-76, just over 2% of UNCF studehLs were foreign.
TABLE VII
GeograLhical Distribution of UNCF Students
REGION 1969-70 1974-75
78%
22%
Deep and Border South]. 83%
Other U.S. and Forei n 17%
1Comprises the following: Alabama, Arkansas, Delaware, District of
Columbia, Florida, Georgia, Kentucky, Louisiana, Maryland, Mississippi,North Carolina, Oklahoma, South Carolina, Tennessee, Texas, Virginia andWest Virginia.
TABLE VIII
Foreign Students on UNCF Campuses(Index Numbers: 1969-70 = 100)
1969-70
Total Mean Index Total
1975-76
Mean Index
Foreign Students 708 20 100 999 24 120
14-10-

TABLE IX
UNCF
INSTITUTIONS ALA,
ATLANTA UNIVERSITY
BARBER-SCOTIA COLLEGE
BENEDICT COLLEGE
BENNETT COLLEGE 8
BETHUNE-COOKMAN COLLEGE 7
BISHOP COLLEGE 42
CLAFLIN COLLEGE
CLARK COLLEGE 88
DILLARD UNIVERSITY 149
FISK UNIVERSITY 76
FLORIDA MEMORIAL COLLEGE 8
HUSTON-TILLOTSON COLLEGE 2
INTERDENOM. THEO. CENTER 9
JARVIS CHRISTIAN COLLEGE 119
JOHNSON C. SMITH UNIVERSITY 5
KNOXVILLE COLLEGE 142
iLANE COLLEGE 6
HLEMOYNE-OWEN COLLEGE 2
1
LIVINGSTONE COLLEGE 21
MILES COLLEGE 1,073
MOREHOUSE COLLEGE 45
MORRIS BROWN COLLEGE 51
OAKWOOD COLLEGE 198
PAINE COLLEGE
PAUL QUINN COLLEGE 5
PHILANDER SMITH COLLEGE 2
RUST COLLEGE 10
SAINT AUGUSTINE'S COLLEGE
SAINT PAUL'S COLLEGE 9
SHAW UNIVERSITY 78
SPELMAN COLLEGE 42
STILLMAN COLLEGE 575
TALLADEGA COLLEGE 196
TEXAS COLLEGE 9
TOUGALOO COLLEGE/
4
TUSKEGEE INSTITUTE 1,543
VIRGINIA UNION UNIVERSITY 12
VOORHEES COLLEGE
WILBERFORCE UNIVERSITY 28
WILEY COLLEGE 86
XAVIER UNIVERSITY76
15TOTAL 4,726
GEOGRAPHICAL DISTRIBUTION OF TOTAL STUDENTS ENROLLED
UNCF INSTITUTIONS
REGULAR SESSION, 1974.-75
ALAS. ARIZ. ARK. CALIF. COLO. CONN. DEL. D.C. FLA. GA. HAWAII IDAHO. ILL.
--
1 11 8 16 6
4 2 7 22 11 7
3 1 10 4 27 11 44- 12
3 4 1 5 1,082 50 4
3 29 32 9 I 1 2 14 13 48
1 5 4 5-
2 5 1 18 4 42 137 891 34
6 8 0 1 41 25 17
2 6 51 3 17 3 49 47 105 1 89
- 1, 2 1 3 548 5 8
14 13 19 1 56
9 2 , 1 1 1 15 35, 5
38 7 3 8 22 4
1 1 2 3 7 29 37 28 14
3 11 1 38 47 118 , 154
32 5 1 2 24 19 34
19 - 1 3 7
1 12 1 21 20 12 32
- 2 1 22 20 3
- 4 40 21 26 60 395 55
2 1 3 1 11 145 1,041 22
2 1 116 8 1 11 59 45 - 68
1 1 1 10 10 517 2
- 8 713 8 3
649 4- - 1
14
8_ - 1 3 2 6
1 4 - 18 10 6 13
, 3 1. 15 12 7 5
2 28 3 34 4 61 186 39 82
1 1 2 26 8 10 1 30 50 349 1 35
1- 6 35 34 37
- 3 3 15 30 49 14
1 6 4 6 146 5 . - 5
3 3 3 2 1 3 - 17
9 14 38 3 E. 33 223 332 68
1 1 L I 69 10 1 12
1 2 4 4 6
3 14 43 6 43 18 11 74
19 10_ , 38 3 - 29
---1 2 7 1 1 9 64 20 20
2 20 881 30 246 40 620 3,238 4,276
_l_
1 1 1,117
16

17
TABLE IX (cont'd)
GEOGRAPHICAL DISTRIBUTION OF TOTAL STUDENTS ENROLLED
UNCF INSTITUTIONS
REGULAR SESSION, 1974-75
UNCF
IND. IOWA KANS, KY. LA. MAINE
-
MD. MASS. AICH. MINN. MISS. MO. MONT. NEBR.INSTITUTIONS
ATLANTA UNIVERSITY_ _ ,
EARBER-SCOTIA COLLEGE 1 4 - 1
BENEDICT COLLEGE 1 5 2 3 I 1 1
BENNETT COLLEGE 1 4 13 1 2 1 1
BETHUNE-COOKMAN COLLEGE 2 1 5c, 2
BISHOP COLLEGE 19 1 5 3 91 2 3 28 2 38 37 5
CLAFLIN COLLEGE 1 2 3 1
CLARK COLLEGE 13 1 3 6 10 13 6 17 5 5 12 1
DILLARD UNIVERSITY 3 702 11 1 65 4
FISK UNIVERSITY 48 1 4 27 25 26 11 58 12 30 41
FLORIDA MEMORIAL COLLEGE 2 - 1 1 2
HUSTON-TILLOTSON COLLEGE 4 4 1 2 19 2 8 - 1
INTERDENOM. THEO. CENTER 5 1 - 4 5 14 2 1
JARVIS CHRISTIAN COLLEGE I 25 3 8 44 -
JOHNSON C. SMITH UNIVERSITY 3 - 3 20 5_ 1 3 3
KNOXVILLE COLLEGE 14 6 3 3 17 35 13
LANE COLLEGE 6 2 6 3 10 52 21
LEMOYNE-OWEN COLLEGE 3 1 I 3 4 7 I
LIVINGSTONE COLLEGE 3 2 - 18 1 15 1 I 1
MILES COLLEGE 2 3 1 4 3
MOREHOUSE COLLEGE 15 1 6 23 24 26 48 4 19
MORRIS BROWN COLLEGE 3 1 2 18 8 6 19 6 5
OAKWOOD COLLEGE 24 2 4 6 16 18 7 59 18 19 1 1
PAINE COLLEGE I I 2 -
PAUL QUINN COLLEGE 1 33 1 17 - 1
PHILANDER SMITH COLLEGE 4 1 1 1 4 1 3 9
RUST COLLEGE 2 1 1 - 529 6
SAINT AUGUSTIA'S COLLEGE 4 1 1 -
SAINT PAUL'S COLLEGE 3 14 1 I
SHAW UNIVERSITY 3 1 3 12 4 6 2 3
SPELMAN COLLEGE 16 2 5 5 19 23 20 5' 3 15 29
STILLMAN COLLEGE I - 4 2 - 5 21 4
TALLADEGA COLLEGE 3 'L 1 2 2 I - 12 1
TEXAS COLLEGE 3 6 4 1 - 2 4 2
TOUGALOO COLLEGE 5 3 5 1 6 1 934 3
TUSKEGEE INSTITUTE 16 8 31 1 48 6 59 3 94 17 1
VIRGINIA UNION UNIVERSITY 3 2 I 21 4
VOORHEES COLLEGE 1 1 - 1 -
WILBERFORCE UNIVERSITY 9 8 4 6 4 47 52 15
WILEY COLLEGE
XAVIER UNIVERSITY
6
3
6
2
155
2 1 428 4 2
26
3 1
1,
68
4
17 1 1
249
_12
__?98 2,625 2 310 111 36 2,085 287 16
TOTAL 43 541 7
18
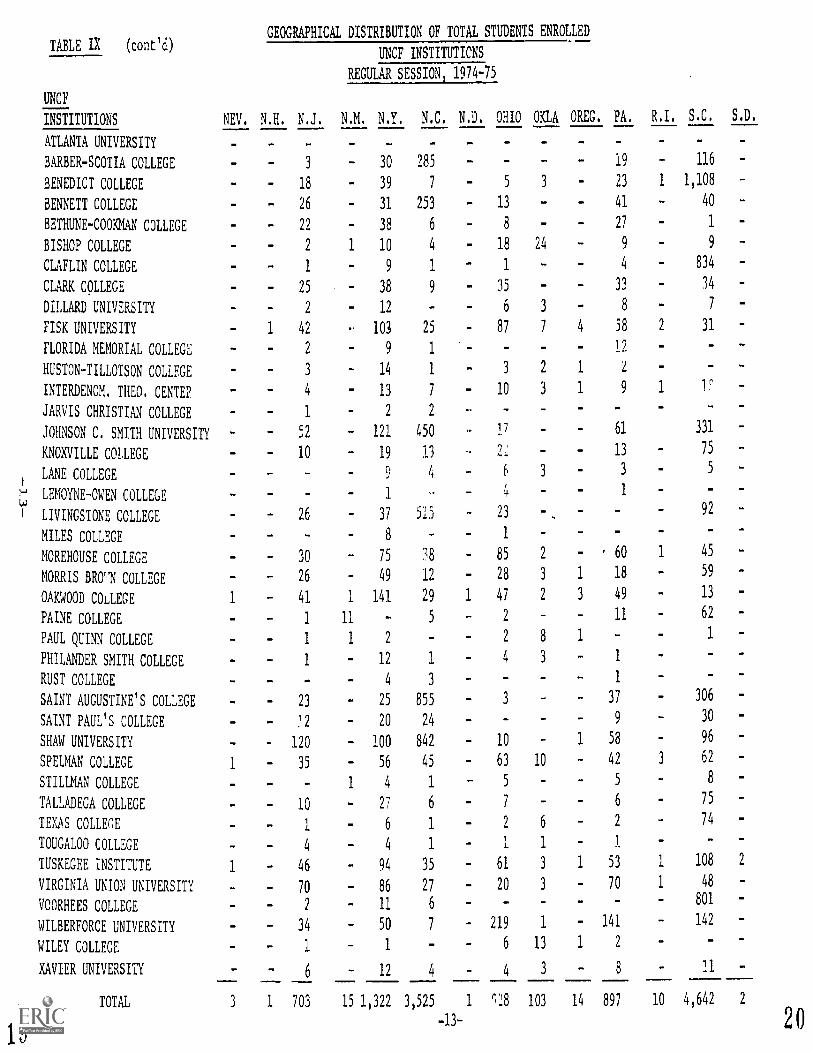
TABLE IX (cont'd)
GEOGRAPHICAL DISTRIBUTION OF TOTAL STUDENTS ENROLLED
UNCF INSTITUTICNS
REGULAR SESSION, 1974-75
UNCF
NEV. N.H. N.J. N.M. N.Y. N.C. N.D. OHIO OKLA OREG. PA, R.I. S.C.
.
S.D.
m
INSTITUTIONS
_ _ ..ATLANTA UNIVERSITY . . .. . -
BARBER-SCOTIA COLLEGE . _3 30 285 - - 19 116 -
BENEDICT COLLEGE 18 39 7 5 3 23 1 1,108 .
BENNETT COLLEGE - - 26 31 253 - 13 - 41 40
BETHUNE-COOKMAN COLLEGE - 22 38 6 - 8 - 27 - 1m
BISHOP COLLEGE - 2 1 10 4 18 24 9 9 _
CLAFLIN COLLEGE _ 1 9 1 1 4_ 834 .
CLARK COLLEGE , 25 38 9 - 35 33 - 34 -
DILLARD UNIVERSITY 2 12 - 6 3 8 7.
FISK UNIVERSITY - 1 42 103 25 87 7 4 58 2 31_
FLORIDA MEMORIAL COLLEGE 2 9 1 - 12
HUSTON-TILLOTSON COLLEGE_ 3 14 1
. 3 2 1 2
INTERDENOM. THEO. CENTEP . 4 13 7 10 3 1 9 1 1
JARVIS CHRISTIAN COLLEGE 1 2 2_ -
JOHNSON C. SMITH UNIVERSITY - 52 - 121 450 .. 17 - 61 331
75KNOXVILLE COILEGE 10 19 i3 2.: - 13 -
5LANE COLLEGE 9 4 6 3 3t
LEMOYNE-OWEN COLLEGE_ .
1. 4 1 -
w1 LIVINGSTONE COLLEGE
MILES COLLEGE
- 26
-
37
8
515
.
23
- 1 -.
92
_
45
..
-MOREHOUSE COLLEGE 30 75 38 . 85 2 - ' 60 1
59 -MORRIS BRO"N COLLEGE 26 49 12 . 28 3 1 18
13 -OAKWOOD COLLEGE 1
_ 41 1 141 29 1 47 2 3 49.
62 -PAINE COLLEGE 1 11 - 5 - 2 - 11
1PAUL QUINN COLLEGE 1 1 2. 2 8 1
.
_PHILANDER SMITH COLLEGE
RUST COLLEGE
1
-
12
4
1
3
. 4
_
3 1
1. ..
.SAINT AUGUSTINE'S COLLEGE . - 23 25 855 - 3 37
. 306
.SAINT PAUL'S COLLEGE - '2 20 24 - 9 30
SHAW UNIVERSITY 120 100 842 . 10 1 58 96
62SPELMAN COLLEGE 1 - 35 56 45 - 63 10 42 3
8 -STILLMAN COLLEGE 1 4 1- 5 5
TALLADEGA COLLEGE - 10. 27 6
. 7 - 6 75
-TEXAS COLLEGE 1 - 6 1 2 6 2 74
TOUGALOO COLLEGE - 4 4 1 1 1 1
2TUSKEGEE INSTITUTE 1. 46 94 35 61 3 1 53 1 108
VIRGINIA UNION UNIVERSITY - 70 86 27 20 3 70 1 48
801
-
-VOORHEES COLLEGE - 2 11 6
_ _ -
142WILBERFORCE UNIVERSITY 34 - 50 7
_ 219 1 141
WILEY COLLEGE - 1 1 6 13 1 2
XAVIER UNIVERSITY 6 - 12 4 4 3 8 - 11
TOTAL 3 1 703
_15 1,322 3,525 1 ',1!8 103 14 897 10 4,642 2
19-13- 20
2 1
TABLE Ix (cont'd)caGRAPHICAL DISTRIBUTION OF TOTAL STUDENTS ENROLLED
UNCF INSTITUTIONS
REGULAR SESSION, 1974-75
UNCF
TENN. TEL UTAH VT. VA. WASH. W.VA, WIS. WYO.
U.S.
POSS. FOREIGN TOTALINSTITUTIONS
ATLANTA UNIVERSITY - .. ... ... ..
BARBER-SCOTIA LALEGE 6 - 1 - 4 515
BENEDICT COLLEGE - 4 2 1,286
BENNETT COLLEGE 3 2 32 1 - - 2 3 594
BETHUNE-COOKMAN COLLEGE 3 3 . .32 1,315
BISHOP COLLEGE 25 668 1 2 1 1 18 1,243
CLAFLIN COLLEGE 1 . 885
CLARK COLLEGE 29 7 1 9 . 23 5 1,584
DILLARD UNIVERSITY 4 23 1 3 1 6 1,117
FISK UNIVERSITY 324 49 - 48 1 7 5 10 38 1,585
FLORIDA MEMORIAL COLLEGE 4 - 51 739
HUSTON-TILLOTSON COLLEGE 2 469 1 109 777
INTERDENOM. THEO. CENTER 4 6 3 1 1 5 205
JARVIS CHRISTIAN COLLEGE 3 251 553
JOHNSON C. SMITH UNIVERSITY 5 1 . 75 1 - 3 1,297
KNOXVILLE COLLEGE 210 . 21 . . 12 1,006
LANE COLLEGEI
417 2 1 1 - 679
H LEMOYNE-OWEN COLLEGE;,
836 1 - 1 1 906
1 LIVINGSTONE COLLEGE 8 47 - 18 938
MILES COLLEGE 2 - 2 - - 1,147
MOREHOUSE COLLEGE 39 19 - 15 11 2 41 1,275
MORRIS BROWN COLLEGE 25 2 - - 5 1 1 6 1,600
OAKWOOD COLLEGE 26 12 - - 15 2 1 5 74 1,197
PAINE COLLEGE - ....
3 - - .1 646
PAUL QUINN COLLEGE 8 373 - - - 504
PHILANDER SMITH COLLEGE 9 1 - 1 - 9 818
RUST COLLEGE 138 . ..- - 3
.1 731
SAINT AUGUSTINE'S COLLEGE 5 - 153 - 1 12 1,548
SAINT PAUL'S COLLEGE . . - 370 - 2 540
SHAW UNIVERSITY 3 2 - 88 1 . 2 36 1,903
SPELMAN COLLEGE 42 34 - 23 3 3 1 3 2 1,195
STILLMAN COLLEGE _2 1 780
TALLADEGA COLLEGE 14 1 1 - 1 1 483
TEXAS COLLEGE 13 220 . - 2 - 1 2 - 537
TOUGALOO COLLEGE 7 2 - - 2 .- 7 1,038
TUSKEGEE INSTITUTE 42 16 - - 42 2 6 6 1 18 85 3,242
VIRGINIA UNION UNIVERSITY 11 1 791 1 2 - 6 1,356
VOORHEES COLLEGE - - 855
WILBERFORCE UNIVERSITY 15 1 - 23 3 5 1 - 1 1 1,054
WILEY COLLEGE - 709 - - - 3 . 4 1,141
XAVIER UNIVERSITY 9 15 - .1 3 1 3 - 10 17 1,848
TOTAL 2,279 2,889 2 - 11792 25
-14-
37 39 5 61 606
_42,662
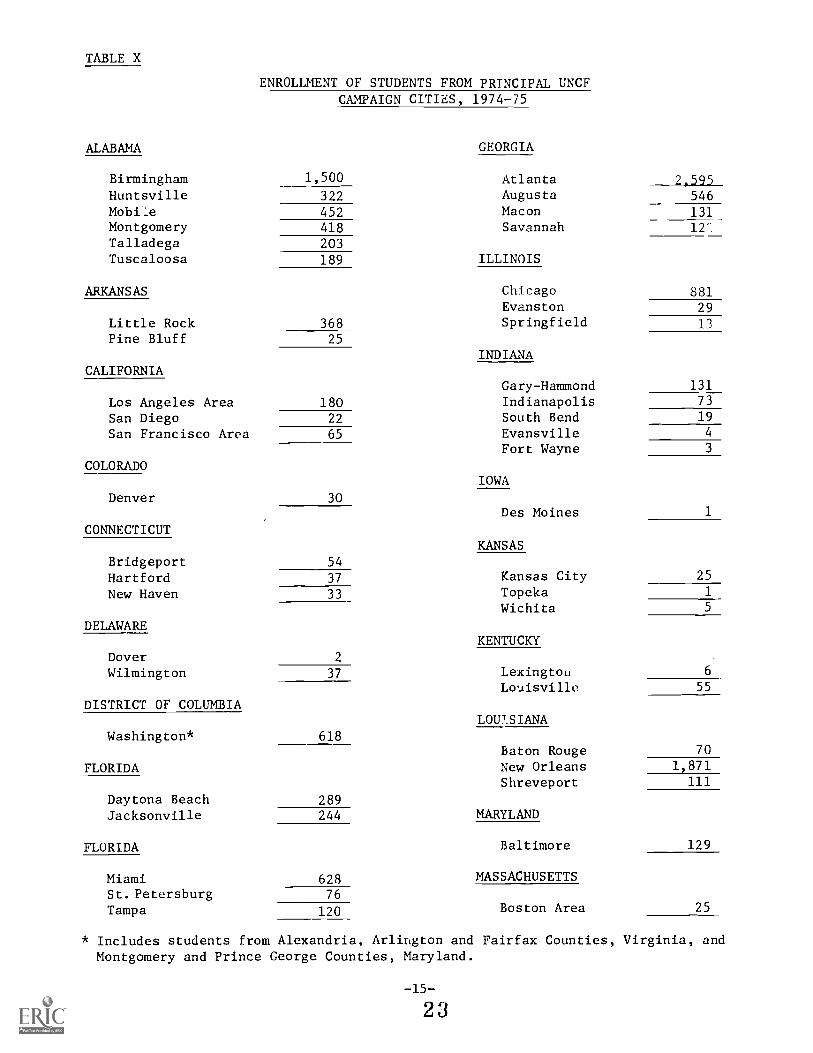
TABLE X
ENROLLMENT OF STUDENTS FROM PRINCIPAL UNCF
ALABAMA
CAMPAIGN CITIES, 1974-75
GEORGIA
Birmingham 1,500 Atlanta 2,595Huntsville 322 Augusta 546MobiLe 452 Macon 131Montgomery 418 Savannah 12'.
Talladega 203Tuscaloosa 189 ILLINOIS
ARKANSAS Chicago 881Evanston 29
Little Rock 368 Springfield 13
Pine Bluff 25
INDIANACALIFORNIA
Gary-Hammond 131
Los Angeles Area 180 Indianapolis 73
San Diego 22 South Bend 19
San Francisco Area 65 Evansville 4
Fort Wayne 3
COLORADOIOWA
Denver 30Des Moines 1
CONNECTICUTKANSAS
Bridgeport 54
Hartford 37 Kansas City 25
New Haven 33 Topeka 1
Wichita 5
DELAWAREKENTUCKY
Dover 2
Wilmington 37 Lexington 6
55
DISTRICT OF COLUMBIALOUISIANA
Washington* 618Baton Rouge 70
FLORIDA New Orleans 1,871Shreveport 111
Daytona Beach 289Jacksonville 244 MARYLAND
FLORIDA Baltimore 129
Miami 628 MASSACHUSETTS
St.Petersburg 76
Tampa 120 Boston Area 25
* Includes students from Alexandria, Arlington and Fairfax Counties, Virginia, andMontgomery and Prince George Counties, Maryland.
-15-
2 3
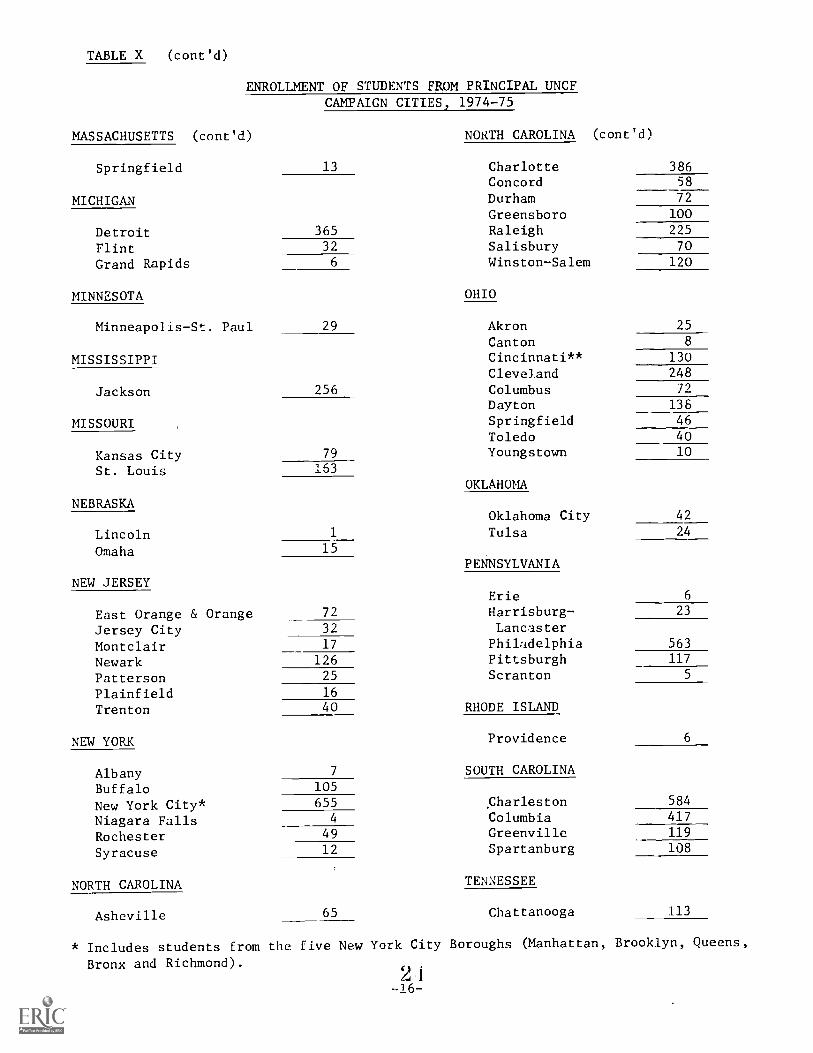
TABLE X (cont'd)
OF STUDENTS FROM PRINCIPAL UNCFENROLLMENTCAMPAIGN CITIES, 1974-75
MASSACHUSETTS (cont'd) NORTH CAROLINA (cont'd)
Springfield 13 Charlotte 386Concord 58
MICHIGAN Durham -72Greensboro 100
Detroit 365 Raleigh 225
Flint 32 Salisbury 70
Grand Rapids 6 Winston-Salem 120
MINNESOTA OHIO
Minneapolis-St. Paul 29 Akron 25
Canton 8
MISSISSIPPI Cincinnati** 130Cleve3and 248
Jackson 256 Columbus 72
Dayton 138
MISSOURI Springfield 46
Toledo 40
Kansas City 79 Youngstown 10
St. Louis 1.63
OKLAHOMA
NEBRASKAOklahoma City 42
Lincoln 1 Tulsa 24
Omaha 15PENNSYLVANIA
NEW JERSEYErie 6
East Orange & Orange 72 Harrisburg- 23
Jersey City 32 Lancaster
Montclair 17 Philadelphia 563
Newark 126 Pittsburgh 117
Patterson 25 Scranton 5
Plainfield 16
Trenton 40 RHODE ISLAND
NEW YORK Providence 6
Albany 7 SOUTH CAROLINA
Buffalo 105
New York City* 655 Charleston 584
Niagara Falls 4 Columbia 417
Rochester 49 Greenville 119
Syracuse 12 Spartanburg 108
NORTH CAROLINA TENNESSEE
Asheville 65 Chattanooga 113
* Includes students from the five New York City Boroughs (Manhattan, Brooklyn, Queens,
Bronx and Richmond).
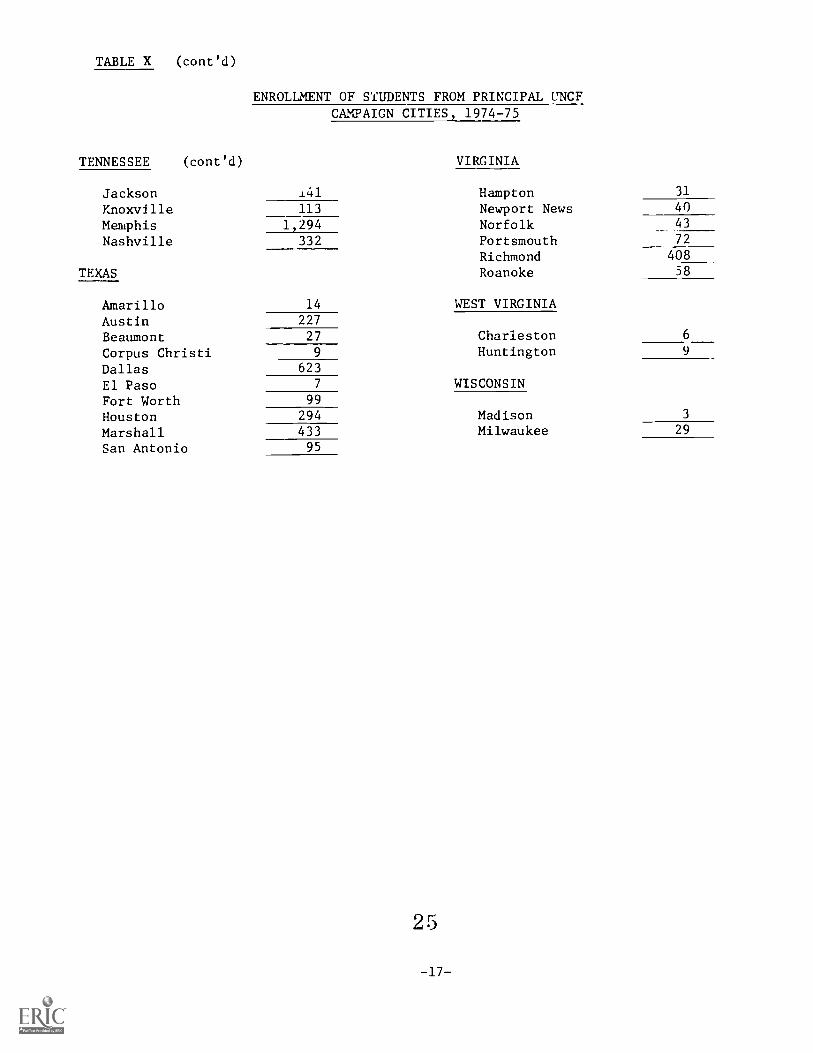
TABLE X (cont'd)
TENNESSEE (cont'd)
ENROLLMENT OF STUDENTS FROM PRINCIPAL UNCFCAMPAIGN CITIES, 1974-75
VIRGINIA
Jackson 141 Hampton 31
Knoxville 113 Newport News 40
Memphis 1,294 Norfolk 43
Nashville 332 Portsmouth 72
Richmond 408
TEXAS Roanoke 58
Amarillo 14 WEST VIRGINIA
Austin 227
Beaumont 27 Charleston 6
Corpus Christi 9 Huntington 9
Dallas 623
El Paso 7 WISCONSIN
Fort Worth 99
Houston 294 Madison 3
Marshall 433 Milwaukee 29
San Antonio 95
DEGREES GRANTED
An analysis of the level and types of degrees awarded by UNCF
institutions affords still another body of evidence of the kinds of
education they now provide their students. Information aboui: the degrees
they award reveal more about their institutional purposes and services
than the figures presented on enrollment, for degrees indicate the number
of students who vere actually successful in completing a full college
program.
dergraduate & Graduate Degrees
The number of earned academic degrees increased significantly in
-75 over the previous year and the base year, 1969-70 (Table XI). A
total of 6,869 bachelor degrees were awarded in 1974-75 at UNCF insti-
tutions.
Earned graduate degrees increased 11% in 1974-75 over the previous
year. In 1974-75, 753 graduate degrees were awarded compared to 676 in
1973-74. Two-thirds of the graduate degrees were awarded at the two UNCF
graduate institutions, Atlanta University and Intrdenominational Theo-
logical Center (Table XII).
2
-18-

TABLE XI
Bachelor's Degrees Granted1969-70, 1973-74, 1974-75
(Index: 1969-70=100)
UNCFINSTITUTIONS 1969-70 1973-74 1974-75
ATLANTA UNIVERSITY - - -
BARBER-SCOTIA COLLEGE 89 78 65
BENEDICT COLLEGE 261 297 339BENNETT COLLEGE 126 72 104
BETHUNE-COOKMAN COLLEGE 272 276 254
BISHOP COLLEGE 206 277 209CLAFLIN COLLEGE 182 154 146
CLARK COLLEGE 169 161 238
DILLARD UNIVERSITY 214 183 218
FISK UNIVERSITY 227 272 223
FLORIDA MEMORIAL COLLEGE 114 153 118
HUSTON-TILLOTSON CnLLEGE 125 102 105
INTERDENOM. THEO. CENTER - -
JARVIS CHRISTIAN COLLEGE * 102 148
JOHNSON C. SMITH UNIVERSITY 176 185 189KNOXVILLE COLLEGE 207 157 140
LANE COLLEGE 200 201 154
LEMOYNE-OWEN COLLEGE 111 126 103
LIVINGSTONE COLLEGE 160 154 131
MILES COLLEGE * 222 197
MOREHOUSE COLLEGE 163 181 213
MORRIS BROWN COLLEGE 179 211 181
OAKWOOD COLLEGE 65 130 142
PAINE COLLEGE 101 86 76
PAUL QUINN COLLEGE * 68 58
PHILANDER SMITH COLLEGE 159 123 151
RUST COLLEGE * 154 128
SAINT AUGUSTINE'S COLLEGE 202 200 232
SAINT PAUL'S COLLEGE 81 93 153
SHAW UNIVERSITY 168 265 401
SPELMAN COLLEGE 195 216 222
STILLMAN COLLEGE 145 130 120
TALLADEGA COLLEGE 77 105 81
TEXAS COLLEGE * 98 92
TOUGALOO COLLEGE 145 159 155
TUSKEGEE INSTITUTE 454 386 428
VIRGINIA UNION UNIVERSITY 175 233 223
VOORHEES COLLEGE 103 107 163WILBERFORCE UNIVERSITY 173 167 167
WILEY COLLEGE 105 78 99
XAVIER UNIVERSITY 209 220 303
TOTAL 5,738 6,582 6,869
MEAN 169 169 176
INDEX 100 100 104
* Connotes member colleges not yet admitted to UNCF.
2 17-19-
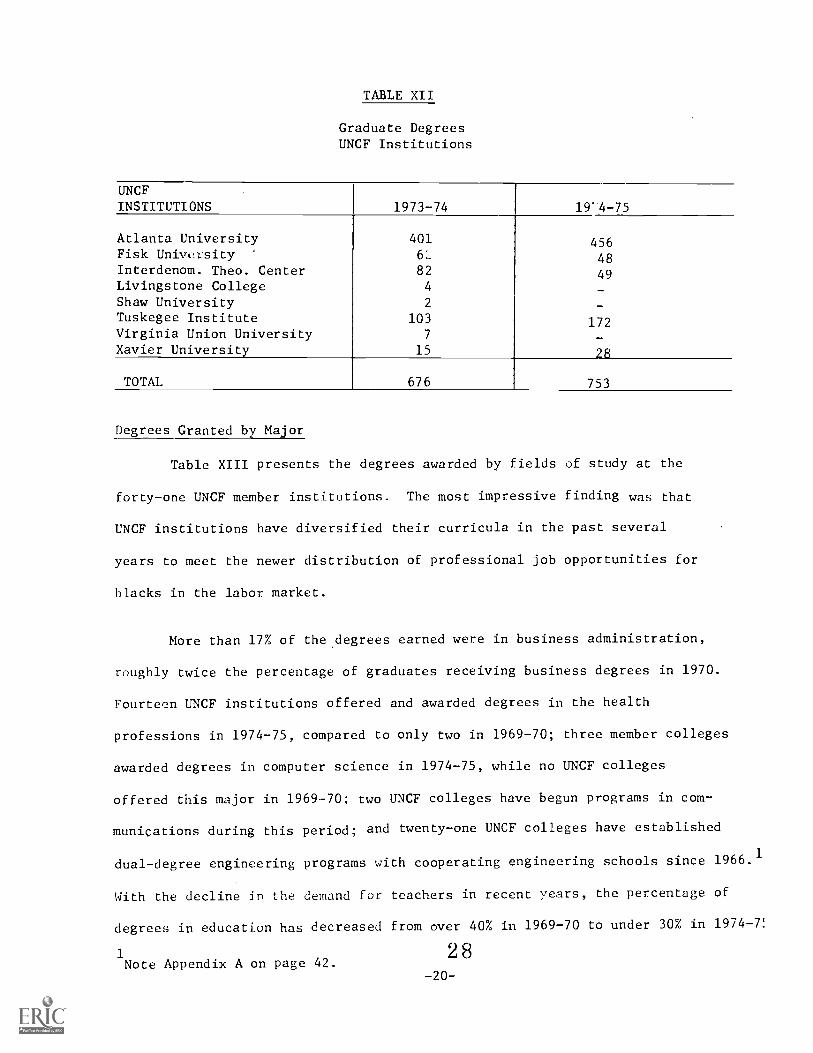
TABLE XII
Graduate DegreesUNCF Institutions
UNCFINSTITUTIONS 1973-74 19.4-75
Atlanta University 401 456Fisk Univ(.1.sity 48Interdenom. Theo. Center 82 49Livingstone College 4
Shaw University 2
Tuskegee Institute 103 172Virginia Union University 7
Xavier University 15 28
TOTAL 676 753
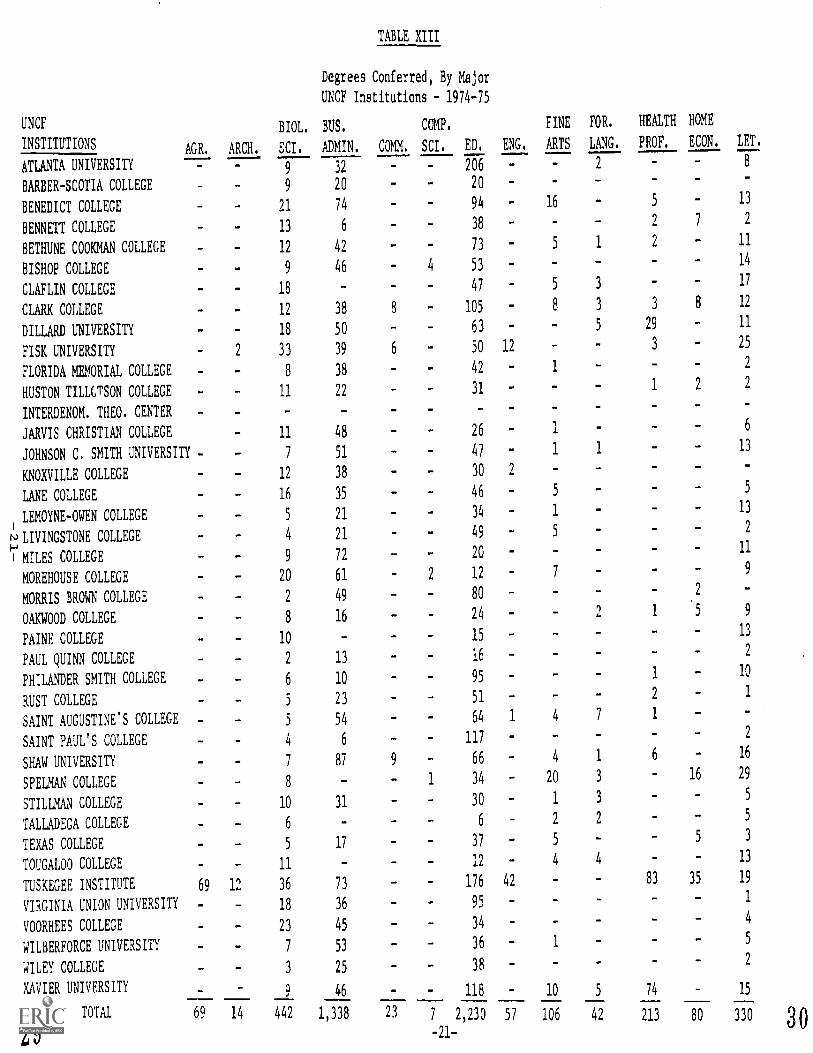
Degrees Granted by Major
Table XIII presents the degrees awarded by fields of study at the
forty-one UNCF member institutions. The most impressive finding was that
UNCF institutions have diversified their curricula in the past several
years to meet the newer distribution of professional job opportunities for
blacks in the labor market.
More than 17% of the,degrees earned were in business administration,
roughly twice the percentage of graduates receiving business degrees in 1970.
Fourteen UNCF institutions offered and awarded degrees in the health
professions in 1974-75, compared to only two in 1969-70; three member colleges
awarded degrees in computer science in 1974-75, while no UNCF colleges
offered this major in 1969-70; two UNCF colleges have begun programs in com-
munications during this period; and twenty-one UNCF colleges have established
dual-degree engineering programs with cooperating engineering schools since 1966.1
With the decline in the demand for teachers in recent years, the percentage of
degrees in education has decreased from over 40% in 1969-70 to under 30% in 1974-7!
1Note Appendix A on page 42.
2 8-20-
UNCF
INSTITUTIONSAGR.
ATLANTA UNIVERSITY -
BARBER-SCOTIA COLLEGE
BENEDICT COLLEGE
BENNETT COLLEGE
BETHUNE COOKMAN COLLEGE
BISHOP COLLEGE -
CLAFLIN COLLEGE
CLARK COLLEGE .
DILLARD UNIVERSITY
FISK UNIVERSITY
FLORIDA MEMORIAL COLLEGE -
HUSTON TILLCTSON COLLEGE -
INTERDENOM. THEO. CENTER
JARVIS CHRISTIAN COLLEGE
JOHNSON C. SMITH UNIVERSITY -
KNOXVILLE COLLEGE
LANE COLLEGE -
LEMOYNE-OWEN COLLEGE1
NLIVINGSTONE COLLEGE -
M1 MILES COLLEGE
MOREHOUSE COLLEGE
MORRIS BROWN COLLEGE
OAKWOOD COLLEGE
PAINE COLLEGE
PAUL QUINN COLLEGE
PHILANDER SMITH COLLEGE
RUST COLLEGE
SAINT AUGUSTINE'S COLLEGE
SAINT PAUL'S COLLEGE
SHAW UNIVERSITY
SPELMAN COLLEGE
STILLMAN COLLEGE
TALLADEGA COLLEGE
TEXAS COLLEGE
TOUGALOO COLLEGE
TUSKEGEE INSTITUTE 69
VIRGINIA UNION UNIVERSITY
VOORHEES COLLEGE
WILBERFORCE UNIVERSITY
WILEY COLLEGE
XAVIER UNIVERSITY
TOTAL 69
29
ARCH,
Degrees
UNCF Institutions
BIOL. BUS.
SCI, ADMIN.
TABLE XIII
ENG.
FINE
ARTS
FOR.
LANG.
HEALTH HOME
PROF. ECON. LET.
Conferred, By Major
1974-75
COMP.
COMM. SCI, ED,
.9 32 - 206 - 2
_ _8
9 20 - 20_ -
21 74 94 . 16 5 - 13
- 13 6 38. _ 2 7 2
- 12 42. . 73 5 1 2 11
- 9 46 4 5314
- 18 47 5 3 17
- 12 38 8 - 105 8 3 3 8 12
- 18 50 - 63 - 5 29 11
2 33 39 6 50 12. 3 - 25
8 38. 42 - 1 - 2
11 22_ 31
. 1 2 2
. -... . -
_ 11 48. 26
. 1 - 6
7 51. . 47 1 1 13
12 38 30 2 -
16 35 46 5 - 5
_ 5 21 34. 1 13
4 21 49 5 2
9 72 20 -11
20 61 2 12 79
2 49 80
8 16 24 2 1 5 9
10 15 . - 13
2 13 162
_ 6 10. 95
_ 1 10
5 23 51 2 1
_ 5 54 64 1 4 7 1
4 6 1172
7 87 9 66 4 1 6 16
8 - 1 34. 20 3 16 29
10 31 30 1 3 5
6 6 2 2 5
5 17 37 5 5 3
_ 11 - 12 - 4 4 13
12 36 73 - 176 42 83 35 19
18 36 95 -. _ 1
23 45 - 34. 4
7 53. 36 1
. . 5
3 25_ 38 . - . 2
9 46 . - 118 10 5 74 15
14 442 1,338 23 7 2,230 57 106 42 213 80 330
-21-30

UNCF
INSTITUTIONS
LIB.
SCI, MATH
PHYS.
SCI.
Degrees
UNCF Institutions
PSYCHO.
TABLE XIII
THEOLOGY
Conferred, By Major
1974-75
PUB. SOC.
AFFAIRS SCI.
ATLANTA UNIVERSITY 68 3 8 - 76 44
BARBER-SCOTIA COLLEGE _ _ - - - 16
BENEDICT COLLEGE 8 9 1 41 57
BENNETT COLLEGE - 3 2 7 24
BETHUNE COOKMAN COLLEGE 5 1 38 64
BISHOP COLLEGE 4 10 3 14 52
CLAFLIN COLLEGE - - 5 _ _ 37 -
CLARK COLLEGE - 3 5 - _ 33
DILLARD UNIVERSITY - - 4 13 - 25
FISK UNIVERSITY - 9 18 34 14 26
FLORIDA MEMORIAL COLLEGE 1 - - 24 2
HUSTON TILLOTSON COLLEGE 2 3 - 31 -
INTERDENOM. THEO. CENTER - - - 49
JARVIS CHRISTIAN COLLEGE 10 - 45 1
JOHNSON C. SMITE UNIVERSITY 3 1 22 2 41
KNOXVILLE COLLEGE 5 23 30 -
LANE COLLEGE 2 1 44
ft, LEMOYNE-OWEN COLLEGE 2 2 - - 25
LIVINGSTONE COLLEGE 4 1 L5
MILES COLLEGE - _ 4 8 70
MOREHOUSE COLLEGE 1 17 19 65
MORRIS BROWN COLLEGE 4 10 - 34
OAKWOOD COLLEGE 3 3 9 - 21 40
PAINE COLLEGE - 3 3 - - 32
PAUL QUINN COLLEGE 2 - - - 23
PHILANDER SMITH COLLEGE - - 1 4 13 12
RUST COLLEGE 10 5 - - 33
SAINT AUGUSTINE'S COLLEGE - .8 10 10 68
SAINT PAUL'S COLLEGE _ 1 23
SHAW UNIVERSITY 3 2 - 103
SPELMAN COLLEGE 6 2 39 - 64
STILLMAN COLLEGE 2 - 38
TALLADEGA COLLEGE 7 3 20 7 23
TEXAS COLLEGE 5 - 15
TOUGALOO COLLEGE 8 1 32 - 70 _
TUSKEGEE INSTITUTE 10 4 - 26 57
VIRGINIA UNION UNIVERSITY - 5 5 - 5 58 8
VOORHEES COLLEGE - 8 - 47 -
WILBERFORCE UNIVERSITY - 2 1 8 4 50
WILEY COLLEGE - - - 27
XAVIER UNIVERSITY 8 5 1 - 40 -
TOTAL 68 160 136 293 210 1,636 104
-22-
In sum, the private predominantly black colleges comprising the
United Negro College Fund are gradually becoming more multipurpose
institutions with enriched curricular offerings to strengthen their insti-
tutional programs. The additions and expansions in curricula are extending
educational opportunity to thousands of individual students and are enhanc-
ing their potential contribution to American society.
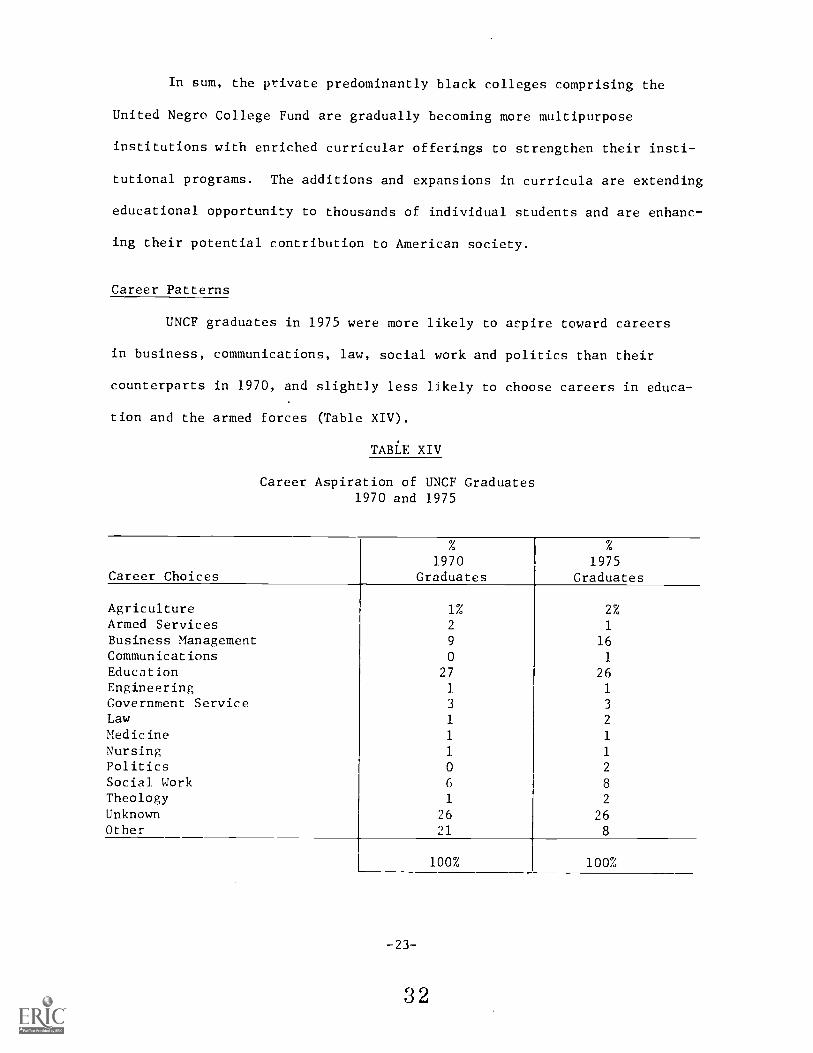
Career Patterns
UNCF graduates in 1975 were more likely to aspire toward careers
in business, communications, law, social work and politics than their
counterparts in 1970, and slight]y less likely to choose careers in educa-
tion and the armed forces (Table XIV).
TABLE XIV
Career Aspiration of UNCF Graduates1970 and 1975
Career Choices1970
Graduates1975
Graduates
Agriculture 1% 2%Armed Services 2 1
Business Management 9 16Communications 0 1
Education 27 26Engineering 1 1
Government Service 3 3
Law 1 2
Medicine 1 1
Nursing 1 1
Politics 2
Social Work 6 8
Theology 1 2
Unknown 26 26Other 21 8
100% 100%
-23-
3 2
Approximately 25% of the 1975 graduating seniors attending IINCF
institutions were admitted to graduate and professional schools. It
is estimated that at least an equal number of graduates decide to pursue
advanced degrees after they graduate, but vork for a year or more for
financial or other reasons. Within five years after graduation,
approximately 50% of UNCF graduates earn advanced degrees.
3 3
-24-

THE FACULTY
The private predominantly black colleges and universities with-
in the United Negro College Fund are essentially teaching institutions
as opposed to research institutions. In particular, their primary
services are related to the teaching of undergraduate students. In this
chapter we analyze the faculties in terms of their degrees held, their
racial composition, their compensation, and their number relative to
students.
Total Faculty
The mean number of faculty (full-time equivalent) per institu-
tion increased 2.4% in 1974-75 over the previous year, from 71.6 per
institution to 73.3 per institution (Table XV). The increase in faculty
kept pace with the 2.8% enrollment increase during the period. Approxi-
mately two-thirds of the faculty were black; and one-third white and
"other."
Faculty by Degre
The percentage of faculty members at four-year colleges nationally
having Ph.D degrees was 37% according to the most recent U.S. Office of
Education statistics. In comparison, more than two out of five faculty at
UNCF institutions (40.6%) hold Ph.D's (Table XV). Excluding UNCF's two
graduate institutions, 38.8% of the faculty held Ph.D's; still 1.8X
greater than at four-year colleges nationally.
Between 1973-74 and 1974-75 the percentage of faculty with Ph.D's on
1
The Condition of Education, National Center for Education Statistics,
1975, p.115.
3 4

TABLE XV
Total FacultylBy Race and Degrees1973-74 & 1974-75
1973-74 1974-75-
UNCFINSTITUTIONS
%
Ph.D. Black
White& Other TOTAL
%
Ph.D. Black
White& Other TOTAL
ATLANTA UNIVERSITY 67 95 43 138 63 101 31 132
BARBER-SCOTIA COLLEGE 34 19 12 31 41 21 12 33
BENEDICT COLLEGE 32 59 27 86 35 58 97 85
BENNETT COLLEGE 28 41 20 61 48 34 16 50
BETHUNE-COOKMAN COLLEGE 36 46 35 El 47 47 36 83
BISHOP COLLEGE 67 49 45 94 67 40 44 84
CLAFLIN COLLEGE 38 23 25 48 39 22 1 23
CLARK COLLEGE 44 73 29 102 54 68 36 104
DILLARD UNIVERSITY 38 50 34 84 29 61 34 95
FISK UNIVERSITY 50 72 46 118 48 76 44 120
FLORIDA MEMORIAL COLLEGE 17 21 14 35 17 18 16 34
USTON-TILLOTSON COLLEGE 44 31 23 54 53 20 16 36
INTERDENOM. THEO. CENTER 55 21 4 25 71 17 1 18
JARVIS CHRISTIAN COLLEGE 28 23 16 39 26 26 15 41
JOHNSON C. SMITH UNIVERSITY 33 57 16 73 38 54 1 55
KNOXVILLE COLLEGE 41 31 27 58 39 28 31 59
LANE COLLEGE 34 39 17 49 32 28 18 46
LEMOYNE-OWEN COLLEGE 40 34 20 54 29 40 22 62
LIVINGSTONE COLLEGE 24 36 14 50 31 35 19 54
,IIEES COLLEGE 31 54 22 76 31 60 32 92
q0REHOUSE COLLEGE 59 53 38 91 62 72 35 107
qORRIS BROWN COLLEGE 95 86 16 102 23 84 20 104
)AKWOOD COLLEGE 28 44 14 58 31 55 11 66
PAINE COLLEGE 30 30 27 57 34 35 30 65
?AUL QUINN COLLEGE 29 23 12 35 34 25 15 40
PHILANDER SMITH COLLEGE 8 27 12 39 19 40 14 54
:UST COLLEGE 40 25 22 47 49 25 19 44
/11NT AUGUSTINE'S COLLEGE 30 51 21 72 49 53 1 54
3AINT PAUL'S COLLEGE 27 29 15 44 28 31 - 31
;HAW UNIVERSITY 34 39 33 72 34 35 38 73
3PELMAN COLLEGE 39 77 30 107 57 61 33 94
;TILLMAN COLLEGE 41 14 24 38 46 16 21 37
TALLADEGA COLLEGE 35 26 29 55 40 23 23
CEXAS COLLEGE 34 33 12 45 38 30 10 40
TOUGALOO COLLEGE 36 30 28 58 43 26 77 53
CUSKEGEE INSTITUTE 24 191 122 313 36 257 93 350
VIRGINIA UNION UNIVERSITY 32 53 22 75 35 68 23 91
/00RHEES COLLEGE 31 25 21 46 40 26 28 54
1ILBERFORCE UNIVERSITY 37 23 35 58 38 25 28 53
1ILEY COLLEGE 44 24 3 27 35 23 11 34
LAVIER UNIVERSITY 36 50 16 66 37 50 83 133
TOTAL 1,820 1,041 2,861 1,914 992 2.,906
MEAN 37.5 % 35 40.2%
1Full-time Equivalent -26-

UNCF campuses increased 7.2% from 37.5% to 40.6%. More than one-third (34.1%)
of the faculty members are nonblack.
Student-Faculty Ratio
The ratio of students to faculty is significantly more generous
at UNCF institutions than at private colleges and universities nationally.
In 1974-75 the ratio on UNCF campuses was roughly 14:1, compared to more
than 16:1 in the private higher education sector nationally.
TABLE XVI
Student-Faculty Ratio
Year UNCF
PrivateColleges Nationally
1
1969-70 13.1:1 16.1:1
1973-74 14.0:1 16.1:1
1974-75 14.1:1 16.4:1
1The Condition of Education, National Center for Education Statistics, 1975,
p. 115.
In summary, UNCF faculties are providing a product to their students
which is somewhat different from that provided by most other faculties.
The more generous student-faculty ratio at UNCF institutions provides student
with a greater opportunity to see educated adults up close. The larger
percentage of faculty with Ph.D's is particularly unusual for smaller colleges
such as those within UNCF. Whatever kind of education is being provided, it
is likely that for certain kinds of young people at UNCF institutions and
elsewhere it may be more constructive and helpful for them to have close,
personal contact with highly qualified teachers, than exposure to professors
holding forth in a lecture hall with fifty or more students.
-27-
3 6

Faculty Compensation
One of the most criLical problems facing UNCF institutions is the
generally low level of their salaries. The greatest salary difference
between UNCF institutions and the total collegiate sector occurs in the
higher ranks. As Table XVII indicates, full professors at UNCF insti-
tutions earned an average of over $7,200 less in 1974-75 than their
counterparts nationally; associate professorL earned an average of over
$3,900 less than their counterparts; assistant profet;.;ors earned over
$2,600 less; And instructors earaed almost $1,700 less.
TABLE XVII
Average Faculty CompensationUNCF Institutions and Nationally
Type of Institutions 1972-73 1974-75 Increase
UNCF InstitutionsProfessor $ 13,376 $ 14,651 9.5
Associate Professor 11,422 12,561 10.0
Assistant Professor 9,999 10,936 9.9
Instructor 8,700 9,343 7.4
AVERAGE $ 10,874 $ 11,872 9.2
Colleges and Universities Nationally1
Professor $ 19,751 $ 21,870 10.7
Associate Professor 14,887 16,495 10.8
Assistant Professor 12,289 13,578 1J.5
Instructor 9,873 11,005 L1.5
AVERAGE $ 14,200 $ 15,737 10.9
1
Source: "The Economic Status of the Profession," AAUP Bulletin, American
Association of University Professors, June 1973, p.211; August,
1975, p.126.
Between 1972-73 and 1974-75 the salarie: faculty at UNCF institu-
tions lost ground relative to faculty salaries nationally. The average

salary increase for the two-year period at UNCF institutions was 9.2%
for all ranks, compared to 10.9% for all ranks of faculty nationally.
Real earnings of both UNCF faculty and faculty nationally declined
between 1972-73 and 1974-75. The consumer price index rose 20.1% during
this period, compared to the average 9.2 and 10.9 percent increases for
UNCF and national faculties.
3 8

INSTITUTIONAL AND STUDENT FINANCES
In this chapter we bring together several topics bearing on the
financial po:31tion of MCP students and institutions. These include
c,,erating r-venues and expenditures, endowment, financial aid to
undergraduate students, student charges, and parental income.
qurating Revenues and Expenditures
Revenues are the monies available to pay for current institutional
operations, and expenditures are those funds used to support academic
instruction, administration, student aid, building maintenance, etc. In
this section data is presented on revenues and expenditures over the period
1971-72 through 1974-75.
Between 1971-72 and 1974-75 there was a 32.0% increase in total revenues
at UNCF institutions. During the same period, however, expenditures increased
37.3% with the net result being that expenditures increased at a faster rate
than income received by the schools.
TABLE XVIII
Revenue and ExpendituresUNCF Institutions 1
1971-72 and 1974-75
(Index: 1971-72=100)
1971-72 1974-75
Revenue 100 132.0
($125,167,367) ($16-,,242,006)
Expenditures 100 137.3
($120,266,739) 0165,174,808;
% Deficit Institutions2 24% 49%
1Based on 34 of 41 member institutions reporting.2Institutions wherb. expenditures exceeded revenues.
-30-
3

Revenues per student Increased 28.3% between 1971-72 And 1974-75,
but expenditures per student incteased 33.3% Mring the same period. Thus, the
growth In revenues per student did not keep ! lce with increased expenditures.
Revenues and expenditures per student were roughly equal in 1974-75.
This situation allow- little room for substantial improvements in educational
quality and faculty salary increases beyond cost of living adjustments.
Additional revenues must be generated beyond existing increases to meet
these costs.
BLE XIX
Revenues and Expenditures Per StudentUNCF Institutions 1
1971-72
Revenues Per Student $3,675
Expenditures Per Student 3 531
1974-75 Change
$4,710 +
4,7C8 + 33.3%
1Based on 34 of the 41 member institutions.
Since 1971-72, the budgetary situation as measured by defici' ; has,
on the whole, declined. Only 24% of UNCF institutions experienced budgct
deficits in 1971-72 compared to 49% in 1974-75.
In 1974-75, twenty or roughly half of all UNCF institutions experienced
budget deficits. Current expenditures exceeded current revenues by a net total
of $377,699.
The real issue for these colleges and universities is whether they will
be able to find resources in amounts that keep pace with rising costs, new
program development and salary improvements. Further increases in tuition
would discourage and deprive large ihers of UNCF students from attending
college (see page 35 for parental income of UNCF students). Cutting costs below
-31-
4 0
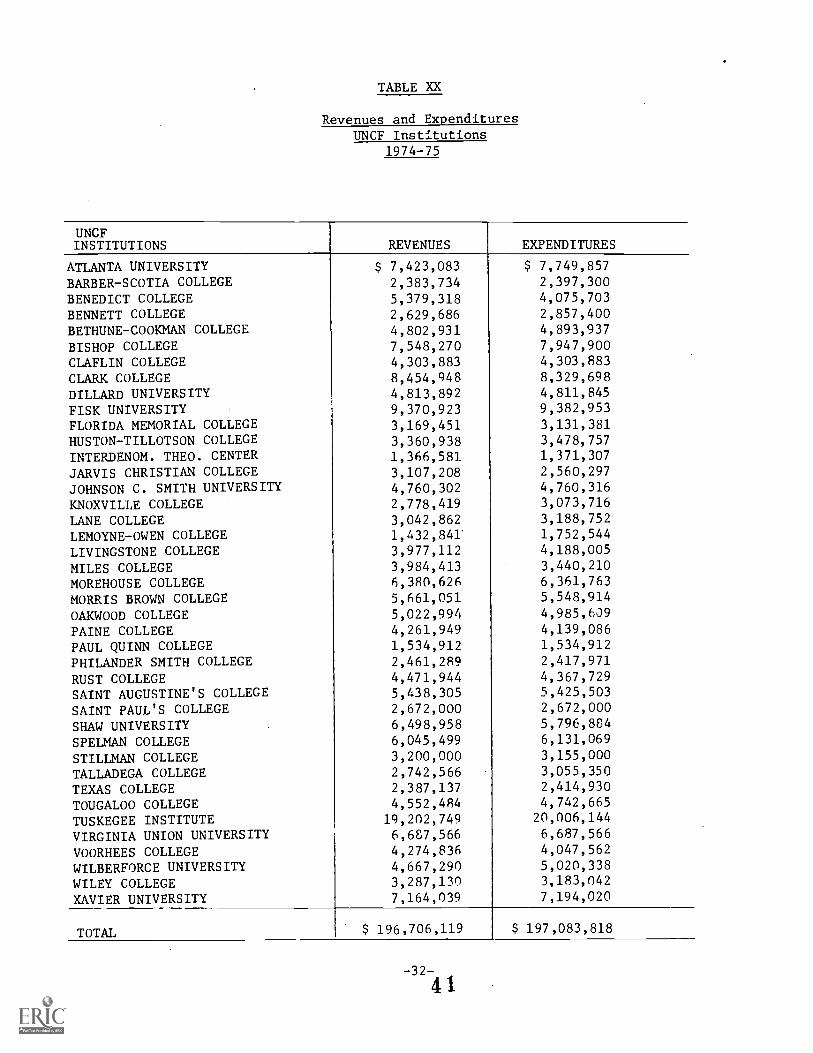
TABLE XX
Revenues and ExpendituresUNCF Institutions
1974-75
UNCFINSTITUTIONS REVENUES EXPENDITURES
ATLANTA UNIVERSITY $ 7,423,083 $ 7,749,857BARBER-SCOTIA COLLEGE 2,383,734 2,397,300
BENEDICT COLLEGE 5,379,318 4,075,703
BENNETT COLLEGE 2,629,686 2,857,400
BETHUNE-COOKMAN COLLEGE 4,802,931 4,893,937
BISHOP COLLEGE 7,548,270 7,947,900
CLAFLIN COLLEGE 4,303,883 4,303,883
CLARK COLLEGE 8,454,948 8,329,698
DILLARD UNIVERSITY 4,813,892 4,811,845
FISK UNIVERSITY 9,370,923 9,382,953
FLORIDA MEMORIAL COLLEGE 3,169,451 3,131,381HUSTON-TILLOTSON COLLEGE 3,360,938 3,478,757INTERDENOM. THEO. CENTER 1,366,581 1,371,307
JARVIS CHRISTIAN COLLEGE 3,107,208 2,560,297
JOHNSON C. SMITH UNIVERSITY 4,760,302 4,760,316
KNOXVILLE COLLEGE 2,778,419 3,073,716
LANE COLLEGE 3,042,862 3,188,752
LEMOYNE-OWEN COLLEGE 1,432,841 1,752,544
LIVINGSTONE COLLEGE 3,977,112 4,188,005
MILES COLLEGE 3,984,413 3,440,210
MOREHOUSE COLLEGE 6,380,626 6,361,763
MORRIS BROWN COLLEGE 5,661,051 5,548,914
OAKWOOD COLLEGE 5,022,994 4,985,609
PAINE COLLEGE 4,261,949 4,139,086
PAUL QUINN COLLEGE 1,534,912 1,534,912
PHILANDER SMITH COLLEGE 2,461,289 2,417,971
RUST COLLEGE 4,471,944 4,367,729
SAINT AUGUSTINE'S COLLEGE 5,438,305 5,425,503
SAINT PAUL'S COLLEGE 2,672,000 2,672,000
SHAW UNIVERSITY 6,498,958 5,796,884
SPELMAN COLLEGE 6,045,499 6,131,069
STILLMAN COLLEGE 3,200,000 3,155,000
TALLADEGA COLLEGE 2,742,566 3,055,350
TEXAS COLLEGE 2,387,137 2,414,930
TOUGALOO COLLEGE 4,552,484 4,742,665
TUSKEGEE INSTITUTE 19,202,749 20,006,144
VIRGINIA UNION UNIVERSITY 6,687,566 6,687,566
VOORHEES COLLEGE 4,274,836 4,047,562
WILBERFORCE UNIVERSITY 4,667,290 5,020,338
WILEY COLLEGE 3,287,130 3,183,042
XAVIER UNIVERSITY 7,164,039 7,194,020
TOTAL $ 196,706,119 $ 197,083,818
-32 -
4 1
already low levels could seriously diminish the attractiveness
and effectiveness of the colleges. The situation suggests a clear
need for additional capital in order to meet rising costs, and gives
impetus to UNCF's planned capital fund drive.
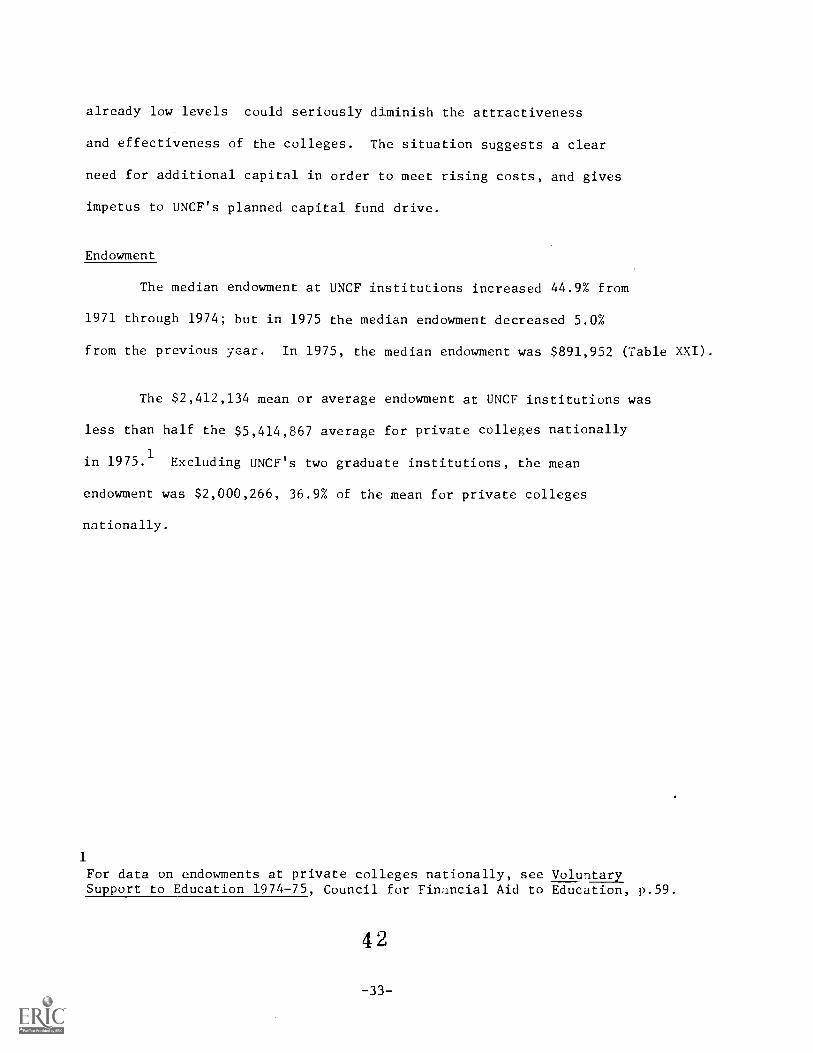
Endowment
The median endowment at UNCF institutions increased 44.9% from
1971 through 1974; but in 1975 the median endowment decreased 5.0%
from the previous year. In 1975, the median endowment was $891,952 (Table XXI).
The $2,412,134 mean or average endowment at UNCF institutions was
less than half the $5,414,867 average for private colleges nationally
in 1975.1
Excluding UNCF's two graduate institutions, the mean
endowment was $2,000,266, 36.9% of the mean for private colleges
nationally.
1
For data on endowments at private colleges nationally, see VoluntarySupport to Education 1974-75, Council for Fimincial Aid to Education, p.59.
4 2
-33-

TABLE XXI
General Financial InformationTotal Endowment Figures
1971, 1974 & 1975(Index: 1971=100)
( $ )
UNCFINSTITUTIONS 1971 1974 1975
ATLANTA UNIVERSITY $ 12,835,376 $ 14,409,737 $ 16,448,428
BARBER-SCOTIA COLLEGE 225,000 NA -0-
BENEDICT COLLEGE 935,875 845,173 726,000
BENNETT COLLEGE 2,038,532 2,568,183 2,469,386
BETHUNE-COOKMAN COLLEGE 1,298,038 1,303,846 1,279,940
BISHOP COLLEGE 628,033 691,859 897,319
CLAFLIN COLLEGE 637,620 578,347 580,202
CLARK COLLEGE 1,745,677 1,928,017 1,981,761
DILLARD UNIVERSITY 3,600,076 3,955,397 3,950,554
FISK UNIVERSITY 6,665,805 4,264,782 3,991,862
FLORIDA MEMORIAL COLLEGE 433,579 435,392 315,192
HUSTON-TILLOTSON COLLEGE 350,359 593,448 627,885
INTERDENOM. THEO. CENTER 3,070,728 4,476,147 4,438,716
JARVIS CHRISTIAN COLLEGE 591,869 1,876,350 1,880,260
JOHNSON C. SMITH UNIVERSITY 850,426 935,383 910,568
KNOXVILLE COLLEGE NA 1,351,659 1,351,427
LANE COLLEGE 442,784 443,464 461,416
LEMOYNE-OWEN COLLEGE 1,130,364 922,882 999,444
LIVINGSTONE COLLEGE 620,178 . 664,844 673,139
MILES COLLEGE 370,094 445,723 447,528
MOREHOUSE COLLEGE 5,129,428 7,330,433 7,069,676
MORRIS BROWN COLLEGE 1,027,318 1,852,512 1,703,546
OAKWOOD COLLEGE 148,273 72,304 299,603
PAINE COLLEGE 427,831 430,196 430,196
PAUL QUINN COLLEGE 32,026 81,925 379,721PHILANDER SMITH COLLEGE 445,300 750,137 891,952
RUST COLLEGE 579,658 797,344 811,780
SAINT AUGUSTINE'S COLLEGE 609,713 1,081,842 1,201,685
SAINT PAUL'S COLLEGE 773,578 505,370 491,498
SHAW UNIVERSITY 98,636 98,540 98,540
SPELMAN COLLEGE 6,770,323 11,224,286 10,049,700STILLMAN COLLEGE 1,386,210 1,776,089 1,817,433
TALLADEGA COLLEGE 9,094,719 3,449,819 3,455,331
TEXAS COLLEGE 449,349 511,276 511,276
TOUGALOO COLLEGE NA 350,000 546,674
TUSKEGEE INSTITUTE 17,467,642 19,644,622 19,506,674
VIRGINIA UNION UNIVERSITY 2,014,459 2,577,753 2,577,753
VOORHEES COLLEGE 138,712 145,200 145,200
WILBERFORCE UNIVERSITY 115,685 128,934 131,567
WILEY COLLEGE 354,495 277,973 289,587
XAVIER UNIVERSITY 1,756,287 2,057,081 2,057,081
TOTAL $ 80,290,775 $ 97,834,269 $ 98,897,500
MEAN ENDOWMENT $ 2,058,737 $ 2,386,202 $ 2,412,134
MEDIAN ENDOWMENT $ 637,620 $ 923,882 $ 891,952
MEDIAN INDEX 100 144.9 139.9
NA/Not Available 4 3 '34-

Parental Income
Almost half of UNCF undergraduate students came fl-)m fami ies
whose total annual incomes were less than $5,000 in 1975. More than
four out of five UNCF undergraduate students fell into the under
$10,000 per year category of annual family income, while only 2%
came from families with incomes over $20,000 per year. Nationally,
fewer than one out of five private college students came from families
earning less than $10,000 per year, and 45% came from families earning
over $20,000 per year in 1975.1
TABLE XXII
Parental IncomeUNCF Students
1975
Parental Income
Under $5,000$5,000 9,99910,000 - 14,99915,000 - 19,99920,000 and over
% UNCFStudents
48.7%32.511.65.22.0
Average Charges to Students
The average tuition at UNCF institutions in 1975-76 was roughly two-
thirds the national average for private, four-year colleges, and room and board
was approximately 85% of the national mean.
With books and supplies included, the total average cost of attending
a UNCF college in 1975-76 was $2,703. UNCF institutions would have to raise
1The American Freshman: National Norms for Fall 1975, Cooperative Institutional
Research Program, ACE/UCLA, p.45.
-35-
4 4
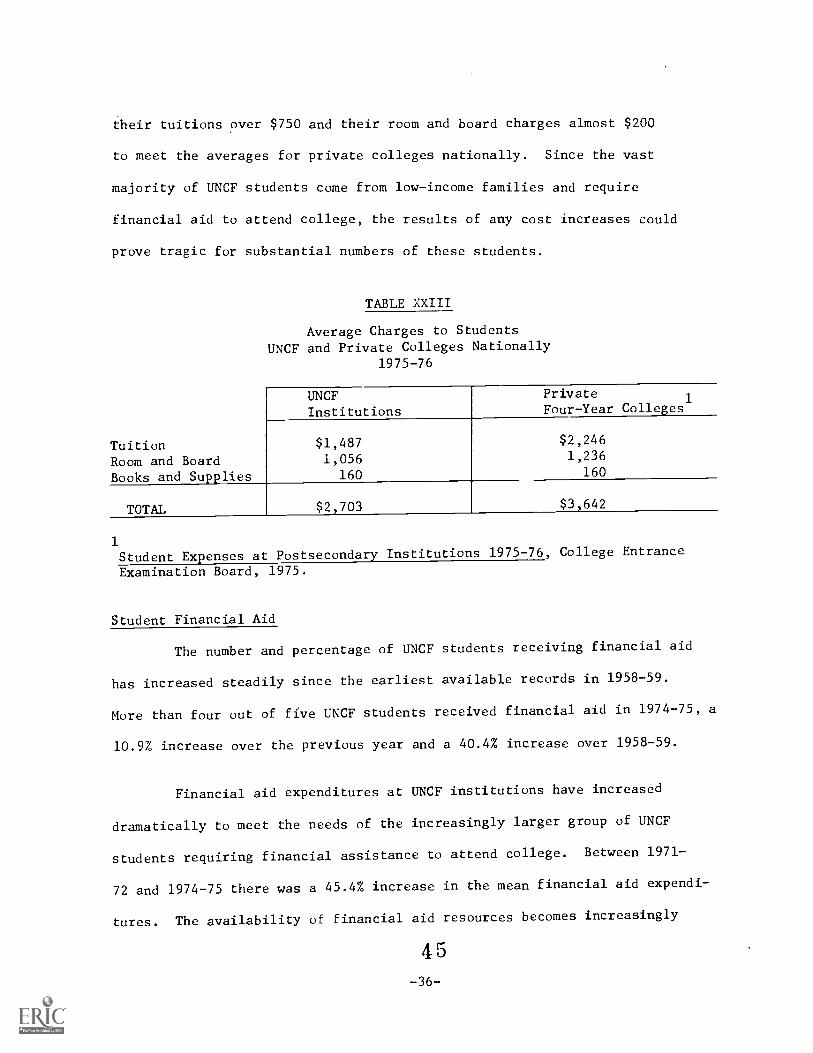
their tuitions over $750 and their room and board charges almost $200
to meet the averages for private colleges nationally. Since the vast
majority of UNCF students come from low-income families and require
financial aid to attend college, the results of any cost increases could
prove tragic for substantial numbers of these students.
TABLE XXIII
Average Charges to StudentsUNCF and Private Colleges Nationally
1975-76
UNCFInstitutions
PrivateFour-Year Colleges
1
Tuition $1,487 $2,246
Room and Board 1,056 1,236
Books and Supplies 160 160
TOTAL $2,703 $3,642
1
Student Expenses at Postsecondary Institutions 1975-76, College Entrance
Examination Board, 1975.
Student Financial Aid
The number and percentage of UNCF students receiving financial aid
has increased steadily since the earliest available records in 1958-59.
More than four out of five UNCF students received financial aid in 1974-75, a
10.9% increase over the previous year and a 40.4% increase over 1958-59.
Financial aid expenditures at UNCF institutions have increased
dramatically to meet the needs of the increasingly larger group of UNCF
students requiring financial assistance to attend college. Between 1971-
72 and 1974-75 there was a 45.4% increase in the mean financial aid expendi-
tures. The availability of financial aid resources becomes increasingly
4 5
-36-
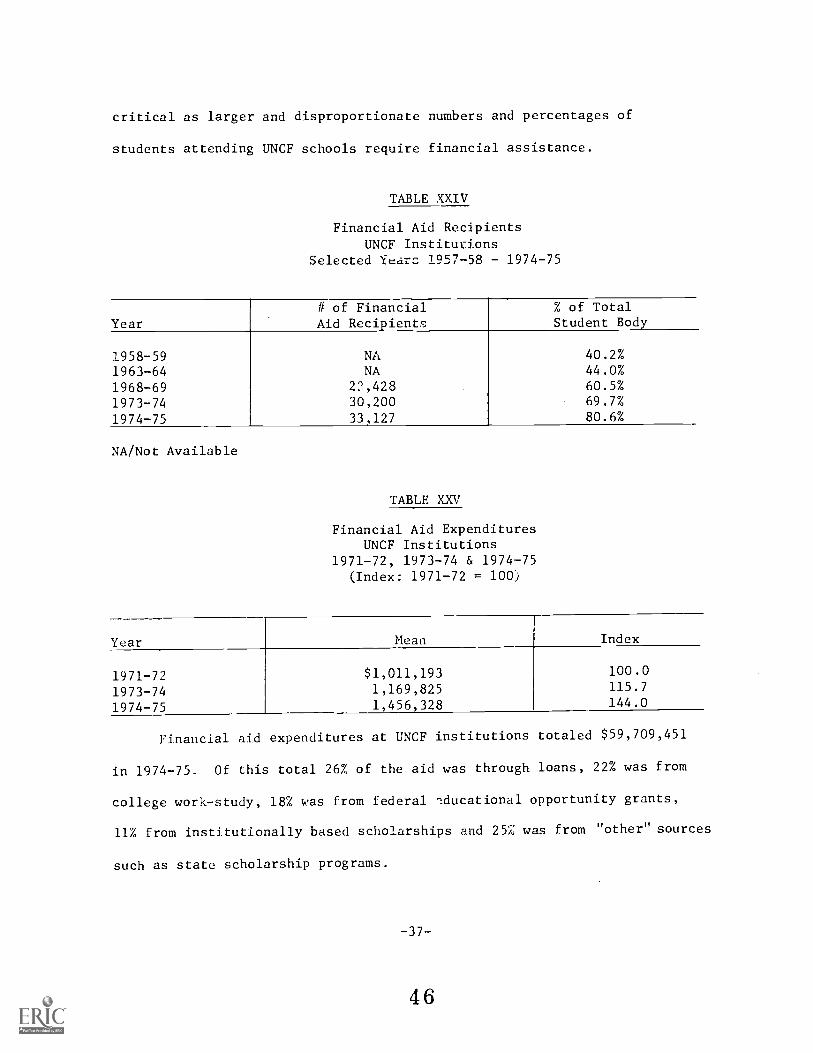
critical as larger and disproportionate numbers and percentages of
students attending UNCF schools require financial assistance.
TABLE XXIV
Financial Aid RecipientsUNCF Institutions
Selected Yearc 1957-58 - 1974-75
Year
1958-591963-641968-691973-741974-75
# of FinancialAid Recipients
NANA
22,42830,20033,127
% of TotalStudent Body
40.2%44.0%60.5%69.7%80.6%
NA/Not Available
TABLE XXV
Financial Aid ExpendituresUNCF Institutions
1971-72, 1973-74 & 1974-75(Index: 1971-72 = 100)
Year Mean
1971-721973-741974-75
$1,011,1931,169,8251,456,328
Index
100.0115.7144.0
Financial aid expenditures at UNCF institutions totaled $59,709,451
in 1974-75. Of this total 26% of the aid was through loans, 22% was from
college work-study, 18% was from federal ',1ducational opportunity grants,
11% from institutionally based scholarships and 25% was from "other" sources
such as state scholarship programs.
-37--
4 6

TABLE XXVI
Student Financial Aid Allocations
UNCF Institutions - 1974-75
INCE
ISTITUTI00,_
Scholarships Work-Aid Loans
Total Amt, No. Rec, Total Amt. No, Rec, Total Amt. No. Rec.
iTLANTA UNIVERb TY $ 448,579 368 $ 395,804 339 $ 111,975 118
iARBER-SCOTIA COLLL 54,781 97 136,864 217 132,733 232
ENEDICT COLLEGE 50,000 57 654,396 716 242,457 397
IENNETT COLLEGE 359,020 453 154,352 326 75,710 130
ETHUNE COOKMAN COLLEGE 262,000 190 400,000 580 165,000 255
3ISH0P COLLEGE 207,115 386 606,974 836 764,839 1,233
:LAFLIN COLLEGE 88,431 110 166,657 334 145,647 319
:LARK COLLEGE 253,388 379 404,293 499 725,100 773
)ILLARD UNIVERSITY 243,134 348 196,579 390 446,052 425
FISK UNIVERSITY 703,714 720 321,950 496 338,732 520
FLORIDA MEMORIAL COLLEGE 135,450 175 327,776 450 182,179 307
IUSTON TILLOTSON COLLEGE 104,940 196 210,355 331 285,336 503
INTERDENOM. THEO. CENTER 63,141 222 22,520 22 32,577 64
JARVIS CHRISTIAN COLLEGE 40,000 125 183,576 276 552,739 525
JOHNSON C. SMITH UNIVERSITY 324,222 475 379,197 653 248,650 409
KNOXVILLE COLLEGE 145,157 250 325,420 459 280,332 532
LANE COLLEGE 26,526 21 339,420 564 131,327 276
LEMOYNE-OWEN COLLEGE 46,647 66 33,394 541 99,375 185
LIVINGSTONE COLLEGE 349,899 484 232,047 452 184,668 336
MILES COLLEGE 40,000 45 371,815 579 101,302 194
MOREHOUSE COLLEGE 327,189 290 290,361 320 189,560 237
MORRIS BROWN COLLEGE 245,56. 196 505,276 673 871,688 971
OAKWOOD COLLEGE 93,951 108 319,714 700 3,244 270
PAINE COLLEGE 17,359 62 348,656 457 117,961 305
PAUL QUINN COLLEGE 40,767 214 178,225 498 165,478 316
PHILANDER SMITH COLLEGE 19,988 63 111,987 178 98,026 188
RUST COLLEGE 54,000 196 467,500 526 83,273 242
SAINT AUGUSTINE'S COLLEGE 150,000 201 520,407 648 667,878 958
SAINT PAUL'S COLLEGE 38,825 69 159,043 255 205,427 354
SHAW UNIVERSITY 77,475 63 61,687 76 501,375 737
EDELMAN COLLEGE 263,410 215 438,456 465 588,987 520
STILLMAN COLLEGE 111,089 143 189,152 337 80,933 245
TALLADEGA COLLEGE 89,366 142 108,485 207 75,221 180
TEXAS COLLEGE 58,375 71 254,760 455 496,690 525
TOUGALOO COLLEGE 296,341 322 228,485 516 190,710 467
TUSKEGEE INSTITUTE 496,613 718 934,995 1,478 698,140 1,296
VIRGINIA UNION UNIVERSITY 118,728 194 277,680 390 391,182 427
VOORHEES COLLEGE 15,000 25 339,599 375 216,445 513
WILBERFORCE UNIVERSITY 58,653 132 965,781 857 712,715 997
WILEY COLLEGE 156,433 250 176,827 248 195,579 318
XAVIER UNIVERSITY 144,547 164 658,900 991 474,473 823
TOTAL $ 6,819,814 9,005 19,750 $ 12,271,715 18,622
PERCENTAGE OF TOTAL 11.4
_113,399,365
22.4 20.5

TABLE EVI (Cont'd)
Student Financial Aid Allocations
UNCF Institutions - 1974-75
UNCF
INSTITUTIONS
Educ. Opport, Grants Other Aid Financial Aid Total
Total Amt. No. Rec. Total Amt. No. Rec, Total Amt. No. Rec.
ATLANTA UNIVERSITY $ - $ 509,838 210 $ 1,466,196 923
BARBER-SCOTIA COLLEGE 170,019 275 210,974 282 659,676 393
BENEDICT COLLEGE 187,063 257 1,259,257 1,032 2,393,175 1,243
BENNETT COLLEGE 54,732 105 150,632 137 794,446 482
BETHUNE COOKMAN COLLEGE 230,000 425 1,433,000 920 2,500,000 1,383
BISHOP COLLEGE 734,968 987 124,000 136 2,437,896 1,241
CLAFLIN COLLEGE 189,305 320 995,416 558 1,585,456 818
CLARK COLLEGE 614,209 486 336,821 866 2,333,823 1,116
DILLARD UNIVERSITY 612,769 694 41,700 125 1,540,234 834
FISK UNIVERSITY 242,272 310 539,557 550 2,146,225 938
FLORIDA MEMORIAL COLLEGE 129,389 318 175,000 425 949,794 NA
HUSTON TILLOTSON COLLEGE 109,360 297 284,830 441 994,821 578
INTERDENOM. THEO. CENTER - .. 2,750 17 118,238 222
JARVIS CHRISTIAN COLLEGE 144,392 309 200,000 176 1,120,707 480
JOHNSON C. SMITH UNIVERSITY 684,781 1,033 84,044 168 1,725,902 851
KNOXVILLE COLLEGE 216,113 445 15,712 25 982,724 594
LANE COLLEGE 257,882 471 423,707 479 1,178,862 618
LEMOYNE-OWEN COLLEGE 139,325 247 437,554 539 1,046,295 789
LIVINGSTONE COLLEGE 61,368 160 311,002 379 1,138,984 781
MILES COLLEGE 310,697 545 202,036 225 1,025,850 725
MOREHOUSE COLLEGE 197,429 295 221,692 149 1,226,231 956
MORRIS BROWN COLLEGE 268,188 495 867,305 1,736 2,757,748 1,336
OAKWOOD COLLEGE 115,118 214 30,000 100 314,839 428
PAINE COLLEGE 294,579 617 192,000 300 970,500 686
PAUL QUINN COLLEGE 173,325 420 252,204 419 809,999 599
PHILANDER SMITH COLLEGE 43,414 79 175,778 91 449,193 475
RUST COLLEGE 268,359 447 532,000 634 1,630,941 634
SAINT AUGUSTINE'S COLLEGE 401,430 601 562,273 722 2,683,976 1,078
SAINT PAUL'S COLLEGE 305,260 459 51,025 131 760,580 397
SHAW UNIVERSITY220,125 334 1,219,926 983 2,080,588 1,029
SPELMAN COLLEGE 136,816 207 8,000 5 983,225 650
STILLMAN COLLEGE 234,249 352 273,250 299 888,673 592
TALLADEGA COLLEGE 161,196 295 126,998 176 721,023 410
TEXAS COLLEGE 153,164 211 57,359 151 1,020,348 632
TOUGALOO COLLEGE 122,389 281 325,269 399 1,163,194 761
TUSKEGEE INSTITUTE 432,436 848 150,000 200 4,088,685 3,021
VIRGINIA UNION UNIVERSITY 369,135 537 48,195 85 1,204,920 918
VOORHEES COLLEGE 585,167 437 562,251 482 1,718,462 803
WILBERFORCE UNIVERSITY 648,312 832 817,292 497 3,202,753 983
WILEY COLLEGE 123,357 184 353,743 335 1,005,939 469
XAVIER UNIVERSITY 509,253 882 101,157 338 1,888,330 1,261
TOTAL $ 10,851,345 13,711 $ 14,665,547 15,922 $ 59,709,451 33,127
PERCENTAGL u. 1L 18.2 24.6
4950

UNCF Campur. Campaigns
Since UNCF does not collect giving information by of the
mot. significant indicators of black giving to the College l'und is the UNCF
campus campaign. In 1975 the faculties at UNCF institutions contributed
$155,171, a 23% increase over the previous year. UNCF students in 1975
raised a total of $137,008 for a 25% increase over 1974 (Table XXVIII).
The total amount raised by UNCF students and faculties accounted for 2.4%
of the total raised by UNCF from all sources in the 1975 campaign.
Alumni Giving
Contributions from alumni have increased dramatically at UNCF
institutions. Between 1973-74 and 1974-75 contributions rose 37.2%; and
from 1968-69 to 1974-75 contributions rose 94%. Such a substantial in-
crease appears to indicate a greater commitment on the part of alumni
toward maintaining and strengthening the quality of education at their
alma maters.
TABLE XXVII
Alumni Giving and UNCF Campus Campaigns1968-69, 1973-74 and 1974-75
1968-69 1973-74 1974-75
Amount Index Amount Index Amount Index
UNCF Faculty Campaign $ 90,816 100 $ 134,298 148 $ 155,171 171UNCF Student Campaign 107,078 100 109,862 103 137,008 128Alumni Giving 812,760 100 1,147,513 141 1,572,564 194
-40-
51

UNCFINSTITUTIONS
TABLE XXVIII
Alumni Giving and UNCF Campus Campaigns1974-75
Faculty StudentsATLANTA UNIVERSITYBARBER-SCOTIA COLLEGEBENEDICT COLLEGEBENNETT COLLEGEBETHUNE COOKMAN COLLEGEBISHOP COLLEGECLAFLIN COLLEGECLARK COLLEGEDILLARD UNIVERSITYFISK UNIVERSITYFLORIDA MEMORIAL COLLEGEHUSTON TILLOTSON COLLEGEINTERDENOM. THEO. CENTERJARVIS CHRISTIAN COLLEGEJOHNSON C. SMITH UNIVERSITYKNOXVILLE COLLEGELANE COLLEGELEMOYNE-OWEN COLLEGELIVINGSTONE COLLEGEMILES COLLEGEMOREHOUSE COLLEGEMORRIS BROWN COLLEGEOAKWOOD COLLEGEPAINE COLLEGEPAUL QUINN COLLEGEPHILANDER SMITH COLLEGERUST COLLEGESAINT AUGUSTINE'S COLLEGESAINT PAUL'S COLLEGESHAW UNIVERSITYSPELMAN COLLEGESTILLMAN COLLEGETALLADEGA COLLEGETEXAS COLLEGETOUGALOO COLLEGETUSKEGEE INSTITUTEVIRGINIA UNION UNIVERSITYVOORHEES COLLEGEWILBERFORCE UNIVERSITYWILEY COLLEGEXAVIER UNIVERSITY
$ 5,9453,700
2432,500
15,00020,500
3,692
-0-7,862
750398
10,5272,943
5,0071,0053,0054,6561,7389,546NRNR
10,000195
-0-4,500NR
2,000NR
1,9205,0001,0211,100
548
5,1981,2006,4702,392NR340
9,0005,210
$ -0-6,140
757
2,0008,412
24,9909,230
928929
-0-700
15,5902,000
43
4,0202,0001,435
4,3852,978
NRNR500-0-
1,032
750
19,6917,500
NR631
1,000
5001,2302,814
3,2754,590
423
525NR10
6,000-0-
TOTAL $155,171 $137,008
Alumni
$ 1,950
1,600141,C93
45,978106,01692,00047,50054,78912,80482,000
38526,1572,0001,624
742,43862,67834,923
30,38762,147
36,76091,00027,11312,36217,0664,300
13,06341,16627,19228,405
33,576NR
4,57034,74915,82255,673
75,16065,61915,61050,04035,12141,678
$1,572,564
NR - No ResponLe
-41-
5 2
APPENDIX A:
UNCF Member Institutions'
Participation in the
Dual-Degree Engineering
Program
5 3
-42-

UNCF INSTITUTIONS
WITH
DUAL DEGREE PROGRAMS IN ENINEERING
UNCF INSTITUTION ESTABLISHED
1. Bennett 1976
2. Bethune-Cookman 1967
3. Bishop 1970
4. Clark 1969
5. Dillard 1974
6. Fisk 1970
Huston-Tillotson 1974
8. Johnson C. Smith 1972
9. Knoxville 1966
10. Miles 1976
11. Morehouse 1969
12. Morris Brown 1969
13. Oakwood 1969
14. Rust 1971
15. St. Augustine's 1974
16. Shaw 1969
17. Spelman 1969
18. Talladega 1972
ADVISOR OR DIRECTOR
Dr. Mattie Moss
Dr. Frank Radosta
Dr. Angelia Esquivel
Dr. William W. Sutton
Dr. George Neely, Jr.
Ms. Marian Whitson
Dr. Charles Merideth
Dr. Frank Weaver
Dr. Allen Brush
Dr. Rodger N. Jenkins
5 4 Dr. Jerry Breecher
-44-
COOPERATINCENGINEERING SCHOOL
North CarolinaA & T University
Tuskegee & Universityof Florida
Southern MethodistUniversity
Georgia Tech
Columbia Univ. Sch.of Engineering
Vanderbilt Univ.Sch. of Engineering
University of Texasat Austin
University of N.C.at Charlotte
University of Tenn.
Tuskegee
Georgia Tech.
Georgia Tech.
Tuskegee
Georgia Tech &Tuskegee
N. C. State Univ.at Raleigh
N. C. State Univ.at Raleigh
Georgia Tech.
Tuskegee

UNCF INSTITUTION ESTABLISHED ADVISOR OR DIRECTOR COOPERATINGENGINEERING SCHOOL
19. Virginia Union 1974 Dr. Clara McCreary Howard & Universityof Michigan
20. Wilberforce 1973 Univ. of Dayton
21. Xavier 1964 Dr. Harold Vincent Univ. of Detroit;Univ. of NewOrleans & Tulane
5 5
-45-

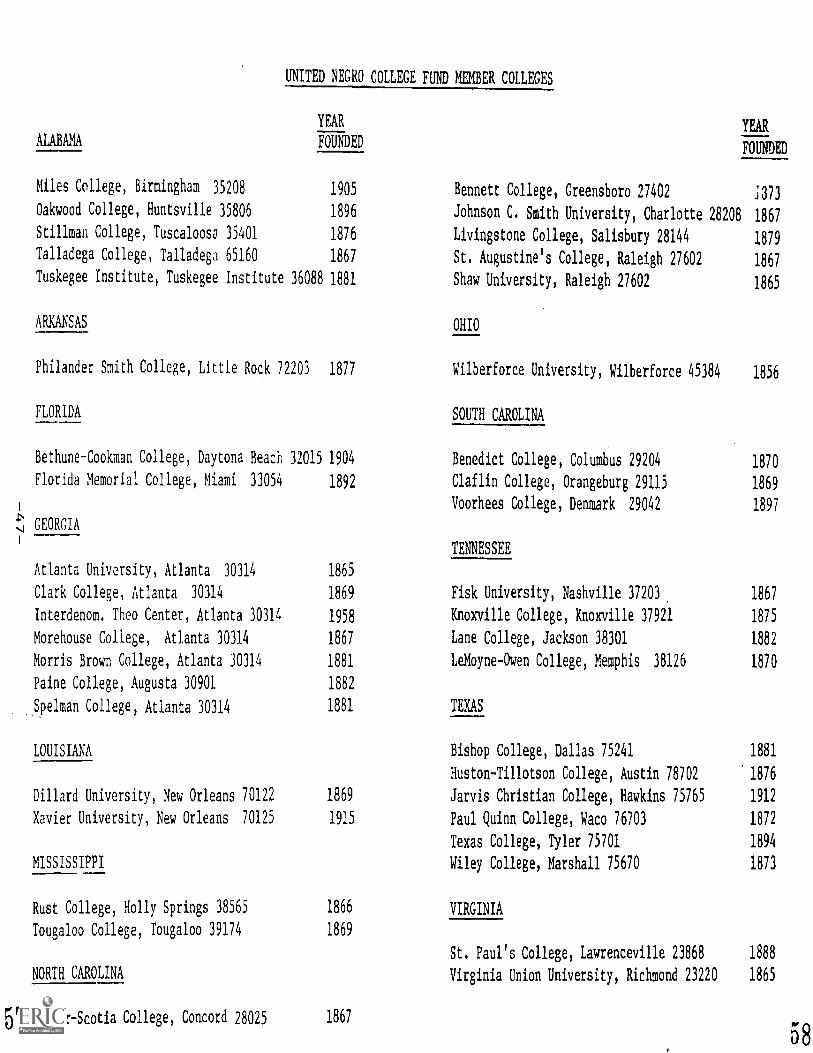
APPENDIX B:
List of UNCF
Member Institutions
5 6
-46-
ALABAMA
UNITED NEGRO COLLEGE FUND MEMBER COLLEGES
YEAR
FOUNDED
Miles College, Birmingham 35208 1905
Oakwood College, Huntsville 35806 1896
Stillman College, Tuscaloosa 35401 1876
Talladega College, Talladega 65160 1867
Tuskegee Institute, Tuskegee Institute 36088 1881
ARKANSAS
Philander Smith College, Little Rock 72203 1877
FLORIDA
Bethune-Cookman College, Daytona Beach 32015 1904
Florida Memorial College, Miami 33054 1892
GEORGIA
Atlanta University, Atlanta 30314
Clark College, Atlanta 30314
Interdenom. Theo Center, Atlanta 30314
Morehouse College, Atlanta 30314
Morris Brown College, Atlanta 30314
Paine College, Augusta 30901
Spelman College, Atlanta 30314
LOUISIANA
Dillard University, New Orleans 70122
Xavier University, New Orleans 70125
MISSISSIPPI
1865
1869
1958
1867
1881
1882
1881
YEAR
FOUNDED
Bennett College, Greensboro 27402 1373
Johnson C. Smith University, Charlotte 28208 1867
Livingstone College, Salisbury 28144 1879
St. Augustine's College, Raleigh 27602 1867
Shaw University, Raleigh 27602 1865
OHIO
Wilberforce University, Wilberforce 45384 1856
SOUTH CAROLINA
Benedict College, Columbus 29204 1870
Claflin College, Orangeburg 29115 1869
Voorhees College, Denmark 29042 1897
TENNESSEE
Fisk University, Nashville 37203
Knoxville College, Knoxville 37921
Lane College, Jackson 38301
LeMoyne-Owen College, Memphis 38126
TEXAS
Bishop College, Dallas 75241
Huston-Tillotson College, Austin 78702
1869 Jarvis Christian College, Hawkins 75765
1915 Paul Quinn College, Waco 76703
Texas College, Tyler 75701
Wiley College, Marshall 75670
Rust College, Holly Springs 38565 1866
Tougaloo College, Tougaloo 39174 1869
NORTH CAROLINA
57 Barber-Scotia College, Concord 28025 1867
VIRGINIA
1867
1875
1882
1870
1881
1876
1912
1872
1894
1873
St. Paul's College, Lawrenceville 23868 1888
Virginia Union University, Richmond 23220 1865