not for release to us wire services or distribution in …...2019/05/14 · asx announcement 14 may...
TRANSCRIPT

ASX Announcement14 May 2019
Not for release to US wire services or distribution in the United States
Pantoro Acquires a 50% Share in the World-Class Central Norseman Gold ProjectPantoro Limited (ASX:PNR) (Pantoro) through its wholly owned subsidiary Pantoro South Pty Ltd has executed a binding agreement to acquire a 50% share of the Central Norseman Gold Project (the Transaction). The Transaction will be funded via existing cash reserves, ongoing cash-flow from Pantoro’s Halls Creek operations, and a A$43 million fully underwritten placement. The Transaction will result in Pantoro owning two very high grade and highly productive gold regions in the desirable jurisdiction of Western Australia.
Key Points
• Pantoro to acquire a 50% interest in the Central Norseman Gold Project (CNGP) which contains a current JORC compliant Mineral Resource of 4.4 million ounces of gold.
• Pantoro will form an unincorporated joint venture (UJV) with Central Norseman Gold Corporation Pty Ltd and its subsidiary (Vendor) whereby Pantoro, upon signing of the agreement will immediately take management control of the CNGP, including mining tenements and infrastructure with a focus on returning CNGP to production in the near term.
• The purchase consideration is staged as follows:
— A$10 million in cash, with A$2.5 million deposit payable to the Vendor on signing of the binding legal document and the balance payable on Completion.
— A$20 million equivalent in Pantoro common shares payable to the Vendor on Completion.
— Deferred cash payments to the Vendor comprising A$5 million payable 12 months after Completion and A$10 million payable 24 months after Completion.
— Pantoro to sole fund the first A$50 million of project expenditure.
— 1% Net Smelter Royalty to the Vendor on Pantoro’s attributable gold and silver produced from CNGP, capped at a total of A$6 million plus a 0.0025% royalty for a period of 5 years after the first A$6 million is paid.
— A$10 million milestone payment to the Vendor upon definition of 1.8 Moz JORC Ore Reserve.
• The Transaction cost equates to approximately A$39 per ounce for Pantoro’s attributable 50% share (2.2 Moz of gold Mineral Resource).
• CNGP is amongst the highest grade goldfields mined in Australia with historic production exceeding 5.5 million ounces of gold since discovery in 1894.
• CNGP includes a tenement package covering approximately 70 km of strike along the highly productive CNGP-Wiluna greenstone belt and currently has approximately 35 separate Mineral Resources modelled. A number of the Mineral Resources are near-development ready and initial works are to be focused on transition to production as soon as possible.
• Originally one of Western Mining’s key gold production regions from 1935 until 2002, the CNGP was divested along with the remainder of Western Mining’s gold division around that time. Little systematic exploration has been undertaken since the late 1990’s.
• Much of the CNGP tenure lies under Lake Cowan where historical exploration is limited. The CNGP is considered to be highly prospective for discovery of multiple +1 million ounce deposits.
Pantoro LimitedABN 30 003 207 467
t: +61 8 6263 1110 | e: [email protected] | w: www.pantoro.com.auPO Box 1353 West Perth WA 6872 | 1187 Hay Street, West Perth WA 6005
For
per
sona
l use
onl
y
• Forfeiture applications over the tenure have been settled and the project tenements will be delivered to Pantoro clear of any such encumbrances at Completion.
• The Transaction provides Pantoro with the unique position of owning the majority of two entire goldfield regions in Western Australia, both with outstanding exploration upside potential, and known very high grade Mineral Resources with similar geological properties.
• CNGP has a number of similarities with Pantoro’s starting position at Halls Creek Project providing leverage to Pantoro’s project development and operational skills. The majority of the required infrastructure for mining is already in place, existing Mineral Resources are available for development, and mineralisation style is similar to Halls Creek.
• Completion is subject to satisfaction of key conditions customary for a transaction of this nature.
Commenting on the acquisition, Managing Director Paul Cmrlec said:
“The board is delighted to have secured this outstanding opportunity for our shareholders. Following an extensive review of acquisition opportunities during the past two years, CNGP was a clear standout for Pantoro with large, high grade Mineral Resources, and extensive infrastructure already in place at company, local shire and national government infrastructure levels.
The acquisition cost of less than $40 per attributable Mineral Resource ounce is an enviable metric which provides Pantoro with the opportunity to add significant shareholder value in the immediate term.
It is rare to find a project which provides a large, high grade mineral resource which is infrastructure rich in our own back yard. With existing operations in Western Australia, Pantoro’s intimate knowledge of legislation and operational requirements is a clear advantage in recommencing gold production from the area.
There are many synergies with Pantoro’s acquisition and development of the Halls Creek Project approximately 5 years ago. Both projects have outstanding Mineral Resources which are amongst the highest grade in Australia, and mineralisation styles are very similar allowing Pantoro to leverage its project skills that has been highly successful in applying at Halls Creek. Like Halls Creek, CNGP is infrastructure rich with a major National highway adjacent to the project, active railway infrastructure servicing the Esperance port 200km to the south, a sealed air strip, a regional hospital and schooling to year 12.
At the CNGP level, there is a processing plant which last operated in 2016, road infrastructure with formed roads to all Mineral Resource areas, an accommodation camp and housing, a fully operational power station, water supply infrastructure and several office and work shop complexes.
Access to the existing infrastructure provides value to the CNGP, and will ultimately reduce the development cost considerably, just as it did in the development of Halls Creek. Our team will immediately focus work on defining, developing and operating a large scale gold production hub within the next 12 to 18 months.
On behalf of the Pantoro board, I would like to thank CNGP Chairman Kevin Maloney and his team for the faith and trust that they have placed in Pantoro. Pantoro looks forward to delivering a high value gold production project for the benefit of both companies.”
Enquiries
Paul Cmrlec | Managing Director I Ph: +61 8 6263 1110 I Email: [email protected]
Page 2
For
per
sona
l use
onl
y

CNGP OverviewCNGP is located in the Eastern Goldfileds of Western Australia, at the southern end of the highly productive Norseman-Wiluna greenstone belt. The project lies approximately 725 km east of Perth, 200 km south of Kalgoorlie, and 200 km north of Esperance.
The current Mineral Resource is 4.4 million ounces of gold contained in approximately 35 separate Mineral Resources. The majority of the Mineral Resources defined to date remain open along strike and at depth, and many of the Mineral Resources have only been tested to shallow depths. Mineral Resources have been estimated by Independent Expert HGS Australia Exploration Services. The Competent Person for the Mineral Resource is Mr Andrew Hawker of HGS Australia Exploration Services.
A number of the existing Mineral Resources are considered by Pantoro to be near-development ready, and Pantoro will immediately focus on establishing a clear production development plan, and execution of that plan. The aim will be to initially establish operations supporting production of 100,000 ounces per annum, expanding to 200,000 ounces per annum over the following 2 – 4 years.
In addition, there are numerous anomalies and mineralisation occurrences which are yet to be tested adequately to be placed into Mineral Resources.
CNGP is one of Western Australia’s great gold fields, discovered during the 1890 gold rushes in the area. In 1935, Western Mining established large scale operations at CNGP, and continued to operate the project until it decided to divest its Western Australian gold projects in the mid 1990’s. Western Mining held the project in joint venture with Central Norseman Gold, holding 50.1% of the company.
The project was sold to Croesus Mining in 2002, and operated successfully despite low gold prices until 2006. With two additional gold projects, Croesus took on hedging contracts in the low gold price environment and were unable to meet the hedging commitments following closure of the other operations. Historical reports indicate that CNGP generally operated profitably during the period, but was unable to fulfil the hedge position once the company’s other assets were closed or disposed.
CNGP has produced over 5.5 million ounces of gold since operations began in 1935, and is one of, if not the highest grade field within the Yilgarn Craton.
CNGP comprises 146 near-contiguous mining tenements, most of which are pre-1954 Mining Leases which are free of native title. The tenure covers some 70 kilometres of the highly prospective Norseman – Wiluna greenstone belt covering more than 1,000 square kilometres. Forfeiture applications over the tenure have been settled, and the tenements will be delivered to Pantoro in a clean and clear condition at Completion.
The CNGP is serviced by first class infrastructure at the project, local shire, and national infrastructure levels. Infrastructure includes:
Project• 720,000 tonne per annum processing plant last operated in 2016;• Operational power station which services the project and the town of Norseman;• Operational site laboratory;• Extensive road infrastructure, including a number of sealed roads;• Accommodation camp (ownership retained by the Vendor but available for use by the joint venture at market
rates);• Office and workshop infrastructure; and• Extensive critical spares, fixed underground mining plant and equipment and mobile equipment.
Local Infrastructure• Sealed airstrip;• Hospital;• Scheme water;• Town services such as a hotel, road house and extensive housing; and• Supporting, mining orientated local community.
Page 3
For
per
sona
l use
onl
y
National infrastructure• Adjacent to the national highway system with direct access to Kalgoorlie, Esperance and Perth;• Operational railway servicing Esperance Port and an active rail siding in Norseman; and• Bulk and container port facilities 200 km south in Esperance;
Transaction Structure
The acquisition of 50% of CNGP has been structured to limit upfront payment to the Vendor and to maximise project funding to support rapid development of the project.
Pantoro’s total consideration for the UJV holding comprises:
• A$10 million in cash, with A$2.5 million deposit payable to the Vendor on signing of the binding legal document and the balance payable on Completion.
• A$20 million equivalent in Pantoro common shares payable to the Vendor on Completion.
• Deferred cash payments to the Vendor comprising A$5 million payable 12 months after Completion and A$10 million payable 24 months after Completion.
• Pantoro to sole fund the first A$50 million of project expenditure.
• 1% Net Smelter Royalty to the Vendor on Pantoro’s attributable gold and silver produced from CNGP, capped at a total of A$6 million plus a 0.0025% royalty for a period of 5 years after the first $6 million is paid.
• A$10 million milestone payment to the Vendor upon definition of 1.8 Moz JORC Ore Reserve.
The issue of A$20 million of shares to the Vendor will be priced at the lower of the 20 trading day VWAP of the Pantoro share price prior to signing the agreement, and the Offer Price. On that basis, the issue of shares to the Vendor will be issued at $0.20 per share with allotment subject to shareholder approval on or around 1 July 2019.
The Transaction is subject to satisfaction of a number of conditions which are customary for a transaction of this nature. Pantoro believes that all conditions will be satisfied in the near term, and both parties are working to ensure completion in the shortest possible time.
Pantoro is the manager of the unincorporated joint venture and takes control of the site immediately upon execution of the agreement. Expenditure undertaken pre-settlement is part of the sole funding requirement and is immediately refundable by the Vendor if settlement does not occur for any reason.
Funding
The Transaction and development of CNGP is to be funded using a combination of Pantoro’s existing cash reserves, ongoing cashflow from Pantoro’s Halls Creek operations, A$20 million scrip issued to the Vendor and a A$43 million fully underwritten placement.
The placement will issue approximately 215 million fully paid ordinary shares in the Company (Placement Shares) to professional and sophisticated investors at an offer price of A$0.20 per Placement Share (Offer Price) in accordance with ASX Listing Rules 7.1 and 7.1A (Placement).
The Offer Price of A$0.20 per Placement Share represents a 9.1% discount to the last closing price of A$0.22 on 14 May 2019 and 13.0% discount to the 20 day VWAP of A$0.23.
Settlement of the Placement Shares will occur on Tuesday, 21 May 2019, with allotment scheduled for Wednesday, 21 May 2019. Placement Shares will rank equally with existing ordinary shares.
The Placement is joint lead managed by Bell Potter Securities Limited, Argonaut Securities Pty Limited and Hartleys Limited. Bell Potter Securities Limited is the exclusive and sole bookrunner and underwriter.
Page 4
For
per
sona
l use
onl
y

Indicative Timetable
The intended acquisition and placement time table is set out in the table below. Factors affecting the time table maybe outside of the company’s control, and the company reserves the right to modify the time table as necessary.
Event DateTrading halt and announcement of the Transaction and Placement
After-market Tuesday, 14 May 2019
Placement bookbuild Wednesday, 15 May – Thursday, 16 May 2019Trading halt lifted and Pantoro shares recommence trading on ASX
Friday, 17 May 2019
Settlement of Placement Tuesday, 21 May 2019Allotment of new shares under the Placement Wednesday, 22 May 2019General Meeting to approve the issue of shares to the Vendor
Monday, 1 July 2019
* Dates and times above are indicative only and subject to change
Additional Information
Further details of the Transaction are set out in the investor presentation also provided to ASX today. The investor presentation contains important information including the terms and effects of the Transaction, key risks and foreign selling restrictions with respect to the Placement. Any person considering an investment in Pantoro should read the investor presentation and seek his or her own independent advice before making any decision in this regard.
Conference call
Investors are invited to join a conference call hosted by Paul Cmrlec, Managing Director, on Wednesday, 15 May at 11:00am Sydney time.
To access the call please use the numbers below:
Australia: 1800 685 494International: +613 8687 0650
Enquiries
Paul Cmrlec | Managing Director I Ph: +61 8 6263 1110 I Email: [email protected]
Page 5
For
per
sona
l use
onl
y

Summary InformationThe following disclaimer applies to this announcement and any information contained in it (the Information). The Information in this announcement is of general background and does not purport to be complete. It should be read in conjunction with Pantoro’s other periodic and continuous disclosure announcements lodged with ASX Limited, which are available at www.asx.com.au. You are advised to read this disclaimer carefully before reading or making any other use of this announcement or any Information contained in this announcement. In accepting this announcement, you agree to be bound by the following terms and conditions including any modifications to them.
Forward Looking StatementsThis announcement may include forward-looking statements. These forward-looking statements are based on Pantoro’s expectations and beliefs concerning future events. Forward looking statements are necessarily subject to risks, uncertainties and other factors, many of which are outside the control of Pantoro, which could cause actual results to differ materially from such statements. Pantoro makes no undertaking to subsequently update or revise the forward-looking statements made in this announcement, to reflect the circumstances or events after the date of this announcement.
Not for release to US wire services or distribution in the United StatesThis announcement has been prepared for publication in Australia and may not be released to US wire services or distributed in the United States. This announcement does not constitute an offer to sell, or a solicitation of an offer to buy, securities in the United States or any other jurisdiction. Any securities described in this announcement have not been, and will not be, registered under the US Securities Act of 1933 and may not be offered or sold in the United States except in transactions exempt from, or not subject to, the registration requirements of the US Securities Act and applicable US state securities laws.
Competent Person StatementThe information in this report that relates to Exploration Targets, Exploration Results and Mineral Resources is based on information compiled by Mr Andrew Hawker (B.Sc. (Hons)), a Competent Person who is a Member of the Australian Institute of Geoscientists. Mr Hawker is an independent consultant to CNGP and is a director of HGS Australia Exploration Services which is the entity providing services to CNGP. HGS Australia Exploration Services is retained by CNGP under industry standard commercial consulting rates. Mr Hawker has sufficient experience that is relevant to the style of mineralisation and type of deposit under consideration and to the activity being undertaken to qualify as a Competent Person as defined in the 2012 Edition of the‘ Australasian Code for Reporting of Exploration Results, Mineral Resources and Ore Reserves. Mr Hawker consents to the inclusion in the report of the matters based on his information in the form and context in which it appears.
Page 6
For
per
sona
l use
onl
y
Listing Rule 5.8.1 Additional Information
Geology and Geological Interpretation
The Norseman gold deposits are located within the southern portion of the Eastern Goldfields Province of Western Australia in the Norseman-Wiluna greenstone belt in the Norseman district. Deposits are predominantly associated with near north striking easterly dipping quartz vein within metamorphosed Archean mafic rocks of the Woolyeenyer Formation located above the Agnes Venture slates which occur at the base.
The principal units of the Norseman district, are greenstones which are west dipping and interpreted to be west facing. The sequence consists of the Penneshaw Formation comprising basalts and felsic volcanics on the eastern margin bounded by the Buldania granite batholith, the Noganyer Iron Formation, the Woolyeenyer formation comprising pillow basalts intruded by gabbros and the Mount Kirk Formation a mixed assemblage.
The mineralisation is hosted in quartz reefs in steeper shears and flatter linking sections, more recently significant production has been sourced from NNW striking reefs known as cross structures (Bullen). Whilst a number of vein types are categorized the gold mineralisation is predominantly located in the main north trending reefs which in the Mainfield strike for over a kilometre. The quartz/sulphide veins range from 0.5 metres up to 2 metres thick, these veins are zoned with higher grades occurring in the laminated veins on the margins and central bucky quartz which is white in colour. Bonanza grades are associated with native gold and tellurides with other accessory sulphide minerals being galena, sphalerite, chalcopyrite, pyrite and arsenopyrite.
The long running operations at Norseman have provided a good understanding on the controls of mineralisation as well as the structural setting of the deposits. The overall geology of the Norseman area is well understood with 3D Fractal Graphic mapping and detailed studies, adding to a good geological understanding to the area. The geometry of the main lodes at Norseman are well known and plunge of shoots predictable in areas, however large areas remain untested by drilling with the potential for new spurs and cross links high. Whilst the general geology of lodes is used to constrain all wireframes, predicting continuity of grade has proven to be difficult at the higher grades when mining and in some instances (containing about 7% of the ounces) subjective parameters have been applied.
Drilling Techniques
A variety of drilling techniques were used to test the Norseman deposits, utilising a combination of surface and underground drilling using RC, AC and Diamond drilling techniques. Extensive air core drilling has been carried out on the lake surface, however these results were used to delineate the ore body and are not used in the Mineral Resource estimates. Underground drilling has been completed using pneumatic and electric hydraulic drill rigs with standard core LTK46 and LTK48 both with the same nominal core size of 38mm. For surface diamond drilling, the standard core size used was NQ2 which has an inside diameter of 79mm. HQ has only been used for drilling partially weathered material from the near surface areas at the top of the system or the pre-collar in order to put in place the casing.
Sampling Techniques, Sub-Sampling Techniques and Sample Preparation
Diamond Core
Sampling of surface and underground diamond drilling is carried out using half core, and sampled so that the sample intervals match geological intervals and veins. Small veins, less than 20cm core length, have insufficient sample for assay. These intersections are bulked out to 20cm core length and dilution is included in the assay. Core was halved using a diamond saw, with half sent for analysis and half retained. The retained component is stored on core racks in a core farm on site. Sampling of diamond holes generally follows geological intervals, such as veins that are sampled discreetly and don’t include wall rock dilution. Exceptions to this procedure occurred where veins were too small to provide sufficient material for assaying. Intersections of this type were bulked out to 10 or 20 cm lengths and dilution was included in the assay. The core was halved with a diamond saw with half sent for analysis and half retained.
Reverse Circulation Samples
Reverse Circulation drill holes were sampled as a 2-3 kg split via a splitter attached to the cyclone assembly of the drill rig.
Page 7
For
per
sona
l use
onl
y
Underground Face sampling
Routine underground face sampling was conducted across the face of ore drives, nominally 2-2.5m. A scaled drawing of the face is completed by the site geologists, which includes measurements and other relevant details. Underground face samples are taken from discrete geological lithologies perpendicular to the strike, whilst the quartz vein is usually chipped out with a geological hammer to produce an equivalent “channel sample”. A 2 kg representative sample is collected for each lithology.
Sample Analysis Method
Drill Core
Very old assays would have been done on site using fire assay techniques. The largest component of the Resources using these assays would have been the Crown Reef, North Royal underground, parts of the Mararoa and the deeper areas of OK. Assays prior to June 1996 were sent to the WMC laboratory in Kalgoorlie. From July 1996 assays were sent to Analabs in Perth. Assaying procedures changed with the change in laboratory. Samples that were expected to assay well, were subjected to bulk pulverisation with duplicate assays at the WMC Laboratory and Screen Fire assaying at Analabs. The routine assaying method for other samples was aqua regia digest at WMC and fire assay at Analabs. The bulk pulverisation routine used at the WMC Laboratory involved milling the entire sample to a nominal -75µm. Duplicate samples were split from the milled material and the sample was analysed using aqua regia digest and an atomic absorption finish. At Analabs the total sample was dried and milled in an LM5 mill to a nominal 90% passing -75µm. An analytical pulp of approximately 200g was sub sampled from the bulk and the milled residue was retained for future reference. All the preparation equipment was flushed with barren feldspar prior to the commencement of the job. A 50 gram sample was fused in a lead collection fire assay. The resultant prill is dissolved in aqua regia and the gold content of the sample is determined by AAS. For samples that contained visible free gold the screen fire assay method was used. It involved a 1000g sample screened through a 106µm mesh. The resulting plus and minus fractions were then analysed for gold by fire assay. Information reported included size fraction weight, coarse and fine fraction gold content and calculated gold.
From early 2000 the drill core samples have been sent to Kalgoorlie Assay Labs to be sampled using an accelerated Cyanide leach on the hierarchy of sample sizes, depending on the initial sample weight. If insufficient sample was present a fire assay on the tails was performed. A fire assay on the tails was done on all assays over 1g/t and any others to have a minimum of 10% with a fire assay on the tails.
From January 2002 the surface drill core samples had been sent to Ultratrace Laboratories in Perth, where the leachwell technique was used, the underground drilling samples continued to go to Kalgoorlie Assay Labs as previously. At Ultratrace after drying and pulverising, the samples were rolled for 12 hours in a cyanide solution, before gold in the resultant solution was determined by Inductively Coupled Plasma (ICP) Mass Spectrometry (MS). Samples that assayed greater than 0.100 ppm Au were then re-analysed using the Mini-BLEG technique, where a 50 gram sub-sample was subjected to a 2 hour semi-static leach in a cyanide solution, ICP-MS was used to determine gold. Samples that assayed over 1.00 ppm Au were subjected to a 40 gram fire assay “tail” using a sub-sample of the dried leachwell material, in order to pick up any gold that was missed during the cyanide leaching process.
From 2010-2011 underground drill core was sent to SGS and Amdel. SGS used an accelerated cyanide leach technique (leachwell), where a 400g sample was mixed with 600ml of water and a leachwell tablet added. This was mix rolled for 2 hours. Liquor was drawn off and analysed using an AAS with DIBK finish. Samples > 1g/t had residue fire assayed.
Face Samples
From the commencement of the mine until late 1995 the assaying was done on site and with the demise of the on site laboratory the samples were sent to Silver Lake lab at Kambalda. From November 2001 the samples were sent to Analabs in Kalgoorlie, subsequently owned and operated by the SGS group. The samples have always been fire assayed with various charge weights (generally either 30 or 50g). The method was (using the SGS codes) DRY11 (sample drying, 105°C), CRU24 (crush > 3.5kg, various mesh sizes per kg), SPL26 (riffle splitting, per kg), PUL48 (pulv, Cr Steel, 75µm, 1.5 to 3kg), FAA505 (AU FAS, AAS, 50g) (two of these were performed), and WST01 (waste disposal).
Page 8
For
per
sona
l use
onl
y

In 2011 all face samples and core were sent to Amdel in Kalgoorlie. The total sample was dried and milled in an LM5 mill to a nominal 90% passing 75μm. An analytical pulp of approximately 200 g was sub sampled from the bulk and the milled residue was retained for future reference. All the preparation equipment was flushed with barren feldspar prior to the commencement of the job. A 50 gram sample was fused in a lead collection fire assay. The resultant prill was dissolved in aqua regia and the gold content of the sample was determined by AAS.
In general the assaying procedures have been an attempt to prevent under estimation of the total contained gold. Where aqua regia was used, it probably under estimated the grade.
In summary all samples used in the Resource estimation have either been obtained from fire assaying using a minimum 30g charge, in some instances a cyanide leach with tail assay, screen fire assays and aqua regia. The aqua regia method probably understated the grade. No assay data was adjusted
Estimation Methodology
All resources, except Lady Miller, were conducted using Surpac. Lady Miller was conducted using Datamine.
The majority of resources were interpolated using Ordinary Kriging with inverse distance interpolations as a check.
Grade cutting and block sizes are applied as outlined in Appendix 1. This is based on an examination of face sample and drillhole data distribution.
The Resource is not factored to reflect production due to difficulties of reconciliation with individual lodes and mining outside of stated Resources. 90% of the reported Resource ounces are based on historically audited models with limited supporting documentation or block models. Surface or near surface models have lower cut of 0.5g/t, 0.7g/t or 1.0g/t. Updated underground resources have a lower cut of 4.0g/t Historical underground resources, Ajax, Bullen, Crown and OK, have lower cut at 9g/t
Classification
This current Mineral Resource Estimate has been classified as Measured, Indicated and Inferred Mineral Resources. A Measured Resource at Norseman is only stated where it has been developed, identifying tonnage, density, shape, physical characteristics and grade with a high level of confidence. This is based on areas which have underground development.
An Indicated Mineral Resource (usually 40m x 40m drilling) at Norseman has a satisfactory level of geological data and confidence in geological interpretation. In some cases the drill hole spacing down dip or up dip may not be as close as would normally be required to assign an Indicated classification however the continuity of the structure and validation of the existing intersections are demonstrated by proximal existing workings.
An Inferred Mineral Resource at Norseman is defined by an inadequate number of drill holes to meet the Indicated classification, or widely spaced drill holes in an ore solid wireframe (generally greater than 40m by 40m spacing) and up to 80m. Previously noted was the fact that drilling (usually on a sparse grid of 40m x40m) understates the ounces mined in the subsequent mined areas. Historically at Norseman for every 10 holes drilled in what later proved to be ore zones (through development and mining) only 3-4 holes showed values >1g/t. Hence in some sparsely drilled areas larger extensions are used in the Inferred category to reflect this well established underestimation fact at Norseman.
Any Resource estimate with less than 5,000 ounces has been removed from the reported Underground Resources.
Pillars
High grade pillars at Crown Reef have been severely cut. (An approximate 50% recovery has been applied, taking into consideration the high grade cut applied (50g/t) and the reduced bulk density used.
Limited pillars have been included at Harlequin and OK. This has been achieved by the use of the higher cut off grade in the upper areas of the mine and use of lower recoveries in the deeper portions of Harlequin and Perch (50% recovery). Remnant recoveries have also been reduced (20% in Perch, 40% in Redfin).
Page 9
For
per
sona
l use
onl
y

Cut-off Parameters
The Mineral Resource has been reported for surface or near surface models at a lower cut of 0.5g/t, 0.7g/t or 1.0g/t. Updated underground Mineral Resources have a lower cut of 4.0g/t Historical underground Mineral Resources, Ajax, Bullen, Crown and OK, have lower cut at 9g/t.
Mining and Metallurgical Factors or Assumptions
Historically underground estimates for Mineral Resources were based on underground airleg mining using a room and random pillar method. In 2011-2012 longhole mining was considered to be viable and applied at both Harlequin and OK mines. This resulted in a lower cut off grade being used for Resource estimation (a diluted 2g/t for the marginal cut off grade) but when mining, the dilution increased due to overbreak thus increasing the minimum mining width. In 2013 the preferred method of mining was airleg T-bone stoping. While this minimized dilution it has resulted in a higher cost and higher cut off grade at a reduced cost per ounce.
For Open Pit cut off grades refer to Appendix 1 of the Table 1 included in this .
Ore at Norseman is generally free milling with the majority of the gold being recovered by the gravity circuit. Some ore processed in the past (from satellite pits) has been associated with elevated amounts of pyrite leading to lower recoveries. The milling process is as follows:
Run of mine (ROM) ore from stockpiles is fed into a primary crusher by front end loader. Crushed ore feeds a two stage milling circuit made up of a SAG mill, ball mill and also includes a pebble crusher for SAG mill oversize. Coarse gold is removed during grinding by two centrifugal gravity concentrators. The gravity gold recovered accounts for typically over 60% of gold in ore feed.
Lime and sodium cyanide additions are made to the ground slurry and gold is leached from the ore in six air agitated Pachuca style tanks. Carbon is used in the last five tanks for absorption of soluble gold from the slurry. Gold is recovered from carbon in a conventional elution and electrowinning circuit. CIL gold together with the gravity gold is smelted to produce gold dore bars for export from the site.
Page 10
For
per
sona
l use
onl
y

1
JORC Code, 2012 Edition – Table 1
Section 1 Sampling Techniques and Data
(Criteria in this section apply to all succeeding sections.)
Criteria JORC Code explanation Commentary
Sampling techniques
• Nature and quality of sampling (eg cut channels, random chips, or specific specialised industry standard measurement tools appropriate to the minerals under investigation, such as down hole gamma sondes, or handheld XRF instruments, etc). These examples should not be taken as limiting the broad meaning of sampling.
• Include reference to measures taken to ensure sample representivity and the appropriate calibration of any measurement tools or systems used.
• Aspects of the determination of mineralisation that are Material to the Public Report.
• In cases where ‘industry standard’ work has been done this would be relatively simple (eg ‘reverse circulation drilling was used to obtain 1 m samples from which 3 kg was pulverised to produce a 30 g charge for fire assay’). In other cases more explanation may be required, such as where there is coarse gold that has inherent sampling problems. Unusual commodities or mineralisation types (eg submarine nodules) may warrant disclosure of detailed information.
• The Norseman Field consists of narrow quartz veins with coarse gold and as such a number of sampling techniques have been carried out over its extensive history. The methods of sampling are typical of those used in the Eastern Goldfields. Reverse Circulation drilling (RC), Aircore (not used in any of the Resource estimation procedures) and Diamond Drilling (DD) have been the preferred methods of surface drilling to obtain samples, whilst underground samples have been generated by Diamond Drilling and channel sampling of faces in both development and stoping. Broken ore samples have been used on occasion to monitor stope and open cut performance but have not been used in Resource estimation procedures.
• Sampling of diamond holes generally follows geological intervals, such as veins that are sampled discreetly and don’t include wall rock dilution. Exceptions to this procedure occurred where veins were too small to provide sufficient material for assaying. Intersections of this type were bulked out to 10 or 20 cm lengths and dilution was included in the assay. The core was halved with a diamond saw with half sent for analysis and half retained.
• Reverse Circulation drill holes were sampled as a 2-3 kg split via a splitter attached to the cyclone assembly of the drill rig.
• Routine underground face sampling was conducted across the face of ore drives, nominally 2-2.5m. A scaled drawing of the face is completed by the site geologists, which includes measurements and other relevant details. Underground face samples are taken from discrete geological lithologies perpendicular to the strike, whilst the quartz vein is usually chipped out with a geological hammer to produce an equivalent “channel sample”. A 2 kg representative sample is collected for each lithology.
For
per
sona
l use
onl
y
2
Criteria JORC Code explanation Commentary
• A large proportion of the Resource is based on historical information generated by WMC. A history of assay procedures is included:
DRILL CORE:
• Very old assays would have been completed on site using fire assay techniques. The largest component of the Resources using these assays would have been the Crown Reef, North Royal underground, parts of the Mararoa and the deeper areas of OK.
• Assays prior to June 1996 were sent to the WMC laboratory in Kalgoorlie. From July 1996 assays were sent to Analabs in Perth. Assaying procedures changed with the change in laboratory.
• Samples that were expected to assay well, were subjected to bulk pulverisation with duplicate assays at the WMC Laboratory and Screen Fire assaying at Analabs. The routine assaying method for other samples was aqua regia digest at WMC and fire assay at Analabs.
• The bulk pulverisation routine used at the WMC Laboratory involved milling the entire sample to a nominal -75µm. Duplicate samples were split from the milled material and the sample was analysed using aqua regia digest and an atomic absorption finish.
• At Analabs the total sample was dried and milled in an LM5 mill to a nominal 90% passing -75µm. An analytical pulp of approximately 200g was sub sampled from the bulk and the milled residue was retained for future reference. All the preparation equipment was flushed with barren feldspar prior to the commencement of the job. A 50 gram sample was fused in a lead collection fire assay. The resultant prill is dissolved in aqua regia and the gold content of the sample is determined by AAS. For samples that contained visible free gold the screen fire assay method was used. It involved a 1000g sample screened through a 106µm mesh. The resulting plus and minus fractions were then analysed for gold by fire assay. Information reported included size fraction weight, coarse and fine fraction gold content and calculated gold.
• From early 2000 the drill core samples have been sent to Kalgoorlie
For
per
sona
l use
onl
y
3
Criteria JORC Code explanation Commentary
Assay Labs to be sampled using an accelerated Cyanide leach on the hierarchy of sample sizes, depending on the initial sample weight. If insufficient sample was present a fire assay on the tails was performed. A fire assay on the tails was done on all assays over 1g/t and any others to have a minimum of 10% with a fire assay on the tails.
• From January 2002 the surface drill core samples had been sent to Ultratrace Laboratories in Perth, where the leachwell technique was used, the underground drilling samples continued to go to Kalgoorlie Assay Labs as previously. At Ultratrace after drying and pulverising, the samples were rolled for 12 hours in a cyanide solution, before gold in the resultant solution was determined by Inductively Coupled Plasma (ICP) Mass Spectrometry (MS). Samples that assayed greater than 0.100 ppm Au were then re-analysed using the Mini-BLEG technique, where a 50 gram sub-sample was subjected to a 2 hour semi-static leach in a cyanide solution, ICP-MS was used to determine gold. Samples that assayed over 1.00 ppm Au were subjected to a 40 gram fire assay “tail” using a sub-sample of the dried leachwell material, in order to pick up any gold that was missed during the cyanide leaching process.
• From 2010-2011 underground drill core was sent to SGS and Amdel. SGS used an accelerated cyanide leach technique (leachwell), where a 400g sample was mixed with 600ml of water and a leachwell tablet added. This was mix rolled for 2 hours. Liquor was drawn off and analysed using an AAS with DIBK finish. Samples > 1g/t had residue fire assayed.
FACE SAMPLES:
• From the commencement of the mine until late 1995 the assaying was done on site and with the demise of the on site laboratory the samples were sent to Silver Lake lab at Kambalda. From November 2001 the samples were sent to Analabs in Kalgoorlie, subsequently owned and operated by the SGS group. The samples have always been fire assayed with various charge weights (generally either 30 or 50g). The method was (using the SGS codes) DRY11 (sample drying, 105°C), CRU24 (crush > 3.5kg, various mesh sizes per kg),
For
per
sona
l use
onl
y
4
Criteria JORC Code explanation Commentary
SPL26 (riffle splitting, per kg), PUL48 (pulv, Cr Steel, 75µm, 1.5 to 3kg), FAA505 (AU FAS, AAS, 50g) (two of these were performed), and WST01 (waste disposal).
• Trials have been done to investigate the feasibility of using an accelerated cyanide leach, but the leach time of the higher grade samples does not allow reasonable turn around of the sample results.
• In 2011 all face samples and core were sent to Amdel in Kalgoorlie. The total sample was dried and milled in an LM5 mill to a nominal 90% passing 75µm. An analytical pulp of approximately 200g was sub sampled from the bulk and the milled residue was retained for future reference. All the preparation equipment was flushed with barren feldspar prior to the commencement of the job. A 50 gram sample was fused in a lead collection fire assay. The resultant prill was dissolved in aqua regia and the gold content of the sample was determined by AAS.
• In general the assaying procedures have been an attempt to prevent under estimation of the total contained gold. Where aqua regia was used, it probably under estimated the grade.
• In summary all samples used in the Resource estimation have either been obtained from fire assaying using a minimal 30g charge, in some instances a cyanide leach with tail assay, screen fire assays and aqua regia. The aqua regia method probably understated the grade.
Drilling techniques
• Drill type (eg core, reverse circulation, open-hole hammer, rotary air blast, auger, Bangka, sonic, etc) and details (eg core diameter, triple or standard tube, depth of diamond tails, face-sampling bit or other type, whether core is oriented and if so, by what method, etc).
• Resources have been drilled by a combination of surface and underground drilling using RC, AC and Diamond drilling techniques. Extensive air core drilling has been carried out on the lake surface, however these results were used to delineate the ore body and were not used in the Resource estimates.
• Underground drilling has been completed using pneumatic and electric hydraulic drill rigs with standard core LTK46 and LTK48 both with the same nominal core size of 38mm.
• For surface diamond the standard core size used was NQ2 which has an inside diameter of 79mm. HQ has only been used for drilling
For
per
sona
l use
onl
y
5
Criteria JORC Code explanation Commentary
partially weathered material from the near surface areas at the top of the system or the pre-collar in order to put in place the casing.
• Diamond core was reconstructed into continuous runs on an angle iron cradle for orientation marking. Depths are checked against the depth given on the core blocks and rod counts are routinely carried out by drillers. RC samples were checked for recovery, moisture and contamination.
• RC sampling was conducted mostly on 1m riffle and cone split samples, with occasional 2m split sampling, mostly within historical drilling.
Drill sample recovery
• Method of recording and assessing core and chip sample recoveries and results assessed.
• Measures taken to maximise sample recovery and ensure representative nature of the samples.
• Whether a relationship exists between sample recovery and grade and whether sample bias may have occurred due to preferential loss/gain of fine/coarse material.
• RC sample recoveries were monitored by company representatives during drilling operations.
• The maximum sample interval for gold bearing veins is 1 metre, to ensure the assayed interval is not over weighted when calculating the total face grade.
• The majority of underground drilling had good recovery. Some holes drilled from underground encountered voids associated with the weathering profile causing some core loss.
Logging • Whether core and chip samples have been geologically and geotechnically logged to a level of detail to support appropriate Mineral Resource estimation, mining studies and metallurgical studies.
• Whether logging is qualitative or quantitative in nature. Core (or costean, channel, etc) photography.
• The total length and percentage of the relevant intersections logged.
• Lithological and structural logging was carried out on surface diamond drilling with strategic holes being geotechnically logged. Structural information recorded included RQD, dip, dip direction, alpha angle, beta angle, slicken slides and shear zones.
• Post 2008 diamond drilling was photographed prior to sampling. • All drill core has been systematically logged at Norseman.
Sub-sampling techniques and sample preparation
• If core, whether cut or sawn and whether quarter, half or all core taken.
• If non-core, whether riffled, tube sampled, rotary split, etc and whether sampled wet or dry.
• For all sample types, the nature, quality and appropriateness of the sample preparation technique.
• Quality control procedures adopted for all sub-sampling stages to maximise representivity of samples.
• Measures taken to ensure that the sampling is representative of the in situ material collected, including for instance results for field duplicate/second-half sampling.
• Whether sample sizes are appropriate to the grain size of the material
• Sampling of surface and underground diamond drilling is carried out using half core, and sampled so that the sample intervals match geological intervals and veins. Small veins, less than 20cm core length, have insufficient sample for assay. These intersections are bulked out to 20cm core length and dilution is included in the assay
• Core was halved using a diamond saw, with half sent for analysis and half retained. The retained component is stored on core racks in a core farm on site.
• See section on assaying for details of sample preparation. For
per
sona
l use
onl
y
6
Criteria JORC Code explanation Commentary
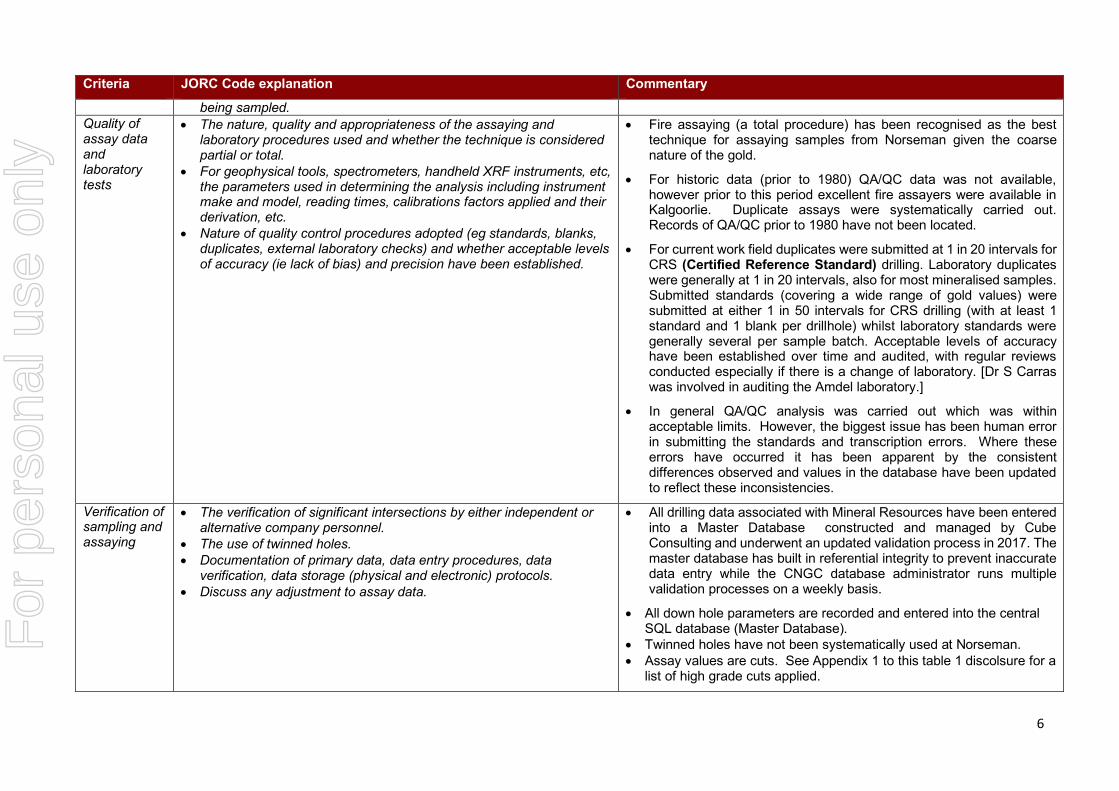
being sampled. Quality of assay data and laboratory tests
• The nature, quality and appropriateness of the assaying and laboratory procedures used and whether the technique is considered partial or total.
• For geophysical tools, spectrometers, handheld XRF instruments, etc, the parameters used in determining the analysis including instrument make and model, reading times, calibrations factors applied and their derivation, etc.
• Nature of quality control procedures adopted (eg standards, blanks, duplicates, external laboratory checks) and whether acceptable levels of accuracy (ie lack of bias) and precision have been established.
• Fire assaying (a total procedure) has been recognised as the best technique for assaying samples from Norseman given the coarse nature of the gold.
• For historic data (prior to 1980) QA/QC data was not available, however prior to this period excellent fire assayers were available in Kalgoorlie. Duplicate assays were systematically carried out. Records of QA/QC prior to 1980 have not been located.
• For current work field duplicates were submitted at 1 in 20 intervals for CRS (Certified Reference Standard) drilling. Laboratory duplicates were generally at 1 in 20 intervals, also for most mineralised samples. Submitted standards (covering a wide range of gold values) were submitted at either 1 in 50 intervals for CRS drilling (with at least 1 standard and 1 blank per drillhole) whilst laboratory standards were generally several per sample batch. Acceptable levels of accuracy have been established over time and audited, with regular reviews conducted especially if there is a change of laboratory. [Dr S Carras was involved in auditing the Amdel laboratory.]
• In general QA/QC analysis was carried out which was within acceptable limits. However, the biggest issue has been human error in submitting the standards and transcription errors. Where these errors have occurred it has been apparent by the consistent differences observed and values in the database have been updated to reflect these inconsistencies.
Verification of sampling and assaying
• The verification of significant intersections by either independent or alternative company personnel.
• The use of twinned holes. • Documentation of primary data, data entry procedures, data
verification, data storage (physical and electronic) protocols. • Discuss any adjustment to assay data.
• All drilling data associated with Mineral Resources have been entered into a Master Database constructed and managed by Cube Consulting and underwent an updated validation process in 2017. The master database has built in referential integrity to prevent inaccurate data entry while the CNGC database administrator runs multiple validation processes on a weekly basis.
• All down hole parameters are recorded and entered into the central SQL database (Master Database).
• Twinned holes have not been systematically used at Norseman. • Assay values are cuts. See Appendix 1 to this table 1 discolsure for a
list of high grade cuts applied.
For
per
sona
l use
onl
y
7
Criteria JORC Code explanation Commentary
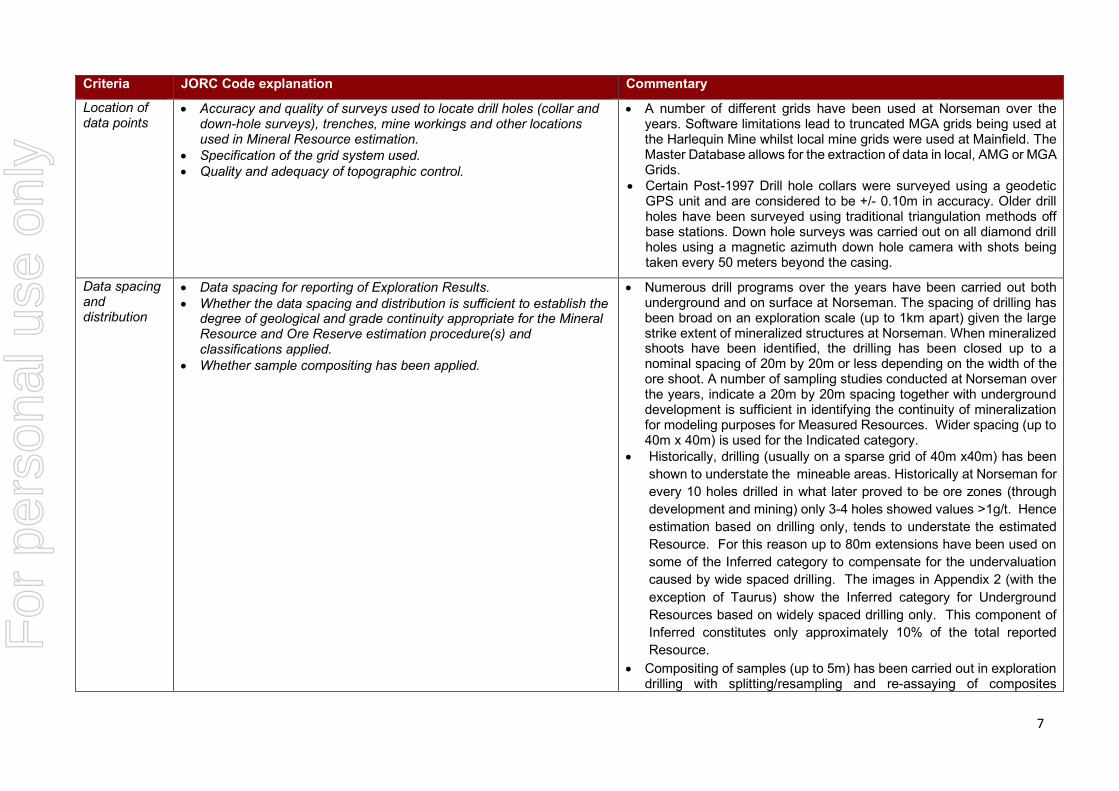
Location of data points
• Accuracy and quality of surveys used to locate drill holes (collar and down-hole surveys), trenches, mine workings and other locations used in Mineral Resource estimation.
• Specification of the grid system used. • Quality and adequacy of topographic control.
• A number of different grids have been used at Norseman over the years. Software limitations lead to truncated MGA grids being used at the Harlequin Mine whilst local mine grids were used at Mainfield. The Master Database allows for the extraction of data in local, AMG or MGA Grids.
• Certain Post-1997 Drill hole collars were surveyed using a geodetic GPS unit and are considered to be +/- 0.10m in accuracy. Older drill holes have been surveyed using traditional triangulation methods off base stations. Down hole surveys was carried out on all diamond drill holes using a magnetic azimuth down hole camera with shots being taken every 50 meters beyond the casing.
Data spacing and distribution
• Data spacing for reporting of Exploration Results. • Whether the data spacing and distribution is sufficient to establish the
degree of geological and grade continuity appropriate for the Mineral Resource and Ore Reserve estimation procedure(s) and classifications applied.
• Whether sample compositing has been applied.
• Numerous drill programs over the years have been carried out both underground and on surface at Norseman. The spacing of drilling has been broad on an exploration scale (up to 1km apart) given the large strike extent of mineralized structures at Norseman. When mineralized shoots have been identified, the drilling has been closed up to a nominal spacing of 20m by 20m or less depending on the width of the ore shoot. A number of sampling studies conducted at Norseman over the years, indicate a 20m by 20m spacing together with underground development is sufficient in identifying the continuity of mineralization for modeling purposes for Measured Resources. Wider spacing (up to 40m x 40m) is used for the Indicated category.
• Historically, drilling (usually on a sparse grid of 40m x40m) has been shown to understate the mineable areas. Historically at Norseman for every 10 holes drilled in what later proved to be ore zones (through development and mining) only 3-4 holes showed values >1g/t. Hence estimation based on drilling only, tends to understate the estimated Resource. For this reason up to 80m extensions have been used on some of the Inferred category to compensate for the undervaluation caused by wide spaced drilling. The images in Appendix 2 (with the exception of Taurus) show the Inferred category for Underground Resources based on widely spaced drilling only. This component of Inferred constitutes only approximately 10% of the total reported Resource.
• Compositing of samples (up to 5m) has been carried out in exploration drilling with splitting/resampling and re-assaying of composites
For
per
sona
l use
onl
y
8
Criteria JORC Code explanation Commentary
occurring where required.
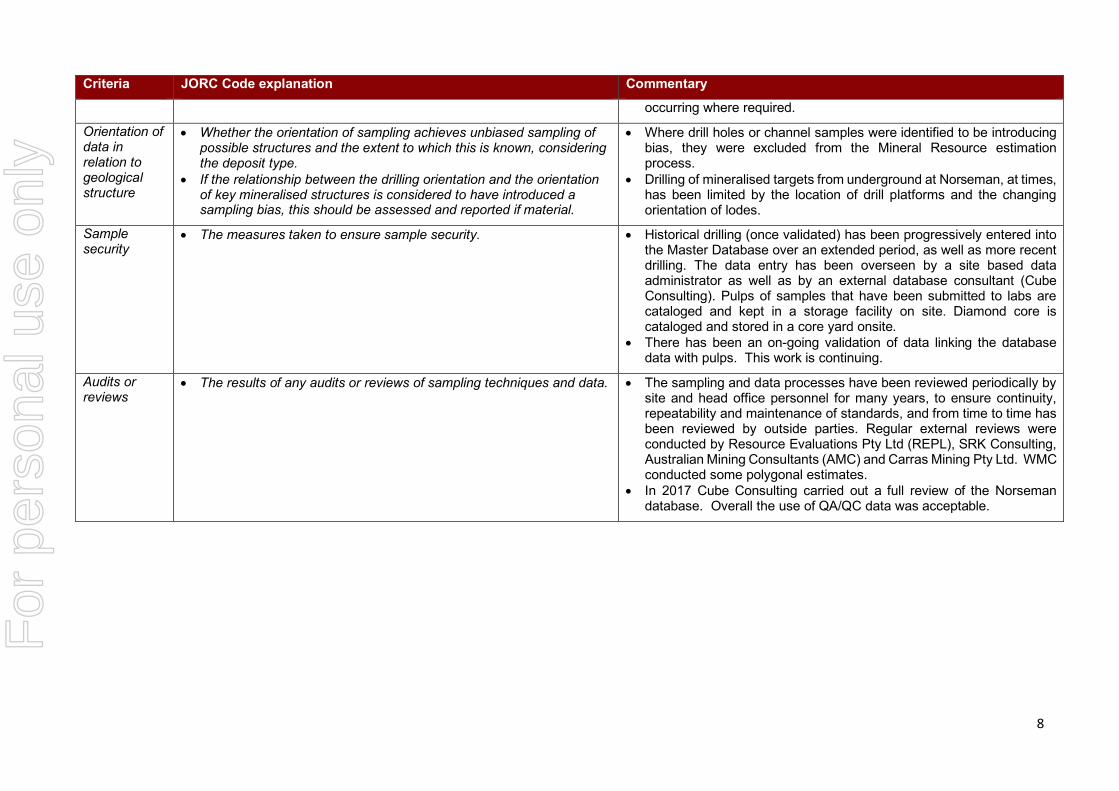
Orientation of data in relation to geological structure
• Whether the orientation of sampling achieves unbiased sampling of possible structures and the extent to which this is known, considering the deposit type.
• If the relationship between the drilling orientation and the orientation of key mineralised structures is considered to have introduced a sampling bias, this should be assessed and reported if material.
• Where drill holes or channel samples were identified to be introducing bias, they were excluded from the Mineral Resource estimation process.
• Drilling of mineralised targets from underground at Norseman, at times, has been limited by the location of drill platforms and the changing orientation of lodes.
Sample security
• The measures taken to ensure sample security. • Historical drilling (once validated) has been progressively entered into the Master Database over an extended period, as well as more recent drilling. The data entry has been overseen by a site based data administrator as well as by an external database consultant (Cube Consulting). Pulps of samples that have been submitted to labs are cataloged and kept in a storage facility on site. Diamond core is cataloged and stored in a core yard onsite.
• There has been an on-going validation of data linking the database data with pulps. This work is continuing.
Audits or reviews
• The results of any audits or reviews of sampling techniques and data. • The sampling and data processes have been reviewed periodically by site and head office personnel for many years, to ensure continuity, repeatability and maintenance of standards, and from time to time has been reviewed by outside parties. Regular external reviews were conducted by Resource Evaluations Pty Ltd (REPL), SRK Consulting, Australian Mining Consultants (AMC) and Carras Mining Pty Ltd. WMC conducted some polygonal estimates.
• In 2017 Cube Consulting carried out a full review of the Norseman database. Overall the use of QA/QC data was acceptable.
For
per
sona
l use
onl
y

9
Section 2 Reporting of Exploration Results
(Criteria listed in the preceding section also apply to this section.)
Criteria JORC Code explanation Commentary
Mineral tenement and land tenure status
• Type, reference name/number, location and ownership including agreements or material issues with third parties such as joint ventures, partnerships, overriding royalties, native title interests, historical sites, wilderness or national park and environmental settings.
• The security of the tenure held at the time of reporting along with any known impediments to obtaining a licence to operate in the area.
• There are 142 current tenements (2018). These are divided into 6 Exploration Licences (associated with exploration activities), 15 Miscellaneous Licences (associated with infrastructure and access), 108 Mining Leases (associated with mining and exploration activities) and 13 Prospecting Licences (associated with exploration activities). All Licences are subject to Native Title Ngadju WC 1999/002. Ownership by Central Norseman Gold Corporation is close to 100%
• Minimum expenditure per year is approximately $5.9M. • The extent of the tenements is approximately 56,000 hectares. • Expiry Dates are as follows:
Exploration Licence Expiry Dates Yr No
2019 4
2021 2
Miscellaneous Licence Expiry Dates
Yr No
2019 7
2020 1
2022 5
2023 1
2025 1
Mining Lease Expiry Dates Yr No
2020 3
2021 2
>2025 103
For
per
sona
l use
onl
y
10
Criteria JORC Code explanation Commentary
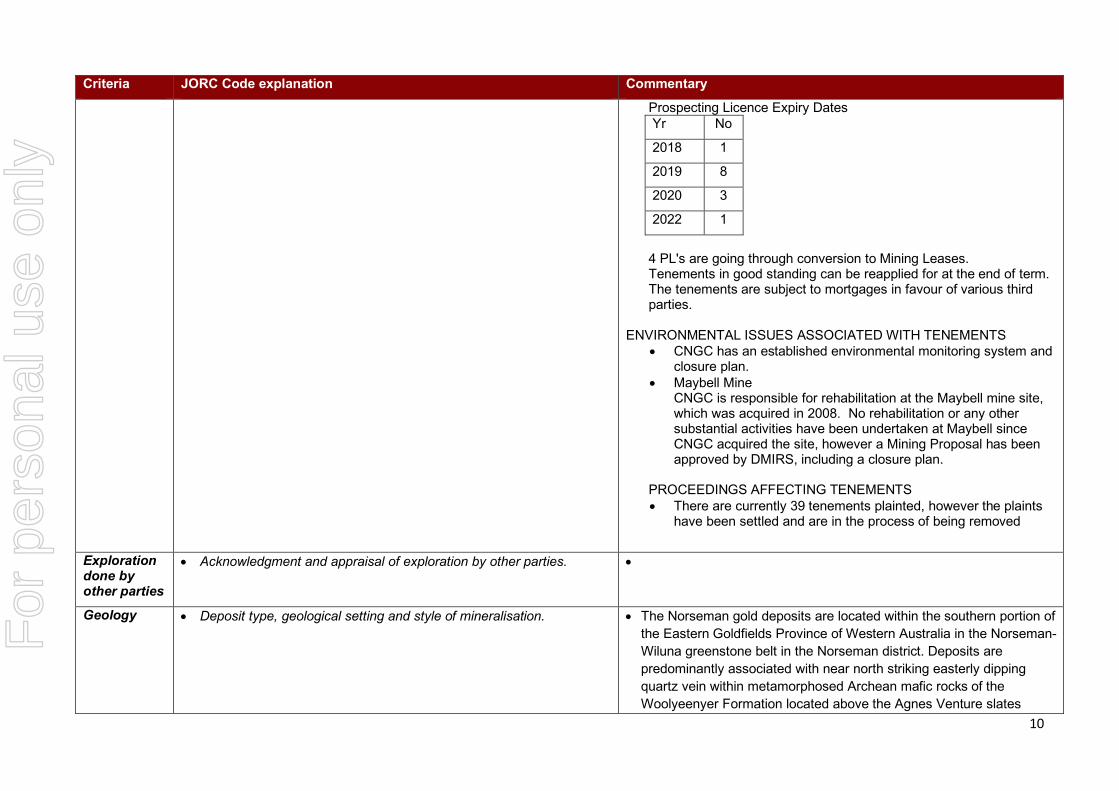
Prospecting Licence Expiry Dates Yr No
2018 1
2019 8
2020 3
2022 1
4 PL's are going through conversion to Mining Leases. Tenements in good standing can be reapplied for at the end of term. The tenements are subject to mortgages in favour of various third parties.
ENVIRONMENTAL ISSUES ASSOCIATED WITH TENEMENTS • CNGC has an established environmental monitoring system and
closure plan. • Maybell Mine
CNGC is responsible for rehabilitation at the Maybell mine site, which was acquired in 2008. No rehabilitation or any other substantial activities have been undertaken at Maybell since CNGC acquired the site, however a Mining Proposal has been approved by DMIRS, including a closure plan.
PROCEEDINGS AFFECTING TENEMENTS • There are currently 39 tenements plainted, however the plaints
have been settled and are in the process of being removed
Exploration done by other parties
• Acknowledgment and appraisal of exploration by other parties. •
Geology • Deposit type, geological setting and style of mineralisation. • The Norseman gold deposits are located within the southern portion of the Eastern Goldfields Province of Western Australia in the Norseman-Wiluna greenstone belt in the Norseman district. Deposits are predominantly associated with near north striking easterly dipping quartz vein within metamorphosed Archean mafic rocks of the Woolyeenyer Formation located above the Agnes Venture slates
For
per
sona
l use
onl
y

11
Criteria JORC Code explanation Commentary
which occur at the base. • The principal units of the Norseman district, are greenstones which
are west dipping and interpreted to be west facing. The sequence consists of the Penneshaw Formation comprising basalts and felsic volcanics on the eastern margin bounded by the Buldania granite batholith, the Noganyer Iron Formation, the Woolyeenyer formation comprising pillow basalts intruded by gabbros and the Mount Kirk Formation a mixed assemblage.
• The mineralisation is hosted in quartz reefs in steeper shears and flatter linking sections, more recently significant production has been sourced from NNW striking reefs known as cross structures (Bullen). Whilst a number of vein types are categorized the gold mineralisation is predominantly located in the main north trending reefs which in the Mainfield strike for over a kilometre. The quartz/sulphide veins range from 0.5 metres up to 2 metres thick , these veins are zoned with higher grades occurring in the laminated veins on the margins and central bucky quartz which is white in colour. Bonanza grades are associated with native gold and tellurides with other accessory sulphide minerals being galena , sphalerite, chalcopyrite, pyrite and arsenopyrite.
• The long running operations at Norseman have provided a good understanding on the controls of mineralisation as well as the structural setting of the deposits. The overall geology of the Norseman area is well understood with 3D Fractal Graphic mapping and detailed studies, adding to a good geological understanding to the area. The geometry of the main lodes at Norseman are well known and plunge of shoots predictable in areas, however large areas remain untested by drilling with the potential for new spurs and cross links high. Whilst the general geology of lodes is used to constrain all wireframes, predicting continuity of grade has proven to be difficult at the higher grades when mining and in some instances (containing about 7% of the ounces) subjective parameters have been applied.
Drill hole Information
• A summary of all information material to the understanding of the exploration results including a tabulation of the following information for all Material drill holes: o easting and northing of the drill hole collar
• The Master Database contains the following: • Aircore Holes: 18,326 holes for 724,684m • Diamond Holes: 11,694 holes for 1,474,300m
For
per
sona
l use
onl
y
12
Criteria JORC Code explanation Commentary
o elevation or RL (Reduced Level – elevation above sea level in metres) of the drill hole collar
o dip and azimuth of the hole o down hole length and interception depth o hole length.
• If the exclusion of this information is justified on the basis that the information is not Material and this exclusion does not detract from the understanding of the report, the Competent Person should clearly explain why this is the case.
• Trenches: 423 trenches for 17,037m • Face Samples: 25,802 samples for 29,938m • Grade Control Drilling: 925 samples for 5,206m • Percussion Drilling: 28 holes for 1,218m • RAB Drilling: 2,062 holes for 55,204m • RC Drilling: 13,738 holes for 585,960m
• Drilling is oriented in many directions and on various grids over the past decades. All data has been converted to a standard grid GDA 94 zone 51
Data aggregation methods
• In reporting Exploration Results, weighting averaging techniques, maximum and/or minimum grade truncations (eg cutting of high grades) and cut-off grades are usually Material and should be stated.
• Where aggregate intercepts incorporate short lengths of high grade results and longer lengths of low grade results, the procedure used for such aggregation should be stated and some typical examples of such aggregations should be shown in detail.
• The assumptions used for any reporting of metal equivalent values should be clearly stated.
• Resource evaluation interpolation methods and high grade cutting can be viewed in Appendix 1
• All resources are quoted as gold only. There are no metal equivalents quoted
Relationship between mineralisation widths and intercept lengths
• These relationships are particularly important in the reporting of Exploration Results.
• If the geometry of the mineralisation with respect to the drill hole angle is known, its nature should be reported.
• If it is not known and only the down hole lengths are reported, there should be a clear statement to this effect (eg ‘down hole length, true width not known’).
•
Diagrams • Appropriate maps and sections (with scales) and tabulations of intercepts should be included for any significant discovery being reported These should include, but not be limited to a plan view of drill hole collar locations and appropriate sectional views.
•
Balanced reporting
• Where comprehensive reporting of all Exploration Results is not practicable, representative reporting of both low and high grades and/or widths should be practiced to avoid misleading reporting of Exploration Results.
•
Other substantive
• Other exploration data, if meaningful and material, should be reported including (but not limited to): geological observations; geophysical survey results; geochemical survey results; bulk samples – size and method of treatment; metallurgical test results; bulk density,
•
For
per
sona
l use
onl
y

13
Criteria JORC Code explanation Commentary
exploration data
groundwater, geotechnical and rock characteristics; potential deleterious or contaminating substances.
Further work • The nature and scale of planned further work (eg tests for lateral extensions or depth extensions or large-scale step-out drilling).
• Diagrams clearly highlighting the areas of possible extensions, including the main geological interpretations and future drilling areas, provided this information is not commercially sensitive.
•
For
per
sona
l use
onl
y
14
Section 3 Estimation and Reporting of Mineral Resources
(Criteria listed in section 1, and where relevant in section 2, also apply to this section.)
Criteria JORC Code explanation Commentary
Database integrity
• Measures taken to ensure that data has not been corrupted by, for example, transcription or keying errors, between its initial collection and its use for Mineral Resource estimation purposes.
• Data validation procedures used.
• Validation of the site database is an ongoing process. A site based internal database administrator as well as an external consultant (Cube Consulting) has been historically responsible for keeping the database clean. In 2017 a full audit of the database was carried out by Cube Consulting.
• Validating historical drilling that has been entered into the database can be checked against hard copies of the drill logs that are kept in a fire proof room on site.
• Data transfer is electronic with pre-numbered sample bags helping to minimize potential errors.
Site visits • Comment on any site visits undertaken by the Competent Person and the outcome of those visits.
• If no site visits have been undertaken indicate why this is the case.
• The Competent Person Mr Andrew Hawker, Principal Geologist at HGS Australia. Mr Hawker has conducted resource evaluations at CNGC since January 2016 and made many trips to the operations during that time.
• External consultants over the years have included Resource Evaluations Pty Ltd, SRK, AMC, CSG Global, HGS Australia and Carras Mining Pty Ltd.
• Technical contributions have been made by Dr Spero Carras from Carras Mining, and Mr Jonathan Sharp geology manager at CNGC.
Geological interpretation
• Confidence in (or conversely, the uncertainty of) the geological interpretation of the mineral deposit.
• Nature of the data used and of any assumptions made. • The effect, if any, of alternative interpretations on Mineral Resource
estimation. • The use of geology in guiding and controlling Mineral Resource estimation. • The factors affecting continuity both of grade and geology.
• The long running operations at Norseman have provided a good understanding on the controls of mineralization as well as the structural setting of the deposits. The overall geology of the Norseman area is well understood with 3D Fractal Graphic mapping and detailed studies, adding to a good geological understanding to the area.
• The geometry of the main lodes at Norseman are well known and plunge of shoots predicable in areas, however large areas remain untested by drilling with the potential for new spurs and cross links high.
• Whilst the general geology of lodes is used to constrain all wireframes, predicting continuity of grade has proven to be difficult at the higher grades when mining and in some instances (containing about 7% of the ounces) subjective parameters have
For
per
sona
l use
onl
y

15
Criteria JORC Code explanation Commentary
been applied.
Dimensions • The extent and variability of the Mineral Resource expressed as length (along strike or otherwise), plan width, and depth below surface to the upper and lower limits of the Mineral Resource.
• The Mainfield Deposit which includes the Bullen, St Patricks and Crown Mine is 5 km long, 2km wide and over 600m deep. The Nearby OK Mine is 800m long by 600m wide by 500m deep. The Harlequin Mine is 2km long by 1.2km wide by 800m deep. The Scotia Mine 30km to the south of Norseman is 1600m long by 630m wide by 600m deep. Most of the deposits outcrop or come very close to surface apart from Harlequin which is covered by over 30m of lake sediment.
• The latest resource at North Royal-Slippers is 3km long, 1200m wide and 800m deep, comprising 32 lodes of varying widths from paleochannels and laterites to 0.5m wide high-grade underground lodes.
• Andronicus: 1040m long x 300m wide x 110m vertical • Buldania: 1650m long x 130m wide x 105m vertical • Cobbler: 1850m long x 120m wide x 170m vertical • Daisy South: 270m long x 45m wide x 115m vertical • Dhufish: 770m long x 140m wide x 240m vertical • Freegift: 320m long x 50m wide x 100m vertical • Gladstone-Everlasting: 1740m long x 450m wide x 280m vertical • Golden Dragon: 400m long x 260m wide x 200m vertical • Kaipoi: 320m long x 50m wide x 70m vertical • Lady Eleanor: 360m long x 60m wide x 80m vertical • Lady Miller: 2120m long x 500m wide x 150m vertical • Lord Percy: 620m long x 170m wide x 115m vertical • Maybell: 350m long x 180m wide x 200m vertical • Perkins: 1000m long x 1500m wide x 170m vertical • Sontaran: 940m long x 800m wide x 260m vertical
Estimation and modelling techniques
• The nature and appropriateness of the estimation technique(s) applied and key assumptions, including treatment of extreme grade values, domaining, interpolation parameters and maximum distance of extrapolation from data points. If a computer assisted estimation method was chosen include a description of computer software and parameters used.
• The availability of check estimates, previous estimates and/or mine production records and whether the Mineral Resource estimate takes appropriate account of such data.
• The assumptions made regarding recovery of by-products.
• All Mineral Resource Estimates, except Lady Miller, were conducted using Surpac. Lady Miller was conducted using Datamine.
• The majority of the Mineral Resource Estimates were interpolated using Ordinary Kriging with inverse distance interpolations as a check.
• Grade cutting and block sizes are applied as outlined in Appendix 1. This is based on an examination of face sample and drillhole data distribution.
For
per
sona
l use
onl
y

16
Criteria JORC Code explanation Commentary
• Estimation of deleterious elements or other non-grade variables of economic significance (eg sulphur for acid mine drainage characterisation).
• In the case of block model interpolation, the block size in relation to the average sample spacing and the search employed.
• Any assumptions behind modelling of selective mining units. • Any assumptions about correlation between variables. • Description of how the geological interpretation was used to control the
resource estimates. • Discussion of basis for using or not using grade cutting or capping. • The process of validation, the checking process used, the comparison of
model data to drill hole data, and use of reconciliation data if available.
• The Mineral Resource is not factored to reflect production due to difficulties of reconciliation with individual lodes and mining outside of stated Mineral Resources.
• 90% of the reported Mineral Resource ounces are based on historically audited models with limited supporting documentation or block models.
• Surface or near surface models have lower cut of 0.5g/t, 0.7g/t or 1.0g/t.
• Updated underground resources have a lower cut of 4.0g/t • Historical underground resources, Ajax, Bullen, Crown and OK,
have lower cut at 9g/t
Moisture • Whether the tonnages are estimated on a dry basis or with natural moisture, and the method of determination of the moisture content.
• The tonnages are estimated on a dry basis.
Cut-off parameters
• The basis of the adopted cut-off grade(s) or quality parameters applied. • Cut off grades utilized in the Open Pit models can be found in Appendix 1. For Open Pit results the marginal cut off grade is based on the milling cost only. Some Open Pits have been optimized and others are close enough to the surface to be considered as an Open Pit Resource.
• The cut off grade used for underground Mineral Resources is a marginal cut off grade. The underground cut off grade used includes mining costs, power, water, overheads, haulage and milling costs. It does not include the cost of development, cost of refurbishment to regain access to non-maintained areas, those areas under water or other capital costs.
• The basis of these cut off grade estimates is discussed below. • Resource marginal cut off grades utilize a gold price of
AUD$1700 per ounce.
Mining factors or assumptions
• Assumptions made regarding possible mining methods, minimum mining dimensions and internal (or, if applicable, external) mining dilution. It is always necessary as part of the process of determining reasonable prospects for eventual economic extraction to consider potential mining methods, but the assumptions made regarding mining methods and parameters when estimating Mineral Resources may not always be rigorous. Where this is the case, this should be reported with an explanation of the basis of the mining assumptions made.
• Historically underground estimates for Mineral Resources were based on underground airleg mining using a room and random pillar method. In 2011-2012 longhole mining was considered to be viable and applied at both Harlequin and OK mines. This resulted in a lower cut off grade being used for Mineral Resource estimation (a diluted 2g/t for the marginal cut off grade) but when mining, the dilution increased due to overbreak thus increasing the minimum mining width. In 2013 the preferred method of mining was airleg T-bone stoping. While this minimized dilution it has resulted in a higher cost and higher
For
per
sona
l use
onl
y

17
Criteria JORC Code explanation Commentary
cut off grade at a reduced cost per ounce. • For Open Pit cut off grades refer to Appendix 1.
Metallurgical factors or assumptions
• The basis for assumptions or predictions regarding metallurgical amenability. It is always necessary as part of the process of determining reasonable prospects for eventual economic extraction to consider potential metallurgical methods, but the assumptions regarding metallurgical treatment processes and parameters made when reporting Mineral Resources may not always be rigorous. Where this is the case, this should be reported with an explanation of the basis of the metallurgical assumptions made.
• Ore at Norseman is generally free milling with the majority of the gold being recovered by the gravity circuit. Some ore processed in the past (from satellite pits) has been associated with elevated amounts of pyrite leading to lower recoveries. The milling process is as follows:
o Run of mine (ROM) ore from stockpiles is fed into a primary crusher by front end loader. Crushed ore feeds a two stage milling circuit made up of a SAG mill, ball mill and also includes a pebble crusher for SAG mill oversize. Coarse gold is removed during grinding by two centrifugal gravity concentrators. The gravity gold recovered accounts for typically over 60% of gold in ore feed.
o Lime and sodium cyanide additions are made to the ground slurry and gold is leached from the ore in six air agitated Pachuca style tanks. Carbon is used in the last five tanks for absorption of soluble gold from the slurry. Gold is recovered from carbon in a conventional elution and electrowinning circuit. CIL gold together with the gravity gold is smelted to produce gold dore bars for export from the site.
Environmen-tal factors or assumptions
• Assumptions made regarding possible waste and process residue disposal options. It is always necessary as part of the process of determining reasonable prospects for eventual economic extraction to consider the potential environmental impacts of the mining and processing operation. While at this stage the determination of potential environmental impacts, particularly for a greenfields project, may not always be well advanced, the status of early consideration of these potential environmental impacts should be reported. Where these aspects have not been considered this should be reported with an explanation of the environmental assumptions made.
• Tailings waste disposal sites are in place at Norseman and are monitored on a regular basis by onsite and external environmental officers.
• Processing of the Phoenix tails may be impacted by dust considerations and a very small component of Battery sands, which contains a mercury component.
Bulk density • Whether assumed or determined. If assumed, the basis for the assumptions. If determined, the method used, whether wet or dry, the frequency of the measurements, the nature, size and representativeness of
• Bulk density tests of core and whole rock samples have been carried out on a regular basis at Norseman using either the immersion or suspension method. The size of rock analysed for
For
per
sona
l use
onl
y
18
Criteria JORC Code explanation Commentary
the samples. • The bulk density for bulk material must have been measured by methods
that adequately account for void spaces (vugs, porosity, etc), moisture and differences between rock and alteration zones within the deposit.
• Discuss assumptions for bulk density estimates used in the evaluation process of the different materials.
bulk density range from 0.5m lengths of core up to kilogram sized samples.
• Historical density values of 2.65t/m3 quartz veining have been used. Density tests have been carried out for the density of the country rock around mineralisation. These include the basalt, granodiorite and porphyry host rocks that were intersected in drill core. With the average bulk densities for basalt, granodiorite and porphyry being 2.74 t/m3, 2.86 t/m3 and 2.65 t/m3 respectively. An average bulk density of 2.70 t/m3 has been used for all unmineralised material.
• In general the SGs at Norseman have been confirmed by the milling process over a long period of time.
Classification • The basis for the classification of the Mineral Resources into varying confidence categories.
• Whether appropriate account has been taken of all relevant factors (ie relative confidence in tonnage/grade estimations, reliability of input data, confidence in continuity of geology and metal values, quality, quantity and distribution of the data).
• Whether the result appropriately reflects the Competent Person’s view of the deposit.
• The underground models are depleted for areas that have been mined and then classified based on confidence in the structure depending on the number of drill holes and the location and degree of development within the ore. Models are then reported based on a nominal lower cut grade of 4g/t or 9g/t for underground lodes and this corresponds to the marginal cut-off grade for the proposed mining method to be used. High grade domains are reported with no low grade cut off.
• A Measured Mineral Resource at Norseman is only stated where it has been developed, identifying tonnage, density, shape, physical characteristics and grade with a high level of confidence. This is based on areas which have underground development.
• An Indicated Mineral Resource (usually 40m x 40m drilling) at Norseman has a satisfactory level of geological data and confidence in geological interpretation. In some cases the drill hole spacing down dip or up dip may not be as close as would normally be required to assign an Indicated classification however the continuity of the structure and validation of the existing intersections are demonstrated by proximal existing workings.
• An Inferred Mineral Resource at Norseman is defined by an inadequate number of drill holes to meet the Indicated classification, or widely spaced drill holes in an ore solid wireframe (generally greater than 40m by 40m spacing) and up to 80m. Previously noted was the fact that drilling (usually on a sparse grid of 40m x40m) understates the ounces mined in the
For
per
sona
l use
onl
y

19
Criteria JORC Code explanation Commentary
subsequent mined areas. Historically at Norseman for every 10 holes drilled in what later proved to be ore zones (through development and mining) only 3-4 holes showed values >1g/t. Hence in some sparsely drilled areas larger extensions are used in the Inferred category to reflect this well-established underestimation fact at Norseman.
• Any Mineral Resource estimate with less than 5,000 ounces has been removed from the reported Underground Resources.
PILLARS • High grade pillars at Crown Reef have been severely cut. (An
approximate 50% recovery has been applied, taking into consideration the high grade cut applied (50g/t) and the reduced bulk density used.
• Limited pillars have been included at Harlequin and OK. This has been achieved by the use of the higher cut off grade in the upper areas of the mine and use of lower recoveries in the deeper portions of Harlequin and Perch (50% recovery). Remnant recoveries have also been reduced (20% in Perch, 40% in Redfin).
Audits or reviews
• The results of any audits or reviews of Mineral Resource estimates. • A number of improvements have been suggested by various auditors such as the plotting of drill hole data and block model results to validate the estimates. Other suggestions include the altering of block sizes, increasing search radii and increasing the number of informing samples.
• One of the recommendations by auditors was to prepare estimates based solely on drillhole data (excluding grade control data) for deposits which have been mined. This would allow reconciliation between the model and actual mine production and would provide some measure of the reliability of drill defined Resources. This however has proven difficult due to mining outside of Ore Reserves.
Discussion of relative
• Where appropriate a statement of the relative accuracy and confidence level in the Mineral Resource estimate using an approach or procedure deemed appropriate by the Competent Person. For example, the
• The Competent Person considers the estimation procedures used by CNGC at Norseman are at a high standard given the
For
per
sona
l use
onl
y
20
Criteria JORC Code explanation Commentary
accuracy/ confidence
application of statistical or geostatistical procedures to quantify the relative accuracy of the resource within stated confidence limits, or, if such an approach is not deemed appropriate, a qualitative discussion of the factors that could affect the relative accuracy and confidence of the estimate.
• The statement should specify whether it relates to global or local estimates, and, if local, state the relevant tonnages, which should be relevant to technical and economic evaluation. Documentation should include assumptions made and the procedures used.
• These statements of relative accuracy and confidence of the estimate should be compared with production data, where available.
nuggety nature of the gold and difficulty in quantifying and reconciling. This makes reconciliation difficult.
• Resources have been validated using swath plots, geostatistical variability and visual representations between the modelled grade and drill intercepts. Ordinary Kriged estimates and inverse distance squared interpolations have been conducted.
• The estimate of the grade of pillars in the Crown Reef is conservative due to the high-grade cut applied (50g/t).
• In 2011 6 diamond holes were drilled into the Crown Reef to investigate the behaviour of Remnant areas which had been included in Resources. 3 of these holes intersected gold, confirming the potential for further extensions to Resources as previously used (2012) in the Inferred category. Hole CRD013 intersected 4.13m of 6.3g/t Au with a further 2m of 3.61g/t Au in the immediate Crown Hanging Wall Reef. Hole CRD011A intersected 2.5m of 9.9g/t Au. The drilling program was cut short due to the necessity to drill production areas in preference to exploration areas.
• There is concern that more material may have been mined from the Crown Reef than previously believed and in 2014 there has been a very limited extension used (9m halo only). Half of these ounces associated with the Crown Reef halo have been included as Indicated and the other half as Inferred. The 2014 approach is conservative, and Crown Reef requires further drilling to investigate its potential. (There remains a concern that any remaining mineralisation in the Crown Reef may be patchy in parts.) For this reason, some of the previously reported Crown Reef has been placed in the Exploration Target category as required by JORC 2012.
• At the Crown Reef the narrow mineralisation envelop surrounding the high-grade Pillars would need to be mined by a form of long hole retreat. (No recovery has been applied to this data.)
• The Norseman area constitutes a very large mineralised system and as such the factor which controls the ounces reported in Resources at Norseman is largely the cut off grade. In this report the marginal cut-off grade of 4 and 9g/t over 0.7m has been used
For
per
sona
l use
onl
y
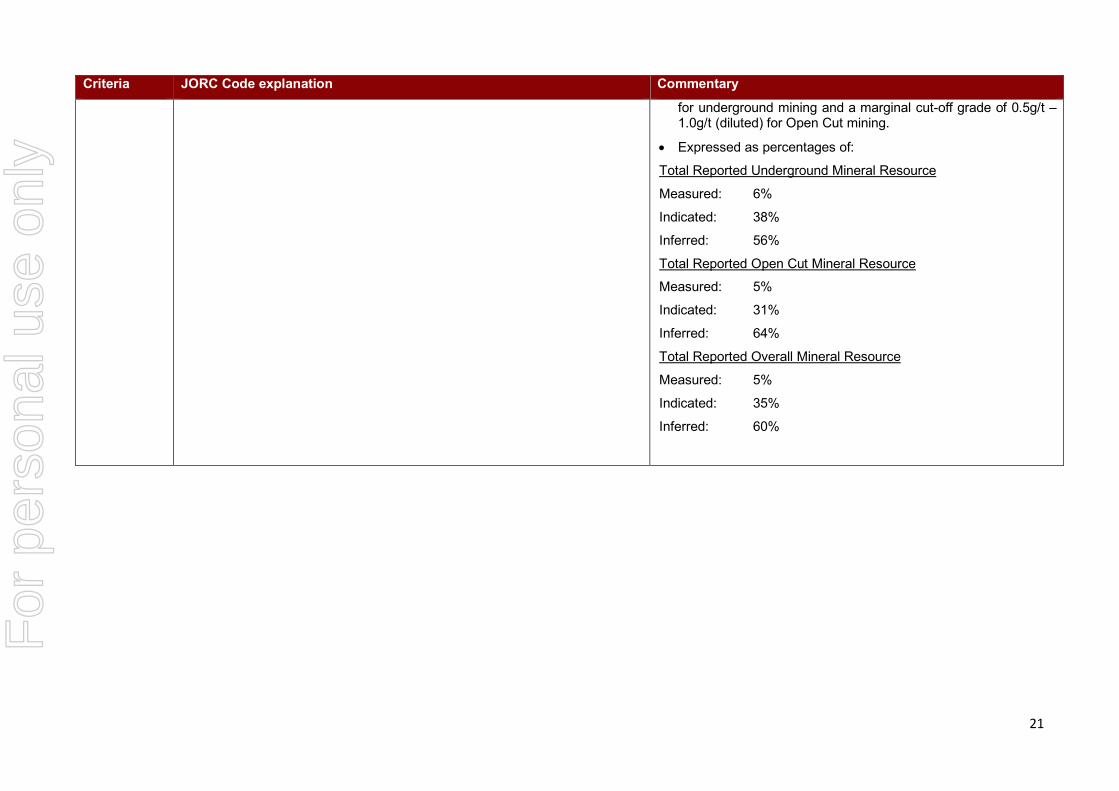
21
Criteria JORC Code explanation Commentary
for underground mining and a marginal cut-off grade of 0.5g/t – 1.0g/t (diluted) for Open Cut mining.
• Expressed as percentages of:
Total Reported Underground Mineral Resource
Measured: 6%
Indicated: 38%
Inferred: 56%
Total Reported Open Cut Mineral Resource
Measured: 5%
Indicated: 31%
Inferred: 64%
Total Reported Overall Mineral Resource
Measured: 5%
Indicated: 35%
Inferred: 60%
For
per
sona
l use
onl
y

22
Section 4 Estimation and Reporting of Ore Reserves
(Criteria listed in section 1, and where relevant in sections 2 and 3, also apply to this section.)
Criteria JORC Code explanation Commentary
Mineral Resource estimate for conversion to Ore Reserves
• Description of the Mineral Resource estimate used as a basis for the conversion to an Ore Reserve.
• Clear statement as to whether the Mineral Resources are reported additional to, or inclusive of, the Ore Reserves.
• Most Mineral Resources have been optimized for open pit operations, but include the inferred category for planning purposes. This aid to determine future economics for Norseman and to plan resource drilling to improve classifications.
For
per
sona
l use
onl
y
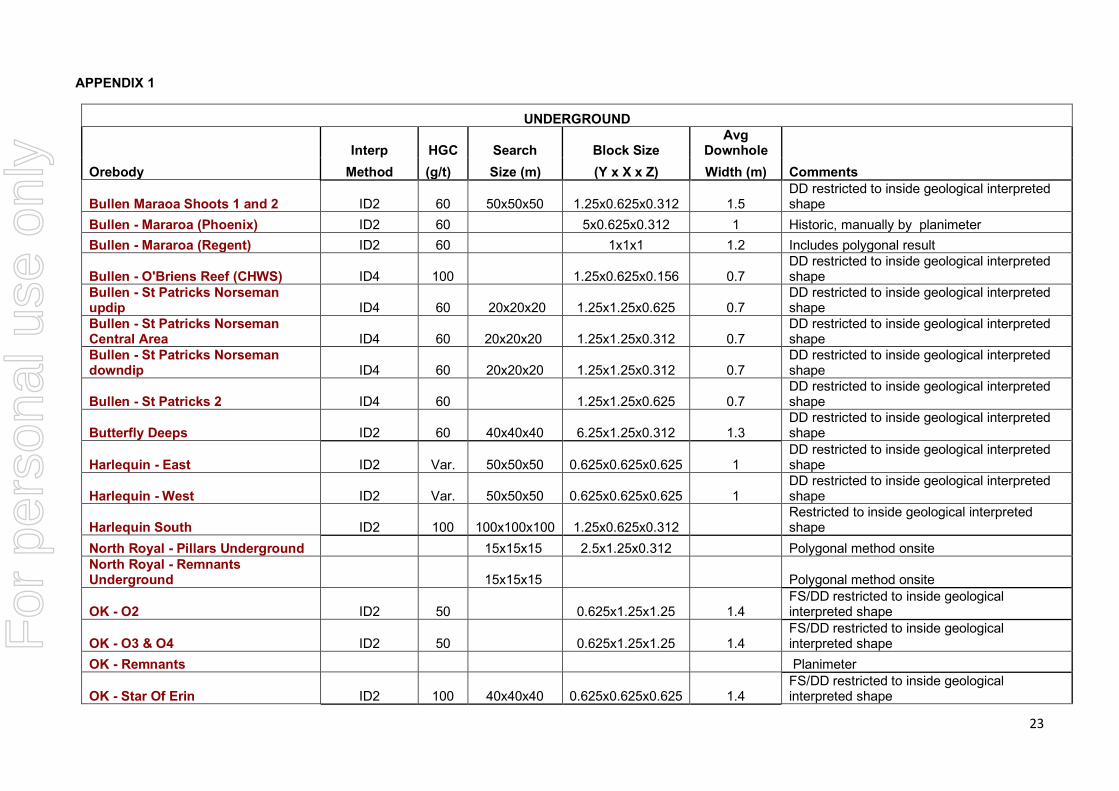
23
APPENDIX 1
UNDERGROUND
Interp HGC Search Block Size Avg
Downhole
Orebody Method (g/t) Size (m) (Y x X x Z) Width (m) Comments
Bullen Maraoa Shoots 1 and 2 ID2 60 50x50x50 1.25x0.625x0.312 1.5 DD restricted to inside geological interpreted shape
Bullen - Mararoa (Phoenix) ID2 60 5x0.625x0.312 1 Historic, manually by planimeter Bullen - Mararoa (Regent) ID2 60 1x1x1 1.2 Includes polygonal result
Bullen - O'Briens Reef (CHWS) ID4 100 1.25x0.625x0.156 0.7 DD restricted to inside geological interpreted shape
Bullen - St Patricks Norseman updip ID4 60 20x20x20 1.25x1.25x0.625 0.7
DD restricted to inside geological interpreted shape
Bullen - St Patricks Norseman Central Area ID4 60 20x20x20 1.25x1.25x0.312 0.7
DD restricted to inside geological interpreted shape
Bullen - St Patricks Norseman downdip ID4 60 20x20x20 1.25x1.25x0.312 0.7
DD restricted to inside geological interpreted shape
Bullen - St Patricks 2 ID4 60 1.25x1.25x0.625 0.7 DD restricted to inside geological interpreted shape
Butterfly Deeps ID2 60 40x40x40 6.25x1.25x0.312 1.3 DD restricted to inside geological interpreted shape
Harlequin - East ID2 Var. 50x50x50 0.625x0.625x0.625 1 DD restricted to inside geological interpreted shape
Harlequin - West ID2 Var. 50x50x50 0.625x0.625x0.625 1 DD restricted to inside geological interpreted shape
Harlequin South ID2 100 100x100x100 1.25x0.625x0.312 Restricted to inside geological interpreted shape
North Royal - Pillars Underground 15x15x15 2.5x1.25x0.312 Polygonal method onsite North Royal - Remnants Underground 15x15x15 Polygonal method onsite
OK - O2 ID2 50 0.625x1.25x1.25 1.4 FS/DD restricted to inside geological interpreted shape
OK - O3 & O4 ID2 50 0.625x1.25x1.25 1.4 FS/DD restricted to inside geological interpreted shape
OK - Remnants Planimeter
OK - Star Of Erin ID2 100 40x40x40 0.625x0.625x0.625 1.4 FS/DD restricted to inside geological interpreted shape
For
per
sona
l use
onl
y
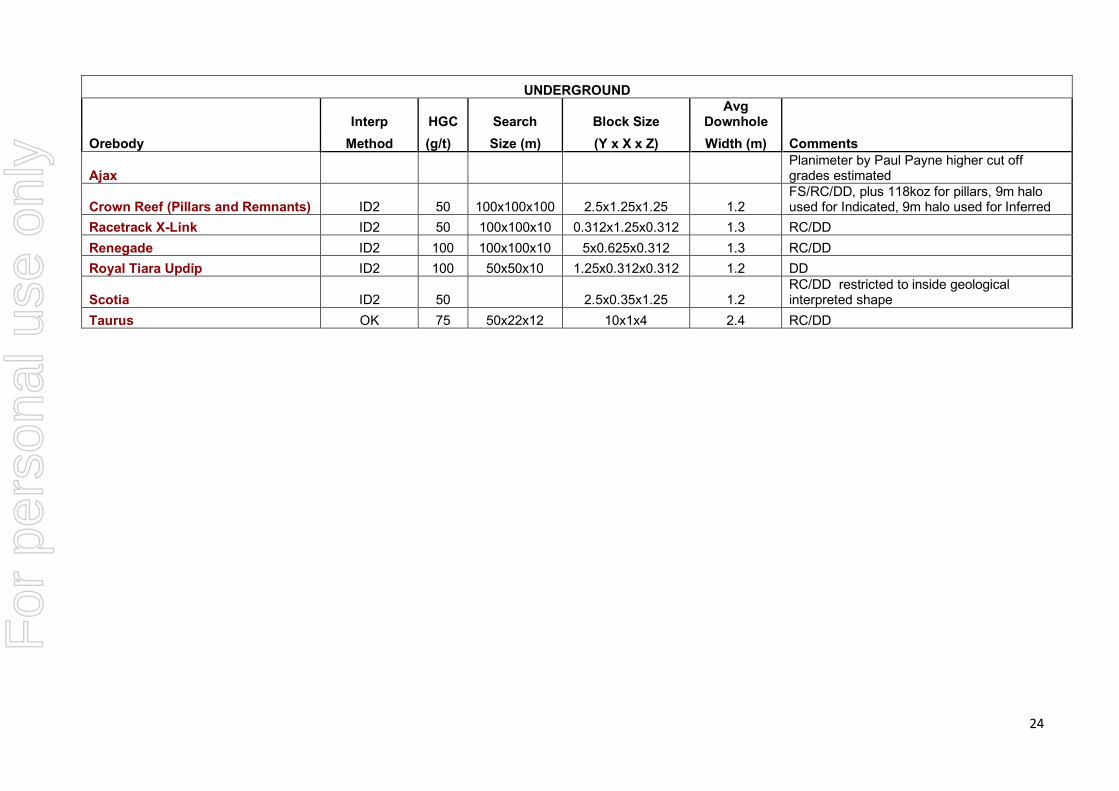
24
UNDERGROUND
Interp HGC Search Block Size Avg
Downhole
Orebody Method (g/t) Size (m) (Y x X x Z) Width (m) Comments
Ajax Planimeter by Paul Payne higher cut off grades estimated
Crown Reef (Pillars and Remnants) ID2 50 100x100x100 2.5x1.25x1.25 1.2 FS/RC/DD, plus 118koz for pillars, 9m halo used for Indicated, 9m halo used for Inferred
Racetrack X-Link ID2 50 100x100x10 0.312x1.25x0.312 1.3 RC/DD Renegade ID2 100 100x100x10 5x0.625x0.312 1.3 RC/DD Royal Tiara Updip ID2 100 50x50x10 1.25x0.312x0.312 1.2 DD
Scotia ID2 50 2.5x0.35x1.25 1.2 RC/DD restricted to inside geological interpreted shape
Taurus OK 75 50x22x12 10x1x4 2.4 RC/DD
For
per
sona
l use
onl
y
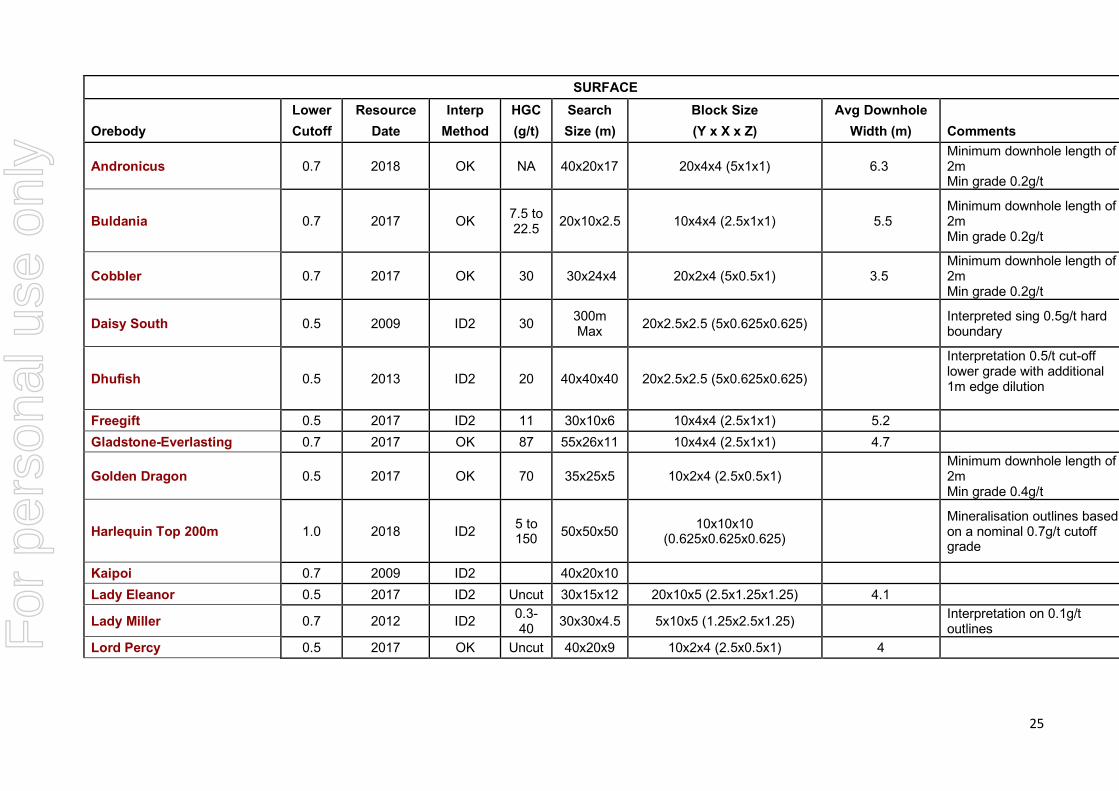
25
SURFACE
Lower Resource Interp HGC Search Block Size Avg Downhole
Orebody Cutoff Date Method (g/t) Size (m) (Y x X x Z) Width (m) Comments
Andronicus 0.7 2018 OK NA 40x20x17 20x4x4 (5x1x1) 6.3 Minimum downhole length of 2m Min grade 0.2g/t
Buldania 0.7 2017 OK 7.5 to 22.5 20x10x2.5 10x4x4 (2.5x1x1) 5.5
Minimum downhole length of 2m Min grade 0.2g/t
Cobbler 0.7 2017 OK 30 30x24x4 20x2x4 (5x0.5x1) 3.5 Minimum downhole length of 2m Min grade 0.2g/t
Daisy South 0.5 2009 ID2 30 300m Max 20x2.5x2.5 (5x0.625x0.625) Interpreted sing 0.5g/t hard
boundary
Dhufish 0.5 2013 ID2 20 40x40x40 20x2.5x2.5 (5x0.625x0.625)
Interpretation 0.5/t cut-off lower grade with additional 1m edge dilution
Freegift 0.5 2017 ID2 11 30x10x6 10x4x4 (2.5x1x1) 5.2
Gladstone-Everlasting 0.7 2017 OK 87 55x26x11 10x4x4 (2.5x1x1) 4.7
Golden Dragon 0.5 2017 OK 70 35x25x5 10x2x4 (2.5x0.5x1) Minimum downhole length of 2m Min grade 0.4g/t
Harlequin Top 200m 1.0 2018 ID2 5 to 150 50x50x50 10x10x10
(0.625x0.625x0.625) Mineralisation outlines based on a nominal 0.7g/t cutoff grade
Kaipoi 0.7 2009 ID2 40x20x10
Lady Eleanor 0.5 2017 ID2 Uncut 30x15x12 20x10x5 (2.5x1.25x1.25) 4.1
Lady Miller 0.7 2012 ID2 0.3-40 30x30x4.5 5x10x5 (1.25x2.5x1.25) Interpretation on 0.1g/t
outlines Lord Percy 0.5 2017 OK Uncut 40x20x9 10x2x4 (2.5x0.5x1) 4 F
or p
erso
nal u
se o
nly

26
SURFACE
Lower Resource Interp HGC Search Block Size Avg Downhole
Orebody Cutoff Date Method (g/t) Size (m) (Y x X x Z) Width (m) Comments
Maybell 0.5 2017 OK 49 30x20x10 10x10x1 (1.25x1.25x0.125) Interpretation: 1.0/t cut-off lower grade with additional 1m edge dilution
Mount Barker 1 2005 ID2 17.5, 24 &
134g/t 20x15x8 10x4x4 (2.5x1x1)
North Royal Slippers Area 0.5-0.7 2018 OK 3-50 50 10x5x2.5 (1.25x0.625x0.312) 15m
Minimum downhole length of 2m Min grade 0.2g/t Top 150m. UG lodes use geological or 2g/t boundaries.
Phoenix Tails 0 2017 OK Uncut 25x20x8 6x6x4 (1.5x1.5x1) Interpretation: 1.0/t cut-off lower grade with additional 1m edge dilution
Sontaran 1 2005 ID2 15 75x75x25 25x5x5 (6.25x1.25x1.25)
Perkins 0.5 2017 OK 30 25x18x4 10x4x1 (2.5x1x0.25) 3.1 Minimum downhole length of 2m Min grade 0.2g/t
Scotia 0.5 2017 OK 15-72 40x20x7 10x1x2 (2.5x0.25x0.5)
Mainfield Area GROUND LARK 0.7 2017 ID2 10 100 20x20x1 (5x5x0.25) 0.83 constrained by wireframe
MALONEYS REEF 0.7 2017 ID2 50 100 20x20x1 (5x5x0.25) 0.68 constrained by wireframe
ST PATRICKS NORSEMAN REEF
0.7 2017 ID2 50 100 20x20x1 (5x5x0.25) 0.79 constrained by wireframe
VENTURE H/W REEF (MOON?)
0.7 2017 ID2 50 100 20x20x1 (5x5x0.25) 0.9 constrained by wireframe
ST PATRICKS X-LINK 0.7 2017 ID2 100 100 20x20x1 (5x5x0.25) 0.72 constrained by wireframe
For
per
sona
l use
onl
y
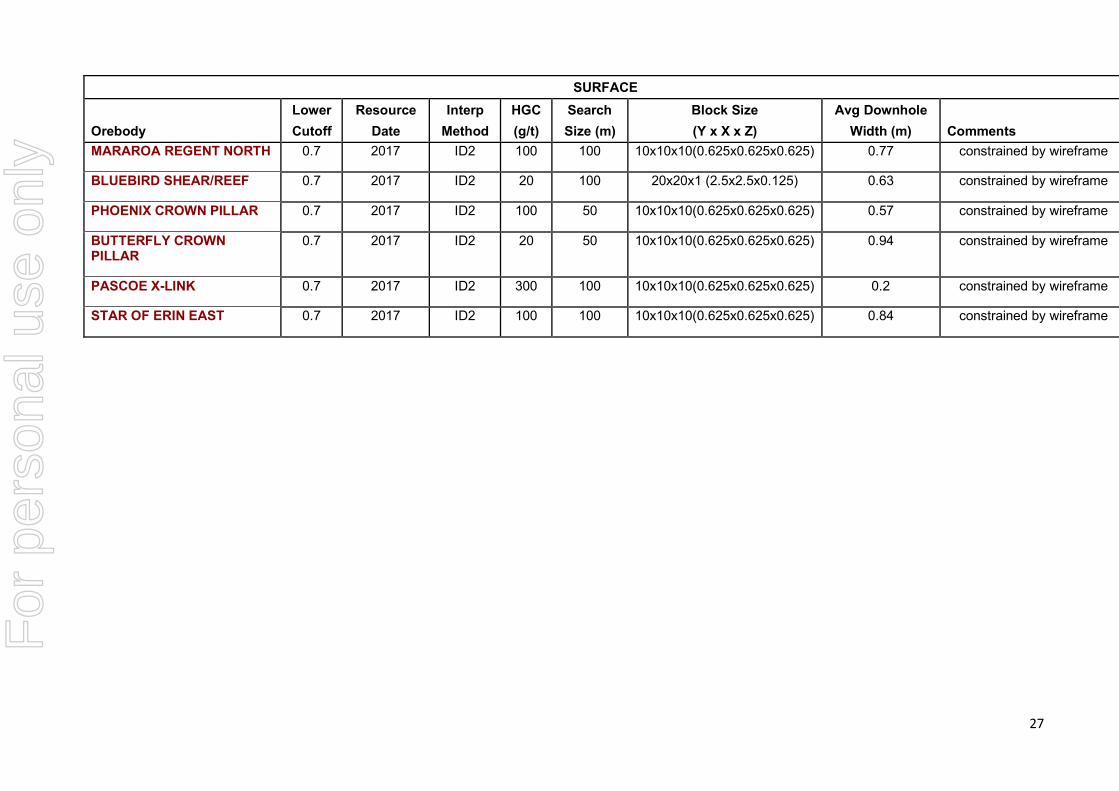
27
SURFACE
Lower Resource Interp HGC Search Block Size Avg Downhole
Orebody Cutoff Date Method (g/t) Size (m) (Y x X x Z) Width (m) Comments MARAROA REGENT NORTH 0.7 2017 ID2 100 100 10x10x10(0.625x0.625x0.625) 0.77 constrained by wireframe
BLUEBIRD SHEAR/REEF 0.7 2017 ID2 20 100 20x20x1 (2.5x2.5x0.125) 0.63 constrained by wireframe
PHOENIX CROWN PILLAR 0.7 2017 ID2 100 50 10x10x10(0.625x0.625x0.625) 0.57 constrained by wireframe
BUTTERFLY CROWN PILLAR
0.7 2017 ID2 20 50 10x10x10(0.625x0.625x0.625) 0.94 constrained by wireframe
PASCOE X-LINK 0.7 2017 ID2 300 100 10x10x10(0.625x0.625x0.625) 0.2 constrained by wireframe
STAR OF ERIN EAST 0.7 2017 ID2 100 100 10x10x10(0.625x0.625x0.625) 0.84 constrained by wireframe
For
per
sona
l use
onl
y

28
Abbreviations
Drilling Type
RC: Reverse Circulation Drilling
DD: Diamond Drilling
FS: Face Samples
Interpolation Method
ID2: Inverse Distance Squared
ID3: Inverse Distance Cubed
ID4: Inverse Distance to the Power of 4
OK: Ordinary Kriging Method
Search Size: Given as: Down Dip x Across Dip x Height
HGC: Maximum value of gold in g/t used in the estimation
Block Size: Y = Along Strike, X = Across Strike, Z = RL
Notes:
Declustered Crest System uses Diamond Drilling and Face Sample data.
Measured: Being proximal to underground development
Indicated: Where diamond drilling is up to 40m x 40m
Inferred: Limited in most cases to 80m
For cut off grade calculations the average true width of all underground lodes is assumed to be approximately 0.7m.
Unless the Crest System is specifically stated as being used, modelling is carried out by using Surpac where the diamond drilling is restricted to a geologically interpreted shape. Face samples are used where applicable and standard geostatistical algorithms using Surpac are applied. Not all models referred to above are included in the final Resource estimates.
For
per
sona
l use
onl
y

29
APPENDIX 2
DIAGRAMMATIC REPRESENTATION OF THE INFERRED RESOURCE SHOWING EXTRAPOLATION
RENEGADE
Showing block model grades within 80m of a Drillhole intersection point (shown as black dots)
Light black lines show the domain boundaries
BLUE 0-4g/t
GREEN 4-10g/t
RED 10g/t +
Values above 9g/t are reported for resources.
Inferred Ounces: 66,000
For
per
sona
l use
onl
y

30
RACETRACK X LINK
Showing block model grades within 80m of a Drillhole intersection point (shown as black dots)
Light black lines show the domain boundaries
BLUE 0-4g/t
GREEN 4-10g/t
RED 10g/t +
Values above 9g/t are reported for resources.
Inferred Ounces: 44,000
For
per
sona
l use
onl
y
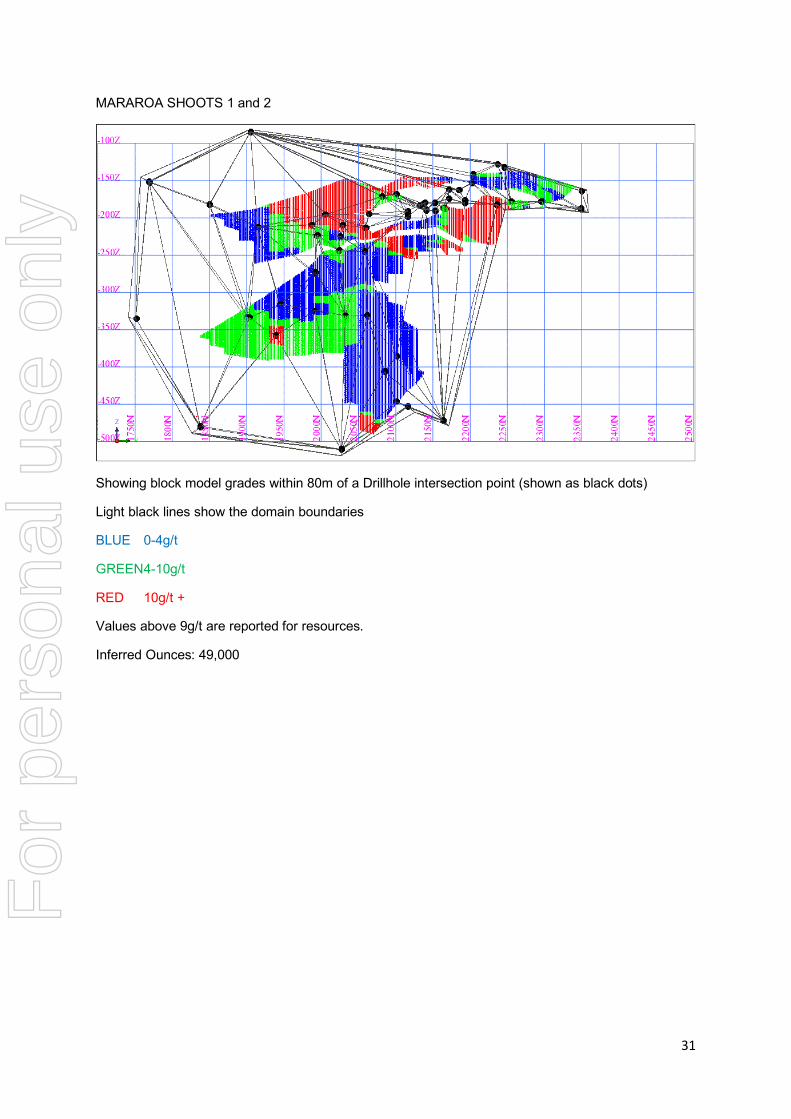
31
MARAROA SHOOTS 1 and 2
Showing block model grades within 80m of a Drillhole intersection point (shown as black dots)
Light black lines show the domain boundaries
BLUE 0-4g/t
GREEN 4-10g/t
RED 10g/t +
Values above 9g/t are reported for resources.
Inferred Ounces: 49,000
For
per
sona
l use
onl
y
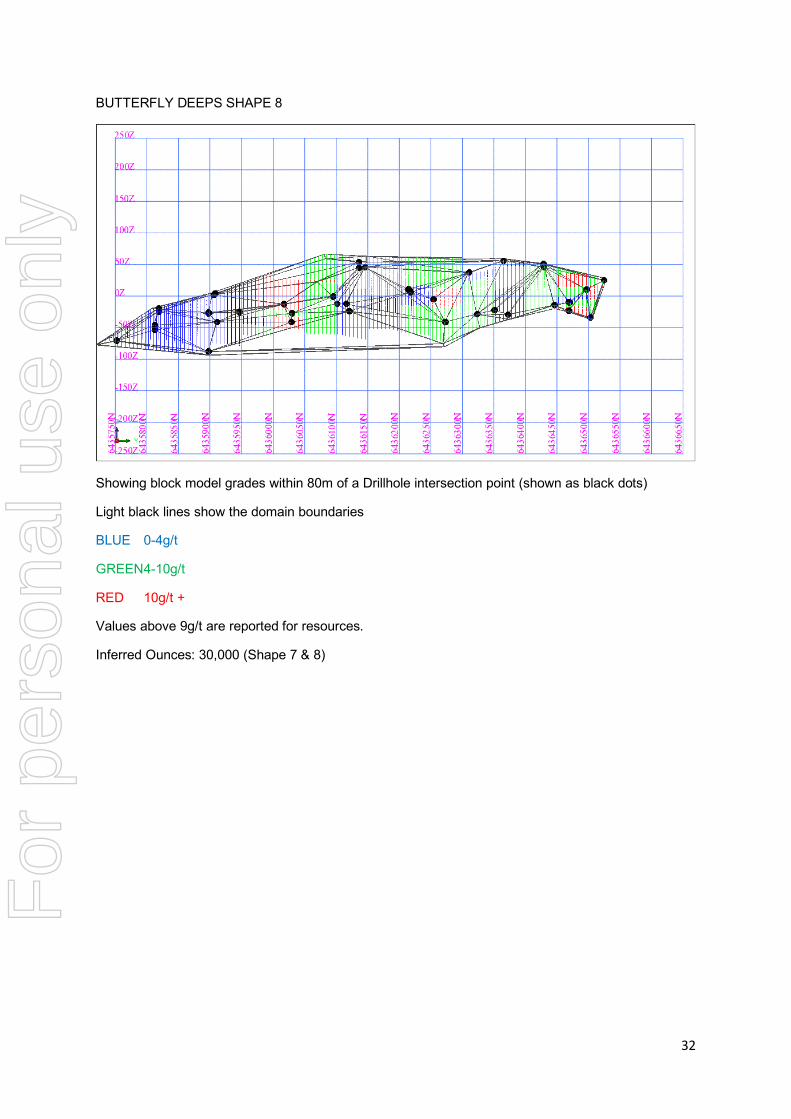
32
BUTTERFLY DEEPS SHAPE 8
Showing block model grades within 80m of a Drillhole intersection point (shown as black dots)
Light black lines show the domain boundaries
BLUE 0-4g/t
GREEN 4-10g/t
RED 10g/t +
Values above 9g/t are reported for resources.
Inferred Ounces: 30,000 (Shape 7 & 8)
For
per
sona
l use
onl
y
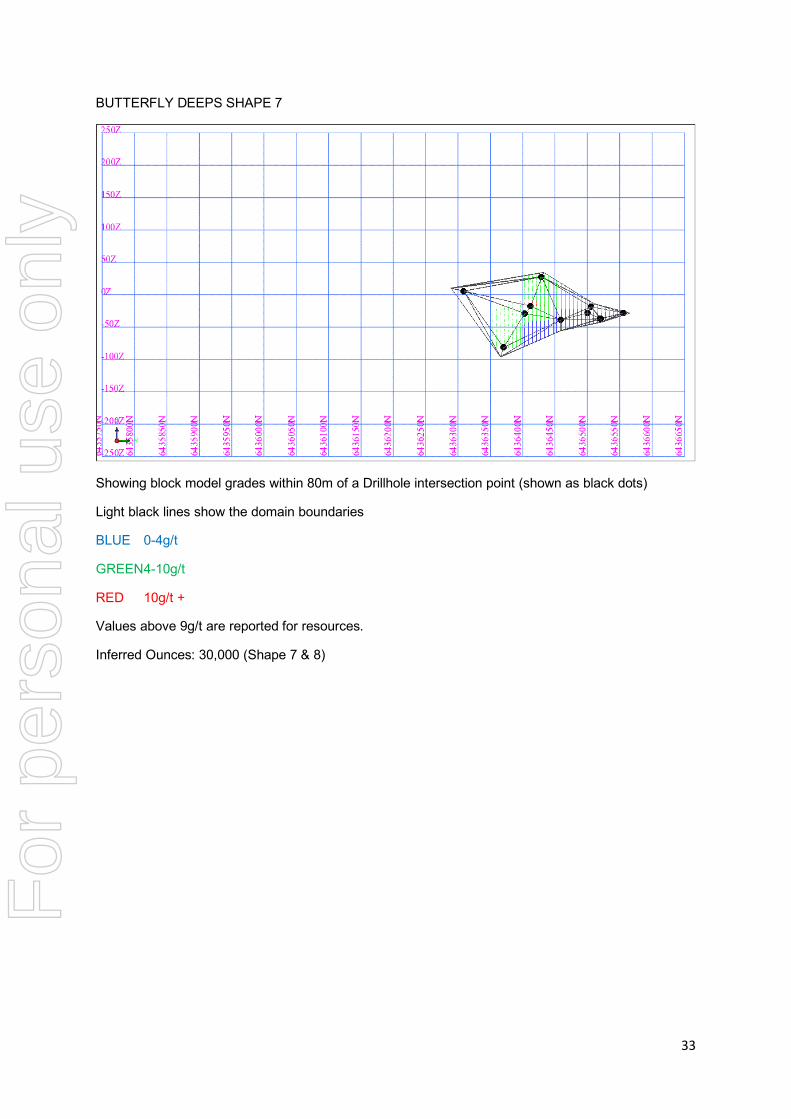
33
BUTTERFLY DEEPS SHAPE 7
Showing block model grades within 80m of a Drillhole intersection point (shown as black dots)
Light black lines show the domain boundaries
BLUE 0-4g/t
GREEN 4-10g/t
RED 10g/t +
Values above 9g/t are reported for resources.
Inferred Ounces: 30,000 (Shape 7 & 8)
For
per
sona
l use
onl
y
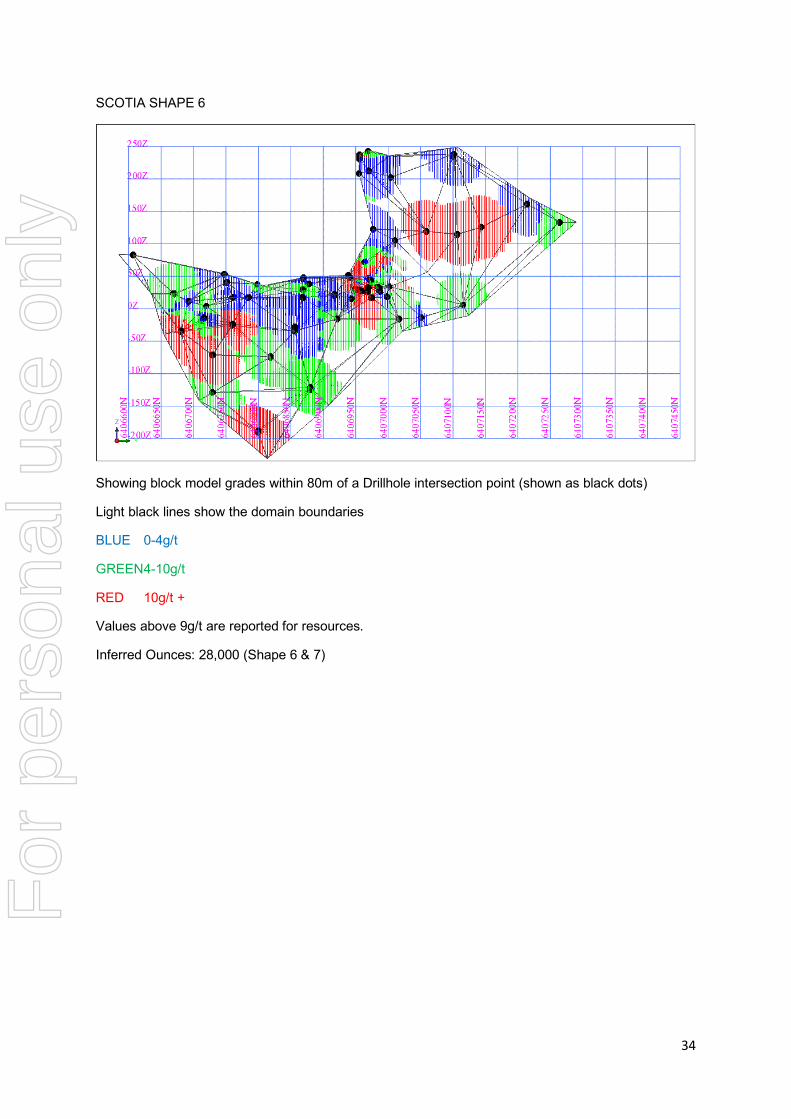
34
SCOTIA SHAPE 6
Showing block model grades within 80m of a Drillhole intersection point (shown as black dots)
Light black lines show the domain boundaries
BLUE 0-4g/t
GREEN 4-10g/t
RED 10g/t +
Values above 9g/t are reported for resources.
Inferred Ounces: 28,000 (Shape 6 & 7)
For
per
sona
l use
onl
y
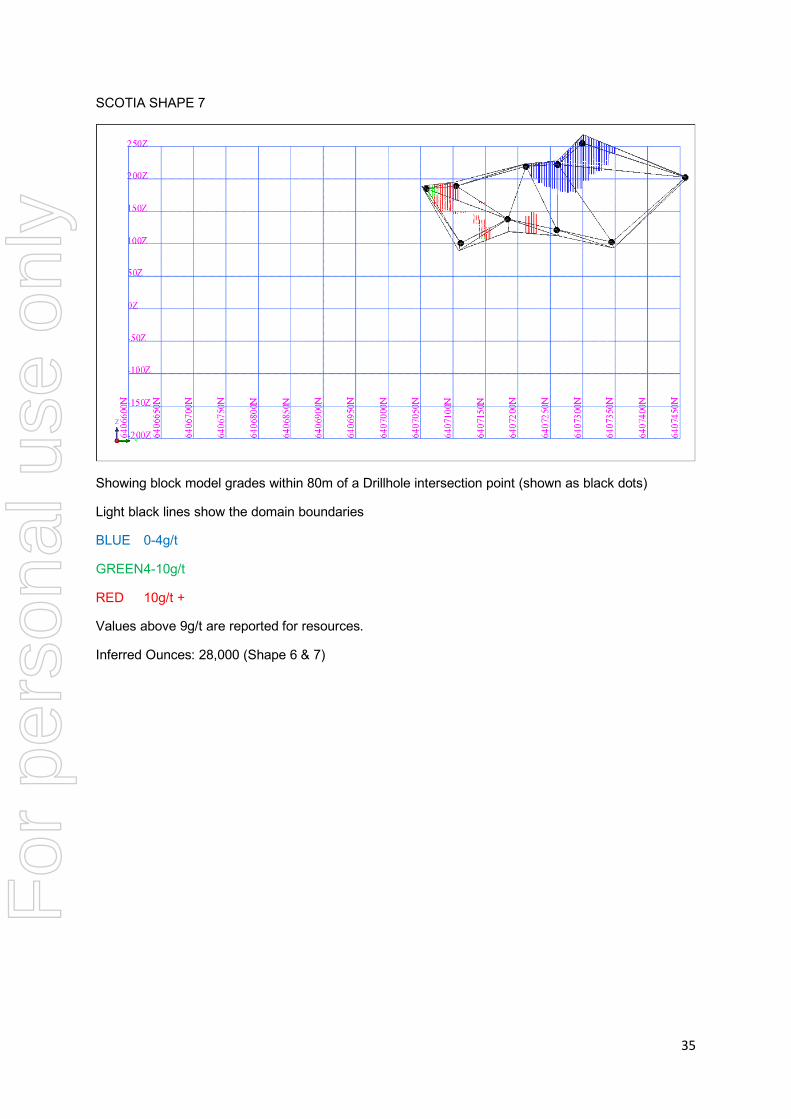
35
SCOTIA SHAPE 7
Showing block model grades within 80m of a Drillhole intersection point (shown as black dots)
Light black lines show the domain boundaries
BLUE 0-4g/t
GREEN 4-10g/t
RED 10g/t +
Values above 9g/t are reported for resources.
Inferred Ounces: 28,000 (Shape 6 & 7)
For
per
sona
l use
onl
y
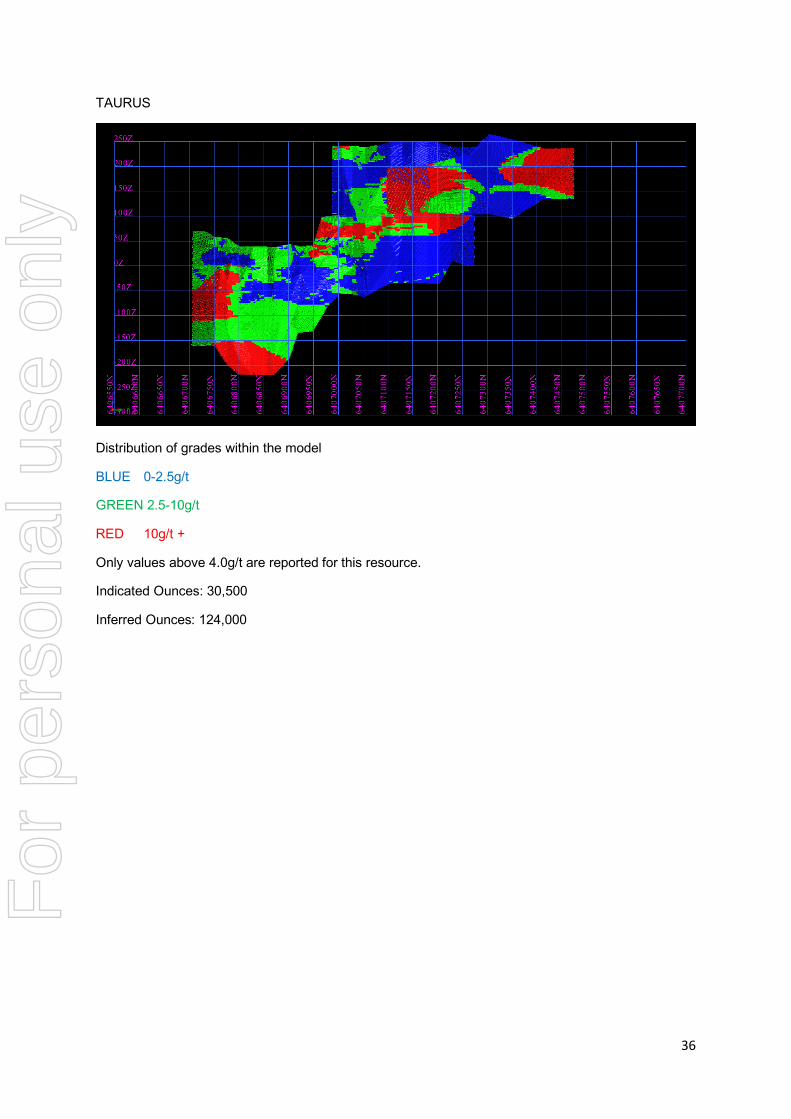
36
TAURUS
Distribution of grades within the model
BLUE 0-2.5g/t
GREEN 2.5-10g/t
RED 10g/t +
Only values above 4.0g/t are reported for this resource.
Indicated Ounces: 30,500
Inferred Ounces: 124,000
For
per
sona
l use
onl
y