not for quotation without permission of …pure.iiasa.ac.at/1115/1/wp-79-068.pdf · not for...
TRANSCRIPT

NOT FOR QUOTATIONWITHOUT PERMISSIONOF THE AUTHOR
HOW SAFE IS "TOO" SAFE?
S. BlackF. NiehausD. Simpson
June 1979WP-79-68
Working Papers are interim reports on work of theInternational Institute for Applied Systems Analysisand have received only limited review. Views oropinions expressed herein do not necessarily represent those of the Institute or of its National MemberOrganizations.
INTERNATIONAL INSTITUTE FOR APPLIED SYSTEMS ANALYSISA-2361 Laxenburg, Austria
S. Black is senior research scientist of the Joint IAEA/IIASARisk Assessment Project, International Atomic Energy Agency,P.O. Box 590, A-lOll Vienna, Austria.
F. Niehaus is Project Leader of the Joint IAEA/IIASA Risk Assessment Project, International Atomic Energy Agency, P.O. Box 590,A-lOll Vienna, Austria. .
D. Simpson is with the Atomic Energy Board, Licensing Branch,Private Bag X256, Pretoria, South Africa.This work was performed during his association with the JointIAEA/IIASA Risk Assessment Project, International Atomic EnergyAgency, P.O. Box 590, A-lOll Vienna, Austria.
-ii-
PREFACE
Decisions on future energy strategies have to be based ona comparison of their risks and benefits. The risk of a giventechnology is variable and may· be further reduced by additionalsafety measures which, however, usually incur additional expenditures.
Cost-effectiveness analysis is one methodology which canbe used to address the question of "how safe is safe enough"and which level of risk is "as low as reasonably achievable"(knownas the"'ALARA" approach). This paper ' introduces atnethod which doesnot limit the analysis of cost-effectiveness of additional safetyequipment to a specific facility, but provides a systems approachwhich allows consideration of the total economic system of acountry.
-iii-

ABSTRACT
Safety expenditures usually follow the law of diminishingreturns, i.e. marginal cost of risk reduction increases progressively with the level of safety achieved. Though the riskof a facility can in principle be reduced below any given valueit is not possible to reduce the risk to zero, to reach "absolutesafety". This poses ~hed.questionabQut._c.:t.helevel at which furtherrisk"reduction is no longer cost-effective.
This paper demonstrates that these considerations are onlyvalid if a system element (e.g. a plant) is analysed. When thetotal economic system is considered another source of risk hasto be added: the occupational and public health effects associated with the production of safety equipment.
Using some simplifying assumptions and data from nationaleconomic input-output tables and occupational accident statisticsit is possible to derive a linear relationship between the costof the safety equipment and the health effects caused by itsproduction. When this relation is combined with the. exponentialrisk:,:cost"r·~i.3iionshipof- the faciiity·,:Ttmder coneLdexat.Lon , thecombined curve exhibits a minimum value where the health effectsof producing the safety feature equals the health effects avoidedwhen it is installed. It is shown that if one probable. healtheffect at some·unknown future, time is avoided by use of $ 30 million of safety equipments, one equivalent health effect willcertainly occur at the present time. The problem of balancingthese two effects is a societal decision which is not addressedherein.
-iv-

CONTENTS
INTRODUCTION, 1Putting Risks into Perspective, 1Comparisons of Risks and Benefits, 2Cost-Effectiveness of Risk Reduction, 2
COST-EFFECTIVENESS OF RISK REDUCTION, 2
RISK IDENTIFICATION AND QUANTIFICATION, 4
THE RISK OF PRODUCING GOODS AND SERVICES, 5The Methodology, 5Results, 8
THE RISK OF PRODUCTION OF SAFETY EQUIPMENT, 9
APPLICATION OF RESULTS, 14General Implications to Standard Setting, 14Application to U.S. Environmental Protection Agency Results, 19Application to Remote Reactor Siting, 22Reduction of Radiation Doses to Nuclear Plant Operators, 23
CONCLUSIONS, 23
REFERENCES, 25
-v-

-1-
HOW SAFE IS "TOO" SAFE?
S. Black, F. Niehaus, D. Simpson
INTRODUCTION
Any activity of man involves some risk to his life or health.Though it is possible to reduce these risks, it is not possibleto reach the "zero risk" or "absolute safety" that is often demanded. Once this general fact is recognized, it becomes necessary to decide which risks are acceptable and to what extent riskshave to be reduced.
In the past, exposures to industrial risks were graduallyreduced until an acceptable level was reached. Modern technological systems are capable of hypothetical hazards so largethat determination of the appropriate level on the basis of experience is not acceptable. It is necessary to use predictivemethods to estimate these risks. Risk assessment (Otway et al.1977) methodology implies the need for the formal (systematic)evaluation of estimated risks using some defined acceptabilitycriteria.
There are three primary methods for this evaluation:
Putting Risks into Perspective
This approach has been most widely used and is based on theassumption that a new risk is acceptable if it does not exceedpresent levels of already accepted risks (Reactor Safety Study1975) and it has been suggested that a new technology shouldpresent a risk which is at least a factor of 10 lower than wellestablished technologies (Higson 1978, Tattersall et ale 1972).This approach poses the problem of the comparability of risks fromvery different sources (e.g. airplanes with chemical plants) anddoes not consider the value of a technology to society.

-2-
Comparisons of Risks and Benefits
Once it has been established that a risk is not out ofproportion with other similar risks, a common basis for a comparison of technologies can be achieved by normalizing theirrisks to a common measure of benefits which they can provideto society. This approach implicitly assumes that for a higherbenefit a higher level of risk should be acceptable (Inhaber1978, Black et ale 1978)
Cost-Effectiveness of Risk Reduction
The above-mentioned methods allow for a comparison ofoptions, however, they do not indicate whether these levels ofsafety are adequate, or whether the risk should be reduced evenfurther. Safety philosophy require,s risks to be reduced to levels"as low as reasonably achievable" (known as the ·ALA~" approach).Cost-effectiveness procedures may be used for this problem andsome relevant aspects are discussed below.
COST-EFFECTIVENESS OF RISK REDUCTION
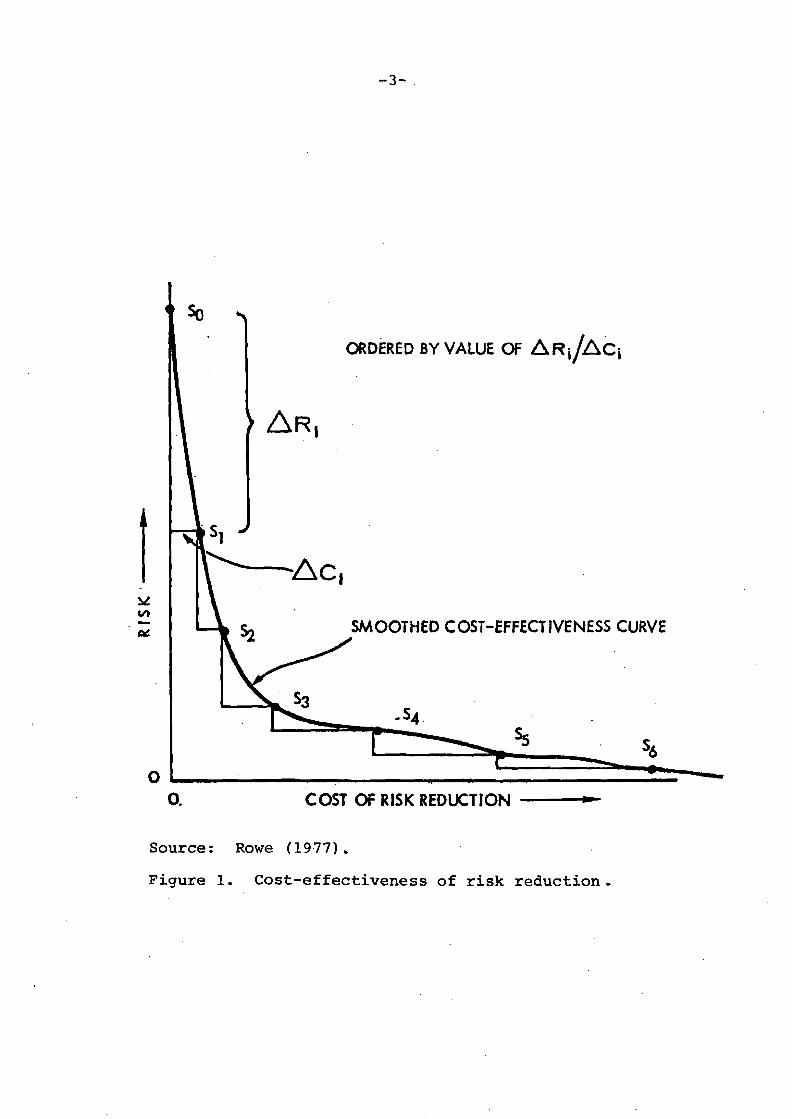
It has been assumed that safety expenditures generallyfollow the law of diminishing returns (Rowe 1977)~ The generalrelationship of this law is outlined in Figure 1 and has beenrecognized in several case studies (Roy and Ciceri 1978, U.S.
; ',;, ,Environmental Protection Agency 1976). Two main conclusions canbe drawn from this diagram:
1. the marginal cost of risk reduction increases withthe level of safety achieved; and
2. for any given safety level it is possible to reducethe risk even further, however, it is not possible toreduce the risk to zero.
Society is, however, constrained by the limited resourcesat its disposal and this poses the question about "how safeis safeenough?" (Fischhoff et ale 1978) The two observations fromFigure 1 imply that "safe enough" is always determined by anarbitrary compromise between the two objectives of the efficientuse of limited resources (minimizing costs) and achieving thehighest safety (minimizing risk). Since the units of these objectives are money and health effects respectively, any such solution implies a specified expenditure per unit of risk reduction.In particular, the use of mortality risk leads to a monetaryvalue being assigned to a human life (Strictly, determinationof the value of a human life would be only one method of deriving an appropriate expenditure for risk reduction. In general, the expenditure will be defined by the societal consensusover the resource allocation for safety. Although this valuewill be quoted in dollars per life saved, it will not in factbe the "value of human life"'.) Such values can be compared forsafety expenditures in various risk areas. It has been suggested(Linnerooth 1977) that a value of $ 300,000 per life should be
-3- .
SMOOTHED COST-EFFECTIVENESS CURVE
•COST OF RISK REDUCTION -----
Source: Rowe (1977).
Figure 1. Cost-effectiveness of risk reduction.

-4-
chosen which could be weighted by some factors describing specific attributes of the actual situation. Such a procedureimplies the objective that safety expenditures should be spentmost cost-effectively on various technologies but does not answerthe more general question of "how safe is safe enough?"
In contrast to the above approach, this paper will suggestthat a practical limit to risk reduction does exist. The typical curve shown in Figure I relates to one particular technological facility and the fact that such a plant or technology isonly one element in the total economic system is overlooked.Therefore, the fact that the safety measures themselves cannotbe produced without risk is also neglected. Thus it followsthat Figure I applies only to the system element (e.g. a plant).If the total system is considered, however, the curve fromFigure I will actually have a minimum risk and this will bedescribed in more detail below.
RISK IDENTIFICATION AND QUANTIFICATION
The term "risk" is used in a variety of contexts, generallyto describe the possibility of negative outcomes. But its precise meaning is usually not defined (Schaefer 1978). "Risk"is used here to mean some measure of the detrimental effectsthat may be associated with a technology. The technical datathat describe these risks may be classified into:
events and their probability of occurrence (e.g.emissions, accident sequences, wind direction, etc.)consequences of these events (e.g. health effects,property damage, etc.)distribution of consequences within the populationaffecteduncertainties in these estimates
The measurement of the technological risk in terms of thesecategories may be termed the "objective" part of the risk,although they will often have a certain degree of subjectivity,introduced by the judgments of the technical experts. However,the combination rule for aggregation of these data is not specified by any natural law. Therefore, there is no such thing asan objective unified measure of risk. Any mathematical procedure to combine these data is part of an evaluative processand thereby subjective.
Since methods for integrating the above mentioned categories of technical data which describe risks have not yet beensufficiently developed, the measure to be used here is theexpected value, where risk is defined as the multiplicativecombination of probability and the consequences of an event.It should be noted that this procedure has the effect of treatingone death per year as equivalent to 100 deaths occurring oncein 100 years.
-5-
Further, these calculations will be limited to impacts onhuman health. This poses the difficult problem of aggregatingrisks due to deaths and illnesses. As sooner or later everybodyhas to die, death will be quantified in terms of loss of yearsof life. It is common to equate each fatality with a loss of6,000 man-days (U.S. Atomic Energy Commission 1974, AmericanNational Standards Institute 1968), and this procedure is usedin this paper. However, it is possible to apply the followingmethodology to any otherwise defined measure of risk.
THE RISK OF PRODUCING GOODS AND SERVICES
The Methodology
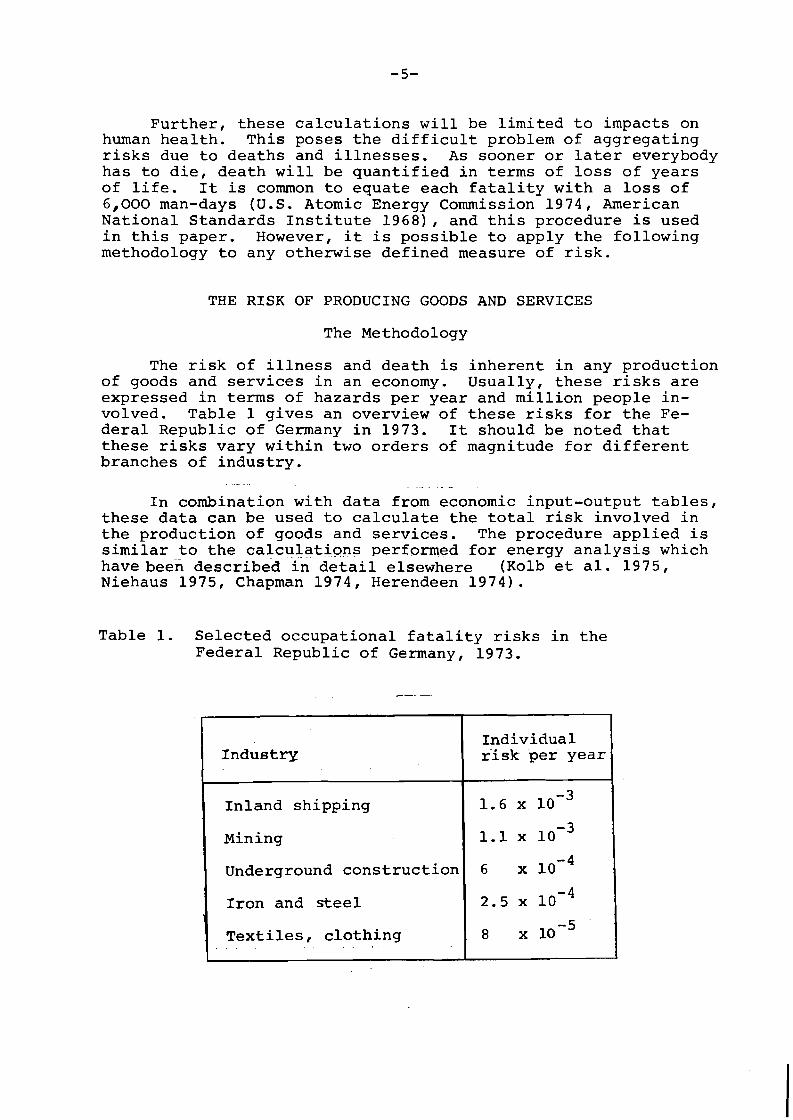
The risk of illness and death is inherent in any productionof goods and services in an economy. Usually, these risks areexpressed in terms of hazards per year and million people involved. Table 1 gives an overview of these risks for the Federal Republic of Germany in 1973. It should be noted thatthese risks vary within two orders of magnitude for differentbranches of industry.
In combination with data from economic input-output tables,these data can be used to calculate the total risk involved inthe production of goods and services. The procedure applied issimilar to the calcu~~t~9ns perform~d for energy analysis whichhave been described in detail elsewhere (Kolb et ale 1975,Niehaus 1975, Chapman 1974, Herendeen 1974).
Table 1. Selected occupational fatality risks in theFederal Republic of Germany, 1973.
IndividualIndustry rlskper year
Inland shipping 1.6 x 10⁻³
Mining 1.1 x 10⁻³
Underground construction 6 x 10⁻⁴
Iron and steel 2.5 x 10⁻⁴
Textiles, clothing 8 x 10⁻⁵. .
-6-
Sec- y Itor 1 , .... J ......
- -"..-..~._-
1 ·to· X1
·· from···I A·· . --l(; XiIJ 1
·····n
Xi = L A·· ·X·+ y.j=1
IJ J I
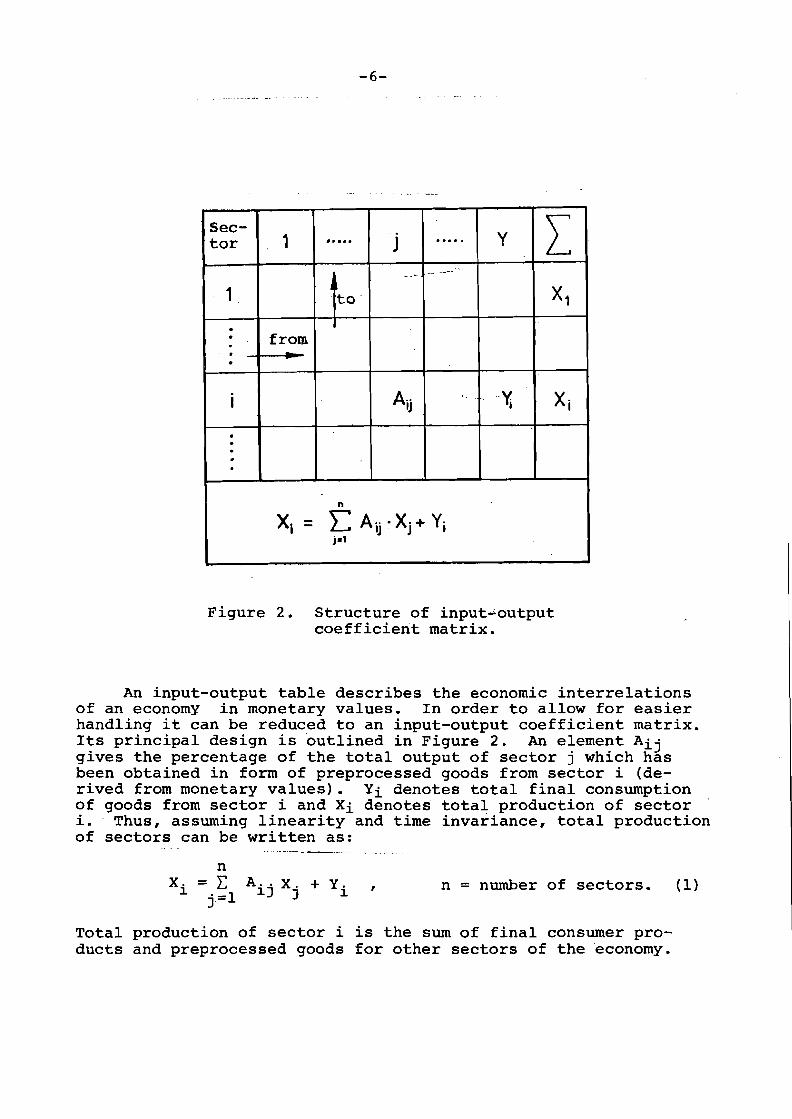
Figure 2. Structure of input~output
coefficient matrix.
An input-output table describes the economic interrelationsof an economy in monetary values. In order to allow for easierhandling it can be reduced to an input-output coefficient matrix.Its principal design is outlined in Figure 2. An element Aijgives the percentage of the total output of sector j which hasbeen obtained in form of preprocessed goods from sector i (derived from monetary values). Yi denotes total final consumptionof goods from sector i and Xi denotes total production of sectori. Thus, assuming linearity and time invariance, total productionof sectors can be written as:
nX. = E A .. X. + Y.
1 . -1 1J} 1J-n = number of sectors. (l)
Total production of sector i is the sum of final consumer products and preprocessed goods for other sectors of the economy.

-7-
This can be written more easily in the form of vectors (e~g. X)and matrices (e.g. ~~ as
x = AX + Y=-
It follows that
X = (I A) -1 Y:::!::::=:=::::::=:: I = unit matrix.
=
(2 )
(3)
{I - A)-l- is'known as the'inverse Leontief matrix.
The elements of this matrix (I - A>i3 denote t~e.percentageof a value unit which has to be produced ny sector 1 ln termsof preprocessed goods for all other sectors in order to allowfor the production of one value unit of goods of sector j.
Its meaning is better understood if the matrix is developedinto a series
{I _ A)-l = £ + ~ + ~2
If one considers the vector of final consumption Y thenthe vector for final production ~O and the nth step of-preprocessing are given (for n = 1,2 ..• J by
= I Y= -
( 4)
~l
Z A Z = 8_2~~ = =-1
-8-
Total production therefore is
00
X = L Zn=O -n
2= (~ + ~ + ~ ... )Y (5)
which is equivalent to Equation (3).
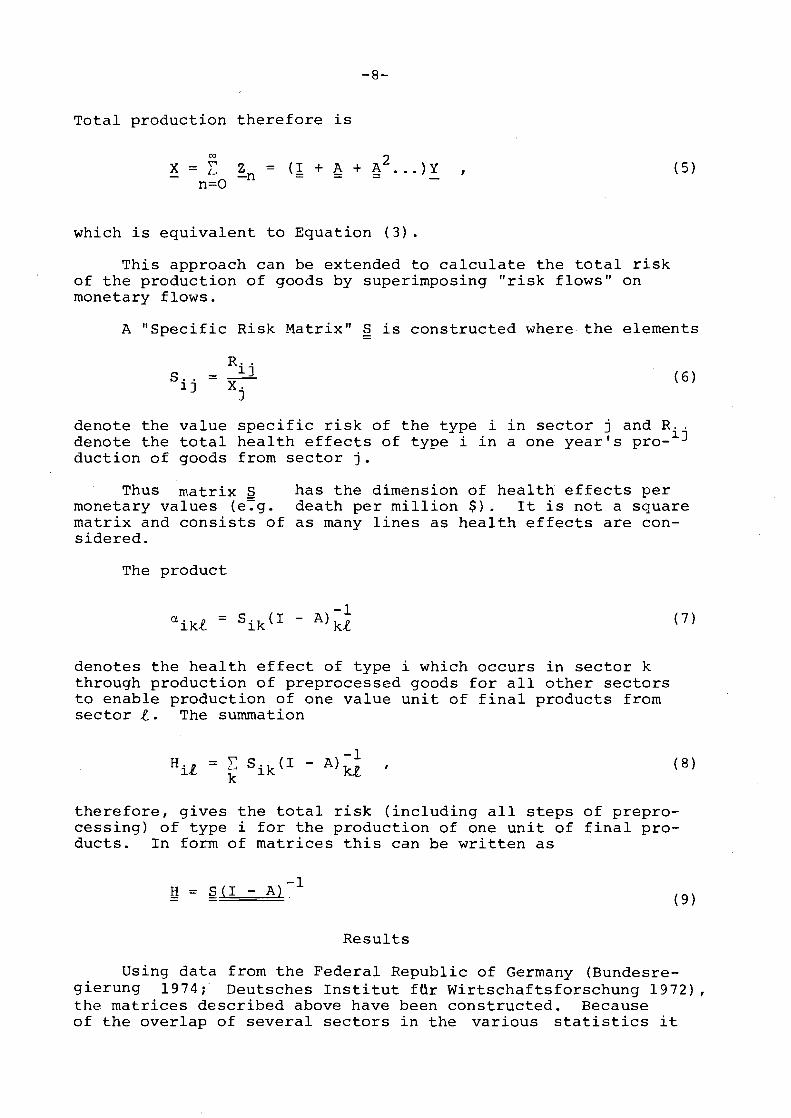
This approach can be extended to calculate the total riskof the production of goods by superimposing "risk flows" onmonetary flows.
A "Specific Risk Matrix" S is constructed where the elements
S ..1J
R ..= 1Jx:
J
(6 )
denote the value specific risk of the type i in sector j and R ..denote the total health effects of type i in a one year's pro_1 J
duct ion of goods from sector j.
Thus matrix Smonetary values (e~g.matrix and consists ofsidered.
The product
has the dimension of health effects perdeath per million $). It is not a squareas many lines as health effects are con-
( 7)
denotes the health effect of type i which occurs in sector kthrough production of preprocessed goods for all other sectorsto enable production of one value unit of final products fromsector f. The summation
(8)
therefore, gives the total risk (including all steps of preprocessing) of type i for the production of one unit of final products. In form of matrices this can be written as
( 9)
Results
Using data from the Federal Republic of Germany (Bundesregierung 1974; Deutsches Institut fUr Wirtschaftsforschung 1972) ,the matrices described above have been constructed. Becauseof the overlap of several sectors in the various statistics it
-9-
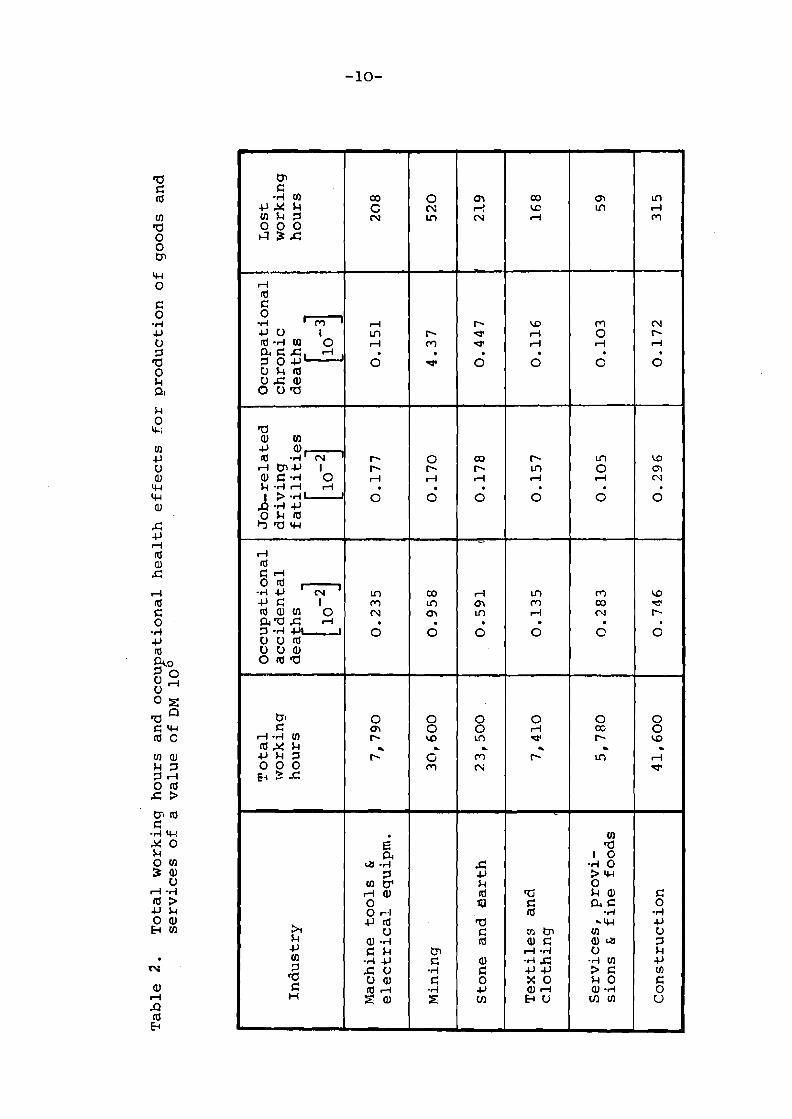
became necessary to aggregate the original 60 sectors of theinput-output table and the 38 sectors of accident statisticsto 19 sectors (e.g. machine tool industry and electrical equipment sector had to be aggregated). Table 2 gives the resultsof such a calculation for a sample of sectors. It should beborne in mind that, for example, the data on construction alreadyinclude the data of production of preprocessed goods which thissector receives from other sectors such as "mining" or "stoneand earth" industry. The first column gives the total workinghours which have to be used to produce goods of the value ofDM 1 million of that sector. The large differences reflectthe various proportions of labour, know-how and capital (machinery) involved.
The other columns give the respective health effects. Itcan be seen that occupational accidents and job-related drivingfatalities are of the same order of magnitude. Column 4 givesoccupational chronic deaths. They occurred during the yearunder consideration. However, they have been caused by exposureto pollutants during previous work.
THE RISK OF PRODUCTION OF SAFETY EQUIPMENT
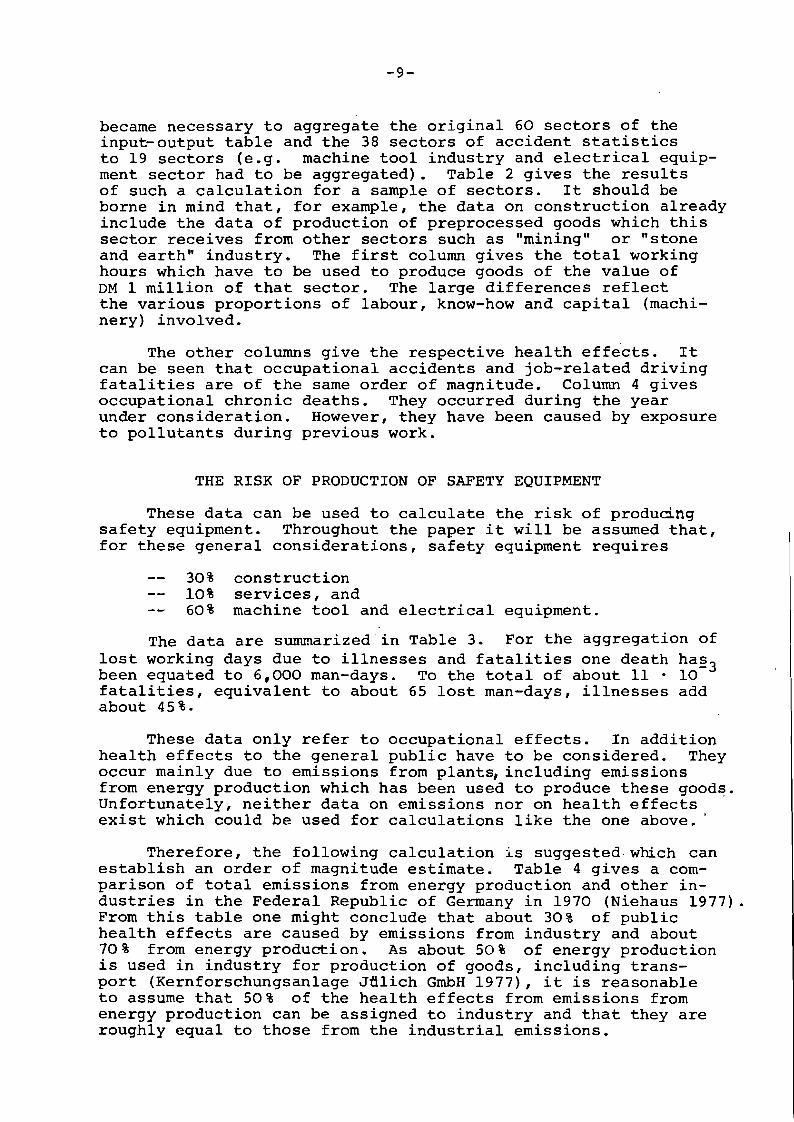
These data can be used to calculate the risk of producingsafety equipment. Throughout the paper it will be assumed that,for these general considerations, safety equipment requires
30% construction10% services, and60% machine tool and electrical equipment.
The data are summarized in Table 3. For the aggregation oflost working days due to illnesses and fatalities one death ha~3
been equated to 6,000 man-days. To the total of about 11 . 10fatalities, equivalent to about 65 lost man-days, illnesses addabout 45 %.
These data only refer to occupational effects. In additionhealth effects to the general public have to be considered. Theyoccur mainly due to emissions from plants, including emissionsfrom energy production which has been used to produce these goods.Unfortunately, neither data on emissions nor on health effects .exist which could be used for calculations like the one above. '
Therefore, the following calculation is suggested which canestablish an order of magnitude estimate. Table 4 gives a comparison of total emissions from energy production and other industries in the Federal Republic of Germany in 1970 (Niehaus 1977).From this table one might conclude that about 30% of publichealth effects are caused by emissions from industry and about70 % from energy producti on • As about 50 % of energy productionis used in industry for production of goods, including trans-port (Kernforschungsanlage J~lich GmbH 1977), it is reasonableto assume that 50% of the health effects from emissions fromenergy production can be assigned to industry and that they areroughly equal to those from the industrial emissions.
Tab
le2
.T
ota
lw
ork
ing
ho
urs
an
do
ccu
pati
on
al
healt
heffects
for
pro
du
cti
on
of
go
od
san
dserv
ices
of
av
alu
eo
fDM
10
°.
To
tal
occu
pati
on
al
Jo
b-r
ela
ted
Occu
pati
on
al
Lo
stw
ork
Ln
qaccid
en
tal
dri
vin
gch
ron
icw
ork
ing
Ind
ustr
yh
ou
rsde
arhS
fati
liti
es
deat...h
sh
ou
rs
10
-2]
[1
0-2]
10-~
Mach
ine
too
ls&
7,7
90
0.2
35
0.1
77
0.1
51
20
8ele
ctr
ical
eq
uip
rn.
Min
ing
30
,60
00
.95
80
.17
04
.37
52
0
Sto
ne
an
d-e
art
h2
3,5
00
0.5
91
I0
.17
80
.44
72
19
Tex
tile
san
d7
,41
00
.13
50
.15
70
.11
61
68
clo
thin
g
Serv
ices,
pro
vi-
5,7
80
0.2
83
0.1
05
0.1
03
59sio
ns
&fi
ne
foo
ds
Co
nstr
ucti
on
41
,60
00
.74
60
.29
60
.17
23
15
I f-' o I

-11-
Table 3. Total ~ccupational risk of producing"DM 1 millionsafety equipment.
Total working hours 17,700
Lost working hours 225
Occupational accidental deaths 3.93 · 10-3
Driving fatalities 2.06 · 10-3
Occupational chronic deaths 0.153 . 10-3
Total deaths 6.14 · 10-3
.L: equivalent * 10-3death 10.8 .or
L:equiValent *lost working days 65
*1 death = 6,000 man-days

-12-
Table 4. Emissions in the Federal Republic of Germany, 1970 .
._- ._. - -_. .__.
Emission Percentage [%1
Pollutant
[106t/a J Energy Industry
CO 11.2 83 17
80 2 5~3 72 28
C H 3.3 76 24n m
NO 2.6 98 2x
Particulates 2.2 55 45
Using the method described, it is possible to calculatethe total energy necessary to produce industrial goods. A detailed calculation has been made (Niehaus 1975), which gives avalue of about 35 kg coal equivalent per OM 100 production ofmachinery and electric equipment goods. If it is further assumedthat energy is produced by coal, then data (Tattersall et al.1972) on public health effects from energy production (3 - 22deaths/GWa(e)) can be combined with the specific energy requirements. Assuming an efficiency of 40% from coal-fired plants,public risks from emissions of the required energy productionwould be about 1.3 • 10- 3 deaths per OM 106 for an average valueof 10 deaths/GWa(e). This value might be too high by a factor ofthree ,or to~ l~w by a factor of tWO._
3Addingthe effects of in
dustrlal emlSSlons a value of 3 • 10 deaths per OM 106 isassumed. A comparison with data from Table 3 shows that publiceffects from emissions are less than one third of the totaloccupational risks.

-13-
Public effects from job-related driving accidents areassumed to be equivalent to occupational driving accidents.Therefore, the total occupational and public risk of the production of safety equipment is estimated to be
-3 615 • 10 equivalent deaths/OM 10or
90 lost man-days
These data are6summarized
in Table 5. Therefore, theproduction of OM 65 • 10 safety equipment has a risk of 1 equivalent death.
Table 5. Occupational and public effects of production ofOM 1 million safety equipment.
Occupational
lost working hours 225
total death 6.14 . 10-3
~eqUiValent death 10.8 . 10-3
Public (equivalent death)
energy production 1.3 . 10- 3
industrial production 1.3 . 10-3
driving accidents 2.06 • 10-3
~eqUiValent death 4.66 • 10-3
Total
~eqUiValent death 15 • 10-3
or
~eqUiValent lost man-days 90

-14-
APPLICATION OF RESULTS
General Implications to Standard Setting
It was shown above that health effects of approximateGy 1
equivalent death are caused by the production of $ 30 • 10 worthof safety equipment as specified in this paper. This suggeststhat the general relationship of cost-effectiveness of risk reduction, as outlined in Figure 1, should be modified, as indicated in Figure 3, in order to represent health effects in thetotal economic system. Any achievement in technological safetythrough additional equipment has to be paid for not only byadditional costs but also by the occupational and public healtheffects caused by the production of this safety equipment. Thisrisk may be considered to be proportional to these safety investments. Therefore, if the total system of an economy is considered,the risk cannot be reduced to any given value; beyond a certainlimit the risk increases again with increasing expenditures forsafety equipment. The minimum of the risk~cost relationship isgiven when the marginal cost of risk reduction, i.e. the firstderivative of the curve labelled "operation" is equal to theslope of the linear relationship for investments. (1 death!$ 30 . 106). The initial design, without additions of safety
\\
\\
\
\
\
\\\ ,f- TOTAL SYSTEM
tINVESTMENT
COST ---,)
Figure 3. Principal relationship of cost-effectivenessof risk reduction considering the totaleconomic system.

-15-
measures, poses a risk (So) that is determined by factors intrinsic to the technological process. As a consequence, nofixed number can be attached to the absolute values of the risksor the costs .defining the minimum.
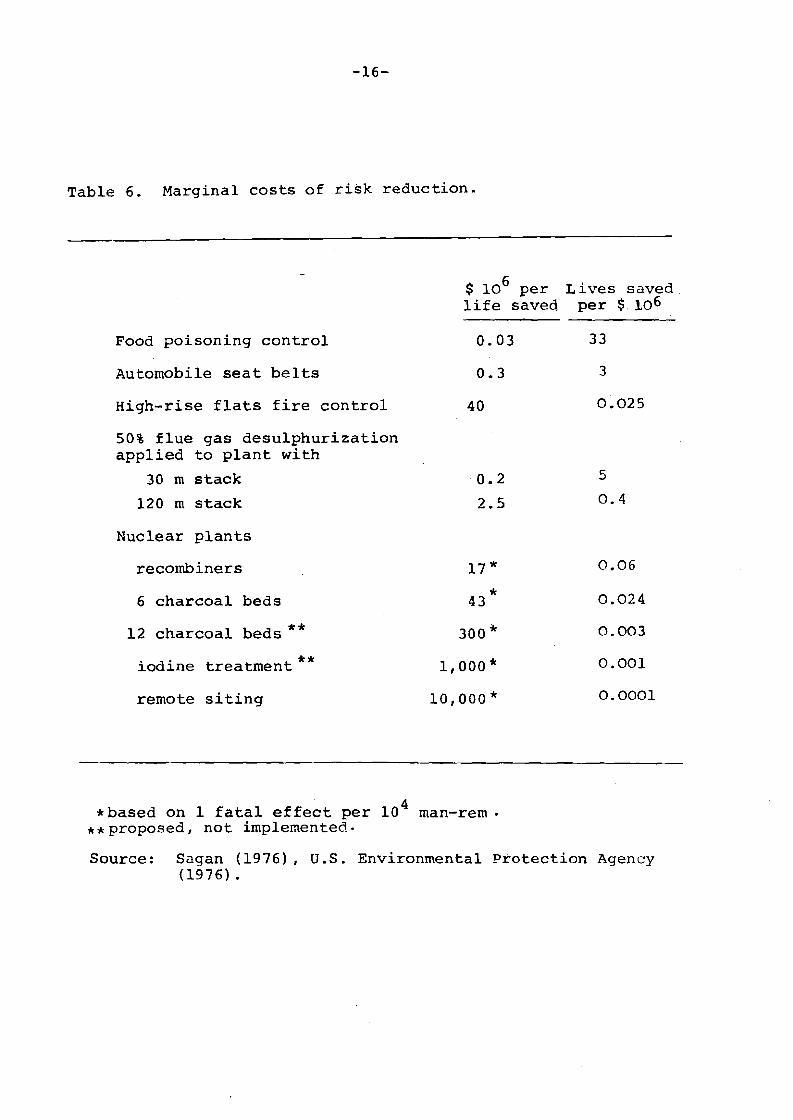
Thus any expenditure on safety equipment has the effect ofreducing the expected number of health effects predicte1tooccur during the lifetime operation of the plant at the expenseof causing some effects during the construction phase. Moreover,if the safety investments are greater than the amount indicatedby the minimum of the curve, then the current health impact willactually be larger than the reduction in future expected effects.For example, Table 6 gives a listing of safety expenditures(Sagan 1976) that have been applied or proposed in various areas.It is apparent that the minimum value, at a marginal cost of$ 30 • 106 per expected equivalent death reduced, has actuallybeen exceeded.
However, even expenditure at the minimum of the curve wherethe same number of health effects are merely antedated still represents a drain on societal resources. In terms of expectedeffects there is no net benefit, but Table 3 shows that theavoidance of one future expected equivalent death (therebycausing it today) requires about 20 people to work for 30 years(600 man-years) in the production of safety equipment. Inaddition, it ignores the possibility that medical and technicaladvances will be able to reduce the risk in an alternativemanner in the future.
Safety expenditures at lower cost than indicated by theminimum would result in a net reduction of health effects anda standard value would have to be determined by a trade-offbetween required costs and man-power, and reduction of healtheffects. These relationships will be studied in more detailbelow.
As has been described above practical case studies generallyshow that costs of risk reduction follow an exponential law andin some cases even exponential power functions. As a conservative estimate an exponential function is assumed here.
Therefore, the total system risk-cost 'relationship ofFigure 3 can be described as
C--(lO)
where R = risk level, c = cost of safety equipment.
-16-
Table 6. Marginal costs of risk reduction.
Food poisoning control
Automobile seat belts
High-rise flats fire control
50% flue gas desulphurizationapplied to plant with
30 m stack
120 m stack
$ 106 perlife saved
0.03
0.3
40
0.2
2.5
Lives savedper $.106
33
3
0.025
5
0.4
Nuclear plants
recombiners 17 * 0.06
6 charcoal beds * 0.02443
12 charcoal beds ** 300 * 0.003
iodine ** 1,000 * 0.001treatment
remote siting 10,000* 0.0001
4* based on 1 fatal effect per 10 man-rem.**proposed, not implemented.
Source: Sagan (1976), u.S. Environmental Protection Agency(1976).
-17-
with:
RO = risk of initial design
Co = constant for a particular technology
r = specific risk of producing safety equipmentp (1 death/$ 30 . 106)
The minimum is derived by
dRdc
c--e· c O + = 0r
p( 11)
Therefore, when the costs are:
the minimum risk level ~ is given by
(12)
(13 )
As outlined above the initial design described by RO andc = 0 has been arbitrarily defined. Therefore, no meaning isattached to the absolute values of ~ and c M. It has to beemphasized that these values should not be used to comparedifferent technologies. They only indicate the minimum expectedrisk achievable given a specific design.
However, the shape of the minimum is the same no matter whichdesign Ro has been chosen as initial value. Sensitivity studiestherefore should not be made with regard to relative changes inrisk or cost but with regard to their absolute values.
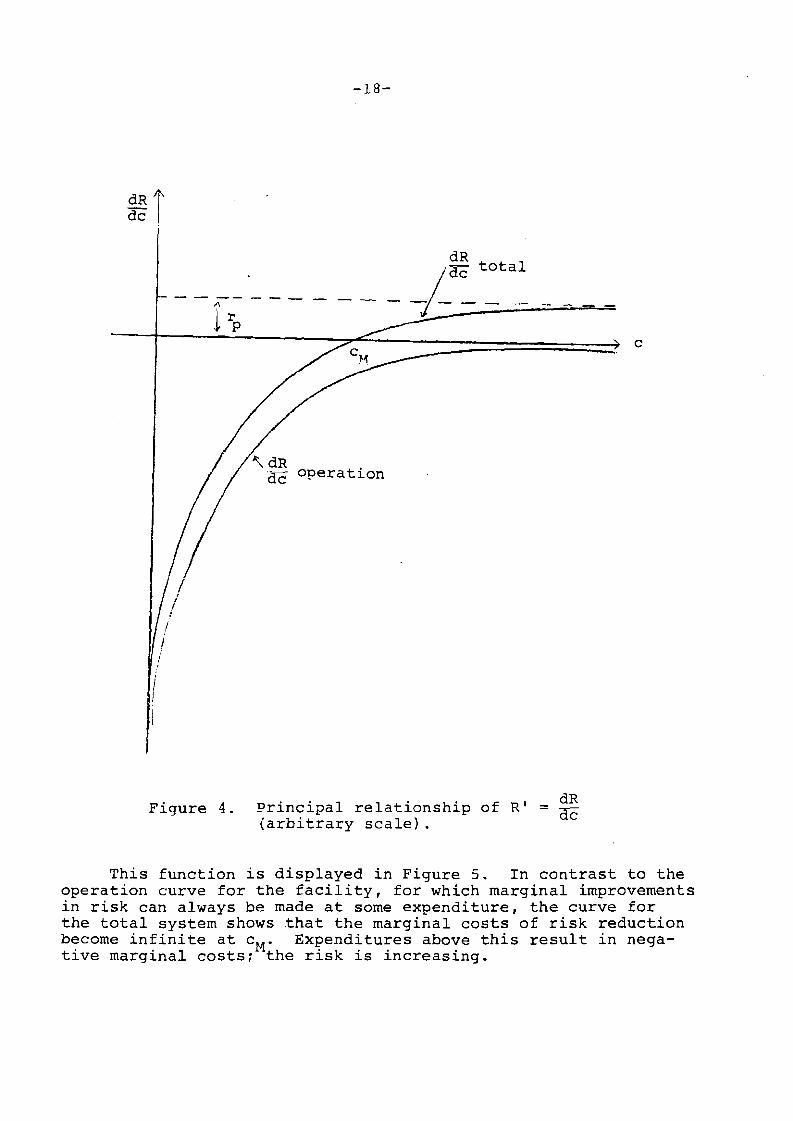
Figure 4 indicates graphically the impact of r on the first
derivative R' = ~R (see Equation 11) ." Taking r .. inio accountshifts the asympe8te for the operation curve inEo positive values.Because of the exponential shape of the curve, c~i is sensitiveto the value of r p.
The negative inverted function of R' gives the marginalcosts of risk reduction
dc = fCc) =-dR
(:~)
1
c--e cO - r
p
(14)
-18-
dR tdc I
dRIdc total
-/~ - _ ..-
operation
fr
II
c
Figure 4. Principal relationship of R '(arbitrary scale).
dR= dc
This function is displayed in Figure 5. In contrast to theoperation curve for the facility, for which marginal improvementsin risk can always be made at some expenditure, the curve forthe total system shows that the marginal costs of risk reductionbecome infinite at cM. Expenditures above this result in negative marginal costs; the risk is increasing.
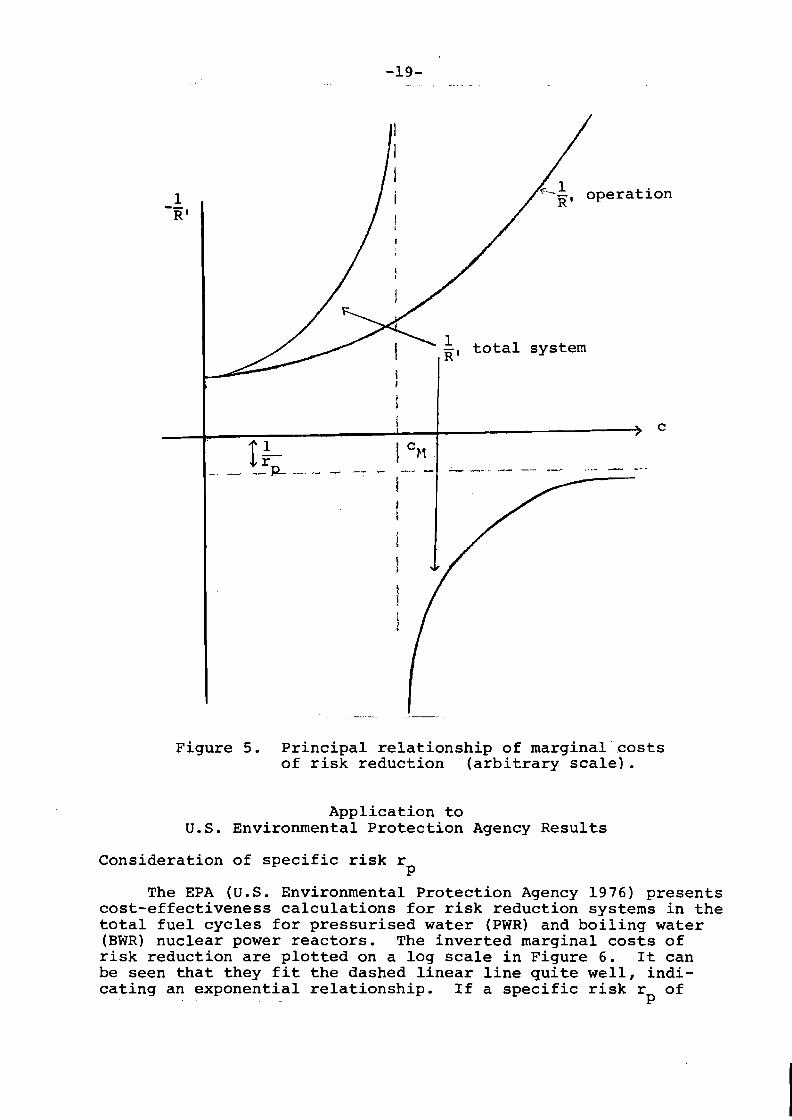
-19-
operation
total system
c
Figure 5. Principal relationship of marginal"costsof risk reduction (arbitrary scale).
Application toU.S. Environmental Protection Agency Results
Consideration of specific risk rp
The EPA (U.S. Environmental Protection Agency 1976) presentscost-effectiveness calculations for risk reduction systems in thetotal fuel cycles for pressurised water (PWR) and boiling water(BWR) nuclear power reactors. The inverted marginal costs ofrisk reduction are plotted on a log scale in Figure 6. It canbe seen that they fit the dashed linear line quite well, indicating an exponential relationship. If a specific risk r of
" p

1000
.'0
0()
PW
RD
AT
AI
BW
RD
AT
A<
J>
/00I
<J>
\0\0
100.
00
<jr-
l
<,
~II)
II)
+J
/0.0
+J
,OJ)
oo
QJ
QJ
l.Hl.H
l.Hl.H
/.O~
!r_
eff
f:<1r
peff
M<
J<
,<J
II)"
II)+
J""
..j,J
II)
QIII)
4.10
rp0
r po
o<
,
r-l
r-l
Ittl
ttl<
,IV
~0.
0/~
0-01
,<,
0·r
i<
,·r
i.....
IO
'l-,
tr.
~~
ttl-,
ttl~
O.DO
/~
~,OD'I
I.....
......
<,
<,
<,
().O
O()
II
II
!!
II
II
I0.
0001
II
II
I\
\
0.2-
J(,
, to
IlIII
/6"
.20
0.2-
if6
B10
,~
,,,16
"so
:1~
.ll(~
~I
Cu
mu
lati
ve
co
sts
$lO
6/ G
w(e
)C
um
ula
tiv
eco
sts
$lO
6/ G
w(e
)
Fig
ure
6.
Co
st-
eff
ecti
ven
ess
of
risk
red
ucti
on
.

-21-
1 death/$ 30 . 106 is applied, it can be seen that severalsafety reduction systems have been considered that would infact prevent less expected health effects than would be causedduring their production.
At total cumulative costsBWR, the marginal cost of riskeconomic system--would become
6of about $ 12 . 10 forreduction--consideringinfinite (See Figures 4
PI"1R andthe totaland 5).
It has to be noted that equating one effect in the futurewith one effect during construction already contains a valuejudgment. We agree with the suggestions (Cohen and Tewes 1979)that no discounting factor should be applied for future effects;that therefore one effect in the future should be considered asserious as one effect today. However, this does introduce afactor of conservatism into the calculations as no credit isgiven to the development of improved methods for medical treatment in the future.
Consideration of r p and labour requirements
As discussed above, it is not suggested that this absolutelimit where marginal costs of risk reduction become infinite,should be the barrier to risk reduction. It has been explainedthat, at this minimum achievable risk, 615 man-years of labourrequirements would be associated with shifting each healtheffect from the time period of operation (or later) to thetime period of construction.
The labour requirements may be included in the specificproduction risk r p in order to present a more realistic suggestedlimit for safety ~xpenditure. However, this poses the valuequestion concerning the aggregation of health effects andlabour needs. One way to look at this problem is to considerthe extent to which society is prepared to utilize the availablelabour resources in the reduction of technological hazards. Itis clear that this problem needs considerable study and a solution cannot be provided here. However, if it is assumed thatsociety should expend 1 man-year of work to gain one man-year oflife, one may equate, expected effects and the equivalent manyears of labour. This would allow for an aggregation in termsof man-lives. If one health effect is estimated to lead to aloss of one life, or 6,000 man-days, then 17,800 working hoursper DM 106 would be equivalent to about 22 man-lives per $ 30 . 106.
Thus the value of the effective specific production riskr p eff becomes
r =p eff22 man-lives
r p + $ 30 . 106 = 23 man-lives$ 30 . 106- (15)
This value is also indicated in Figure 6 and is clearlydominated by the labour requirements.

-22-
The condition for minimum risk using this revised value,r p eff, is that the marginal cost of risk reduction has to beequal to $ 1.3 . 106•
Application to Remote Reactor Siting
Based on data from the draft document of WASH 1400 the marginal costs of risk reduction for remote reactor siting were calculated (Niehaus et ale 1977). Figure 7 plots those marginalcosts of risk reduction in $/equivalent man-rem versus distancebetween a nuclear plant and a densely populated area. Using theequivalence between 1 death and 10 4 man-rem, l/r can be converted into $ 3,OOO/man-rem or $ 30,OOO/man-rem,Prespectively.These values are also indicated in Figure 7. However, they arenot conservative estimates because the construction of high-voltage transmission lines will involve a higher risk than will theproduction of safety equipment. These results show that, beyond
acute death310 man-remr-, ~p= s .3·0, OOO/man-rem
+-1 acute death ~ 10 4 man-rem---- _...........--_.__._.-
; = $ 3,000/man-remp
5010 20 30 40 60.*Distance
70(kIn)
80 90 100 ] 10
*Distance between nuclear power plant and densely populated area.
Figure 7. Marginal costs of risk reduction for remote reactor siting.

-23-
a distance of about 30 km, more health effects are expected tooccur during construction of the transmission line than areexpected to be saved through remote reactor siting. If arpeff of 23 man-lives per $ 30 • 106 is used, the equivalentconversions for l/rpeff become $ 130 and $ 1,300 per man-remand these are far below the marginal costs of risk reductionimplied by remote reactor siting as plotted in Figure 7. Thismeans that the extra labour man-hours for construction of thetransmission line will be greater than the expected loss inpopulation lifetime for all conceivable accidents to the reactorsystem.
Reduction of Radiation Doses to Nuclear Plant Operators
A value of $ 1,000/ma~remhas been advocated by the U.S.Nuclear Regulatory Commission and others (Niehaus and Otway 1977,U.S. Nuclear Regulatory Commission 1975) as an appropriate indexfor use in determining the cost-effectiveness of nuclear radiation risk reduction measures. From the figures given aboveit is evident that if the risk is to be reduced by constructionof added safety features, then this value is an upper limitfrom a risk and labour time aspect. Conversely, it has beenargued (Atomic Industrial Forum 1978) that if radiation exposures can be reduced by planning and administrative procedures,then costs can be minimised by reduced down-time and use offewer men. In this case, the risk reduction would not be associated with added risks elsewhere in the system and the minimumrisk would not be applicable.
CONCLUSIONS
It has usually been assumed that it is always possible toreduce a risk below any given value and that the only limitationis the associated increased costs. As a result of this assumption the question of "how safe is safe enough" is posed. However, such a relationship only holds true for a single systemelement (e.g. a specific facility). If the total economic systemis considered one has to take account of the fact that safetyequipment has to be produced. This production leads to anoccupational risk and also a risk to the public in the sameway as the manufacture of any industrial goods. This risk isestimated to be one equivalent death per $ 30 . 106 worth ofsafety equipment produced. In addition, about 615 man-yearsof labour are involved.
Thus this paper concludes that the risk-cost relationshipactually shows a minimum beyond which additional expendituresintended to reduce a risk will actually increase it. It hasbeen demonstrated that several applied or proposed risk reductionmeasures already exceed such a minimum level.
The levels quoted here have been derived in a general mannerand may not be applicable to any particular situation, nevertheless they do reflect the orner of magnitude that would be obtained
-24-
with a more specific analysis. However, before this methodology is applied to any particular cost-effectiveness problem thefollowing aspects have to be considered in greater detail:
how to define risks (expected health effects have beenused here);how to compare health effects and labour requirements(and costs);how to compare health effects today versus healtheffects which would occur in the future: andhow to compare occupational and public health effects.
One may deduce from the results shown above and using theassumptions given that there is a tendency for present day expenditures on certain safety items to be excessive. In other wordsthe risk is not minimised. However, the basic assumption,namely that risk ought to be minimised, has not been questioned.Although cost-effectiveness techniques can be used to identifythe minimum risk, no evaluation is given as to whether thisminimum is itself low enough. The solution to this problemwhich is closely allied to the four aspects mentioned above,demands further investigation into individual and group atti-tudes towards risk and risk reduction.
The conclusions drawn in this paper do depend on the variousassumptions made. Alternative assumptions could give differentresults, however, the general methodology is valid and couldstill be applied.

-25-
REFERENCES
American National Standards Institute (1968) Method of Recordingand Measuring Work Injury Experience. ANSI-Z16-1-67.New York.
Atomic Industrial Forum (1978) Potential Benefits of ReducingRadiation Exposure. AIF/NESP-010. Washington D.C.
Black, S., F. Niehaus and D.M. Simpson (1978) Nutzen und Risikenbei alternativen Energieversorgungssystemen. TechnischeMitteilungen 8/9:446-452.
Bundesregierung (1974) Bericht der Bundesregierung Uber denStand der UnfallverhUtung und das Unfallgeschehen in derBundesrepublik Deutschland. Bonn: UnfallverhUtungsberichtDrucksache 7/2622.
Chapman, P. (1974) The Ins and Outs of Nuclear Power. NewScientist 64:866-869.
Cohen, J.J. and H.A. Tewes (1979) Development of RadiologicalCriteria for Nuclear Waste Management. IAEA-SR-36-22.Paper presented at the Topical Seminar on the PracticalImplications of the ICRP Recommendations (1977) and theRevised IAEA Basic Standards for Radiation Protection.Vienna, Austria: IAEA.
Deutsches Institut fUr Wirtschaftsforschung (1972) Input-OutputRechnung fUr die Bundesrepublik Deutschland 1972, editedby R. Pischner, R. St~glin and H. Wessels. Berlin: Dunker& Humboldt.
Fischhoff, B., P. Slovic, S. Lichtenstein, S. Read and B. Combs(1978) How Safe is Safe Enough? A Psychometric Study of Attitudes towards Technological Risks and Benefits. PolicySciences 8: 127-152 •

-26-
Herendeen, R. (1974) The Use of Input-Output Analysis to Determine the Energy Costs of Goods and Services. Pages 141-158,Energy: Demand, Conservation and Institutional Problems,edited by M. Macrakis. Cambridge, Mass.: MIT Press.
Higson, D.J. (1978) The Development of Safety Criteria for Usein the Nuclear Industry. Presented at the Sixth NationalChemical Engineering Conference in Queensland, Australia,November 6-8, 1978.
Inhaber, H. (1978) Risks of Energy Production. AECB 1119.Ottawa, Ontario, Canada: Atomic Energy Control Board.
Kernforschungsanlage Jftlich GmbH (1977) Angewandte SystemanalyseNr. 1. Die Entwicklungsm~glichkeitender Energiewirtschaftin der Bundesrepublik Deutschland - Untersuchung mit Hilfeeines dynamischen Simulationsmodells. Pages 37-44, JftlSpez-l/Band 1, November 1977, ISSN 0343-7639.
Kolb, G., F. Niehaus, S. Rath-Nagel und A. Voss (1975) DerEnergieaufwand fftr den Bau und Betrieb von Kernkraftwerken.Jftl-1230. Jftlich, Federal Republic of Germany: KFA Jftlich.
Linnerooth, J. (1977) The Evaluation of Public Programs AffectingPopulation Mortality. Ph.D. Dissertation, Faculty of· the .Graduate School, University of Maryland, College Park,Maryland. .
Niehaus, F. (1975) Nettoenergiebilanzen - Ein Hilfsmittel zurAnalyse von Energienutzungsstrukturen. Brennstoff - W~rme Kraft 10:395-400.
Niehaus, F. (1977) Computersimulation langfristiger Umweltbelastung durch Energieerzeugung: Kohlendioxyd, Tritium undRadiokohlenstoff, ISR 41. Page 3. Basel, Switzerland:Birkh~user Verlag.
Niehaus, F. and H.J. Otway (1977) The Cost-Effectiveness ofRemote Nuclear Reactor Siting. Nuclear Technology 34:387-397.
Otway, H.J., J. Linnerooth and F. Niehaus (1977) On the SocialAspects of Risk Assessment. Paper presented at the Internati< 1al Conference on Nuclear Systems Reliability Engineering and Risk Assessment, Gatlinburg, USA, June 20-24, 1977.Proceedings published by the Society for Industrial andApplied Mathematics.
Reactor Safety Study (1974) An Assessment of Accident Risks inU.S. Commercial Nuclear Power Plants. u.S. AEC, WASH-1400.Draft.
Reactor Safety Study (19i5) An Assessment. of Accident Risks inu.S. Commercial Nuclear Power Plants. U.S.NRC,NUREG-75/a14(WASH-1400). Main report.

-27-
Rowe, W.D. (1977) An Anatomy of Risk. New York: John Wiley& Sons.
Roy, C. and M.-F. Ciceri (1978) A Propos des Problemes Statistiquesposes par les Evenements Rares dans Ie Domaine de la Surete.Fontenay-aux-Roses, France: Centre d'Etudes sur l'Evaluationde la Protection dans Ie Domaine Nucleaire.
Sagan, L. (1976) Public Health Aspects of Energy Systems. Pages87-111, Energy and the Environment - A Risk-Benefit Approach,edited by H. Ashley, R.L. Rudman and C. Whipple. New York:.Pergamon Press.
Schaefer, R.E. (1978) What Are We Talking About When We TalkAbout "Risk"? A Critical Survey of Risk and Risk PreferenceTheories. RM-78-69. Laxenburg, Austria: InternationalInstitute for Applied Systems Analysis.
Tattersall, J.O., D.M. Simpson and R. A. Reynolds (1972) A Discussion of Nuclear Plant Safety with Reference to OtherHazards Experienced by the Community. Page 671, A/CONF. 49.Vienna, Austria: IAEA.
u.S. Atomic Energy Commission (1974) Comparative Risk-Cost-BenefitStudy of Alternative Sources of Electrical Energy. WASH 1224.Washington D.C.
u.S. Environmental Protection Agency (1976) Environmental Radiation Protection Requirements for Normal Operations ofActivities in the Uranium Fuel Cycle. EPA-520/4-76-016.Washington D.C. .
u.S. Nuclear Regulatory Commission (1975) Radioactive Materialin Light-Water Cooled Nuclear Power Reactor EffluentsProposed Regulations to Title 10, Part 50. Vol. 40, No. 87.Washington D.C.