nose temperature and anticorrelation between
TRANSCRIPT
1
Nose Temperature and Anticorrelation between
Recrystallization Kinetics and Molecular Relaxation
Dynamics in Amorphous Morniflumate at High
Pressure
Michela Romanini,† Sergio Rodriguez, Sofia Valenti, María Barrio, Josep Lluis Tamarit, Roberto
Macovez*
Grup de Caracterització de Materials, Departament de Física and Barcelona Research Center in
Multiscale Science and Engineering, Universitat Politècnica de Catalunya, EEBE, Campus
Diagonal-Besòs, Av. Eduard Maristany 10-14, E-08019 Barcelona, Catalonia, Spain.
* Corresponding author: [email protected]

2
ABSTRACT
We probe the dielectric response of the supercooled liquid phase of Morniflumate, an active
principle with anti-inflammatory and antipyretic properties, studying in particular the pressure and
temperature dependence of the relaxation dynamics, glass transition temperature Tg, and
recrystallization kinetics. Tg increases by roughly 20 K every 100 MPa at low applied pressure,
where the ratio Tg/Tm has a constant value of ∼ 0.8 (Tm = melting point). Liquid Morniflumate
displays two dielectric relaxations: the structural α relaxation associated with the collective
reorientational motions which become arrested at Tg, and a secondary relaxation likely
corresponding to an intramolecular dynamics. The relaxation times of both processes scale
approximately with the inverse reduced temperature Tg/T. Near room temperature and under an
applied pressure of 50 MPa, supercooled Morniflumate recrystallizes in a characteristic time of
few hours, with an Avrami exponent of 1.15. Under these conditions, the recrystallization rate is a
nonmonotonic function of temperature, displaying a maximum around 298 K, which can be taken
to be the optimum crystal growth temperature Tnose. The β relaxation becomes kinetically frozen
at ambient temperature under an applied hydrostatic pressure higher than 320 MPa, suggesting that
the Morniflumate glass should be kinetically stable under these conditions.
KEYWORDS: glassy drug stability, dielectric spectroscopy, secondary relaxation,
recrystallization kinetics, optimum crystal growth temperature.

3
1. Introduction
In recent years many active pharmaceutical ingredients (APIs) with poor aqueous solubility have
reached the drug development stage by means of formulation in the amorphous solid or
supercooled liquid state.1-4 Below the melting temperature, the amorphous form of an API (both
supercooled liquid and glass) has lower density and higher free energy than the crystalline phase.
This entails on one hand that the amorphous API has a better dissolution profile in the biological
medium and thus a higher bioavailability,5 but on the other hand, that such phase is
thermodynamically unstable against recrystallization into the poorly soluble crystal phase.6 In this
context, it is of interest to study the amorphous form of APIs and the recrystallization kinetics, and
to determine the metastability conditions of this non-equilibrium form and whether strategies can
be devised to maintain it for longer storage times.7
It has been suggested by several authors that the recrystallization rate and onset times, and
therefore indirectly the kinetic stability of the amorphous phase, are directly correlated with the
characteristic times of molecular relaxation processes in the amorphous phase, both above the glass
transition temperature,8,9 where the dynamics is dominated by the cooperative structural (α)
relaxation which vitrifies at Tg, and below such temperature, where only secondary relaxations
take place.10,11 These secondary relaxations can correspond to local, intramolecular motions
involving the rotation of a polar subpart of a molecule, or else be so called Johari-Goldstein (JG)
relaxations. The JG relaxation is a molecular dynamics process of glass forming materials that
involves the motion of the constituent molecules as a whole, but that contrary to the α relaxation
is active also in the glass state below Tg.12,13 It is found in many instances that, as a rule of thumb,
the amorphous state of an API can be maintained for a commercially significant time if it is stored
well below the glass transition, following the so-called “Tg − 50 K” rule.14-16 The relatively high

4
kinetic stability of the amorphous phase under these conditions is related to a slow nucleation and
growth kinetics of the crystal phase; nucleation is generally avoided deep in the glass state, unless
other external stimuli are applied, inducing phenomena such as strain-induced fracture17 or
electric-field dependent polymorphism.18 Recent studies indicate that the “Tg − 50 K” rule should
be reformulated in terms of the freeze temperature of secondary relaxations, that is, long-term
kinetic stability of the glass state against recrystallization can be obtained at a storage temperature
below the temperature at which the secondary relaxations freeze out.11,19
It has been suggested that obtaining the amorphous phase under high pressure conditions may
improve its kinetic stability, based on the fact that Tg increases with increasing pressure. However,
this conjecture has not been tested in detail; the effect of applying a pressure on a supercooled
liquid is in some cases opposite, with an increased tendency towards nucleation of the crystalline
phase, possibly due to pressure-induced shock accelerating nucleation.20,21 The effect of the
increased density on the crystallization kinetics is instead different for different compounds.22 In
general, the relaxation dynamics and recrystallization kinetics are much less studied under an
applied hydrostatic pressure than at atmospheric pressure.
The application of pressure allows studying for example the possible existence, for the relaxation
times of the studied dynamic processes, of scaling relations such as the so-called density-
dependent “thermodynamic scaling”,23-27 whose range of applicability is debated,28,29 or the
master-curve scaling as a function of the inverse reduced temperature Tg/T. A common scaling of
the secondary relaxation time and of the structural relaxation time is considered to be a distinctive
feature of the JG relaxation,30 which is generally not shared by local relaxations corresponding to
the reorientational motions of polar subgroups of a molecule.31

5
In this contribution, we employ broadband dielectric spectroscopy to study the dependence on
pressure and temperature of the relaxation dynamics of a glass-forming anti-inflammatory drug,
Morniflumate, as well as its recrystallization kinetics at high pressure. The glass transition
temperature displays a very large increase by almost 90 K when the pressure is increased from
ambient conditions to 520 MPa. The dielectric loss spectra are characterized by the presence of a
structured, multicomponent main loss feature. By application of pressure, we are able to
distinguish two separate spectral contributions, and to assign them respectively to the structural
relaxation (α) associated with the collective diffusional motions which become frozen at the glass
transition, and to a secondary (β) relaxation likely of intramolecular nature. While the β relaxation
has approximately constant activation energy and volume, the α relaxation time displays sub-
Arrhenius temperature dependence and an effective activation volume that increases with
increasing pressure. Despite the fact that both α and β relaxation times follow a common scaling
as function of the inverse reduced temperature Tg/T, the secondary relaxation lacks other
characteristic traits of JG relaxations.
By monitoring the recrystallization kinetics at a pressure of 50 MPa near ambient temperature,
we find that crystallization of supercooled Morniflumate follows the Avrami law with exponent n
= 1.15 which suggests a strongly anisotropic, one-dimensional growth of the crystallites with
sporadic nucleation of new domains. Optical microscopy investigation of samples recrystallized
under these conditions indeed shows a dendritic-like growth. The recrystallization time is found
to be a nonmonotonic function of temperature, with an optimum crystallization temperature near
room temperature (298 K) at 50 MPa. In particular, the recrystallization time has the opposite
temperature dependence than the primary and secondary relaxation times above 300 K,
invalidating the idea that the mutual correlation between these quantities reported in several recent
6
studies8,9,32-34 can be a general feature of amorphous APIs. At the same time, we provide a
rationalization for the previous observations of such mutual correlation by means of ambient
pressure dielectric spectroscopy.
Finally, assuming that well below Tg the correlation between secondary relaxation time and
recrystallization time is recovered and that the relation recently proposed by Kissi et al.11 is valid,
we estimate that the recrystallization of amorphous Morniflumate should be effectively quenched,
at ambient temperature, by the application of a hydrostatic pressure of 320 MPa.
2. Experimental Methods
High-Pressure Differential Thermal Analysis (HP-DTA)
A home-made high-pressure differential thermal analyzer (HP-DTA), similar to the apparatus
reported in Ref. 35 and working in the pressure range 0.1-300 MPa, was used to determine the
glass transition temperatures and melting points of unweighed Morniflumate specimens in
cylindrical tin pans, sealed so as to avoid the presence of air bubbles. The set-up was in thermal
contact with a bath containing the cryogenic liquid Kryo 51 by Lauda, which allowed varying the
sample temperature between 223 and 393 K. HP-DTA scans were acquired upon heating at a rate
of 2 K min–1.
Ambient-Pressure and High-Pressure Dielectric Spectroscopy
For dielectric measurements, Morniflumate was placed inside home-made stainless steel
parallel-plate capacitors designed for measuring liquid samples in the radiofrequency range, with
the plates kept separated by needle-like cylindrical silica spacers of 50 μm diameter. For
temperature control, the capacitor was loaded in either a nitrogen-gas cryostat operating between
120 and 500 K at ambient pressure, or a pressure set-up in thermal contact with a bath of the Kryo

7
51 liquid, which allowed sample temperature control between 223 and 393 K. In the pressure set-
up, the maximum pressure available was 520 MPa.
The sample was initially melted to reach the supercooled liquid state, and dielectric spectra were
then acquired between 10–1 and 5∙106 Hz at fixed values of pressure and temperature, with a typical
temperature stability of ±0.3 K and a pressure stability better than 0.5 MPa, respectively. Four
series of spectra were acquired while keeping the temperature constant and varying the pressure
(isothermal series), and three more series while keeping a fixed pressure and varying the
temperature (isobaric series).
A Novocontrol Alpha analyzer was employed for dielectric characterization, connected to the
capacitor plates via electrical contacts, and dielectric data were analyzed with the dedicated WinFit
software by the same producer. The isothermal dielectric spectra are complex functions of
frequency, which can be displayed as real permittivity spectra (the dielectric function, ε’(f)) and
imaginary permittivity spectra (the loss spectrum, ε”(f)). The ε”(f) spectra were fitted as the sum
of two relaxation processes α and β, each modeled as the imaginary part of the phenomenological
Cole-Cole function (εCC), and a background representing the dc conductivity contribution:
(1) ε��� = −� � ��� �� + ε��,���� + ε��,����
The analytical expression of εCC is:36,37
(2) ������ = �� + �������� ���
Here, ∆ε = εs – ε∞ is the dielectric strength (equal to the step variation of the real part of the
permittivity ε’), and ε∞ and εs are the high-frequency and low-frequency (static) limits of ε’(f),
respectively. τ is the characteristic time of each relaxation process, corresponding to the maximum
dielectric loss, and the Cole-Cole exponent c, which lies in the range from 0 to 1, is related to the
width of each relaxation feature in the loss spectrum. The fit functions used to model the relaxation

8
processes were of the more general Havriliak-Nagami type, whose spectral line shape is
asymmetric and depends on a second exponent, but the free fits gave a better agreement with the
experimental data when such exponent was equal to one, corresponding to the Cole-Cole case.
The origin of the two relaxation processes will be discussed in Section 3.
Optical microscopy
Micrographs of the Morniflumate samples after recrystallization were acquired with an Olympus
BX51optical microscope with an objective with 20× magnification.
3. Results and Discussion
Figure 1. Filled markers: Tm and Tg of Morniflumate obtained by HP-DTA, as a function of the
applied hydrostatic pressure. Continuous lines are linear fits of equations Tm [K] = 0.30 P [MPa]
+ 345.4 and Tg [K] = 0.23 P[Mpa] + 249.0, respectively. Tm data are taken from Ref. 38. Open
markers: (Tg,Pg) pairs for Morniflumate as extracted from both isothermal (red circles) and isobaric
(blue triangles) BDS measurements. Dashed line: fit with Eq. (5).
9
Figure 1 shows the values of the melting point (Tm) and glass transition temperature (Tg)
determined in isobaric HP-DTA scans on the polycrystalline Morniflumate powder and
supercooled Morniflumate, respectively. The Tm values were taken from a previous work by some
of us.38 The experimental critical temperatures for the glass-supercooled liquid transition and for
the melting of the crystal phase are observed to vary roughly linearly with applied pressure. Linear
fits are obtained with slopes (dT/dP)g = 0.235 K/MPa and (dT/dP)m = 0.291 K/MPa, respectively.
The ratio of the linear coefficients is 0.235/0.291 ≈ 0.808, so that, at least for low applied pressures,
the relation Tg/Tm ∼ 0.8 holds (for many glass formers this ratio is approximately close to 2/3). It
should be noted that both critical temperatures vary significantly with the applied pressure; in
particular, at low applied pressure Tg increases by roughly 20 K every 100 MPa. Open markers
represent (Tg,Pg) pairs obtained by dielectric spectroscopy, to be discussed later on.
Dielectric spectroscopy experiments were carried out on supercooled liquid Morniflumate in
order to observe directly the effect of an applied pressure on the molecular relaxation dynamics.
Figure 2 displays typical dielectric loss spectra as a function of frequency, acquired either during
an isobaric experiment at 100 MPa while changing the temperature in steps of 2 K (a), or during
an isothermal series at 313 K while increasing the pressure in a stepwise fashion (b). Each spectrum
is characterized by a low-frequency background increasing toward lower frequencies, which
corresponds to the dc conductivity contribution to the dielectric loss, and a prominent loss feature
with asymmetric shape. Close-up investigation of the loss feature shows that it actually consists of
two symmetric components, one responsible for the local ε” maximum, and the other visible as a
shoulder on the high-frequency flank of the latter. Indeed, a fit of all spectra with Eq. (1) shows
that a single Cole-Cole (or even Havriliak-Negami) function is not enough to account for the
observed spectra, and that instead two (Cole-Cole) components are necessary, which we label as

10
α and β, respectively. The two relaxation components, the conductivity background, and the
overall fit are shown in Figure 2 for selected spectra. The rest of the spectra acquired in our study
(not shown) similarly displayed two relaxation components.
Figure 2. Selected dielectric loss spectra of Morniflumate at different (P,T) conditions (markers),
and their fits with the imaginary part of Eq. (1) (continuous lines). All spectra were fitted with two
spectral components. (a) Series of isobaric spectra at different temperatures as indicated, at the
fixed pressure of 100 MPa. Dashed lines are fit components of the spectrum at 281.2 K. (b) Series

11
of isothermal spectra at different pressures as indicated, at 313.2 K. Dashed lines are fit
components of the spectrum at 110.5 MPa.
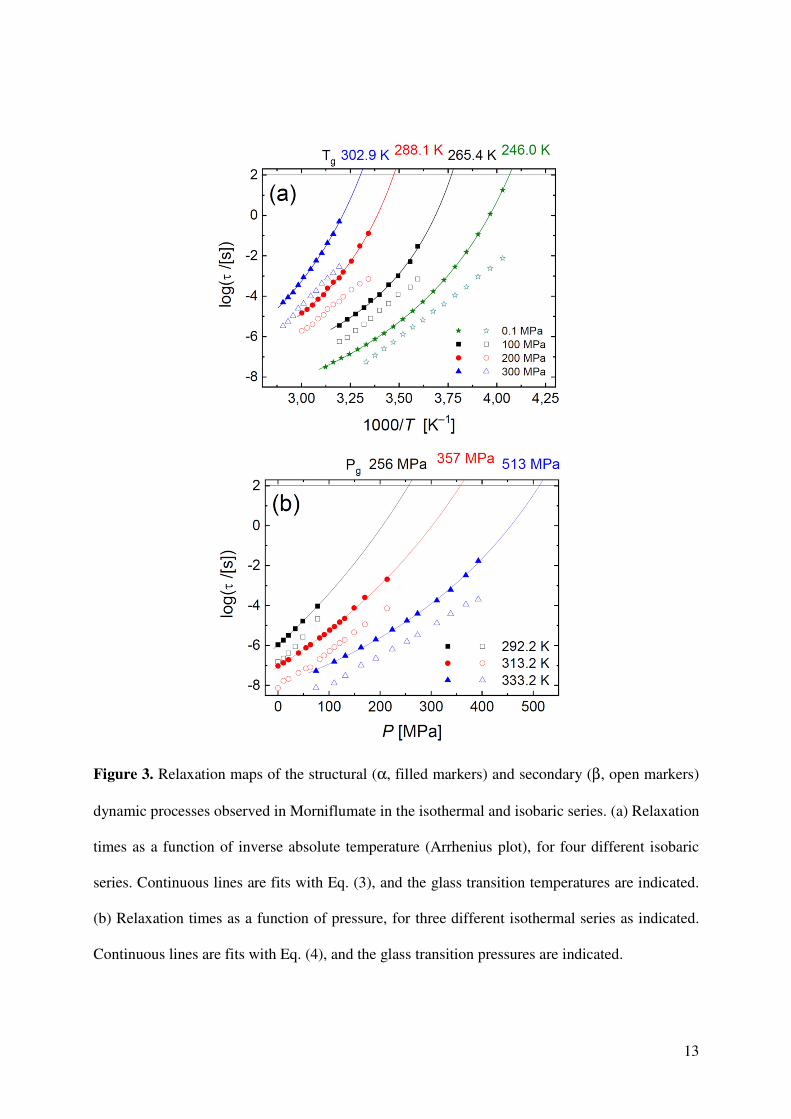
The fit of the loss spectra with Eq. (1) yields the relaxation times of both relaxation processes.
The resulting relaxation maps are shown in Figure 3 in two separate panels, namely as a function
of the inverse temperature in the isothermal series (the so-called Arrhenius plot, panel (a)), and as
a function of pressure for the isothermal series (b). Of the two processes, the faster and less intense
β relaxation, appearing as a high-frequency shoulder in the loss spectrum, has a characteristic
logarithmic relaxation time that varies almost linearly with 1/T and P, respectively. Instead, the
logarithm of the relaxation time of the slower and more intense process (labeled as α and
responsible for the local maximum of ε”) displays a nonlinear dependence on these variables. As
shown below, the α relaxation feature is the structural relaxation of supercooled liquid
Morniflumate, which justifies the label. In the Arrhenius plot (Figure 3(a)), it is also seen that the
relaxation times of the α and β processes tend have a similar dependence on temperature at
sufficiently high T.
The temperature dependence of the relaxation time of the α process was modelled with the
Vogel-Fulcher-Tammann equation, which is typical of cooperative structural processes in glass-
forming liquids and whose analytical expression is:39
(3) � �!� = ��#$% �& '()'*'()
�.
Here the prefactor τ∞ represents the high-temperature limit value of the relaxation time, and the
so-called “strength parameter” D and the Vogel-Fulcher temperature TVF are phenomenological
constants that describe the deviation of the temperature dependence of the relaxation time from a
simply activated behaviour. The pressure dependence of the same relaxation time was modeled
with an analogous function of P, namely:40
12
(4) � �+� = �,#$% �&--
-()*-�,
where τ0 is the value of the relaxation time at the same temperature at atmospheric pressure (0.1
MPa), PVF is a “Vogel-Fulcher pressure”, and DP is the equivalent strength parameter.
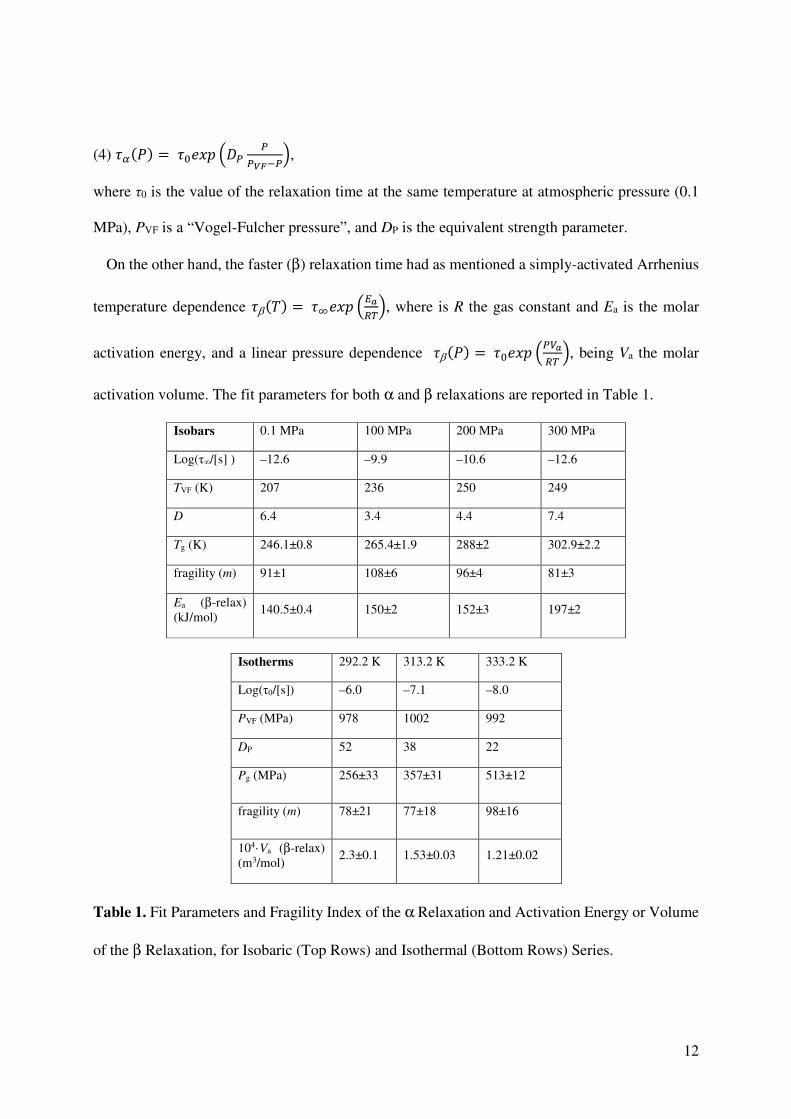
On the other hand, the faster (β) relaxation time had as mentioned a simply-activated Arrhenius
temperature dependence ���!� = ��#$% �./0'�, where is R the gas constant and Ea is the molar
activation energy, and a linear pressure dependence ���+� = �,#$% �-1/0' �, being Va the molar
activation volume. The fit parameters for both α and β relaxations are reported in Table 1.
Isobars 0.1 MPa 100 MPa 200 MPa 300 MPa
Log(τ∞/[s] ) –12.6 –9.9 –10.6 –12.6
TVF (K) 207 236 250 249
D 6.4 3.4 4.4 7.4
Tg (K) 246.1±0.8 265.4±1.9 288±2 302.9±2.2
fragility (m) 91±1 108±6 96±4 81±3
Ea (β-relax)
(kJ/mol) 140.5±0.4 150±2 152±3 197±2
Isotherms 292.2 K 313.2 K 333.2 K
Log(τ0/[s]) –6.0 –7.1 –8.0
PVF (MPa) 978 1002 992
DP 52 38 22
Pg (MPa) 256±33 357±31 513±12
fragility (m) 78±21 77±18 98±16
104·Va (β-relax)
(m3/mol) 2.3±0.1 1.53±0.03 1.21±0.02
Table 1. Fit Parameters and Fragility Index of the α Relaxation and Activation Energy or Volume
of the β Relaxation, for Isobaric (Top Rows) and Isothermal (Bottom Rows) Series.
13
Figure 3. Relaxation maps of the structural (α, filled markers) and secondary (β, open markers)
dynamic processes observed in Morniflumate in the isothermal and isobaric series. (a) Relaxation
times as a function of inverse absolute temperature (Arrhenius plot), for four different isobaric
series. Continuous lines are fits with Eq. (3), and the glass transition temperatures are indicated.
(b) Relaxation times as a function of pressure, for three different isothermal series as indicated.
Continuous lines are fits with Eq. (4), and the glass transition pressures are indicated.

14
Extrapolation of the exponential fit functions Eq.s (3) and (4) to the value τα = 100 s (that is,
Log(τα) = 2) yields the values of the thermodynamic variables at the vitrification (freeze)
temperature of the α relaxation process. These can be compared with (Tg,Pg) pairs for the glass
transition obtained in HP-DTA measurements, as shown in Figure 1. The agreement between the
Tg values obtained by both techniques (Figure 1) shows that the relaxation process labelled as α is
indeed the cooperative structural relaxation of the Morniflumate glass former. It should be noted
that, while HP-DTA measurements are conducted in a smaller pressure interval, in which the
dependence of Tg on pressure appears to be linear, in a larger pressure range the same dependence
is found to be sublinear. In particular, the relation between Tg and Pg is found to be well described
by the empirical Andersson and Andersson equation, given by:41
(5) !2 = 3� �1 + 5657
· +2�9
:6 ,
Where k1, k2 and k3 are material constants. The fit is displayed with a dashed line in Figure 1.
The best-fit values of the parameters were k1 = 245.3±1.5 K, k2 = 2.9±0.5, and k3 = 1020±90 MPa,
respectively.
The relaxation times of the β relaxation can similarly be extrapolated to a value of 100 s,
assuming a constant linear dependence on P and 1/T; the corresponding (T,P) values represent the
thermodynamic conditions at which the secondary relaxation is effectively “frozen”, and the glass
state of Morniflumate should, according to a recent study, acquire sufficient kinetic stability to
prevent transformation of the API into the thermodynamically stable crystal phase.11 In particular,
at ambient temperature the extrapolated “freeze pressure” of the secondary relaxation of
Morniflumate is approximately 320 MPa.
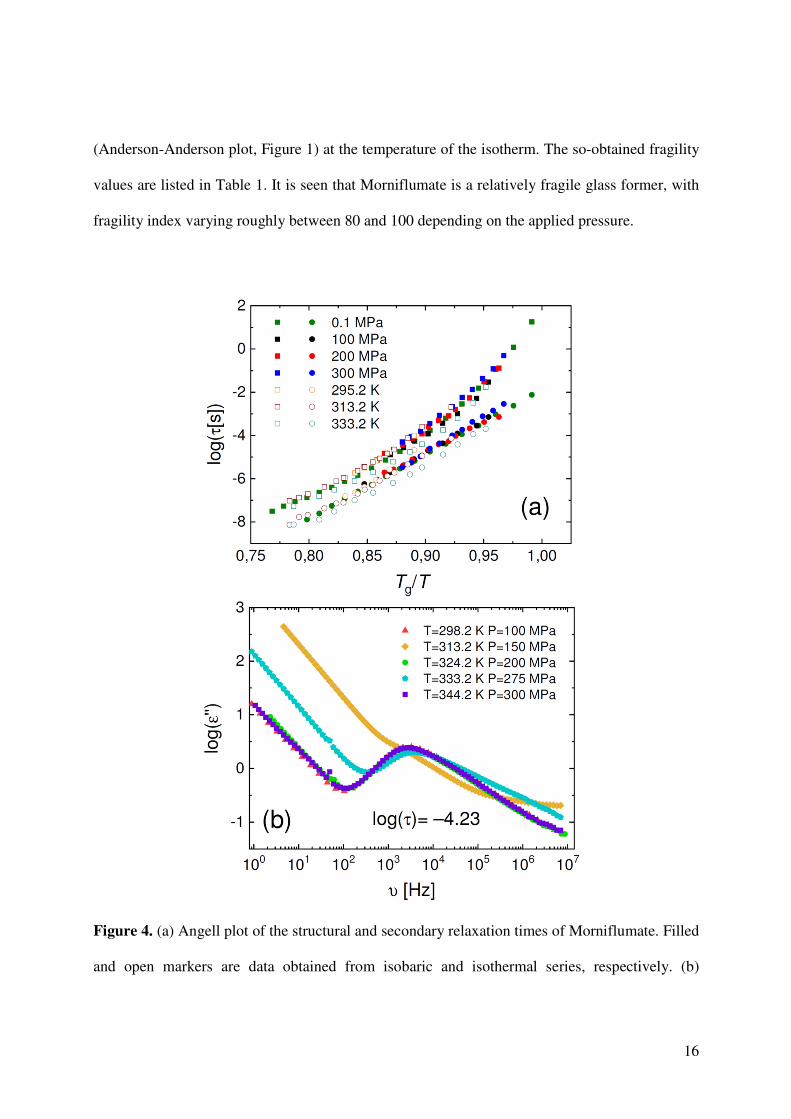
It is interesting to plot all obtained relaxation times in a single plot as a function of the inverse
reduced temperature Tg/T (the so-called Angell plot). This is displayed in Figure 4(a). It may be

15
observed that both the structural (α) and secondary (β) relaxation times of different measurements
are very roughly superposed in the graph, and that the slope of the β relaxation in the Angell plot
has similar values for all isobaric and isothermal series. The scaling of both α and β relaxation
times with the reduced temperature is nontrivial (for example, no such scaling is observed when
using the reduced pressure P/Pg). On the other hand, however, the τα and τβ relaxation times do
not tend to converge at the same value at high temperatures; it seems instead that the two dynamics
remain separated by one decade in time in the high-T region of the plot. This is in contrast with
the expectations for a Johari-Goldstein (JG) relaxation.13,30 Another characteristic feature of JG
relaxations is that, since the spectral line shape of the α relaxation is almost independent on
thermodynamic variables, the value of τβ should have virtually the same value for all (P,T) pairs
with the same τα value; in other words, the line shape of isochronal spectra with the same structural
relaxation time should be independent on T and P.30 Figure 4(b) shows several isochronal spectra
corresponding to approximately τα = 5.8 · 10–5 s, and it is seen that they do not all obey this
invariance. We therefore conclude that the secondary β relaxation is likely a local relaxation
involving the relative motions of subparts or side groups of the Morniflumate molecule.
From the curvature of the Arrhenius (Figure 3(a)) or Angell (Figure 4(a)) plots, the so-called
isobaric kinetic fragility index m can be extracted, which is a measure of the degree of deviation
from the simply-activated Arrhenius behaviour. The kinetic fragility is defined42,43 as the slope to
the Angell plot at Tg/T = 1, namely ; = <�=>?@A�<B'C '⁄ E F
'G'C. Using the chain rule of derivation, this
steepness index can be generalized44 to describe isothermal measurements as ; = 1HB-CE0IJ��,� �<'C
<- �*�,
where Va(Pg) is the extrapolated apparent activation volume of an isotherm at Pg (obtained from
Eq. (4) with the corresponding fitting parameters), and dTg/dP is the slope of the (Tg,Pg) curve
16
(Anderson-Anderson plot, Figure 1) at the temperature of the isotherm. The so-obtained fragility
values are listed in Table 1. It is seen that Morniflumate is a relatively fragile glass former, with
fragility index varying roughly between 80 and 100 depending on the applied pressure.
Figure 4. (a) Angell plot of the structural and secondary relaxation times of Morniflumate. Filled
and open markers are data obtained from isobaric and isothermal series, respectively. (b)
17
Isochronal master plot of three spectra displaying approximately the same structural relaxation
time (τα = 5.8 · 10–5 s), acquired at the indicated (T,P) conditions.
In order to determine the impact of pressure on the kinetics of recrystallization, we employed
our dielectric spectroscopy setup to monitor isothermal crystallization of supercooled liquid
Morniflumate near room temperature under an applied pressure of P = 50 MPa, at five different
temperatures. To reach the desired state, we first melted the sample and then cooled it down to the
desired temperature, and then increased the pressure from ambient pressure to 50 MPa while
keeping the temperature constant (in other words, we moved towards Pg at ambient temperature
with the sample in the supercooled liquid state in thermal contact with the bath at fixed
temperature). The onset time of recrystallization of Morniflumate under these conditions was
unpredictable: in several occasions, the sample did not show any sign of recrystallization over a
period of more than one day, in another, the recrystallization started a few minutes after reaching
the final desired conditions; in some cases, we induced crystallization by suddenly reducing the
applied hydrostatic pressure. Visual inspection of the samples after recrystallization (see also
below) showed that the nucleation was likely to occur at the interface between the sample and the
electrode; in other words, nucleation was heterogeneous rather than homogeneous. As a
consequence, the so-called induction time (also termed nucleation time) could not be
unambiguously determined. It would appear that the “intrinsic” induction time at fixed (T,P)
conditions is relatively long (more than one day), but that mechanical vibrations and especially
density fluctuations induced by minimal pressure variations are sufficient to trigger nucleation of
the crystal phase, as reported in other systems.21
We carried out a study of the crystallization kinetics by acquiring dielectric spectra at fixed (T,P)
conditions and monitoring the dielectric strength of the structural relaxation process. The latter is

18
equal to the step-like decrease in the real permittivity visible at the characteristic frequency of the
α relaxation. The series of real and imaginary permittivity spectra acquired at different times
during recrystallization of Morniflumate at T = 293 K and P = 50 MPa are shown in Figure 5(a,b).
The effect of recrystallization was visible as a decrease over time of the intensity of the loss feature
or equivalently of the static permittivity value εs, the latter taken to be equal to the value of ε’(f) at
a frequency slightly lower than that of the α peak, at which the low-frequency plateau value of ε’
is attained (at lower frequency, ε’(f) increased due to polarization effects associated with mobile
charge carriers). It can be observed that the relaxation frequency increases slightly during
recrystallization. Such a shift was observed in most measurements, and is possibly due to the
reduction in the effective internal pressure of the cell as Morniflumate crystallizes into the higher-
density crystal phase or to a confinement effect on the amorphous regions.
The evolution of εs with the time elapsed from the start of the measurements is displayed in panel
(c) of Figure 5. The onset time to of the recrystallization process was determined as the intersection
of the horizontal line representing the constant value of εs in supercooled liquid Morniflumate, and
the slope of the tangent to the data during recrystallization (see inset to Figure 5(c)).

19
Figure 5. (a,b) Real and imaginary permittivity spectra of a supercooled Morniflumate sample
during recrystallization at P = 50 MPa and T = 293 K, as a function of time elapsed since the start
of the measurement. (c) Static permittivity εs (taken as the value of ε’(f) at the frequency of 206
Hz). The determinations of the 20% recrystallization time tr and of the onset time to are displayed
in the main panel and in the inset, respectively (see the text for details). (d) Optical micrograph of
the sample taken after full recrystallization.

20
In order to analyze the crystallization kinetics, we define as customary45 a renormalized static
permittivity as:
(6) ���K� = �L�M�*�L�N=��L���*�L�N=�
Here εs(SL) and εs(C) are the static permittivity of the supercooled liquid and the crystal phase,
as measured before the onset of nucleation of the crystal phase and at the end of the crystal growth,
respectively, while εs(t) is the static permittivity of the partially crystallized, mixed-phase sample
as a function of the time elapsed from the start of the measurements. The overall global kinetics of
crystallization is often described with the help of the Avrami law46,47 which combines together the
effects of both nucleation of the crystal phase and the subsequent growth of the crystalline nuclei.
When the recrystallization process follows the Avrami law, the renormalized static permittivity
varies in time as:48
(7) ���K� = 1 − exp�−R�K − K>���,
where n is the Avrami exponent and Z is a constant, from which a crystallization rate with units of
s–1 can be obtained49 as k = Z1/n. Eq. (7) predicts that the quantity ln(–ln(1 – εn)) should vary linearly
with the logarithm of elapsed time since the recrystallization onset, t – to. This is indeed observed
in the so-called “Avrami plot”, displayed in Figure 6(a). The values of the obtained fit parameters
(n, k) are listed in Table 2. While a certain variability is observed in k, as expected, the value of
the Avrami exponent was always close to n = 1.15 for all cases.
The fact that the value of the Avrami exponent is close to unity suggests a strongly anisotropic
growth of the crystalline nuclei following sporadic nucleation,9,50,51 at least under an applied
hydrostatic pressure of 50 MPa. Such anisotropic growth is confirmed by inspection of the
recrystallized samples under the optical microscope (Figure 5(d)), where it is observed that the
growth occurs in a dendritic fashion in the disk-like Morniflumate sample, with evidence of
21
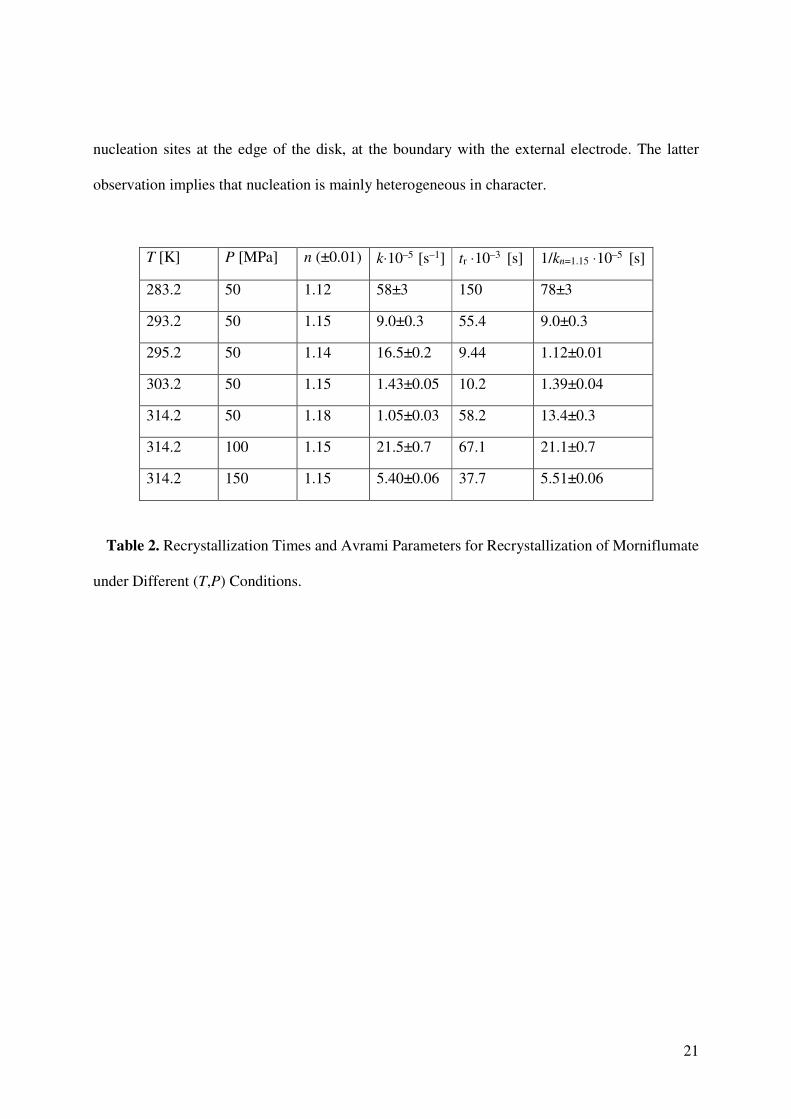
nucleation sites at the edge of the disk, at the boundary with the external electrode. The latter
observation implies that nucleation is mainly heterogeneous in character.
T [K] P [MPa] n (±0.01) k⋅10–5 [s–1] tr ⋅10–3 [s] 1/kn=1.15 ⋅10–5 [s]
283.2 50 1.12 58±3 150 78±3
293.2 50 1.15 9.0±0.3 55.4 9.0±0.3
295.2 50 1.14 16.5±0.2 9.44 1.12±0.01
303.2 50 1.15 1.43±0.05 10.2 1.39±0.04
314.2 50 1.18 1.05±0.03 58.2 13.4±0.3
314.2 100 1.15 21.5±0.7 67.1 21.1±0.7
314.2 150 1.15 5.40±0.06 37.7 5.51±0.06
Table 2. Recrystallization Times and Avrami Parameters for Recrystallization of Morniflumate
under Different (T,P) Conditions.

22
23
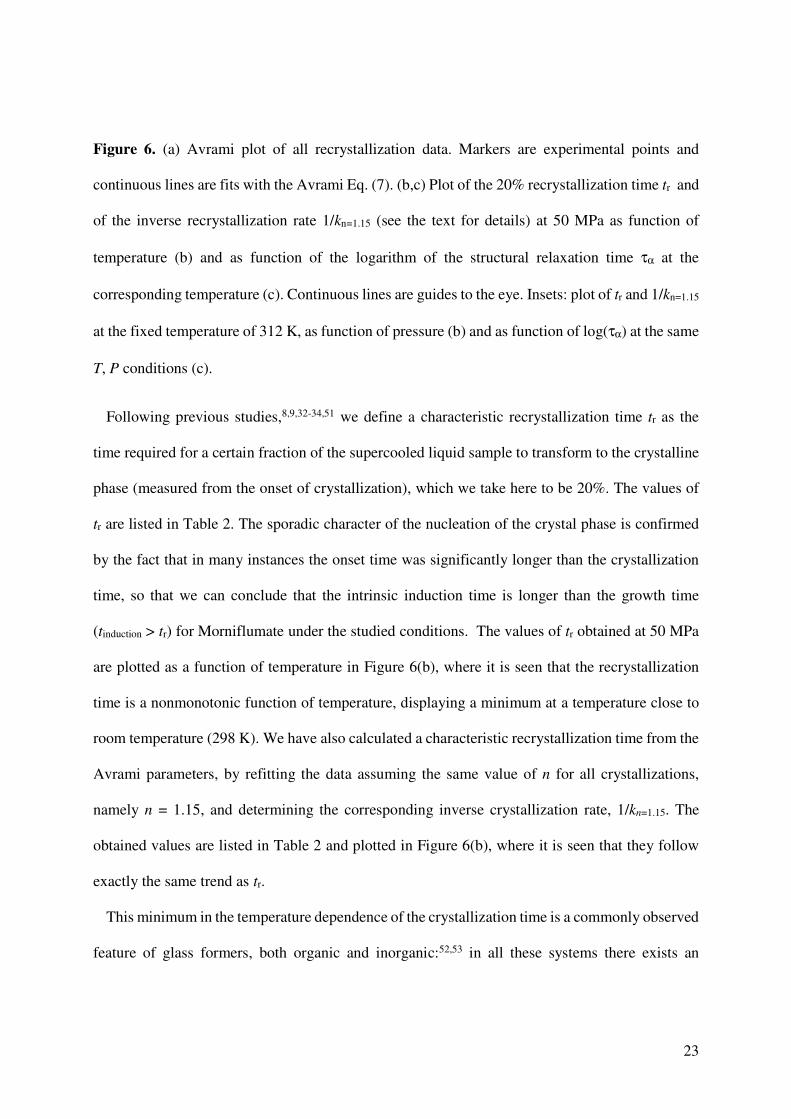
Figure 6. (a) Avrami plot of all recrystallization data. Markers are experimental points and
continuous lines are fits with the Avrami Eq. (7). (b,c) Plot of the 20% recrystallization time tr and
of the inverse recrystallization rate 1/kn=1.15 (see the text for details) at 50 MPa as function of
temperature (b) and as function of the logarithm of the structural relaxation time τα at the
corresponding temperature (c). Continuous lines are guides to the eye. Insets: plot of tr and 1/kn=1.15
at the fixed temperature of 312 K, as function of pressure (b) and as function of log(τα) at the same
T, P conditions (c).
Following previous studies,8,9,32-34,51 we define a characteristic recrystallization time tr as the
time required for a certain fraction of the supercooled liquid sample to transform to the crystalline
phase (measured from the onset of crystallization), which we take here to be 20%. The values of
tr are listed in Table 2. The sporadic character of the nucleation of the crystal phase is confirmed
by the fact that in many instances the onset time was significantly longer than the crystallization
time, so that we can conclude that the intrinsic induction time is longer than the growth time
(tinduction > tr) for Morniflumate under the studied conditions. The values of tr obtained at 50 MPa
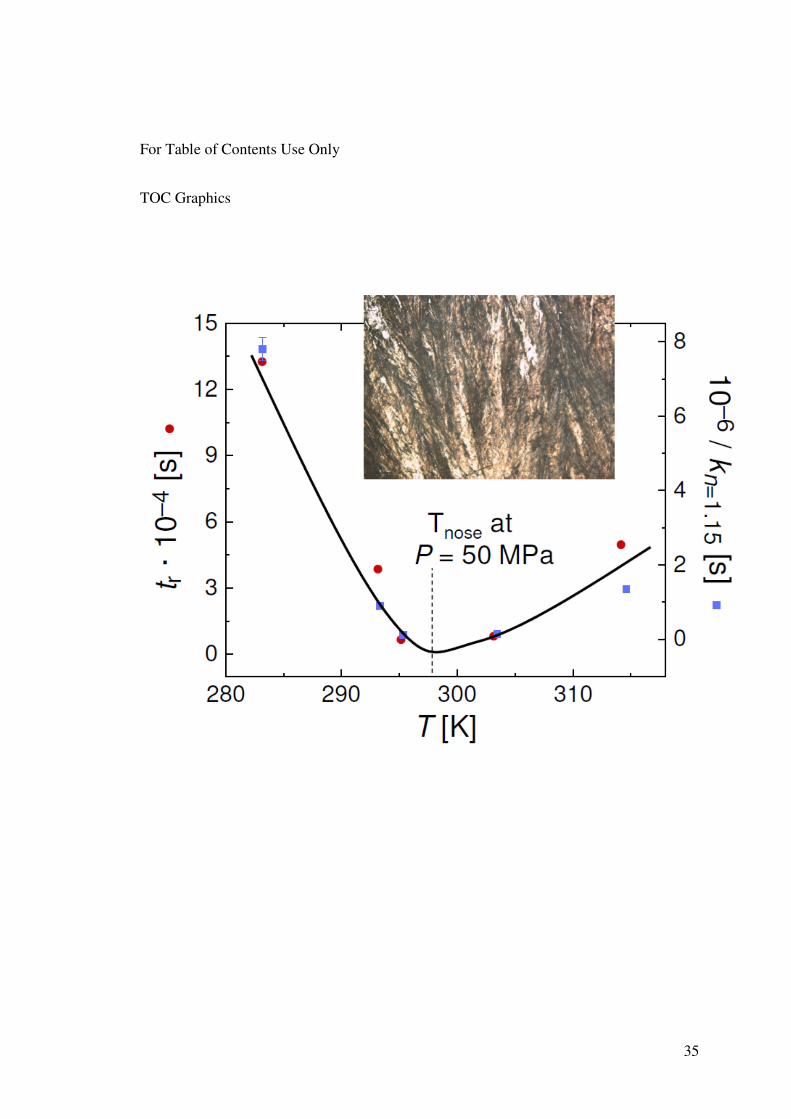
are plotted as a function of temperature in Figure 6(b), where it is seen that the recrystallization
time is a nonmonotonic function of temperature, displaying a minimum at a temperature close to
room temperature (298 K). We have also calculated a characteristic recrystallization time from the
Avrami parameters, by refitting the data assuming the same value of n for all crystallizations,
namely n = 1.15, and determining the corresponding inverse crystallization rate, 1/kn=1.15. The
obtained values are listed in Table 2 and plotted in Figure 6(b), where it is seen that they follow
exactly the same trend as tr.
This minimum in the temperature dependence of the crystallization time is a commonly observed
feature of glass formers, both organic and inorganic:52,53 in all these systems there exists an

24
optimum temperature for the growth of the crystalline phase from the supercooled liquid, known
as “nose temperature” from the characteristic shape of the time-temperature-transformation
curve.52,54. The existence of the nose temperature is a consequence of two competing effects:
although the thermodynamic driving force for recrystallization (difference between the free energy
of the liquid and crystal states) increases as T is lowered below the melting point Tm, the molecular
mobility decreases; the competition results in an optimum temperature at which recrystallization
is fastest. Our results imply that the optimum crystal growth temperature Tnose of Morniflumate is
approximately room temperature (298 K) at the pressure of 50 MPa. An increase of T above such
value (at the same pressure) actually results in a slower recrystallization rate, as observed
experimentally in Figure 6(b). The inset to Figure 6(b) shows the variation of tr with pressure at
the fixed temperature of 314 K. tr has a maximum value for P = 100 MPa, while it has a lower
value at 50 or 150 MPa. Applying a pressure leads to three different effects: a change in
thermodynamic driving force, a change in the molecular dynamics, and a change in density; a
detailed recrystallization study as a function both of T and P under isochronal conditions would be
required to disentangle the three effects, which is beyond the scope of our work.
In the Figure 6(c) we plot the characteristic recrystallization time tr and inverse recrystallization
rate 1/kn=1.15 at 50 MPa at different temperatures (same data as in panel (b)), as function of the
structural relaxation time τα at the same (T,P) conditions used in our recrystallization study. . It
may be observed that the crystallization time is a nonmonotonic function of τα, which is a
consequence of the fact that, at constant pressure, the structural relaxation time is a monotonic
function of T (Figure 3(a)) while tr and kn=1.15 are not (Figure 6(b)). In particular, above the nose
temperature the two times are “anticorrelated”: τα decreases as the crystallization time increases.
Hence the power-law correlation between tr and τα observed for other pharmaceutical compounds
25
at ambient pressure8,9,32-34,51 cannot be a general feature of amorphous pharmaceuticals in a large
temperature window; indeed, it may be observed a priori only below the optimum crystal growth
temperature Tnose. Since Tnose normally lies between the glass transition temperature Tg (below
which the structural relaxation is kinetically frozen) and the melting point Tm, between Tnose and
Tm the two times are necessarily anticorrelated. On the other hand, a power law correlation between
tr and τα can exist between Tg and Tnose, since at low enough temperature the recrystallization rate
is fundamentally limited by the molecular mobility, that is, by the diffusion of molecules which
enables formation and growth of crystal nuclei. The fact that this correlation has been often
reported in dielectric spectroscopy studies is likely a consequence of the fact that the available
frequency range of this technique (up to 1 or 10 MHz) is particularly suited to study dynamics
close to the glass transition temperature, rather than those close to the melting point, where the
structural relaxation frequency is normally above 1 or 10 GHz.
The practical implication of our findings for amorphous pharmaceuticals are two. On one hand,
the fact that the possible (sublinear) correlation between the recrystallization rate and the structural
relaxation time can at best hold only in a limited temperature interval (namely, between Tg and
Tnose) indicates that one should look at secondary relaxations, rather than at the structural one, to
search possible indicators of the stability of amorphous pharmaceuticals. This is of course obvious
below Tg, where the structural relaxation is dynamically frozen. On the other hand, the fact that
depressurization of over-pressurized liquid Morniflumate often lead in our experiments to the
onset of recrystallization, indicates that pressurization may not be a viable means to stabilize
amorphous pharmaceuticals: besides being scarcely applicable on an industrial scale,
depressurization after storage may induce the very transformation (recrystallization) which the
applied pressure might avoid during storage.
26
Conclusions
We have employed dielectric spectroscopy to study the pressure and temperature dependence of
the relaxation dynamics and recrystallization kinetics of a glass-forming API with anti-
inflammatory and antipyretic properties, Morniflumate. The dielectric spectra are characterized by
the presence of two loss features, the structural α relaxation and a secondary β relaxation,
respectively. Both relaxation times have a steep dependence with pressure. In particular, while the
β relaxation has fixed activation volume, the α relaxation time displays an effective activation
volume that increases with increasing pressure. At low applied pressure, the pressure-dependent
glass transition temperature Tg(P) increases by 20 K every 100 MPa. In the whole pressure and
temperature range probed, both α and β relaxation times are observed to scale roughly with the
temperature rescaled to the pressure-dependent glass transition temperature. Since the β relaxation
can be kinetically frozen at ambient temperature by applying a pressure of approximately 320
MPa, we predict that Morniflumate should be in a kinetically stable glassy state at this pressure.
The recrystallization kinetics at a pressure of 50 MPa follows the Avrami law with exponent n =
1.15, consistent with the dendritic-like growth that we observed in our freshly recrystallized
samples by optical microscopy. The recrystallization time is a nonmonotonic function both of
temperature and of the structural relaxation time: the optimum crystallization temperature of
Morniflumate is found to be between 295 and 300 K under an applied pressure of 50 MPa.
AUTHOR INFORMATION
Corresponding Author
* Author to whom correspondence should be addressed. Electronic
mail:[email protected].

27
PresentAddress
† Departament d’Estructura i Constituents de la Matèria, Facultat de Física, Universitat de
Barcelona, Av. Diagonal 647, E-08028 Barcelona, Catalonia, Spain.
Author Contributions
The manuscript was written through contributions of all authors. All authors have given approval
to the final version of the manuscript.
ACKNOWLEDGMENT
This work has been partially supported by the Spanish Ministry of Economy and
Competitiveness MINECO through project FIS2017-82625-P, and by the Generalitat de Catalunya
under project 2017SGR-42.
REFERENCES
1. Shah, N., Sandhu, H., Choi, D.S., Chokshi, H., Malick, A. W. Amorphous Solid
Dispersions: Theory and Practice (Springer, New York, 2014).
2. Yin, S., Franchini, M., Chen, J., Hsieh, A., Jen, S., Lee, T., Hussain, M., Smith, R.
Bioavailability Enhancement of a COX-2 Inhibitor, BMS-347070, from a Nanocrystalline
Dispersion Prepared by Spray-Drying. J. Pharm. Sci. 2005, 94, 1598–1607.
3. Wu, T., Yu, L. Surface Crystallization of Indomethacin Below Tg. Pharm. Res. 2006, 23,
2350–2355.
4. Qian, F., Tao, J., Desikan, S., Hussain, M., Smith, R. Mechanistic Investigation of
Pluronic® Based Nano-crystalline Drug-polymer Solid Dispersions. Pharm. Res. 2007,
24,1551–1560.

28
5. Gupta, P., Chawla, G., Bansal, A. Physical Stability and Solubility Advantage from
Amorphous Celecoxib: the Role of Thermodynamic Quantities and Molecular Mobility.
Mol. Pharmaceutics 2004, 1, 406−413.
6. Bhardwaj, S., Arora, K., Kwong, E., Templeton, A., Clas, S., Suryanarayanan, R.
Correlation between Molecular Mobility and Physical Stability of Amorphous
Itraconazole. Mol. Pharmaceutics 2013, 10, 694−700.
7. Capen, R., Christopher, D., Forenzo, P., Ireland, C., Liu, O., Lyapustina, S., O’Neill, J.,
Patterson, N., Quinlan, M., Sandell, D., Schwenke, J., Stroup, W., Tougas, T. On the shelf
life of pharmaceutical products. AAPS Pharm. Sci. Tech. 2012, 13, 911–918.
8. Mehta, M.; Ragoonanan, V.; McKenna, G. B.; Suryanarayanan, R. Correlation between
Molecular Mobility and Physical Stability in Pharmaceutical Glasses. Mol. Pharmaceutics
2016,13, 1267−1277.
9. Ruiz, G. N., Romanini, M., Barrio, M., Tamarit, J. Ll., Pardo, L. C., Macovez, R.
Relaxation Dynamics vs Crystallization Kinetics in the Amorphous State: The Case of
Stiripentol. Mol. Pharmaceutics 2017, 14, 3636-3643.
10. Okamoto, N., Oguni, M. Discover of Crystal Nucleation Proceeding much below the Glass
Transition Temperature in a Supercooled Liquid. Solid State Commun. 1996, 99, 53−56.
11. Kissi, E. O., Grohganz, H., Löbmann, K., Ruggiero, M. T., Zeitler, J. A., Rades, T. Glass-
Transition Temperature of the β-Relaxation as the Major Predictive Parameter for
Recrystallization of Neat Amorphous Drugs. J. Phys. Chem. B 2018, 122, 2803.

29
12. Johari, G. P., Goldstein, M. Viscous Liquids and the Glass Transition. II. Secondary
Relaxations in Glasses of Rigid Molecules. J. Chem. Phys. 1970, 53, 2372–2388.
13. Ngai, K. L., Capaccioli, S. Relation between the Activation Energy of the Johari-Goldstein
β Relaxation and Tg of Glass Formers. Phys. Rev. E 2004, 69, 031501.
14. Yu, L. Amorphous Pharmaceutical Solids: Preparation, Characterization and Stabilization.
Adv. Drug Delivery Rev. 2001, 48, 27−42.
15. Hancock, B. C., Zografi, G. Characteristics and Significance of the Amorphous State in
Pharmaceutical Systems. J. Pharm. Sci. 1997, 86, 1−12.
16. Hatley, R. H. M. Glass Fragility and the Stability of Pharmaceutical Preparations-Excipient
Section. Pharm. Dev. Technol. 1997, 2, 257−264.
17. Su, Y., Yu, L., Cai, T. Enhanced Crystal Nucleation in Glass-Forming Liquids by Tensile
Fracture in the Glassy State. Cryst. Growth Des. 2019, 19, 291−299.
18. Adrjanowicz, K., Paluch M., Richert, R. Formation of New Polymorphs and Control of
Crystallization in Molecular Glass-Formers by Electric Field. Phys. Chem. Chem. Phys.
2018, 20, 925–931.
19. Kolodziejczyk, K., Paluch, M., Grzybowska, K. Grzybowski, A. Wojnarowska, Z.,
Hawelek, L., Ziolo, J. D. Relaxation Dynamics and Crystallization Study of Sildenafil in
the Liquid and Glassy States. Mol. Pharmaceutics 2013, 10, 2270–2282.
20. Knapik, J., Wojnarowska, Z., Grzybowska, K., Hawelek, L., Sawicki, W., Wlodarski, K.,
Markowski, J., Paluch M. Physical Stability of the Amorphous Anticholesterol Agent
(Ezetimibe): the Role of Molecular Mobility. Mol. Pharmaceutics 2014, 11, 4280–4290.
30
21. Rams-Baron, M., Pacułt, J., Jędrzejowska, A., Knapik-Kowalczuk, J., Paluch, M. Changes
in Physical Stability of Supercooled Etoricoxibafter Compression. Mol. Pharmaceutics
2018, 15, 3969–3978.
22. Adrjanowicz, K., Grzybowski, A., Kaminski, K., Paluch, M. Temperature and Volume
Effect on the Molecular Dynamics of Supercooled Ibuprofen at Ambient and Elevated
Pressure. Mol. Pharmaceutics 2011, 8, 1975–1979.
23. Tölle, A. Neutron Scattering Studies of the Model Glass Former Ortho-terphenyl. Rep.
Prog. Phys. 2001, 64, 1473–1532.
24. Casalini, R., Roland, C. M. Thermodynamical Scaling of the Glass Transition Dynamics.
Phys. Rev. E 2004, 69, 062501.
25. Dreyfus, C., Le Grand, A., Gapinski, J., Steffen, W., Patkowski, A. Scaling the α-
Relaxation Time of Supercooled Fragile Organic Liquids. Eur. Phys. J. B 2004, 42, 309–
319.
26. Roland, C. M., Hensel-Bielowka, S., Paluch, M., Casalini, R. Supercooled Dynamics of
Glass-Forming Liquids and Polymersunder Hydrostatic Pressure. Rep. Prog. Phys. 2005,
68, 1405-1478.
27. Dyre, J. C. Hidden Scale Invariance in Condensed Matter. J. Phys. Chem. B 2014, 118,
10007–10024.
28. Sanz, A., Hecksher, T., Wase Hansen, H., Dyre, J. C. Niss, K., Pedersen U. R. Experimental
Evidence for a State-Point-Dependent Density-Scaling Exponent of Liquid Dynamics.
Phys. Rev. Lett. 2019, 122, 055501.
31
29. Romanini, M., Barrio, M., Macovez, R., Ruiz-Martin, M.D., Capaccioli, S., Tamarit, J. Ll.
Thermodynamic Scaling of the Dynamics of a Strongly Hydrogen-Bonded Glass-Former.
Sci. Rep.2017, 7, 1346.
30. Ngai, K. L., Habasaki, J., Prevosto, D., Capaccioli, S., Paluch, M. Thermodynamic Scaling
of α-Relaxation Time and Viscosity Stems from the Johari-Goldstein β-Relaxation or the
Primitive Relaxation of the Coupling Model. J. Chem. Phys. 2012, 137, 034511.
31. Kaminska, E., Kaminski, K., Paluch, M., Ngai, K. L. Primary and Secondary Relaxations
in Supercooled Eugenol and Isoeugenol at Ambient and Elevated Pressures: Dependence
on Chemical Microstructure. J. Chem. Phys. 2006, 124, 164511.
32. Johari, G., Kim, S., Shanker, R. Dielectric Relaxation and Crystallization of Ultraviscous
Melt and Glassy States of Aspirin, Ibuprofen, Progesterone, and Quinidine. J. Pharm. Sci.
2007, 96, 1159–1175.
33. Dantuluri, A. K. R., Amin, A., Puri, V., Bansal, A. K. Role of α-Relaxation on
Crystallization of Amorphous Celecoxib above Tg Probed by Dielectric Spectroscopy.
Mol. Pharmaceutics 2011, 8, 814–822.
34. Sanz, A.; Niss, K. Coupling between Molecular Mobility and Kinetics of Crystal Growth
in a Hydrogen-Bonded Liquid. Cryst. Growth Des. 2017, 17, 4628−4636.
35. Würflinger, A. Differential Thermal Analysis under High Pressure IV: Low-Temperature
DTA of Solid-Solid and Solid-Liquid Transitions of Several Hydrocarbons up to 3 kbar.
Ber. Bunsenges. Phys. Chem. 1975, 79, 1195–1201.

32
36. Cole, K.S., Cole, R.H. Dispersion and Absorption in Dielectrics - I Alternating Current
Characteristics. J. Chem. Phys. 1941, 9, 341–352.
37. Cole, K.S., Cole, R.H. Dispersion and Absorption in Dielectrics - II Direct Current
Characteristics. J. Chem. Phys. 1942, 10, 98–105.
38. Barrio, M., Tamarit, J. Ll., Céolin, R., Robert, B., Guéchot, C., Teulon, J.-M., Rietveld, I.
B. Experimental and Topological Determination of the Pressure-Temperature Phase
Diagram of Morniflumate, a Pharmaceutical Ingredient with Anti-Inflammatory
Properties. J. Chem. Thermodynamics 2017, 112, 308-313.
39. Kremer, F., Schönhals, A. Broad Band Dielectric Spectroscopy. (Springer, Berlin, 2003).
40. Paluch, M., Rzoska, S. J., Habdas, P., Ziolo, J. On the Isothermal Pressure Behaviour of
the Relaxation Times for Supercooled Glass-Forming Liquids. J. Phys.: Condens. Matter
1998, 10, 4131.
41. Andersson, S. P., Andersson, O. Relaxation Studies of Poly(propylene glycol) under High
Pressure. Macromolecules 1998, 31, 2999–3006.
42. Angell, C. A. Spectroscopy Simulation and Scattering, and the Medium Range Order
Problem in Glass. J. Non-Cryst. Solids 1985, 73, 1–17.
43. Böhmer, R., Ngai, K. L., Angell, C. A., Plazek, D. J. Nonexponential relaxations in strong
and fragile glass formers. J. Chem. Phys. 1993, 99, 4201-4209.
44. Paluch, M., Gapinski, J., Patkowski, A., Fischer, E. W. Does Fragility Depend on Pressure?
A Dynamic Light Scattering Study of a Fragile Glassformer. J. Chem. Phys. 2001, 114,
8048-8055.

33
45. D’Amore, A. J. M. L., Kenny, J. M., Nicolais, L., Tucci, V. Dynamic-Mechanical and
Dielectric Characterization of PEEK Crystallization. Polym. Eng. Sci. 1990, 30, 314.
46. Avrami, M. Kinetics of Phase Change. I. General theory. J. Chem. Phys. 1939, 7, 1103–
1112.
47. Avrami, M. Kinetics of Phase Change. II Transformation-Time Relations for Random
Distribution of Nuclei. J. Chem. Phys. 1940, 8, 212–224.
48. Adrjanowicz, K., Kaminski, K., Wojnarowska, Z., Dulski, M., Hawelek, L., Pawlus, S.,
Paluch, M. Dielectric Relaxation and Crystallization Kinetics of Ibuprofen at Ambient and
Elevated Pressure. J. Phys. Chem. B 2010, 114, 6579–6593.
49. Yousefzade, O., Valenti, S., Puiggali, J., Garmabi, H., Macovez, R. Segmental Relaxation
and Partial Crystallization of Chain-Extended Poly(L-Lactic Acid) Reinforced with
Carboxylated Carbon Nanotube. J. Polym. Sci. B Polym. Phys. 2019, 57, 222–233.
50. Tripathi, P., Romanini, M., Tamarit, J. Ll., Macovez, R. Collective Relaxation Dynamics
and Crystallization Kinetics of the Amorphous Biclotymol Antiseptic. Int. J.
Pharmaceutics 2015, 495, 420–427.
51. Valenti, S., Romanini, M., Franco, L., Puiggalí, J., Tamarit, J. Ll., Macovez, R. Tuning the
Kinetic Stability of the Amorphous Phase of the Chloramphenicol Antibiotic. Mol.
Pharmaceutics 2018, 15, 5615−5624.
52. Uhlmann, D. R. A Kinetic Treatment of Glass Formation. J. Non-Cryst. Solids 1972, 7,
337–348.
34
53. Shelby, J. E. Introduction to Glass Science and Technology, 2nd Edition (The Royal
Society of Chemistry, Cambridge, 2005).
54. Uhlmann, D. R. Glass Formation, a Contemporary View. J. Amer. Ceram Soc. 1983, 66,
95–100.
35
For Table of Contents Use Only
TOC Graphics