northwest queens community health profile
TRANSCRIPT

11101
11105
11106
11103
11102
1110411109
21S
TS
T
31STAVE
31S
TS
T
STATE HWY 25
34THAVE
VE
RN
ON
BL
VD
39T
HS
T
49TH AVE
STE
INW
AY
ST
DIT
MAR
SBLV
D
ASTORIA BLVD
48T
HS
T
BROADWAY
LI EXWY
25THAVE
S
36THAVE
11101
11105
11106
11103
11102
1110411109
21S
TS
T
31STAVE
31S
TS
T
STATE HWY 25
34THAVE
VE
RN
ON
BL
VD
39T
HS
T
49TH AVE
STE
INW
AY
ST
DIT
MAR
SBLV
D
ASTORIA BLVD
48T
HS
T
BROADWAY
LI EXWY
25THAVE
S
36THAVE
CommunityHealth
Prof i les
New York City Department of Health and Mental Hygiene
SECOND EDITION — 2006
TAKE CARE
NorthwestQueens
(Including Astoria,
Long Island City, and
Sunnyside)
nyc.gov/health
2 TA K E C A R E N O R T H W E S T Q U E E N S
New York City is the most diverse city in the U.S. — a fact reflected in the distinct character of each neighborhood. The second edition of the Community Health Profiles uses Take Care New York (TCNY), the city’s health policy, toexamine preventable causes of illness and death in all of NYC’s 42 neighborhoods. This report updates the 2002 profile(available at nyc.gov/health) by providing more recent and time-trend data, and a greater variety of health statistics. Key health issues in Northwest Queens include:
■ One in 5 Northwest Queens adults smokes, and smokers in this community are less likely to be trying to quitthan smokers in NYC overall (page 6).
■ Women in Northwest Queens are less likely to get regular Pap tests for cervical cancer than women in NYCoverall (page 11).
■ Northwest Queens has the second highest proportion of uninsured adults among all NYC neighborhoods, andforeign-born residents in this community are more likely to be without health insurance than those born in theU.S. (page 14).
Methods: While this report provides important information, it is not intended to be an exhaustive examination of the health ofNorthwest Queens residents, as not all health problems and their causes could be covered. Only statistically significant findings arediscussed in the text. For complete information on methods, see Technical Notes (page 15).
Community Health Profile, Second Edition: Northwest Queens
Northwest Queens at a Glance
Northwest Queens Queens NYC
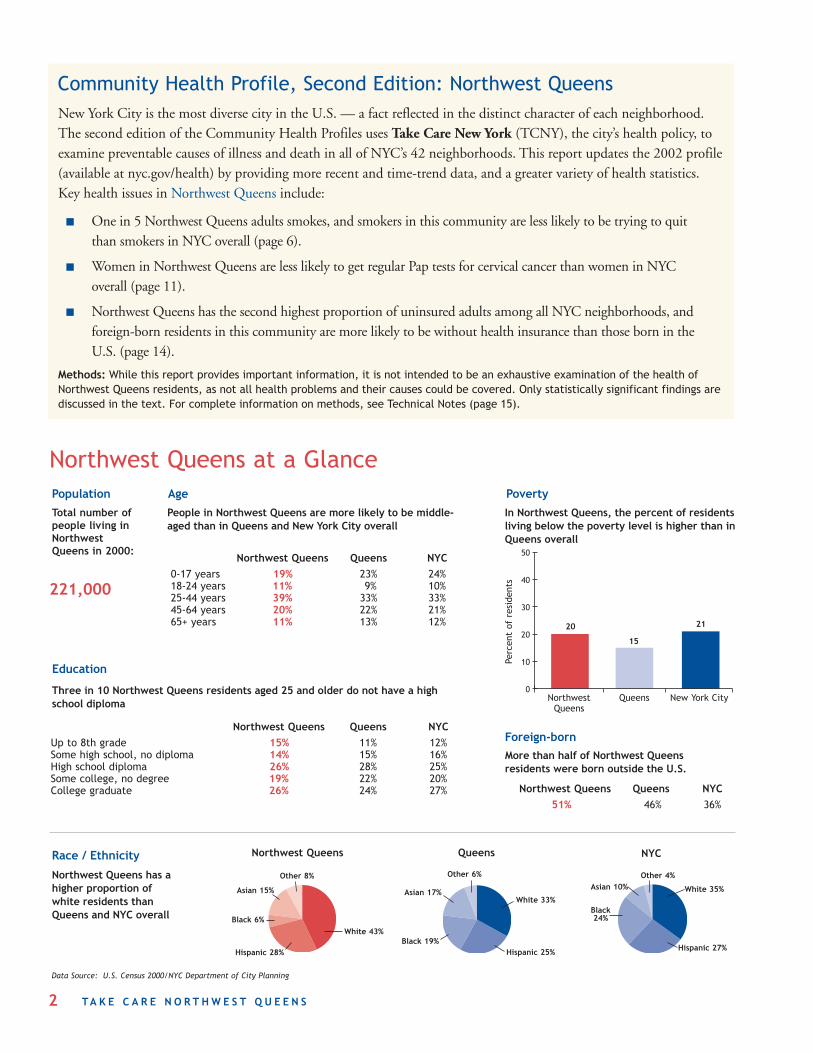
0-17 years 19% 23% 24%18-24 years 11% 9% 10%25-44 years 39% 33% 33%45-64 years 20% 22% 21%65+ years 11% 13% 12%
People in Northwest Queens are more likely to be middle-aged than in Queens and New York City overall
In Northwest Queens, the percent of residentsliving below the poverty level is higher than inQueens overall
Northwest Queens Queens NYC
Up to 8th grade 15% 11% 12%Some high school, no diploma 14% 15% 16%High school diploma 26% 28% 25%Some college, no degree 19% 22% 20%College graduate 26% 24% 27%
Three in 10 Northwest Queens residents aged 25 and older do not have a highschool diploma
20
15
21
0
10
20
30
40
50
Perc
ent
of r
esid
ents
NorthwestQueens
Queens New York City
Northwest Queens Queens NYC
Other 8%
White 43%
Hispanic 28%
Asian 15%
Black 6%
Other 6%
White 33%
Hispanic 25%
Asian 17%
Black 19%
Other 4%
White 35%
Hispanic 27%
Asian 10%
Black24%
More than half of Northwest Queensresidents were born outside the U.S.
Northwest Queens Queens NYC
51% 46% 36%
Data Source: U.S. Census 2000/NYC Department of City Planning
Northwest Queens has ahigher proportion ofwhite residents thanQueens and NYC overall
Total number ofpeople living inNorthwestQueens in 2000:
221,000
Race / Ethnicity
PovertyAge
Education
Foreign-born
Population

3TA K E C A R E N O R T H W E S T Q U E E N S
Perc
ent
of a
dult
s (1
8+)
NorthwestQueens
Queens New York City
2220
21
0
10
20
30
40
In 2004, the Health Department created a citywide health policy called Take Care New York(TCNY) to help improve the health of New Yorkers. TCNY identifies 10 key areas that causesignificant illness and death but can be improved through intervention by individuals, health careproviders, government agencies, and other organizations.
This report examines how well Northwest Queens residents are doing on health indicators for eachof the 10 TCNY goals. It examines areas in which the community is a health leader, as well as areasthat need improvement. The TCNY report card below shows where Northwest Queens ranksamong all 42 New York City neighborhoods. (See Technical Notes for information about howneighborhoods were defined and ranked.)
Take Care Northwest Queens
Below Average (bottom 10)
✓
Average (middle 22) Above Average (top 10)
✓
✓
✓
✓
Take Care New York Goals
1 Have a regular doctor
2 Be tobacco-free
3 Keep your heart healthy
4 Know your HIV status
5 Get help for depression
6 Live free of alcohol and drugs
7 Get checked for cancer
8 Get the immunizations you need
9 Make your home safe and healthy
10 Have a healthy baby
✓
✓
✓
✓
✓
Northwest Queens ranks as average on nearly all indicators when compared to the 41 other NYC neighborhoods
Take Care New York report card
People are good at rating their own health. In general,when asked to rate their general health as excellent, verygood, good, fair, or poor, those who say “fair” or “poor” aremore likely to have health problems than those who reportbetter health.
In Northwest Queens, more than one fifth of residentsreport being in fair or poor health (22%).
More than 1 in 5 adults in Northwest Queens considerthemselves to be in fair or poor health
How Residents Rate Their Own Health
Percents are age-adjusted.Data Source: NYC Community Health Survey 2002-03-04
Overall health

4 TA K E C A R E N O R T H W E S T Q U E E N S
Cancer 25%2,414 years lost
Heart Disease 18%1,776 years lost
Other* 39%3,892 years lost
0
200
400
600
800
1000
1995-96
Dea
ths
per
100,
000
peop
le
1997-98 1999-00 2001-02 2003-04
Drug-related 6%630 years lost
Accidents 5%516 years lost
People who die before age 75 can be thought of as dying early, orprematurely. If a person dies early, their years of potential life lost (YPLLs)can be calculated by subtracting their age at death from 75 years to get ameasure of premature death.
The causes of premature death differ across communities. The primary causeof premature death in Northwest Queens is cancer, as well as in both Queensand New York City overall.
Overall Death Rates in Northwest Queens
The death rate in Northwest Queens has decreased bymore than 15% in the past decade, mirroring the rate dropin New York City overall.
In 2003-2004, the average annual death rate in NorthwestQueens was similar to the rate in Queens and more than15% lower than in New York City overall (587/100,000 vs.610/100,000 in Queens and 718/100,000 in NYC).Throughout this profile, cause-specific death rates areprovided for TCNY goals.
The 2003-2004 average annualdeath rate for people younger than75 years in Northwest Queens ranks13th among 42 NYC neighborhoods
BETTER
Cancer causes the most years of potential life lost inNorthwest Queens
Premature death
WORSE
NorthwestQueensQueens
In Northwest Queens, death rates have dropped over the past10 years and are lower than in NYC overall
NYC
Rates are age-adjusted.Data Sources: Bureau of Vital Statistics, NYC DOHMH, 1995-2004; U.S. Census 1990and 2000/NYC Department of City Planning
Data Source: Bureau of Vital Statistics, NYC DOHMH, 2002-04
*Other includes HIV-related (5%), Homicide (3%), Suicide (3%), Chronic Lower RespiratoryDisease (2%), Congenital Conditions (2%), and Other (24%).
Data Sources: Bureau of Vital Statistics, NYCDOHMH, 2003-04; U.S. Census 2000/NYCDepartment of City Planning
Death rates
Top 5 causes of years of potential life lost
Death before age 75
Line graphs. All time-trend data are presented as annualaverages with 2 or 3 years of data combined. For example, inthis graph, the first point on each line represents the averageannual death rate for 1995 and 1996 combined.
Certain Perinatal Conditions 7%675 years lost
New York City
Northwest Queens Queens

5TA K E C A R E N O R T H W E S T Q U E E N S
0
20
40
60
80
100
62 66 71
182225
1312
11
0
5
10
15
20
25
30
35
28
24
88
24
7
Perc
ent
of a
dult
s (1
8+)
No personal doctor1 Go to ED when sick or need healthadvice2
Percents are age-adjusted.Data Sources: 1NYC Community Health Survey 2002-03-04, 2NYC Community Health Survey 2003-04
New York City
New York CityNorthwestQueens
Queens
Perc
ent
of a
dult
s (1
8-64
)
Northwest Queens Queens
Without a primary provider, people may seek routine health care in theemergency department (ED)
Health insurance is important foraccess to health care. NorthwestQueens adults are more likely to becurrently uninsured than those inNYC overall (25% vs. 18%). Inaddition, another 13% of residents inthis community went without healthinsurance at some time during the pastyear.
Insurance rates are calculated for adults aged 18-64 and age-adjusted.Data Source: NYC Community Health Survey 2002-03-04
GOAL 1 Have a Regular Doctor or Other Health Care ProviderTake Care New York Goals
The 2004 avoidable hospitalizationrate in Northwest Queens ranks 11thamong 42 NYC neighborhoods
BETTER
WORSE
NorthwestQueens
Queens
NYC
Data Sources: New York State Department of HealthStatewide Planning and Research Cooperative System,2004; U.S. Census 2000/NYC Department of CityPlanning
Avoidable hospitalizations
Access to care
Access to good medical care helps people prevent illnesses, identify healthconditions early, and treat health problems. Some conditions can and should bemanaged regularly outside the hospital. Higher rates of these avoidablehospitalizations can indicate reduced access to health care in a community.
Having a “medical home”— a personal doctor or other health care provider anda regular place of care other than the emergency department (ED) — is a criticalcomponent of good health care access. In Northwest Queens, almost 3 in 10residents (28%) do not have a regular doctor, compared to the TCNY goal ofless than 20%. In addition, nearly 1 in 10 Northwest Queens residents goes tothe ED when they are sick or need health advice (8%).
TCNY Target: <20% by 2008
Insured now, and forentire past yearInsured now, butuninsured some timein past yearUninsured now
Adults in Northwest Queens are more likely to be uninsured than thosein NYC overall
Health insurance

6 TA K E C A R E N O R T H W E S T Q U E E N S
More than 1 in 5 adults in Northwest Queens smoke
Percents are age-adjusted.Data Source: NYC Community Health Survey 2004
Smoking is the leading cause of preventable death in New York City and the cause of many illnesses, including heartdisease, stroke, emphysema, and lung cancer. One fifth of Northwest Queens residents (21%) currently smoke. Manymethods to quit smoking are available, but smokers in Northwest Queens are less likely to be trying to kick the habit thanthose in Queens and NYC overall.
Residents who smoke Attempts to quit smoking in the past year
Heart disease can cause severe illness and death. The heart disease hospitalization rate in Northwest Queens has increasedby more than 10% in the past decade. Residents had an average annual heart disease hospitalization rate in 2003-2004that was similar to both the Queens and NYC overall rates (1,709/100,000 vs. 1,727/100,000 in Queens and1,856/100,000 in NYC). In contrast to hospitalizations, the heart disease death rate in Northwest Queens has decreased inthe past 10 years. The 2003-2004 rate (280/100,000) was similar to the rates in Queens (288/100,000) and NYC overall(297/100,000).
Rates are age-adjusted.Data Sources: New York State Department of Health Statewide Planning and ResearchCooperative System, 1995-2004; U.S. Census 1990 and 2000/NYC Department of CityPlanning
Rates are age-adjusted.Data Sources: Bureau of Vital Statistics, NYC DOHMH, 1995-2004;U.S. Census 1990 and 2000/NYC Department of City Planning
High blood pressure and high cholesterol. Both of these conditions contribute to heart disease. In Northwest Queens, 23% of adultswere told by a health care professional that they have high blood pressure (similar to 26% in Queens and NYC overall), and onequarter (25%) were told that they have high cholesterol (similar to 26% in Queens and NYC overall).
GOAL 2 Be Tobacco-Free
0
100
200
300
400
500
0
400
800
1200
1600
2000
2400
Hos
pita
lizat
ions
per
100
,000
adul
ts (
18+)
Heart disease hospitalizations Deaths due to heart disease
Dea
ths
per
100,
000
peop
lePe
rcen
t of
adu
lt s
mok
ers
(18+
)
0
20
40
60
80
100
6866
51
NorthwestQueens
New York CityQueens
Perc
ent
of a
dult
s (1
8+)
NorthwestQueens
New York CityQueens
16 1821
0
10
20
30
40
50
Smokers in Northwest Queens are less likely totry to quit
TCNY Target: <18% by 2008
The heart disease hospitalization rate in NorthwestQueens has increased in the past decade
The heart disease death rate in Northwest Queenshas decreased in the past decade
1995-96 1997-98 1999-00 2001-02 2003-04 1995-96 1997-98 1999-00 2001-02 2003-04
GOAL 3 Keep Your Heart Healthy
Percents are age-adjusted. Data Source: NYC Community Health Survey 2002
New York City
Northwest Queens Queens
Percents are age-adjusted.Data Source: NYC Community Health Survey 2004
New York City
Northwest Queens Queens

7TA K E C A R E N O R T H W E S T Q U E E N S
1819
20
0
5
10
15
20
25
30
Perc
ent
of a
dult
s (1
8+)
NorthwestQueens
New York CityQueens
8 89
0
5
10
15
20
25
30
NorthwestQueens
New York CityQueens
Percents are age-adjusted.Data Source: NYC Community Health Survey 2002-03-04
Perc
ent
of a
dult
s (1
8+)
In addition to smoking, high blood cholesterol and high bloodpressure, other factors that put people at risk for heart disease — lackof physical activity and obesity — can be prevented or controlled.
Obesity can lead to a variety of health problems, including heartdisease and diabetes. Rates of obesity are increasing rapidly in NewYork City and across the U.S., making it a major public healthconcern. In Northwest Queens, nearly one fifth of adults are obese(18%).
The increasing prevalence of obesity in the U.S. has contributed to anepidemic of diabetes. About 95% of diabetes cases are type 2 diabetes,which is strongly associated with obesity. Uncontrolled diabetes canworsen the harmful effects of high blood pressure, high cholesterol,and other risk factors for heart disease.
In Northwest Queens, 8% of adults have diabetes.
Nearly 1 in 5 adults in Northwest Queens is obese
Obesity is defined as a body-mass-index (BMI) of 30 or greater.Percents are age-adjusted.Data Source: NYC Community Health Survey 2002-03-04
One in 12 adults has diabetes in Northwest Queens
Physical activity helps people maintain ahealthy weight and strengthens thecardiovascular system. More than 4 in 10Northwest Queens residents report doing nophysical activity at all (42%). Less than half ofresidents in this community (45%) reportexercising at least 3 days a week.
Survey Question: On average, how many days per week do you exercise for at least 30 minutes?Percents are age-adjusted.Data Source: NYC Community Health Survey 2003
0 20 40 60 80 100
43 15 23 19
46 15 21 18
42 13 23 22Northwest
Queens
New YorkCity
Queens
Percent of adults (18+)
0 days 1-2 days 3-4 days 5-7 days
Centers for Disease Control and PreventionRecommendations
Adults should do either 20 minutes of vigorousexercise 3 times per week or 30 minutes ofmoderate exercise 5 times per week.
Obesity
Diabetes
Less than half of Northwest Queens adults are meeting physical activityrecommendations
Days per week of recreational exercise
8 TA K E C A R E N O R T H W E S T Q U E E N S
Perc
ent
of a
dult
s (1
8+)
Northwest Queens
New York CityQueens
Perc
ent
of a
dult
s (1
8-64
)
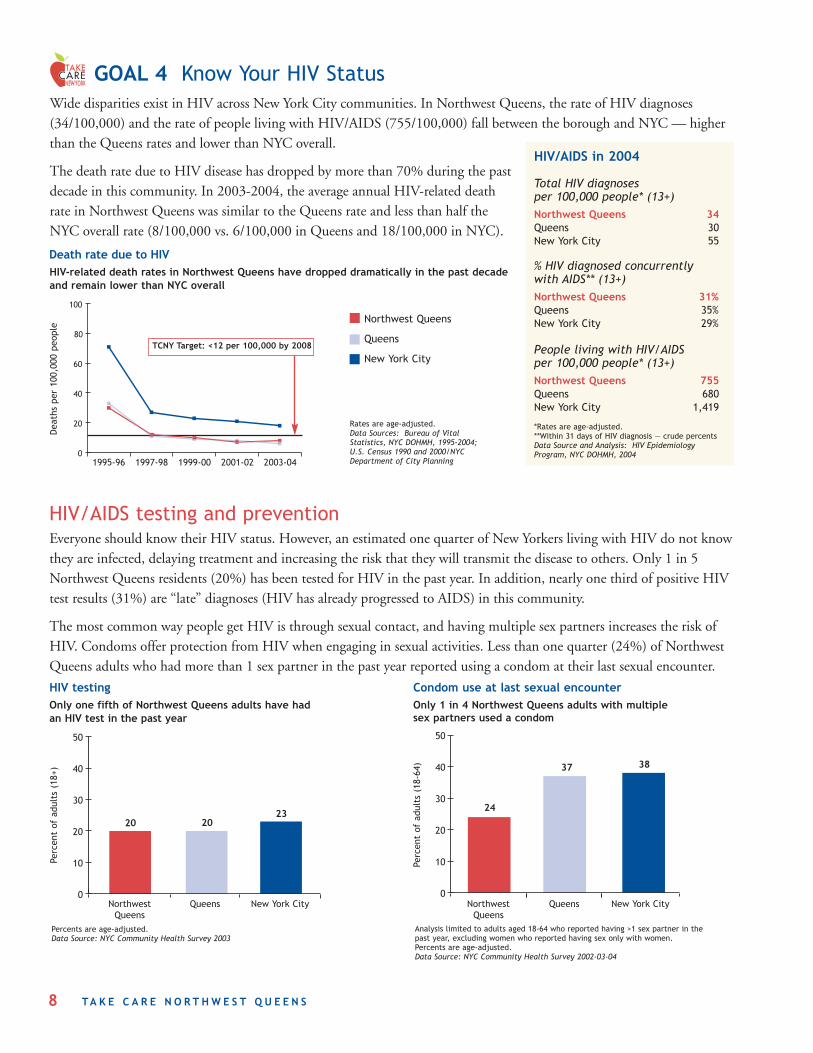
24
37 38
0
10
20
30
40
50
2020
23
0
10
20
30
40
50
NorthwestQueens
New York CityQueens
Only one fifth of Northwest Queens adults have hadan HIV test in the past year
Only 1 in 4 Northwest Queens adults with multiplesex partners used a condom
0
20
40
60
80
100
Dea
ths
per
100,
000
peop
le
Everyone should know their HIV status. However, an estimated one quarter of New Yorkers living with HIV do not knowthey are infected, delaying treatment and increasing the risk that they will transmit the disease to others. Only 1 in 5Northwest Queens residents (20%) has been tested for HIV in the past year. In addition, nearly one third of positive HIVtest results (31%) are “late” diagnoses (HIV has already progressed to AIDS) in this community.
The most common way people get HIV is through sexual contact, and having multiple sex partners increases the risk ofHIV. Condoms offer protection from HIV when engaging in sexual activities. Less than one quarter (24%) of NorthwestQueens adults who had more than 1 sex partner in the past year reported using a condom at their last sexual encounter.
HIV/AIDS testing and prevention
Rates are age-adjusted.Data Sources: Bureau of VitalStatistics, NYC DOHMH, 1995-2004;U.S. Census 1990 and 2000/NYCDepartment of City Planning
Percents are age-adjusted.Data Source: NYC Community Health Survey 2003
Analysis limited to adults aged 18-64 who reported having >1 sex partner in thepast year, excluding women who reported having sex only with women.Percents are age-adjusted.Data Source: NYC Community Health Survey 2002-03-04
TCNY Target: <12 per 100,000 by 2008
Wide disparities exist in HIV across New York City communities. In Northwest Queens, the rate of HIV diagnoses(34/100,000) and the rate of people living with HIV/AIDS (755/100,000) fall between the borough and NYC — higherthan the Queens rates and lower than NYC overall.
The death rate due to HIV disease has dropped by more than 70% during the pastdecade in this community. In 2003-2004, the average annual HIV-related deathrate in Northwest Queens was similar to the Queens rate and less than half theNYC overall rate (8/100,000 vs. 6/100,000 in Queens and 18/100,000 in NYC).
Northwest Queens
Queens
New York City
HIV/AIDS in 2004
Total HIV diagnosesper 100,000 people* (13+)Northwest Queens 34Queens 30New York City 55
% HIV diagnosed concurrently with AIDS** (13+)Northwest Queens 31%Queens 35%New York City 29%
People living with HIV/AIDS per 100,000 people* (13+)Northwest Queens 755Queens 680New York City 1,419
*Rates are age-adjusted.**Within 31 days of HIV diagnosis — crude percentsData Source and Analysis: HIV EpidemiologyProgram, NYC DOHMH, 2004
HIV-related death rates in Northwest Queens have dropped dramatically in the past decadeand remain lower than NYC overall
HIV testing
Death rate due to HIV
Condom use at last sexual encounter
1995-96 1997-98 1999-00 2001-02 2003-04
GOAL 4 Know Your HIV Status
9TA K E C A R E N O R T H W E S T Q U E E N S
Perc
ent
of a
dult
s (1
8+)
NorthwestQueens
New York CityQueens
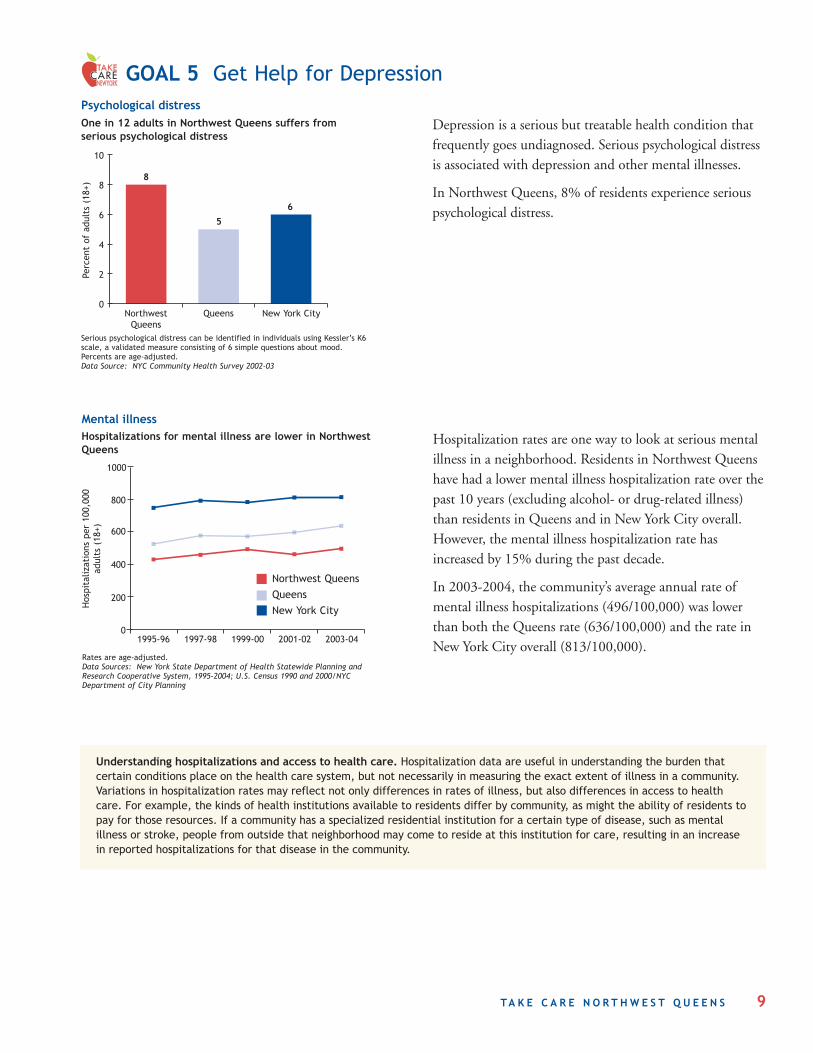
8
5
6
0
2
4
6
8
10
Depression is a serious but treatable health condition thatfrequently goes undiagnosed. Serious psychological distressis associated with depression and other mental illnesses.
In Northwest Queens, 8% of residents experience seriouspsychological distress.
Serious psychological distress can be identified in individuals using Kessler’s K6scale, a validated measure consisting of 6 simple questions about mood.Percents are age-adjusted.Data Source: NYC Community Health Survey 2002-03
Hospitalization rates are one way to look at serious mentalillness in a neighborhood. Residents in Northwest Queenshave had a lower mental illness hospitalization rate over thepast 10 years (excluding alcohol- or drug-related illness)than residents in Queens and in New York City overall.However, the mental illness hospitalization rate hasincreased by 15% during the past decade.
In 2003-2004, the community’s average annual rate ofmental illness hospitalizations (496/100,000) was lowerthan both the Queens rate (636/100,000) and the rate inNew York City overall (813/100,000).
0
200
400
600
800
1000
Hos
pita
lizat
ions
per
100
,000
ad
ults
(18
+)
1995-96 1999-001997-98
Northwest QueensQueensNew York City
Rates are age-adjusted.Data Sources: New York State Department of Health Statewide Planning andResearch Cooperative System, 1995-2004; U.S. Census 1990 and 2000/NYCDepartment of City Planning
Understanding hospitalizations and access to health care. Hospitalization data are useful in understanding the burden thatcertain conditions place on the health care system, but not necessarily in measuring the exact extent of illness in a community.Variations in hospitalization rates may reflect not only differences in rates of illness, but also differences in access to healthcare. For example, the kinds of health institutions available to residents differ by community, as might the ability of residents topay for those resources. If a community has a specialized residential institution for a certain type of disease, such as mentalillness or stroke, people from outside that neighborhood may come to reside at this institution for care, resulting in an increasein reported hospitalizations for that disease in the community.
One in 12 adults in Northwest Queens suffers fromserious psychological distress
Hospitalizations for mental illness are lower in NorthwestQueens
2003-042001-02
Psychological distress
Mental illness
GOAL 5 Get Help for Depression

10 TA K E C A R E N O R T H W E S T Q U E E N S
Perc
ent
of a
dult
s (1
8+)
NorthwestQueens
New York CityQueens
Nearly 1 in 6 adults in Northwest Queens engaged inbinge drinking in the past month
14 14
0
5
10
15
20
25
16
The abuse of alcohol and drugs can lead to manypreventable injuries, illnesses, and deaths, including injuryin motor-vehicle crashes, liver disease, and violence.
Estimates of binge drinking represent the risk of immediatealcohol-related problems, such as alcohol-poisoning, injuryand violence. In Northwest Queens, 16% of adults reportengaging in at least one episode of binge drinking (definedas consuming 5 or more drinks on one occasion) in thepast month.
Alcohol-related hospitalizations reflect both acute andchronic (e.g., liver disease) consequences of alcohol abuse.In 2003-2004, the average annual alcohol-relatedhospitalization rate in Northwest Queens was similar to theQueens rate and lower than the rate in New York City overall(218/100,000 vs. 235/100,000 in Queens and 439/100,000in NYC).
The drug-related hospitalization rate in Northwest Queenshas decreased by 35% in the past decade. In 2003-2004, therate (174/100,000) was lower than in Queens (234/100,000)and New York City overall (595/100,000).
The 2003-2004 death rate due to drugs in NorthwestQueens (10/100,000) was more than 65% higher than theQueens overall rate (6/100,000) and same as the rate in NYCoverall.
Percents are age-adjusted.Data Source: NYC Community Health Survey 2002-03-04
0
200
400
600
800
Hos
pita
lizat
ions
per
100
,000
adu
lts
(18+
)
1995-96 1999-001997-98 2003-042001-02
Rates are age-adjusted.Data Sources: New York State Department of Health Statewide Planning and ResearchCooperative System, 1995-2004; U.S. Census 1990 and 2000/NYC Department of CityPlanning
0
200
400
600
800
1995-96 1999-001997-98 2003-042001-02
Drug-related hospitalizations
Rates are age-adjusted.Data Sources: New York State Department of Health Statewide Planning andResearch Cooperative System, 1995-2004; U.S. Census 1990 and 2000/NYCDepartment of City Planning
0
5
10
15
20
25
30
35
Dea
ths
per
100,
000
peop
le
Rates are age-adjusted.Data Sources: Bureau of Vital Statistics, NYC DOHMH, 1995-2004; U.S. Census1990 and 2000/NYC Department of City Planning
Hos
pita
lizat
ions
per
100
,000
adu
lts
(18+
)
The alcohol-related hospitalization rate inNorthwest Queens is lower than the NYC rate
TCNY Target: <8 per 100,000 by 2008
Binge drinking
Alcohol-related hospitalizations
The drug-related death rate is higher in Northwest Queensthan in Queens overall
The drug-related hospitalization rate in Northwest Queenshas decreased and remains lower than in NYC overall
1995-96 1999-001997-98 2003-042001-02
GOAL 6 Live Free of Dependence on Alcohol and Drugs
Drug-related deaths
Northwest Queens Queens New York City Northwest Queens Queens New York City
New York City
Northwest Queens Queens

Cancer screening can save lives by preventing disease,catching cancer in its early stages and providingopportunities for treatment. TCNY has set specificscreening targets for cervical, breast, and coloncancers.
Women in Northwest Queens are less likely to getPap tests for cervical cancer than women in NYCoverall (69% vs. 80%). In addition, the percent ofwomen in this community who have had a timelymammogram for breast cancer is below the TCNYtarget of more than 85%. Similarly, only about 4 in10 adults aged 50 and older in Northwest Queenshave had a colonoscopy in the past 10 years.
11TA K E C A R E N O R T H W E S T Q U E E N S
Cancer deaths
0
50
100
150
200
250
300
Dea
ths
per
100,
000
peop
le
Rates are age-adjusted.Data Sources: Bureau of Vital Statistics, NYC DOHMH, 1995-2004; U.S. Census 1990 and2000/NYC Department of City Planning
Rates are age-adjusted. Data Sources: Bureau of Vital Statistics, NYC DOHMH, 2003-2004; U.S. Census 2000/NYC Department of City Planning
1995-96 1999-001997-98 2003-042001-02
4244
47
7675
7880
76
69
0
20
40
60
80
100
Perc
ent
of a
dult
s (1
8+)
Colon cancer screening(colonoscopy), past 10
years (adults 50+)2
Breast cancer screening(mammogram), past 2years (women 40+)1
Cervical cancerscreening (Pap test),
past 3 years (all women)1
Percents are age-adjusted.Data Sources: 1NYC Community Health Survey 2002 & 2004, 2NYC Community Health Survey 2003-04
TCNY Target: >85% by 2008
In Northwest Queens, cancer screening is lower than TCNY targets
Highest cancer death rates in Northwest Queens (2003-2004)
MEN WOMENDEATHS / 100,000 PEOPLE
Type of Cancer Northwest Queens NYC
Lung, trachea, bronchus 45 51
Colorectal 22 23
Prostate 18 25
Pancreas 15 12
Blood-related 13 18
DEATHS / 100,000 PEOPLE
Type of Cancer Northwest Queens NYC
Lung, trachea, bronchus 24 28
Breast 20 26
Colorectal 14 17
Blood-related 11 12
Pancreas 7 9
The highest cancer-related death rates among men in Northwest Queens are due to lung, colon, and prostate cancers.Among women, lung, breast, and colorectal cancers are the top 3 causes of cancer-related death.
Cancer screenings
TCNY Target: >60% by 2008
The death rate due to cancer is lower in Northwest Queens thanin NYC overall
The death rate due to cancer has decreased inNorthwest Queens during the past decade. The 2003-2004 average annual cancer death rate was the sameas the Queens rate and 15% lower than the NYCoverall rate (137/100,000 vs. 161/100,000 in NYC).
GOAL 7 Get Checked for Cancer
New York City
Northwest Queens Queens
Preventing cancer and related deaths. Individuals canreduce their risk of the most common cancers. Neversmoking or quitting the habit greatly reduces the risk oflung and other cancers. High colon and breast cancerdeath rates highlight the importance of gettingrecommended screenings so treatment can begin early.
Northwest Queens Queens New York City

12 TA K E C A R E N O R T H W E S T Q U E E N S
Perc
ent
of o
lder
adu
lts
(65+
)
Flu immunization in past year (adults aged 65+)
Pneumococcal immunization ever(adults aged 65+)
Flu shot rates among older adults fall below the TCNY targetand pneumococcal (pneumonia) immunizations are even lower
60 60 60
484850
0
20
40
60
80
100
Data Source: NYC Community Health Survey 2002-03-04
Rate
per
1,0
00 c
hild
ren
(0-1
7)te
sted
NorthwestQueens
Queens
Lead poisoning among young children continues to be a problem
8
10
0
2
4
6
8
10
12
8
New York City
Childhood lead poisoning is a health problem that may be associated with decreased intelligence, learning andbehavioral problems, and delayed growth and development.While the number of lead-poisoned children (0-17 yearsold) in New York City has declined dramatically over thepast decade, the Health Department aims to eliminate leadpoisoning by preventing children’s exposure to lead-basedpaint and other sources of lead.
In 2004, 71 children in Northwest Queens (8/1,000) werenewly identified with lead poisoning (defined as a bloodlead level greater than or equal to 10 µg/dL).
Lead poisoning is defined as a blood lead level ≥10 µg/dL.Data Source and Analysis: Lead Poisoning Prevention Program, NYC DOHMH, 2004
4
5
0
2
4
6
8
10
12
4
Perc
ent
of a
dult
s (1
8+)
NorthwestQueens
New York CityQueens
Fewer than 1 in 20 adults in Northwest Queenssuffers from asthma
Percents are age-adjusted.Data Source: NYC Community Health Survey 2002-03-04
Conditions, or “triggers,” in the home environment, suchas the presence of second-hand smoke or dust, can causeasthma attacks. Some housing conditions associated withasthma triggers, such as rodent or roach infestation, aremore common in some neighborhoods than others.
Many adults in Northwest Queens report having asthma(4%).
Asthma in Adults and Children
Immunizations
Childhood lead poisoning
Asthma
GOAL 8 Get the Immunizations You Need
GOAL 9 Make Your Home Safe and Healthy
Immunizations are not just for kids. Of all the deaths thatcould have been prevented by vaccination, 99% occur inadults. Take Care New York has set a target that more than80% of adults aged 65 and older will get an annual flu(influenza) shot by 2008. The Northwest Queens fluimmunization rate among older adults falls short of theTCNY target by 25%.
Immunization rates for pneumonia are lower than those forflu across NYC. Only half of older adults in NorthwestQueens have ever received the pneumococcal vaccine,which protects against one common cause of pneumonia.Northwest Queens Queens New York City
TCNY Target: >80% by 2008

13TA K E C A R E N O R T H W E S T Q U E E N S
0
10
20
30
40
50
60
Perc
ent
of l
ive
birt
hs
Mothers in Northwest Queens are more likely to receive lateor no prenatal care than those in New York City overall
1995-96 1999-001997-98 2003-042001-02
The health of babies depends on the health of mothers. Good health care for pregnant women includes high qualityprenatal care beginning in the first trimester of pregnancy. The average annual percent of women who received late or noprenatal care has declined in Northwest Queens in the past decade and was higher in 2003-2004 than the percent in NYCoverall (35% vs. 28%).
Teenage mothers and their babies face a number of risks. Pregnant teens are more likely to be poor and not complete highschool than other teens, and they are more likely to have babies born with low birthweight than older women. The birthrate to teenage mothers has decreased over the past 10 years by nearly 20% in Northwest Queens. In 2003-2004, theaverage annual teen birth rate in this community (60/1,000) was 20% lower than in NYC overall (75/1,000).
0
5
10
15
Hos
pita
lizat
ions
per
1,0
00
adul
ts (
18+)
1995-96 1999-001997-98 2003-042001-020
5
10
15
Hos
pita
lizat
ions
per
1,0
00ch
ildre
n (0
-17)
Rates of asthma hospitalization are lower inNorthwest Queens than in NYC overall
Rates are age-adjusted.Data Sources: New York State Department of Health Statewide Planning andResearch Cooperative System, 1995-2004; U.S. Census 1990 and 2000/NYCDepartment of City Planning
Neighborhood asthma hospitalization rates depend in part on the percent of residents who have asthma. However, goodmedical management of asthma can prevent many asthma-related hospitalizations, and patients can work with health careproviders to better control their asthma. Thus, the asthma hospitalization rate can also indicate poor access to health care.
Asthma hospitalization rates for adults in Northwest Queens are lower than in NYC overall (2/1,000 vs. 3/1,000). Therate among children (0-17 years old) has declined nearly 60% in the past decade, and the 2003-2004 rate was lower thanboth the Queens and NYC overall rates (3/1,000 vs. 4/1,000 in Queens and 6/1,000 in NYC).
Adult asthma hospitalizations
Prenatal care
0
25
50
75
100
125
Birt
hs t
o te
enag
ers
(15-
19)
per
1,00
0 liv
e bi
rths
The birth rate to teenage mothers (15-19 years) islower in Northwest Queens than in NYC overall
Data Source: Bureau of Vital Statistics, NYC DOHMH, 1995-2004
1995-96 1999-001997-98 2003-042001-02
1995-96 1997-98 2003-042001-02
Goal 10 Have a Healthy Baby
The child asthma hospitalization rate has decreasedand remains lower in Northwest Queens
Teenage mothers
Child asthma hospitalizations
Data Sources: New York State Department of Health Statewide Planning andResearch Cooperative System, 1995-2004; U.S. Census 1990 and 2000/NYCDepartment of City Planning
Data Source: Bureau of Vital Statistics, NYC DOHMH, 1995-2004
1999-00
Northwest Queens Queens New York City Northwest Queens Queens New York City
Northwest Queens Queens New York CityNorthwest Queens Queens New York City

14 TA K E C A R E N O R T H W E S T Q U E E N S
0
5
10
15
20
Perc
ent
of l
ive
birt
hs
Low-birthweight babies are less common inNorthwest Queens
0
5
10
15
20
Dea
ths
per
1,00
0 liv
e bi
rths
The IMR is similar in Northwest Queens and NYCoverall
Babies born with low birthweight tend to have more health problems than others. In 2003-2004, the average percent ofbabies born with low birthweight in Northwest Queens was 7% — lower than in Queens (8%) and NYC overall (9%).
Infant mortality (the death of babies in the first year of life) has declined over the past 10 years in NYC. The 2002-2004rate in Northwest Queens was 5/1,000, similar to both Queens and NYC overall.
Low birthweight is defined as <2,500 grams (5.5 pounds).Data Source: Bureau of Vital Statistics, NYC DOHMH, 1995-2004
1995-96 1999-001997-98 2003-042001-02 1993-95 1999-20011996-98 2002-04
Neighborhood Health Highlight: The Uninsured
Perc
ent
of a
dult
s (1
8-64
) w
ith
prim
ary
care
phy
sici
an
0
20
40
60
80
100
78
41
Every New York City neighborhood has different health concerns. Here we highlight the uninsured in Northwest Queens.
One quarter of Northwest Queens adults (25%) do not havehealth insurance, making it the neighborhood with the secondhighest proportion of uninsured adults in New York City.Lack of health insurance can lead to poor access to care, whichcan threaten good health. In fact, those without insurance inNorthwest Queens are significantly less likely to have aprimary care physician than those with insurance (78% vs.41%).
In Northwest Queens, individuals born outside the U.S. aretwice as likely to be uninsured as those born in the U.S. (35%vs. 17%). Northwest Queens has the third highest proportionof foreign born residents (51%) among all NYCneighborhoods, and most recent immigrants are not eligiblefor public health insurance because of their immigrationstatus.
Percents are calculated for adults aged 18-64 and age-adjusted.Data Source: NYC Community Health Survey 2002-03-04
Uninsured residents are less likely to have aregular doctor in Northwest Queens
Low birthweight
TCNY Target: <5.0 per 1,000 by 2008
Free and low cost health insurance is available throughMedicaid and Family Health Plus for eligible low-income groups.Despite this, 37% of Northwest Queens residents living below thepoverty level are uninsured.
For information on finding affordable or free health insurance,call 311.
TAKING ACTION
Infant mortality rate (IMR)
Data Source: Bureau of Vital Statistics, NYC DOHMH, 1993-2004
Insured Uninsured
Perc
ent
of u
nins
ured
adu
lts
(18-
64)
17
35
0
10
20
30
40
50
Percents are calculated for adults aged 18-64 and age-adjusted.Data Source: NYC Community Health Survey 2002-03-04
Foreign-born residents are more likely to be uninsured in Northwest Queens
Born in the U.S. Born outside the U.S.
Northwest Queens Queens New York City Northwest Queens Queens New York City

15TA K E C A R E N O R T H W E S T Q U E E N S
Technical notes
AnalysesAll analyses were conducted by the Bureau of Epidemiology Services, NYC DOHMH, unless otherwise indicated. All estimates in thisreport were age standardized to the Year 2000 Standard Population, except for age-specific data and mother-child health indicators. AllCHS analyses were done in SUDAAN to account for complex survey design and were weighted to the New York City population accordingto the U.S. Census 2000.
Data sourcesNYS DOH hospitalization data: Includes hospitalizations of NYC residents that occurred anywhere in New York State. Patient zip code wasused to classify hospitalizations into 42 neighborhoods. Data from 1995-2003 updated in April 2005; 2004 data updated in July 2005.
Vital Statistics data: Includes births and deaths of NYC residents that occurred within New York City. Data were combined across years toincrease statistical stability and average annual rates are presented. In addition, infant mortality rates (IMR) were calculated as 3-yearannual averages, and this statistic and others may differ from the presentation in “Summary of Vital Statistics” reports from the Bureauof Vital Statistics, NYC DOHMH.
Community Health Survey data: The NYC Community Health Survey (CHS) is an annual random-digit-dial telephone survey ofapproximately 10,000 adults in New York City. This profile uses the following datasets from this survey: NYC CHS 2002, NYC CHS 2003,NYC CHS 2004, NYC CHS 2002-03-04, NYC CHS 2002-03, NYC CHS 2002 & 2004, and NYC CHS 2003-04. The combined-year datasetsincrease statistical power, allowing for more stable analyses at the neighborhood level.
Neighborhood DefinitionsThe 42 NYC neighborhoods are based on the United Hospital Fund definitions of neighborhood, which are specified by zip code. For acomplete listing of all 42 neighborhoods and their zip codes, go to nyc.gov/health. The zip codes included in analyses of NorthwestQueens are 11101, 11102, 11103, 11104, 11105, 11106, and 11109. Please note that some neighborhoods were combined for statisticalpurposes in the CHS 2002, CHS 2003 and CHS 2004 datasets to make a total of 33 (2002) or 34 (2003, 2004) neighborhoods. NorthwestQueens statistics from the 2003 and 2004 individual-year datasets include data from the neighboring communities in West Queens,including Corona, Elmhurst, Jackson Heights, Maspeth, and Woodside.
Avoidable HospitalizationsData based on Ambulatory Care Sensitive Conditions (called “avoidable hospitalizations” in this report) were calculated using the Agencyfor Healthcare Research and Quality (AHRQ) classification of inpatient hospitalization data. Conditions in the overall measure include:Diabetes Short-term Complications Admission Rate, Diabetes Long-term Complications Admission Rate, Pediatric Asthma Admission Rate,Chronic Obstructive Pulmonary Disease Admission Rate, Pediatric Gastroenteritis Admission Rate, Hypertension Admission Rate,Congestive Heart Failure Admission Rate, Dehydration Admission Rate, Bacterial Pneumonia Admission Rate, Urinary Tract InfectionAdmission Rate, Angina without Procedure Admission Rate, Uncontrolled Diabetes Admission Rate, Adult Asthma Admission Rate, andRate of Lower-extremity Amputation among Patients with Diabetes.
Significance TestingFor all data, 95% confidence limits were calculated for neighborhood, borough, and NYC estimates. If these ranges did not overlap, asignificant difference was inferred. This is a conservative measure of statistical difference. This methodology also was used to examinedifferences between years in neighborhood trend data. Only robust findings found to be statistically significant are discussed in thetext. In addition, all NYC CHS estimates were evaluated for statistical stability using the relative standard error (RSE). Those estimateswith an RSE > .30 are flagged in graphs, “Estimate is unstable due to small sample size and should be interpreted with caution."
TCNY report cardThe neighborhood was classified according to where it ranked in comparison to the other 41 NYC neighborhoods with Above Average =rankings 1-10, Average = rankings 11-32, and Below Average = rankings 33-42 where 1 = the best neighborhood score. Rankings werecomputed by combining (or in some cases, using only one indicator) standardized measures (z-scores) of the following health indicators foreach TCNY goal: TCNY#1 - primary care provider, insurance, ED visits; TCNY#2 - current smokers; TCNY#3 - diabetes, obesity, exercise,heart disease hospitalizations, heart disease mortality; TCNY#4 - HIV testing, AIDS mortality; TCNY#5 - serious psychological distress,mental illness hospitalizations; TCNY#6 - binge drinking, alcohol-related hospitalizations, drug-related hospitalizations, drug-relatedmortality; TCNY#7 - cervical cancer screening, breast cancer screening, colon cancer screening, cancer mortality; TCNY#8 - fluimmunization; TCNY#9 - child lead poisoning, adult asthma rates; TCNY#10 - prenatal care, teenage mothers, low birthweight, infantmortality.
Cover Photograph: 38th Street, Queens. Photo by Dejana Selenic. Maps by Susan Resnick.
Thank you to all the individuals who contributed to these reports: Sonia Angell, Fatima Ashraf, Birgit Bogler, Shadi Chamany, LouiseCohen, Lorna Davis, Erica Desai, Tamara Dumanovsky, Donna Eisenhower, Jennifer Ellis, Tim Frasca, Stephen Friedman, Renu Garg, ChrisGoranson, Leena Gupta, Charon Gwynn, David Hanna, Kelly Henning, Mary Huynh, John Jasek, Qun Jiang, Deborah Kaplan, AdamKarpati, Elizabeth Kilgore, Marty Kim, Vani Kurup, Brooke Levinson, Cortnie Lowe, Jingsong Lu, Xiaowu Lu, Jenna Mandel-Ricci, ThomasMatte, Tina McVeigh, Rachel Miller, Trang Nguyen, Leze Nicaj, Preeti Pathela, Robyn Philburn, Jane Plapinger, Chitra Ramaswamy, JudySackoff, Julia Schillinger, Tejinder Singh, Sally Slavinski, Catherine Stayton, Parisa Tehranifar, William Vaughn, Joshua Volle, JoyceWeinstein, Kellee White, Candace Young, and Regina Zimmerman.
NYC Community Health Profiles
Division of Epidemiology, Bureau of Epidemiology Services, 125 Worth Street, CN-6, New York, NY 10013
Michael R. BloombergMayor
Thomas R. Frieden, MD, MPHCommissioner of Health and Mental Hygiene
Copyright©2006The New York City Department of Health and Mental HygieneNYC Community Health Profiles, Second Edition feature information about 42 neighborhoods in NewYork City.
Suggested citation: Olson EC, Van Wye G, Kerker B, Thorpe L, Frieden TR. Take Care NorthwestQueens. NYC Community Health Profiles, Second Edition; 2006; 29(42):1-16.
PRST STDU.S. POSTAGE
PAIDNEW YORK, N.Y.PERMIT NO. 6174
This report is an updated, expanded second edition of the2002 Community Health Profile for Northwest Queens.
First and second edition reports on all 42 New York Cityneighborhoods are available from the New York CityDepartment of Health and Mental Hygiene online or by mail.
Web: nyc.gov/healthClick on “My Community’s Health”
Email: [email protected]
Mail:Community Health ProfilesNew York City Department of Health and Mental HygieneDivision of Epidemiology125 Worth Street, Room 315, CN-6New York, NY 10013
For more information about health issues in this report, please call 311.
InsideCommunity-specificinformation on . . .
Census Data 2
TCNY Report Card 3
Death Rates 4
Take Care New York Have a Regular Doctor 5
Be Tobacco Free 6
Keep Your Heart Healthy 6
Know Your HIV Status 8
Get Help for Depression 9
Live Free of Dependence on Alcohol and Drugs 10
Get Checked for Cancer 11
Get the Immunizations You Need 12
Make Your Home Safe and Healthy 12
Have a Healthy Baby 13
Neighborhood HealthHighlight 14
Community Health Profile for Northwest Queens
New York City Department of Health and Mental Hygiene
NEW IN THE SECOND EDITION:■ Take Care New York report card■ Time-trend data on births, hospitalizations, and deaths■ More neighborhood-specific health statistics■ Robust estimates from data through 2004
EP
I122
R40
1
nyc.gov/health