northern pipeline interconnector economic impact ...eisdocs.dsdip.qld.gov.au/completed...
TRANSCRIPT
Northern Pipeline Interconnector Economic Impact Assessment Final Report September 2008
Northern Pipeline Interconnector Economic Impact Assessment Final Report
Prepared for: Southern Regional Water Pipeline Company (Trading as LinkWater) Level 5, 200 Creek Street BRISBANE QLD 4000
Prepared by: Economic Associates Pty Ltd ACN 085 445 610 PO Box 541 Spring Hill QLD 4004 Telephone: (07) 3839 1011 Facsimile: (07) 3839 1022 September 2008 07029 Report Rev 0 © Economic Associates Pty Ltd
Northern Pipeline Interconnector – Economic Impact Assessment iii 30 September 2008 07029 Report Rev 0
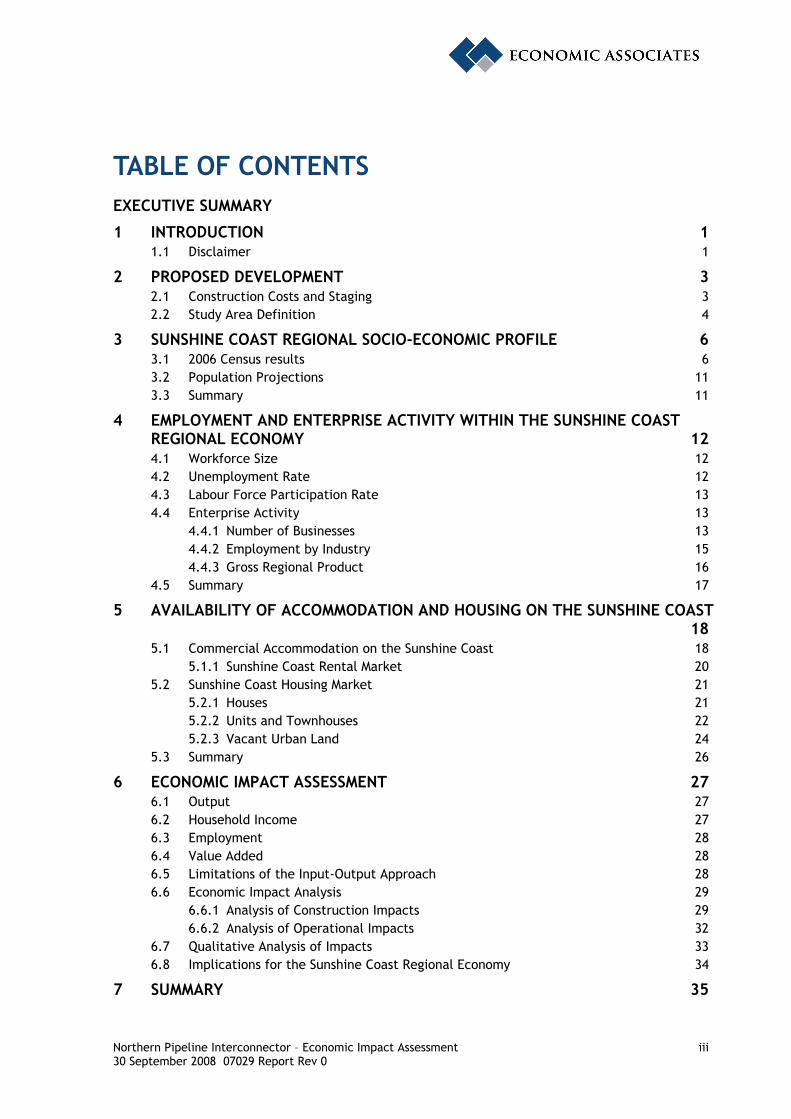
TABLE OF CONTENTS EXECUTIVE SUMMARY
1 INTRODUCTION 1 1.1 Disclaimer 1
2 PROPOSED DEVELOPMENT 3 2.1 Construction Costs and Staging 3 2.2 Study Area Definition 4
3 SUNSHINE COAST REGIONAL SOCIO-ECONOMIC PROFILE 6 3.1 2006 Census results 6 3.2 Population Projections 11 3.3 Summary 11
4 EMPLOYMENT AND ENTERPRISE ACTIVITY WITHIN THE SUNSHINE COAST REGIONAL ECONOMY 12 4.1 Workforce Size 12 4.2 Unemployment Rate 12 4.3 Labour Force Participation Rate 13 4.4 Enterprise Activity 13
4.4.1 Number of Businesses 13 4.4.2 Employment by Industry 15 4.4.3 Gross Regional Product 16
4.5 Summary 17
5 AVAILABILITY OF ACCOMMODATION AND HOUSING ON THE SUNSHINE COAST 18 5.1 Commercial Accommodation on the Sunshine Coast 18
5.1.1 Sunshine Coast Rental Market 20 5.2 Sunshine Coast Housing Market 21
5.2.1 Houses 21 5.2.2 Units and Townhouses 22 5.2.3 Vacant Urban Land 24
5.3 Summary 26
6 ECONOMIC IMPACT ASSESSMENT 27 6.1 Output 27 6.2 Household Income 27 6.3 Employment 28 6.4 Value Added 28 6.5 Limitations of the Input-Output Approach 28 6.6 Economic Impact Analysis 29
6.6.1 Analysis of Construction Impacts 29 6.6.2 Analysis of Operational Impacts 32
6.7 Qualitative Analysis of Impacts 33 6.8 Implications for the Sunshine Coast Regional Economy 34
7 SUMMARY 35
Northern Pipeline Interconnector – Economic Impact Assessment iv 30 September 2008 07029 Report Rev 0
8 REFERENCES 36
Northern Pipeline Interconnector – Economic Impact Assessment v 30 September 2008 07029 Report Rev 0
LIST OF TABLES & FIGURES Table E.1: NPI Project Costs incurred in 2008 and 2009 ($M) vii Table 2.1: NPI project costs likely to be incurred in 2008 ($M) 3 Table 2.2: NPI project costs likely to be incurred in 2009 ($M) 4 Figure 2.1: Map of Sunshine Coast 5 Table 3.1: Socio-Economic Profile, Sunshine Coast, SEQ and Queensland, 1996-2006 8 Table 3.2: Population Projections, Sunshine Coast, SEQ and Queensland, 2007-2026 11 Table 4.1: Labour Force Size, Y/E Mar 2002 to Y/E Mar 2008 12 Table 4.2: Unemployment Rate, Y/E Mar 2002 to Y/E Mar 2008 13 Table 4.3: Labour Force Participation Rate, 2001 to 2006 13 Table 4.4: Number of Businesses, Sunshine Coast, June 2007 14 Table 4.5: Number of Businesses, Sunshine Coast and Queensland, 2007 15 Table 4.6: Sunshine Coast estimated employment by industry, 2001-2005 (full time
equivalents) 16 Table 4.7: Sunshine Coast estimated gross regional product by industry, 2001-2005
(nominal terms) 17 Table 5.1: Summary of Tourism Establishments, Sunshine Coast, March Quarter 2008 18 Table 5.2: Occupancy Rate Trends, Sunshine Coast and Queensland, Mar Q 05 to Mar
Q 08 19 Table 5.3: Average Number of Vacancies per Night, Sunshine Coast, Mar Q 05 to Mar
Q 08 20 Table 5.4: Median Weekly Rents, Dec Q 2003 to Jun Q 2007 20 Figure 5.1: Volume of House Sales, Sunshine Coast, 1991 to 2007 21 Figure 5.2: Median Sale Price, Houses, 1991-2007 22 Figure 5.3: Volume of Unit and Townhouse Sales, Sunshine Coast, 1991 to 2007 23 Figure 5.4: Median Sale Price, Units and Townhouses, 1991-2007 24 Figure 5.5: Volume of Vacant Urban Land Sales, Sunshine Coast, 1991 to 2007 25 Figure 5.6: Median Sale Price, Vacant Urban Land, 1991-2007 26 Table 6.1: Project purchases by category and origin, 2008-2009 30 Table 6.2: Economic impact analysis of construction of Stage 2 of NPI, 2008-2009 31 Table 6.3: Economic impact analysis of operational and maintenance works
associated with Stage 2 of the NPI 33
Northern Pipeline Interconnector – Economic Impact Assessment vi 30 September 2008 07029 Report Rev 0
EXECUTIVE SUMMARY Introduction
The Southern Regional Water Pipeline Company trading as LinkWater (SRWPC) is proposing to construct the Northern Pipeline Interconnector, a potable water pipeline between the Sunshine Coast and Brisbane, as part of the Queensland Government’s water grid for South East Queensland (SEQ). The Northern Pipeline Interconnector (NPI) is to be constructed over two stages:
• Stage 1: a 46 kilometre potable water pipeline between Morayfield Reservoir in Caboolture Shire and the Landers Shute Water Treatment Plant Main Line in Maroochy Shire; and
• Stage 2: a 50 kilometre potable water pipeline between the Landers Shute Water Treatment Plant Main Line in Maroochy Shire and the Noosa Water Treatment Plant.
Stage 2 of the NPI is the subject of this economic impact assessment.
This report:
• Provides a socio-economic overview of the Sunshine Coast regional economy;
• Provides an assessment of the enterprise and employment activity across the Sunshine Coast;
• Assesses the availability of commercial accommodation and housing across the Sunshine Coast; and
• Assesses the indicative economic impacts generated by the construction and operation of the second stage of the NPI project.
Section 3.10 of the Terms of Reference for the NPI Stage 2 Environmental Impact Assessment requires the following economic issues to be addressed:
• A community profile that provides information on:
– Demography and family structure;
– Workforce characteristics, including types of skills or occupations and availability during both construction and operational stages; and
– Accommodation type, quantity and availability (as it relates to the need for accommodation of the project construction and operational workforce);
– Socio-demographic characteristics, including employment and unemployment rates;
• A description of the existing economic values that might be affected by the NPI project;
• Any impacts (positive or negative) on the local and regional housing construction sector with regard to the supply of dwellings for the construction workforce; and
• The direct and indirect impacts of the NPI project on the regional, state and national economies in terms of direct and indirect effects on employment, income and production.
Construction Costs and Staging
Construction of Stage 2 of the NPI will occur over two years, commencing in 2008. The total cost of the project is estimated at $400 million, comprising $310 million in 2008 and $90 million
Northern Pipeline Interconnector – Economic Impact Assessment vii 30 September 2008 07029 Report Rev 0
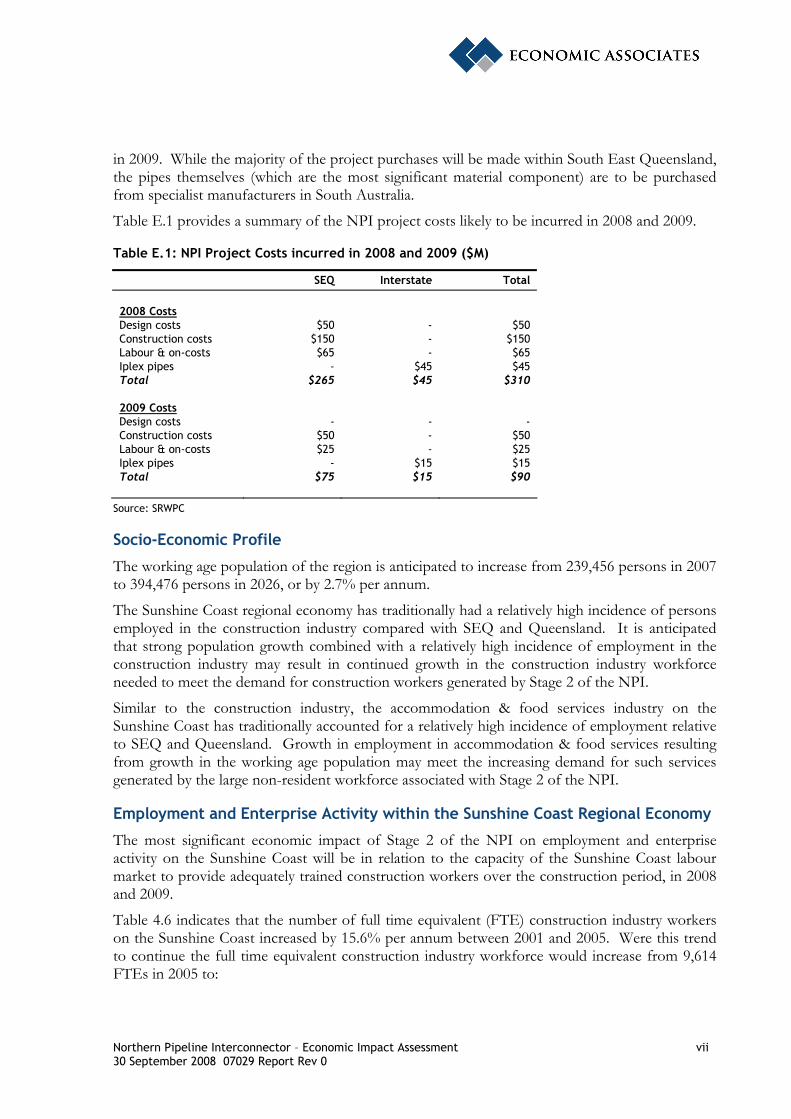
in 2009. While the majority of the project purchases will be made within South East Queensland, the pipes themselves (which are the most significant material component) are to be purchased from specialist manufacturers in South Australia.
Table E.1 provides a summary of the NPI project costs likely to be incurred in 2008 and 2009.
Table E.1: NPI Project Costs incurred in 2008 and 2009 ($M)
SEQ Interstate Total 2008 Costs Design costs $50 - $50 Construction costs $150 - $150 Labour & on-costs $65 - $65 Iplex pipes - $45 $45 Total $265 $45 $310 2009 Costs Design costs - - - Construction costs $50 - $50 Labour & on-costs $25 - $25 Iplex pipes - $15 $15 Total $75 $15 $90
Source: SRWPC
Socio-Economic Profile
The working age population of the region is anticipated to increase from 239,456 persons in 2007 to 394,476 persons in 2026, or by 2.7% per annum.
The Sunshine Coast regional economy has traditionally had a relatively high incidence of persons employed in the construction industry compared with SEQ and Queensland. It is anticipated that strong population growth combined with a relatively high incidence of employment in the construction industry may result in continued growth in the construction industry workforce needed to meet the demand for construction workers generated by Stage 2 of the NPI.
Similar to the construction industry, the accommodation & food services industry on the Sunshine Coast has traditionally accounted for a relatively high incidence of employment relative to SEQ and Queensland. Growth in employment in accommodation & food services resulting from growth in the working age population may meet the increasing demand for such services generated by the large non-resident workforce associated with Stage 2 of the NPI.
Employment and Enterprise Activity within the Sunshine Coast Regional Economy
The most significant economic impact of Stage 2 of the NPI on employment and enterprise activity on the Sunshine Coast will be in relation to the capacity of the Sunshine Coast labour market to provide adequately trained construction workers over the construction period, in 2008 and 2009.
Table 4.6 indicates that the number of full time equivalent (FTE) construction industry workers on the Sunshine Coast increased by 15.6% per annum between 2001 and 2005. Were this trend to continue the full time equivalent construction industry workforce would increase from 9,614 FTEs in 2005 to:
Northern Pipeline Interconnector – Economic Impact Assessment viii 30 September 2008 07029 Report Rev 0
• 14,850 FTEs in 2008; and
• 17,080 FTEs in 2009.
Were the number of full time equivalent construction industry workers only to grow at the same rate as that projected for working age population between 2007 and 2011 (i.e. 3.1% per annum), the full time equivalent construction industry workforce would increase from 9,614 FTEs in 2005 to:
• 10,540 FTEs in 2008; and
• 10,860 FTEs in 2009.
In either case, the full time equivalent construction industry workforce is likely to increase in size sufficient to provide the required number of locally sourced construction workers for Stage 2 of the NPI.
Availability of Accommodation and Housing on the Sunshine Coast
An analysis of the commercial accommodation permanently available for letting on the Sunshine Coast throughout the year indicates that over the last three years the average number of vacant rooms / beds per night has ranged from between:
• 2,018-3,039 hotel / motel rooms and serviced apartments;
• 1,010-1,805 caravan sites;
• 1,285-2,128 holiday flats, units and houses; and
• 178-357 hostel beds.
Based on the vacancies described above it is likely that the Sunshine Coast commercial accommodation market has the capacity to accommodate the NPI’s non-resident workforce.
Construction Impacts of NPI Stage 2
In 2008, the economic impact of stimulus associated with the construction of Stage 2 of the NPI project on the SEQ regional economy is anticipated to be approximately:
• $383.2 million in additional expenditure, including $183.2 million in indirect expenditure;
• $78.7 million in additional household income, including approximately $34.2 million of indirect income;
• 1,486 full time equivalent positions, including 809 indirect full time equivalent positions; and
• $134.7 million in value added, including $76.9 million in indirect value added.
Interstate purchases of Iplex pipe from South Australia are anticipated to have the following approximate economic impacts outside of the SEQ and Queensland economies:
• $72.1 million in additional expenditure, including $27.1 million in indirect expenditure;
• $13.1 million in additional household income, including approximately $6.9 million of indirect income;
• 180 full time equivalent positions, including 92 indirect full time equivalent positions; and
• $22.1 million in value added, including $10.4 million in indirect value added.
Northern Pipeline Interconnector – Economic Impact Assessment ix 30 September 2008 07029 Report Rev 0
In 2009, the economic impact of stimulus associated with the construction of Stage 2 of the NPI project on the SEQ regional economy is anticipated to be approximately:
• $99.3 million in additional expenditure, including $49.3 million in indirect expenditure;
• $16.9 million in additional household income, including approximately $11.5 million of indirect income;
• 358 full time equivalent positions, including 218 indirect full time equivalent positions; and
• $31.8 million in value added, including $20.2 million in indirect value added.
Interstate purchases of Iplex pipe from South Australia are anticipated to have the following approximate economic impacts outside of the SEQ and Queensland economies:
• $24.0 million in additional expenditure, including $9.0 million in indirect expenditure;
• $4.4 million in additional household income, including approximately $2.3 million of indirect income;
• 60 full time equivalent positions, including 31 indirect full time equivalent positions; and
• $7.4 million in value added, including $3.9 million in indirect value added.
Operational Impacts of NPI Stage 2
The stimulus created by the operation and maintenance pertains to ‘water pipeline transport’. Impacts will be contained within the SEQ region. Input-output analysis estimates that ongoing annual economic impacts of the operation and maintenance of Stage 2 of the NPI would be approximately:
• $10.8 million in additional expenditure, including $3.2 million in indirect expenditure;
• $2.3 million in additional household income, including approximately $0,8 million of indirect income;
• 38 full time equivalent positions, including 13 indirect full time equivalent positions; and
• $6.0 million in value added, including $1.4 million in indirect value added.
Implications for the Sunshine Coast Regional Economy
Based on construction costs of $150 million in 2008 and an average weekly shift of 55 hours for SRWPC construction workers, approximately 365 workers would be required for the project during the first year of construction. SRWPC indicates that approximately two thirds of the construction workforce (approximately 245 workers) would be sourced from outside the Sunshine Coast region, suggesting approximately 120 workers would need to be sourced from the Sunshine Coast.
While it is unlikely that unemployed persons would gain employment directly related to Stage 2 of the NPI, the movement of currently employed persons from their current industry of employment to the construction industry to pursue opportunities created by Stage 2 of the NPI would create lower skilled opportunities for those persons currently unemployed.
It is anticipated that over time much of the employment impact is likely to be absorbed by the labour market in this way, rather than through the creation of new employment opportunities. It is anticipated that new employment opportunities would be created ‘at the margin’. For example,
Northern Pipeline Interconnector – Economic Impact Assessment x 30 September 2008 07029 Report Rev 0
the project may increase the work program of small contractors such that it generates the need for an additional worker to be employed by each small contractor.
Alternatively, it is possible that Stage 2 of the NPI may represent one of many projects already anticipated by business / contractors and as such may not create significant additional employment (in other words, that business / contractors have already geared up in anticipation of the NPI and other large projects in the region).
Vacancy rates at accommodation establishments on the Sunshine Coast indicate the region’s accommodation market has the capacity to accommodate the NPI’s non-resident workforce. However, a number of other major infrastructure projects planned for the region, including the Traveston Crossing Dam, upgrades to the Bruce Highway and Stage 1 of the NPI, are likely to put pressure on the Sunshine Coast and northern SEQ labour and accommodation markets.
The impact of the operation and maintenance of Stage 2 of the NPI is unlikely to be significant in the context of the Sunshine Coast regional economy. The SRWPC advise that workers associated with the operation and maintenance of Stage 2 of the NPI will be part of a larger water grid workforce, which will be responsible for maintaining all of SEQ’s water pipelines. Work crews are likely to rotate throughout SEQ to provide operational and maintenance support to various pipelines throughout the region.
At this stage it is unclear how many water grid workers will be based on the Sunshine Coast. However, it is unlikely that the number of workers located on the Sunshine Coast would be significant.
Summary
Construction of stage 2 of the NPI is likely to represent a major economic stimulus or ‘shock’ to the Sunshine Coast regional economy in 2008 and 2009. The project is expected to stimulate significant economic activity across SEQ, some of which would to occur on the Sunshine Coast.
Traditionally, construction works associated with large infrastructure projects are seen as generating major benefits for local communities in terms of increased employment and expenditure within the region. However, the Sunshine Coast, and Queensland more broadly, is experiencing a high level of labour force participation and employment. Given the scale of the proposed project and the generally strong economic conditions experienced on the Sunshine Coast, there may be some concern as to whether capacity constraints in terms of the availability of a skilled workforce may hamper project delivery or that the subject project may ‘crowd out’ other projects in the development pipeline on the Sunshine Coast (or SEQ more generally).
An analysis of the prevailing regional economic conditions of the Sunshine Coast and SEQ and economic impact analysis of the construction of Stage 2 of the NPI indicate that Stage 2 of the NPI would not in itself ‘stretch’ the Sunshine Coast and SEQ construction industry. However, the confluence of a number of major projects on the Sunshine Coast and in northern SEQ may put pressure on the regional labour and commercial accommodation markets.
Northern Pipeline Interconnector – Economic Impact Assessment 1 30 September 2008 07029 Report Rev 0
1 INTRODUCTION The Southern Regional Water Pipeline Company trading as LinkWater (SRWPC) is proposing to construct the Northern Pipeline Interconnector, a potable water pipeline between the Sunshine Coast and Brisbane, as part of the Queensland Government’s water grid in South East Queensland (SEQ). The Northern Pipeline Interconnector (NPI) is to be constructed over two stages:
• Stage 1: a 46 kilometre potable water pipeline between Morayfield Reservoir in Caboolture Shire and the Landers Shute Water Treatment Plant Main Line in Maroochy Shire; and
• Stage 2: a 50 kilometre potable water pipeline between the Landers Shute Water Treatment Plant Main Line in Maroochy Shire and the Noosa Water Treatment Plant.
Stage 2 of the NPI is the subject of this economic impact assessment.
This report:
• Provides a socio-economic overview of the Sunshine Coast regional economy;
• Provides an assessment of the enterprise and employment activity across the Sunshine Coast;
• Assesses of the availability of commercial accommodation and housing across the Sunshine Coast; and
• Assesses the indicative economic impacts generated by the construction and operation of the second stage of the NPI project.
Section 3.10 of the Terms of Reference for the NPI Stage 2 Environmental Impact Assessment require the following economic issues to be addressed:
• A community profile that provides information on:
– Demography and family structure;
– Workforce characteristics, including types of skills or occupations and availability during both construction and operational stages; and
– Accommodation type, quantity and availability (as it relates to the need for accommodation of the project construction and operational workforce);
– Socio-demographic characteristics, including employment and unemployment rates
• A description of the existing economic values that might be affected by the NPI project;
• Any impacts (positive or negative) on the local and regional housing construction sector with regard to the supply of dwellings for the construction workforce; and
• The direct and indirect impacts of the NPI project on the regional, state and national economies in terms of direct and indirect effects on employment, income and production.
1.1 Disclaimer While all care and diligence has been taken in preparing this report, Economic Associates Pty Ltd does not warrant the accuracy of the information contained within and accepts no liability for any loss or damage that may be suffered as a result of reliance on this information, whether or not

Northern Pipeline Interconnector – Economic Impact Assessment 2 30 September 2008 07029 Report Rev 0
there has been any, error, omission or negligence on the part of Economic Associates Pty Ltd or its employees. Any forecasts or projections used in the analysis can be affected by unforeseen events, and as such no warranty is given that a particular set of results will in fact be achieved.
Northern Pipeline Interconnector – Economic Impact Assessment 3 30 September 2008 07029 Report Rev 0
2 PROPOSED DEVELOPMENT The Northern Pipeline Interconnector (NPI) is a proposed potable water pipeline that will connect the Sunshine Coast and Brisbane potable water reticulation systems, which is anticipated to be completed in 2009. The pipeline will be constructed by the Southern Regional Water Pipeline Company (SRWPC) and will have the capacity to carry up to 65 million litres of water per day.
Initially, the NPI will carry water in a southerly direction from the Sunshine Coast to Brisbane. However, it is proposed that the NPI will have reverse flow capacity, meaning it will be able to carry water in both directions, north and south.
In total, the NPI will be approximately 96 kilometres long connecting the Morayfield Reservoir in Caboolture Shire to the Noosa Water Treatment Plant. The NPI is to be constructed over two stages:
• Stage 1: a 46 kilometre potable water pipeline between Morayfield Reservoir in Caboolture Shire and the Landers Shute Water Treatment Plant Main Line in Maroochy Shire; and
• Stage 2: a 50 kilometre potable water pipeline between the Landers Shute Water Treatment Plant Main Line in Maroochy Shire and the Noosa Water Treatment Plant.
Stage 2 of the NPI is the subject of this economic impact assessment.
2.1 Construction Costs and Staging Construction of Stage 2 of the NPI will occur over two years, commencing in 2008. The SRWPC have advised that the total construction cost of the project is anticipated to be approximately $400 million. While the majority of the project purchases will be made within South East Queensland (SEQ), the pipes themselves are to be purchased from specialist manufacturers in South Australia. Interstate purchases are anticipated to account for approximately 15% of project outlays.
In 2008, approximately $310 million (or 77.5%) of the estimated $400 million in project costs is anticipated to be expended. Approximately 85.5% of the 2008 project expenditure will relate to purchases from within SEQ. The only substantive interstate purchase resulting from the project relates to the Iplex pipes manufactured in South Australia ($45 million).
Table 2.1: NPI project costs likely to be incurred in 2008 ($M)
SEQ Interstate Total Design costs $50 - $50 Construction costs $150 - $150 Labour & on-costs $65 - $65 Iplex pipes - $45 $45 Total $265 $45 $310
Source: SRWPC
Northern Pipeline Interconnector – Economic Impact Assessment 4 30 September 2008 07029 Report Rev 0
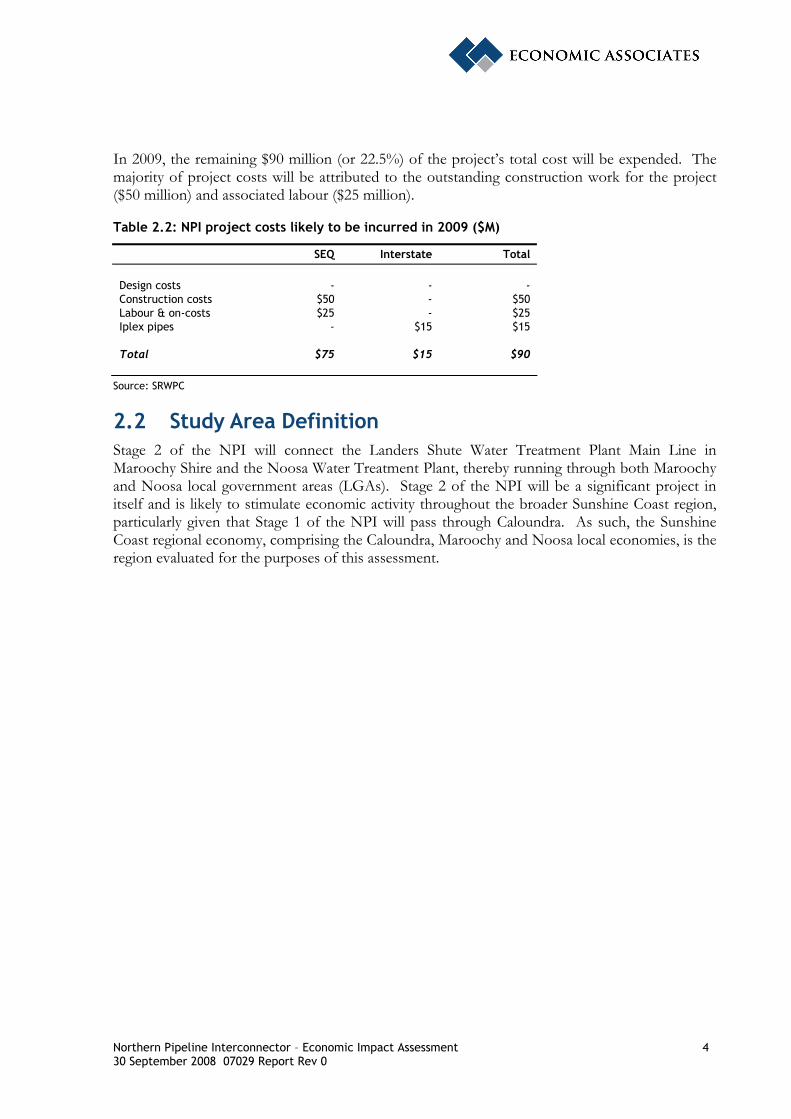
In 2009, the remaining $90 million (or 22.5%) of the project’s total cost will be expended. The majority of project costs will be attributed to the outstanding construction work for the project ($50 million) and associated labour ($25 million).
Table 2.2: NPI project costs likely to be incurred in 2009 ($M)
SEQ Interstate Total Design costs - - - Construction costs $50 - $50 Labour & on-costs $25 - $25 Iplex pipes - $15 $15 Total $75 $15 $90
Source: SRWPC
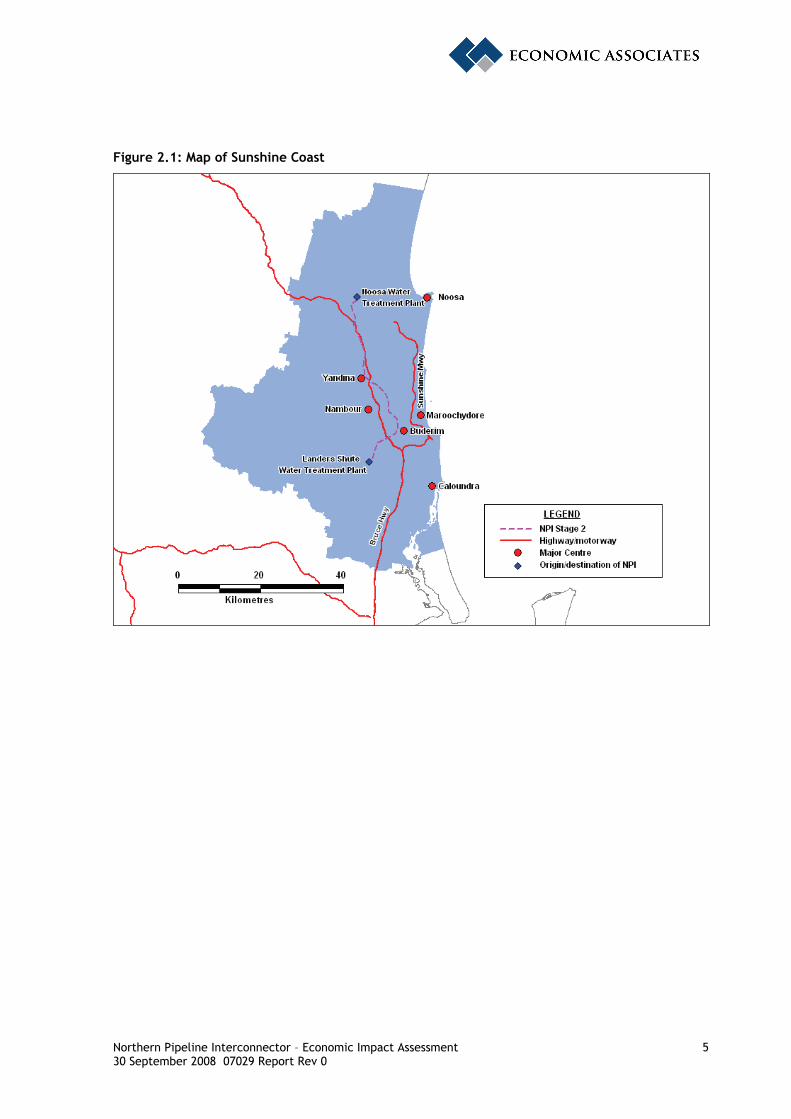
2.2 Study Area Definition Stage 2 of the NPI will connect the Landers Shute Water Treatment Plant Main Line in Maroochy Shire and the Noosa Water Treatment Plant, thereby running through both Maroochy and Noosa local government areas (LGAs). Stage 2 of the NPI will be a significant project in itself and is likely to stimulate economic activity throughout the broader Sunshine Coast region, particularly given that Stage 1 of the NPI will pass through Caloundra. As such, the Sunshine Coast regional economy, comprising the Caloundra, Maroochy and Noosa local economies, is the region evaluated for the purposes of this assessment.
Northern Pipeline Interconnector – Economic Impact Assessment 5 30 September 2008 07029 Report Rev 0
Figure 2.1: Map of Sunshine Coast
Northern Pipeline Interconnector – Economic Impact Assessment 6 30 September 2008 07029 Report Rev 0
3 SUNSHINE COAST REGIONAL SOCIO-ECONOMIC PROFILE
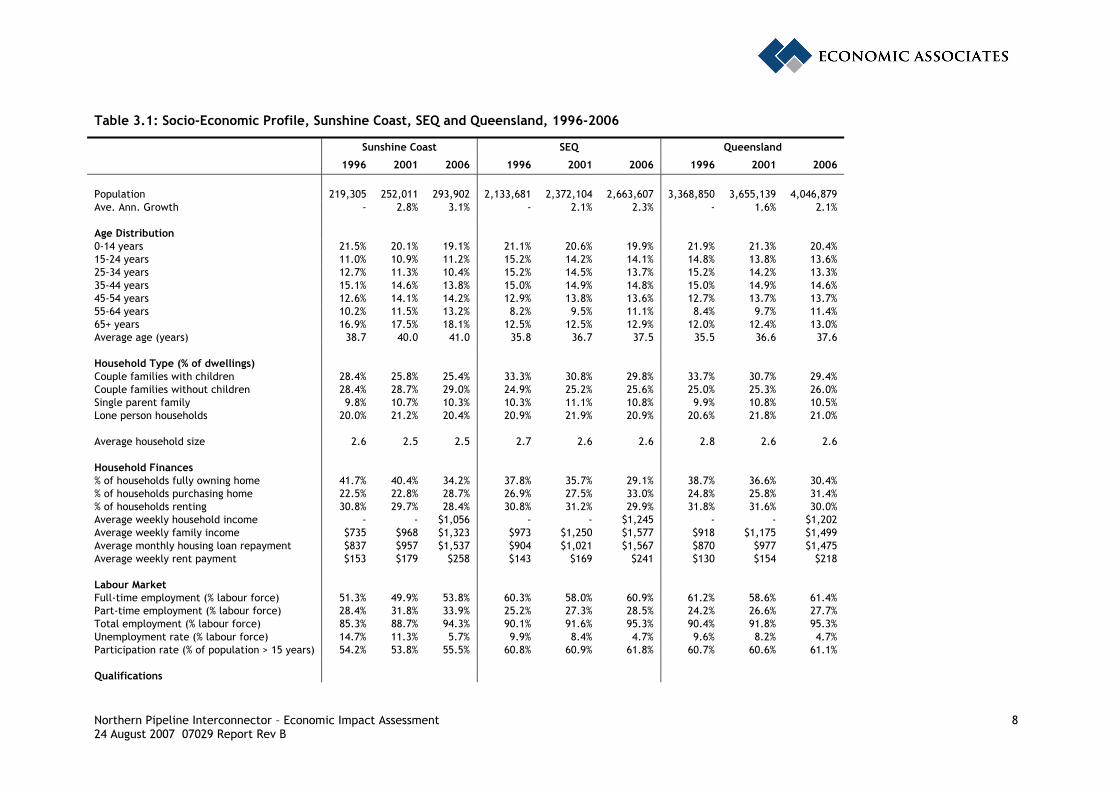
3.1 2006 Census results A socio-economic profile of the Sunshine Coast benchmarked against SEQ and Queensland as at the 1996, 2001 and 2006 Census of Population and Housing is provided in Table 3.1. A number of key points can be drawn from this profile, these being:
• In 2006, there were 293,902 persons living on the Sunshine Coast accounting for approximately 11.0% of the SEQ population. In the 2001 to 2006 period the population of the Sunshine Coast increased at an average annual growth rate of 3.1% per annum, above the growth rates of both SEQ (2.3%) and Queensland (2.1%);
• At the time of the 2006 Census, the Sunshine Coast (18.1%) recorded a significantly higher incidence of persons aged 65 years than SEQ (12.9%) and Queensland (13.0%). In all regions the proportion of persons aged 0 to 14 years decreased in the 1996 to 2006 period with the Sunshine Coast recording the largest decrease (2.4% points);
• The average age of residents in 2006 was significantly higher in the Sunshine Coast (41.0 years) than SEQ (37.5 years) and Queensland (37.6 years). The average age of residents on the Sunshine Coast has been consistently higher than the SEQ and Queensland in the 1996 to 2006 period;
• In 2006, the Sunshine Coast (29.0%) recorded a significantly higher proportion of couple families without children than SEQ (25.6%) and Queensland (26.0%). In all regions the incidence of single parent households was highest in 2001;
• The average household size in 2006 was marginally lower on the Sunshine Coast (2.5 persons) than in SEQ (2.6 persons) and Queensland (2.6 persons). In all regions, the average household size decreased by 0.1 persons between 1996 and 2006;
• On the Sunshine Coast the proportion of households fully owning their home decreased from 41.7% in 1996 to 34.2% in 2006, consistent with the trend in SEQ and Queensland. The decrease in the incidence of households fully owning their home from 1996 to 2006 was lower on the Sunshine Coast (7.5% points) than SEQ (8.7% points) and Queensland (8.3% points). The incidence of households renting also decreased in the 1996 to 2006 period in all regions;
• At the time of the 2006 Census, average weekly household income was significantly lower on the Sunshine Coast ($1,056) relative to SEQ ($1,245) and Queensland ($1,202). Average monthly housing loan repayments were higher on the Sunshine Coast ($1,537) than Queensland ($1,475) but lower than SEQ ($1,567). Average weekly rent payments in 2006 were higher on the Sunshine Coast ($258) than in SEQ ($241) and Queensland ($218);
• In 2006, the proportion of persons employed full time was relatively low on the Sunshine Coast (53.8%) compared with SEQ (60.9%) and Queensland (61.4%). The unemployment rate declined in all regions in the 1996 to 2006 period, with the Sunshine Coast recording the most significant decline (down from 14.7% in 1996 to 5.7% in 2006);
• At the time of the 2006 Census, the incidence of persons with a post school qualification on the Sunshine Coast (39.4%) was similar to SEQ (39.6%) and higher than Queensland (37.5%).
Northern Pipeline Interconnector – Economic Impact Assessment 7 30 September 2008 07029 Report Rev 0
The proportion of persons with a post school qualification increased in all regions between 1996 and 2006;
• In 2006, the Sunshine Coast (16.6%) recorded a higher incidence of persons employed in upper blue collar occupations than SEQ (14.8%) and Queensland (15.3%). In the 2001 to 2006 period there was a decrease in the proportion of persons employed in lower white and blue collar professions and an increase in the proportion of persons employed in upper white and blue collar professions on the Sunshine Coast; and
• In 2006, employment by industry on the Sunshine Coast was concentrated in retail trade (13.9%), construction (12.5%) and health care & social assistance (11.1%). The Sunshine Coast (9.1%) recorded a significantly higher incidence of persons employed in the accommodation & food services industry than SEQ (6.9%) and Queensland (7.0%).
Northern Pipeline Interconnector – Economic Impact Assessment 8 24 August 2007 07029 Report Rev B
Table 3.1: Socio-Economic Profile, Sunshine Coast, SEQ and Queensland, 1996-2006
Sunshine Coast SEQ Queensland
1996 2001 2006 1996 2001 2006 1996 2001 2006 Population 219,305 252,011 293,902 2,133,681 2,372,104 2,663,607 3,368,850 3,655,139 4,046,879 Ave. Ann. Growth - 2.8% 3.1% - 2.1% 2.3% - 1.6% 2.1% Age Distribution 0-14 years 21.5% 20.1% 19.1% 21.1% 20.6% 19.9% 21.9% 21.3% 20.4% 15-24 years 11.0% 10.9% 11.2% 15.2% 14.2% 14.1% 14.8% 13.8% 13.6% 25-34 years 12.7% 11.3% 10.4% 15.2% 14.5% 13.7% 15.2% 14.2% 13.3% 35-44 years 15.1% 14.6% 13.8% 15.0% 14.9% 14.8% 15.0% 14.9% 14.6% 45-54 years 12.6% 14.1% 14.2% 12.9% 13.8% 13.6% 12.7% 13.7% 13.7% 55-64 years 10.2% 11.5% 13.2% 8.2% 9.5% 11.1% 8.4% 9.7% 11.4% 65+ years 16.9% 17.5% 18.1% 12.5% 12.5% 12.9% 12.0% 12.4% 13.0% Average age (years) 38.7 40.0 41.0 35.8 36.7 37.5 35.5 36.6 37.6 Household Type (% of dwellings) Couple families with children 28.4% 25.8% 25.4% 33.3% 30.8% 29.8% 33.7% 30.7% 29.4% Couple families without children 28.4% 28.7% 29.0% 24.9% 25.2% 25.6% 25.0% 25.3% 26.0% Single parent family 9.8% 10.7% 10.3% 10.3% 11.1% 10.8% 9.9% 10.8% 10.5% Lone person households 20.0% 21.2% 20.4% 20.9% 21.9% 20.9% 20.6% 21.8% 21.0% Average household size 2.6 2.5 2.5 2.7 2.6 2.6 2.8 2.6 2.6 Household Finances % of households fully owning home 41.7% 40.4% 34.2% 37.8% 35.7% 29.1% 38.7% 36.6% 30.4% % of households purchasing home 22.5% 22.8% 28.7% 26.9% 27.5% 33.0% 24.8% 25.8% 31.4% % of households renting 30.8% 29.7% 28.4% 30.8% 31.2% 29.9% 31.8% 31.6% 30.0% Average weekly household income - - $1,056 - - $1,245 - - $1,202 Average weekly family income $735 $968 $1,323 $973 $1,250 $1,577 $918 $1,175 $1,499 Average monthly housing loan repayment $837 $957 $1,537 $904 $1,021 $1,567 $870 $977 $1,475 Average weekly rent payment $153 $179 $258 $143 $169 $241 $130 $154 $218 Labour Market Full-time employment (% labour force) 51.3% 49.9% 53.8% 60.3% 58.0% 60.9% 61.2% 58.6% 61.4% Part-time employment (% labour force) 28.4% 31.8% 33.9% 25.2% 27.3% 28.5% 24.2% 26.6% 27.7% Total employment (% labour force) 85.3% 88.7% 94.3% 90.1% 91.6% 95.3% 90.4% 91.8% 95.3% Unemployment rate (% labour force) 14.7% 11.3% 5.7% 9.9% 8.4% 4.7% 9.6% 8.2% 4.7% Participation rate (% of population > 15 years) 54.2% 53.8% 55.5% 60.8% 60.9% 61.8% 60.7% 60.6% 61.1% Qualifications
Northern Pipeline Interconnector – Economic Impact Assessment 9 24 August 2007 07029 Report Rev B
Sunshine Coast SEQ Queensland
1996 2001 2006 1996 2001 2006 1996 2001 2006 % of persons with a non-school qualification 28.3% 33.6% 39.4% 29.1% 34.2% 39.6% 27.6% 32.3% 37.5% % of persons with Bachelor or higher 6.9% 9.2% 11.6% 9.8% 12.3% 15.0% 8.6% 10.8% 13.1% % of persons with Diploma 6.0% 6.4% 7.9% 5.8% 6.0% 7.3% 5.4% 5.5% 6.6% % of persons with Certificate 15.4% 18.1% 19.9% 13.6% 15.8% 17.3% 13.6% 16.0% 17.8% Occupation Upper White Collar Managers 15.2% 13.5% 13.0% 12.0% 11.6% 11.8% 13.3% 12.9% 12.4% Professionals 14.0% 15.4% 16.3% 16.7% 18.0% 18.9% 15.3% 16.4% 17.2% Subtotal 29.3% 29.0% 29.3% 28.7% 29.6% 30.8% 28.6% 29.3% 29.6% Lower White Collar Community & Personal Service Workers 8.1% 9.4% 9.6% 8.2% 8.9% 9.1% 8.1% 8.9% 9.1% Clerical and Admin Workers 13.9% 13.7% 13.4% 16.8% 16.5% 15.9% 15.3% 15.0% 14.8% Sales Workers 12.0% 12.8% 12.3% 11.0% 11.5% 10.9% 10.2% 10.7% 10.3% Subtotal 34.0% 36.0% 35.3% 36.0% 36.9% 35.8% 33.6% 34.7% 34.2% Upper Blue Collar Technicians & Trades Workers 16.3% 15.7% 16.6% 15.4% 14.5% 14.8% 15.6% 14.7% 15.3% Subtotal 16.3% 15.7% 16.6% 15.4% 14.5% 14.8% 15.6% 14.7% 15.3% Lower Blue Collar Machinery Operators & Drivers 6.5% 5.8% 5.1% 7.5% 6.9% 6.2% 8.3% 7.8% 7.2% Labourers 11.5% 11.6% 12.0% 10.0% 10.1% 10.7% 11.4% 11.5% 11.9% Subtotal 18.0% 17.4% 17.0% 17.5% 17.1% 16.9% 19.7% 19.3% 19.1% Employment by Industry (% of employees) Agriculture, forestry & fishing 4.9% 4.0% 2.7% 1.9% 1.7% 1.2% 5.2% 4.9% 3.4% Mining 0.4% 0.3% 0.4% 0.4% 0.4% 0.5% 1.6% 1.2% 1.7% Manufacturing 8.3% 8.6% 7.3% 10.9% 11.3% 10.4% 10.1% 10.5% 9.9% Electricity, gas, water & waste services 0.7% 0.7% 0.6% 0.7% 0.9% 0.9% 0.9% 1.0% 1.0% Construction 10.2% 9.5% 12.5% 7.3% 7.1% 9.1% 7.0% 6.9% 9.0% Wholesale trade 4.4% 3.9% 3.3% 5.8% 5.0% 4.3% 5.3% 4.9% 3.9% Retail trade 12.9% 13.8% 13.9% 10.9% 11.8% 11.9% 10.6% 11.5% 11.6% Accommodation & food services 9.7% 10.1% 9.1% 7.0% 7.3% 6.9% 7.2% 7.4% 7.0% Transport, postal & warehousing 3.4% 3.6% 3.5% 4.9% 5.0% 5.0% 5.1% 5.2% 5.1% Information media & telecommunications 2.3% 1.7% 1.4% 2.4% 2.2% 1.7% 2.1% 1.9% 1.4% Financial & insurance services 2.8% 2.5% 2.7% 3.5% 3.4% 3.4% 3.0% 2.8% 2.9% Rental, hiring & real estate services 3.1% 2.8% 2.9% 2.2% 2.2% 2.3% 2.0% 2.0% 2.1% Professional, scientific & technical services 4.8% 4.8% 5.1% 6.6% 6.5% 6.7% 5.5% 5.4% 5.6%
Northern Pipeline Interconnector – Economic Impact Assessment 10 24 August 2007 07029 Report Rev B
Sunshine Coast SEQ Queensland
1996 2001 2006 1996 2001 2006 1996 2001 2006 Administrative & support services 2.8% 3.4% 3.2% 3.0% 3.5% 3.3% 2.7% 3.2% 3.0% Public administration & safety 3.8% 3.9% 4.6% 6.1% 5.8% 6.3% 6.3% 6.2% 6.7% Education & training 6.9% 7.9% 7.5% 7.4% 7.9% 7.6% 7.5% 8.0% 7.6% Health care & social assistance 9.5% 10.2% 11.1% 9.5% 9.8% 10.5% 9.2% 9.5% 10.2% Arts & recreation services 1.4% 1.5% 1.5% 1.7% 1.7% 1.6% 1.5% 1.5% 1.4% Other services 4.5% 4.2% 4.0% 4.6% 4.2% 3.8% 4.3% 4.0% 3.7%
Source: Australian Bureau of Statistics (2007)
Northern Pipeline Interconnector – Economic Impact Assessment 11 12 October 2007 07029 Report Rev C
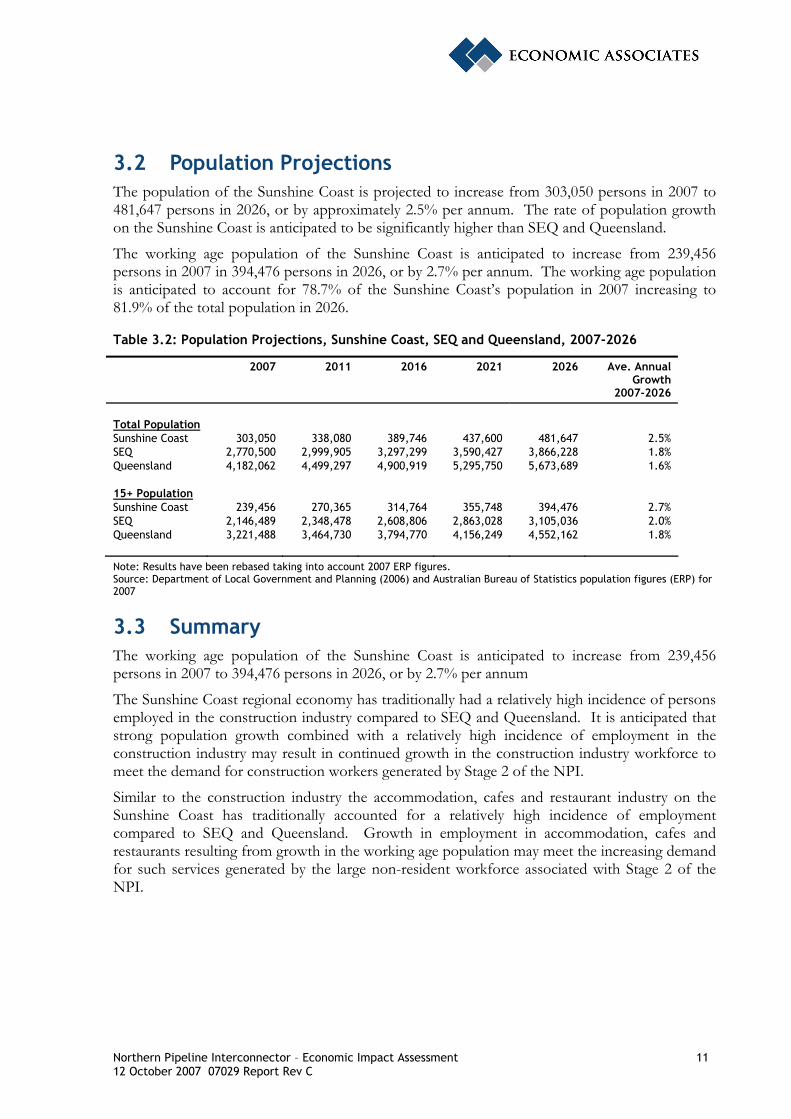
3.2 Population Projections The population of the Sunshine Coast is projected to increase from 303,050 persons in 2007 to 481,647 persons in 2026, or by approximately 2.5% per annum. The rate of population growth on the Sunshine Coast is anticipated to be significantly higher than SEQ and Queensland.
The working age population of the Sunshine Coast is anticipated to increase from 239,456 persons in 2007 in 394,476 persons in 2026, or by 2.7% per annum. The working age population is anticipated to account for 78.7% of the Sunshine Coast’s population in 2007 increasing to 81.9% of the total population in 2026.
Table 3.2: Population Projections, Sunshine Coast, SEQ and Queensland, 2007-2026
2007 2011 2016 2021 2026 Ave. Annual Growth
2007-2026
Total Population Sunshine Coast 303,050 338,080 389,746 437,600 481,647 2.5% SEQ 2,770,500 2,999,905 3,297,299 3,590,427 3,866,228 1.8% Queensland 4,182,062 4,499,297 4,900,919 5,295,750 5,673,689 1.6% 15+ Population Sunshine Coast 239,456 270,365 314,764 355,748 394,476 2.7% SEQ 2,146,489 2,348,478 2,608,806 2,863,028 3,105,036 2.0% Queensland 3,221,488 3,464,730 3,794,770 4,156,249 4,552,162 1.8%
Note: Results have been rebased taking into account 2007 ERP figures. Source: Department of Local Government and Planning (2006) and Australian Bureau of Statistics population figures (ERP) for 2007
3.3 Summary The working age population of the Sunshine Coast is anticipated to increase from 239,456 persons in 2007 to 394,476 persons in 2026, or by 2.7% per annum
The Sunshine Coast regional economy has traditionally had a relatively high incidence of persons employed in the construction industry compared to SEQ and Queensland. It is anticipated that strong population growth combined with a relatively high incidence of employment in the construction industry may result in continued growth in the construction industry workforce to meet the demand for construction workers generated by Stage 2 of the NPI.
Similar to the construction industry the accommodation, cafes and restaurant industry on the Sunshine Coast has traditionally accounted for a relatively high incidence of employment compared to SEQ and Queensland. Growth in employment in accommodation, cafes and restaurants resulting from growth in the working age population may meet the increasing demand for such services generated by the large non-resident workforce associated with Stage 2 of the NPI.
Northern Pipeline Interconnector – Economic Impact Assessment 12 12 October 2007 07029 Report Rev C
4 EMPLOYMENT AND ENTERPRISE ACTIVITY WITHIN THE SUNSHINE COAST REGIONAL ECONOMY
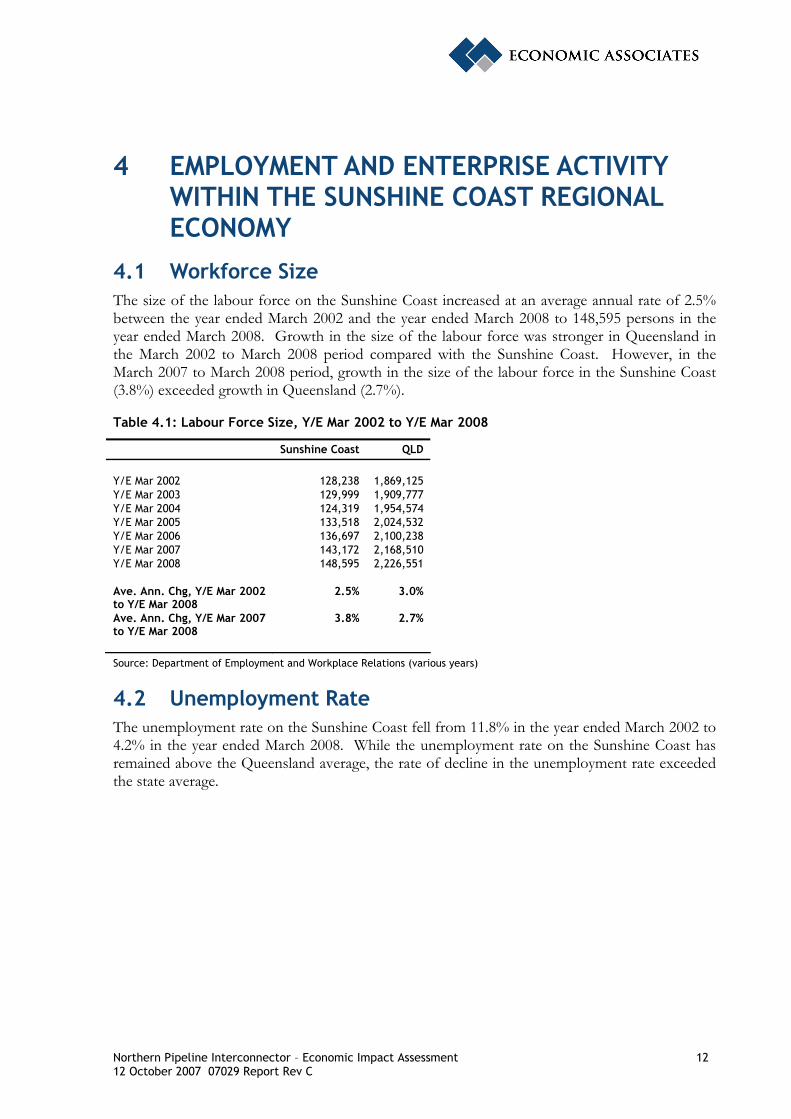
4.1 Workforce Size The size of the labour force on the Sunshine Coast increased at an average annual rate of 2.5% between the year ended March 2002 and the year ended March 2008 to 148,595 persons in the year ended March 2008. Growth in the size of the labour force was stronger in Queensland in the March 2002 to March 2008 period compared with the Sunshine Coast. However, in the March 2007 to March 2008 period, growth in the size of the labour force in the Sunshine Coast (3.8%) exceeded growth in Queensland (2.7%).
Table 4.1: Labour Force Size, Y/E Mar 2002 to Y/E Mar 2008
Sunshine Coast QLD
Y/E Mar 2002 128,238 1,869,125 Y/E Mar 2003 129,999 1,909,777 Y/E Mar 2004 124,319 1,954,574 Y/E Mar 2005 133,518 2,024,532 Y/E Mar 2006 136,697 2,100,238 Y/E Mar 2007 143,172 2,168,510 Y/E Mar 2008 148,595 2,226,551 Ave. Ann. Chg, Y/E Mar 2002 to Y/E Mar 2008
2.5% 3.0%
Ave. Ann. Chg, Y/E Mar 2007 to Y/E Mar 2008
3.8% 2.7%
Source: Department of Employment and Workplace Relations (various years)
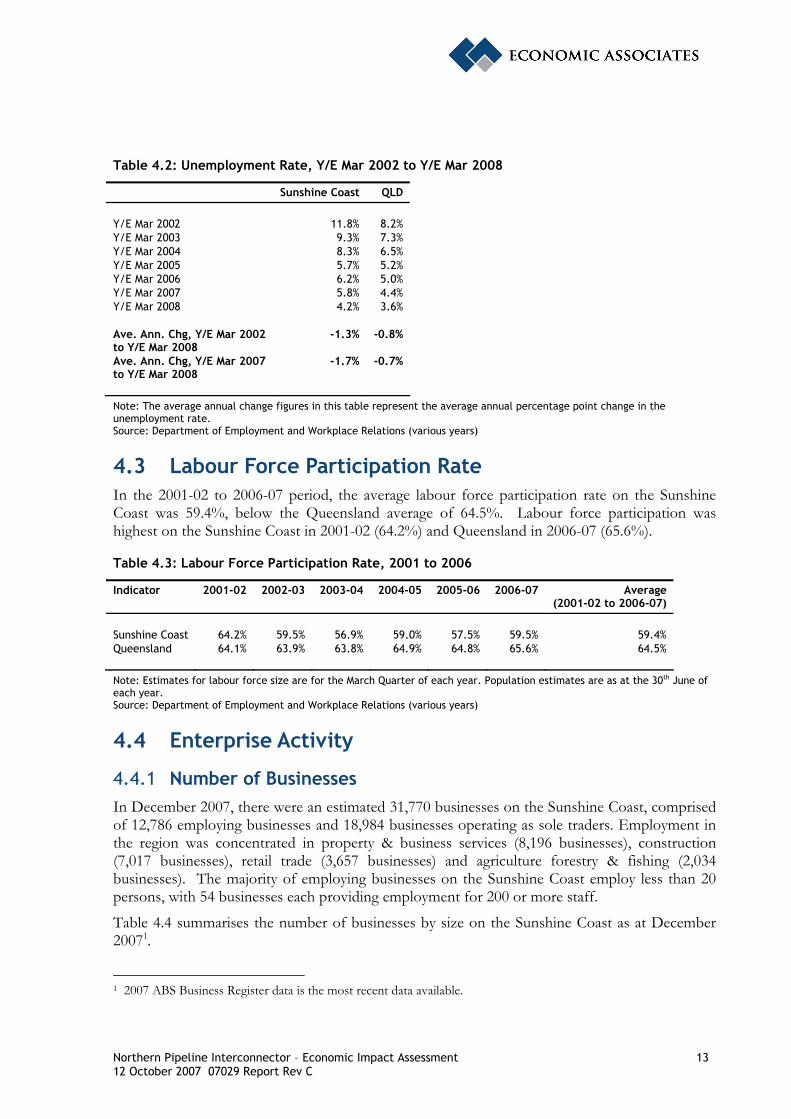
4.2 Unemployment Rate The unemployment rate on the Sunshine Coast fell from 11.8% in the year ended March 2002 to 4.2% in the year ended March 2008. While the unemployment rate on the Sunshine Coast has remained above the Queensland average, the rate of decline in the unemployment rate exceeded the state average.
Northern Pipeline Interconnector – Economic Impact Assessment 13 12 October 2007 07029 Report Rev C
Table 4.2: Unemployment Rate, Y/E Mar 2002 to Y/E Mar 2008
Sunshine Coast QLD
Y/E Mar 2002 11.8% 8.2% Y/E Mar 2003 9.3% 7.3% Y/E Mar 2004 8.3% 6.5% Y/E Mar 2005 5.7% 5.2% Y/E Mar 2006 6.2% 5.0% Y/E Mar 2007 5.8% 4.4% Y/E Mar 2008 4.2% 3.6% Ave. Ann. Chg, Y/E Mar 2002 to Y/E Mar 2008
-1.3% -0.8%
Ave. Ann. Chg, Y/E Mar 2007 to Y/E Mar 2008
-1.7% -0.7%
Note: The average annual change figures in this table represent the average annual percentage point change in the unemployment rate. Source: Department of Employment and Workplace Relations (various years)
4.3 Labour Force Participation Rate In the 2001-02 to 2006-07 period, the average labour force participation rate on the Sunshine Coast was 59.4%, below the Queensland average of 64.5%. Labour force participation was highest on the Sunshine Coast in 2001-02 (64.2%) and Queensland in 2006-07 (65.6%).
Table 4.3: Labour Force Participation Rate, 2001 to 2006
Indicator 2001-02 2002-03 2003-04 2004-05 2005-06 2006-07 Average (2001-02 to 2006-07)
Sunshine Coast 64.2% 59.5% 56.9% 59.0% 57.5% 59.5% 59.4% Queensland 64.1% 63.9% 63.8% 64.9% 64.8% 65.6% 64.5%
Note: Estimates for labour force size are for the March Quarter of each year. Population estimates are as at the 30th June of each year. Source: Department of Employment and Workplace Relations (various years)
4.4 Enterprise Activity
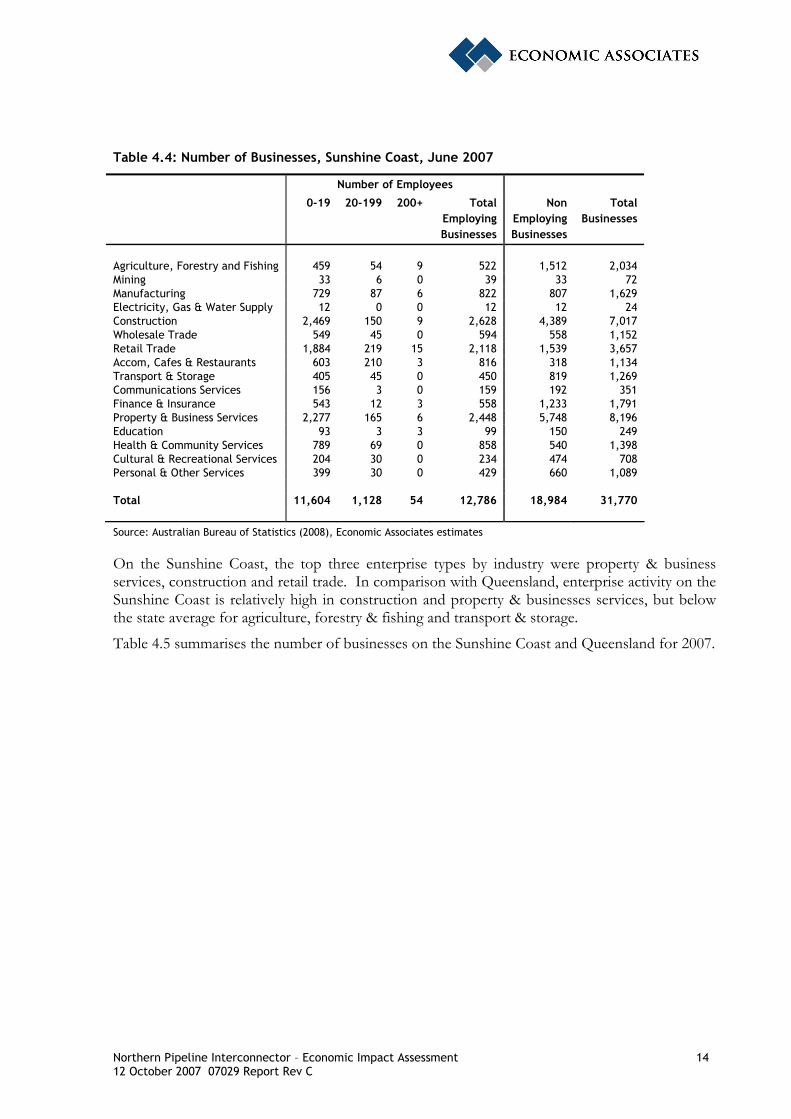
4.4.1 Number of Businesses In December 2007, there were an estimated 31,770 businesses on the Sunshine Coast, comprised of 12,786 employing businesses and 18,984 businesses operating as sole traders. Employment in the region was concentrated in property & business services (8,196 businesses), construction (7,017 businesses), retail trade (3,657 businesses) and agriculture forestry & fishing (2,034 businesses). The majority of employing businesses on the Sunshine Coast employ less than 20 persons, with 54 businesses each providing employment for 200 or more staff.
Table 4.4 summarises the number of businesses by size on the Sunshine Coast as at December 20071.
1 2007 ABS Business Register data is the most recent data available.
Northern Pipeline Interconnector – Economic Impact Assessment 14 12 October 2007 07029 Report Rev C
Table 4.4: Number of Businesses, Sunshine Coast, June 2007
Number of Employees
0-19 20-199 200+ Total Employing
Businesses
Non Employing Businesses
Total Businesses
Agriculture, Forestry and Fishing 459 54 9 522 1,512 2,034 Mining 33 6 0 39 33 72 Manufacturing 729 87 6 822 807 1,629 Electricity, Gas & Water Supply 12 0 0 12 12 24 Construction 2,469 150 9 2,628 4,389 7,017 Wholesale Trade 549 45 0 594 558 1,152 Retail Trade 1,884 219 15 2,118 1,539 3,657 Accom, Cafes & Restaurants 603 210 3 816 318 1,134 Transport & Storage 405 45 0 450 819 1,269 Communications Services 156 3 0 159 192 351 Finance & Insurance 543 12 3 558 1,233 1,791 Property & Business Services 2,277 165 6 2,448 5,748 8,196 Education 93 3 3 99 150 249 Health & Community Services 789 69 0 858 540 1,398 Cultural & Recreational Services 204 30 0 234 474 708 Personal & Other Services 399 30 0 429 660 1,089 Total 11,604 1,128 54 12,786 18,984 31,770
Source: Australian Bureau of Statistics (2008), Economic Associates estimates
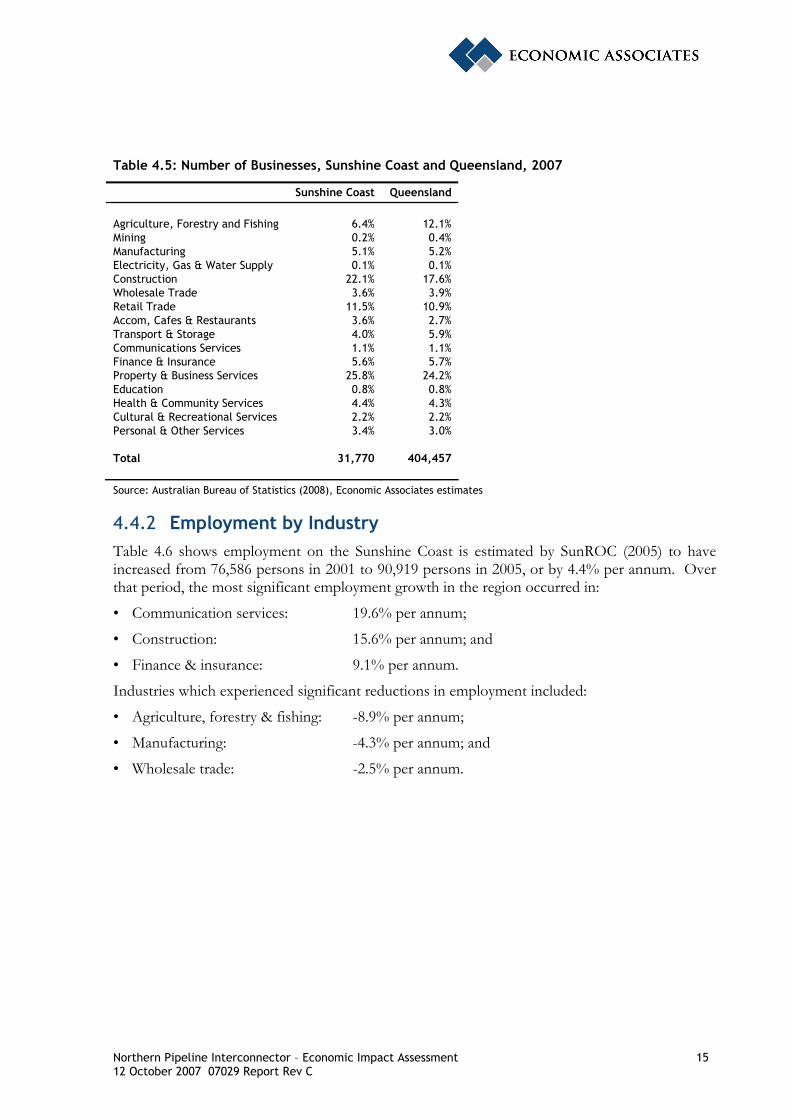
On the Sunshine Coast, the top three enterprise types by industry were property & business services, construction and retail trade. In comparison with Queensland, enterprise activity on the Sunshine Coast is relatively high in construction and property & businesses services, but below the state average for agriculture, forestry & fishing and transport & storage.
Table 4.5 summarises the number of businesses on the Sunshine Coast and Queensland for 2007.
Northern Pipeline Interconnector – Economic Impact Assessment 15 12 October 2007 07029 Report Rev C
Table 4.5: Number of Businesses, Sunshine Coast and Queensland, 2007
Sunshine Coast Queensland
Agriculture, Forestry and Fishing 6.4% 12.1% Mining 0.2% 0.4% Manufacturing 5.1% 5.2% Electricity, Gas & Water Supply 0.1% 0.1% Construction 22.1% 17.6% Wholesale Trade 3.6% 3.9% Retail Trade 11.5% 10.9% Accom, Cafes & Restaurants 3.6% 2.7% Transport & Storage 4.0% 5.9% Communications Services 1.1% 1.1% Finance & Insurance 5.6% 5.7% Property & Business Services 25.8% 24.2% Education 0.8% 0.8% Health & Community Services 4.4% 4.3% Cultural & Recreational Services 2.2% 2.2% Personal & Other Services 3.4% 3.0% Total 31,770 404,457
Source: Australian Bureau of Statistics (2008), Economic Associates estimates
4.4.2 Employment by Industry Table 4.6 shows employment on the Sunshine Coast is estimated by SunROC (2005) to have increased from 76,586 persons in 2001 to 90,919 persons in 2005, or by 4.4% per annum. Over that period, the most significant employment growth in the region occurred in:
• Communication services: 19.6% per annum;
• Construction: 15.6% per annum; and
• Finance & insurance: 9.1% per annum.
Industries which experienced significant reductions in employment included:
• Agriculture, forestry & fishing: -8.9% per annum;
• Manufacturing: -4.3% per annum; and
• Wholesale trade: -2.5% per annum.
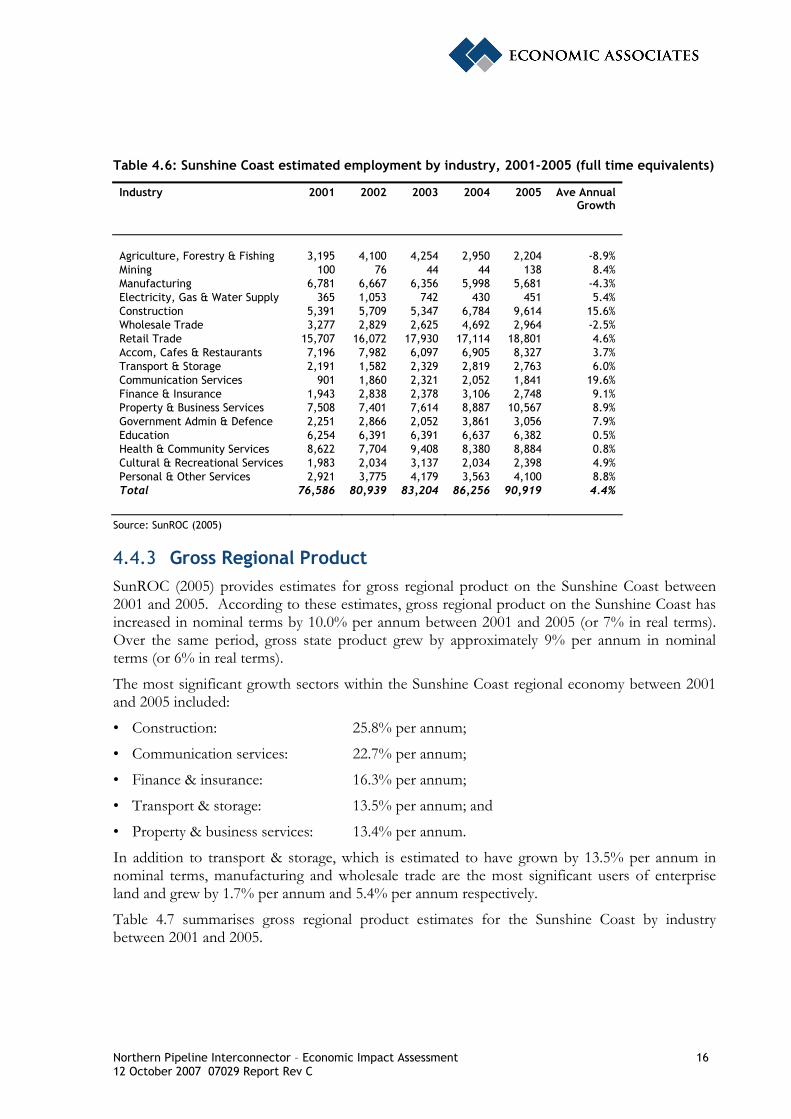
Northern Pipeline Interconnector – Economic Impact Assessment 16 12 October 2007 07029 Report Rev C
Table 4.6: Sunshine Coast estimated employment by industry, 2001-2005 (full time equivalents)
Industry 2001 2002 2003 2004 2005 Ave Annual Growth
Agriculture, Forestry & Fishing 3,195 4,100 4,254 2,950 2,204 -8.9% Mining 100 76 44 44 138 8.4% Manufacturing 6,781 6,667 6,356 5,998 5,681 -4.3% Electricity, Gas & Water Supply 365 1,053 742 430 451 5.4% Construction 5,391 5,709 5,347 6,784 9,614 15.6% Wholesale Trade 3,277 2,829 2,625 4,692 2,964 -2.5% Retail Trade 15,707 16,072 17,930 17,114 18,801 4.6% Accom, Cafes & Restaurants 7,196 7,982 6,097 6,905 8,327 3.7% Transport & Storage 2,191 1,582 2,329 2,819 2,763 6.0% Communication Services 901 1,860 2,321 2,052 1,841 19.6% Finance & Insurance 1,943 2,838 2,378 3,106 2,748 9.1% Property & Business Services 7,508 7,401 7,614 8,887 10,567 8.9% Government Admin & Defence 2,251 2,866 2,052 3,861 3,056 7.9% Education 6,254 6,391 6,391 6,637 6,382 0.5% Health & Community Services 8,622 7,704 9,408 8,380 8,884 0.8% Cultural & Recreational Services 1,983 2,034 3,137 2,034 2,398 4.9% Personal & Other Services 2,921 3,775 4,179 3,563 4,100 8.8% Total 76,586 80,939 83,204 86,256 90,919 4.4%
Source: SunROC (2005)
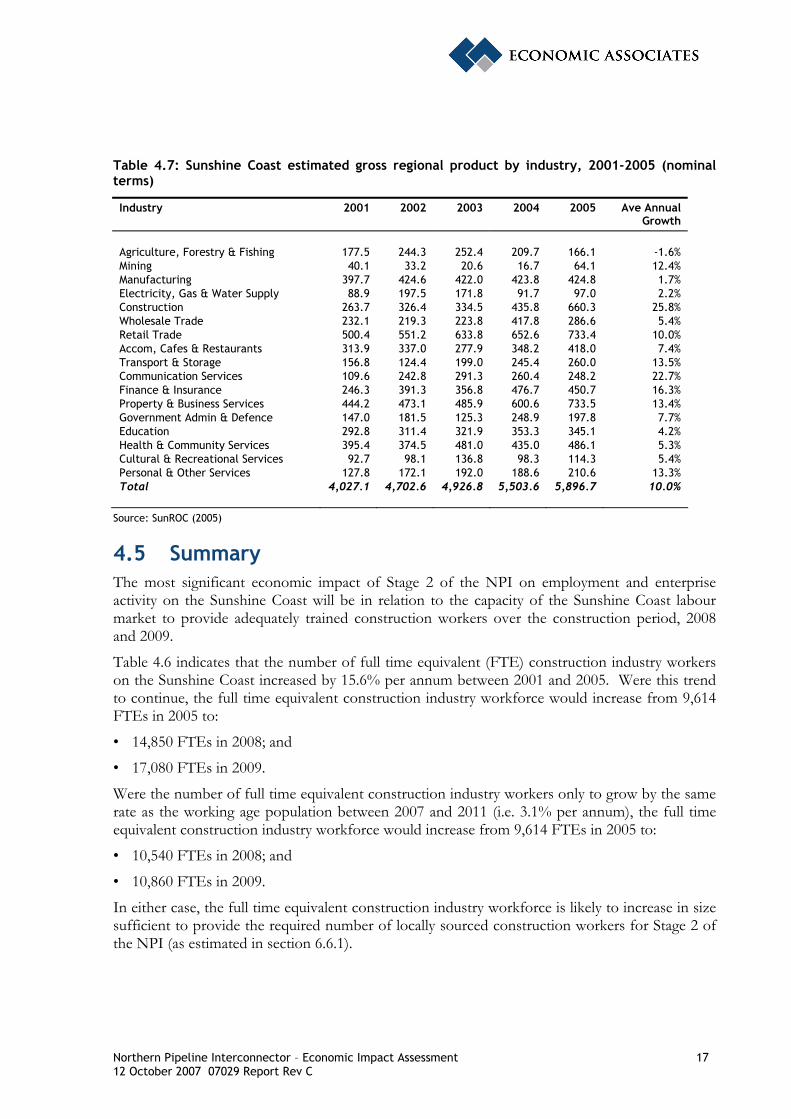
4.4.3 Gross Regional Product SunROC (2005) provides estimates for gross regional product on the Sunshine Coast between 2001 and 2005. According to these estimates, gross regional product on the Sunshine Coast has increased in nominal terms by 10.0% per annum between 2001 and 2005 (or 7% in real terms). Over the same period, gross state product grew by approximately 9% per annum in nominal terms (or 6% in real terms).
The most significant growth sectors within the Sunshine Coast regional economy between 2001 and 2005 included:
• Construction: 25.8% per annum;
• Communication services: 22.7% per annum;
• Finance & insurance: 16.3% per annum;
• Transport & storage: 13.5% per annum; and
• Property & business services: 13.4% per annum.
In addition to transport & storage, which is estimated to have grown by 13.5% per annum in nominal terms, manufacturing and wholesale trade are the most significant users of enterprise land and grew by 1.7% per annum and 5.4% per annum respectively.
Table 4.7 summarises gross regional product estimates for the Sunshine Coast by industry between 2001 and 2005.
Northern Pipeline Interconnector – Economic Impact Assessment 17 12 October 2007 07029 Report Rev C
Table 4.7: Sunshine Coast estimated gross regional product by industry, 2001-2005 (nominal terms)
Industry 2001 2002 2003 2004 2005 Ave Annual Growth
Agriculture, Forestry & Fishing 177.5 244.3 252.4 209.7 166.1 -1.6% Mining 40.1 33.2 20.6 16.7 64.1 12.4% Manufacturing 397.7 424.6 422.0 423.8 424.8 1.7% Electricity, Gas & Water Supply 88.9 197.5 171.8 91.7 97.0 2.2% Construction 263.7 326.4 334.5 435.8 660.3 25.8% Wholesale Trade 232.1 219.3 223.8 417.8 286.6 5.4% Retail Trade 500.4 551.2 633.8 652.6 733.4 10.0% Accom, Cafes & Restaurants 313.9 337.0 277.9 348.2 418.0 7.4% Transport & Storage 156.8 124.4 199.0 245.4 260.0 13.5% Communication Services 109.6 242.8 291.3 260.4 248.2 22.7% Finance & Insurance 246.3 391.3 356.8 476.7 450.7 16.3% Property & Business Services 444.2 473.1 485.9 600.6 733.5 13.4% Government Admin & Defence 147.0 181.5 125.3 248.9 197.8 7.7% Education 292.8 311.4 321.9 353.3 345.1 4.2% Health & Community Services 395.4 374.5 481.0 435.0 486.1 5.3% Cultural & Recreational Services 92.7 98.1 136.8 98.3 114.3 5.4% Personal & Other Services 127.8 172.1 192.0 188.6 210.6 13.3% Total 4,027.1 4,702.6 4,926.8 5,503.6 5,896.7 10.0%
Source: SunROC (2005)
4.5 Summary The most significant economic impact of Stage 2 of the NPI on employment and enterprise activity on the Sunshine Coast will be in relation to the capacity of the Sunshine Coast labour market to provide adequately trained construction workers over the construction period, 2008 and 2009.
Table 4.6 indicates that the number of full time equivalent (FTE) construction industry workers on the Sunshine Coast increased by 15.6% per annum between 2001 and 2005. Were this trend to continue, the full time equivalent construction industry workforce would increase from 9,614 FTEs in 2005 to:
• 14,850 FTEs in 2008; and
• 17,080 FTEs in 2009.
Were the number of full time equivalent construction industry workers only to grow by the same rate as the working age population between 2007 and 2011 (i.e. 3.1% per annum), the full time equivalent construction industry workforce would increase from 9,614 FTEs in 2005 to:
• 10,540 FTEs in 2008; and
• 10,860 FTEs in 2009.
In either case, the full time equivalent construction industry workforce is likely to increase in size sufficient to provide the required number of locally sourced construction workers for Stage 2 of the NPI (as estimated in section 6.6.1).
Northern Pipeline Interconnector – Economic Impact Assessment 18 12 October 2007 07029 Report Rev C
5 AVAILABILITY OF ACCOMMODATION AND HOUSING ON THE SUNSHINE COAST
The following assessment of the Sunshine Coast accommodation and housing markets relates to:
• Stock and availability of commercial accommodation, including:
– Hotel and motel rooms and serviced apartments;
– Caravan park sites;
– Holiday flats, units and houses; and
– Hostel beds;
• Median rents for two bedroom units and three bedroom houses; and
• Sales of houses, units, townhouses and vacant urban land.
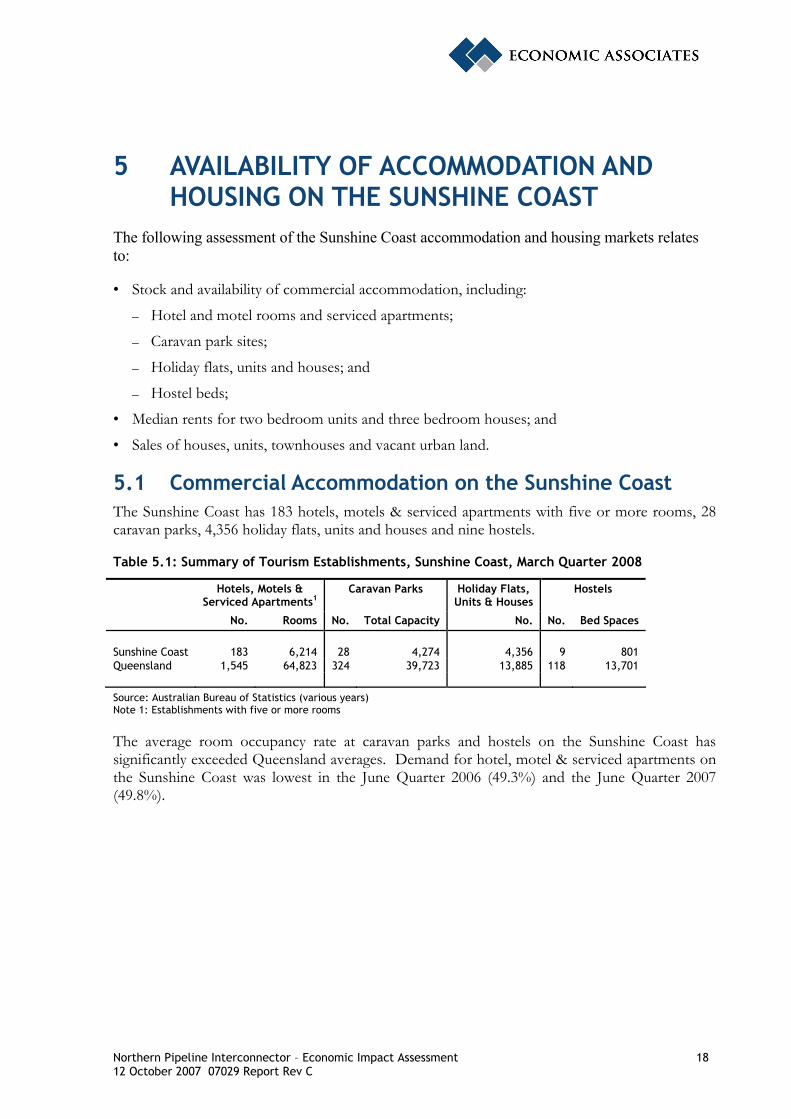
5.1 Commercial Accommodation on the Sunshine Coast The Sunshine Coast has 183 hotels, motels & serviced apartments with five or more rooms, 28 caravan parks, 4,356 holiday flats, units and houses and nine hostels.
Table 5.1: Summary of Tourism Establishments, Sunshine Coast, March Quarter 2008
Hotels, Motels & Serviced Apartments1
Caravan Parks Holiday Flats, Units & Houses
Hostels
No. Rooms No. Total Capacity No. No. Bed Spaces
Sunshine Coast 183 6,214 28 4,274 4,356 9 801 Queensland 1,545 64,823 324 39,723 13,885 118 13,701
Source: Australian Bureau of Statistics (various years) Note 1: Establishments with five or more rooms
The average room occupancy rate at caravan parks and hostels on the Sunshine Coast has significantly exceeded Queensland averages. Demand for hotel, motel & serviced apartments on the Sunshine Coast was lowest in the June Quarter 2006 (49.3%) and the June Quarter 2007 (49.8%).
Northern Pipeline Interconnector – Economic Impact Assessment 19 12 October 2007 07029 Report Rev C
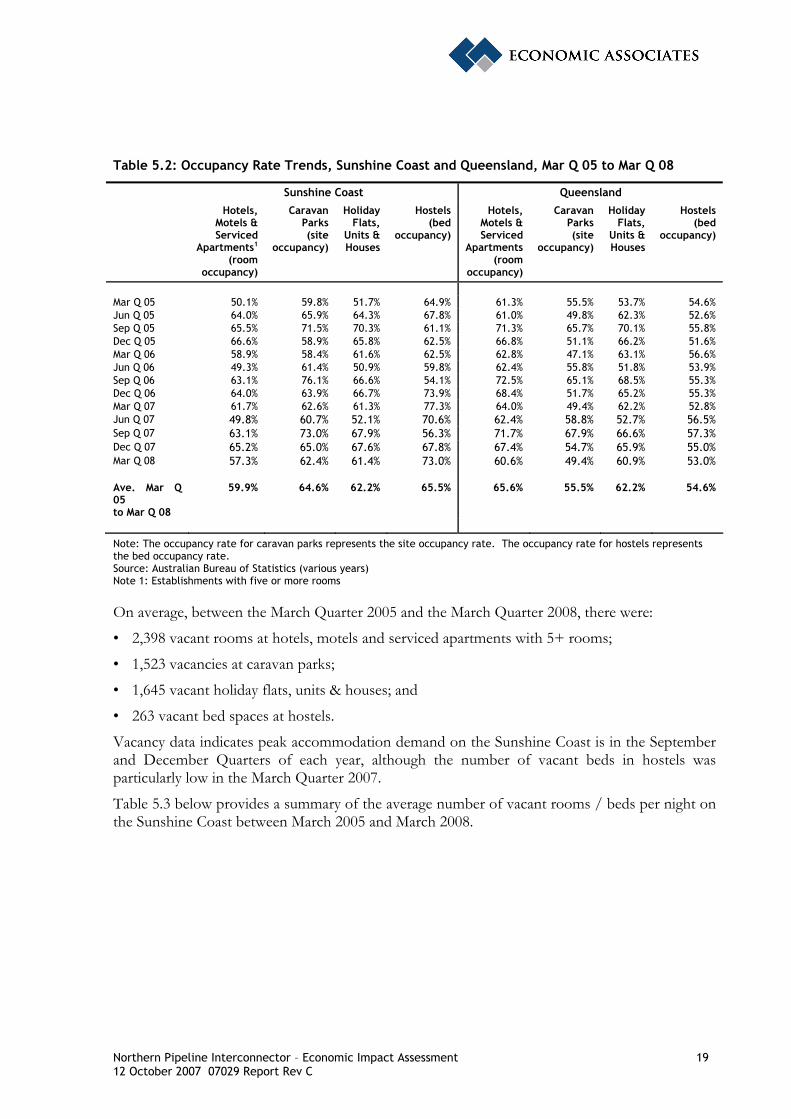
Table 5.2: Occupancy Rate Trends, Sunshine Coast and Queensland, Mar Q 05 to Mar Q 08
Sunshine Coast Queensland
Hotels, Motels & Serviced
Apartments1 (room
occupancy)
Caravan Parks
(site occupancy)
Holiday Flats,
Units & Houses
Hostels (bed
occupancy)
Hotels, Motels & Serviced
Apartments (room
occupancy)
Caravan Parks
(site occupancy)
Holiday Flats,
Units & Houses
Hostels (bed
occupancy)
Mar Q 05 50.1% 59.8% 51.7% 64.9% 61.3% 55.5% 53.7% 54.6% Jun Q 05 64.0% 65.9% 64.3% 67.8% 61.0% 49.8% 62.3% 52.6% Sep Q 05 65.5% 71.5% 70.3% 61.1% 71.3% 65.7% 70.1% 55.8% Dec Q 05 66.6% 58.9% 65.8% 62.5% 66.8% 51.1% 66.2% 51.6% Mar Q 06 58.9% 58.4% 61.6% 62.5% 62.8% 47.1% 63.1% 56.6% Jun Q 06 49.3% 61.4% 50.9% 59.8% 62.4% 55.8% 51.8% 53.9% Sep Q 06 63.1% 76.1% 66.6% 54.1% 72.5% 65.1% 68.5% 55.3% Dec Q 06 64.0% 63.9% 66.7% 73.9% 68.4% 51.7% 65.2% 55.3% Mar Q 07 61.7% 62.6% 61.3% 77.3% 64.0% 49.4% 62.2% 52.8% Jun Q 07 49.8% 60.7% 52.1% 70.6% 62.4% 58.8% 52.7% 56.5% Sep Q 07 63.1% 73.0% 67.9% 56.3% 71.7% 67.9% 66.6% 57.3% Dec Q 07 65.2% 65.0% 67.6% 67.8% 67.4% 54.7% 65.9% 55.0% Mar Q 08 57.3% 62.4% 61.4% 73.0% 60.6% 49.4% 60.9% 53.0% Ave. Mar Q 05 to Mar Q 08
59.9% 64.6% 62.2% 65.5% 65.6% 55.5% 62.2% 54.6%
Note: The occupancy rate for caravan parks represents the site occupancy rate. The occupancy rate for hostels represents the bed occupancy rate. Source: Australian Bureau of Statistics (various years) Note 1: Establishments with five or more rooms
On average, between the March Quarter 2005 and the March Quarter 2008, there were:
• 2,398 vacant rooms at hotels, motels and serviced apartments with 5+ rooms;
• 1,523 vacancies at caravan parks;
• 1,645 vacant holiday flats, units & houses; and
• 263 vacant bed spaces at hostels.
Vacancy data indicates peak accommodation demand on the Sunshine Coast is in the September and December Quarters of each year, although the number of vacant beds in hostels was particularly low in the March Quarter 2007.
Table 5.3 below provides a summary of the average number of vacant rooms / beds per night on the Sunshine Coast between March 2005 and March 2008.
Northern Pipeline Interconnector – Economic Impact Assessment 20 12 October 2007 07029 Report Rev C
Table 5.3: Average Number of Vacancies per Night, Sunshine Coast, Mar Q 05 to Mar Q 08
Hotels, Motels & Serviced Apartments1
(vacant rooms)
Caravan Parks
(vacant sites)
Holiday Flats, Units & Houses (vacant units)
Hostels (vacant
beds)
Mar Q 05 2,872 1,785 2,025 249 Jun Q 05 2,082 1,484 1,449 225 Sep Q 05 2,018 1,217 1,285 276 Dec Q 05 2,026 1,780 1,513 271 Mar Q 06 2,462 1,805 1,720 296 Jun Q 06 2,995 1,646 2,128 320 Sep Q 06 2,174 1,010 1,471 357 Dec Q 06 2,142 1,534 1,459 201 Mar Q 07 2,269 1,598 1,698 178 Jun Q 07 3,039 1,680 2,115 231 Sep Q 07 2,278 1,152 1,404 346 Dec Q 07 2,158 1,496 1,438 256 Mar Q 08 2,653 1,607 1,680 216
Average, Mar Q 05 to Mar Q 08 2,398 1,523 1,645 263
Source: Australian Bureau of Statistics (various years) Note 1: Establishments with five or more rooms
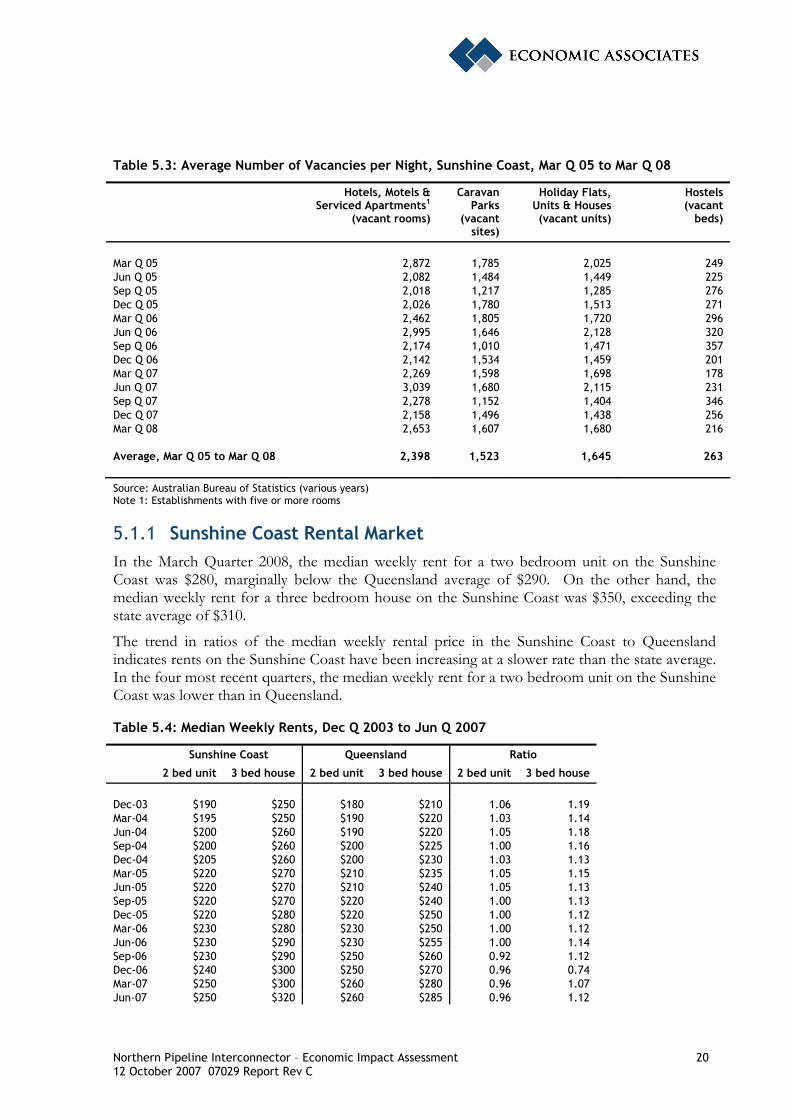
5.1.1 Sunshine Coast Rental Market In the March Quarter 2008, the median weekly rent for a two bedroom unit on the Sunshine Coast was $280, marginally below the Queensland average of $290. On the other hand, the median weekly rent for a three bedroom house on the Sunshine Coast was $350, exceeding the state average of $310.
The trend in ratios of the median weekly rental price in the Sunshine Coast to Queensland indicates rents on the Sunshine Coast have been increasing at a slower rate than the state average. In the four most recent quarters, the median weekly rent for a two bedroom unit on the Sunshine Coast was lower than in Queensland.
Table 5.4: Median Weekly Rents, Dec Q 2003 to Jun Q 2007
Sunshine Coast Queensland Ratio
2 bed unit 3 bed house 2 bed unit 3 bed house 2 bed unit 3 bed house
Dec-03 $190 $250 $180 $210 1.06 1.19 Mar-04 $195 $250 $190 $220 1.03 1.14 Jun-04 $200 $260 $190 $220 1.05 1.18 Sep-04 $200 $260 $200 $225 1.00 1.16 Dec-04 $205 $260 $200 $230 1.03 1.13 Mar-05 $220 $270 $210 $235 1.05 1.15 Jun-05 $220 $270 $210 $240 1.05 1.13 Sep-05 $220 $270 $220 $240 1.00 1.13 Dec-05 $220 $280 $220 $250 1.00 1.12 Mar-06 $230 $280 $230 $250 1.00 1.12 Jun-06 $230 $290 $230 $255 1.00 1.14 Sep-06 $230 $290 $250 $260 0.92 1.12 Dec-06 $240 $300 $250 $270 0.96 0.74 Mar-07 $250 $300 $260 $280 0.96 1.07 Jun-07 $250 $320 $260 $285 0.96 1.12
Northern Pipeline Interconnector – Economic Impact Assessment 21 12 October 2007 07029 Report Rev C
Sunshine Coast Queensland Ratio
2 bed unit 3 bed house 2 bed unit 3 bed house 2 bed unit 3 bed house
Sep-07 $260 $320 $270 $295 0.96 1.08 Dec-07 $270 $340 $275 $300 0.98 1.13 Mar-08 $280 $350 $290 $310 0.97 1.13
Note: A ratio of more (less) than one indicates the median weekly rent on the Sunshine Coast is higher (lower) than the Queensland average. Source: Residential Tenancies Authority of Queensland (2007)
5.2 Sunshine Coast Housing Market
5.2.1 Houses
Volume of Sales
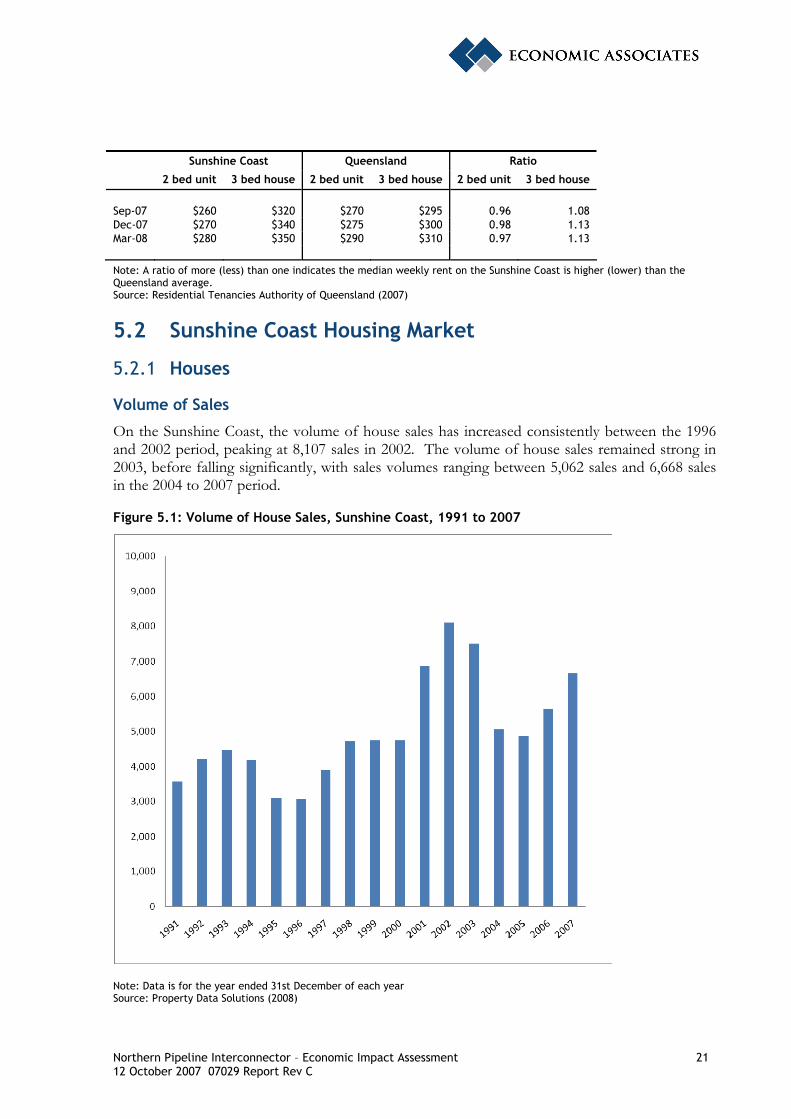
On the Sunshine Coast, the volume of house sales has increased consistently between the 1996 and 2002 period, peaking at 8,107 sales in 2002. The volume of house sales remained strong in 2003, before falling significantly, with sales volumes ranging between 5,062 sales and 6,668 sales in the 2004 to 2007 period.
Figure 5.1: Volume of House Sales, Sunshine Coast, 1991 to 2007
Note: Data is for the year ended 31st December of each year Source: Property Data Solutions (2008)
Northern Pipeline Interconnector – Economic Impact Assessment 22 12 October 2007 07029 Report Rev C
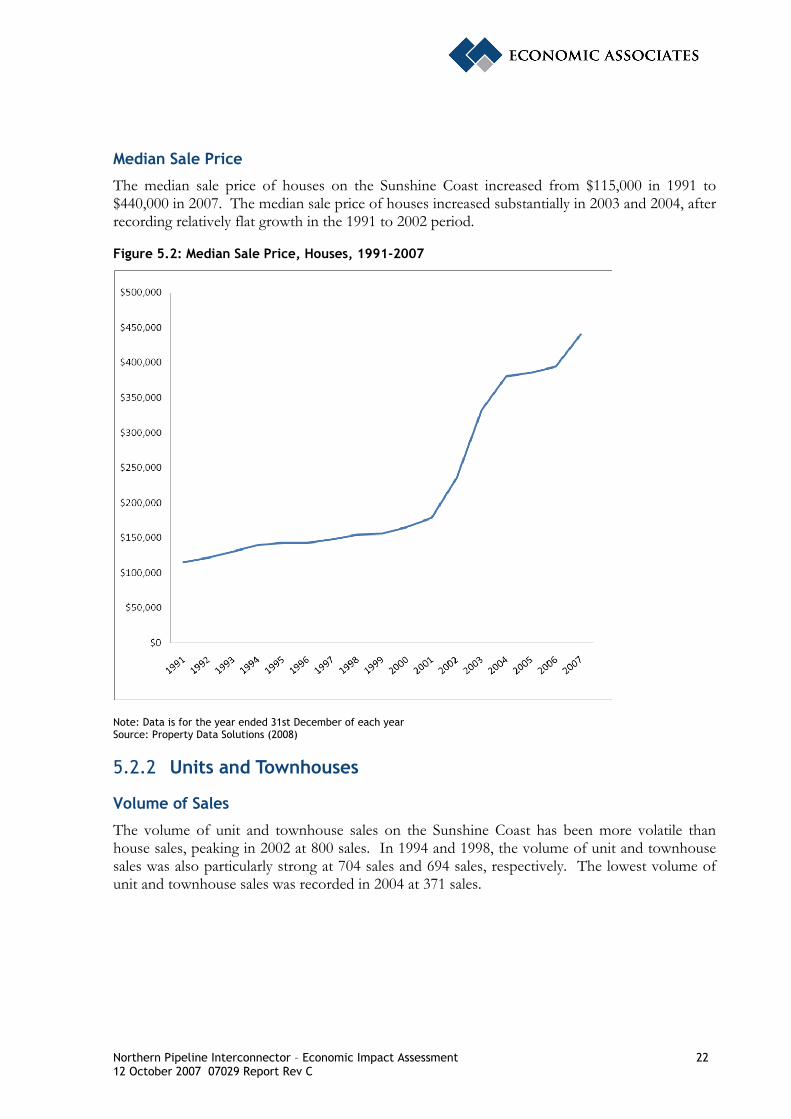
Median Sale Price
The median sale price of houses on the Sunshine Coast increased from $115,000 in 1991 to $440,000 in 2007. The median sale price of houses increased substantially in 2003 and 2004, after recording relatively flat growth in the 1991 to 2002 period.
Figure 5.2: Median Sale Price, Houses, 1991-2007
Note: Data is for the year ended 31st December of each year Source: Property Data Solutions (2008)
5.2.2 Units and Townhouses
Volume of Sales
The volume of unit and townhouse sales on the Sunshine Coast has been more volatile than house sales, peaking in 2002 at 800 sales. In 1994 and 1998, the volume of unit and townhouse sales was also particularly strong at 704 sales and 694 sales, respectively. The lowest volume of unit and townhouse sales was recorded in 2004 at 371 sales.
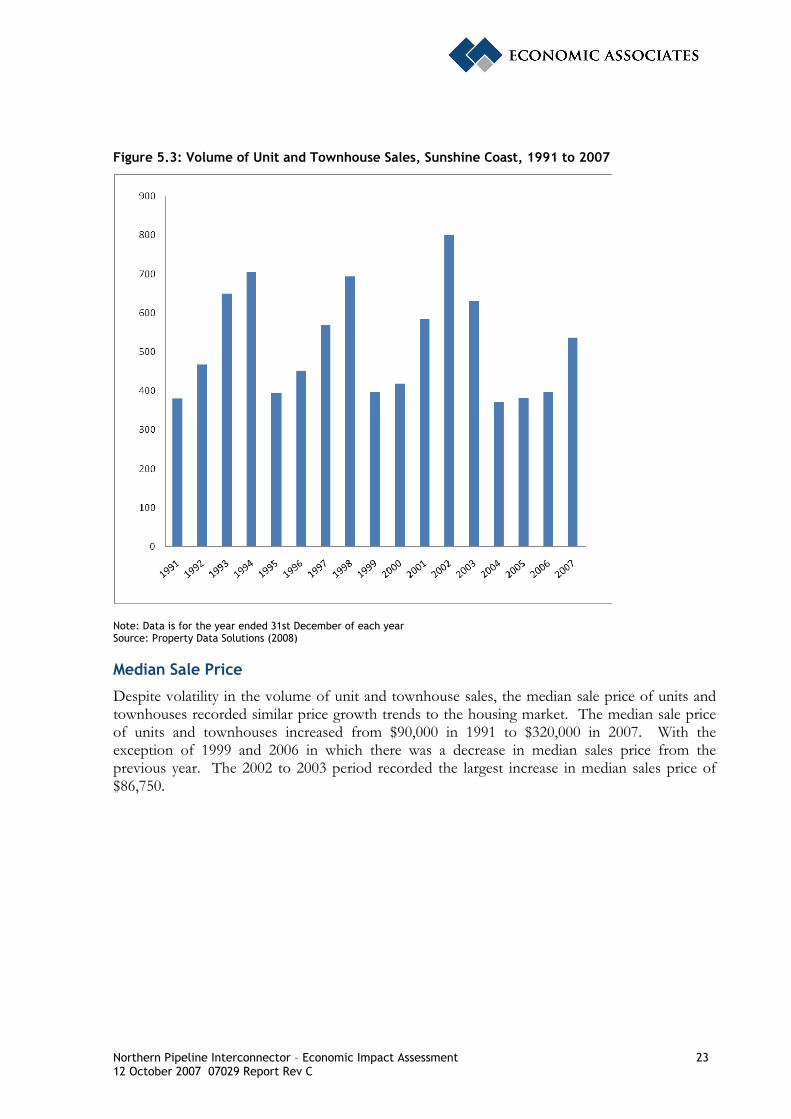
Northern Pipeline Interconnector – Economic Impact Assessment 23 12 October 2007 07029 Report Rev C
Figure 5.3: Volume of Unit and Townhouse Sales, Sunshine Coast, 1991 to 2007
Note: Data is for the year ended 31st December of each year Source: Property Data Solutions (2008)
Median Sale Price
Despite volatility in the volume of unit and townhouse sales, the median sale price of units and townhouses recorded similar price growth trends to the housing market. The median sale price of units and townhouses increased from $90,000 in 1991 to $320,000 in 2007. With the exception of 1999 and 2006 in which there was a decrease in median sales price from the previous year. The 2002 to 2003 period recorded the largest increase in median sales price of $86,750.
Northern Pipeline Interconnector – Economic Impact Assessment 24 12 October 2007 07029 Report Rev C
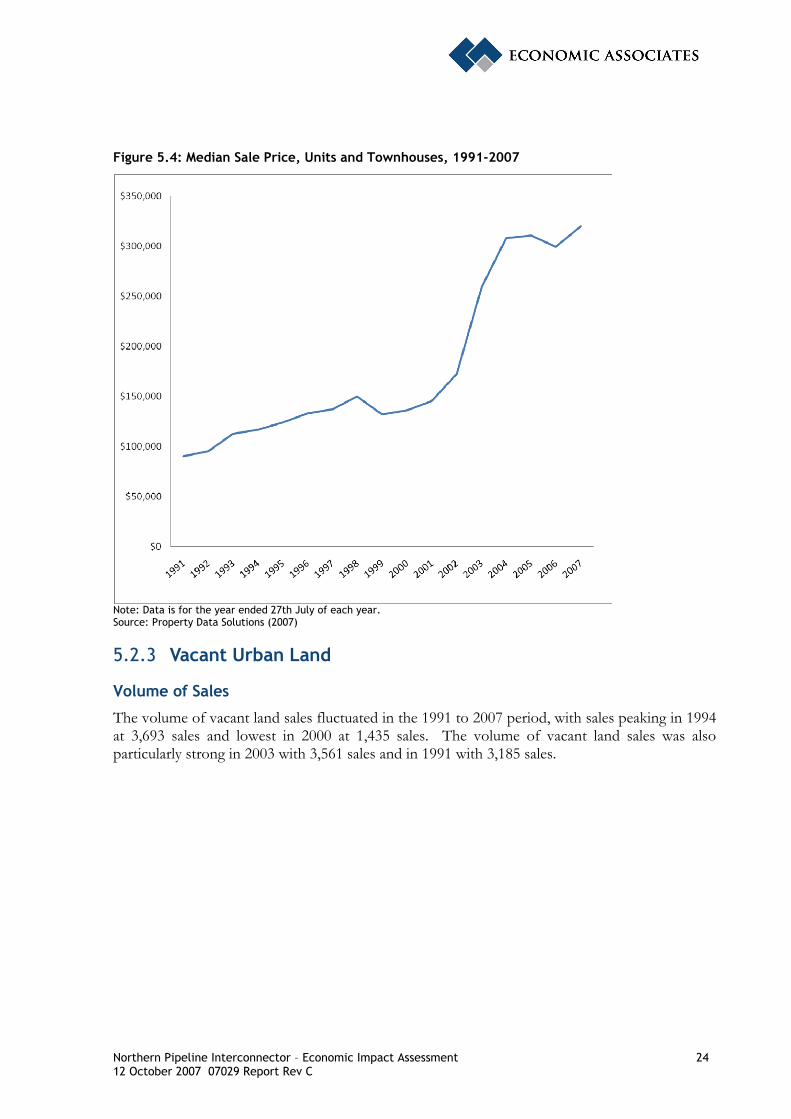
Figure 5.4: Median Sale Price, Units and Townhouses, 1991-2007
Note: Data is for the year ended 27th July of each year. Source: Property Data Solutions (2007)
5.2.3 Vacant Urban Land
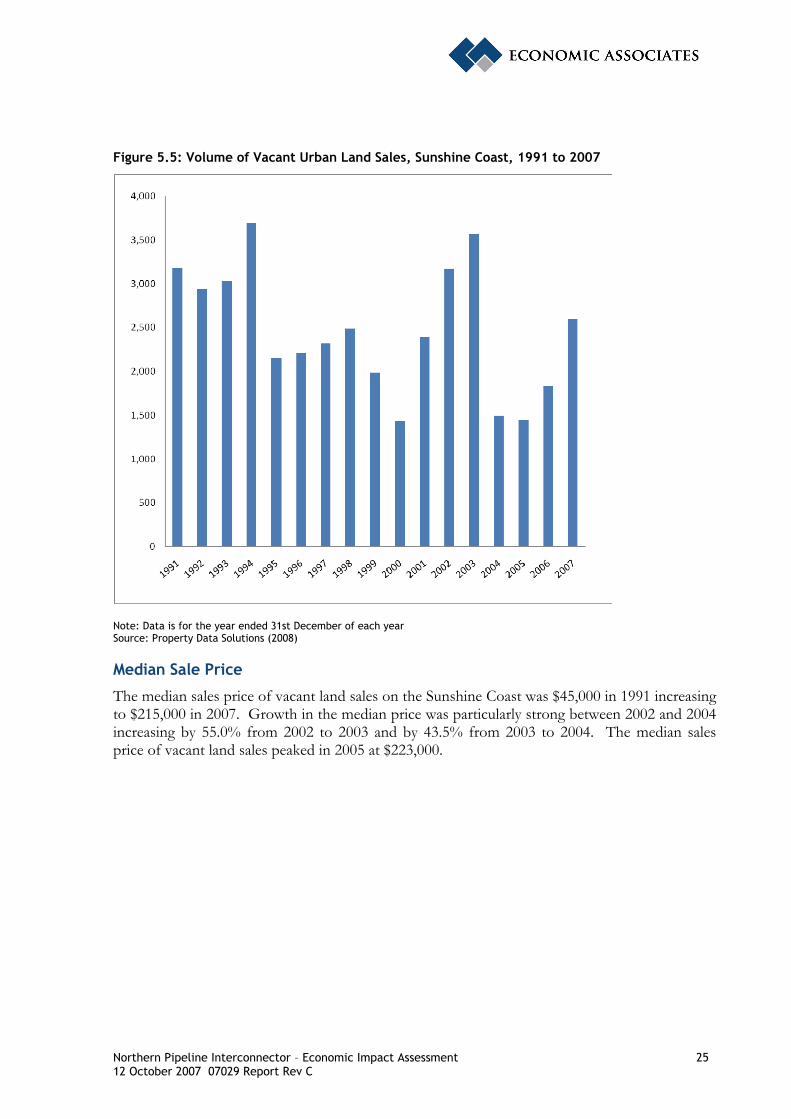
Volume of Sales
The volume of vacant land sales fluctuated in the 1991 to 2007 period, with sales peaking in 1994 at 3,693 sales and lowest in 2000 at 1,435 sales. The volume of vacant land sales was also particularly strong in 2003 with 3,561 sales and in 1991 with 3,185 sales.
Northern Pipeline Interconnector – Economic Impact Assessment 25 12 October 2007 07029 Report Rev C
Figure 5.5: Volume of Vacant Urban Land Sales, Sunshine Coast, 1991 to 2007
Note: Data is for the year ended 31st December of each year Source: Property Data Solutions (2008)
Median Sale Price
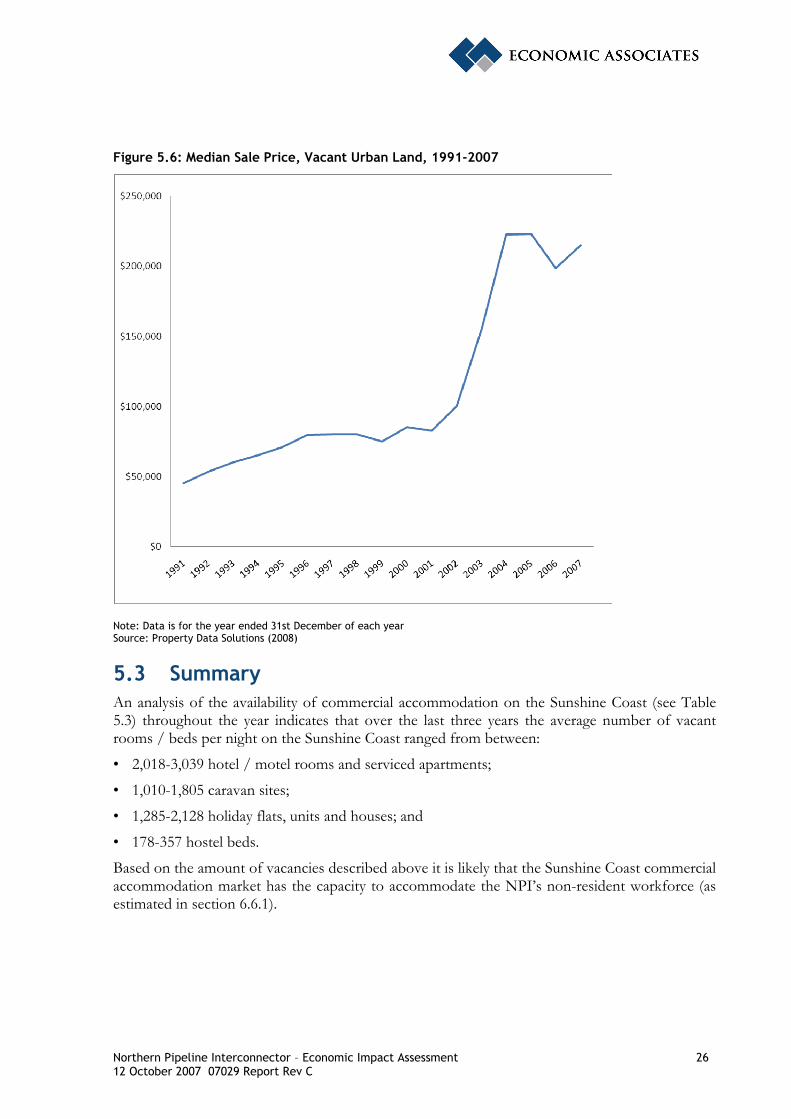
The median sales price of vacant land sales on the Sunshine Coast was $45,000 in 1991 increasing to $215,000 in 2007. Growth in the median price was particularly strong between 2002 and 2004 increasing by 55.0% from 2002 to 2003 and by 43.5% from 2003 to 2004. The median sales price of vacant land sales peaked in 2005 at $223,000.
Northern Pipeline Interconnector – Economic Impact Assessment 26 12 October 2007 07029 Report Rev C
Figure 5.6: Median Sale Price, Vacant Urban Land, 1991-2007
Note: Data is for the year ended 31st December of each year Source: Property Data Solutions (2008)
5.3 Summary An analysis of the availability of commercial accommodation on the Sunshine Coast (see Table 5.3) throughout the year indicates that over the last three years the average number of vacant rooms / beds per night on the Sunshine Coast ranged from between:
• 2,018-3,039 hotel / motel rooms and serviced apartments;
• 1,010-1,805 caravan sites;
• 1,285-2,128 holiday flats, units and houses; and
• 178-357 hostel beds.
Based on the amount of vacancies described above it is likely that the Sunshine Coast commercial accommodation market has the capacity to accommodate the NPI’s non-resident workforce (as estimated in section 6.6.1).
Northern Pipeline Interconnector – Economic Impact Assessment 27 12 October 2007 07029 Report Rev C
6 ECONOMIC IMPACT ASSESSMENT Expenditure related to the proposed Northern Pipeline Interconnector described in the preceding sections has been allocated to the relevant industry sectors as contained in input output tables. This expenditure is then applied to an input output model of the SEQ regional economy derived by Economic Associates using the GRIT technique2. The expenditure related to the construction of the proposed Northern Pipeline Interconnector and ongoing related expenditure represents an economic stimulus (or economic impact) on the economy.
The stimulus from additional economic activity has two levels of impact:
• First round impacts, or direct impacts, arise as the project’s capital budget is expended on goods from other industries, causing an expansion of output in those industries; and
• Second round impacts, or indirect impacts, arise as industries supplying inputs to the project increase their purchases to meet the additional demand generated by the project.
The extent of these impacts can be represented by multipliers calculated in aggregate for the SEQ regional, Queensland and Australian economies. There are commonly four multipliers used to measure impact - output, income, employment and value added. These multipliers do not incorporate accelerator impacts which might arise from stimulating additional investment in the economy and could understate impacts in areas where associated investment would be significant.
It is important to note that value added is the measure preferred by economists of economic impact resulting from a stimulus.
6.1 Output The output impact measures the increase in gross sales throughout the entire economy by aggregating all individual transactions (direct and indirect) resulting from the economic stimulus. The output impact provides an indication of the degree of structural dependence between sectors of the economy. However, output impacts are regarded as overstating the impact on the economy as they count all goods and services used in one stage of production as an input to later stages of production, hence counting their contribution more than once.
6.2 Household Income The household income impact measures the additional wages, salaries and supplements paid to households associated with the industry under consideration and with other industries benefiting from the stimulus to the economy. It is important to note that the input-output tables on which this analysis is based relate to 2001. The input-output tables represent the structural dependence of industry sectors within the regional economy. Since 2001 there may have been significant changes in the real wages of construction workers within SEQ relative to other regions. While the input-output tables have been augmented to reflect changes in relative incomes between industries, they have not been augmented such that they reflect relative differences between regions on an inter-industry basis. 2 The GRIT technique allows for the augmentation of input-output tables using more recent or regional specific data than utilised in the base input output tables.
Northern Pipeline Interconnector – Economic Impact Assessment 28 12 October 2007 07029 Report Rev C
6.3 Employment The employment impact measures the number of full time equivalent (FTE) positions for one year created directly and indirectly by the stimulus3. However, the short-term response to increased demand may be that existing employees work overtime. Consequently, actual levels of employment generated (in terms of persons employed) will tend to be lower than those estimated by the input-output analysis. This short-term employment response (of working additional overtime) will be more prevalent where the demand stimulus is likely to be temporary and short lived, or where there is limited spare capacity in the economy (that is, when the economy is at or near full employment).
6.4 Value Added The value added or Gross Regional Product (GRP) impact measures only the net activity at each stage of production resulting from a stimulus. GRP is defined as the addition of consumption, investment and government expenditure, plus net exports (exports minus imports) from a region. The value added (or GRP) impact is the preferred measure for the assessment of contribution to the economy from a stimulus or impact, and as such should be used to describe the net impact of the event.
6.5 Limitations of the Input-Output Approach The input-output approach has a number of limitations, which may result in overestimation of impacts. Some of the limitations of the input-output approach include:
• The absence of capacity constraints such that the supply of each good is perfectly elastic, implying each industry can supply whatever quantity is demanded of it and there are no budget constraints;
• The assumed linearity and homogeneity of the input function, which implies constant returns to scale and no substitution between inputs. This occurs because the approach assumes inputs purchased by each industry are a function only of the level of output of that industry;
• Each commodity, or type of commodity, is supplied by a single industry sector, implying there is only one method used to produce each commodity and each sector has only a single primary output;
• Multipliers are derived from the 2001 Input Output tables and reflect the structural dependence of the economy at that time. These tables have been augmented to reflect broad level structural change across the national economy by industry sector. The regional tables prepared for this analysis reflect regional variation as at 2001 and industry variation as at 2007. As such, the tables do not reflect any intensification or deterioration in regional competitive advantage in specific industry sector that may have occurred since 2001;
• The assumption that the economy is in equilibrium at given prices and that the economy is not subject to other external influences; and
3 Therefore, if impacts are to be spread over a number of years, the FTE estimate (which relates to the annual equivalent) should be divided by the number of years over which the impact will be spread (in the absence of a clearly defined staging program) to provide an indicative ongoing employment estimate over the life of the impact.
Northern Pipeline Interconnector – Economic Impact Assessment 29 12 October 2007 07029 Report Rev C
• The additivity assumption which suggests the total effect of carrying on several types of production is the sum of the separate effects, which is not a true reflection of economic systems.
The input-output approach is least appropriate when the economic ‘shock’ represents a general as opposed to a marginal change. However, the input-output approach provides a sound basis for taking account of the inter-industry relationships in the short-term and hence is an appropriate tool for determining the direct and indirect economic effects of short-term economic ‘shocks’, such as construction of the proposed pipeline.
The economic impact analysis contained in this report presents results which are indicative of the scale of the economic impacts resulting from the proposed development.
6.6 Economic Impact Analysis Economic stimulus will be generated by the project through inter-industry purchases made by the SRWPC. These stimuli will be generated in two phases of the project, namely:
• Construction; and
• Operation and maintenance.
Relevant expenditure items relating to the construction and operation of Stage 2 of the proposed Northern Pipeline Interconnector, described in section 2, have been allocated to the relevant industry sectors used in input output tables. Only inter-industry purchases are identified as stimuli, as such wages and salaries are excluded.
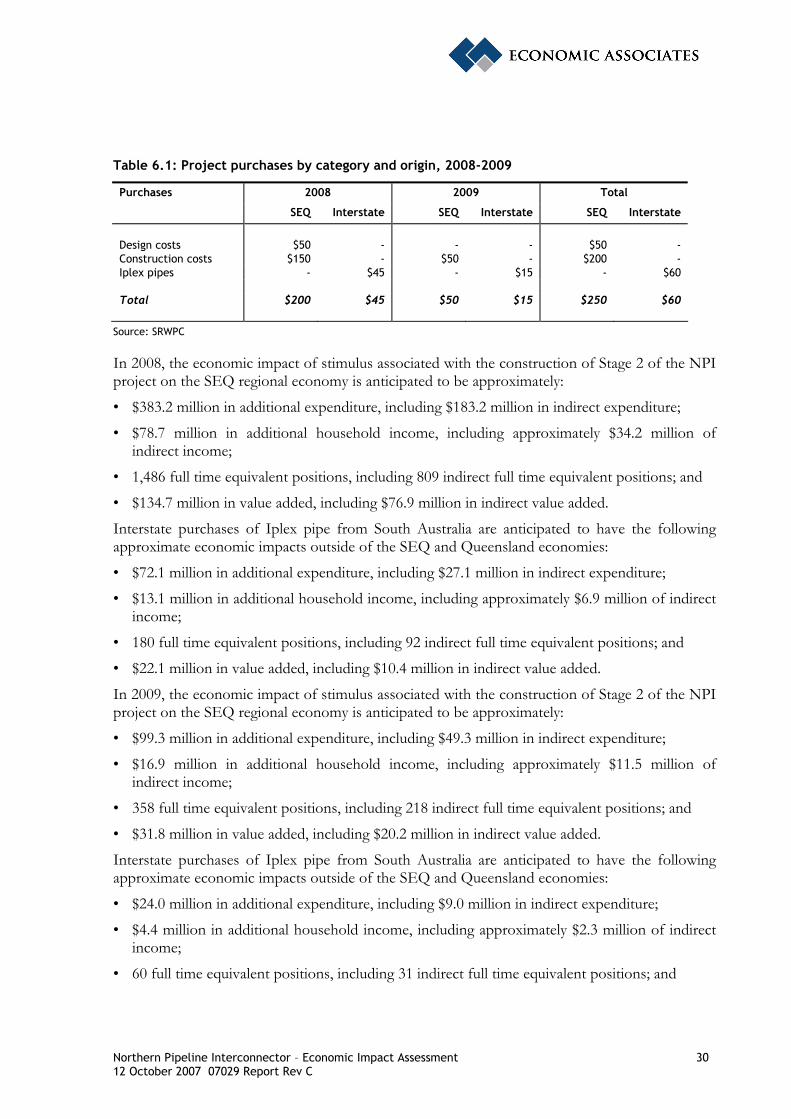
6.6.1 Analysis of Construction Impacts Table 6.1 below summarises the broad inter-industry purchases by origin to be made throughout the course of the project’s construction, as advised by the SRWPC. In 2008, project purchases are estimated to total $245 million, comprising:
• $50 million relating to technical design for Stage 2 of the NPI undertaken in SEQ;
• $150 million in construction costs (SEQ); and
• $45 million relating to the purchase of Iplex pipe from South Australia.
In 2009, project purchases are estimated to total $65 million, comprising:
• $50 million in construction costs (SEQ); and
• $15 million relating to the purchase of Iplex pipe from South Australia.
Table 6.1 below provides a summary of the major costs relating to construction of stage 2 of the NPI and the anticipated year of expenditure.
Northern Pipeline Interconnector – Economic Impact Assessment 30 12 October 2007 07029 Report Rev C
Table 6.1: Project purchases by category and origin, 2008-2009
Purchases 2008 2009 Total
SEQ Interstate SEQ Interstate SEQ Interstate
Design costs $50 - - - $50 - Construction costs $150 - $50 - $200 - Iplex pipes - $45 - $15 - $60 Total $200 $45 $50 $15 $250 $60
Source: SRWPC
In 2008, the economic impact of stimulus associated with the construction of Stage 2 of the NPI project on the SEQ regional economy is anticipated to be approximately:
• $383.2 million in additional expenditure, including $183.2 million in indirect expenditure;
• $78.7 million in additional household income, including approximately $34.2 million of indirect income;
• 1,486 full time equivalent positions, including 809 indirect full time equivalent positions; and
• $134.7 million in value added, including $76.9 million in indirect value added.
Interstate purchases of Iplex pipe from South Australia are anticipated to have the following approximate economic impacts outside of the SEQ and Queensland economies:
• $72.1 million in additional expenditure, including $27.1 million in indirect expenditure;
• $13.1 million in additional household income, including approximately $6.9 million of indirect income;
• 180 full time equivalent positions, including 92 indirect full time equivalent positions; and
• $22.1 million in value added, including $10.4 million in indirect value added.
In 2009, the economic impact of stimulus associated with the construction of Stage 2 of the NPI project on the SEQ regional economy is anticipated to be approximately:
• $99.3 million in additional expenditure, including $49.3 million in indirect expenditure;
• $16.9 million in additional household income, including approximately $11.5 million of indirect income;
• 358 full time equivalent positions, including 218 indirect full time equivalent positions; and
• $31.8 million in value added, including $20.2 million in indirect value added.
Interstate purchases of Iplex pipe from South Australia are anticipated to have the following approximate economic impacts outside of the SEQ and Queensland economies:
• $24.0 million in additional expenditure, including $9.0 million in indirect expenditure;
• $4.4 million in additional household income, including approximately $2.3 million of indirect income;
• 60 full time equivalent positions, including 31 indirect full time equivalent positions; and
Northern Pipeline Interconnector – Economic Impact Assessment 31 12 October 2007 07029 Report Rev C
• $7.4 million in value added, including $3.9 million in indirect value added.
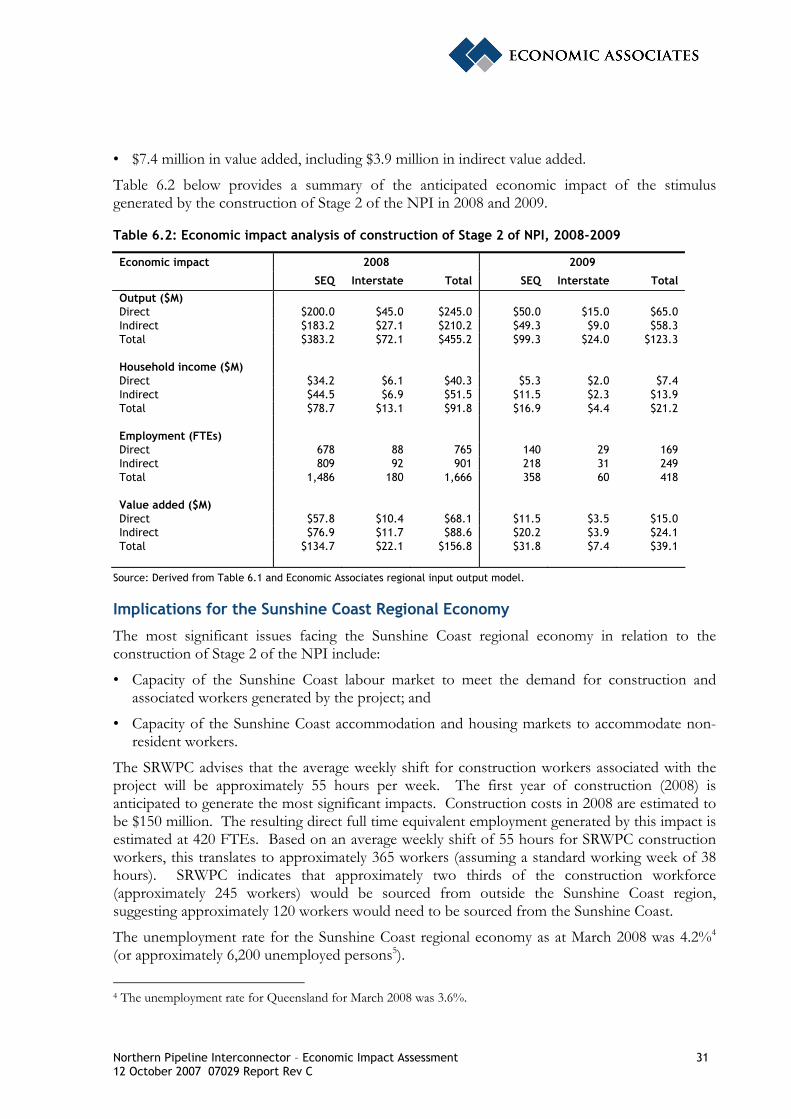
Table 6.2 below provides a summary of the anticipated economic impact of the stimulus generated by the construction of Stage 2 of the NPI in 2008 and 2009.
Table 6.2: Economic impact analysis of construction of Stage 2 of NPI, 2008-2009
Economic impact 2008 2009
SEQ Interstate Total SEQ Interstate Total Output ($M) Direct $200.0 $45.0 $245.0 $50.0 $15.0 $65.0 Indirect $183.2 $27.1 $210.2 $49.3 $9.0 $58.3 Total $383.2 $72.1 $455.2 $99.3 $24.0 $123.3 Household income ($M) Direct $34.2 $6.1 $40.3 $5.3 $2.0 $7.4 Indirect $44.5 $6.9 $51.5 $11.5 $2.3 $13.9 Total $78.7 $13.1 $91.8 $16.9 $4.4 $21.2 Employment (FTEs) Direct 678 88 765 140 29 169 Indirect 809 92 901 218 31 249 Total 1,486 180 1,666 358 60 418 Value added ($M) Direct $57.8 $10.4 $68.1 $11.5 $3.5 $15.0 Indirect $76.9 $11.7 $88.6 $20.2 $3.9 $24.1 Total $134.7 $22.1 $156.8 $31.8 $7.4 $39.1
Source: Derived from Table 6.1 and Economic Associates regional input output model.
Implications for the Sunshine Coast Regional Economy
The most significant issues facing the Sunshine Coast regional economy in relation to the construction of Stage 2 of the NPI include:
• Capacity of the Sunshine Coast labour market to meet the demand for construction and associated workers generated by the project; and
• Capacity of the Sunshine Coast accommodation and housing markets to accommodate non-resident workers.
The SRWPC advises that the average weekly shift for construction workers associated with the project will be approximately 55 hours per week. The first year of construction (2008) is anticipated to generate the most significant impacts. Construction costs in 2008 are estimated to be $150 million. The resulting direct full time equivalent employment generated by this impact is estimated at 420 FTEs. Based on an average weekly shift of 55 hours for SRWPC construction workers, this translates to approximately 365 workers (assuming a standard working week of 38 hours). SRWPC indicates that approximately two thirds of the construction workforce (approximately 245 workers) would be sourced from outside the Sunshine Coast region, suggesting approximately 120 workers would need to be sourced from the Sunshine Coast.
The unemployment rate for the Sunshine Coast regional economy as at March 2008 was 4.2%4 (or approximately 6,200 unemployed persons5).
4 The unemployment rate for Queensland for March 2008 was 3.6%.
Northern Pipeline Interconnector – Economic Impact Assessment 32 12 October 2007 07029 Report Rev C
It is unlikely that those persons currently unemployed would be directly employed during the construction phase of Stage 2 of the NPI. However, the movement of employed persons from their current industry of employment to the construction industry to pursue opportunities created by Stage 2 of the NPI would create lower skilled employment opportunities for those persons currently unemployed.
In 2008, the total employment impact of Stage 2 of the NPI is anticipated to be 1,486 full time equivalents. It is anticipated that a significant amount of this employment will be generated outside of the Sunshine Coast, but still within SEQ. Much of the employment impact is likely to be absorbed by the labour market in the form of over time, rather than the creation of new employment opportunities. It is anticipated however that some new employment opportunities would be created ‘at the margin’. For example, the project may increase the work program of small contractors such that it generates the need for an additional worker.
The transition of workers onto major construction projects on the Sunshine Coast, such as Stage 2 of the NPI, will require training of a number of prospective workers.
It is also important to note that the construction industry is a project based industry, in which businesses / contractors move from project to project. Therefore, it is possible that Stage 2 of the NPI may represent one of many projects already anticipated by businesses / contractors and as such may not create significant additional employment, or at least the employment impact may already have occurred in the process of gearing up for the NPI and other major projects anticipated to occur within the region.
As stated above approximately 245 non-resident workers may need to be accommodated on the Sunshine Coast in the first year of construction of Stage 2 of the NPI. An analysis of the commercial accommodation permanently available for letting on the Sunshine Coast throughout the year indicates that over the last three years the average number of vacant rooms / beds per night on the Sunshine Coast ranged from between:
• 2,018-3,039 hotel / motel rooms and serviced apartments;
• 1,010-1,805 caravan sites;
• 1,285-2,128 holiday flats, units and houses; and
• 178-357 hostel beds.
Based on the amount of vacancies described above it is likely that the Sunshine Coast commercial accommodation market has the capacity to accommodate the NPI’s non-resident workforce.
It is important to note that Stage 2 of the NPI is not the only major infrastructure project that may occur within the Sunshine Coast or northern SEQ over the next five years. Other major projects, including the Traveston Crossing Dam, upgrades of the Bruce Highway and Stage 1 of the NPI, are likely to put pressure on the Sunshine Coast and northern SEQ labour and accommodation markets.
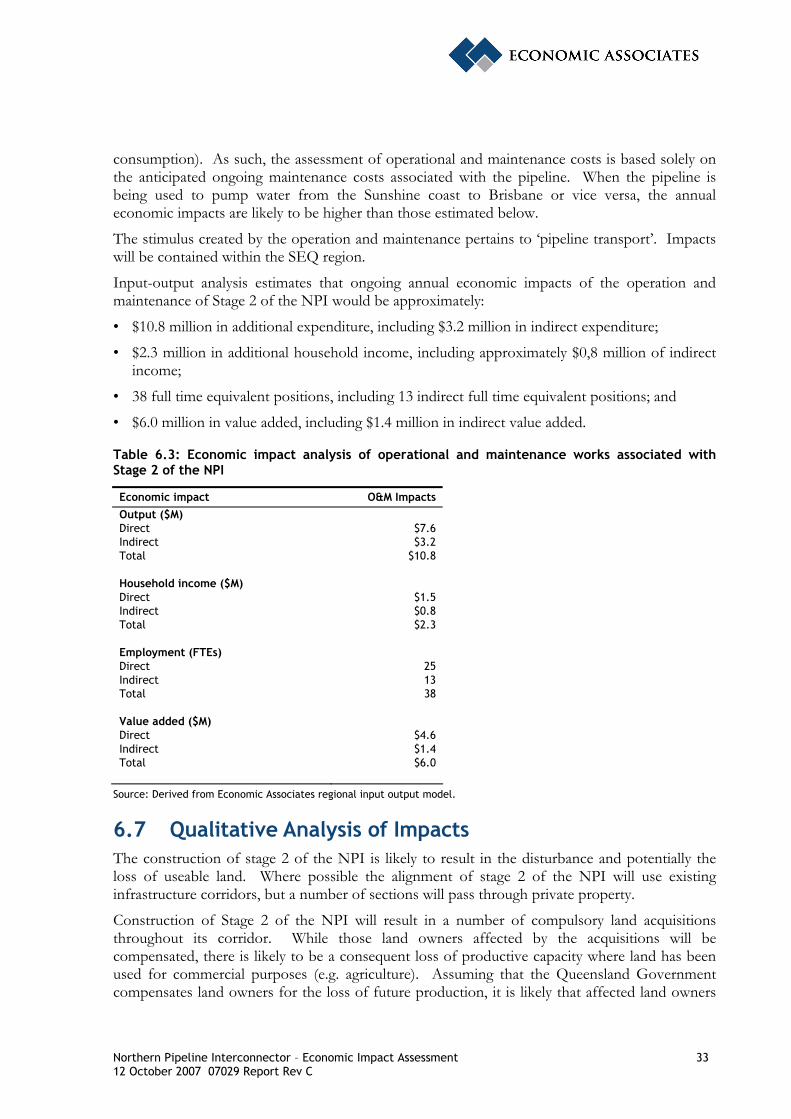
6.6.2 Analysis of Operational Impacts The SRWPC advise that the anticipated operational and maintenance costs of the Stage 2 of the NPI will be approximately $7.6 million per annum, excluding variable costs (primarily power
5 Number of employed persons rounded to the nearest 100 persons.
Northern Pipeline Interconnector – Economic Impact Assessment 33 12 October 2007 07029 Report Rev C
consumption). As such, the assessment of operational and maintenance costs is based solely on the anticipated ongoing maintenance costs associated with the pipeline. When the pipeline is being used to pump water from the Sunshine coast to Brisbane or vice versa, the annual economic impacts are likely to be higher than those estimated below.
The stimulus created by the operation and maintenance pertains to ‘pipeline transport’. Impacts will be contained within the SEQ region.
Input-output analysis estimates that ongoing annual economic impacts of the operation and maintenance of Stage 2 of the NPI would be approximately:
• $10.8 million in additional expenditure, including $3.2 million in indirect expenditure;
• $2.3 million in additional household income, including approximately $0,8 million of indirect income;
• 38 full time equivalent positions, including 13 indirect full time equivalent positions; and
• $6.0 million in value added, including $1.4 million in indirect value added.
Table 6.3: Economic impact analysis of operational and maintenance works associated with Stage 2 of the NPI
Economic impact O&M Impacts Output ($M) Direct $7.6 Indirect $3.2 Total $10.8 Household income ($M) Direct $1.5 Indirect $0.8 Total $2.3 Employment (FTEs) Direct 25 Indirect 13 Total 38 Value added ($M) Direct $4.6 Indirect $1.4 Total $6.0
Source: Derived from Economic Associates regional input output model.
6.7 Qualitative Analysis of Impacts The construction of stage 2 of the NPI is likely to result in the disturbance and potentially the loss of useable land. Where possible the alignment of stage 2 of the NPI will use existing infrastructure corridors, but a number of sections will pass through private property.
Construction of Stage 2 of the NPI will result in a number of compulsory land acquisitions throughout its corridor. While those land owners affected by the acquisitions will be compensated, there is likely to be a consequent loss of productive capacity where land has been used for commercial purposes (e.g. agriculture). Assuming that the Queensland Government compensates land owners for the loss of future production, it is likely that affected land owners
Northern Pipeline Interconnector – Economic Impact Assessment 34 12 October 2007 07029 Report Rev C
will not be adversely affected by the NPI project. However, the loss of land for commercial purposes may result in a net loss to the economy if the NPI does not utilise the land as efficiently as the previous commercial use and/or the compensation paid to affected land owners is not utilised for purposes at least as productive as those on the land to be resumed.
The issue of whether the NPI project represents an efficient allocation of resources is not the subject of this economic impact assessment. Efficiency in resource allocation is typically assessed using the cost benefit methodology, while the methodology used for this assessment only assesses the impact of the proposed project.
6.8 Implications for the Sunshine Coast Regional Economy The impact of the operation and maintenance of Stage 2 of the NPI is unlikely to be significant in the context of the Sunshine Coast regional economy. The SRWPC advise that workers associated with the operation and maintenance of Stage 2 of the NPI will be part of a larger water grid workforce, which will be responsible for maintaining all of SEQ’s water pipelines. Work crews are likely to rotate throughout SEQ to provide operational and maintenance support to various pipelines throughout the region.
At this stage it is unclear how many water grid workers will be based on the Sunshine Coast. However, it is unlikely that the number of workers located on the Sunshine Coast would be significant.
Northern Pipeline Interconnector – Economic Impact Assessment 35 12 October 2007 07029 Report Rev C
7 SUMMARY Construction of stage 2 of the NPI is likely to represent a major economic stimulus or ‘shock’ to the Sunshine Coast regional economy in 2008 and 2009. The project is expected to stimulate significant economic activity across SEQ, some of which would to occur on the Sunshine Coast.
Traditionally, construction works associated with large infrastructure projects are seen as generating major benefits for local communities in terms of increased employment and expenditure within the region. However, the Sunshine Coast, and Queensland more broadly, is experiencing a high level of labour force participation and employment. Given the scale of the proposed project and the generally strong economic conditions experienced on the Sunshine Coast, there may be some concern as to whether capacity constraints in terms of the availability of a skilled workforce may hamper project delivery or that the subject project may crowd out other projects in the development pipeline on the Sunshine Coast (or SEQ more generally).
An analysis of the prevailing regional economic conditions of the Sunshine Coast and SEQ and economic impact analysis of the construction of Stage 2 of the NPI indicate that Stage 2 of the NPI would not in itself represent a major burden to the Sunshine Coast and SEQ construction industry. However, the confluence of a number of major projects on the Sunshine Coast and in northern SEQ may put pressure on the regional labour and accommodation markets.
Northern Pipeline Interconnector – Economic Impact Assessment 36 12 October 2007 07029 Report Rev C
8 REFERENCES Australian Bureau of Statistics (1998) National Accounts: Input Output Tables 1996-97, Catalogue No. 5209.0, Canberra
Australian Bureau of Statistics (2002) Census of Population & Housing, Canberra
Australian Bureau of Statistics (2003 to 2007) Counts of Australian Businesses, including entries & exits, Catalogue No. 8165.0, Canberra
Australian Bureau of Statistics (2007) Census of Population & Housing, Canberra
Australian Bureau of Statistics (various years) Survey of Tourist Accommodation, Catalogue No. 8635.3.55.001, Canberra
Department of Employment and Workplace Relations (various years) Small Area Labour Market Statistics Department of Local Government & Planning (2006) PIFU LGA Population Projections by Age Cohort Office of Government Statistician (1998) Queensland Regional Input Output Tables 1996-97, Brisbane
Residential Tenancies Authority of Queensland (2007) Median Weekly Rents, Available at: http://www.rta.qld.gov.au/
SunROC (2005) Trends in the Sunshine Coast's GRP & Employment Challenge Update Property Data Solutions Live (various years) Sales and Median Sales Price, Available at: http://www.pdslive.com.au/