northern corridor monthly report
TRANSCRIPT

NORTHERN CORRIDOR MONTHLY REPORT
APRIL 2017
THEMATIC FOCUS THIS MONTH: STANDARD GAUGE RAIL
2 | P a g e
TABLE OF CONTENTS
TABLE OF FIGURES ............................................................................................................................... 3
1 SUMMARY ...................................................................................................................................... 4
2 STANDARD GAUGE RAILWAY (SGR) ........................................................................................... 6
3 PERFORMANCE OF INDICATORS FOR APRIL 2017 ................................................................... 8
3.1 MARITIME INDICATORS ....................................................................................................... 8
3.1.1 Vessel Turnaround Time .................................................................................................... 8
3.1.2 Vessel Waiting Time before Berth (hours) ........................................................................ 9
3.2 PORT INDICATORS ................................................................................................................. 9
3.2.1 Containerized Cargo Dwell Time.................................................................................. 9
3.2.2 One Stop Centre Clearance Time ................................................................................ 10
3.2.3 Time Taken at the Document Processing Centre (DPC) ........................................... 11
3.2.4 Delay after customs release ........................................................................................ 12
3.3 CORRIDOR INDICATORS ..................................................................................................... 12
3.3.1 Weighbridge Traffic .................................................................................................... 12
3.3.2 Weight Compliance at the Weighbridge .................................................................... 13
3.3.3 Transit Time ................................................................................................................. 14
3.4 CONTAINERS UPTAKE FROM THE PORT TO THE CFS .................................................... 15
3 | P a g e
TABLE OF FIGURES
Figure 1: Ship Turnaround Time (Hrs) ................................................................................................ 8
Figure 2: Vessel waiting time before Berth (hours) ........................................................................... 9
Figure 3: Containerised Cargo dwell time (Hours) ........................................................................... 10
Figure 4: One Stop Centre Clearance Time for Transit ..................................................................... 11
Figure 5: Time Taken at the Document Processing Centre (DPC) ................................................... 11
Figure 6: Delay after Custom Release ................................................................................................ 12
Figure 7: Monthly average daily traffic volume ................................................................................ 13
Figure 8: Weighbridge Compliance .................................................................................................... 13
Figure 9: Transit time from Mombasa to Malaba ............................................................................. 14
Figure 10: Average Transit from Mombasa to Busia ........................................................................ 14
Figure 11: Container Nomination at the Port of Mombasa .............................................................. 15
Figure 12: Monthly Container Deliveries to CFS .............................................................................. 15

4 | P a g e
1 SUMMARY
This report presents the status of progress achieved on various indicators that are used
to track the smooth flow of cargo and movement of traffic along the northern transport
corridor for the month of April 2017. Measuring these indicators gauges the
performance of the corridor and contributes to the identification of areas requiring
improvement and evaluation of the effectiveness of programs designed to improve
competitiveness of the corridor.
The objective of the Mombasa Port Community Charter is to establish a permanent
framework of collaboration that binds the port community to specific actions, collective
obligations, targets and timelines. In this regard, Northern Corridor Transit and
Transport Coordination Authority established the dashboard that tracks
implementation status of the charter with the aim of informing policy formulation and
enhancing efficiency of the maritime, port and corridor operations.
The Mombasa Port Community Charter commits both public and private sector to
undertake measures that will increase efficiency of the Port and the Northern Corridor.
Since the inception of the charter, there has been continuous implementation of
initiatives that were committed. Some of the commitments include:
Achieve 70% pre-entry of cargo handled by the Mombasa Port.
Achieve an average of 120,000 km per truck per annum by December 2016.
Transform Mombasa Port into a high performing landlord port by 2016
Grow cargo off take by rail to above 35% of throughput by December 2018.
The table below presents a snapshot on achievement for the month of April 2017. The
content of this report is also available online at http: top.ttcanc.org.
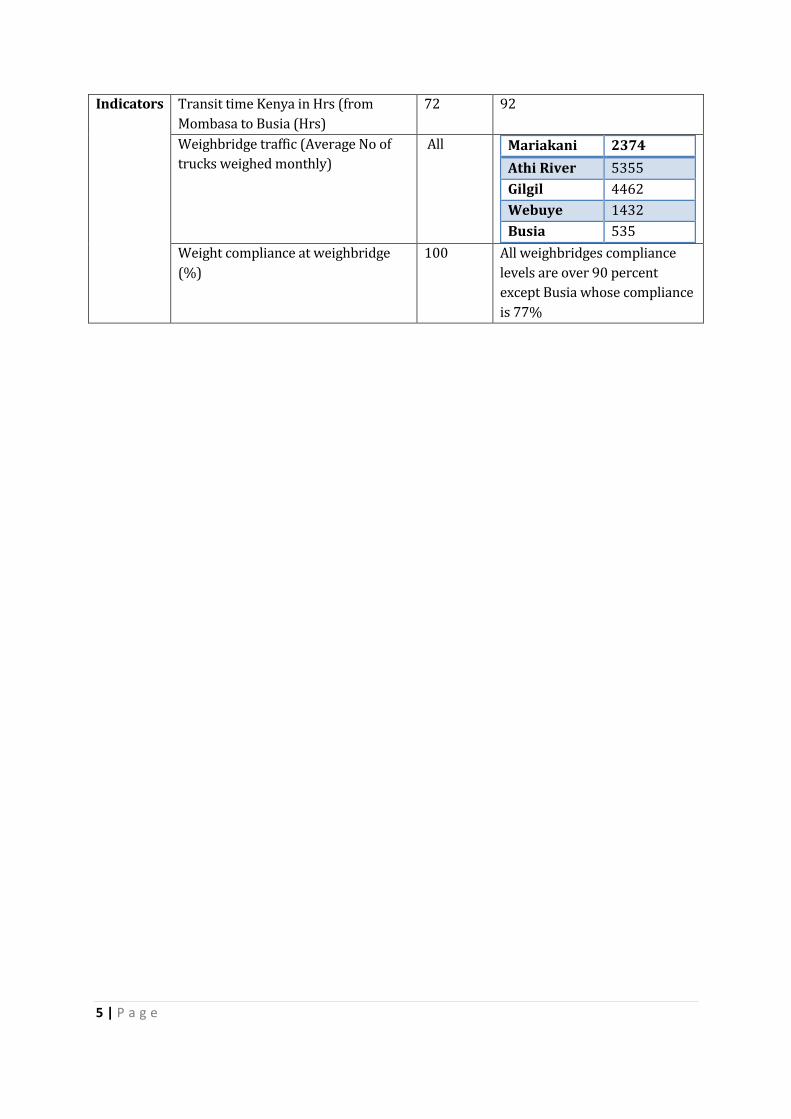
Table 1: Monthly status summary, April 2017
Category Indicator Target April 2017 Status/Progress
Maritime
Indicators
Vessel turnaround time (Hrs) 72 68.45
Gross waiting time before berth (Hrs) 24 11.61
Net waiting time before berth (Hrs) 24 10.83
Port
Indicators
Containerised Cargo Dwell time (Hrs) 72 86
One Stop Centre Time (Hrs) 24 39.8
After customs release (Hrs) 36 44
Document Processing Centre Time
(Hrs)
2 2.45
Corridor Transit time Kenya in Hrs (from
Mombasa to Malaba (Hrs)
72 107
5 | P a g e
Indicators Transit time Kenya in Hrs (from
Mombasa to Busia (Hrs)
72 92
Weighbridge traffic (Average No of
trucks weighed monthly)
All Mariakani 2374
Athi River 5355
Gilgil 4462
Webuye 1432
Busia 535
Weight compliance at weighbridge
(%)
100 All weighbridges compliance
levels are over 90 percent
except Busia whose compliance
is 77%

6 | P a g e
2 STANDARD GAUGE RAILWAY (SGR)
The Port of Mombasa is the busiest port in East Africa. It is a key transport hub for the
entire region, and is connected by road and rail to bordering hinterland countries. The
port handled more than 27 million dead weight tonnes of traffic in 2016. Cargo leaves
the port through the following transport modal channels: road, rail, inland waterways
and pipeline.
As at 2016, road transport mode is the dominant mode for the transport of both
passenger and freight traffic in Kenya, handling more than 90 percent of all freight
traffic (with rail handling less than 10 percent and the balance moved by petroleum
product pipeline). This represents a major shift from the 1970s, when rail handled the
majority of imported freight shipments. However, Standard Gauge Railway is expected
to attract increase in the share of cargo transported by rail.
According to the Northern Corridor Infrastructure Projects protocol, the SGR is
expected to link at least four countries of Uganda, Kenya, Rwanda and South Sudan. SGR
Project, with a total length of 471.65 km, is designed as a single track railway of diesel
traction with maximum speed of 120km/h for passenger service and 80km/h for freight
service. The completion from Mombasa to Nairobi of a route length of 472kms means
that the railway still has to turn through rift-valley all the way to Malaba before it can
link to Kampala. Delivering the first phase – Mombasa to Nairobi – of the SGR
represents a step to connect the entire Northern Corridor and ease movement of cargo.
Standard Gauge Railway for passenger and freight transportation from Mombasa to Nairobi launched by His Excellency Hon. Uhuru Kenyatta on May 31st 2017. In august 2017, the SGR will be used for freight services between Mombasa and Nairobi.
This service will operate alongside the existing metre gauge railway, which has

7 | P a g e
provided service between Mombasa, Nairobi and into Uganda, for decades. With the
operationalization of the SGR, the target of the port charter for growing cargo off take
by rail to above 35% of throughput by December 2018 may be realised. Kenya Ports
Authority (KPA) is expected to deliver 6,000,000 tons by Rail. Freight trains will
complete the journey in less than eight hours.
This will have an impact on the transport and logistics industry and calls for the
industry to re-adjust their business models to align themselves to industry trends. In
Particular, Shipping lines, the CFS operators, transporters, and cargo owners and all
other transport stakeholders will need to be alive to the dynamism of the industry.
In general, a lot can be achieved through political commitment and goodwill in
leadership as well as partnership and creation of synergies between public and private
sector to facilitate trade and foster economic growth.

8 | P a g e
3 PERFORMANCE OF INDICATORS FOR APRIL 2017
The discussion below gives status of the port charter indicators as at April 2017
comparing with the performance in previous years same month. The indicators vary
from maritime, port and corridor indicators. These indicators are part of over 31
indicators on the transports observatory portal. Measuring the performance of the port
is relevant for interaction with policy makers and other stakeholders. It also can assist
port development initiatives and contribute to the competitiveness of the port.
3.1 MARITIME INDICATORS
These indicators include container vessel movement from the arrival of the ship at the
port area, until exit of the vessel from the Port area. The report focuses on performance
of the container vessel movements (waiting time before berth and the average monthly
turnaround time) at the port of Mombasa in the month of April 2017.
3.1.1 Vessel Turnaround Time
This indicator is measured from the time the vessel arrives at the Port area (Fairway
Buoy) to the time it leaves the port area demarcated by the fairway buoy.
The average ship turnaround time in the port of Mombasa has significantly decreased
from 78.4 hours to 68.5 hours in March and April 2017 respectively shaving off 10
hours from its turnaround times. From figure 1 below it can be noted that the 3 days set
target has been attained. However, Mombasa port operators should consider a much
lower turnaround time for vessel in order to benchmark good productivity and
performance for its terminals. KPA has tried to address some of the barriers for instance
by construction of the second container terminal which was launched in September
2016, and has been seen to increase the port capacity by 550,000 Twenty Feet
Equivalent Units (TEUs) and its projected to further drive port efficiency.
Figure 1: Ship Turnaround Time (Hrs)
Source: KPA, data

9 | P a g e
3.1.2 Vessel Waiting Time before Berth (hours)
This time is measured from the time the vessel arrives at the fairway buoy to the time at its
first berth.
Figure 2: Vessel waiting time before Berth (hours)
Source: KPA, data
Figure 2 above shows that gross waiting time before berth was recorded as 11.61 hours
in April 2017 whereas the net waiting time before berth was 10.83 hours. Under the
port charter the main initiative for reducing waiting time was the conversion of berth
nos. 11–14 into container handling terminal that was expected to play a great role in
reducing the vessel waiting time. Currently designs have been done but to be fully
completed when Ground Investigation (GI) is finalized. GI is expected to be completed
by February 2017. In addition, a study on financial and Economic Viability is ongoing
and almost complete.
3.2 PORT INDICATORS
These indicators measure efficiency of the port by gauging how effective port operations
are in minimizing the time cargo spends at the port from the time of offloading.
3.2.1 Containerized Cargo Dwell Time
Refers to the total time spent by cargo at the port from when the cargo is discharged from
the vessel until it exits the port (average number of days the container stays in the yard).

10 | P a g e
Figure 3: Containerised Cargo dwell time (Hours)
Source: KPA data
Data obtained from Kenya Ports Authority (KPA) shows a fairly high level of performance
from 70 hours to 86 hours in March and April 2017 respectively. The performance is
considered worse off compared to March 2017 and it is still lies above the set target of 3
days (72hours). KPA, in collaboration with other stakeholders, was to achieve a dwell
time below 3 days (72 hours) within 120 days after signing the Port Community Charter
in June 2014. This performance was attributable to the challenges associated with the
introduction of Single Customs Territory for the transit containers caused by lack of full
integration between ASYCUDA++, SIMBA and KWATOS which resulted in a large
proportion of transit containers being cleared manually.
However, when compared with the previous year’s same month it is discernible that
performance has improved greatly decreasing from 113 hours in 2015 to 86 hours in
2017 same month.
This trend can only be improved if policy measures and interventions in place as
enshrined under the port charter are fully implemented. In addition, harmonizing the free
period time with the cargo dwell time target will also see an improvement in this target.
3.2.2 One Stop Centre Clearance Time
One Stop Centre Clearance Time measures the average time between passing of customs
entry after its registration and issuance of a release order.
Figure 4 shows that performance in time taken at the one stop centre. Clearance time
and one stop centre deteriorated from 38.9 hours in March to 39.8 hours in April 2017.
The target of 24 hour has still not been met which can be attributed to the challenges
such as last minute changes to import documents by importers, cases of some cargo
interveners not being present at their duty stations and delays in physical verification
and inspection of the cargo. Therefore, all agencies involved are expected to take the
lead role in their respective clearance stages to achieve a target of 24 hours. Conducting

11 | P a g e
joint verification and verification of transit cargo to be made at the countries of
destination will also go a long way in attaining the target.
Figure 4: One Stop Centre Clearance Time for Transit
Source: KRA data
3.2.3 Time Taken at the Document Processing Centre (DPC)
This is the time it takes to have an entry lodged by a clearing agent passed by Customs.
The time at DPC has an effect on port dwell time though minimal.
Figure 5: Time Taken at the Document Processing Centre (DPC)
Source: KRA data
From figure 5 above, DPC time for transit cargo significantly increased from 1.9 hours in
March to 2.5 hours in April 2017. However, this performance is beyond the set target of
one hour. Any further delays above the 1 hours benchmark in documentation implies a
rise in logistical cost hence a rise in commodity prices.
The low performance can be attributable to the SIMBA system stability during the
period, document volumes awaiting processing in between the shifts among others.
Initiatives to improve DPC time include on the spot approval of manifest, allowing
partial manifest and simultaneous online submission of manifest. Furthermore, KRA’s
commitment was to establish a system of pre-arrival clearance to clear 70% of the cargo
within a span of 48 hours before docking of vessels, within 3 months after the charter
signing.

12 | P a g e
3.2.4 Delay after customs release
Delay after customs release refers to the period it takes to evacuate the cargo from the
port after it is officially released by Customs.
Figure 6: Delay after Custom Release
Source: KRA, data
Time taken after customs have issued the transporter with a release order form
authorizing their exit, was recorded as 44 hours in April a significant increase from 34
hours in March 2017 as shown in figure 6 above. The response time is still high
compared to the 36 hour target. Failing to reach this target will continue to affect the
port dwell time for transit cargo.
The Clearing Agents should closely collaborate with the cargo owners and the
transporters to expedite cargo offtake from the Port. Furthermore, the owners of cargo
should be sensitized about their responsibility towards minimizing delays and
demurrage/storage charges at the Port.
3.3 CORRIDOR INDICATORS
Corridor Indicators cover the period from the time goods are released up to exit at the
border. The indicators of interest are compliance levels at weighbridges, volume of
traffic and transit time from the port to the borders.
3.3.1 Weighbridge Traffic
This refers to the number of trucks crossing the weighbridges. The indicator measures the
average number of trucks weighed per day at the various weighbridges in Kenya.
Weighbridges protect the roads and bridges along the corridor from overloaded vehicles.
Kenya National Highways Authority (KeNHA) installed High Speed Weigh in Motion
(HSWIM) systems at Mariakani, Athi River, Gilgil and Webuye on one side of the road.
Currently progress in construction of a second weighing point at Mariakani and Athi River
HSWIM is at 86% and 85% respectively.

13 | P a g e
Figure 7 below shows that on average Athi River registered the highest number of traffic
weighed followed by Gilgil and Mariakani. Comparing with the previous month, all
weighbridges showed a mixed reaction on the traffic volumes weighed. The high traffic
weighed at Athi River might be due to cargo that are originating from Nairobi and its
environs being the capital City and the main business hub in the Country. Busia
weighbridge on the other hand registered the least average daily traffic.
Figure 7: Monthly average daily traffic volume
Source: KeNHA, data
3.3.2 Weight Compliance at the Weighbridge
Weight compliance measures the percentage of trucks that comply with the vehicle load
limits before and after re-distribution of the weights.
Figure 8 shows that only Busia weighbridge registered a compliance level of below the
90% level for the month under review. Low compliance at the Busia weighbridge could be
attributed to the weighbridge not implementing the high speed weigh –in- motion and
being the first weighbridge for most good originating from some Kenya other than the
port. In general, all the trucks weighed should achieve a target of 100% compliance.
Figure 8: Weighbridge Compliance
Source: KeNHA, data

14 | P a g e
3.3.3 Transit Time
Transit time in Kenya is an estimate of the period from the time cargo is removed from
the port of Mombasa to the time the export certificate is issued after crossing the border
at Malaba or Busia.
Transit time from Mombasa to Malaba has averagely decreased from 137 hours in 2016
to 107 hours in 2017 in the months of April. In general, it’s indicative that it still takes
longer to transport cargo through Malaba since the target of 3 days has not been
achieved.
Figure 9: Transit time from Mombasa to Malaba
Source: KRA data
As shown in figure 10 below transit time from Mombasa to Busia (947 Km) indicates a
similar trend over the same period showing a significant decrease from 193 hours to 92
hours respectively. In general, transit time is still beyond the expected 72 hours.
Therefore, activities geared towards attaining this key performance indicator should be
implemented to the latter.
Figure 10: Average Transit from Mombasa to Busia
Source: KRA data

15 | P a g e
3.4 CONTAINERS UPTAKE FROM THE PORT TO THE CFS
Container Freight Stations (CFSs) are an extension of the port and are privately
managed. CFSs have continued to play a key role in facilitation of storage of cargo prior
to clearance through customs. Decongestion of the port of Mombasa enormously
depends on the efficient cargo pick up from the Port by CFS’s and efficient cargo
clearance process at the CFS’s. Cargo to the CFSs is either client nominated or KPA
nominated. According to the Port Charter policy commitment, where 70% pre-clearance
of goods prior to arrival of vessels is targeted, goods should not overstay at CFSs unless
CFS’s are also specialized to be used as Warehouses for Shippers. The time taken for
import pickup and customs release at CFS’s should be comparable with that of the Port.
Figure 11 provides a summary of container nomination at the port. It is clearly
evidenced that most of the containers received at the port are client nominated
representing 85 percent.
Figure 11: Container Nomination at the Port of Mombasa
Figure 12: Monthly Container Deliveries to CFS
Source: KPA, data
The summary presented above reflects only 13 out of 24 CFSs registered under the
CFSAs and KPA policies. The data is transmitted by KPA to various stakeholders, and
only accounts for approximately 20% of the total cargo handled by the CFSs. The
remaining 80% are not submitted to the KPA system as they are private and individual

16 | P a g e
businesses. There is need to bring all the 24 CFSs on board to transmit their data to KPA
in order to give the overall picture of Port operation and efficiency.