northern arizona university final report: telecom energy solutions
TRANSCRIPT

Final Written Report
Submitted to:
U.S. Department of Energy
Submitted toward fulfillment of the 2016 Collegiate Wind Competition
Due: May 1st, 2016
Submitted: April 30th, 2016
From:
Northern Arizona University Collegiate Wind Competition Team
Flagstaff, AZ 86011
Principal Investigator: Karin Wadsack ([email protected]) NAU Student Team Lead: Michael Wertz ([email protected])
Team comprised of:
3 Faculty Mentors
18 Undergraduate Engineering Students 16 Undergraduate Business Students

Engineering Team Members
Last First Major
Alkandari Anas ME
Allen Randon EE
Alramadhan Hashim ME
Bauer Jessica ME
Ceniceros Nathan ME
Clark Norman ME
Cook Jeremy ME
Evans Michael EE
Holaas Korey EE
Melton James ME
Muente Scott ME
Pellerin Brock EE
Richard Tyler ME
Robinson Jess EE
Sabol Zachary EE
Schatz Ryan ME
Wertz Michael ME
Worrell Brayden EE
Business Team Members
Last First
Alajlan Budur
Baxter Luke
Begay Thomas
Bryniarski Randall
Campbell Connor
Carneal Heather
Coil Michael
Deheer Nathan
DeSerio Adam
Grizzle Dakota
Lambright Carl
Lyndsay Kyle
McWhirter Nathan
Rittenhouse Heather
Skorich Blake
Thompson Kyle
Technical Advisors
Photo/Videographer
Sponsors
Last First
Acker Tom
Chopin Marc
Taylor Ross
Wadsack Karin
Willy David
Yaramasu Venkata
Last First
Kirkov Kiril
Institution Name
U.S. Department of Energy
National Renewable Energy Laboratory
Northern Arizona University
NovaKintetics AeroSystems
Table of Contents Executive Summary ....................................................................................................................................... 5 1 Business Plan ........................................................................................................................................ 6
1.1 Business Overview ........................................................................................................................ 6 1.2 Market Opportunity ...................................................................................................................... 6
Direct Competitors ................................................................................................................ 6 Significant Competitors ......................................................................................................... 6 Value Proposition .................................................................................................................. 6 Carbon Tax in India................................................................................................................ 7 Target Companies ................................................................................................................. 7 Pricing .................................................................................................................................... 7 Levelized Cost of Energy ....................................................................................................... 8 Standards in Wind ................................................................................................................. 8 Key Success Factors ............................................................................................................... 8
Barriers to Entry .................................................................................................................... 9 Intellectual Property ............................................................................................................. 9
1.3 Management Team ....................................................................................................................... 9 1.4 Deployment and Operations ....................................................................................................... 10
Business Model ................................................................................................................... 10 Partnerships ........................................................................................................................ 10 Turbine Design Compatibility with Target Market.............................................................. 10 Business Risks ...................................................................................................................... 11

3
1.5 Financial Analysis ........................................................................................................................ 11 2 Technical Design ................................................................................................................................. 12
2.1 Design Objective ......................................................................................................................... 12 2.2 Final Designs ............................................................................................................................... 13 2.3 Static Performance Analysis ........................................................................................................ 14
Blade Design ........................................................................................................................ 14 Generator Selection ............................................................................................................ 16
2.4 Stress/Load Analysis.................................................................................................................... 17 Blade FEA ............................................................................................................................ 17 Interface FEA ....................................................................................................................... 18 Hub FEA ............................................................................................................................... 18 Expected loads and FOS Summary ...................................................................................... 19
2.5 Electrical Analysis ........................................................................................................................ 20 Rectifier ............................................................................................................................... 20 DC-DC Converter ................................................................................................................. 21
2.6 Control Model Analysis ............................................................................................................... 21 Control State Definition ...................................................................................................... 21 Control Model Design ......................................................................................................... 22
2.7 Documentation of Software ....................................................................................................... 22 Control Model Program ...................................................................................................... 22 Bonus Load Program ........................................................................................................... 22 Initial Blade Design (BEM) ................................................................................................... 22
2.8 Results of Testing ........................................................................................................................ 22 Generator ............................................................................................................................ 22 Brakes .................................................................................................................................. 23 Control Program .................................................................................................................. 24 DC-DC Converter ................................................................................................................. 24 Blades .................................................................................................................................. 25
2.9 Engineering Diagrams ................................................................................................................. 25 Rectifier Schematic ............................................................................................................. 25 DC-DC Converter Schematic................................................................................................ 26 AC & DC Brake Schematic ................................................................................................... 26
3 Deployment Strategy.......................................................................................................................... 27 3.1 Identify Site and Dataset ............................................................................................................. 27
Stakeholder Identification and Communication ................................................................. 28 3.2 Timeline & Lifecycle .................................................................................................................... 29 3.3 Installation and Maintenance ..................................................................................................... 29
Installation .......................................................................................................................... 29 Maintenance ....................................................................................................................... 30
3.4 Reliability and risk management ................................................................................................. 30 Electrical Reliability ............................................................................................................. 30 Mechanical Reliability ......................................................................................................... 31 Financial Reliability ............................................................................................................. 31
4 References .......................................................................................................................................... 32 Appendix A - Business Financials ................................................................................................................ 34 Appendix B – Engineering Diagrams ........................................................................................................... 36

4
Table of Figures Figure 1-1: 4 Major Indian Telecom Tower Companies & # of Owned Towers ............................................ 7 Figure 1-2: TES company structure and management roles ......................................................................... 9 Figure 1-3: Initial Company Responsibility Breakdown .............................................................................. 10 Figure 2-1: Final Designs ............................................................................................................................. 13 Figure 2-2: De-rated Power Curves w/ Control States ................................................................................ 16 Figure 2-3: Coefficient of Power Curves at Different Wind Speeds ............................................................ 16 Figure 2-4: Blade FEA Results ...................................................................................................................... 17 Figure 2-5: Interface FEA Results ................................................................................................................ 18 Figure 2-6: Hub FEA results ......................................................................................................................... 19 Figure 2-7: Rectifier DC Output Without a Capacitor ................................................................................. 20 Figure 2-8: Dynamometer test of SunnySky ............................................................................................... 23 Figure 2-9: Brake Prototypes ...................................................................................................................... 23 Figure 2-10: Rectifier Schematic ................................................................................................................. 26 Figure 2-11: DC-DC Converter Schematic ................................................................................................... 26 Figure 2-12: Brake Used for Turbine Shutdown ......................................................................................... 27 Figure 3-1: India Wind Power Density Map (W/sq. m) [15] ....................................................................... 28 Figure 3-2: Deployment Timeline ............................................................................................................... 29 Figure 2-8: Control State Flow Chart........................................................................................................... 39
Table of Tables Table 1-1: Cost Comparison between Diesel Generator & TES's Wind Turbine ........................................... 8 Table 2-1: NAU design constraints/considerations .................................................................................... 13 Table 2-2: Final Design Theoretical Properties ........................................................................................... 14 Table 2-3: Reynolds Number Operation Ranges for Each Turbine ............................................................. 14 Table 2-4: Tunnel Blade Design Properties (TSR – 4 Max 𝐶𝑝 – 0.32) ......................................................... 15 Table 2-5: Deployment Blade Design Properties (TSR – 6, Max 𝐶𝑝 – 0.42)................................................ 15 Table 2-6: Resistive torque requirements at 95% confidence .................................................................... 17 Table 2-7: Tunnel Turbine expected loads and FOS at 24 m/s winds ......................................................... 19 Table 2-8: Deployment Turbine expected loads and FOS at 25 m/s winds ................................................ 20 Table 2-9: Rectifier Input and Output Voltages .......................................................................................... 20 Table 2-10: DC-DC Converter Simulation Results ....................................................................................... 21 Table 2-11: Open Circuit Brake System Test Results .................................................................................. 24 Table 2-12: Boost Converter Bench Test Results ....................................................................................... 25

5
Executive Summary Telecom Energy Solutions (TES) has identified a targeted market for the development and operations of their small scale wind turbine. The identified market was the telecommunication industry in India, where currently 400,000 telecommunication towers are in service, with an expected 3% annual increase. To maintain the electrical demanded of the telecommunication industry (2.5kW/h), diesel generators are used. To compete with the diesel generators, TES has performed a cost comparison over 10 years to see if the wind turbine is a liable solution. From this cost comparison, it was determined that the diesel generator would cost the company an estimated $86,724.00 whereas the turbine would only cost $10,000. From the financial analysis it is seen that the TES turbine can indeed compete with the diesel generator, in terms of pricing. From the identified market, a deployment turbine was designed to meet the specified power needed. To meet the power needed a wind resource assessment was performed. The implementation of the wind resource assessment allowed an understanding of the wind speeds seen at the telecom sites. From this information, a marketable wind turbine was created and produced 4 kW at a wind speed of 11 m/s. To solidify the marketable turbine design, a proof of concept was implemented by creating a scaled down version. The proof of concept (tunnel turbine) used a scale factor of 1/10 and 1/6 for the length of the blade (span) and width of the blade (chord) respectively. These scale factors kept the two turbines linked mathematically and allowed for preliminary testing. A wind tunnel test was then implemented and showed that the tunnel turbine was capable of reaching 23 W at 11m/s. The validation of working turbines has allowed TES to further develop a deployment strategy for the telecommunication industry. The steps that have been established are as follow: identification of the telecom consumer, sell turbine by underlying key opportunities, begin manufacturing of main turbine components, pre-assemble priority components (generator and yaw), ship to consumer and begin installation.

6
1 Business Plan
1.1 Business Overview Telecom Energy Solutions Inc. (TES) offers small wind turbines to provide a more reliable, clean source of energy to telecommunication towers. The small wind industry is growing internationally, with an increase in interest aiming to provide more efficient and earth-friendly energy solutions [1]. TES provides wind turbines that are attached to telecom towers in order to generate electricity for the tower and decrease the need for costly, polluting diesel fuel. TES has determined that India will be our first target market. India’s telecom industry is growing at a very rapid pace. The telecom towers have very unreliable connections to the power grid so they have to have a backup power sources in order to provide continuous reliable cell service to their customers. Also, India has passed regulations that require the telecom tower operators to greatly decrease their emissions [2]. TES will initially partner with GTL, a telecom tower maintenance company, and will work into the market through offering proof-of-concept test turbines in exchange for contracts to purchase. Overall, it is TES’s vision to offer a power source to India’s telecom towers that is lower cost than diesel generation, reliable over the long term, and friendlier with the environment.
1.2 Market Opportunity TES has determined that India will be the first target market. There are over 400,000 telecom towers currently installed, and that number is expected to grow by 3% annually [3]. It is estimated that 80% to 90% of these turbines are on grid and the telecom towers that are connected to the grid have unreliable connections [4]. Thus the towers have to have a backup power source in order to continue providing cell service to their customers. Diesel generators are used to fill this role, but produce harmful emissions. It is also estimated that as much as 80% of the diesel fuel is stolen out of the generators before it is even used by the towers [5]. In addition, India has passed regulations that require the telecom towers to greatly decrease their emissions produced by these generators [2]. Wind turbines provide an excellent solution for these problems. As such, TES has determined that we will establish our first office in Mumbai, India because it has the most streamlined governmental regulations for starting a new business in India.
Direct Competitors Xzeres is a direct competitor of TES. They own the Skystream 3.7, an off-grid small-wind turbine that can power telecommunication towers. The Skystream systems are located in Australia, Africa, Europe, Asia and North America. Xzeres sells and installs the Skystream turbines directly to customers through physical stores and online [6]. Their turbines are estimated to cost between $17,000 and $20,000 per unit (turbine and installed cost). In comparison, TES will offer our product at $4,000, which will be much less expensive for customers.
Significant Competitors Whisper, Bergey Wind Power, Windside, and Aeolos Wind Turbines are all potential significant competitors in the small wind industry. They all offer products that can easily be fitted to power telecom towers. In addition, they all have an international presence.
Value Proposition TES’s offer of reliable, renewable energy for the telecom industry stands apart from the competition because we are working with telecom maintenance companies who already have a trusted relationship with the tower companies. TES’s turbines are a low-cost solution for the telecom companies. It is

7
estimated that these companies spend over $1.5 billion per year in diesel fuel. There is also a significant, and recently increasing, tax on top of the base cost of diesel fuel. To break into the market we are providing five wind turbines to our potential partner companies for proof of concept before they have to purchase the turbines. TES’s turbines also have many technical factors that set them apart from the competition. The yaw system has a vibration isolator that makes the whole turbine more stable, especially in high wind speeds, and prevents damage to towers. The blades have a high in-board angle of twist that allows for low cut-in wind speed. Also, the turbine has a coefficient of performance (Cp) of 0.42 at rated wind speeds that allows for extremely efficient power generation. Lastly, the braking system stops the turbine from producing power when necessary to reduce potential operational issues at very high wind speeds. A tail furling is also included into the design to increase high wind speed survivability (see Section 2).
Carbon Tax in India Because the turbine converts the wind’s kinetic energy into electrical power, this product produces ‘green’ energy, emitting no pollution and using no water. The use of wind energy will reduce carbon dioxide emissions for the telecom tower owners. As the typical Indian telecom tower runs a generator an average of 10 hours/day, it uses 24 liters of fuel in a day. In a year, this results in 8,760 liters of fuel being consumed, amounting to approximately 23 tons of CO2 [7]. India does not currently have an official carbon tax, but plans to institute one in its signed commitment for the United Nations Paris Accords climate agreement in December 2015. In its commitment, India suggested that a reasonable carbon tax would be $35/ton, but argued that it already has an “implicit” carbon tax of $64/ton on diesel fuel due to high Value-Added Taxes. India has gone from having heavy government subsidies for diesel fuel to having high taxation on fuel, in part as an environmental strategy. At a $35/ton tax rate for carbon, the annual tax, assuming running a diesel generator for an average of ten hours a day, would be $805 per tower. In a year, across the entire Indian telecom industry, this works out to $201,125,000 that would be spent on carbon taxes alone, not including the base cost of the diesel itself. Implementation of a wind turbine will significantly decrease the cost of having to keep diesel generators fueled and reduce the expenditures on carbon taxes. It will also protect the tower owners against the risk of future increases in carbon taxes as India strives to meet its national and international environmental commitments.
Target Companies TES plans on using the partnership with GTL to target the four companies that own telecom towers. These companies have a combined 154,000 towers that can benefit from wind turbine power (Figure 1-1). Most of these towers are currently connected to the unreliable grid in India with backup diesel generators.
Figure 1-1: 4 Major Indian Telecom Tower Companies & # of Owned Towers
Pricing TES will offer the wind turbine at $4,000 uninstalled. This is an attractive offer for the telecom towers because they will greatly decrease their need for costly diesel fuel. As stated above, it is estimated that
Indus
•80,000
Reliance Infartel
•31,000
QTIL
•23,000
Bharti Infratel
•20,0000

8
telecom companies spend over $1.5 billion a year on diesel fuel for telecom towers plus the heavy diesel fuel tax. Our competition, Xzeres, estimates that the cost of installing and purchasing their wind turbine is between $17,000 and $20,000. Our product is estimated to be much less in cost to the telecom towers with the turbine and installation.
Levelized Cost of Energy As mentioned, telecom towers in India generally run on generators, using them on average for a total of about 10 hours a day. These generators use 2.4 liters of diesel fuel an hour to make electricity. The current price of diesel fuel in India is $0.80/liter. Assuming a 3kW generator is using 2.4 liters of fuel per hour to make 3 kWh of electricity, the cost per kWh is $0.64. The sale price of the turbine is $4000. We are estimating the average labor, materials and logistics of installation at a cost of $1200, which we believe is a high estimate. We have calculated the lifetime maintenance of the turbine to be $4800. This assumes a day of labor a month for a technician to check the tower during a regular fueling visit, which is a conservative approach, and uses the average annual materials costs for maintenance for a turbine of this size according to the United States National Renewable Energy Laboratory [8]. Thus, the total lifetime system cost to our customer is $10,000. Using the System Advisory Model (SAM), specifications for our turbine, and wind data from near Mumbai, India, we calculated our annual expected generation to be 9760 kWh and a resulting levelized cost of energy of $0.0642. This model accounts for some degradation of the turbine, as the simple “cost per kWh” shown below by dividing the turbine performance by lifetime costs yields a per-kWh cost of $0.0512. Table 1-1 below outlines these values.
Table 1-1: Cost Comparison between Diesel Generator & TES's Wind Turbine
Diesel Wind turbine
Cost per liter $0.80 Sale cost $4,000
Liters of fuel/hour 2.4 Lifetime annual maintenance $4,800
Kwh/hour 3 Installation $1,200
Cost per kWh $0.6400 Total lifetime cost $10,000
Annual kWh 9760
Cost per kWh 0.0512
Cost per kWh calculated by SAM 0.0642
Standards in Wind There are internationally accepted standards, the IEC 61400-2, that regulate the size, safety, reliability, power performance, and sound levels of small wind turbines. Tests must be run to determine that the wind turbine will meet all of these regulations and an accredited certification must be awarded in order to operate in the small wind industry [2]. However, this certification is not required to sell turbines in India. We will begin selling our turbine in India submitting it for review and certification. We are seeking this certification in order to gain more trust in the Indian wind market.
Key Success Factors There are several factors that make companies in the wind industry successful. Firstly, companies have to be able to successfully negotiate with regulatory agencies in the countries in which they have turbines. In most countries, the wind industry is highly regulated and companies need to be able to negotiate or comply with the regulations. However, this is favorable to TES because the regulations in India are not very strict. Secondly, companies have to pass on any increases in cost to their customers. The capital investments in this industry are relatively high so it is important that businesses pass on any extra costs to their customers so they do not lose their margins. We will combat this barrier by

9
controlling our costs through manufacturing in China to keep our part cost low. Thirdly, turbines should operate at the full capacity as much as they can. Wind turbines only generate energy when wind is available, so it is important that idle time is minimized as much as possible. TES’s turbine will interface directly with the battery energy storage system on the telecom tower, offsetting the need for diesel fuel whenever the wind is not blowing. Lastly, the debt and profit management is extremely important in this industry. Because it takes a very large amount of capital to build wind turbines it is important that the debt accumulated and borrowing interest rates are tightly managed [4]. TES will pay very close attention to the cash flows to ensure that the available funds are managed well.
Barriers to Entry This industry has very high barriers to entry. There is a high initial cost when producing wind turbines. The turbines themselves are very expensive to produce and companies typically produce, at least in the beginning of the business, their turbines before they have payment from their customers. TES will be producing five turbines that will be given to a telecom company for proof of concept with the condition that if after three months the turbines are successful then they will purchase the five turbines and 100 more in the first year. In addition, there is a very large amount of expertise needed when entering this industry. TES will have two full time engineers once the operations begin to continue with the product development. This will allow our product to continue to improve. These are the biggest barriers to entry in the wind industry.
Intellectual Property TES has decided not to file for a patent because of the lack of enforcement of patents in India. The US Chamber of Commerce’s Global Intellectual Property Center released an International Intellectual Property Index in 2012 and 2014 wherein India was the worst of twenty-five countries for enforcing intellectual property.
1.3 Management Team Figure 1-2 shows the breakdown of the planned company structure. Beginning Organization Future Organization
Figure 1-2: TES company structure and management roles
Initially, TES will have a board of advisors made up of individuals with legal, international business, and small wind industry expertise. The lead engineer, a Professional Engineer, will report to the Board of Advisors and oversee the activity of the 2nd Engineer and the Development and Operations Manager.
Board of Advisors
2nd Engineer
Turbine Assembly Staff
Development and Operations
Manager
Sales Representitives
Lead Engineer
Board of Advisors
CEO
Development and Operations
Manager
Sales Representitives
CFO
Accountants
Chief Engineer
Engineers
Turbine Assembly Staff

10
The 2nd Engineer will be in charge of overseeing the Turbine Assembly Staff to ensure that the turbines have a high quality of assembly. The Development and Operations manager will be in charge of TES’s growth and expansion. This manager will also oversee the Sales Representatives, who will be working directly with current and potential customers. The 2nd Engineer and the Development and Operations Manager will visit China on a rotating basis to ensure that the manufacturing is being performed at the highest quality.
1.4 Deployment and Operations
Business Model TES will outsource the manufacturing of the wind turbine parts to China. These parts will then be shipped to India where they will be assembled by our assembly team. As mentioned above, TES will initially partner with GTL, but will also target a number of other telecom tower maintenance companies. By partnering with GTL, we will be able to gain access into a market that is difficult to get into. They have built a trust relationship with the tower owners and they know more about the actual telecom towers themselves, making them the perfect company to partner with. GTL will be doing the installing of the turbines, as well as the maintenance. TES will receive $4,000 per wind turbine, depending on the company sold to as stated above, and GTL will charge the customers for the installation cost.
Figure 1-3: Initial Company Responsibility Breakdown
Partnerships TES will partner with Indian telecom maintenance companies or telecom tower companies. These companies will not only serve as initial customers, but they will provide their employees to attend training at our facility to learn how to perform installation and maintenance for the turbine. Strong partnership with our clients will enable us to troubleshoot installations and streamline processes. The tower maintenance companies and owners have an incentive to provide quality installations and to alert us to any issues that arise. We will provide technical support and seek their advice on system design improvements. Potential future partners include emerging battery technology companies, such as Fluidics, which is a company based in Phoenix, Arizona. This would be a partnership leveraged to help supply stored energy from the wind turbine in the event that TES wants to expand its business model to supply more of the whole energy system.
Turbine Design Compatibility with Target Market The installation will utilize a pulley system for lifting the wind turbine to the telecom tower, significantly minimizing installation costs. This strategy works well for the target market because using cranes is logistically and cost prohibitive. In addition, using trained partners takes advantage of the low cost of

11
labor and the incentive mentioned above to perform a high quality installation. The telecom tower must be able to withstand additional loads from the wind turbine. Loads from the wind turbine will be distributed but will still be considerable. Only telecom towers that can withstand the additional load will be considered as potential sales targets. The required power to run a telecom tower averages 2.52 kW [7], and our company’s wind turbine will provide 3 kW. Thus, the system will be suitable to run a telecom tower sufficiently. In terms of research and development for our company, a few turbines will set-up with anemometry in various location in India. The data from the turbines, as well as feedback from the customers, will fuel our research and development for new products.
Business Risks 1. Exchange Rate Risk 2. Cash Flow (Liquidity) Risk 3. Commodity Price Risk 4. Increasing Competition 5. Regulatory Risk ETC will face an exchange rate risk when supplying its row materials from china. According to Apoorv Srivastava, “The Reserve Bank of India (RBI) would intervene to halt any rupee decline, whereas exporters were of the view that the Rupee has always been overrated and that there is no way that it shall appreciate from the present value. This traditional mindset has kept companies away from hedging their exposures” [9]. Like any startup company, TES will have a cash flow risk, which is the risk of not having enough money to meet financial demands. TES will overcome this risk by diligently budgeting and keeping up with current costs. Additionally, TES will run the risk that the price of an input for the turbine will increase. This risk will also be diminished through thorough budgeting and by sustaining relationships with suppliers. Although there is the risk that competition might increase in the future, the relationships TES builds with the telecom companies and tower owners will give the company an advantage. Switching costs should also protect TES from any competition taking business opportunities. There is also a risk the India will increase regulations for manufacturing, turbines, or companies in general. If there is an increase, TES will abide with all new regulations.
1.5 Financial Analysis (See Appendix A for statements) In quarter one, we will begin operations of manufacturing and setting up a business in India simultaneously. It takes approximately 57 days to officially set up our business in India. It costs approximately $500 to set up a business in India. We will not be able to sell any product until we go through this process, but with manufacturing and shipping as well as the assembly we will be ready to sell products around the same time that the business process will be complete. TES will give 5 turbines at the beginning of quarter 2 for proof of concept to a leading telecom provider, installed through GTL, with stipulation that they purchase the turbines at the end of quarter 2. Also in the contract will be a stipulation that they purchase 50 more units in each of quarters 3 and 4. Each turbine will be sold for $4,000. The manufacturing cost for the parts of the turbine is $1340 (per turbine). We will purchase materials in quarters 1 and 3 to maximize the use of space in our 20ft X20ft shipping container. In quarter 4, purchases will be made for the first quarter of year 2 sales. TES will have 3 employees in quarter 1 working 20 days. These 3 employees will begin working full time in quarter 2. TES will have 5

12
assembly employees in quarter 3 and quarter 4 to keep up with growing demand. Assembly employees will have a wage of $10.70 per day. TES will purchase some power tools and 1 forklift in quarter 1. We will also expect to replace some broken equipment in quarter 2-4 as well as supply gas for our forklift, so we will allot $50 per quarter to cover these costs. TES will have three sales representatives who will receive 5% commission on sales made, up to $2000 each per month. TES will also employ 2 engineers. The lead engineer will make $65,000/year and the second engineer will make $55,000/year. The Development and Operations Manager will make $60,000 and is responsible for finding new markets. Rent and utilities are based off typical rent for a 10,000 sq. ft. warehouse in Mumbai. TES does expect to have a very minimal negative cash flow in year one. TES is estimating revenue will go up to $800,000 by the end of year two due to an increasing number of sales. Because of the increase in sales, we will order the supplies in quarter four of the first year to meet the demand in the second year. Due to increase in demand, the company is planning to increase the purchases from suppliers to $285,450. By the end of the third year, sales are estimated to increase to $1 million. The purchases from suppliers will increases as well and will cost $351,080. The wages expense for the company is going up to $15,997 in the third year because two additional workers will be added to meet the increase in demand. TES estimated the sales to be $1,200,000 by the end of year four. The supplier’s purchases will go up to $419,464 to meet the anticipated demand. The wages expenses will go up to $27,820 because two more workers will be hired to meet the demand. TES will experience higher costs in year one due to startup expenses. These expenses will be a sunk cost and are required in order to see income growth. Even with the initial startup costs, TES is projected to make a profit in the first year of operation. The performance will then increase each consecutive year for the following four years. Expenses will remain variable to the number of units sold, meaning that expenses will increase at the same rate as sales. Because of this, TES estimates increasing net revenue (after tax expense) amounting in $400,823 by year five. TES expects a tax rate of 33% for companies that operate in India [10]. As long as TES sales continue to increase while keeping costs at a consistent rate, the company should see expanding profits throughout its future.
2 Technical Design
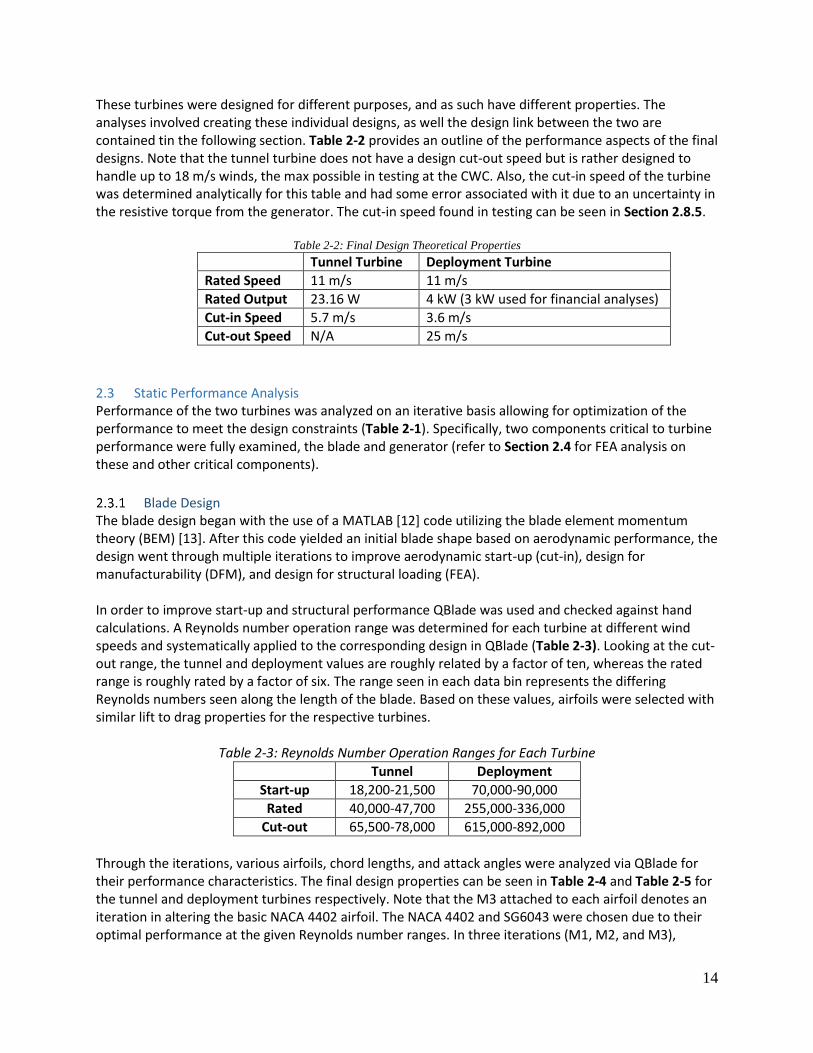
2.1 Design Objective Two turbines were designed to encompass all competition requirements. The first design was the deployment turbine, which focused on product development for a start-up company with a focus on the Indian telecommunication market. Secondly, the tunnel turbine design focused on the wind tunnel tests to be performed at the 2016 competition. The tunnel turbine can be considered a proof of concept prototype for the deployment turbine. Although different in many respects, the two turbine designs are aerodynamically linked through scalar factors, as discussed in Section 2.2.1. Table 2-1 shows technical constraints and requirements for both designs as specified by the Department of Energy (DOE) or identified by market research [11].
13
Table 2-1: NAU design constraints/considerations
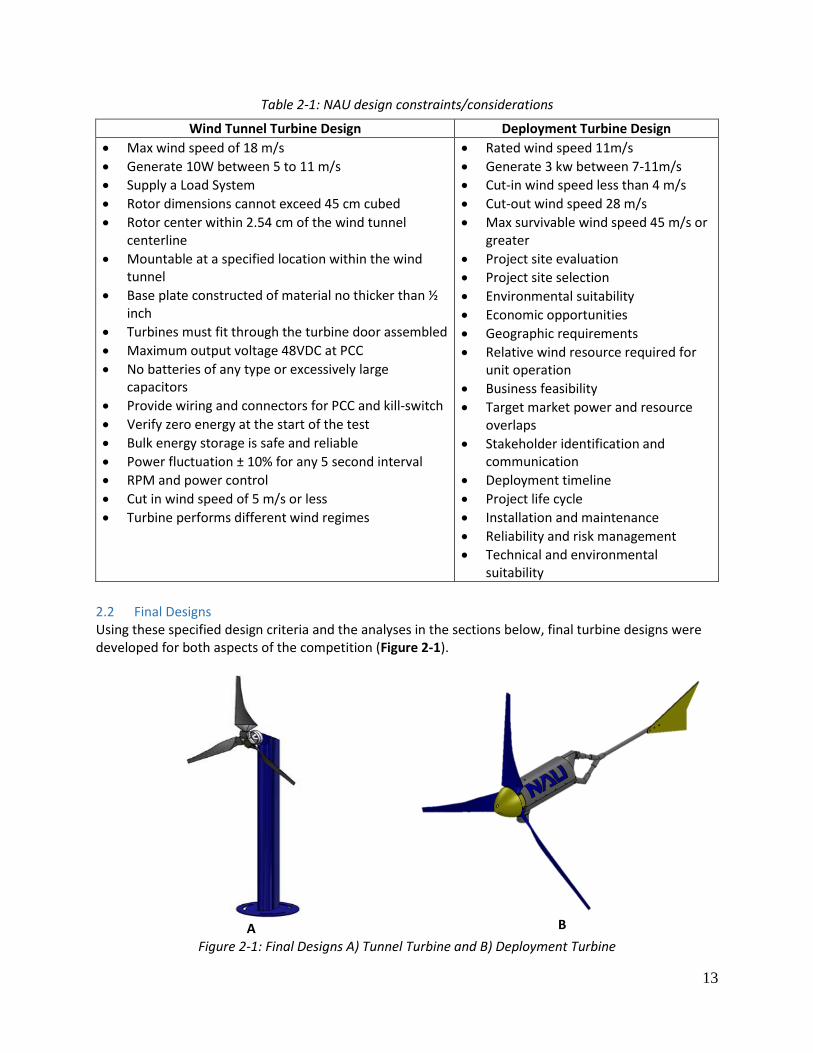
2.2 Final Designs Using these specified design criteria and the analyses in the sections below, final turbine designs were developed for both aspects of the competition (Figure 2-1).
A
B
Figure 2-1: Final Designs A) Tunnel Turbine and B) Deployment Turbine
Wind Tunnel Turbine Design Deployment Turbine Design
Max wind speed of 18 m/s
Generate 10W between 5 to 11 m/s
Supply a Load System
Rotor dimensions cannot exceed 45 cm cubed
Rotor center within 2.54 cm of the wind tunnel centerline
Mountable at a specified location within the wind tunnel
Base plate constructed of material no thicker than ½ inch
Turbines must fit through the turbine door assembled
Maximum output voltage 48VDC at PCC
No batteries of any type or excessively large capacitors
Provide wiring and connectors for PCC and kill-switch
Verify zero energy at the start of the test
Bulk energy storage is safe and reliable
Power fluctuation ± 10% for any 5 second interval
RPM and power control
Cut in wind speed of 5 m/s or less
Turbine performs different wind regimes
Rated wind speed 11m/s
Generate 3 kw between 7-11m/s
Cut-in wind speed less than 4 m/s
Cut-out wind speed 28 m/s
Max survivable wind speed 45 m/s or greater
Project site evaluation
Project site selection
Environmental suitability
Economic opportunities
Geographic requirements
Relative wind resource required for unit operation
Business feasibility
Target market power and resource overlaps
Stakeholder identification and communication
Deployment timeline
Project life cycle
Installation and maintenance
Reliability and risk management
Technical and environmental suitability
14
These turbines were designed for different purposes, and as such have different properties. The analyses involved creating these individual designs, as well the design link between the two are contained tin the following section. Table 2-2 provides an outline of the performance aspects of the final designs. Note that the tunnel turbine does not have a design cut-out speed but is rather designed to handle up to 18 m/s winds, the max possible in testing at the CWC. Also, the cut-in speed of the turbine was determined analytically for this table and had some error associated with it due to an uncertainty in the resistive torque from the generator. The cut-in speed found in testing can be seen in Section 2.8.5.
Table 2-2: Final Design Theoretical Properties Tunnel Turbine Deployment Turbine
Rated Speed 11 m/s 11 m/s
Rated Output 23.16 W 4 kW (3 kW used for financial analyses)
Cut-in Speed 5.7 m/s 3.6 m/s
Cut-out Speed N/A 25 m/s
2.3 Static Performance Analysis Performance of the two turbines was analyzed on an iterative basis allowing for optimization of the performance to meet the design constraints (Table 2-1). Specifically, two components critical to turbine performance were fully examined, the blade and generator (refer to Section 2.4 for FEA analysis on these and other critical components).
Blade Design The blade design began with the use of a MATLAB [12] code utilizing the blade element momentum theory (BEM) [13]. After this code yielded an initial blade shape based on aerodynamic performance, the design went through multiple iterations to improve aerodynamic start-up (cut-in), design for manufacturability (DFM), and design for structural loading (FEA). In order to improve start-up and structural performance QBlade was used and checked against hand calculations. A Reynolds number operation range was determined for each turbine at different wind speeds and systematically applied to the corresponding design in QBlade (Table 2-3). Looking at the cut-out range, the tunnel and deployment values are roughly related by a factor of ten, whereas the rated range is roughly rated by a factor of six. The range seen in each data bin represents the differing Reynolds numbers seen along the length of the blade. Based on these values, airfoils were selected with similar lift to drag properties for the respective turbines.
Table 2-3: Reynolds Number Operation Ranges for Each Turbine
Tunnel Deployment
Start-up 18,200-21,500 70,000-90,000
Rated 40,000-47,700 255,000-336,000
Cut-out 65,500-78,000 615,000-892,000
Through the iterations, various airfoils, chord lengths, and attack angles were analyzed via QBlade for their performance characteristics. The final design properties can be seen in Table 2-4 and Table 2-5 for the tunnel and deployment turbines respectively. Note that the M3 attached to each airfoil denotes an iteration in altering the basic NACA 4402 airfoil. The NACA 4402 and SG6043 were chosen due to their optimal performance at the given Reynolds number ranges. In three iterations (M1, M2, and M3),

15
thickness was continuously added to this airfoil at 29.1% of the chord length to improve the overall structural rigidity (as analyzed in Section 2.4.1) without detracting from aerodynamic performance.
Table 2-4: Tunnel Blade Design Properties (TSR – 4 Max 𝐶𝑝 – 0.32)
Blade Section Position (m) Chord (m) Twist (º) Airfoil
1 0 0.0555 45 NACA 4402-M3
2 0.019 0.045 35 NACA 4402-M3
3 0.038 0.0375 25 NACA 4402-M3
4 0.057 0.03 17.22 NACA 4402-M3
5 0.076 0.024 13.04 NACA 4402-M3
6 0.095 0.021 10.12 NACA 4402-M3
7 0.144 0.018 7.88 NACA 4402-M3
8 0.133 0.015 6.37 NACA 4402-M3
9 0.152 0.0135 5.09 NACA 4402-M3
10 0.17 0.012 4.06 NACA 4402-M3
Table 2-5: Deployment Blade Design Properties (TSR – 6, Max 𝐶𝑝 – 0.42)
Blade Section Position (m) Chord (m) Twist (º) Airfoil
1 0 0.333 42 SG6043
2 0.19 0.27 35 SG6043
3 0.38 0.225 25 SG6043
4 0.57 0.18 17.22 SG6043
5 0.76 0.144 13.04 SG6043
6 0.95 0.126 10.12 SG6043
7 1.44 0.108 7.88 SG6043
8 1.33 0.09 6.37 SG6043
9 1.52 0.081 5.09 SG6043
10 1.7 0.072 4.06 SG6043
The design link between these two turbines is that the position of each blade section of the deployment design is scaled by a factor of 10, whereas the chord length is scaled by 6 when compared to that of the tunnel turbine. The twist angles were kept the same other than the in-board blade element angle, which was changed to reflect the change in resistive torque of the larger size turbine. Also, the airfoils were changed between the designs for the same reason, their ability to perform efficiently within the respective operational Reynolds number range. This results in the deployment turbine having roughly a 10% greater coefficient of performance at all wind speeds when compared to the tunnel turbine at the same speeds. With these design parameters in place, power curves were generated using QBlade to show the theoretical power output by the turbine. These power curves are de-rated, meaning they account for the efficiency based energy losses through various mechanical and electrical components. Figure 2-2 A & B show the de-rated power curves for the tunnel and deployment turbines respectively. Note that the legend shows the electrical control states of the turbines, which will be discussed in Section 2.6.

16
Figure 2-2: De-rated Power Curves w/ Control States for A) Tunnel Turbine & B) Deployment Turbines
Related to these power curves, coefficient of power (Cp) versus tip speed ratio (TSR) plots were also created. This relationship is used to find an optimum efficiency and operating TSR of the blades based on the speed of the blade tip for different wind speeds. Figure 2-3 A & B depict theses curves for each turbine.
Figure 2-3: Coefficient of Power Curves at Different Wind Speeds for A) Tunnel Turbine & B) Deployment
Turbine
Generator Selection Early in the design process, it was decided that a generator would be selected rather than designed. The generator selection process was based on matching the power and RPM characteristics of the rotor as well as the power, voltage, and current of the power electronics and load. During selection, several generators were considered for the tunnel turbine, but only two passed the initial screening criteria stated above, the Sunnysky X4108s and Turnigy 4114. The deciding factor between the generators was the amount of force required to overcome the resistive torque, which is the sum of the electrical cogging torque and the torque required to overcome friction in the bearings. Table 2-6 contains the resistive torques for each generator considered. Note that the uncertainty changes between the generators due to the tighter bin of data collected for the Sunnysky compared to the Turnigy.

17
Table 2-6: Resistive torque requirements at 95% confidence
Generator Resistive Torque
Sunny Sky X4108s 0.019 N-m ± 0.002 N-m
Turnigy 4114 0.040 N-m ± 0.005 N-m
2.4 Stress/Load Analysis Critical components involved in the construction of the turbine have been analyzed for stress and displacement characteristics, including the blades, interface, and hub. This analysis was primarily done using finite element analysis (FEA) through SOLIDWORKS [14]. The results gathered were used to make both material specifications changes and design refinements for each component.
Blade FEA Of the critical components analyzed, the blade was most likely to fail due to its thin profile and high applied centrifugal and thrust forces. In setting up the FEA model for the blades, the thrust force was calculated per annulus of the rotor and applied correspondingly. A centrifugal force was also applied to the blade to represent the rotation of the rotor. The initial FEA on the tunnel blade showed that the overall profile thickness was too thin to survive high wind speeds. Thus approximately 3 iterations were used to find the proper airfoil thicknesses. Small increases in the airfoil iterations were implemented (M1, M2, M3), which led to the final design (M3) discussed in Section 2.3.1. Figure 2-4 A shows the resulting analysis of the final tunnel turbine blade at a 24 m/s winds, which resulted in a factor of safety of 1.60. Similar to the tunnel blade, the deployment blade was also relatively thin and saw high applied forces. However, in the case of this blade rather than altering the thickness of the original airfoil (the NACA 4402), a different airfoil was selected with a greater thickness (the SG6063). The FEA forces and conditions used for analyzing this blade was identical to the tunnel design, but had a great increase in the applied forces due to the much larger size of the blade. Figure 2-4 B shows the resulting final analysis with a resulting factor of safety of 1.04 Note that the thrust forces applied to the blade were exaggerated, adding in an additional factor of safety. The applied thrust force is assuming the blades are flat plates rather than a curved surface.
A
Min FOS – 1.60
B
Min FOS – 1.04
Figure 2-4: Blade FEA Results for A) Tunnel Blade at 24 m/s and B) Deployment Blade at 25 m/s winds

18
Note that the 24 m/s wind speed was used in the tunnel turbine analysis because it was the max speed producible by the tunnel available to NAU for initial testing.
Interface FEA In terms of the interface, it varied for both of the designs. For the tunnel turbine the interface and tower were combined into a single structure. However, the deployment turbine used a nacelle which is turn is connected to a tower via a yawing mechanism. The tower design for the tunnel turbine was structurally sound with the first iteration, and thus further design iterations were only used to account for different generator mounting methods. When developing the FEA model, the sum of the thrust forces seen by the rotor was applied to the generator mounting position. Figure 2-5 A shows the results of the stress analysis, with a resulting factor of safety of 18.2. For the deployment turbine’s nacelle, a basic cylindrical structure was selected due to its easy of manufacturing with pipe or tubing. Similar to the tunnel tower, the sum of the thrust force seen by the rotor was applied to the front of the nacelle. For analysis purposes, the nacelle was restricted from rotation due to the incorporated furling design. Figure 2-5 B shows the results of this analysis, with a resulting minimum factor of safety of 3.6.
A
Min FOS – 18.20
B
Min FOS – 3.60
Figure 2-5: Interface FEA Results for A) Tunnel Tower at 24 m/s and B) Deployment Nacelle at 25 m/s winds
Hub FEA Like other critical components, the hub for both turbines went through several iterations. While the tunnel hub iterated to address weight and structural rigidity, the deployment hub iterated to address different types of blade mounting systems and structural rigidity to meet CWC testing constraints. The tunnel hub iterations attempted to reduce overall weight of the part in order to improve turbine start-up. Similar to the blade FEA model, the thrust and centrifugal forces seen by the blades were

19
applied to the hub. Figure 2-6 A shows the analysis results, where the minimum factor of safety was 2.95. Alternatively, the deployment hub was iterated for different blade mounting configurations, leading to the final design. The last iteration altered the thickness of the plate and the material selected for structural rigidity considerations. Figure 2-6 B shows the FEA results for the final hub deployment hub design, which had a minimum factor of safety of 1.30.
A
Min FOS – 2.95
B
Min FOS – 1.30 Figure 2-6: Hub FEA results for A) Tunnel at 24 m/s and B) Deployment at 25 m/s winds
Expected loads and FOS Summary Similar analyses were performed on the remaining loaded components to verify their ability to withstand the applied forces. Table 2-7 and Table 2-8 contain the analytical results from the stress analyses performed on the tunnel and deployment turbines respectively.
Table 2-7: Tunnel Turbine expected loads and FOS at 24 m/s winds
Component Material Minimum Factor
of Safety Expected
Loads Load
Description
Blade (Fig. 2-3 A)
Carbon fiber 1.93 16.9 N,
545.45 rad/s Thrust,
centrifugal forces
Tower (Fig. 2-4 A)
Chromoly Steel 18.2 16.9 N Thrust force
Hub (Fig. 2-5 A)
6061-T6 Aluminum 2.95 16.9,
545.45 rad/s Thrust,
centrifugal forces
Thrust Washer
Aluminum Alloy 1.73 16.9 N,
545.45 rad/s Thrust,
centrifugal forces
Hub Adaptor Aluminum Alloy 1.7 16.9 N,
545.45 rad/s Thrust,
centrifugal forces

20
Table 2-8: Deployment Turbine expected loads and FOS at 25 m/s winds
Component Material Minimum Factor
of Safety Expected
Loads Load
Description
Blade (Fig. 2-3 B)
S-2 Glass Fiber 1.04 2.5 kN,
150 rad/s Thrust,
centrifugal forces
Nacelle (Fig. 2-4 B)
6061 Aluminum 3.6 2.5 Thrust force
Hub (Fig. 2-5 A)
Plain Carbon Steel 1.30 2.5 kN,
150 rad/s Thrust,
centrifugal forces
2.5 Electrical Analysis
Rectifier Testing the DC-DC converter required control programming that is capable of providing the correct duty cycle at the correct frequency to the switching transistors. By using a bench testing analysis, the outputs were compared to the theoretical calculations and adjusted in the circuit for proper boosting. The Rectifier is a Shottky Three Phase Bridge, comprised of 6 diodes. Two diodes are necessary for each of the three phases, as this is a passive rectification system. The voltage drop is the change in voltage between the input AC voltage and the output DC voltage. Table 2-9 shows the voltages, voltage drops, and the average voltage drop.
Table 2-9: Rectifier Input and Output Voltages
Input AC (line-to-line)
Input AC (rms)
Output DC AC-DC Voltage
Drop
3.8 5.4 4.2 1.2
4.4 6.2 5.2 1.0
4.8 6.8 5.4 1.4
5.1 7.2 5.9 1.2
6.5 9.2 8.0 1.2
7.2 10.2 8.7 1.5
Average Drop: 1.25 V
A heat sink for the rectifier was added to avoid damage to the components and efficiency losses. A capacitor was also added to smooth out the voltage ripple. Figure 2-7 shows an oscilloscope waveform of the rectifier output. Note the small ripple: without a capacitor, this would be much more erratic and harmful to the circuit.
Figure 2-7: Rectifier DC Output w/ a Capacitor (∆𝑥 = 0.5 𝑚𝑠, ∆𝑦 = 1𝑉)

21
DC-DC Converter Initial testing of the DC-DC converter was conducted digitally using PSpice. This analysis allowed for component values previously calculated by hand to be confirmed before final testing. The simulations initially used Rload = 0.256 Ω, which represented the equivalent resistance of the 6V lead-acid battery that was to be employed as the load. However, through multiple iterations of the simulation values it became clear that such a low resistance would not facilitate the more important output voltage requirements, especially at low input power that would be seen near the cut-in wind speed. Upon changing the load resistance to 1 Ω, the simulations then showed that for the calculated values of capacitance, inductance, and switching frequency the output voltage could be attained and thus led to a new load design. Table 2-10 shows the final results.
Table 2-10: DC-DC Converter Simulation Results with fsw=150kHz, Rload=1.0Ω, L=78µH, and C=300µF
Vin (V) D1 Vout,min Vout, max ΔVout
1 0.9 7.55 7.7 0.15
2 0.81 7.6 7.73 0.13
3 0.745 7.44 7.56 0.12
4 0.68 7.46 7.57 0.11
5 0.627 7.68 7.79 0.11
6 0.582 7.63 7.73 0.1
7 0.552 7.9 8.01 0.11
8 0.51 7.53 7.61 0.08
9 0.48 7.51 7.59 0.08
10 0.461 7.82 7.89 0.07
2.6 Control Model Analysis
Control State Definition Based on the turbine power curve, there are 4 main states that need to be controlled for operation, as seen in Appendix B, Figure B4. State one is labeled as waiting. In this state the system is simply waiting for the turbine to cut-in and start generating power. State two is labeled as optimizing output power. This state optimizes the generation of the turbine during the ramp up to rated output. The goal within state two is to reach the rated output power of the turbine as quickly as possible. When the turbine exceeds the rated power, the system moves from state two into state three. State three is labeled as modulating the output power. Once the generation meets rated output, this state forces the turbine to stay within a specific generation range near output despite any increasing wind speeds. In order to do this a pulse width modulation (PWM) controller driven by a feedback loop off of the turbine’s output is utilized. Last is state four, which has three sub-states, 4A, 4B, and 4C. In state 4A the system is generating power until a kill switch is engaged, which causes the turbine to brake. State 4B engages the brake if the load is disconnected from the turbine. Lastly, state 4C brakes the turbine at the specified cut-out speed (this is specific to the deployment system). States 3 and 4 are needed in order to safely run the turbine without exceeding rated values or running the turbine in unsafe conditions.

22
Control Model Design In order to emulate the states of the turbine describe above, a flow chart was created to address the basic operation of the coding and control components, as seen in Appendix B, Figure B4.
2.7 Documentation of Software
Control Model Program For software used, a control program was implemented by using an Arduino Zero microcontroller. The microcontroller was used to control the four different states seen in the turbine (refer to Appendix B, Figure B4 for control model flow chart). This program is used to handle each individual state the turbine goes through, from state 1 to state 4. In states 2 and 3, the Arduino Zero is used to generate a PWM that directly controls the DC-DC converter. In state 4, two conditions need to be met in order to pass the safety test of the competition, the first being brake by load disconnect and the second being brake when a specific input is provided by an outside source. In order to sense the load, an Arduino Zero micro-controller is used to sense a specific voltage drop from the current flow from the turbine. However when the load is disconnected the flow of current will stop, resulting in a voltage reading of 0. To overcome the other form of braking, normally closed relays are used to brake the turbine.
Bonus Load Program The program being used within the bonus challenge reads values off a secondary shunt located in the bonus load, as specified within state 4. The value being read is the voltage being produced by the turbine from the point of common coupling (PCC). As the turbine’s RPM and power production increases, the Arduino will read the power at the PCC and display the power level in small increments (using LED lights) until the turbines rated power is produced.
Initial Blade Design (BEM) The blade element momentum theory [13] was used for the design of the blades through the use of MATLAB [12]. This theory entailed two steps: the use of Betz’ optimum rotor design with wake rotation, and the BEM code. From the Betz’ optimum rotor design, tip speed ratios, rotor radii, and number of blade sections were used as input values. These input values yielded optimal chord lengths, which were in turn used in the BEM to find the angle of twist needed for each blade section.
2.8 Results of Testing To design a tunnel turbine that would operate successfully, testing was performed on each component in the design using a wind tunnel testing apparatus. The systems tested include: generator, brakes, DC-DC converter, blades, and control systems.
Generator After the generator selection, 2 tests were performed. Test 1 used a dynamometer to find the RPMs, voltage, current, and power whereas test 2 used a level arm to find the cogging torque. Figure 2-8 A shows the voltage produced by the generator whereas Figure 2-8 B shows the power out of the generator. Note that both of these plots were derived from the results of test 1.

23
A
B
Figure 2-8: Dynamometer test of SunnySky for A) Open Circuit Output & B) Loading Power Output Similarly, for the turbine test, an open circuit voltage test (Voc) was conducted, as well as loaded circuit tests to determine the power output at various RPM. The current flow was calculated by measuring the DC voltage drop across a shunt.
Brakes Before construction of the actual AC and DC brakes to be used in the wind tunnel, prototyping was done with a breadboard, Arduino Uno, and Mystery brushless test motor. Each brake system was tested for proof-of-concept by rotating the motor by hand, and observing increased rotational resistance when braking. Figures 2-9 A and B display these prototypes.
A B Figure 2-9: Brake Prototypes A) AC Brake B) DC Brake
The dynamic AC and DC brake system was tested for functionality at wind speeds ranging from 5 to 20 m/s. An anemometer was used to measure wind speed, and AC and DC open-circuit voltages were monitored for safety reasons. A successful instance of braking was decided by visually observing the reduction in RPM after braking. If this reduction was significant enough to eliminate the blur seen in fast-moving blades, the braking instance was deemed successful. Although the brakes were capable of activating at all wind speeds up to 20 m/s, successful turbine shutdown was only observed from all wind speeds up to and including 12 m/s, after which the brakes were not able to significantly reduce RPM. Wind speeds above 15 m/s were not recorded for this reason. Table 2-11 displays these results.
0
5
10
15
20
0 2000 4000 6000 8000
Vo
ltag
e o
utp
ut
(V)
Revolutions per minute (RPM)0
50
100
150
200
250
0 2000 4000 6000 8000
Po
we
r o
utp
ut
(W)
Revolutions per minute (RPM)
1.64 ohm
1.24 ohms
0.9 Ohms
0.76 ohms
0.59 ohms

24
Table 2-11: Open Circuit Brake System Test Results
Wind Speed (m/s)
AC Voltage from Turbine (V)
DC Voltage from Turbine (V) Brake?
5.1 0 0 N/A
5.6 2.78 3.65 Yes
6.9 3.9 5.35 Yes
8.6 5.2 6.8 Yes
9.9 6.1 8.3 Yes
11.7 7.3 9.8 Yes
12.7 8.1 11 Yes
13.9 8.9 12 No
15.1 9.9 13.3 No
Control Program In order to check the viability and functionality of the control systems, the corresponding electrical systems that needed to be controlled were tested with the proper coding. This allowed for the individual systems to be actuated individually to verify that they were being controlled properly. Thus, this testing was done in tandem with the other electrical components (refer to Sections 2.8.2 and 2.8.4 for bench testing procedures).
DC-DC Converter Initial bench testing was conducted using an off the shelf boost converter that was purchased online. The boost converter is rated for input voltages between 3 and 35 volts, 9 amperes input current, 6 amperes output current, and an overall output power rating of 65 watts. The purpose of this testing was to not only create a benchmark upon which future prototypes would be compared against, but to also confirm that the off the shelf converter would serve as a suitable backup. The converter was subjected to steady state testing using a DC power supply to simulate the input power from the rectifier, a 10 Ω power resistor connected to the output leads to simulate the load, and a digital multimeter (DMM) to measure the voltage drop across the resistor. Proper performance of the converter was confirmed by first supplying it with 4 volts from the DC power supply and then adjusting the potentiometer that controls the output voltage so that the converter output 8 volts. The input voltage was then reduced to just below its minimum input voltage rating to confirm the minimum input voltage required for proper operation. The input voltage was then stepped up by 0.5 volt increments and output measurements were taken each step along the way, as can be seen in Table 2-12. The outcome of this testing confirmed that without further adjustments to the potentiometer, the off the shelf boost converter successfully regulated the output voltage within the range of expected input voltages and thus would make a suitable backup.

25
Table 2-12: Boost Converter Bench Test Results
Iin Vin Vout
0.22 3 2.68
1.61 3.5 7.99
1.34 4 8
1.17 4.5 8
1.04 5 8.01
0.94 5.5 8.02
0.85 6 8.02
0.77 6.5 8.02
0.72 7 8.02
0.68 7.5 8.03
0.63 8 8.03
0.57 8.5 8.08
0.61 9 8.58
0.62 9.5 9.08
0.62 10 9.58
A similar test was conducted in a local wind tunnel by connecting the converter to peripheral devices and using an additional DMM on the input in order to compare it with the output.
Blades The blades were tested for their cut-in speed. This was done by starting the wind tunnel at the slowest speed possible and slowly ramping up until the blades started to spin and a positive voltage and amperage were read from the generator. Wind speed was measure via the use of an anemometer. Testing performed in the wind tunnel has shown that the aerodynamic start-up required to surpass the resistive torque (of the generator) was between 3.5 and 5 m/s.
2.9 Engineering Diagrams The engineering diagrams for the competition and deployment turbines can be seen in Appendix B Figures B1 and B2. They show an exploded view of the turbines with the necessary components required for the mechanical assemblies. The electrical one-line operation diagram can be seen in Appendix B, Figure B3.
Rectifier Schematic A three-phase, passive diode bridge turns the AC waveform into a fairly stable DC voltage with current. A capacitor helps smooth out the DC voltage even further for ease-of-control on the DC/DC Converter’s side. The team chose the passive design because it would be easier to implement, and the downsides of the increased voltage drop were not significant enough to harm electrical efficiency. In addition, if the team had extra time, they could go back and design their own active rectifier to replace it. Figure 2-10 helps illustrate the design, and also shows the pin numbers of the rectifier.

26
Figure 2-10: Rectifier Schematic
DC-DC Converter Schematic Figure 2-11 shows a PSpice schematic representing the DC-DC converter. The control signal provided by the Arduino is represented here by a saw tooth carrier signal operating at the appropriate switching frequency compared to a control voltage, thus resulting in a pulse-width modulated signal that controls the switching of the transistor. The transistor is modeled by an ideal switch to simplify the simulation, but is also configured to represent the appropriate Rds,on resistance of the NMOS transistor used in the physical circuit. The inductors and capacitors are configured to represent the actual component configuration that was assembled on the prototyping board.
Figure 2-11: DC-DC Converter Schematic
AC & DC Brake Schematic Figure 2-12 illustrates a simplified version of the AC and DC brake system. The AC brake consists of three, wye-connected relays. Upon loss of power or a low output signal, the relays will connect each of the generator output leads together. This action will dynamically brake the turbine through the use of feedback current being forced into the generator. In addition, a DC brake was added to strengthen the braking power of the AC brake. This system used similar principles to dynamically brake the turbine on the DC side. As a result, the DC brake fed back remaining current – not captured by the AC brake – back into the turbine, initiating turbine shutdown.

27
Figure 2-12: Brake Used for Turbine Shutdown
3 Deployment Strategy Considerations in this section are specifically related to the business plan and the deployment turbine design.
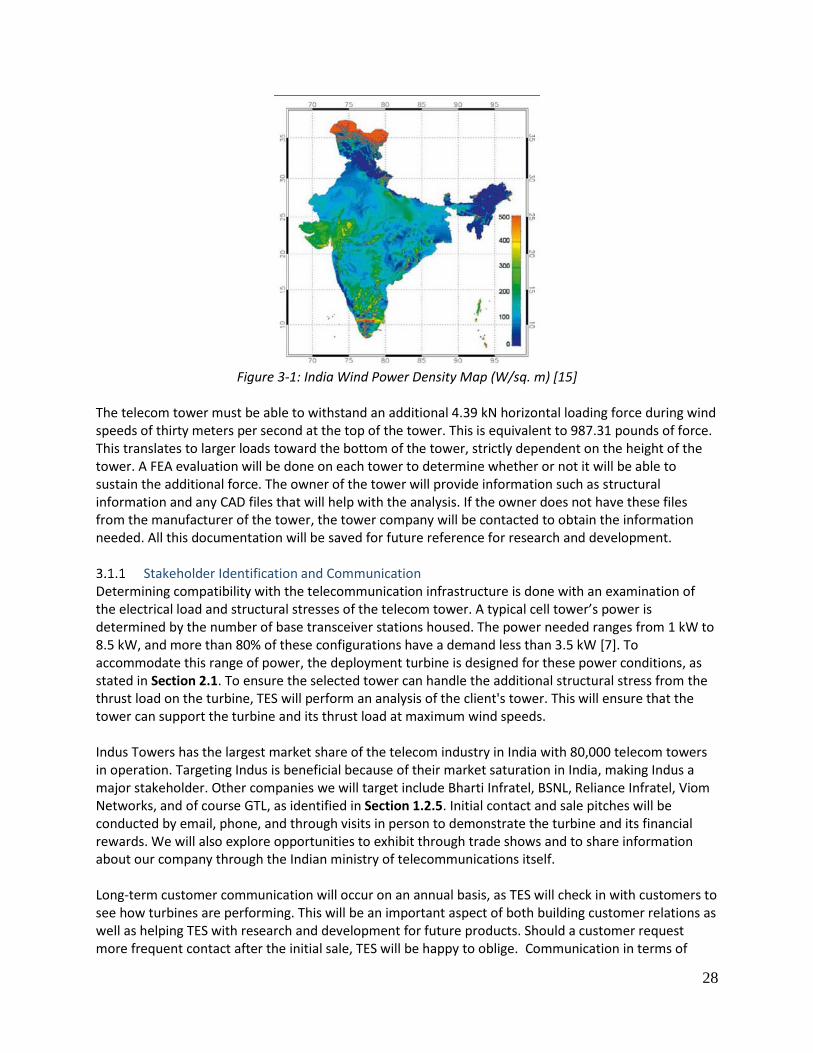
3.1 Identify Site and Dataset The wind resource is a key consideration since the resource itself drives the turbine’s production. Obtaining wind resource data in a region is a crucial step in the site identification and validation process. This allows our company to have a complete understanding of how much electricity the turbine will produce at a specific site. For wind farm development, this data would be as detailed as 5-minute averages of the wind speed collected over the span of 1-3 years. However, finding this data can be difficult, and in many cases it does not exist at all for the site in question. In our case, wind resource maps and publicly available wind measurements will be used. This includes airport wind speed data nearest to the site being considered, as well as other wind resource data sets for the region and data collected at existing telecom towers. Selected sites are analyzed to determine whether or not they possess a wind resource necessary to financially benefit the customer. Sites that have average annual wind speeds ranging from five to fifteen meter per seconds are preferred. Our company engineers will manage a wind data repository and continually refine a wind map of relevant telecom tower sites in India, similar to that seen in Figure 3-1. Based on this figure, our turbine could produce at least 1.26 kW regularly in a majority of India (minimum of 100 W/sq. m).
28
Figure 3-1: India Wind Power Density Map (W/sq. m) [15]
The telecom tower must be able to withstand an additional 4.39 kN horizontal loading force during wind speeds of thirty meters per second at the top of the tower. This is equivalent to 987.31 pounds of force. This translates to larger loads toward the bottom of the tower, strictly dependent on the height of the tower. A FEA evaluation will be done on each tower to determine whether or not it will be able to sustain the additional force. The owner of the tower will provide information such as structural information and any CAD files that will help with the analysis. If the owner does not have these files from the manufacturer of the tower, the tower company will be contacted to obtain the information needed. All this documentation will be saved for future reference for research and development.
Stakeholder Identification and Communication Determining compatibility with the telecommunication infrastructure is done with an examination of the electrical load and structural stresses of the telecom tower. A typical cell tower’s power is determined by the number of base transceiver stations housed. The power needed ranges from 1 kW to 8.5 kW, and more than 80% of these configurations have a demand less than 3.5 kW [7]. To accommodate this range of power, the deployment turbine is designed for these power conditions, as stated in Section 2.1. To ensure the selected tower can handle the additional structural stress from the thrust load on the turbine, TES will perform an analysis of the client's tower. This will ensure that the tower can support the turbine and its thrust load at maximum wind speeds. Indus Towers has the largest market share of the telecom industry in India with 80,000 telecom towers in operation. Targeting Indus is beneficial because of their market saturation in India, making Indus a major stakeholder. Other companies we will target include Bharti Infratel, BSNL, Reliance Infratel, Viom Networks, and of course GTL, as identified in Section 1.2.5. Initial contact and sale pitches will be conducted by email, phone, and through visits in person to demonstrate the turbine and its financial rewards. We will also explore opportunities to exhibit through trade shows and to share information about our company through the Indian ministry of telecommunications itself. Long-term customer communication will occur on an annual basis, as TES will check in with customers to see how turbines are performing. This will be an important aspect of both building customer relations as well as helping TES with research and development for future products. Should a customer request more frequent contact after the initial sale, TES will be happy to oblige. Communication in terms of

29
maintenance and warranty will occur on a monthly basis with maintenance companies to ensure proper handling and care of the turbine. Lastly, TES will hold training sessions for turbine maintenance and tower companies on how to properly maintain the turbine on an annual basis or as needed during start-up. How to install the turbine with the provided pulley system, basic troubleshooting, and the maintenance procedures involved with turbine upkeep will be covered in this training. 3.2 Timeline & Lifecycle In order to spark interest in the product, TES will offer five turbines, free of charge, to several of the tower companies. This will accompany a negotiation with the customer that if the turbines meets their needs, the customer must buy the five turbines following initial testing and an additional 100 within six months. After making the deal, TES will notify the manufacturer to ship more turbine components to the warehouse to supply the number of turbines the customer ordered. The manufacturers are located in China and the warehouse is located in India, so shipping time is allotted for. Once the parts arrive at the warehouse, they will be assembled into larger components that are ready for installation. Finally, the components will be delivered to the customer, and final assembly will occur at the respective tower. Figure 3-2 shows the whole process with projected time allotments.
Figure 3-2: Deployment Timeline
It is projected that after installation, with proper maintenance, the turbine will have a lifespan of approximately 20 years. In order to ensure that any manufacturing or assembly defects are taken care of, the turbine will have a limited parts and labor warranty for the first two years of operation. Proper maintenance, as discussed in Section 3.3, is described as an annual full service, and monthly inspection.
3.3 Installation and Maintenance Once the site and tower have been approved for the turbine, it will be shipped from the manufacturing facility to the site with a team of installation experts from our company if the customer asked for installation service. If not, then TES the will ship the parts to the customer for installation.
Installation The installation team will carry seven items with them to the site, including:
3 blades & Hub Nacelle Tail vane
Tower mounting adaptor Battery Electrical control components

30
The facility will receive the turbine parts from the manufacturer, or the installation team will deliver the parts and install the system on the tower. In both cases, the installation will be performed with a pulley system and a winch, allowing for a very low-cost installation that can be performed by a small team. Four people minimum are required for installing the turbine. One person will operate the winch. Two people will climb the tower and set the pulley system to lift and install the turbine on the tower. The last two people will assemble the turbine on the ground, one of whom can also operate the winch. For safety, installation should not occur during high winds or extreme weather conditions. A safety belt must be worn by the individual who is climbing the tower at all times. Every activity during the installation must be recorded in a logbook and any damages must be reported to TES and the tower company. All workers must be familiar with safety rules before any work can begin. After installation, the team will ensure that the turbine is working properly before leaving the site. Installation Steps:
Attach the nacelle to the tower mounting adaptor Attach the tail vane to the back of the nacelle Attached blades to the hub Connect the hub to the generator shaft; insert the shaft key, then attach the nose cone Set the turbine in a location where it can be easily picked by the winch, then hoist it into place Connect stub tower to telecomm tower Connect the system to the battery and other electronics Run the turbine and make sure it is working before leaving the location
Maintenance Our partner companies will be trained in proper maintenance procedures for our turbine, and our engineers will be available to consult as needed on maintenance issues. Full maintenance should be performed annually and after any severe weather conditions. The GTL maintenance team will have the same safety rules as the installation team. 3.3.2.1 Annual Maintenance It is recommended that technicians who are trained in turbine installation perform a monthly check of all turbine systems, accompanying or taking the place of other tower employees who are visiting the tower to refuel or for other purposes. Annual maintenance is recommended for turbine safety and longevity. It includes inspecting electrical wiring, torqueing all bolts for structural safety, lubricating all bearing, and performing visual inspections on the hub, blades, and the generator to ensure all are functioning properly. It is also recommended that the client inspect each turbine after a severe weather event in the same way the annual maintenance is performed.
3.4 Reliability and risk management Even with proper maintenance and installation, it is important to recognize that any wind turbine has a set of associated risks. A number of business risks were addressed in Section 1.4.4. In this section we examine the electrical, mechanical, financial reliability that mitigate some of these risks.
Electrical Reliability The generator is the main electrical component, and is a 3 kW permanent magnet generator (PMG) manufactured by Henry D [16]. The PMG is designed to satisfy the load requirements of the tower without much overload, prolonging the system life. The turbine will optimize the working condition of the actuators by adjusting the controller. By doing so, the extreme loads on the actuator can be avoided

31
and thus the system life span will be increased. The health rate of the motor is used as additional control input to modify the controller properties according to the motor state and thus to extend the motor lifetime.
Mechanical Reliability The blade design has a factor of safety of 1.04, as discussed in Section 2.4.1, which make them able to withstand a direct wind speed up to 25 m/s when spinning, or 60 m/s when not spinning. In addition, turbine also features a tail vane and nacelle with a gravity driven furling design. This causes the turbine to rotate out of the wind at 30 m/s, protecting the blades from extreme wind speeds. When the wind drops below 30 m/s, the tail vane, which furls upward at a compound angle, is forced back into position by its own weight, swinging the turbine back into the wind. Also, in order to protect the tower from any vibration damage, the yaw system design incorporates eight vibration isolators to dampen any potential threats.
Financial Reliability Since up to 90% of the telecommunication towers in India rely on diesel generators, our turbine will offer reliable electricity at a competitive price. The uninstalled turbine cost is $4,000, while the fuel costs for running the diesel generator alone is $7,000 per year based on the calculations shown in Section 1.2.7. The turbine lifetime maintenance costs are minimal, and the turbine installation cost is minimized by using a pulley system instead of a crane or lift. In conclusion, this turbine makes great financial sense for application on telecommunication towers in India where a wind resource is available. By utilizing the existing tower infrastructure, the initial cost of the turbine is minimized, maximizing the savings seen by the customer.

32
4 References
[1] H. Joshi, "Indian Tower Industry: The Future is Data," [Online]. Available:
https://www2.deloitte.com/content/dam/Deloitte/in/Documents/technology-media-
telecommunications/in-tmt-indian-tower-industry-noexp.pdf. [Accessed 1 March 2016].
[2] "Small Wind Turbine Standard," 15 January 2014. [Online]. Available:
http://www.renewableuk.com/en/utilities/document-summary.cfm?docid=97D39F8A-
0760-45C5-8D9D6B8E7F2302FD. [Accessed 7 March 2016].
[3] M. Bhawan and L. N. Marg, "Annual Report 2013-2014," December 2014. [Online].
Available:
http://www.trai.gov.in/WriteReadData/UserFiles/Documents/AnuualReports/TRAI-
Annual-Report-(English)=01042015.pdf. [Accessed 27 February 2016].
[4] Greentech Media, "Beyond the Electrical Grid: India's Off-Grid Solar Opportunity," 08
November 2011. [Online]. Available:
http://www.greentechmedia.com/articles/read/beyond-grid-electricity-india . [Accessed 29
April 2016].
[5] R. Taylor, Interviewee, Insight into The Small Wind Industry. [Interview]. 6 April 2016.
[6] Xzeres, "Telecom," [Online]. Available:
http://www.windenergy.com/markets/telecommunication. [Accessed 27 February 2016].
[7] Intelligent Energy, "The True Cost of Providing Energy to Telecom Towers in India,"
January 2012. [Online]. Available: : http://www.gsma.com/membership/wp-
content/uploads/2013/01/true-cost-providing-energy-telecom-towers-india.pdf. [Accessed
December 2015].
[8] National Renewable Energy Labratory, "Distributed Generation Renewable Energy
Estimate of Costs," February 2016. [Online]. Available:
http://www.nrel.gov/analysis/tech_lcoe_re_cost_est.html. [Accessed 30 March 2016].
[9] D. Diment, "Competitive Landscape," July 2015. [Online]. Available:
http://clients1.ibisworld.com/reports/us/industry/competitivelandscape.aspx?entid=1913#
MSC. [Accessed 14 May 2016].
[10] S. Apoorv, "Foreign Exchange Risk Management in India," FICCI Blog, 1 February 2013.
[Online]. [Accessed 24 April 2016].
[11] Ernst & Young LLP, "Doing Business in India," November 2013. [Online]. Available:
http://www.ey.com/Publication/vwLUAssets/India_-
_Doing_Business/$FILE/Doing%20Business%20in%20India.pdf. [Accessed 26 April
2016].
[12] U.S. Department of Energy, "CWC Rules and Regulations," 8 February 2016. [Online].
Available:
http://energy.gov/sites/prod/files/2016/02/f29/CWC%20Rules%20and%20Regulations%2
0Manual_Rev3_160203.pdf. [Accessed 30 April 2016].
[13] MATLAB and Statistics Toolbox Release 2015b, Natick, MA: The MathWorks Inc. .
[14] J. Manwell, J. McGowan and A. L. Rogers, Wind Energy Explained: Theory, Design, and
Application, Wiley, 2009.
[15] SolidWorks 2015-2016, Dassault Systemes.

33
[16] India Wind Turbine Manufacturers Association, "Wind Resource Map," [Online].
Available: http://www.indianwindpower.com/news_views.php#tab3. [Accessed 26 April
2016].
[17] "alibaba.com," Qingdao HenryD Wind Power Equipment Co. Ltd, [Online]. Available:
http://hldwtg.en.alibaba.com. [Accessed 25 February 2016].

34
Appendix A - Business Financials
Cash Flow Year 1
Quarter 1 Quarter 2 Quarter 3 Quarter 4
Sales $0 $0 $220,000 $200,000
Total Collections $0 $0 $220,000 $200,000
Cash Disbursements
Purchases $73,708 $0 $67,007 $67,007
Assembly Wages $642 $2,087 $3,478 $3,478
Assembly Machinery $500 $50 $50 $50
Cost to Start Up in India $500 $0 $0 $0
Shipping $500 $0 $500 $500
Import Cost (to India) $1,462 $0 $1,462 $1,462
Sales Representatives $0 $0 $11,000 $12,000
Salaries $45,000 $45,000 $45,000 $45,000
Building Rent $5,409 $5,409 $5,409 $5,409
Utilities $1,200 $1,200 $1,200 $1,200
System analysis and software testing $0 $500 $500 $500
Solidworks Subscription $2,746 $2,746 $2,746 $2,746
Total Disbursements $131,667 $56,992 $138,352 $139,352
Beginning Cash Balance $0 -$131,667 -$188,658 -$107,010
Add: Inflows $0 $0 $220,000 $200,000
Subtract: Outflows -$131,667 -$56,992 -$138,352 -$139,352
Ending Cash Balance -$131,667 -$188,658 -$107,010 -$46,361
Cash Flow Years 2-5
Year 2 Year 3 Year 4 Year 5
Sales $800,000 $1,000,000 $1,200,000 $1,400,000
Total Collections $800,000 $1,000,000 $1,200,000 $1,400,000
Cash Disbursements
Purchases $285,450 $351,080 $419,464 $485,131
Assembly Wages $13,910 $15,997 $27,820 $27,820
Assembly Machinery $200 $200 $200 $200
Shipping $4,500 $4,500 $4,500 $4,500
Import Cost (to India) $8,772 $8,772 $8,772 $8,772
Sales Representatives $72,000 $72,000 $72,000 $72,000
Salaries $180,000 $180,000 $180,000 $180,000
Building Rent $21,636 $21,636 $21,636 $21,636
Utilities $4,800 $4,800 $4,800 $4,800
System analysis and software testing $2,000 $2,000 $2,000 $2,000
Solidworks Software $10,980 $10,980 $10,980 $10,980
Total Disbursements $604,248 $671,965 $752,172 $817,839
Beginning Cash Balance -$46,361 $149,391 $477,426 $925,255
Add: Inflows $800,000 $1,000,000 $1,200,000 $1,400,000
Subtract: Outflows -
$604,248 -$671,965 -$752,172 -$817,839
Ending Cash Balance $149,391 $477,426 $925,255 $1,507,416

35
Income Statement Year 1- 5
Forecast Period
Year 1 Year 2 Year 3 Year 4 Year 5
Sales $420,000 $800,000 $1,000,000 $1,200,000 $1,400,000
Cost of Goods Sold $140,715 $268,028 $335,035 $402,042 $469,049
Gross Profit $279,285 $531,972 $664,965 $797,958 $930,951
Operating Expenses
Assembly Wages $9,684 $13,910 $15,997 $27,820 $27,820
Assembly Machinery $650 $200 $200 $200 $200
Cost to Start Up in India $500 $0 $0 $0 $0
Shipping $1,500 $4,500 $4,500 $4,500 $4,500
Import Cost (to India) $4,386 $8,772 $8,772 $8,772 $8,772
Sales Representatives $23,000 $72,000 $72,000 $72,000 $72,000
Salaries $180,000 $180,000 $180,000 $180,000 $180,000
Building Rent $21,636 $21,636 $21,636 $21,636 $21,636
Utilities $4,800 $4,800 $4,800 $4,800 $4,800
System analysis and software testing $1,500 $2,000 $2,000 $2,000 $2,000
Solidworks Software $10,984 $10,980 $10,980 $10,980 $10,980
Total Expenses $258,640 $318,798 $320,885 $332,708 $332,708
Net Income Before Taxes $20,646 $213,174 $344,081 $465,250 $598,243
Tax Expense (33%) $6,813 $70,347 $113,547 $153,533 $197,420
Income after Tax Expense $13,833 $142,827 $230,534 $311,718 $400,823
Balance Sheet
Pro Forma Balance Sheet
Assets Year 1
Cash -$46,361
Inventory $207,722
Total current assets $161,361
Equipment $650
Net Fixed Assets $650
Total Assets $162,011
Liabilities $0
Total current liabilities $0
External Funds Needed $162,011
Total Liabilities $162,011

36
Appendix B – Engineering Diagrams
Figure B1: Exploded view - Tunnel Turbine

37
Figure B2: Exploded view – Deployment Turbine

38
Figure B3: Electrical One line diagram

39
Figure B4: Control State Flow Chart