northcutt bikes case answers
DESCRIPTION
Northcutt Bikes Case Answers. Q1: Demand Data Plot. Q1: Plot Shows. There is seasonality There is a trend Forecast should take into account both. Construction of base indices. Multiple Regression Results: X is Period and Base. Q2: Forecasting Methods. - PowerPoint PPT PresentationTRANSCRIPT

1
Northcutt Bikes CaseAnswers
2
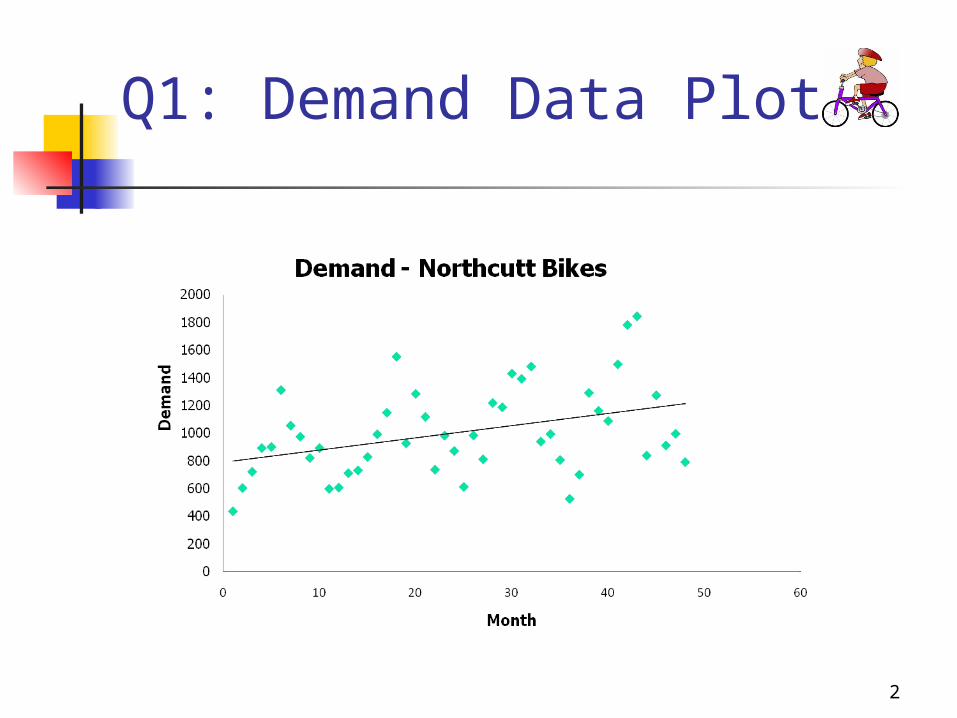
Q1: Demand Data Plot
3
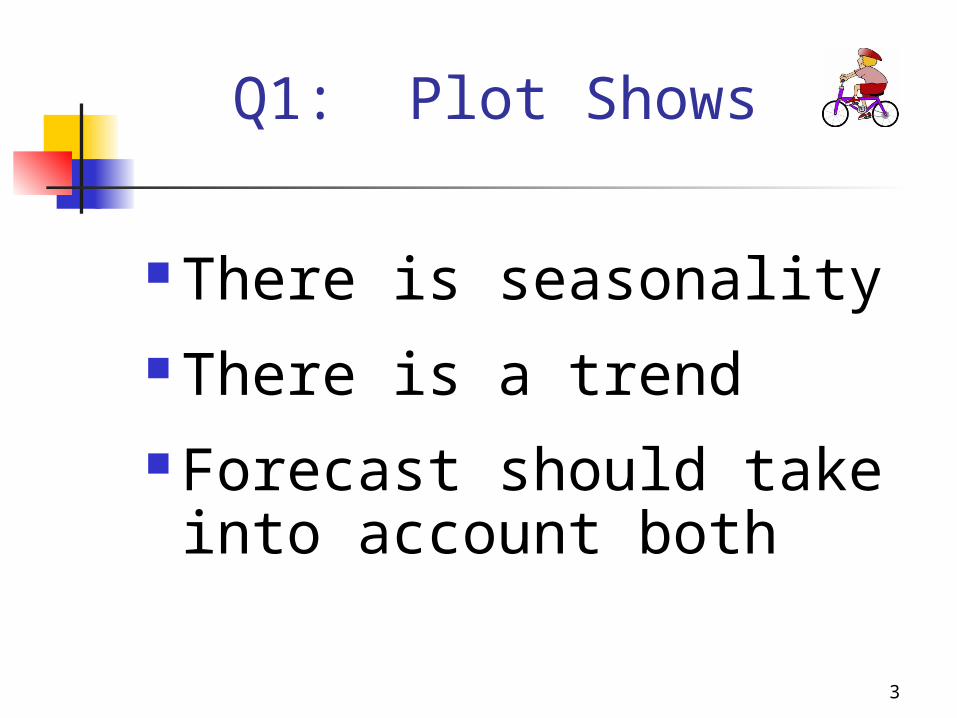
Q1: Plot Shows
There is seasonality There is a trend Forecast should take into
account both
4
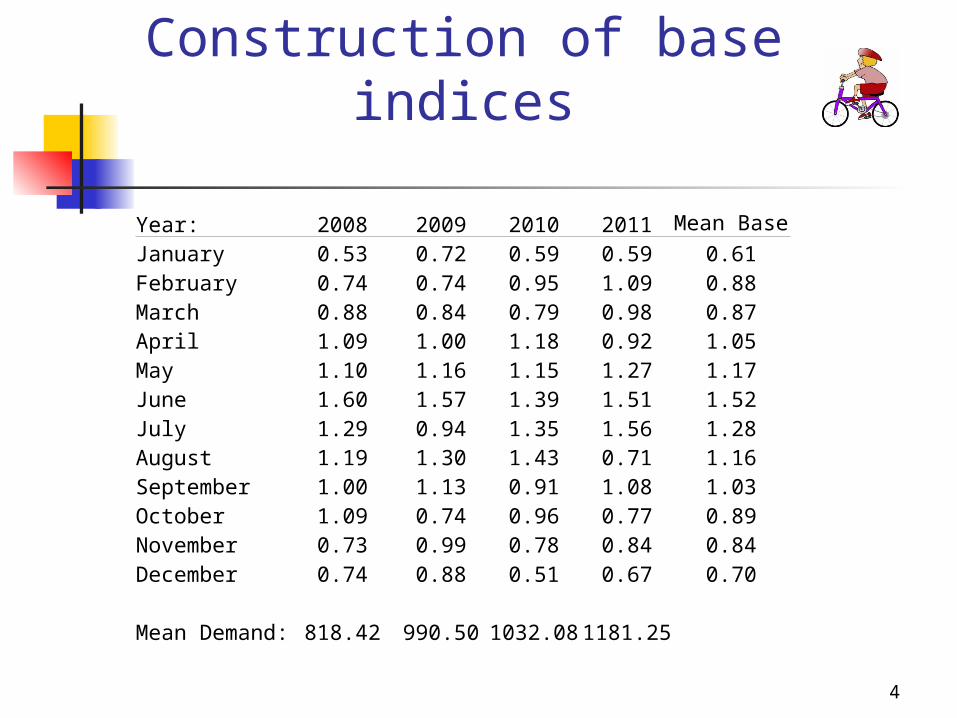
Construction of base indices
Year: 2008 2009 2010 2011 Mean Base
January 0.53 0.72 0.59 0.59 0.61February 0.74 0.74 0.95 1.09 0.88March 0.88 0.84 0.79 0.98 0.87April 1.09 1.00 1.18 0.92 1.05May 1.10 1.16 1.15 1.27 1.17June 1.60 1.57 1.39 1.51 1.52July 1.29 0.94 1.35 1.56 1.28August 1.19 1.30 1.43 0.71 1.16September 1.00 1.13 0.91 1.08 1.03October 1.09 0.74 0.96 0.77 0.89November 0.73 0.99 0.78 0.84 0.84December 0.74 0.88 0.51 0.67 0.70
Mean Demand: 818.42 990.50 1032.08 1181.25
5
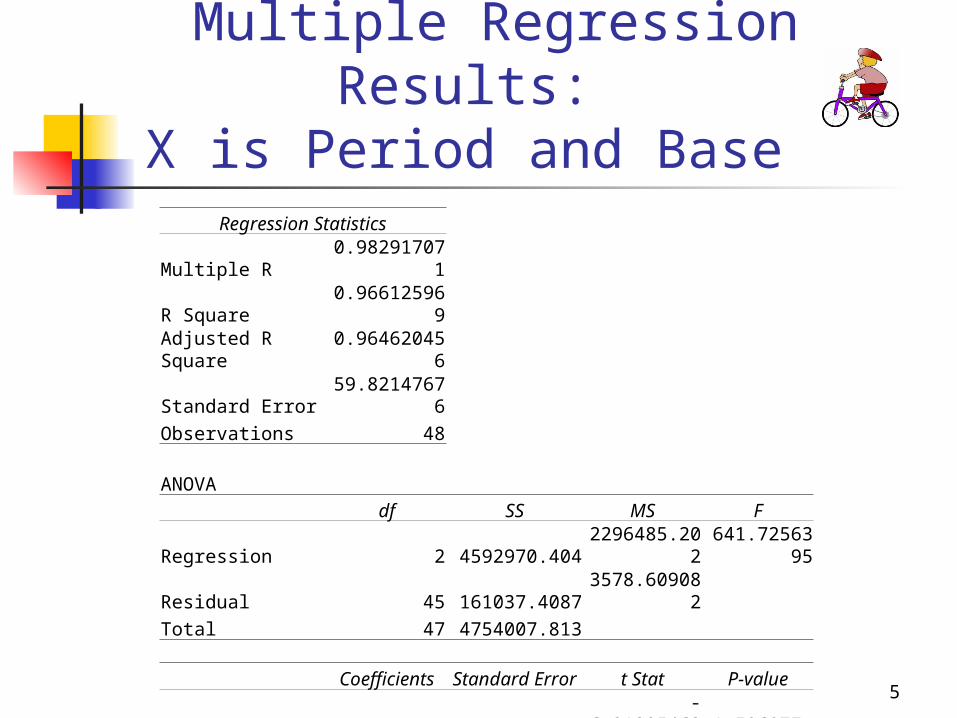
Multiple Regression Results:X is Period and BaseRegression Statistics
Multiple R 0.982917071
R Square 0.966125969
Adjusted R Square 0.964620456
Standard Error 59.82147676
Observations 48
ANOVA
df SS MS F
Regression 2 4592970.404 2296485.202 641.7256395
Residual 45 161037.4087 3578.609082
Total 47 4754007.813
Coefficients Standard Error t Stat P-value
Intercept -219.4209094 35.31667659 -6.212954633 1.50687E-07
Period 8.730540524 0.623285303 14.00729407 5.12015E-18
Base 1011.295853 30.74315604 32.89499139 4.07081E-33
6
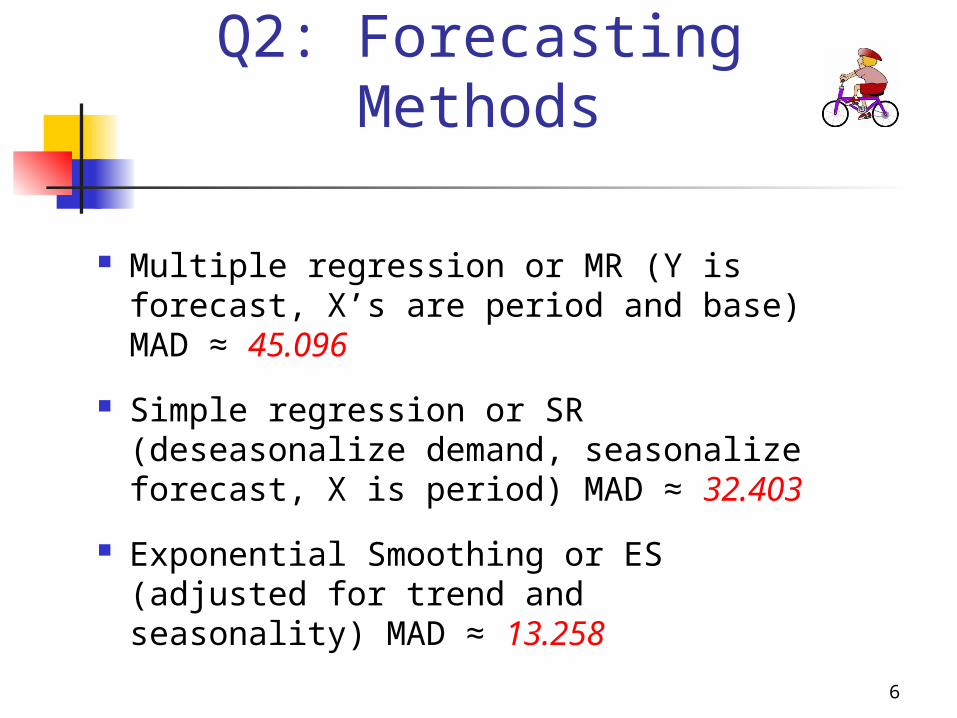
Q2: Forecasting Methods
Multiple regression or MR (Y is forecast, X’s are period and base) MAD ≈ 45.096
Simple regression or SR (deseasonalize demand, seasonalize forecast, X is period) MAD ≈ 32.403
Exponential Smoothing or ES (adjusted for trend and seasonality) MAD ≈ 13.258
7
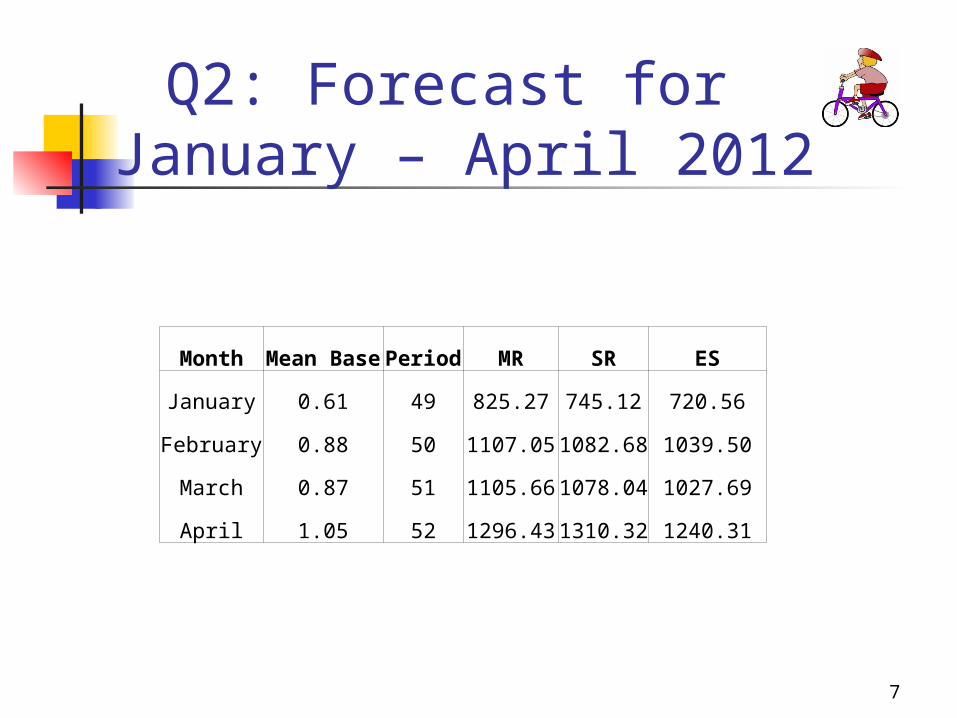
Q2: Forecast for January – April 2012
Month Mean Base Period MR SR ES
January 0.61 49 825.27 745.12 720.56
February 0.88 50 1107.05 1082.68 1039.50
March 0.87 51 1105.66 1078.04 1027.69
April 1.05 52 1296.43 1310.32 1240.31
8
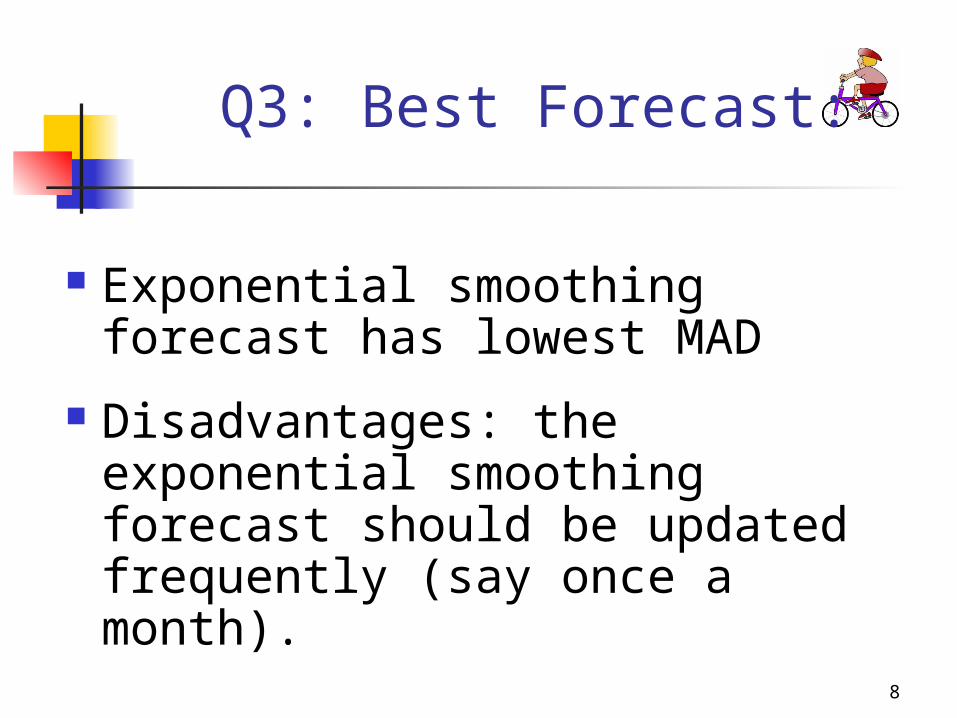
Q3: Best Forecast:
Exponential smoothing forecast has lowest MAD
Disadvantages: the exponential smoothing forecast should be updated frequently (say once a month).
9
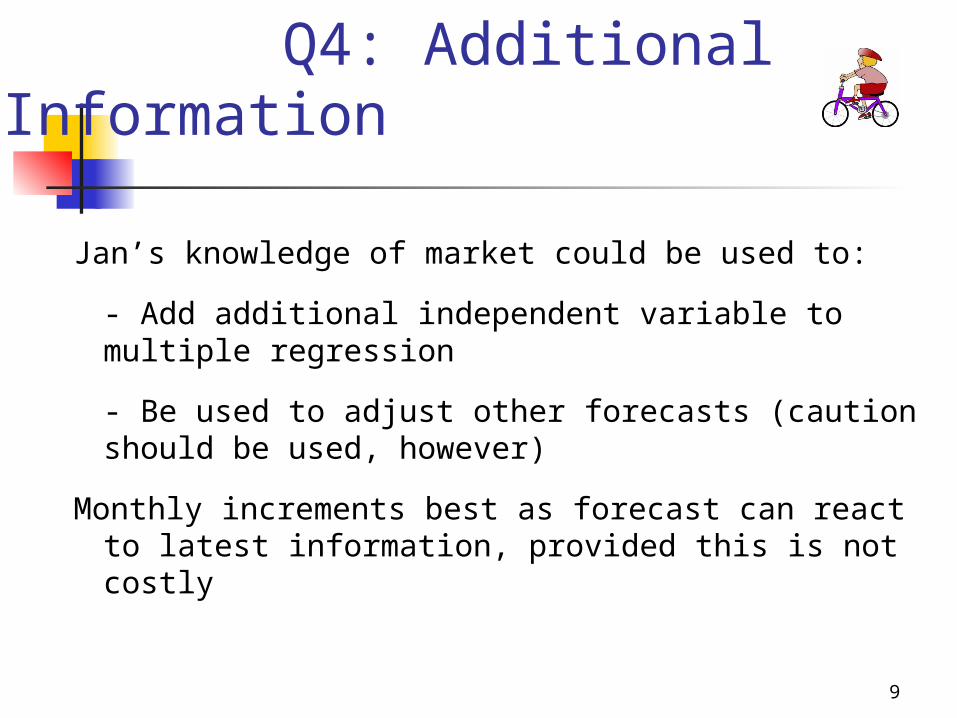
Q4: Additional Information
Jan’s knowledge of market could be used to:
- Add additional independent variable to multiple regression
- Be used to adjust other forecasts (caution should be used, however)
Monthly increments best as forecast can react to latest information, provided this is not costly
10
Q5: Ways to Improve Operations
Quicker response: reduce manufacturing lead times; possibly implement online ordering
Suppliers: reduce lead times; set contracts
Improve information systems Work force: increase flexibility; temps
11
Q6: Recommendations
Operation is likely not too large - Jan can control operation effectively if she: delegates improves information system reduces lead times implements lean (to be discussed) uses different modes of operation for different
style bikes Information needed on costs of above

12
Questions ?
???