north douglas county community health needs … chna phase...center for improvement of child and...
TRANSCRIPT
Center for Improvement of Child and Family Services Page 1 of 39
North Douglas County Community Health Needs Assessment (CHNA)
Phase 2 Regional Health Services Survey Report
Submitted to: Children’s Institute
Submitted by: Callie H. Lambarth, M.S.W., Diane Reid, M.S.W., & Beth L. Green Ph.D.
Portland State University Center for Improvement of Child and Family Services
February 7, 2017
Center for Improvement of Child and Family Services Page 2 of 39
Acknowledgements The Portland State University evaluation team would like to thank the families, community members, and stakeholders who live and work in North Douglas County for sharing your time and insights to make the Community Health Needs Assessment data collection process accessible and successful. We want to recognize the significant work that Heather Olp, Tracy Fall, and Kelli Stevens did to connect with families and service providers to reach as many participants as possible in Drain, Elkton, and Yoncalla to ensure results reflect each community. This project would not have been possible without you. We are especially grateful to work with Erin Helgren, the Early Works Site Liaison of Children’s Institute, who served as a local contact and coordinator, and was essential to the success of the planning process, and to Evelyn Pruse, whose organization and networking helped this phase of the project run smoothly on the ground. Thank you to the Children’s Institute, whose investment in this community-based participatory data collection process allowed local recommendations to emerge.
Center for Improvement of Child and Family Services Page 3 of 39
Contents Acknowledgements ..................................................................................................................................... 2
Executive Summary ..................................................................................................................................... 5
Background ................................................................................................................................................. 6
Methods ...................................................................................................................................................... 7
Regional Health Services Survey ............................................................................................................. 7
Study Area ........................................................................................................................................... 7
Data Collectors .................................................................................................................................... 8
Study Sample ...................................................................................................................................... 8
Survey Instrument & Administration .................................................................................................. 9
Lessons Learned ................................................................................................................................ 10
Steering Committee & Community Engagement ................................................................................. 11
Supplemental Secondary Data Collection ............................................................................................ 11
Key Findings .............................................................................................................................................. 12
Survey Respondents.............................................................................................................................. 12
Community Health & Social Determinants of Health ........................................................................... 15
Overall Health of the Community ..................................................................................................... 15
Child Social & Emotional Health ....................................................................................................... 16
Housing Security & Mobility ............................................................................................................. 17
Food Security .................................................................................................................................... 18
Health Services Utilization .................................................................................................................... 19
Child Health Services ......................................................................................................................... 19
Adult Health Services ........................................................................................................................ 20
Family Support Services .................................................................................................................... 21
Barriers to Health Services Access ........................................................................................................ 22
Child Health Services Barriers ........................................................................................................... 23
Adult Health Services Barriers .......................................................................................................... 23
Service Needs ........................................................................................................................................ 24
Center for Improvement of Child and Family Services Page 4 of 39
Additional Supplemental Secondary Data ............................................................................................ 26
Recommendations .................................................................................................................................... 27
Health, Dental & Mental Health Services ............................................................................................. 28
Health Services .................................................................................................................................. 28
Dental Services .................................................................................................................................. 28
Mental Health Services ..................................................................................................................... 29
Housing Security ................................................................................................................................... 29
Food Security ........................................................................................................................................ 30
Parenting & Family Supports ................................................................................................................ 31
Appendix A: Steering Committee Membership ........................................................................................ 32
Appendix B: Regional Health Services Survey .......................................................................................... 33
Appendix C: Community Flyer .................................................................................................................. 39
Center for Improvement of Child and Family Services Page 5 of 39
Executive Summary Beginning in August 2016, Phase 2 of the North Douglas County (NDC) Community Health Needs Assessment (CHNA) built on work completed in the Phase 1 planning process, and engaged the communities of Drain, Elkton, and Yoncalla, Oregon in the development and administration of a regional health services survey. The purpose of the survey was to learn from families with children ages 0-8 in the NDC region in order to:
• Identify service needs across a range of health service types, e.g., dental care, immunizations, prenatal care, well-child care, primary care, and mental health;
• Identify barriers to access;
• Prioritize the programs and resources families most need to be able to support their and their children’s health;
• Learn about preferred ways families would like to access these services; and
• Recommend strategies to address the prioritized issues, needs, and barriers that emerge from the survey findings.
Who participated in Phase 2?
20 community members/stakeholders, including 9 local parents/caregivers who participated in 4 Steering Committee meetings
3 community members, 1 each in Drain, Elkton, and Yoncalla, who did community outreach directly with other families, and coordinated with schools and other service providers, to distribute and collect surveys
129 survey respondents who participated in the regional health services survey
5 members of the convening team, which included 2 Portland State University staff and 3 Children’s Institute staff
What did we learn?
The high priority issues and recommendations identified by the Steering Committee through their interpretation of results are to:
• Expand health, dental, and mental health services access through the provision of services locally in the NDC region, supports to encourage and complete insurance enrollment, awareness-raising among providers and families about available services, and by building the capacity of community members to deliver and refer to services.
• Improve housing security by working with local government and community organizations to increase the availability and safety of affordable housing.
• Address food security through backyard and community gardens, food sharing programs, cooking classes and community meals, and increased SNAP and WIC enrollment.
• Strengthen parenting and family supports through parent/caregiver engagement and leadership development, raising awareness of parenting support programs and services, expanding breastfeeding supports, and exploring options to support job training programs.
Thank you to everyone who participated in the NDC CHNA!
For more information about the NDC CHNA, please contact: Erin Helgren, [email protected], 541-525-5096
Center for Improvement of Child and Family Services Page 6 of 39
Background Since 2012, two grant-funded initiatives have been supporting work in North Douglas County (NDC) to strengthen early learning and K-12 systems coordination and alignment. The Yoncalla Early Works (YEW) initiative (funded by The Ford Family Foundation and Children’s Institute) and the North Douglas P3 (NDP3) project (funded in 2014 by the Oregon Community Foundation), laid the foundation for the region’s readiness to engage in a Community Health Needs Assessment (CHNA).
Phase 1 of the CHNA consisted of a 6-month planning process, starting with a community kick-off event, followed by a series of Steering Committee meetings, and culminating with a Community Café. The Phase 1 planning process engaged community members in Drain, Elkton, and Yoncalla to explore, understand, and integrate linkages between early learning and young child and family health; identify health-related resources currently available and accessible to NDC families; prioritize health areas of interest to explore through additional data collection; and recommend data collection methods.1
Phase 2 of the CHNA built on the work of Phase 1 by developing a regional health services survey and administering the survey in the communities of Drain, Elkton, and Yoncalla. The purpose of Phase 2 and the regional health services survey was to identify the service needs across a range of health service types, e.g., dental care, immunizations, prenatal care, well-child care, primary care, and mental health, identify barriers to access, prioritize the programs and resources families most need to be able to support their and their children’s health, and the preferred ways community members would like to access these services. The results of this survey show the specific health service needs of NDC families and will serve as a basis for advocating for expanded access to prioritized health services.
This Community Health Needs Assessment (CHNA) was created in partnership with North Douglas County community members, the CHNA Steering Committee, the Center for Improvement of Child and Family Services at Portland State University (PSU), and Children’s Institute. The activities described in this report were carried out in partnership with the CHNA Steering Committee, which guided the work outlined in the Phase 1 report of the CHNA. Phase 1 and 2 of the CHNA were structured around the following “Big Questions”.
1 Lambarth, C. H., Reid, D., & Green, B. L. (2016). North Douglas County Community Health Needs Assessment (CHNA) Phase 1 Planning Report. Portland, OR: Center for Improvement of Child & Family Services, Portland State University.
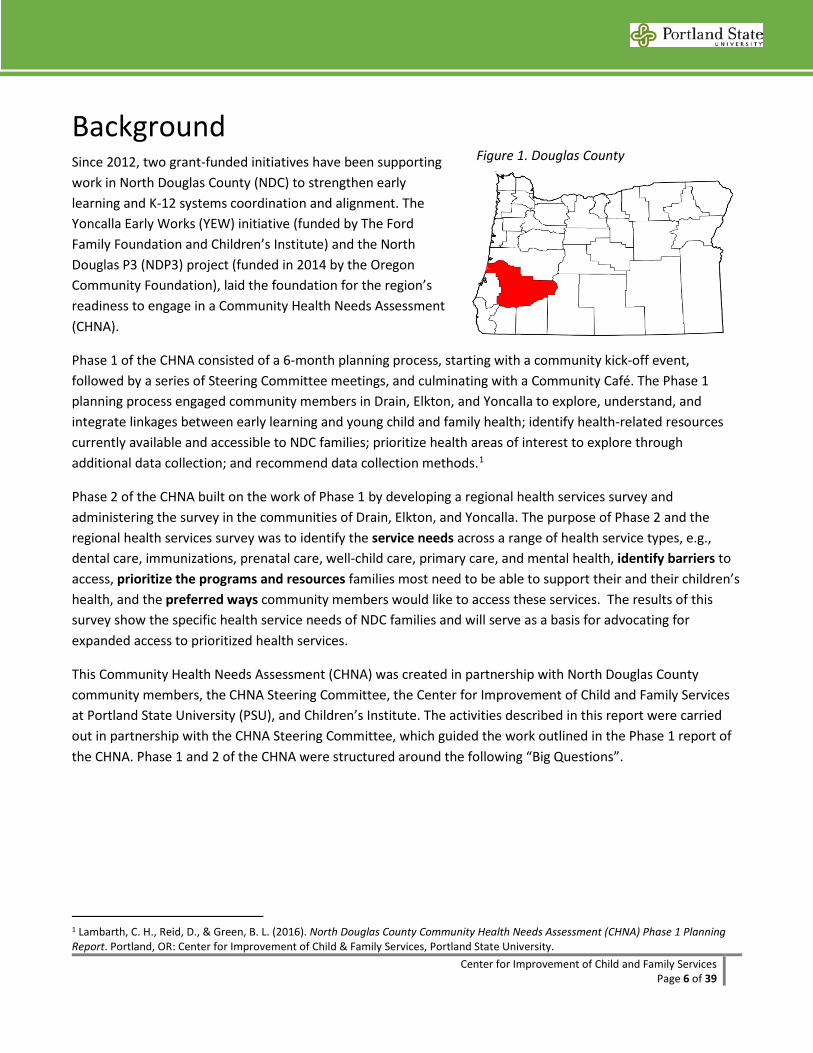
Figure 1. Douglas County
Center for Improvement of Child and Family Services Page 7 of 39
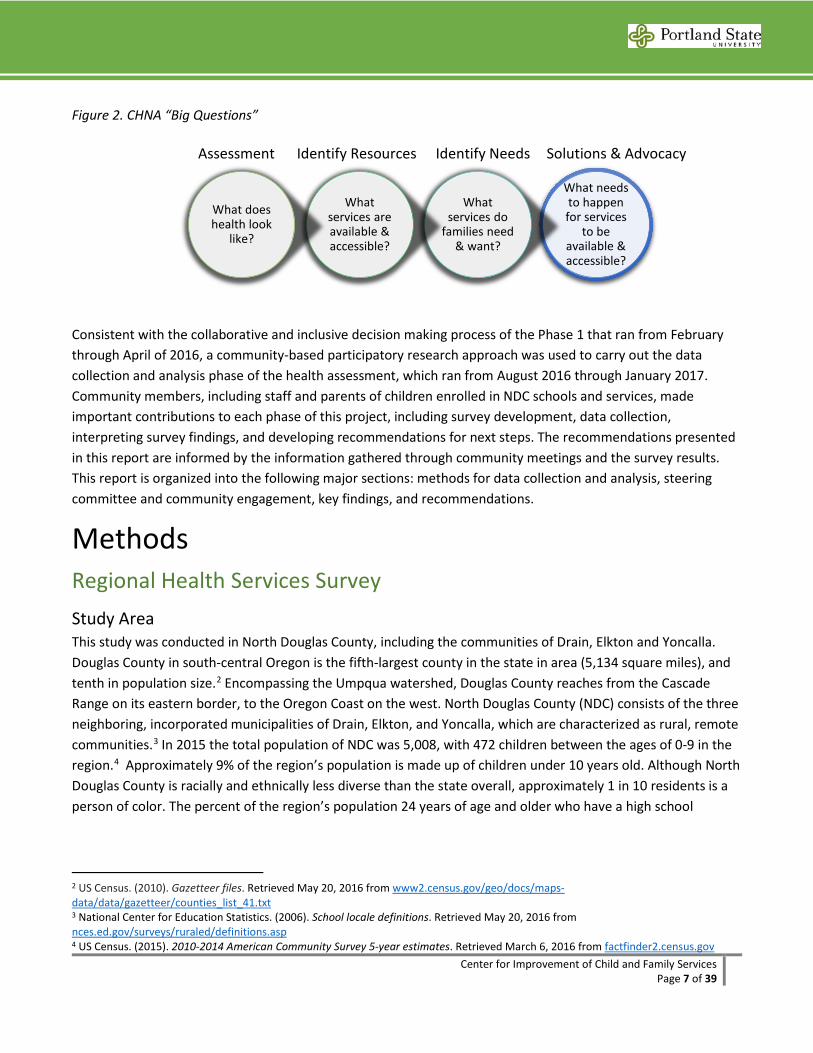
Figure 2. CHNA “Big Questions”
Consistent with the collaborative and inclusive decision making process of the Phase 1 that ran from February through April of 2016, a community-based participatory research approach was used to carry out the data collection and analysis phase of the health assessment, which ran from August 2016 through January 2017. Community members, including staff and parents of children enrolled in NDC schools and services, made important contributions to each phase of this project, including survey development, data collection, interpreting survey findings, and developing recommendations for next steps. The recommendations presented in this report are informed by the information gathered through community meetings and the survey results. This report is organized into the following major sections: methods for data collection and analysis, steering committee and community engagement, key findings, and recommendations.
Methods Regional Health Services Survey Study Area This study was conducted in North Douglas County, including the communities of Drain, Elkton and Yoncalla. Douglas County in south-central Oregon is the fifth-largest county in the state in area (5,134 square miles), and tenth in population size.2 Encompassing the Umpqua watershed, Douglas County reaches from the Cascade Range on its eastern border, to the Oregon Coast on the west. North Douglas County (NDC) consists of the three neighboring, incorporated municipalities of Drain, Elkton, and Yoncalla, which are characterized as rural, remote communities.3 In 2015 the total population of NDC was 5,008, with 472 children between the ages of 0-9 in the region.4 Approximately 9% of the region’s population is made up of children under 10 years old. Although North Douglas County is racially and ethnically less diverse than the state overall, approximately 1 in 10 residents is a person of color. The percent of the region’s population 24 years of age and older who have a high school
2 US Census. (2010). Gazetteer files. Retrieved May 20, 2016 from www2.census.gov/geo/docs/maps-data/data/gazetteer/counties_list_41.txt 3 National Center for Education Statistics. (2006). School locale definitions. Retrieved May 20, 2016 from nces.ed.gov/surveys/ruraled/definitions.asp 4 US Census. (2015). 2010-2014 American Community Survey 5-year estimates. Retrieved March 6, 2016 from factfinder2.census.gov
What needs to happen for services
to be available & accessible?
What services do
families need & want?
What services are available & accessible?
What does health look
like?
Assessment Identify Resources Identify Needs Solutions & Advocacy
Center for Improvement of Child and Family Services Page 8 of 39
diploma/GED is similar to the rest of the county and the state, but the percent who are college graduates (11%) is lower than the county (16%) and state rates (30%).4
Data Collectors There were three primary community data collectors, one working in each target community (Drain, Elkton, and Yoncalla), and two Children’s Institute staff who supported data collectors and data collection activities. Portland State University staff provided regular (daily to weekly) support via phone, email, and text during the data collection period to data collectors, as well as regular check-ins with Children’s Institute staff to coordinate data collection efforts. Data collectors administered surveys by inviting families to participate at school and community events, or in community locations. Data collectors also sent surveys home through the school to families with children in PreK through 3rd grades.
To prepare for these activities, the three community data collectors completed the on-line National Institutes of Health, Protecting Human Subject Research Participants course and participated in a PSU data collector training on October 7, 2016. At this training data collectors were given background information on the project and the findings of Phase 1, a thorough review of the survey tool and data collection protocols, opportunities to practice inviting families to participate and how to offer participation support, and tools to develop an outreach plan for their community. Data collectors were offered a stipend of $15 per hour spent on community engagement and it was anticipated they would give 25 hours each. In practice, this varied for data collectors, ranging from 10 to 29 hours.
Study Sample Surveys were collected in October and November of 2016. To be eligible to participate in the regional health services survey, individuals had to live Drain, Elkton, or Yoncalla; be at least 17 years of age; and be either pregnant or the primary caregiver of a child under 9 years of age. Multiple strategies were used for the sample of regional health services survey participants including intercept surveying at community events and locations and convenience sampling through local schools.
Two waves of surveys were sent home with all students in PreK, kindergarten, 1st, 2nd, and 3rd grade classes in Drain and Elkton over a three-week period, including a cover letter endorsed by the school principals. Surveys were also sent home to all the students in PreK and kindergarten classes in Yoncalla in early November to coincide with the timing of parent-teacher conferences. Data collectors also approached families that they knew in the community and promoted the survey through their personal social media.
Center for Improvement of Child and Family Services Page 9 of 39
Community and school locations and events included:
Drain
• Family Relief Nursery • Food pantry • Junior Bowling League
nights • Post Office • Taekwondo Tiger
testing • Holiday Festival • PreK through 3rd grade
send homes and at parent-teacher conferences
Elkton
• Fall festival • Theater performance
night • PreK through 3rd grade
send homes and at parent-teacher conferences
Yoncalla
• Science Fair • Family Room groups
and activities • Library • First grade family
dinner • PreK and kindergarten
send homes and at parent-teacher conferences
Survey Instrument & Administration The regional health services survey included 117 items focusing on community health, health and mental health services access, program and service needs, and demographics. The survey was developed by the CHNA Steering Committee through an iterative process that involved identifying possible survey items from existing health access measurement tools,5 ensuring that priority areas were addressed by the questions chosen for inclusion, and editing for length and readability. The survey questions were finalized after obtaining feedback from community stakeholders and pilot-testing the instrument at a Steering Committee meeting. The survey is included in Appendix B.
Surveys were collected without any individually-identifying information in order to keep the data anonymous. Survey respondents were offered the choice to include their name and contact information to participate in a random drawing for one of fourteen prizes of $50 or one grand prize of $100 upon completion of the survey to thank them for their participation. The contact information was collected on a separate sheet of paper which
5 Centers for Disease Control and Prevention. (2016). National health interview survey (NHIS). Retrieved August 11, 2016 from https://www.cdc.gov/nchs/nhis/data-questionnaires-documentation.htm Colorado Health Institute. (2015). Colorado health access survey: 2015 questionnaire. Retrieved August 11, 2016 from http://www.coloradohealthinstitute.org/uploads/downloads/2015_CHAS_SurveyTool.pdf Izumi, B. (2014). Earl Boyles Early Works community health assessment: Neighborhood health survey 2014. Personal communication, March 12, 2016. National Center for Rural Health Works. (2016) Health survey questionnaire: Community health needs assessment template. Retrieved August 11, 2016 from http://ruralhealthworks.org/chn/ Promise Neighborhoods Research Consortium. (2011). Community member and parent survey (CMP V38). Retrieved August 11, 2016 from http://promiseneighborhoods.org/media/uploads/cms/pdf/CMP%20V38.pdf Promise Neighborhood Research Consortium. (2011). Survey of current supports for successful youth development. Retrieved August 1, 2016 from https://www.unodc.org/documents/prevention/pnrc_neighborhood_check_up_resident.pdf
Center for Improvement of Child and Family Services Page 10 of 39
participants could submit separately from their survey. The Portland State University Institutional Review Board provided a waiver for review not required for this study and procedures due to the anonymity of the data and the results being used to inform program development or enhancement, rather than producing generalizable findings to inform a larger body of research.
Lessons Learned To assess the strengths and challenges of the data collection process, data collectors were interviewed at the end of the data collection period to provide additional feedback on what the overarching strengths and challenges had been. Overall, data collectors, and Children’s Institute staff who supported them, felt that the data collection process went well and that the return rates were strong. All agreed that investing in well trained, well supported, and committed community data collectors was a major strength of Phase 2. Different levels of support worked for different individuals, e.g., one data collector benefitted from daily check-ins by text, while another data collector preferred a weekly phone call or email. Coordinating with school and community partners to disseminate and promote the survey was essential to reaching a wide cross-section of families. This is illustrated by the following shared by one data collector:
The return rates were highest through individual contacts and if the data collector was able to stay with the participant until the survey was completed. Sending surveys home through the schools also generated good returns. As shared by one data collector:
When community members expressed interest in completing a survey and took it away with them to complete at a later time, surveys were less likely to be returned or mailed back in the pre-stamped envelopes provided. Data collectors mentioned that the entering into the optional drawing for one of 14 prizes of $50 and one $100 prize, however, was appealing to most survey participants.
In addition to one-on-one and school outreach, the surveys were made available electronically and could be accessed through scanning a “quick response” (QR) code from hard copies of the flyers distributed, or through clicking on electronic versions of the flyer posted to social media and school websites. Although data collectors agreed it was helpful to have those options available and to raise awareness of the survey, only 3 respondents ultimately completed the online version of the survey. The biggest challenge noted by data collectors was the length of the survey. It was designed as 3 pages, front-and-back, which was time consuming for families. One of the questions in particular was also confusing to some families, where they were being asked to both prioritize
“The support around helping…data collectors identify some strategies for collecting, that was really helpful. Asking [the data collectors] ‘where could we collect?’ and the freedom for each community member and let them tweak it to what will work best in their community was a really respectful way of approaching it.”
“Definitely the community activities, the parent teacher conferences [were effective for collecting surveys]. I know I’m going to see pretty much everybody in the area during that time.”
Center for Improvement of Child and Family Services Page 11 of 39
and rank service needs in a single question, and then provide feedback specific to those needs about where, when, and how often they would like to access those services.
Steering Committee & Community Engagement Between September 15, 2016 and January 25, 2017, four Steering Committee meetings were held, which engaged 20 stakeholders from the Drain, Elkton, and Yoncalla communities, including 9 local parents of young children.6 Members self-selected into participating on the Steering Committee, in addition to those recruited through specific outreach in order to represent key organizations or perspectives. Membership reflected local families, health services, K-12 staff, school district leadership, early learning and family support providers, and economic development.7 Parents who were not representing their professional roles received $20 stipends for their participation in Steering Committee meetings, and dinner and child care were provided at each meeting. Meetings took place in the Yoncalla Family Room and the North Douglas Elementary School in Drain.
Based on the Phase 1 findings and decisions made at each Steering Committee, the CHNA planning and facilitation team (comprised of PSU and Children’s Institute staff) developed meeting agendas to build structured Steering Committee discussions and work time around the following goals/activities:
1) Set expectations for the CHNA including deliverables and timeline
2) Identify questions to be answered by the survey
3) Review items for survey inclusion
4) Edit and refine the survey instrument and data collection protocols
5) Pilot the survey and provide revision suggestions
6) Review and interpret NDC and community level data from the survey
7) Review the draft CHNA report and develop recommendations
Along with attending regular Steering Committee meetings, members promoted the survey through their organizations and among families they work with through their professional roles.
Supplemental Secondary Data Collection Building on the findings from Phase 1, PSU staff searched for additional early childhood and family health data sources to supplement what was known for the North Douglas County region. Data sources included Census reports, Coordinated Care Organization (CCO) metrics, Oregon Department of Education, and the Women, Infants, and Children (WIC) program.
6 Three parents also represented their professional roles as superintendent, family support services staff, and school psychologist. 7 Refer to Appendix A for a complete membership list.
Center for Improvement of Child and Family Services Page 12 of 39
Key Findings Regional health services survey data analysis was conducted by Portland State University staff. Steering Committee members, including data collectors, and Children’s Institute staff contributed to the interpretation of survey findings and developed recommendations based on the data.
Survey Respondents The final sample size of the regional health services survey was 129 respondents. Although the study area was intended to be limited to residents of Drain, Elkton, and Yoncalla, 17 respondents reported being residents of Cottage Grove, Oakland, Reedsport, Scottsburg, Umpqua, and Winston. Respondents outside of the Drain, Elkton, and Yoncalla zip codes who completed the survey, likely did so through their child’s school.
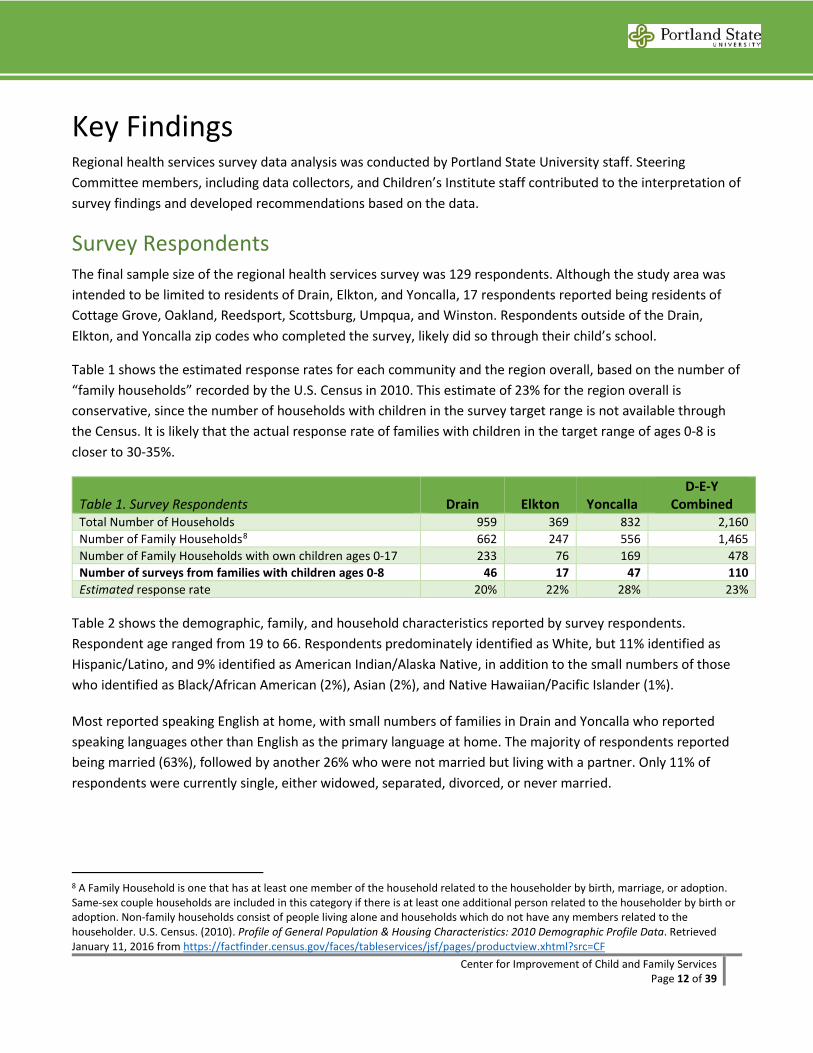
Table 1 shows the estimated response rates for each community and the region overall, based on the number of “family households” recorded by the U.S. Census in 2010. This estimate of 23% for the region overall is conservative, since the number of households with children in the survey target range is not available through the Census. It is likely that the actual response rate of families with children in the target range of ages 0-8 is closer to 30-35%.
Table 1. Survey Respondents Drain Elkton Yoncalla D-E-Y
Combined Total Number of Households 959 369 832 2,160 Number of Family Households8 662 247 556 1,465 Number of Family Households with own children ages 0-17 233 76 169 478 Number of surveys from families with children ages 0-8 46 17 47 110 Estimated response rate 20% 22% 28% 23%
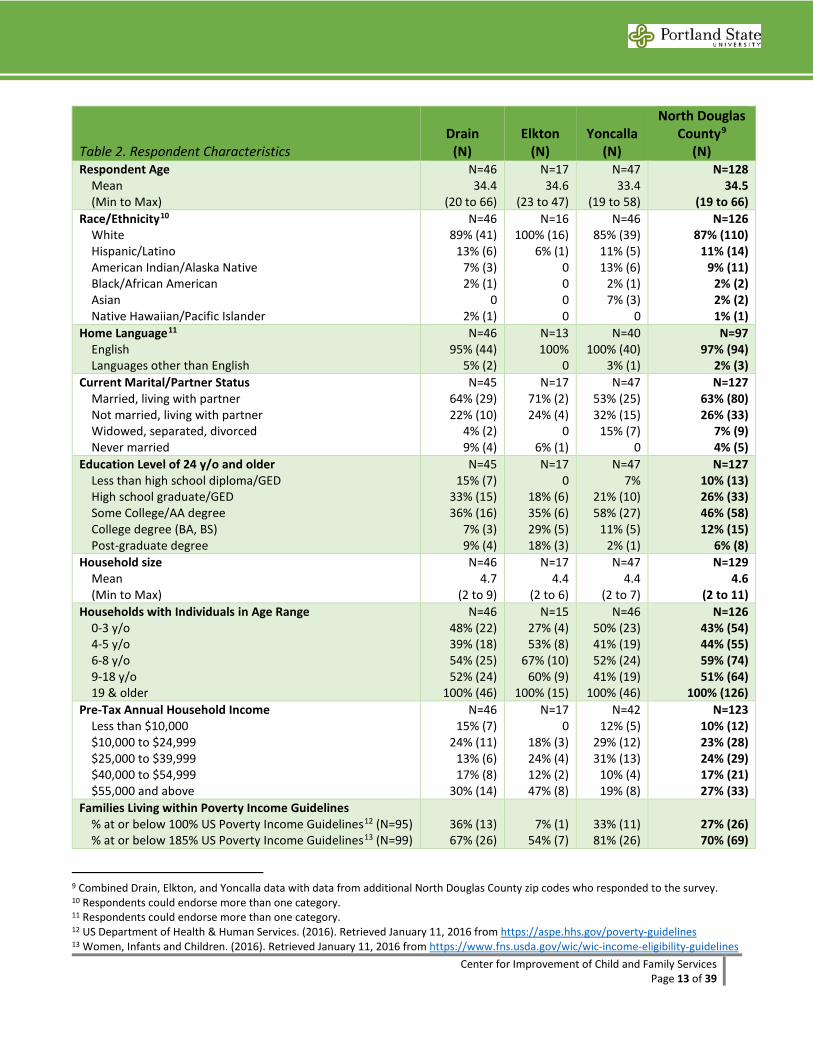
Table 2 shows the demographic, family, and household characteristics reported by survey respondents. Respondent age ranged from 19 to 66. Respondents predominately identified as White, but 11% identified as Hispanic/Latino, and 9% identified as American Indian/Alaska Native, in addition to the small numbers of those who identified as Black/African American (2%), Asian (2%), and Native Hawaiian/Pacific Islander (1%).
Most reported speaking English at home, with small numbers of families in Drain and Yoncalla who reported speaking languages other than English as the primary language at home. The majority of respondents reported being married (63%), followed by another 26% who were not married but living with a partner. Only 11% of respondents were currently single, either widowed, separated, divorced, or never married.
8 A Family Household is one that has at least one member of the household related to the householder by birth, marriage, or adoption. Same-sex couple households are included in this category if there is at least one additional person related to the householder by birth or adoption. Non-family households consist of people living alone and households which do not have any members related to the householder. U.S. Census. (2010). Profile of General Population & Housing Characteristics: 2010 Demographic Profile Data. Retrieved January 11, 2016 from https://factfinder.census.gov/faces/tableservices/jsf/pages/productview.xhtml?src=CF
Center for Improvement of Child and Family Services Page 13 of 39
Table 2. Respondent Characteristics Drain
(N) Elkton
(N) Yoncalla
(N)
North Douglas County9
(N) Respondent Age Mean (Min to Max)
N=46 34.4
(20 to 66)
N=17 34.6
(23 to 47)
N=47 33.4
(19 to 58)
N=128 34.5
(19 to 66) Race/Ethnicity10 White Hispanic/Latino American Indian/Alaska Native Black/African American Asian Native Hawaiian/Pacific Islander
N=46 89% (41)
13% (6) 7% (3) 2% (1)
0 2% (1)
N=16 100% (16)
6% (1) 0 0 0 0
N=46 85% (39)
11% (5) 13% (6)
2% (1) 7% (3)
0
N=126 87% (110)
11% (14) 9% (11)
2% (2) 2% (2) 1% (1)
Home Language11 English Languages other than English
N=46 95% (44)
5% (2)
N=13 100%
0
N=40 100% (40)
3% (1)
N=97 97% (94)
2% (3) Current Marital/Partner Status Married, living with partner Not married, living with partner Widowed, separated, divorced Never married
N=45 64% (29) 22% (10)
4% (2) 9% (4)
N=17 71% (2) 24% (4)
0 6% (1)
N=47 53% (25) 32% (15)
15% (7) 0
N=127 63% (80) 26% (33)
7% (9) 4% (5)
Education Level of 24 y/o and older Less than high school diploma/GED High school graduate/GED Some College/AA degree College degree (BA, BS) Post-graduate degree
N=45 15% (7)
33% (15) 36% (16)
7% (3) 9% (4)
N=17 0
18% (6) 35% (6) 29% (5) 18% (3)
N=47 7%
21% (10) 58% (27)
11% (5) 2% (1)
N=127 10% (13) 26% (33) 46% (58) 12% (15)
6% (8) Household size Mean (Min to Max)
N=46 4.7
(2 to 9)
N=17 4.4
(2 to 6)
N=47 4.4
(2 to 7)
N=129 4.6
(2 to 11) Households with Individuals in Age Range 0-3 y/o 4-5 y/o 6-8 y/o 9-18 y/o 19 & older
N=46 48% (22) 39% (18) 54% (25) 52% (24)
100% (46)
N=15 27% (4) 53% (8)
67% (10) 60% (9)
100% (15)
N=46 50% (23) 41% (19) 52% (24) 41% (19)
100% (46)
N=126 43% (54) 44% (55) 59% (74) 51% (64)
100% (126) Pre-Tax Annual Household Income Less than $10,000 $10,000 to $24,999 $25,000 to $39,999 $40,000 to $54,999 $55,000 and above
N=46 15% (7)
24% (11) 13% (6) 17% (8)
30% (14)
N=17 0
18% (3) 24% (4) 12% (2) 47% (8)
N=42 12% (5)
29% (12) 31% (13)
10% (4) 19% (8)
N=123 10% (12) 23% (28) 24% (29) 17% (21) 27% (33)
Families Living within Poverty Income Guidelines % at or below 100% US Poverty Income Guidelines12 (N=95) % at or below 185% US Poverty Income Guidelines13 (N=99)
36% (13) 67% (26)
7% (1) 54% (7)
33% (11) 81% (26)
27% (26) 70% (69)
9 Combined Drain, Elkton, and Yoncalla data with data from additional North Douglas County zip codes who responded to the survey. 10 Respondents could endorse more than one category. 11 Respondents could endorse more than one category. 12 US Department of Health & Human Services. (2016). Retrieved January 11, 2016 from https://aspe.hhs.gov/poverty-guidelines 13 Women, Infants and Children. (2016). Retrieved January 11, 2016 from https://www.fns.usda.gov/wic/wic-income-eligibility-guidelines
Center for Improvement of Child and Family Services Page 14 of 39
Table 2. Respondent Characteristics Drain
(N) Elkton
(N) Yoncalla
(N)
North Douglas County14
(N) Length of time living in the community Less than a year 1 to 5 years 6 to 10 years 11 or more years
N=44 18% (8) 16% (7) 18% (8)
48% (21)
N=16 6% (1)
50% (8) 6% (1)
38% (6)
N=45 7% (3)
29% (13) 7% (3)
58% (26)
N=125 12% (15) 26% (32) 12% (15) 50% (63)
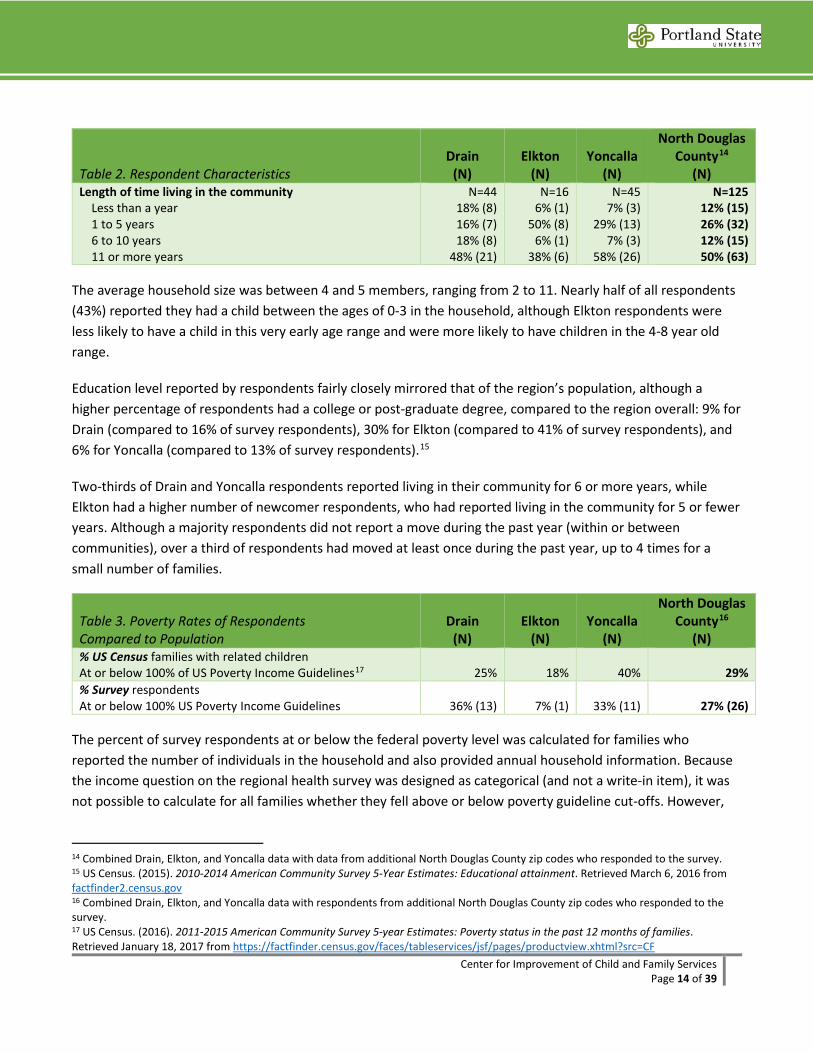
The average household size was between 4 and 5 members, ranging from 2 to 11. Nearly half of all respondents (43%) reported they had a child between the ages of 0-3 in the household, although Elkton respondents were less likely to have a child in this very early age range and were more likely to have children in the 4-8 year old range.
Education level reported by respondents fairly closely mirrored that of the region’s population, although a higher percentage of respondents had a college or post-graduate degree, compared to the region overall: 9% for Drain (compared to 16% of survey respondents), 30% for Elkton (compared to 41% of survey respondents), and 6% for Yoncalla (compared to 13% of survey respondents).15
Two-thirds of Drain and Yoncalla respondents reported living in their community for 6 or more years, while Elkton had a higher number of newcomer respondents, who had reported living in the community for 5 or fewer years. Although a majority respondents did not report a move during the past year (within or between communities), over a third of respondents had moved at least once during the past year, up to 4 times for a small number of families.
Table 3. Poverty Rates of Respondents Compared to Population
Drain (N)
Elkton (N)
Yoncalla (N)
North Douglas County16
(N) % US Census families with related children At or below 100% of US Poverty Income Guidelines17 25% 18% 40% 29% % Survey respondents At or below 100% US Poverty Income Guidelines 36% (13) 7% (1) 33% (11) 27% (26)
The percent of survey respondents at or below the federal poverty level was calculated for families who reported the number of individuals in the household and also provided annual household information. Because the income question on the regional health survey was designed as categorical (and not a write-in item), it was not possible to calculate for all families whether they fell above or below poverty guideline cut-offs. However,
14 Combined Drain, Elkton, and Yoncalla data with data from additional North Douglas County zip codes who responded to the survey. 15 US Census. (2015). 2010-2014 American Community Survey 5-Year Estimates: Educational attainment. Retrieved March 6, 2016 from factfinder2.census.gov 16 Combined Drain, Elkton, and Yoncalla data with respondents from additional North Douglas County zip codes who responded to the survey. 17 US Census. (2016). 2011-2015 American Community Survey 5-year Estimates: Poverty status in the past 12 months of families. Retrieved January 18, 2017 from https://factfinder.census.gov/faces/tableservices/jsf/pages/productview.xhtml?src=CF
Center for Improvement of Child and Family Services Page 15 of 39
for the 95 families for whom the information was available to calculate poverty level, and the 99 families for whom we could calculate 185% of poverty level, they somewhat represented the 2016 Census estimates for percent of families below the federal poverty level for Drain (slightly overrepresented) and Yoncalla (slightly underrepresented), but less so for Elkton, as shown in Table 3.18
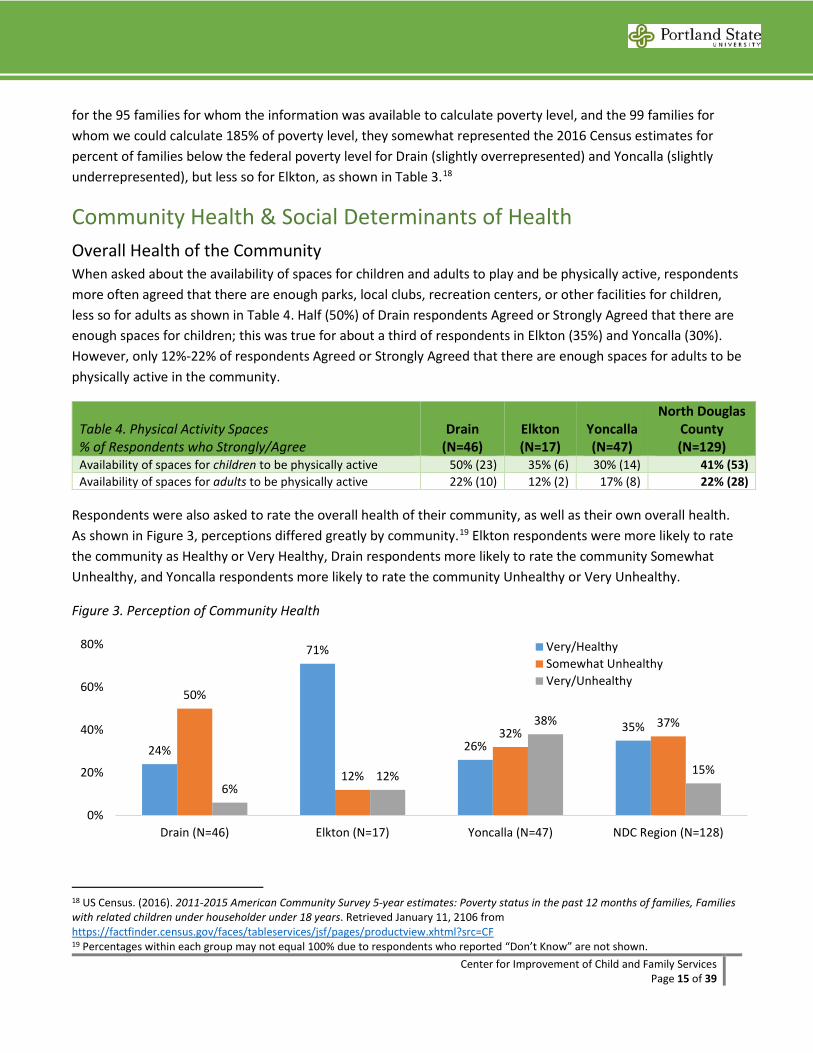
Community Health & Social Determinants of Health Overall Health of the Community When asked about the availability of spaces for children and adults to play and be physically active, respondents more often agreed that there are enough parks, local clubs, recreation centers, or other facilities for children, less so for adults as shown in Table 4. Half (50%) of Drain respondents Agreed or Strongly Agreed that there are enough spaces for children; this was true for about a third of respondents in Elkton (35%) and Yoncalla (30%). However, only 12%-22% of respondents Agreed or Strongly Agreed that there are enough spaces for adults to be physically active in the community.
Table 4. Physical Activity Spaces % of Respondents who Strongly/Agree
Drain (N=46)
Elkton (N=17)
Yoncalla (N=47)
North Douglas County (N=129)
Availability of spaces for children to be physically active 50% (23) 35% (6) 30% (14) 41% (53) Availability of spaces for adults to be physically active 22% (10) 12% (2) 17% (8) 22% (28)
Respondents were also asked to rate the overall health of their community, as well as their own overall health. As shown in Figure 3, perceptions differed greatly by community.19 Elkton respondents were more likely to rate the community as Healthy or Very Healthy, Drain respondents more likely to rate the community Somewhat Unhealthy, and Yoncalla respondents more likely to rate the community Unhealthy or Very Unhealthy.
Figure 3. Perception of Community Health
18 US Census. (2016). 2011-2015 American Community Survey 5-year estimates: Poverty status in the past 12 months of families, Families with related children under householder under 18 years. Retrieved January 11, 2106 from https://factfinder.census.gov/faces/tableservices/jsf/pages/productview.xhtml?src=CF 19 Percentages within each group may not equal 100% due to respondents who reported “Don’t Know” are not shown.
24%
71%
26%35%
50%
12%
32%37%
6%12%
38%
15%
0%
20%
40%
60%
80%
Drain (N=46) Elkton (N=17) Yoncalla (N=47) NDC Region (N=128)
Very/HealthySomewhat UnhealthyVery/Unhealthy
Center for Improvement of Child and Family Services Page 16 of 39
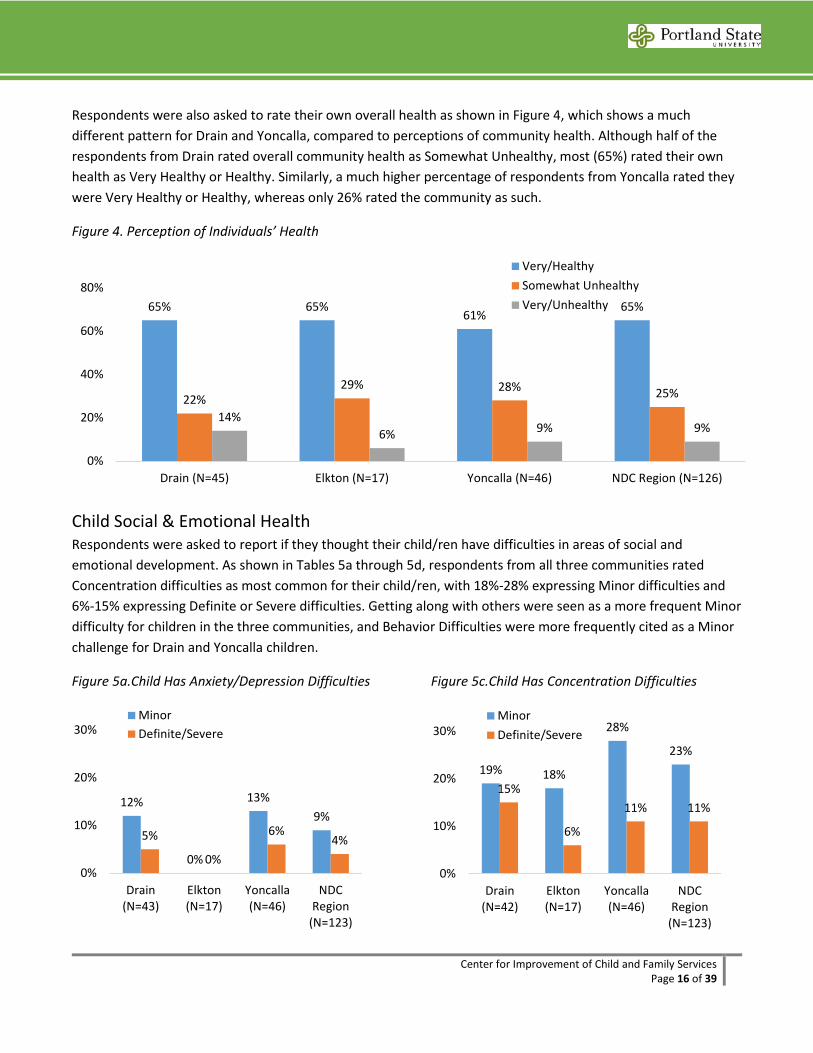
Respondents were also asked to rate their own overall health as shown in Figure 4, which shows a much different pattern for Drain and Yoncalla, compared to perceptions of community health. Although half of the respondents from Drain rated overall community health as Somewhat Unhealthy, most (65%) rated their own health as Very Healthy or Healthy. Similarly, a much higher percentage of respondents from Yoncalla rated they were Very Healthy or Healthy, whereas only 26% rated the community as such.
Figure 4. Perception of Individuals’ Health
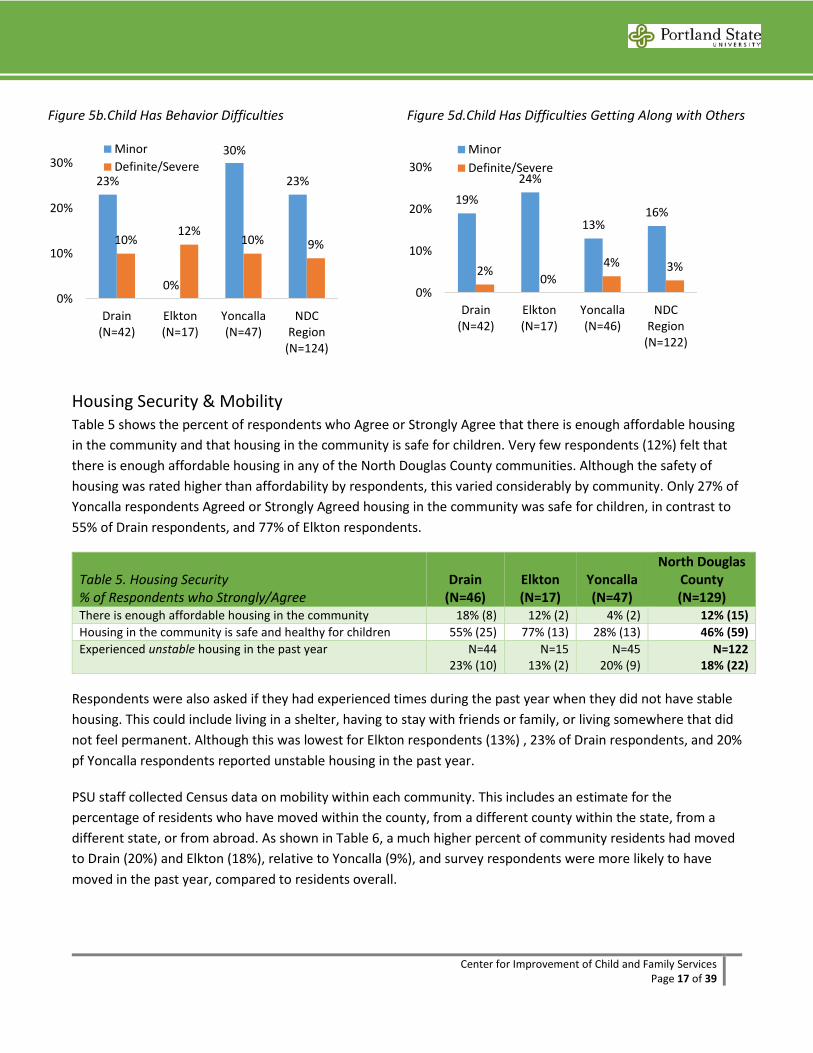
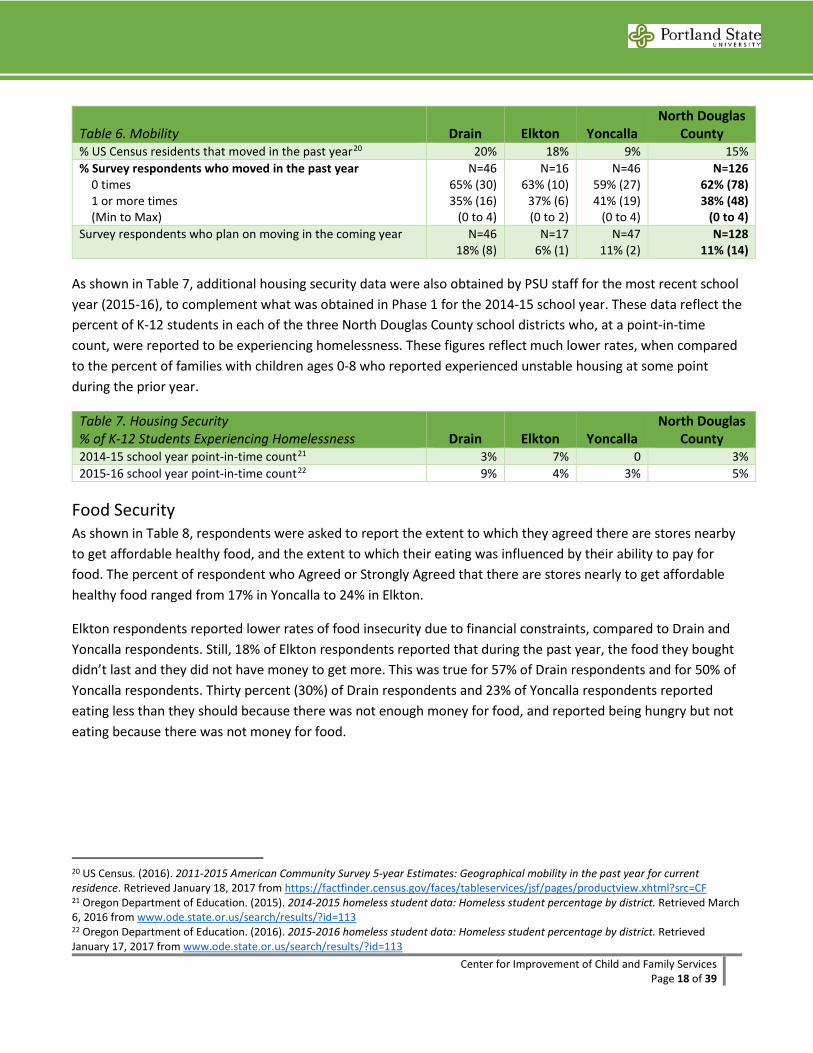
Child Social & Emotional Health Respondents were asked to report if they thought their child/ren have difficulties in areas of social and emotional development. As shown in Tables 5a through 5d, respondents from all three communities rated Concentration difficulties as most common for their child/ren, with 18%-28% expressing Minor difficulties and 6%-15% expressing Definite or Severe difficulties. Getting along with others were seen as a more frequent Minor difficulty for children in the three communities, and Behavior Difficulties were more frequently cited as a Minor challenge for Drain and Yoncalla children.
Figure 5a.Child Has Anxiety/Depression Difficulties
Figure 5c.Child Has Concentration Difficulties
65% 65%61%
65%
22%29% 28% 25%
14%6% 9% 9%
0%
20%
40%
60%
80%
Drain (N=45) Elkton (N=17) Yoncalla (N=46) NDC Region (N=126)
Very/HealthySomewhat UnhealthyVery/Unhealthy
12%
0%
13%9%
5%
0%
6%4%
0%
10%
20%
30%
Drain(N=43)
Elkton(N=17)
Yoncalla(N=46)
NDCRegion
(N=123)
MinorDefinite/Severe
19% 18%
28%
23%
15%
6%
11% 11%
0%
10%
20%
30%
Drain(N=42)
Elkton(N=17)
Yoncalla(N=46)
NDCRegion
(N=123)
MinorDefinite/Severe
Center for Improvement of Child and Family Services Page 17 of 39
Figure 5b.Child Has Behavior Difficulties
Figure 5d.Child Has Difficulties Getting Along with Others
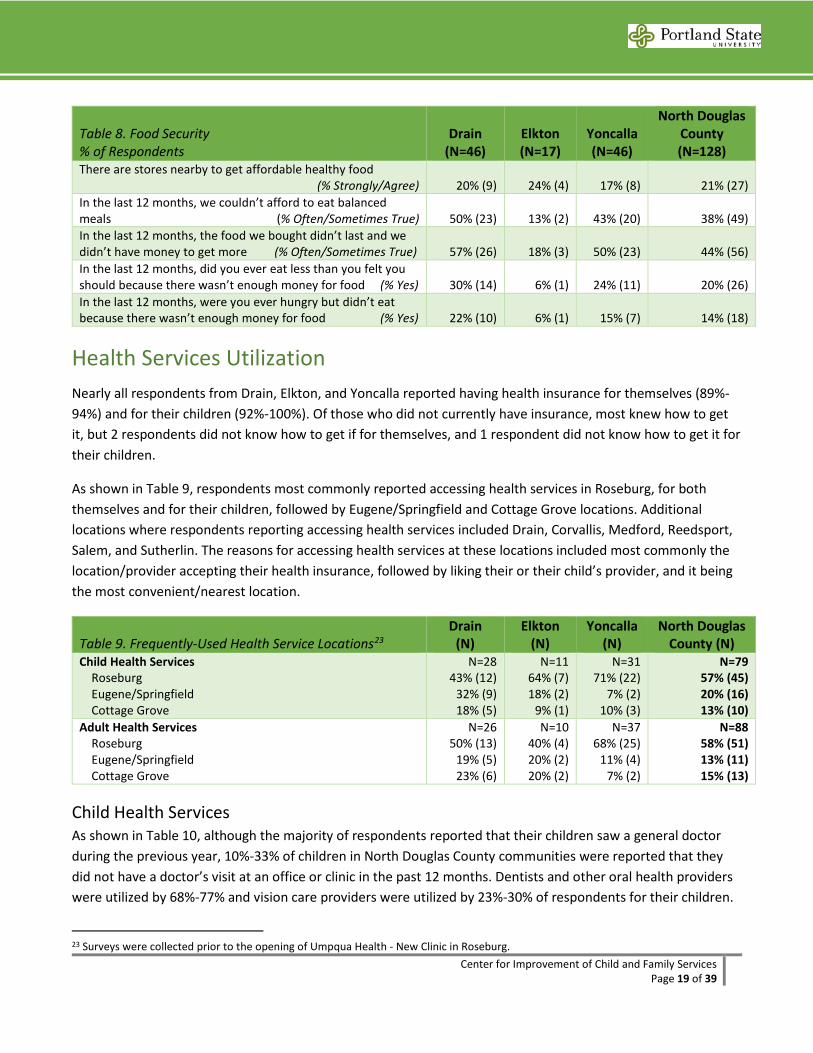
Housing Security & Mobility Table 5 shows the percent of respondents who Agree or Strongly Agree that there is enough affordable housing in the community and that housing in the community is safe for children. Very few respondents (12%) felt that there is enough affordable housing in any of the North Douglas County communities. Although the safety of housing was rated higher than affordability by respondents, this varied considerably by community. Only 27% of Yoncalla respondents Agreed or Strongly Agreed housing in the community was safe for children, in contrast to 55% of Drain respondents, and 77% of Elkton respondents.
Table 5. Housing Security % of Respondents who Strongly/Agree
Drain (N=46)
Elkton (N=17)
Yoncalla (N=47)
North Douglas County (N=129)
There is enough affordable housing in the community 18% (8) 12% (2) 4% (2) 12% (15) Housing in the community is safe and healthy for children 55% (25) 77% (13) 28% (13) 46% (59) Experienced unstable housing in the past year N=44
23% (10) N=15
13% (2) N=45
20% (9) N=122
18% (22)
Respondents were also asked if they had experienced times during the past year when they did not have stable housing. This could include living in a shelter, having to stay with friends or family, or living somewhere that did not feel permanent. Although this was lowest for Elkton respondents (13%) , 23% of Drain respondents, and 20% pf Yoncalla respondents reported unstable housing in the past year.
PSU staff collected Census data on mobility within each community. This includes an estimate for the percentage of residents who have moved within the county, from a different county within the state, from a different state, or from abroad. As shown in Table 6, a much higher percent of community residents had moved to Drain (20%) and Elkton (18%), relative to Yoncalla (9%), and survey respondents were more likely to have moved in the past year, compared to residents overall.
23%
0%
30%
23%
10%12%
10% 9%
0%
10%
20%
30%
Drain(N=42)
Elkton(N=17)
Yoncalla(N=47)
NDCRegion
(N=124)
MinorDefinite/Severe
19%24%
13%16%
2%0%
4% 3%
0%
10%
20%
30%
Drain(N=42)
Elkton(N=17)
Yoncalla(N=46)
NDCRegion
(N=122)
MinorDefinite/Severe
Center for Improvement of Child and Family Services Page 18 of 39
Table 6. Mobility Drain Elkton Yoncalla North Douglas
County % US Census residents that moved in the past year20 20% 18% 9% 15% % Survey respondents who moved in the past year 0 times 1 or more times (Min to Max)
N=46 65% (30) 35% (16)
(0 to 4)
N=16 63% (10)
37% (6) (0 to 2)
N=46 59% (27) 41% (19)
(0 to 4)
N=126 62% (78) 38% (48)
(0 to 4) Survey respondents who plan on moving in the coming year N=46
18% (8) N=17
6% (1) N=47
11% (2) N=128
11% (14)
As shown in Table 7, additional housing security data were also obtained by PSU staff for the most recent school year (2015-16), to complement what was obtained in Phase 1 for the 2014-15 school year. These data reflect the percent of K-12 students in each of the three North Douglas County school districts who, at a point-in-time count, were reported to be experiencing homelessness. These figures reflect much lower rates, when compared to the percent of families with children ages 0-8 who reported experienced unstable housing at some point during the prior year.
Table 7. Housing Security % of K-12 Students Experiencing Homelessness Drain Elkton Yoncalla
North Douglas County
2014-15 school year point-in-time count21 3% 7% 0 3% 2015-16 school year point-in-time count22 9% 4% 3% 5%
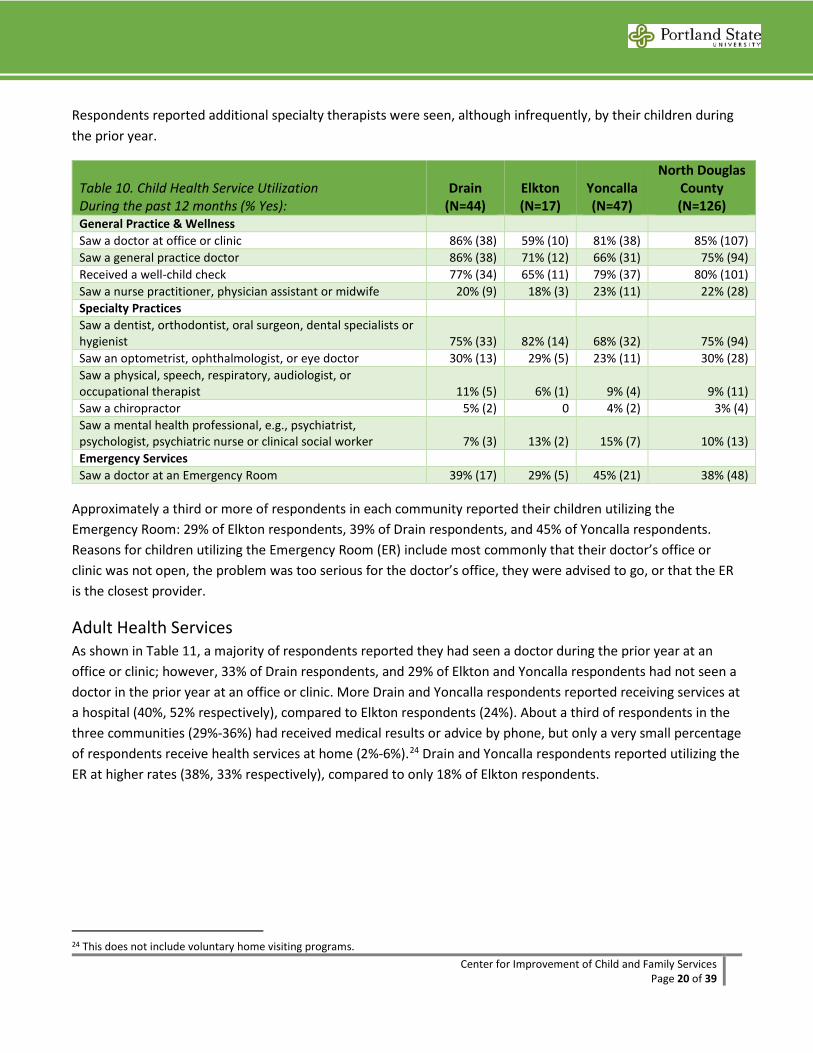
Food Security As shown in Table 8, respondents were asked to report the extent to which they agreed there are stores nearby to get affordable healthy food, and the extent to which their eating was influenced by their ability to pay for food. The percent of respondent who Agreed or Strongly Agreed that there are stores nearly to get affordable healthy food ranged from 17% in Yoncalla to 24% in Elkton.
Elkton respondents reported lower rates of food insecurity due to financial constraints, compared to Drain and Yoncalla respondents. Still, 18% of Elkton respondents reported that during the past year, the food they bought didn’t last and they did not have money to get more. This was true for 57% of Drain respondents and for 50% of Yoncalla respondents. Thirty percent (30%) of Drain respondents and 23% of Yoncalla respondents reported eating less than they should because there was not enough money for food, and reported being hungry but not eating because there was not money for food.
20 US Census. (2016). 2011-2015 American Community Survey 5-year Estimates: Geographical mobility in the past year for current residence. Retrieved January 18, 2017 from https://factfinder.census.gov/faces/tableservices/jsf/pages/productview.xhtml?src=CF 21 Oregon Department of Education. (2015). 2014-2015 homeless student data: Homeless student percentage by district. Retrieved March 6, 2016 from www.ode.state.or.us/search/results/?id=113 22 Oregon Department of Education. (2016). 2015-2016 homeless student data: Homeless student percentage by district. Retrieved January 17, 2017 from www.ode.state.or.us/search/results/?id=113
Center for Improvement of Child and Family Services Page 19 of 39
Table 8. Food Security % of Respondents
Drain (N=46)
Elkton (N=17)
Yoncalla (N=46)
North Douglas County (N=128)
There are stores nearby to get affordable healthy food (% Strongly/Agree) 20% (9) 24% (4) 17% (8) 21% (27)
In the last 12 months, we couldn’t afford to eat balanced meals (% Often/Sometimes True) 50% (23) 13% (2) 43% (20) 38% (49) In the last 12 months, the food we bought didn’t last and we didn’t have money to get more (% Often/Sometimes True) 57% (26) 18% (3) 50% (23) 44% (56) In the last 12 months, did you ever eat less than you felt you should because there wasn’t enough money for food (% Yes) 30% (14) 6% (1) 24% (11) 20% (26) In the last 12 months, were you ever hungry but didn’t eat because there wasn’t enough money for food (% Yes) 22% (10) 6% (1) 15% (7) 14% (18)
Health Services Utilization Nearly all respondents from Drain, Elkton, and Yoncalla reported having health insurance for themselves (89%-94%) and for their children (92%-100%). Of those who did not currently have insurance, most knew how to get it, but 2 respondents did not know how to get if for themselves, and 1 respondent did not know how to get it for their children.
As shown in Table 9, respondents most commonly reported accessing health services in Roseburg, for both themselves and for their children, followed by Eugene/Springfield and Cottage Grove locations. Additional locations where respondents reporting accessing health services included Drain, Corvallis, Medford, Reedsport, Salem, and Sutherlin. The reasons for accessing health services at these locations included most commonly the location/provider accepting their health insurance, followed by liking their or their child’s provider, and it being the most convenient/nearest location.
Table 9. Frequently-Used Health Service Locations23 Drain
(N) Elkton
(N) Yoncalla
(N) North Douglas
County (N) Child Health Services Roseburg Eugene/Springfield Cottage Grove
N=28 43% (12)
32% (9) 18% (5)
N=11 64% (7) 18% (2)
9% (1)
N=31 71% (22)
7% (2) 10% (3)
N=79 57% (45) 20% (16) 13% (10)
Adult Health Services Roseburg Eugene/Springfield Cottage Grove
N=26 50% (13)
19% (5) 23% (6)
N=10 40% (4) 20% (2) 20% (2)
N=37 68% (25)
11% (4) 7% (2)
N=88 58% (51) 13% (11) 15% (13)
Child Health Services As shown in Table 10, although the majority of respondents reported that their children saw a general doctor during the previous year, 10%-33% of children in North Douglas County communities were reported that they did not have a doctor’s visit at an office or clinic in the past 12 months. Dentists and other oral health providers were utilized by 68%-77% and vision care providers were utilized by 23%-30% of respondents for their children.
23 Surveys were collected prior to the opening of Umpqua Health - New Clinic in Roseburg.
Center for Improvement of Child and Family Services Page 20 of 39
Respondents reported additional specialty therapists were seen, although infrequently, by their children during the prior year.
Table 10. Child Health Service Utilization During the past 12 months (% Yes):
Drain (N=44)
Elkton (N=17)
Yoncalla (N=47)
North Douglas County (N=126)
General Practice & Wellness Saw a doctor at office or clinic 86% (38) 59% (10) 81% (38) 85% (107) Saw a general practice doctor 86% (38) 71% (12) 66% (31) 75% (94) Received a well-child check 77% (34) 65% (11) 79% (37) 80% (101) Saw a nurse practitioner, physician assistant or midwife 20% (9) 18% (3) 23% (11) 22% (28) Specialty Practices Saw a dentist, orthodontist, oral surgeon, dental specialists or hygienist 75% (33) 82% (14) 68% (32) 75% (94) Saw an optometrist, ophthalmologist, or eye doctor 30% (13) 29% (5) 23% (11) 30% (28) Saw a physical, speech, respiratory, audiologist, or occupational therapist 11% (5) 6% (1) 9% (4) 9% (11) Saw a chiropractor 5% (2) 0 4% (2) 3% (4) Saw a mental health professional, e.g., psychiatrist, psychologist, psychiatric nurse or clinical social worker 7% (3) 13% (2) 15% (7) 10% (13) Emergency Services Saw a doctor at an Emergency Room 39% (17) 29% (5) 45% (21) 38% (48)
Approximately a third or more of respondents in each community reported their children utilizing the Emergency Room: 29% of Elkton respondents, 39% of Drain respondents, and 45% of Yoncalla respondents. Reasons for children utilizing the Emergency Room (ER) include most commonly that their doctor’s office or clinic was not open, the problem was too serious for the doctor’s office, they were advised to go, or that the ER is the closest provider.
Adult Health Services As shown in Table 11, a majority of respondents reported they had seen a doctor during the prior year at an office or clinic; however, 33% of Drain respondents, and 29% of Elkton and Yoncalla respondents had not seen a doctor in the prior year at an office or clinic. More Drain and Yoncalla respondents reported receiving services at a hospital (40%, 52% respectively), compared to Elkton respondents (24%). About a third of respondents in the three communities (29%-36%) had received medical results or advice by phone, but only a very small percentage of respondents receive health services at home (2%-6%).24 Drain and Yoncalla respondents reported utilizing the ER at higher rates (38%, 33% respectively), compared to only 18% of Elkton respondents.
24 This does not include voluntary home visiting programs.
Center for Improvement of Child and Family Services Page 21 of 39
Table 11. Adult Health Service Utilization During the past 12 months (% Yes):
Drain (N=45)
Elkton (N=17)
Yoncalla (N=45)
North Douglas County (N=127)
Saw a doctor at office or clinic 67% (30) 71% (12) 71% (32) 68% (86) Received services at a hospital 40% (18) 24% (4) 52% (23) 40% (50) Received medical advice or results over the phone 36% (16) 29% (5) 36% (16) 31% (39) Received care at home 4% (2) 6% (1) 2% (1) 3% (4) Saw a doctor at an Emergency Room 38% (17) 18% (3) 33% (15) 31% (39)
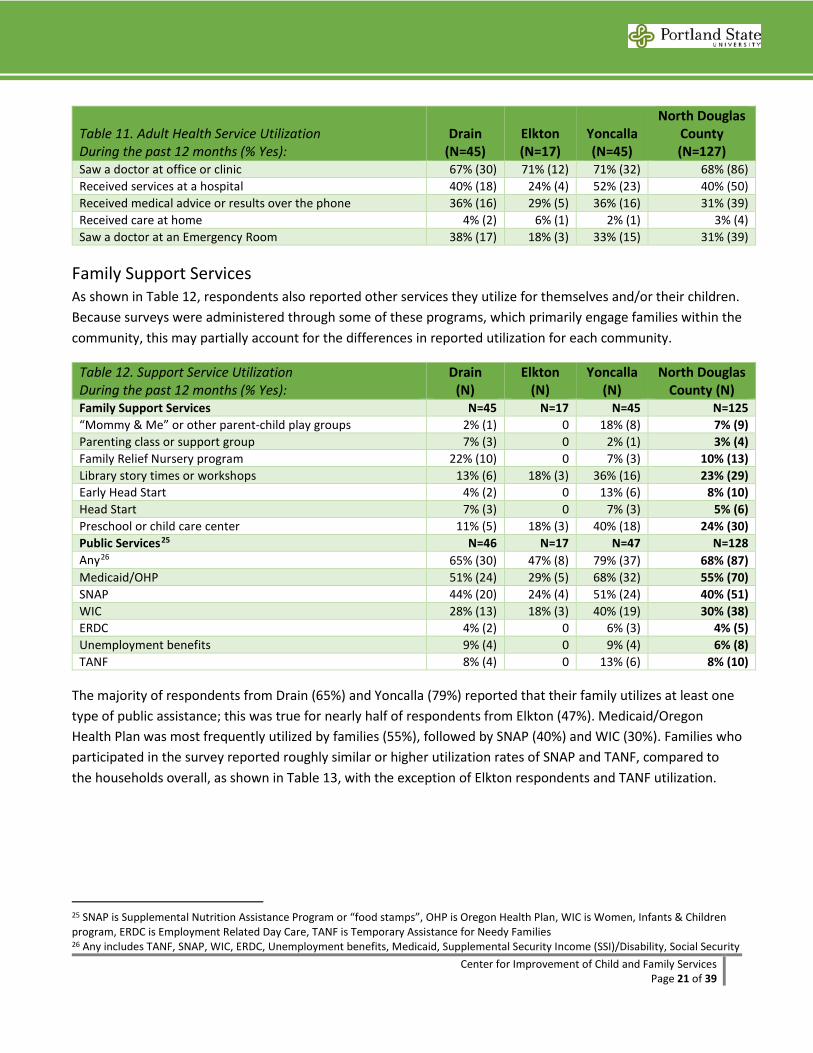
Family Support Services As shown in Table 12, respondents also reported other services they utilize for themselves and/or their children. Because surveys were administered through some of these programs, which primarily engage families within the community, this may partially account for the differences in reported utilization for each community.
Table 12. Support Service Utilization During the past 12 months (% Yes):
Drain (N)
Elkton (N)
Yoncalla (N)
North Douglas County (N)
Family Support Services N=45 N=17 N=45 N=125 “Mommy & Me” or other parent-child play groups 2% (1) 0 18% (8) 7% (9) Parenting class or support group 7% (3) 0 2% (1) 3% (4) Family Relief Nursery program 22% (10) 0 7% (3) 10% (13) Library story times or workshops 13% (6) 18% (3) 36% (16) 23% (29) Early Head Start 4% (2) 0 13% (6) 8% (10) Head Start 7% (3) 0 7% (3) 5% (6) Preschool or child care center 11% (5) 18% (3) 40% (18) 24% (30) Public Services25 N=46 N=17 N=47 N=128 Any26 65% (30) 47% (8) 79% (37) 68% (87) Medicaid/OHP 51% (24) 29% (5) 68% (32) 55% (70) SNAP 44% (20) 24% (4) 51% (24) 40% (51) WIC 28% (13) 18% (3) 40% (19) 30% (38) ERDC 4% (2) 0 6% (3) 4% (5) Unemployment benefits 9% (4) 0 9% (4) 6% (8) TANF 8% (4) 0 13% (6) 8% (10)
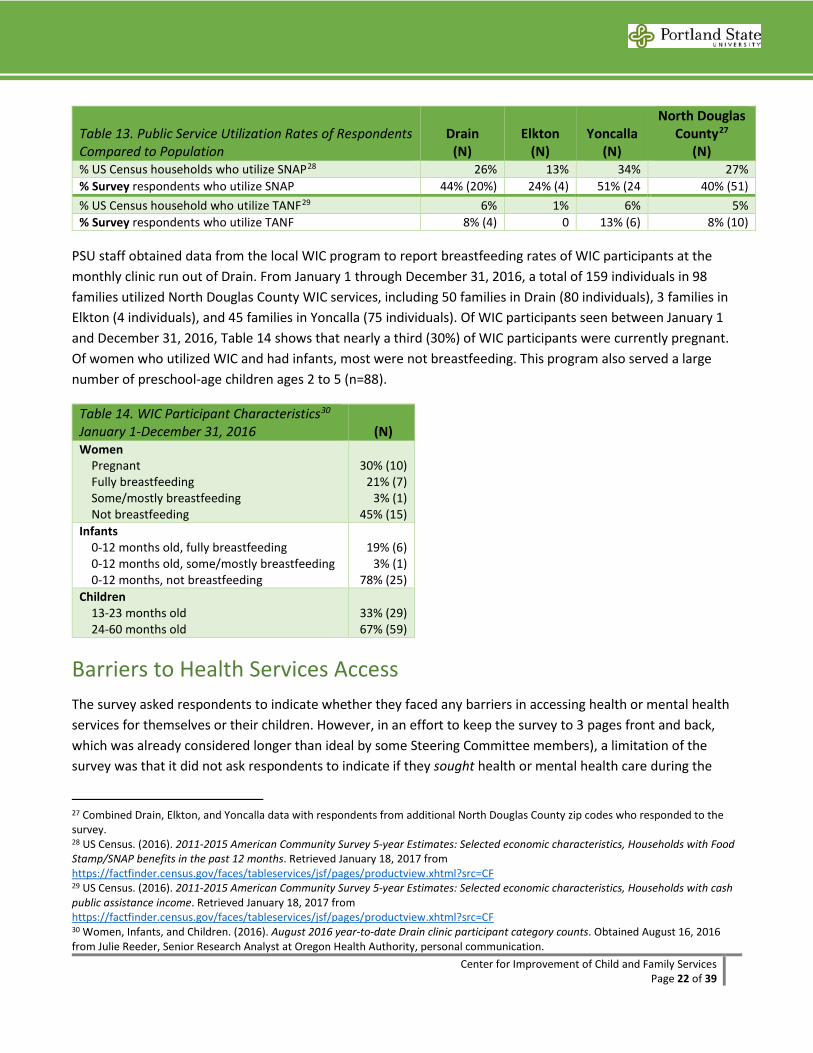
The majority of respondents from Drain (65%) and Yoncalla (79%) reported that their family utilizes at least one type of public assistance; this was true for nearly half of respondents from Elkton (47%). Medicaid/Oregon Health Plan was most frequently utilized by families (55%), followed by SNAP (40%) and WIC (30%). Families who participated in the survey reported roughly similar or higher utilization rates of SNAP and TANF, compared to the households overall, as shown in Table 13, with the exception of Elkton respondents and TANF utilization.
25 SNAP is Supplemental Nutrition Assistance Program or “food stamps”, OHP is Oregon Health Plan, WIC is Women, Infants & Children program, ERDC is Employment Related Day Care, TANF is Temporary Assistance for Needy Families 26 Any includes TANF, SNAP, WIC, ERDC, Unemployment benefits, Medicaid, Supplemental Security Income (SSI)/Disability, Social Security
Center for Improvement of Child and Family Services Page 22 of 39
Table 13. Public Service Utilization Rates of Respondents Compared to Population
Drain (N)
Elkton (N)
Yoncalla (N)
North Douglas County27
(N) % US Census households who utilize SNAP28 26% 13% 34% 27% % Survey respondents who utilize SNAP 44% (20%) 24% (4) 51% (24 40% (51) % US Census household who utilize TANF29 6% 1% 6% 5% % Survey respondents who utilize TANF 8% (4) 0 13% (6) 8% (10)
PSU staff obtained data from the local WIC program to report breastfeeding rates of WIC participants at the monthly clinic run out of Drain. From January 1 through December 31, 2016, a total of 159 individuals in 98 families utilized North Douglas County WIC services, including 50 families in Drain (80 individuals), 3 families in Elkton (4 individuals), and 45 families in Yoncalla (75 individuals). Of WIC participants seen between January 1 and December 31, 2016, Table 14 shows that nearly a third (30%) of WIC participants were currently pregnant. Of women who utilized WIC and had infants, most were not breastfeeding. This program also served a large number of preschool-age children ages 2 to 5 (n=88).
Table 14. WIC Participant Characteristics30 January 1-December 31, 2016 (N) Women Pregnant Fully breastfeeding Some/mostly breastfeeding Not breastfeeding
30% (10) 21% (7)
3% (1) 45% (15)
Infants 0-12 months old, fully breastfeeding 0-12 months old, some/mostly breastfeeding 0-12 months, not breastfeeding
19% (6) 3% (1)
78% (25) Children 13-23 months old 24-60 months old
33% (29) 67% (59)
Barriers to Health Services Access The survey asked respondents to indicate whether they faced any barriers in accessing health or mental health services for themselves or their children. However, in an effort to keep the survey to 3 pages front and back, which was already considered longer than ideal by some Steering Committee members), a limitation of the survey was that it did not ask respondents to indicate if they sought health or mental health care during the
27 Combined Drain, Elkton, and Yoncalla data with respondents from additional North Douglas County zip codes who responded to the survey. 28 US Census. (2016). 2011-2015 American Community Survey 5-year Estimates: Selected economic characteristics, Households with Food Stamp/SNAP benefits in the past 12 months. Retrieved January 18, 2017 from https://factfinder.census.gov/faces/tableservices/jsf/pages/productview.xhtml?src=CF 29 US Census. (2016). 2011-2015 American Community Survey 5-year Estimates: Selected economic characteristics, Households with cash public assistance income. Retrieved January 18, 2017 from https://factfinder.census.gov/faces/tableservices/jsf/pages/productview.xhtml?src=CF 30 Women, Infants, and Children. (2016). August 2016 year-to-date Drain clinic participant category counts. Obtained August 16, 2016 from Julie Reeder, Senior Research Analyst at Oregon Health Authority, personal communication.
Center for Improvement of Child and Family Services Page 23 of 39
prior year for either themselves or their child/ren. As a result, Steering Committee members discussed that the following results related to barriers to accessing mental health services for adults and children, in particular, minimize the challenges of accessing mental health care for those who need or want it. Despite this limitation, the top three most frequently rated barriers to accessing health and mental health services are presented in the following tables.
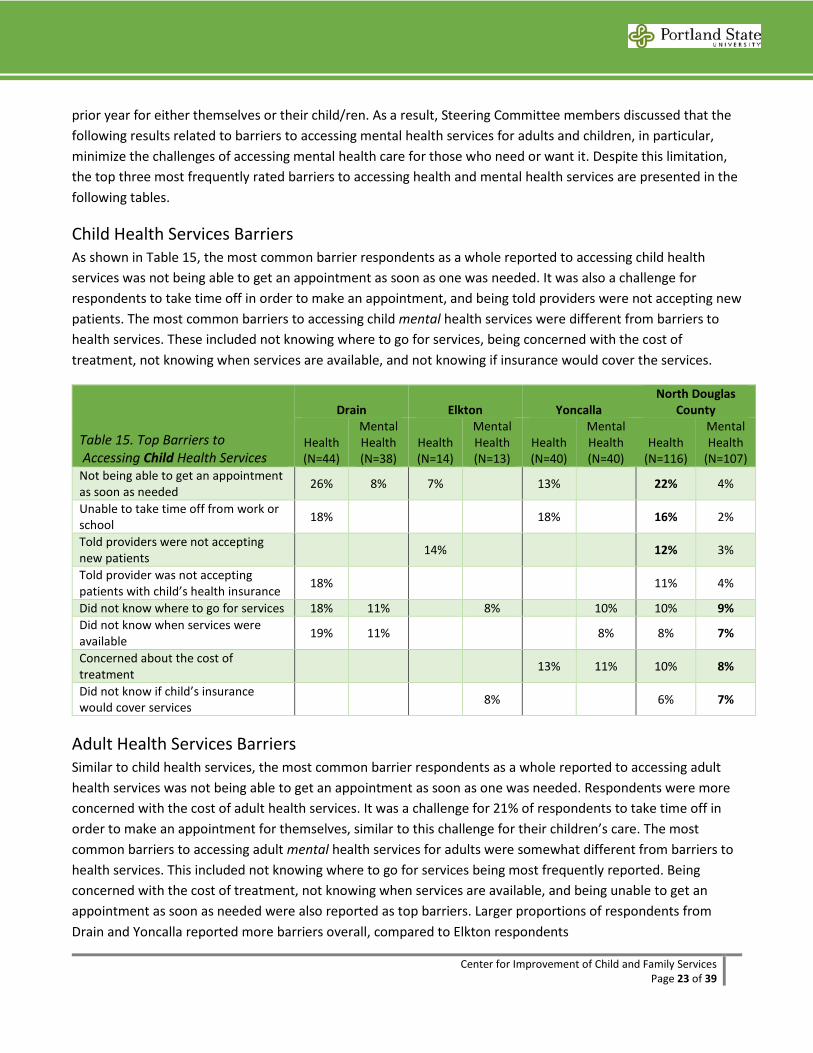
Child Health Services Barriers As shown in Table 15, the most common barrier respondents as a whole reported to accessing child health services was not being able to get an appointment as soon as one was needed. It was also a challenge for respondents to take time off in order to make an appointment, and being told providers were not accepting new patients. The most common barriers to accessing child mental health services were different from barriers to health services. These included not knowing where to go for services, being concerned with the cost of treatment, not knowing when services are available, and not knowing if insurance would cover the services.
Table 15. Top Barriers to Accessing Child Health Services
Drain Elkton Yoncalla North Douglas
County
Health (N=44)
Mental Health (N=38)
Health (N=14)
Mental Health (N=13)
Health (N=40)
Mental Health (N=40)
Health (N=116)
Mental Health
(N=107) Not being able to get an appointment as soon as needed 26% 8% 7% 13% 22% 4%
Unable to take time off from work or school 18% 18% 16% 2%
Told providers were not accepting new patients 14% 12% 3%
Told provider was not accepting patients with child’s health insurance 18% 11% 4%
Did not know where to go for services 18% 11% 8% 10% 10% 9% Did not know when services were available 19% 11% 8% 8% 7%
Concerned about the cost of treatment 13% 11% 10% 8%
Did not know if child’s insurance would cover services 8% 6% 7%
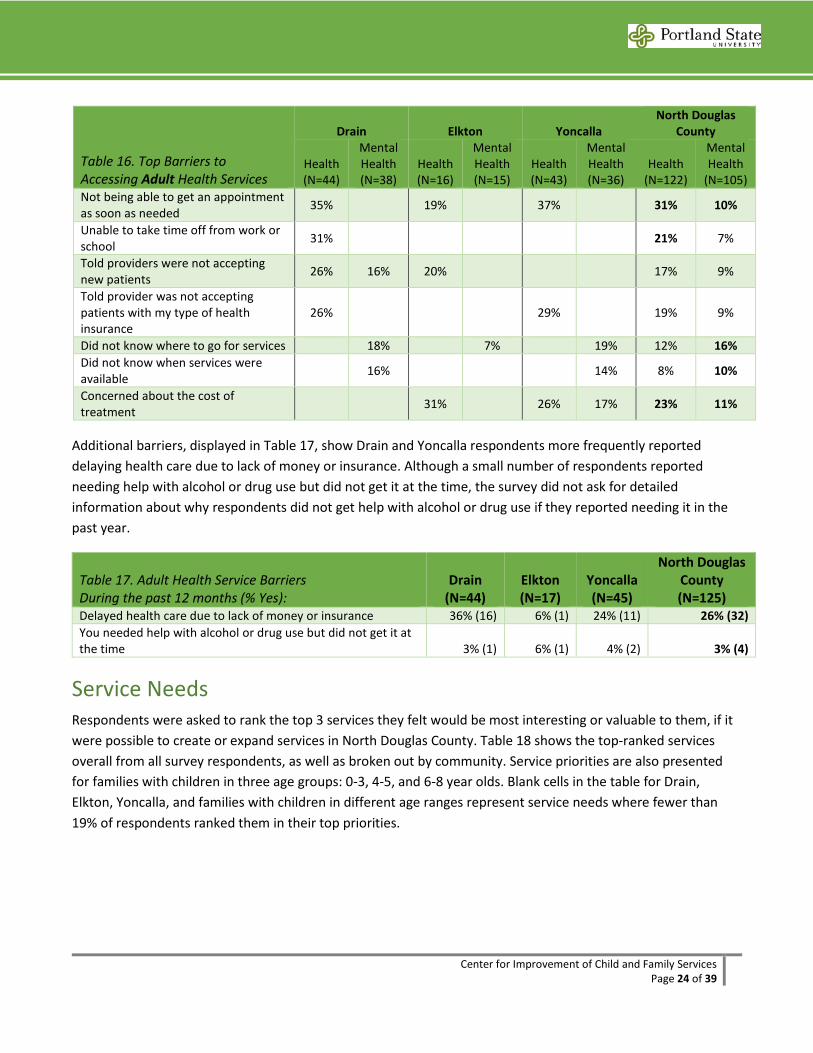
Adult Health Services Barriers Similar to child health services, the most common barrier respondents as a whole reported to accessing adult health services was not being able to get an appointment as soon as one was needed. Respondents were more concerned with the cost of adult health services. It was a challenge for 21% of respondents to take time off in order to make an appointment for themselves, similar to this challenge for their children’s care. The most common barriers to accessing adult mental health services for adults were somewhat different from barriers to health services. This included not knowing where to go for services being most frequently reported. Being concerned with the cost of treatment, not knowing when services are available, and being unable to get an appointment as soon as needed were also reported as top barriers. Larger proportions of respondents from Drain and Yoncalla reported more barriers overall, compared to Elkton respondents
Center for Improvement of Child and Family Services Page 24 of 39
Table 16. Top Barriers to Accessing Adult Health Services
Drain Elkton Yoncalla North Douglas
County
Health (N=44)
Mental Health (N=38)
Health (N=16)
Mental Health (N=15)
Health (N=43)
Mental Health (N=36)
Health (N=122)
Mental Health
(N=105) Not being able to get an appointment as soon as needed 35% 19% 37% 31% 10%
Unable to take time off from work or school 31% 21% 7%
Told providers were not accepting new patients 26% 16% 20% 17% 9%
Told provider was not accepting patients with my type of health insurance
26% 29% 19% 9%
Did not know where to go for services 18% 7% 19% 12% 16% Did not know when services were available 16% 14% 8% 10%
Concerned about the cost of treatment 31% 26% 17% 23% 11%
Additional barriers, displayed in Table 17, show Drain and Yoncalla respondents more frequently reported delaying health care due to lack of money or insurance. Although a small number of respondents reported needing help with alcohol or drug use but did not get it at the time, the survey did not ask for detailed information about why respondents did not get help with alcohol or drug use if they reported needing it in the past year.
Table 17. Adult Health Service Barriers During the past 12 months (% Yes):
Drain (N=44)
Elkton (N=17)
Yoncalla (N=45)
North Douglas County (N=125)
Delayed health care due to lack of money or insurance 36% (16) 6% (1) 24% (11) 26% (32) You needed help with alcohol or drug use but did not get it at the time 3% (1) 6% (1) 4% (2) 3% (4)
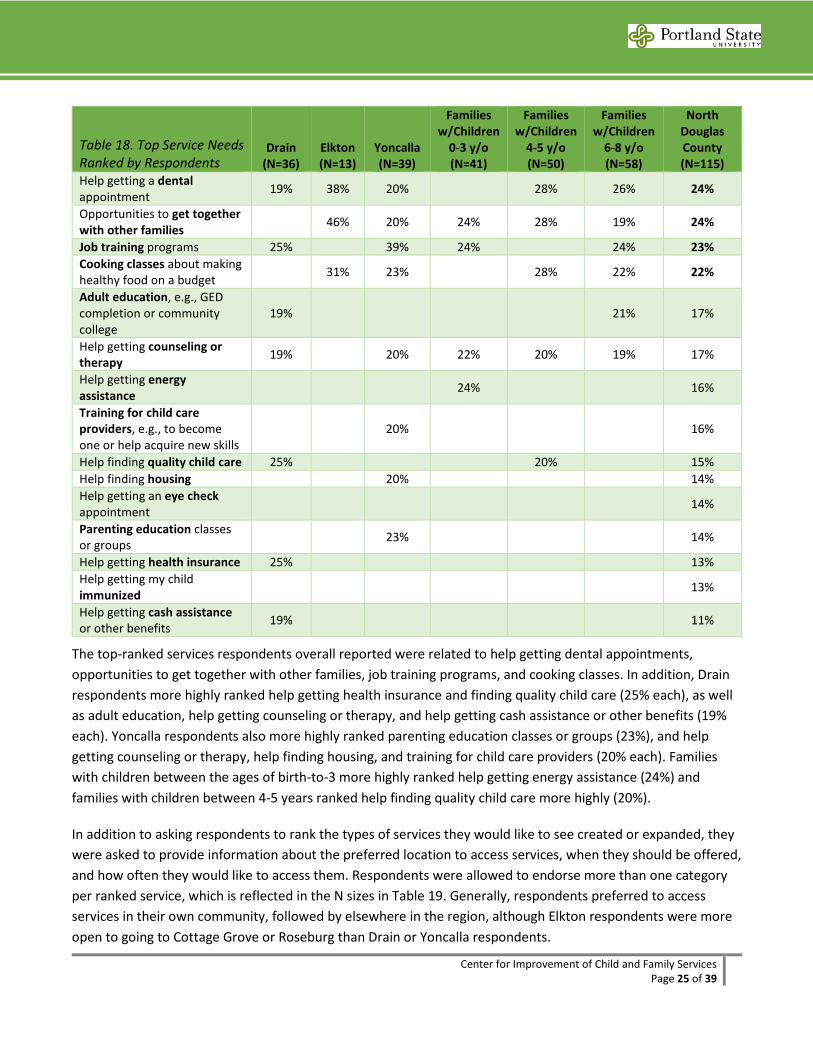
Service Needs Respondents were asked to rank the top 3 services they felt would be most interesting or valuable to them, if it were possible to create or expand services in North Douglas County. Table 18 shows the top-ranked services overall from all survey respondents, as well as broken out by community. Service priorities are also presented for families with children in three age groups: 0-3, 4-5, and 6-8 year olds. Blank cells in the table for Drain, Elkton, Yoncalla, and families with children in different age ranges represent service needs where fewer than 19% of respondents ranked them in their top priorities.
Center for Improvement of Child and Family Services Page 25 of 39
Table 18. Top Service Needs Ranked by Respondents
Drain (N=36)
Elkton (N=13)
Yoncalla (N=39)
Families w/Children
0-3 y/o (N=41)
Families w/Children
4-5 y/o (N=50)
Families w/Children
6-8 y/o (N=58)
North Douglas County (N=115)
Help getting a dental appointment 19% 38% 20% 28% 26% 24%
Opportunities to get together with other families 46% 20% 24% 28% 19% 24%
Job training programs 25% 39% 24% 24% 23% Cooking classes about making healthy food on a budget 31% 23% 28% 22% 22%
Adult education, e.g., GED completion or community college
19% 21% 17%
Help getting counseling or therapy 19% 20% 22% 20% 19% 17%
Help getting energy assistance 24% 16%
Training for child care providers, e.g., to become one or help acquire new skills
20% 16%
Help finding quality child care 25% 20% 15% Help finding housing 20% 14% Help getting an eye check appointment 14%
Parenting education classes or groups 23% 14%
Help getting health insurance 25% 13% Help getting my child immunized 13%
Help getting cash assistance or other benefits 19% 11%
The top-ranked services respondents overall reported were related to help getting dental appointments, opportunities to get together with other families, job training programs, and cooking classes. In addition, Drain respondents more highly ranked help getting health insurance and finding quality child care (25% each), as well as adult education, help getting counseling or therapy, and help getting cash assistance or other benefits (19% each). Yoncalla respondents also more highly ranked parenting education classes or groups (23%), and help getting counseling or therapy, help finding housing, and training for child care providers (20% each). Families with children between the ages of birth-to-3 more highly ranked help getting energy assistance (24%) and families with children between 4-5 years ranked help finding quality child care more highly (20%).
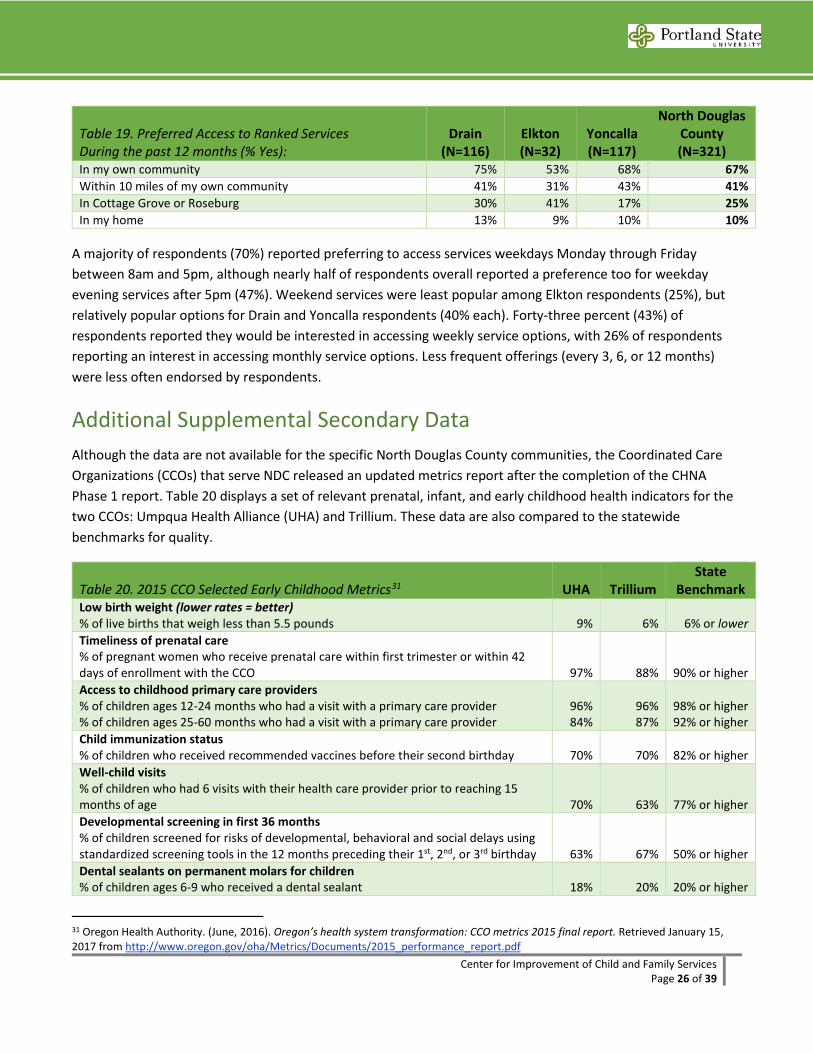
In addition to asking respondents to rank the types of services they would like to see created or expanded, they were asked to provide information about the preferred location to access services, when they should be offered, and how often they would like to access them. Respondents were allowed to endorse more than one category per ranked service, which is reflected in the N sizes in Table 19. Generally, respondents preferred to access services in their own community, followed by elsewhere in the region, although Elkton respondents were more open to going to Cottage Grove or Roseburg than Drain or Yoncalla respondents.
Center for Improvement of Child and Family Services Page 26 of 39
Table 19. Preferred Access to Ranked Services During the past 12 months (% Yes):
Drain (N=116)
Elkton (N=32)
Yoncalla (N=117)
North Douglas County (N=321)
In my own community 75% 53% 68% 67% Within 10 miles of my own community 41% 31% 43% 41% In Cottage Grove or Roseburg 30% 41% 17% 25% In my home 13% 9% 10% 10%
A majority of respondents (70%) reported preferring to access services weekdays Monday through Friday between 8am and 5pm, although nearly half of respondents overall reported a preference too for weekday evening services after 5pm (47%). Weekend services were least popular among Elkton respondents (25%), but relatively popular options for Drain and Yoncalla respondents (40% each). Forty-three percent (43%) of respondents reported they would be interested in accessing weekly service options, with 26% of respondents reporting an interest in accessing monthly service options. Less frequent offerings (every 3, 6, or 12 months) were less often endorsed by respondents.
Additional Supplemental Secondary Data Although the data are not available for the specific North Douglas County communities, the Coordinated Care Organizations (CCOs) that serve NDC released an updated metrics report after the completion of the CHNA Phase 1 report. Table 20 displays a set of relevant prenatal, infant, and early childhood health indicators for the two CCOs: Umpqua Health Alliance (UHA) and Trillium. These data are also compared to the statewide benchmarks for quality.
Table 20. 2015 CCO Selected Early Childhood Metrics31 UHA Trillium State
Benchmark Low birth weight (lower rates = better) % of live births that weigh less than 5.5 pounds 9% 6% 6% or lower Timeliness of prenatal care % of pregnant women who receive prenatal care within first trimester or within 42 days of enrollment with the CCO 97% 88% 90% or higher Access to childhood primary care providers % of children ages 12-24 months who had a visit with a primary care provider % of children ages 25-60 months who had a visit with a primary care provider
96% 84%
96% 87%
98% or higher 92% or higher
Child immunization status % of children who received recommended vaccines before their second birthday 70% 70% 82% or higher Well-child visits % of children who had 6 visits with their health care provider prior to reaching 15 months of age
70%
63%
77% or higher
Developmental screening in first 36 months % of children screened for risks of developmental, behavioral and social delays using standardized screening tools in the 12 months preceding their 1st, 2nd, or 3rd birthday
63%
67%
50% or higher
Dental sealants on permanent molars for children % of children ages 6-9 who received a dental sealant
18%
20%
20% or higher
31 Oregon Health Authority. (June, 2016). Oregon’s health system transformation: CCO metrics 2015 final report. Retrieved January 15, 2017 from http://www.oregon.gov/oha/Metrics/Documents/2015_performance_report.pdf
Center for Improvement of Child and Family Services Page 27 of 39
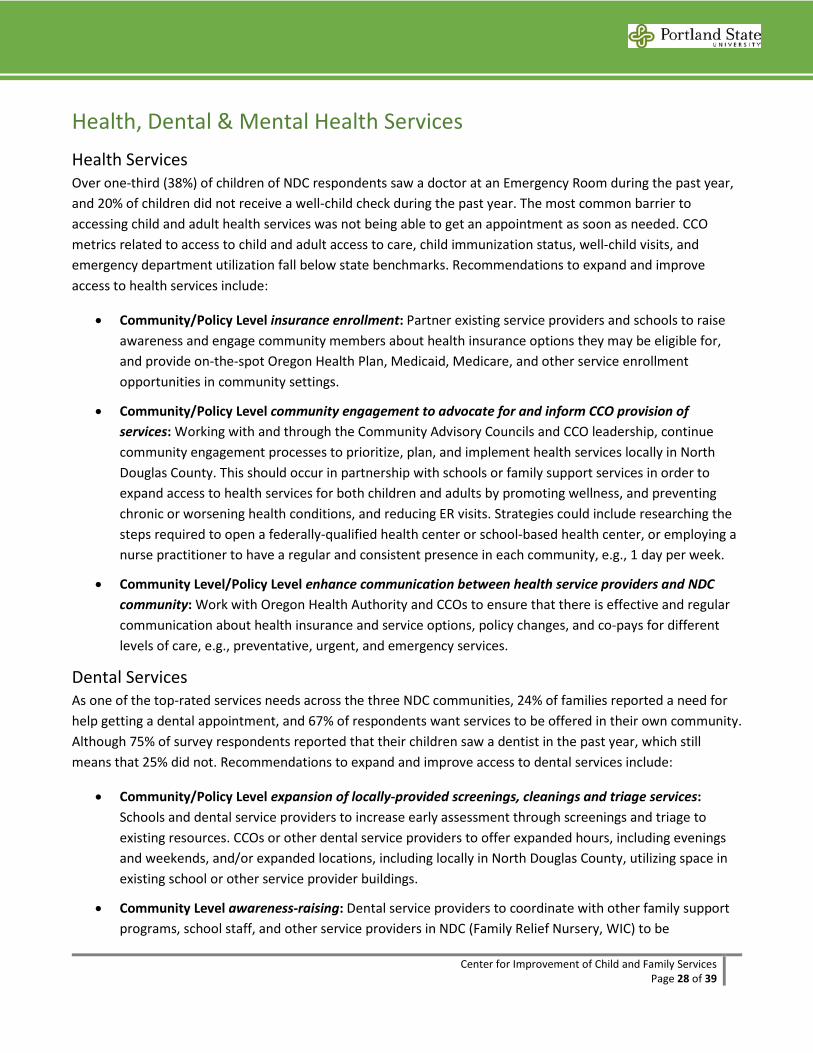
Table 20. 2015 CCO Selected Early Childhood Metrics31 UHA Trillium State
Benchmark Access to care % of adults and children who received appointments and care when they needed them 84% 83% 87% or higher Emergency department utilization (lower rates = better) Number of patient visits to an emergency department, per 1000 member months 58 50 39 or lower
Both CCOs that serve the NDC region are meeting or exceeding state benchmarks for developmental screening for 1-3 year-olds. Areas that both CCOs are not yet meeting benchmarks are in the areas of child access to care and primary care providers, child immunizations, well-child visits, and ER utilization rates. Although the NDC communities represent only a portion of the service areas for UHA and Trillium CCOs, these metrics highlight areas that could potentially be impacted by health service access changes that might come about as a result of the regional health services survey and community-driven recommendations.
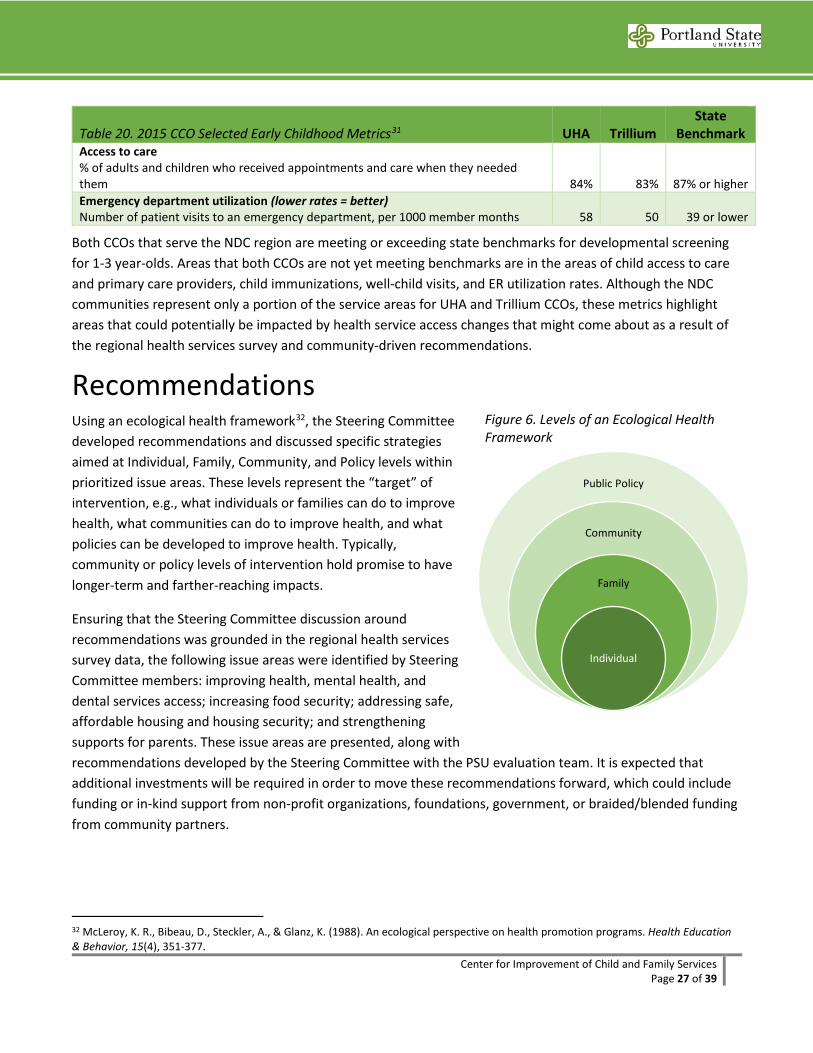
Recommendations Using an ecological health framework32, the Steering Committee developed recommendations and discussed specific strategies aimed at Individual, Family, Community, and Policy levels within prioritized issue areas. These levels represent the “target” of intervention, e.g., what individuals or families can do to improve health, what communities can do to improve health, and what policies can be developed to improve health. Typically, community or policy levels of intervention hold promise to have longer-term and farther-reaching impacts.
Ensuring that the Steering Committee discussion around recommendations was grounded in the regional health services survey data, the following issue areas were identified by Steering Committee members: improving health, mental health, and dental services access; increasing food security; addressing safe, affordable housing and housing security; and strengthening supports for parents. These issue areas are presented, along with recommendations developed by the Steering Committee with the PSU evaluation team. It is expected that additional investments will be required in order to move these recommendations forward, which could include funding or in-kind support from non-profit organizations, foundations, government, or braided/blended funding from community partners.
32 McLeroy, K. R., Bibeau, D., Steckler, A., & Glanz, K. (1988). An ecological perspective on health promotion programs. Health Education & Behavior, 15(4), 351-377.
Public Policy
Community
Family
Individual
Figure 6. Levels of an Ecological Health Framework
Center for Improvement of Child and Family Services Page 28 of 39
Health, Dental & Mental Health Services Health Services Over one-third (38%) of children of NDC respondents saw a doctor at an Emergency Room during the past year, and 20% of children did not receive a well-child check during the past year. The most common barrier to accessing child and adult health services was not being able to get an appointment as soon as needed. CCO metrics related to access to child and adult access to care, child immunization status, well-child visits, and emergency department utilization fall below state benchmarks. Recommendations to expand and improve access to health services include:
• Community/Policy Level insurance enrollment: Partner existing service providers and schools to raise awareness and engage community members about health insurance options they may be eligible for, and provide on-the-spot Oregon Health Plan, Medicaid, Medicare, and other service enrollment opportunities in community settings.
• Community/Policy Level community engagement to advocate for and inform CCO provision of services: Working with and through the Community Advisory Councils and CCO leadership, continue community engagement processes to prioritize, plan, and implement health services locally in North Douglas County. This should occur in partnership with schools or family support services in order to expand access to health services for both children and adults by promoting wellness, and preventing chronic or worsening health conditions, and reducing ER visits. Strategies could include researching the steps required to open a federally-qualified health center or school-based health center, or employing a nurse practitioner to have a regular and consistent presence in each community, e.g., 1 day per week.
• Community Level/Policy Level enhance communication between health service providers and NDC community: Work with Oregon Health Authority and CCOs to ensure that there is effective and regular communication about health insurance and service options, policy changes, and co-pays for different levels of care, e.g., preventative, urgent, and emergency services.
Dental Services As one of the top-rated services needs across the three NDC communities, 24% of families reported a need for help getting a dental appointment, and 67% of respondents want services to be offered in their own community. Although 75% of survey respondents reported that their children saw a dentist in the past year, which still means that 25% did not. Recommendations to expand and improve access to dental services include:
• Community/Policy Level expansion of locally-provided screenings, cleanings and triage services: Schools and dental service providers to increase early assessment through screenings and triage to existing resources. CCOs or other dental service providers to offer expanded hours, including evenings and weekends, and/or expanded locations, including locally in North Douglas County, utilizing space in existing school or other service provider buildings.
• Community Level awareness-raising: Dental service providers to coordinate with other family support programs, school staff, and other service providers in NDC (Family Relief Nursery, WIC) to be
Center for Improvement of Child and Family Services Page 29 of 39
knowledgeable and up-to-date on current dental services provided, e.g., through Advantage Dental, dental van, and clinics in Sutherlin and Cottage Grove; and to have information about services available for all families.
Mental Health Services The most common barriers to accessing both child and adult mental health services were related to not knowing where to go for services, not knowing when services are available, and concerns about the cost of treatment. Nearly a quarter of NDC respondents reported that their children had minor concentration difficulties and minor behavior difficulties; another 10% reported Definite or Severe difficulties in both of these areas. Recommendations to expand and improve access to mental health services include:
• Community/Policy Level capacity-building around mental/behavioral health identification, referral, response, and intervention: Form a community task force to work with CCO leadership to understand mental health service billing processes, training requirements, and service provision criteria. Identify students and community members interested in the mental health field to bring trainings through the Infant-Toddler Mental Health Association to build local capacity to provide or expand mental health services in partnership with schools or existing family support programs.
Leverage and promote existing state and regional trainings that could be made available to a wider range of NDC early childhood providers, i.e., open up trainings provided by FRN or home visiting programs. Coordinate trainings in NDC with existing programs such as Trauma-Informed Oregon (TIO) and Family Connections of Lane & Douglas County, the regional Child Care Resource & Referral (CCR&R) for early childhood providers, school staff, and other community members and families.
• Community Level awareness-raising: CCO and mental health service providers to coordinate with other family support programs, school staff, and other service providers in NDC (Family Relief Nursery, WIC) to be knowledgeable and up-to-date on current mental health services available to members of North Douglas County communities, including services available in Cottage Grove and Roseburg.
Housing Security Only 12% of NDC respondents Agreed or Strongly Agreed that there is enough affordable housing in the community. Fewer than half of respondents (46%) in NDC thought that housing in the community is safe and healthy for children, although this was much lower for Yoncalla respondents (28%). Eighteen percent (18%) of NDC respondents also experienced some form of housing instability over the prior year. Recommendations to improve housing security include:
• Community/Policy Level partnerships to increase stock of affordable housing: Establish a task force to explore the feasibility of working with existing organizations such as Umpqua NeighborWorks to purchase bank-owned properties for renovation and resale or lease.
• Individual/Family/Community Level efforts to bring housing security issues to the fore: Community members and city councils to collaborate on and adopt safe and secure housing as a community priority, work with home owners to explore solutions to housing safety and affordability, including incentivizing
Center for Improvement of Child and Family Services Page 30 of 39
new affordable housing construction or rehabilitation, and enforce accountability for home owners whose properties are not up to code.
• Individual/Family/Community Level partnerships to improve existing housing: Establish a work group to engage renters, home owners, and existing organizations such as Umpqua NeighborWorks and Habitat for Humanity to leverage funds that may be available to improve existing housing in NDC communities. Increase community awareness of resources available, including those provided by these organizations, as well as the DreamSavers program to establish and grown Individual Development Accounts (IDAs) for home purchases.
Food Security Only 21% of NDC respondents Agreed or Strongly Agreed that there are stores nearby to get affordable, healthy food. While 38% of NDC respondents couldn’t afford to eat balanced and healthy meals in the past year, this increased to 44% for whom the food they bought didn’t last and they didn’t have money to get more. Cooking classes about making healthy food on a budget was also reported by 22% of NDC respondents as a top need in the community. Recommendations to improve food security include:
• Community/Policy Level enrollment in SNAP and WIC: Partner existing service providers and schools to raise awareness and engage community members about public services they may be eligible for, and provide on-the-spot SNAP and WIC enrollment opportunities in community settings.
• Community/Policy Level create a sustainable rural food shed: Explore opportunities to ensure that the local food shed is healthy, affordable and sustainable through local, state, and national policies that support small rural growers and grocers.
• Community Level coordination of cooking classes and community meals: Coordinate and expand cooking classes around community meals and preparing low-cost health food with community partners, e.g., OSU food preservation and preparation classes and WIC specialists; hold cooking classes during community child and family events, such as Elkton’s Saturday Basketball program; and explore additional funding sources to reintegrate cooking classes in high school curricula.
• Individual/Family/Community Level expansion of food sharing and coordination: Community members and local or regional gardening and food programs to coordinate or expand fresh produce collection sites, deliveries, and distribution sites and promote more backyard gardening. Partner programs could include churches, Community Gleaners, Elkton Community Education Center (ECEC), Future Business Leaders of America high school volunteer program, master gardener program through Oregon State University (OSU), Umpqua NeighborWorks backyard gardens project, and Oregon Food Bank’s Food, Education, Agriculture, Solutions Together (FEAST) community organizing process currently being planned in Elkton.33
33 For more information about FEAST and the April 8, 2017 meeting about the Douglas County food system to be held in Roseburg visit: https://www.oregonfoodbank.org/our-work/partnerships/community-food-systems/feast/
Center for Improvement of Child and Family Services Page 31 of 39
Parenting & Family Supports Small percentages of NDC respondents reported utilizing parent-child play groups (7%) or parenting classes or support groups (3%) in the prior year. Of the 23 women with infants served by the NDC WIC program in 2016, 15 (or 65%) were not breastfeeding at all. However, nearly a quarter of NDC respondents said they wanted opportunities to get together with other families (24%), and 23% of NDC respondents also reported they wanted access to job training programs. Recommendations to strengthen parenting and family supports include:
• Individual/Family/Community Level parent/caregiver engagement and leadership development: Build on existing local efforts such as Yoncalla Early Works and North Douglas Prenatal-through-3rd Grade (NDP3) to continue expanding the reach of parent/caregiver engagement and leadership in community organizing and implementing community and school events. Support parents/caregivers to promote these activities through social networks via word-of-mouth to continue growing a group of active parents/caregivers to advocate for and help sustain community- and school-based parenting and family support opportunities.
• Individual/Family/Community Level expansion of breastfeeding supports: Promote breastfeeding through more regular and consistent opportunities for families with infants to establish breastfeeding habits, and to address challenges and barriers early. This may require growing the workforce of local providers, or providing additional training for those already working within existing programs, to become lactation educators in NDC communities. Pair information from breastfeeding specialists with parent/caregiver peer-to-peer messaging to continue building norms and community support for breastfeeding, i.e., promote breastfeeding at community baby showers as a way to share information as well as provide support and guidance for new parents.
• Community Level awareness-raising of parenting support programs and services: Continue building on successes in NDC with specific programs and services, e.g., Family Relief Nursery in Drain, parenting classes and the Family Room in Yoncalla, and library activities in Elkton and Yoncalla, to continue building trusting relationships between schools, family support program providers, and families. Ensure that multiple and varied mechanisms exist to communicate opportunities available for parents/caregivers to connect with one another and support their children’s learning both at home and at school.
• Community Level support of family stability through job training: Explore options to develop or promote job training programs available for parents/caregivers in community-based settings and/or in partnership with local or regional organizations, including Umpqua Community College.
Center for Improvement of Child and Family Services Page 32 of 39
Appendix A: Steering Committee Membership34 Name Affiliation Andy Boe* Elkton School District, Local Parent April Deese* Local Parent Catherine Paul* Umpqua Valley Breastfeeding Coalition Cindy Shirtcliff Advantage Dental Elizabeth Briggs Local Parent Evelyn Pruse* North Douglas P3 Jerry Fauci* Yoncalla School District Kathleen Baylor* Women, Infants & Children (WIC) Kelli Stevens Local Parent Kent Smith* Community Member Lupe Paz Local Parent Maureen Short* United Community Action Network (UCAN) Megan Barber* Family Relief Nursery (FRN), Local Parent Michael Hamm Local Parent Naomi Paz* Local Parent Rebekah Melton* Douglas Education Service District (DESD), Local parent Robin Hill-Dunbar The Ford Family Foundation Scott Sublette* Yoncalla School Board Sherry Cowens* United Community Action Network (UCAN) Tracy Fall Local Parent
* Indicates participation in the CHNA Steering Committee during Phase 1.
34 A full roster of the CHNA Steering Committee from Phase 1 can be found in the Phase 1 report. Please request from the authors at Portland State University.
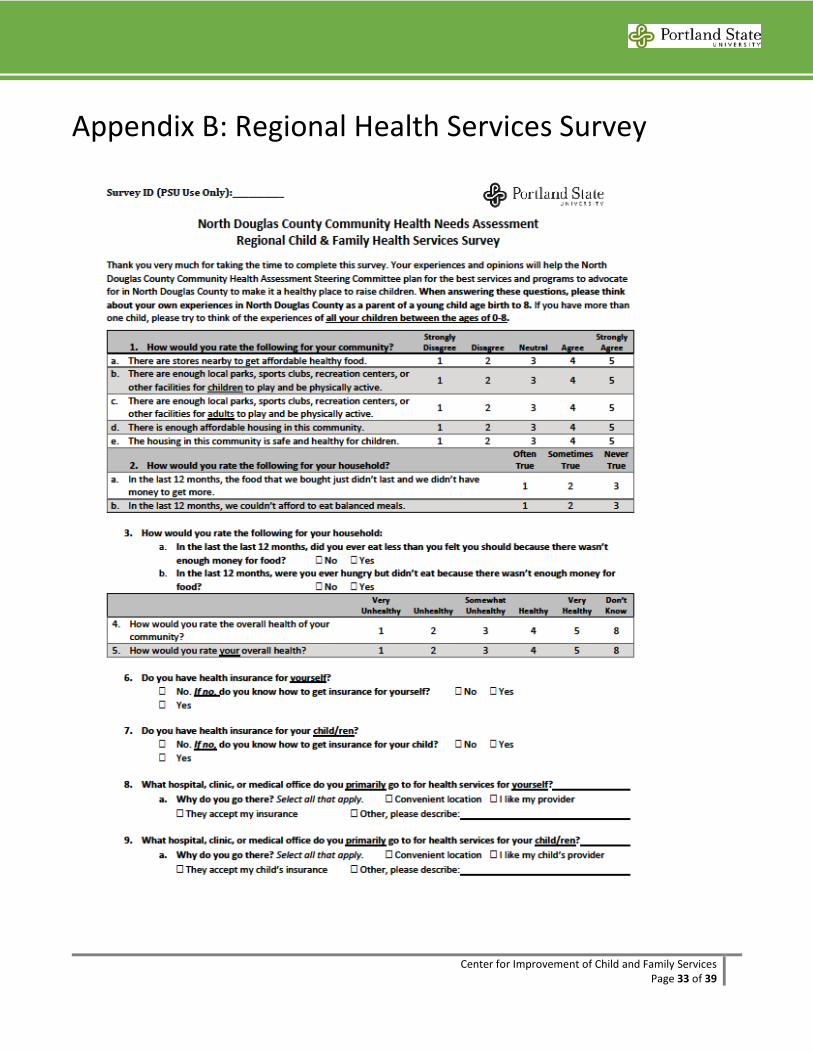
Center for Improvement of Child and Family Services Page 33 of 39
Appendix B: Regional Health Services Survey
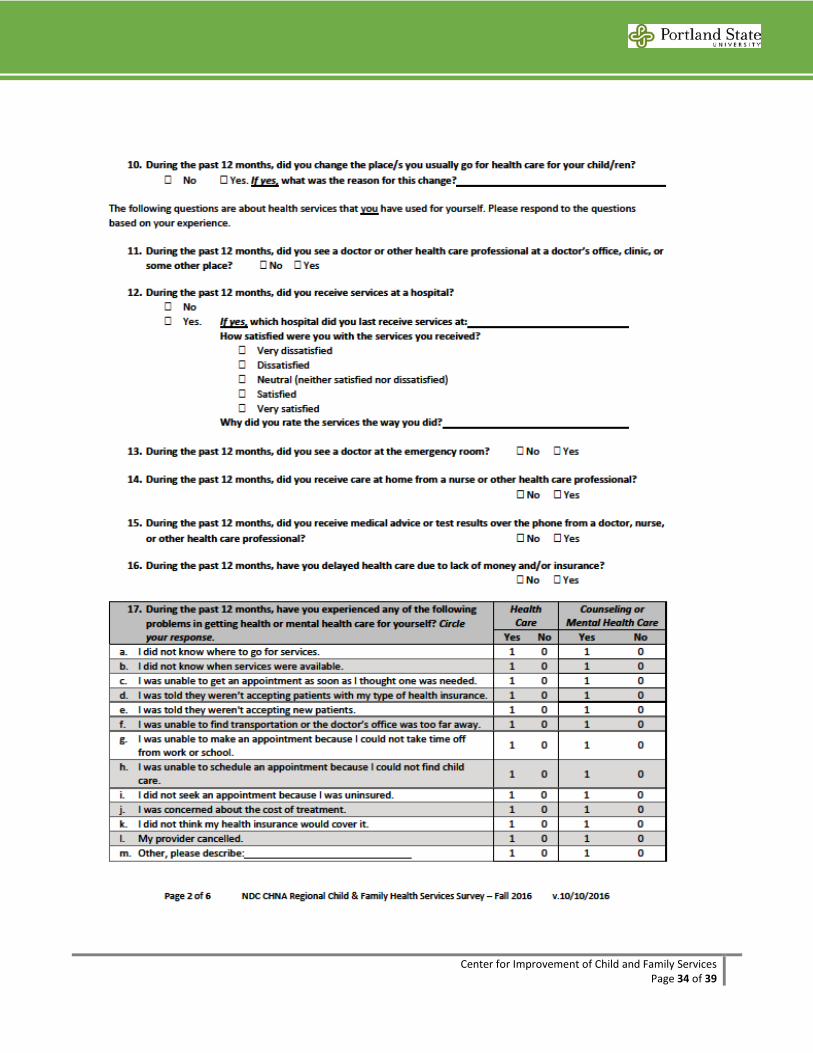
Center for Improvement of Child and Family Services Page 34 of 39
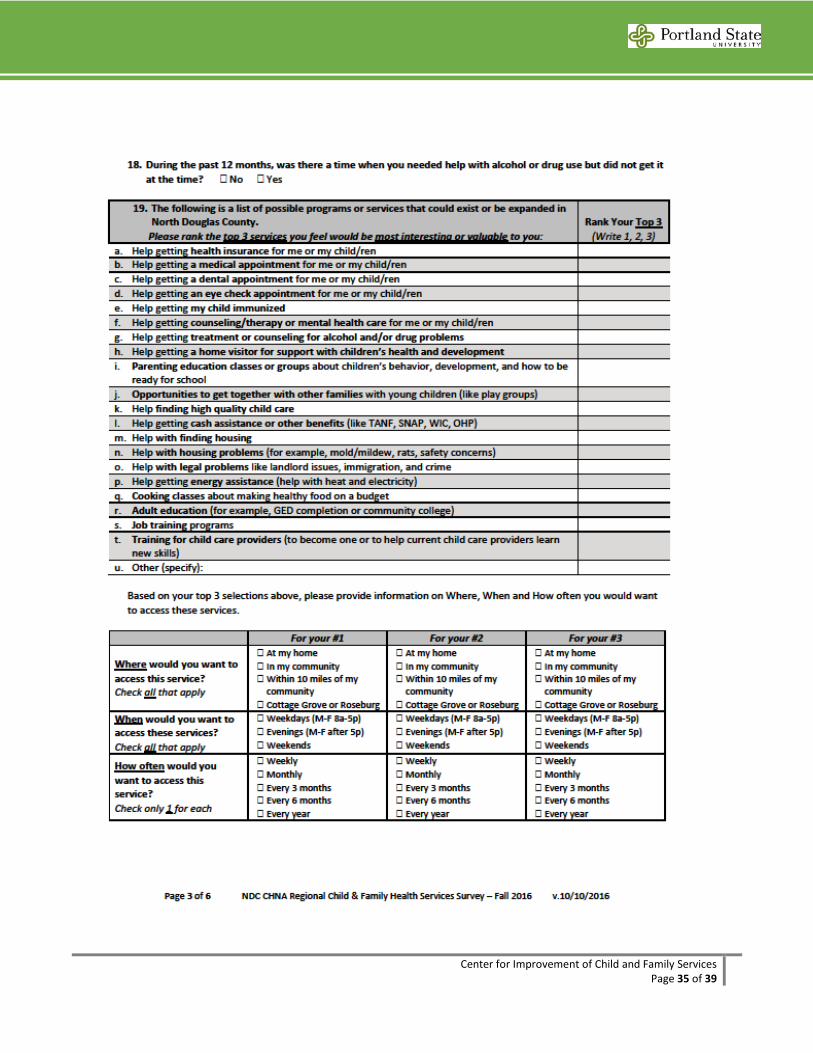
Center for Improvement of Child and Family Services Page 35 of 39
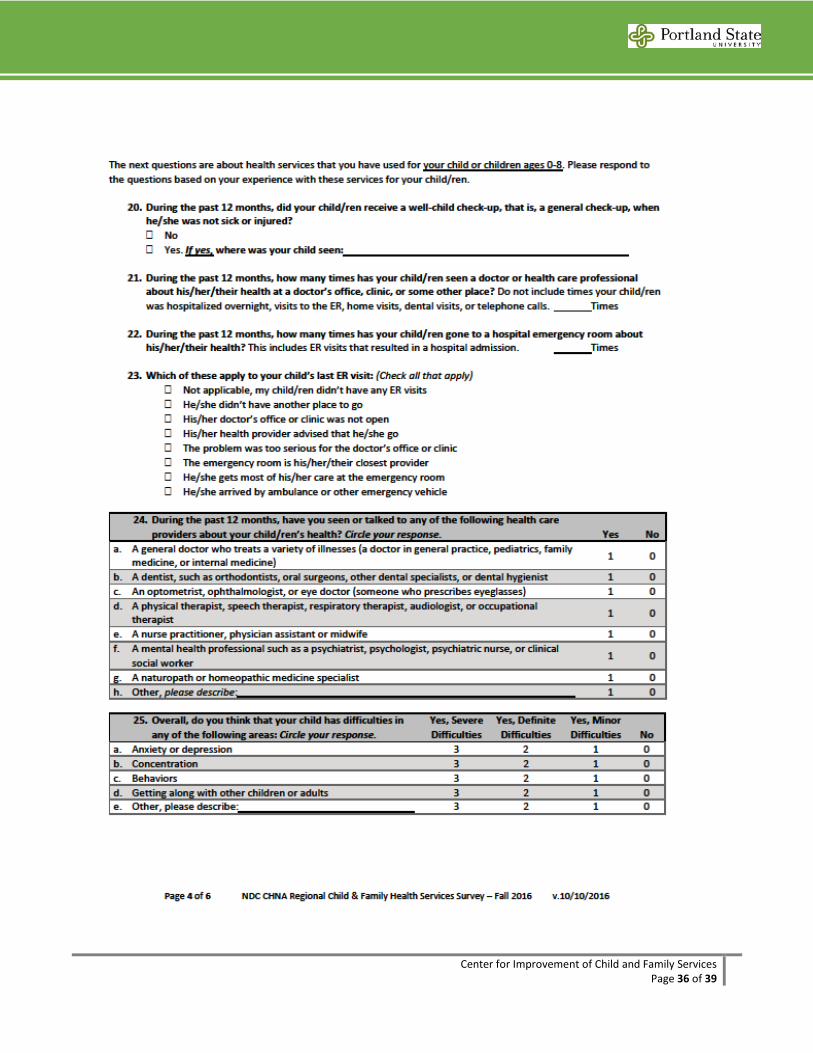
Center for Improvement of Child and Family Services Page 36 of 39
Center for Improvement of Child and Family Services Page 37 of 39
Center for Improvement of Child and Family Services Page 38 of 39
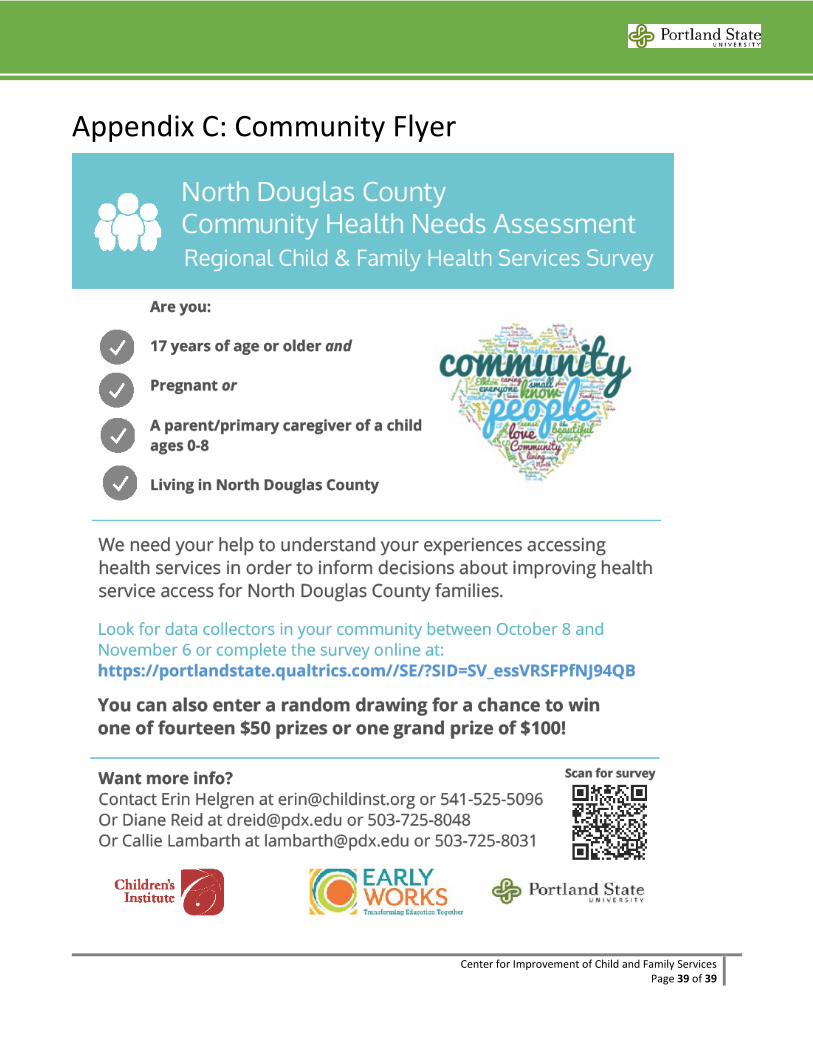
Center for Improvement of Child and Family Services Page 39 of 39
Appendix C: Community Flyer