north carolina supplemental retirement plans - nc treasurer of trustees/wellington... · north...
TRANSCRIPT
A
A 2000654699/375595_0/375395/G1068
North Carolina Supplemental Retirement Plans
Wellington Management Company LLP
14 August 2014

Copyright © 2014 All Rights Reserved2000654701/375595_0/375395/375395A
A
AgendaTitle Line 2
Section one ����������������������������� Wellington Management Company llp Update and Relationship Review
Section two ����������������������������� Quality Value Portfolio Review
Section three �������������������������� Opportunistic Growth Portfolio Review
Section four ���������������������������� Global Opportunities Portfolio Review
Section five ����������������������������� Appendix A – Quality Value
Section six ������������������������������� Appendix B – Global Opportunities
A North Carolina SupplementalRetirement Plans A14 August 2014 A1 1

1
Copyright © 2014 All Rights Reserved2000635967/370019_4/G1039/G1039
A North Carolina SupplementalRetirement Plans A14 August 2014
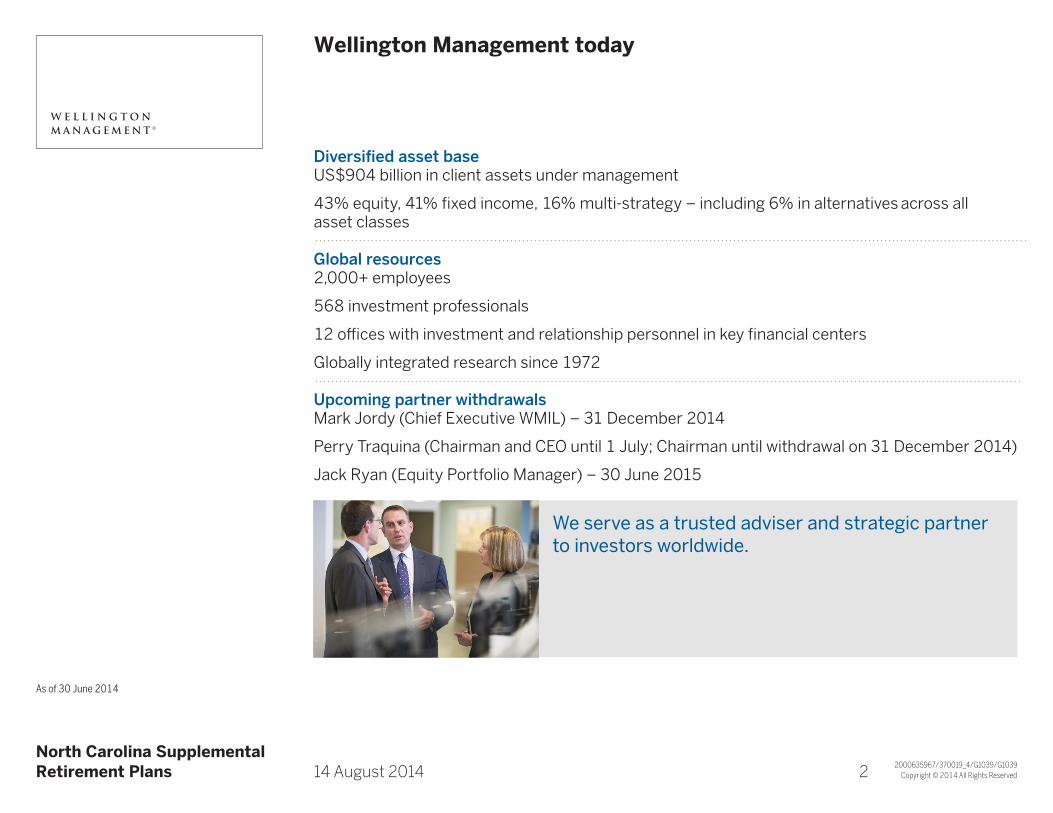
Wellington Management todayTitle Line 2
As of 30 June 2014
Diversified asset baseUS$904 billion in client assets under management
43% equity, 41% fixed income, 16% multi-strategy – including 6% in alternatives across all asset classes
Global resources2,000+ employees
568 investment professionals
12 offices with investment and relationship personnel in key financial centers
Globally integrated research since 1972
Upcoming partner withdrawalsMark Jordy (Chief Executive WMIL) – 31 December 2014
Perry Traquina (Chairman and CEO until 1 July; Chairman until withdrawal on 31 December 2014)
Jack Ryan (Equity Portfolio Manager) – 30 June 2015
We serve as a trusted adviser and strategic partner to investors worldwide.
A1 2
Copyright © 2014 All Rights Reserved2000003966/375595_0/G1039/G1039
A North Carolina SupplementalRetirement Plans A14 August 2014
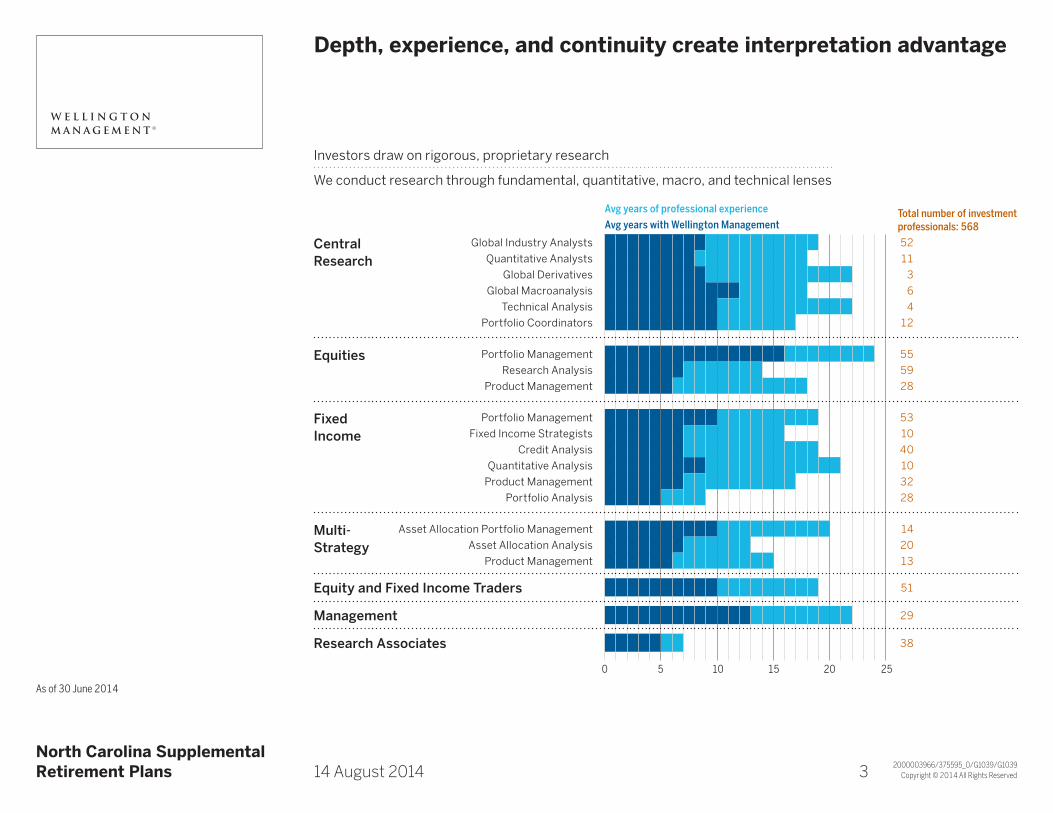
Depth, experience, and continuity create interpretation advantageTitle Line 2
As of 30 June 2014
Avg years of professional experience Total number of investment professionals: 568Avg years with Wellington Management
Central Research
Global Industry Analysts 52Quantitative Analysts 11
Global Derivatives 3Global Macroanalysis 6
Technical Analysis 4Portfolio Coordinators 12
Equities Portfolio Management 55Research Analysis 59
Product Management 28
Fixed Income
Portfolio Management 53Fixed Income Strategists 10
Credit Analysis 40Quantitative Analysis 10
Product Management 32Portfolio Analysis 28
Multi-Strategy
Asset Allocation Portfolio Management 14Asset Allocation Analysis 20
Product Management 13
Equity and Fixed Income Traders 51
Management 29
Research Associates 38
0 5 10 15 20 25
Investors draw on rigorous, proprietary research
We conduct research through fundamental, quantitative, macro, and technical lenses
A1 3

Copyright © 2014 All Rights Reserved2000003970/375395_1/G1039/G1039
A North Carolina SupplementalRetirement Plans A14 August 2014
Comprehensive capabilitiesTitle Line 2Across traditional and alternative strategies
We combine stability with agility, global reach with local depth, and broad multi-asset skill with deep specialization to craft the best solutions for clients
Proprietary research
Traditional and alternative strategies
Equities Fixed income Commodities Multi-Asset
Fundamental Quantitative Macro Technical Derivatives
A1 4

Copyright © 2014 All Rights Reserved2000003974/360482_3/G1039/G1039
A North Carolina SupplementalRetirement Plans A14 August 2014
Open, collaborative culture shapes investment processTitle Line 2
Investors draw on marketplace of ideas to build portfolios
We believe the best investment thinking is forged by the free exchange of ideas among a broadly diverse group of professionals
Forum for global collaborationDaily Morning Meetings
Future Themes researchRegional strategy meetings
Weekly industry reviews
Lessons Learned sessionsInvestor Launch Pad online research exchangeCompany management meetingsInvestor road trips
TECHNICALANALYSISCURRENCY
EQUITIESFIXEDINCOMEGLOBAL
INDUSTRYRESEARCH
ASSET ALLOCATION
DERIVATIVES
COMMODITIES
QUANTITATIVEANALYSIS
MACRO-ANALYSIS
GLOBAL COLLABORATION
Portfolioteam
Lessons Learned sessionsILP online research exchangeCompany management meetingsInvestor road trips
Daily Morning MeetingsFuture Themes research
Regional strategy meetingsWeekly industry reviews
Risk management Trading
Macroanalysis
Currency
Quantitative Analysis
Global Industry Research
EquitiesFixed Income
Asset Allocation
Derivatives
Technical Analysis
Commodities
A1 5

Copyright © 2014 All Rights Reserved2000655426/375395_1/375395/361319A
A
Relationship ReviewTitle Line 2
12-Mar-09 North Carolina retained Wellington Management Company, llp to manage a portion of its DC assets in an Opportunistic Growth Portfolio
30-Jun-10 North Carolina retained Wellington Management Company, llp to manage a portion of its DC assets in a Quality Value Portfolio
31-Jul-10 North Carolina retained Wellington Management Company, llp to manage a portion of its DC assets in a Global Opportunities Portfolio
30-Jun-14 Market values
Opportunistic Growth $282.5 million
Quality Value 300.1
Global Opportunities 350.9
DC Portfolios Total 933.5
DB Portfolios Total 3,792.7
$4,726.2 million
A North Carolina SupplementalRetirement Plans A14 August 2014 A1 6

2

Copyright © 2014 All Rights Reserved2000422205/355123_3/G1068/G1068
A
A
Quality ValueTitle Line 2Investment philosophy
We believe…
Downside protection leads to superior performance due to the effects of compounding over time
The market underappreciates the importance of quality management teams and their ability to consistently generate value and redistribute it to shareholders• Stableandgrowingdividend• Abilitytocreate,innovate,andcapturemarketshareovertime
Troughs in the capital cycle create buying opportunities with lower downside risk
A North Carolina SupplementalRetirement Plans A14 August 2014 A1 7

Copyright © 2014 All Rights Reserved2000561319/371779_0/G1068/G1068
A North Carolina SupplementalRetirement Plans A14 August 2014
Quality ValueTitle Line 2Investment team and resources
Matthew G. Baker Equity Portfolio ManagerSenior Vice President University of Pennsylvania (Wharton) 2000, MBA 17 years of professional experience 10 years with Wellington Management
Edward P. Bousa, CFA Equity Portfolio Manager/AnalystSenior Vice President Harvard Business School 1984, MBA 32 years of professional experience 14 years with Wellington Management
Donald J. Kilbride Equity Portfolio Manager/AnalystSenior Vice President University of North Carolina 1991, MBA 25 years of professional experience 12 years with Wellington Management
Peter C. Fisher Equity Research AnalystVice President University of Chicago 2000, MBA 19 years of professional experience 9 years with Wellington Management
Nataliya Kofman Equity Research AnalystVice President Harvard Business School 2006, MBA 14 years of professional experience 8 years with Wellington Management
p 8age 1

Copyright © 2014 All Rights Reserved2000561327/371698_0/G1068/G1068
A North Carolina SupplementalRetirement Plans A14 August 2014
Quality ValueTitle Line 2Investment team and resources (continued)
Mark E. Vincent Equity Research AnalystVice President Cornell University 2008, MBA 11 years of professional experience 6 years with Wellington Management
Ellen Chae Investment DirectorVice President Northwestern (Kellogg) 1997, MBA 18 years of professional experience 2 years with Wellington Management
50 Global Industry Analysts Fundamental Research 20 years average professional experience 10 years average with Wellington Management
p 9age 1

Copyright © 2014 All Rights Reserved
A North Carolina SupplementalRetirement Plans A14 August 2014
Quality ValueTitle Line 2Firmwide resources leveraged by the team
31 March 2014
2000561272/371616_0/G1068/G1068
Quality Value PortfolioMatthew Baker
Consumer Staples, Retail, Banks
Don KilbrideHealth Care
Edward BousaDiversified Financials, Utilities
Nataliya KofmanIndustrials, Semiconductors, Automobiles, Insurance
Mark VincentInfo Tech, Telecom Svcs, Media
Peter FisherEnergy, Materials,Consumer Durables
Global Equity Traders20 members
Macroanalysts6 members
Fixed Income Credit Analysts39 members
Global Industry Analysts50 members
Other Value team members22 members
p 10age 1

Copyright © 2014 All Rights Reserved
A North Carolina SupplementalRetirement Plans A14 August 2014
Quality ValueTitle Line 2Investment process summary
The characteristics presented are sought during the portfolio management process. Actual experience may not reflect all of these characteristics, or may be out-side of stated ranges.
2000561278/371779_0/G1068/G1068
Quality Value Basic AttributesPrimarily greater than US$10 bil market cap
Opportunistic in US$2 – US$10 bil
Comparisons of basic valuation, yield, and quality measures
“Out of favor” or forgotten
Investment FocusUndervalued market leaders
Industries with improving supply/demand trends
“Broken” growth companies
Fundamental AnalysisTrends in market share
Competitive advantage
Yield
Free cash flow
Common sense valuation
Return on capital vs normalized
Industry cycle analysis
Fundamental research – Idea generation
Upside return/downside risk
Buy/sell discipline
QualityValue
Portfolio construction
65 – 85 Stocks150 – 200 Stocks400 – 600 Stocks
p 11age 1

Copyright © 2014 All Rights Reserved2000654704/375395_0/375395/G2095A
A
North Carolina DC Quality ValueTitle Line 2Investment returns (US$) through 30 June 2014
Annualized Returns
3 mos 1 yr 3 yrs Since Inception1
North Carolina DC Quality Value 4.7 21.7 14.9 18.3
Russell 1000 Value 5.1 23.8 16.9 19.8
YTD 2013 2012 2011
North Carolina DC Quality Value 7.8 28.7 14.9 0.1
Russell 1000 Value 8.3 32.5 17.5 0.4
A North Carolina SupplementalRetirement Plans A14 August 2014
1Inception date of the Portfolio is 30 June 2010. | Returns for periods less than one year are not annualized. | PAST RESULTS ARE NOT NECESSARILY INDICATIVE OF FUTURE RESULTS AND AN INVESTMENT CAN LOSE VALUE.
A1 12

Copyright © 2014 All Rights Reserved2000654714/375395_0/375395/G2095A
A
North Carolina DC Quality ValueTitle Line 2Performance review: year to date as of 30 June 2014Portfolio: 7.8%; Benchmark: 8.3%
A North Carolina SupplementalRetirement Plans A14 August 2014
1Represents stocks that were not held in the Portfolio. | PAST RESULTS ARE NOT NECESSARILY INDICATIVE OF FUTURE RESULTS AND AN INVESTMENT CAN LOSE VALUE.
Allocation Security Selection60
40
20
0
-20
-40
-60
Sector Attribution (Basis Points)
HealthCare
Materials Consstaples
Energy Industrials Telecomsvcs
Utilities Financials Consdiscretionary
Infotechnology
Top Relative Contributors
Company SectorRelative Impact
End Weight
AstraZeneca Health Care 39 bps 1.5%
General Dynamics Industrials 22 1.1
Schlumberger Energy 22 1.1
Merck & Co. Health Care 17 3.7
Alliant Energy Utilities 16 1.6
Top Relative Detractors
Company SectorRelative Impact
End Weight
Mattel Cons discretionary -28 bps 1.0%
ConocoPhillips1 Energy -14 0.0
Lowe’s Cons discretionary -12 1.3
Verizon Telecom svcs -11 1.8
Accenture Info technology -11 1.0
A1 13

Copyright © 2014 All Rights Reserved2000654718/375595_0/375395/G2095A
A
North Carolina DC Quality ValueTitle Line 2Performance review: three years ended 30 June 2014Portfolio: 14.9%; Benchmark: 16.9%
A North Carolina SupplementalRetirement Plans A14 August 2014
1Represents stocks that were not held in the Portfolio. | PAST RESULTS ARE NOT NECESSARILY INDICATIVE OF FUTURE RESULTS AND AN INVESTMENT CAN LOSE VALUE.
Allocation Security Selection40
20
0
-20
-40
-60
-80
Sector Attribution (Basis Points)
Financials Telecomsvcs
Consstaples
Materials HealthCare
Utilities Consdiscretionary
Industrials Infotechnology
Energy
Top Relative Contributors
Company SectorRelative Impact
End Weight
Comcast Cons discretionary 18 bps 1.2%
AstraZeneca Health Care 17 1.5
Ameriprise Financial Financials 16 1.2
Hewlett-Packard1 Info technology 16 0.0
Lowe’s Cons discretionary 13 1.3
Top Relative Detractors
Company SectorRelative Impact
End Weight
Petrobras Energy -28 bps 0.0%
Baker Hughes Energy -27 0.0
Ultra Petroleum Energy -25 0.0
Intel Info technology
-20 1.5
Teva Pharmaceutical Industries Health Care
-20 0.0
A1 14

Copyright © 2014 All Rights Reserved2000654709/375395_0/375395/G2095A
A
North Carolina DC Quality ValueTitle Line 2Portfolio positioning as of 30 June 2014
A North Carolina SupplementalRetirement Plans A14 August 2014
1End Weights as of 30 June 2014
31 Dec 2013 30 Jun 20144
3
2
1
0
-1
-2
-3
Active Weights vs Index (Percent)
HealthCare
Industrials Consstaples
Consdiscretionary
Infotechnology
Telecomsvcs
Energy Utilities Materials Financials
Portfolio* 16.5% 11.6% 7.7% 6.6% 8.8% 1.8% 13.2% 5.5% 1.9% 26.4%
Index* 13.1 10.5 6.9 6.3 8.9 2.3 13.9 6.3 3.4 28.5
A1 15

Copyright © 2014 All Rights Reserved2000654712/375595_0/375395/G2095A
A
North Carolina DC Quality ValueTitle Line 2Top ten active positions as of 30 June 2014
Company IndustryPortfolio Weight1
Benchmark Weight1
Active Weight
Merck & Co. Pharmaceuticals 3.8 1.5 2.3
Berkshire Hathaway Diversified financial svcs 0.0 2.3 -2.3
AT&T Diversified telecom svcs 0.0 1.8 -1.8
Verizon Communications Diversified telecom svcs 1.8 0.0 1.8
Alliant Energy Multi-Utilities 1.7 0.1 1.6
AstraZeneca Pharmaceuticals 1.5 0.0 1.5
Imperial Oil Oil, Gas & Consumable Fuels 1.4 0.0 1.4
Northeast Utilities Electric Utilities 1.5 0.1 1.4
Equifax Professional Services 1.3 0.0 1.3
Lowe’s Specialty Retail 1.3 0.0 1.3
Total of Top Ten 14.3 5.8
Number of Equity Names: 80
A North Carolina SupplementalRetirement Plans A14 August 2014
1Percent of equities
A1 16

Copyright © 2014 All Rights Reserved2000654713/375595_0/375395/G2095A
A
North Carolina DC Quality ValueTitle Line 2Portfolio characteristics as of 30 June 2014
North Carolina DC Quality Value Russell 1000 Value
Size
Asset-weighted Market Cap $119 bil $110 bil
Median Market Cap $53 bil $7 bil
Over $10 billion 93% 84%
$2 – 10 billion 7% 16%
Under $2 billion 0% 0%
Valuation
Projected EPS Growth (3 – 5 Yrs) 8.3% 9.3%
Projected P/E 13.5x 13.9x
Price/Book 2.2x 1.9x
Yield 2.5% 2.3%
Risk
Historical Beta (3-Yr) 0.94
Historical R2 (3-Yr) 0.99
Historical Tracking Risk (3-Yr) 1.63%
Turnover (T-12) 43%
A North Carolina SupplementalRetirement Plans A14 August 2014 A1 17

3

Copyright © 2014 All Rights Reserved
1Effective 1 April 2014, Tim Manning assumed management responsibility of the mid cap portion of Opportunistic Growth from Phil Ruedi.
A North Carolina SupplementalRetirement Plans A14 August 2014
Opportunistic GrowthTitle Line 2Investment team
2000567630/375595_0/G1085/G1085
Andrew J. Shilling, CFA Equity Portfolio Manager – Large Cap Growth StocksSenior Vice President Dartmouth College (Tuck) 1994, MBA 23 years of professional experience
Timothy N. Manning Equity Portfolio Manager – Mid Cap Growth Stocks1
Vice President Team Analyst – Large Cap Growth Stocks Boston University 1997, BS 18 years of professional experience
Steven C. Angeli, CFA Equity Portfolio Manager – Small Cap Growth StocksSenior Vice President University of Virginia (Darden), 1994, MBA 22 years of professional experience
Seth A. Abramowitz, CFA Team Analyst – Large Cap Growth StocksVice President University of Pennsylvania (Wharton) 2002, BS 12 years of professional experience
Mario E. Abularach, CFA, CMT Team Analyst – Small Cap Growth StocksSenior Vice President Harvard Business School 2001, MBA 18 years of professional experience
p 18age 1
Copyright © 2014 All Rights Reserved2000567631/375595_0/G1085/G1085
A North Carolina SupplementalRetirement Plans A14 August 2014
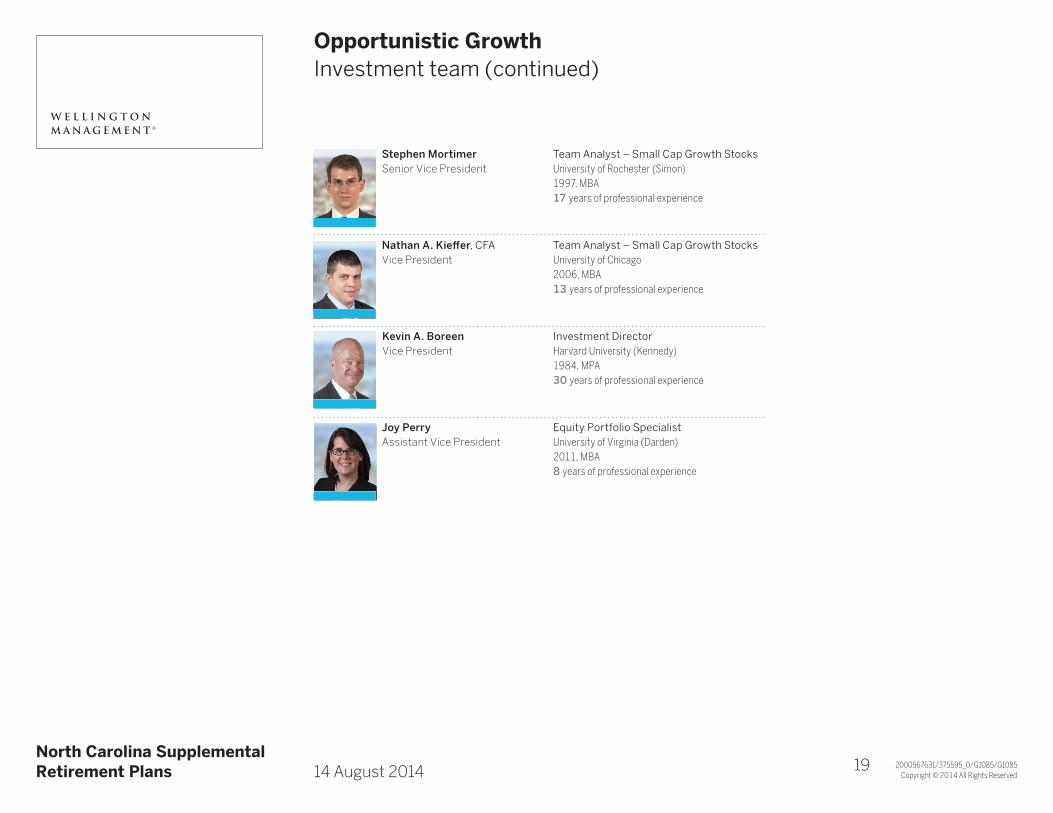
Opportunistic GrowthTitle Line 2Investment team (continued)
Stephen Mortimer Team Analyst – Small Cap Growth StocksSenior Vice President University of Rochester (Simon) 1997, MBA 17 years of professional experience
Nathan A. Kieffer, CFA Team Analyst – Small Cap Growth StocksVice President University of Chicago 2006, MBA 13 years of professional experience
Kevin A. Boreen Investment DirectorVice President Harvard University (Kennedy)
1984, MPA 30 years of professional experience
Joy Perry Equity Portfolio SpecialistAssistant Vice President University of Virginia (Darden) 2011, MBA 8 years of professional experience
p 19age 1

Copyright © 2014 All Rights Reserved2000654985/375416_0/375416/G1085
A North Carolina SupplementalRetirement Plans A14 August 2014
Opportunistic GrowthTitle Line 2The team leverages firmwide resources
30 June 2014
Assets: US$4.1 billionNumber of accounts: 12
Drew ShillingTim ManningSteve AngeliEquity Portfolio
Managers
Team members
Seth AbramowitzLarge Cap
Global Industry Analysts
50 members
Other Growth/Capital
Appreciation Team members
Equity Quantitative Analysts
10 members
Macroanalysts6 members
Global Equity Traders
20 members
Tim ManningMid Cap/Large Cap
Mario AbularachSmall Cap
Nathan KiefferSmall Cap
Stephen MortimerSmall Cap
A1 20

Copyright © 2014 All Rights Reserved2000551847/369286_0/G1086/G1086
A
A
Opportunistic GrowthTitle Line 2Investment Philosophy
We believeCompetitive forces create significant hurdles for companies to sustain above average growth for long periods of time.
Companies with high barriers to entry are best positioned to sustain growth and reward shareholders over time, since stock prices are driven by earnings growth and increasing return on invested capital.
Investors often underestimate a company’s ability to grow. As a result, the duration and consistency of above-average returns for high-quality businesses is frequently misjudged by the market.
The market is overly focused on the short term, which creates opportunities for timeframe arbitrage. In other words, we can add value by taking a longer-term view.
A North Carolina SupplementalRetirement Plans A14 August 2014 A1 20

Copyright © 2014 All Rights Reserved2000551855/370861_0/G1086/G1086A
A
Opportunistic GrowthTitle Line 2Investment Objective and Approach
Investment objectiveSeeks to consistently outperform the growth indexes and, longer term, the broader market
Investment approachBottom-up stock selection based on rigorous fundamental research and access to corporate decision makers
We create a portfolio based on three principles• Sustainablegrowthfocus• Identifiablecompetitivebarrierstoentry• Superiorbusinessmodels
A North Carolina SupplementalRetirement Plans A14 August 2014 A1 21

Copyright © 2014 All Rights Reserved
A North Carolina SupplementalRetirement Plans A14 August 2014
Opportunistic GrowthTitle Line 2Areas of opportunity
For illustrative purposes only. Not representative of an actual investment.
Investment opportunities are typically found in two distinct areas
Typical co. Lifecycle
2000561853/375395_0/G1086/G1086
Proprietary Estimate Market Consensus J Opportunity
Gro
wth
rate
Time Time
Gro
wth
rate
Description of opportunity
Growth potential Duration of growth
Faster growth and improving rate of return that is under-appreciated by the market
High-quality stocks for which duration of return is underestimated by the market
Typical company profile
Sustaining or re-emerging growth/returns
ROIC understated
Changing management focus on returns
High quality
High barriers to entry
Strong FCF and balance sheet
Portfolio example Keurig Green Mountain (GMCR) Visa (V) and Mastercard (MA)
p 22age 1

Copyright © 2014 All Rights Reserved2000567633/369286_0/G1085/G1085
A North Carolina SupplementalRetirement Plans A14 August 2014
Opportunistic GrowthTitle Line 2Investment process summary
The characteristics are sought during the portfolio management process. Actual experience may not reflect all of these characteristics, or may be outside of stated ranges.
Fundamental research – Idea generation Buy/sell discipline Portfolio construction
Opportunistic Growth
Opportunistic Growth investment universe Minimum• EPS growth• Revenue growth
Sustainable growth focus Long-lasting trends
Barriers to entry
Consider regulationand complianceinitiatives
Superior business models High/improving return on capital
Strong management
Quality balance sheet
Sound corporate governance
Free cash flow
Upside potential
Confidence
Stock limits
Industry exposures
Capitalizationranges
~ 1,000 stocks ~ 450 stocks ~ 100 – 150 stocks
p 23age 1
Copyright © 2014 All Rights Reserved2000654731/375395_1/375395/G1086
A North Carolina SupplementalRetirement Plans A14 August 2014
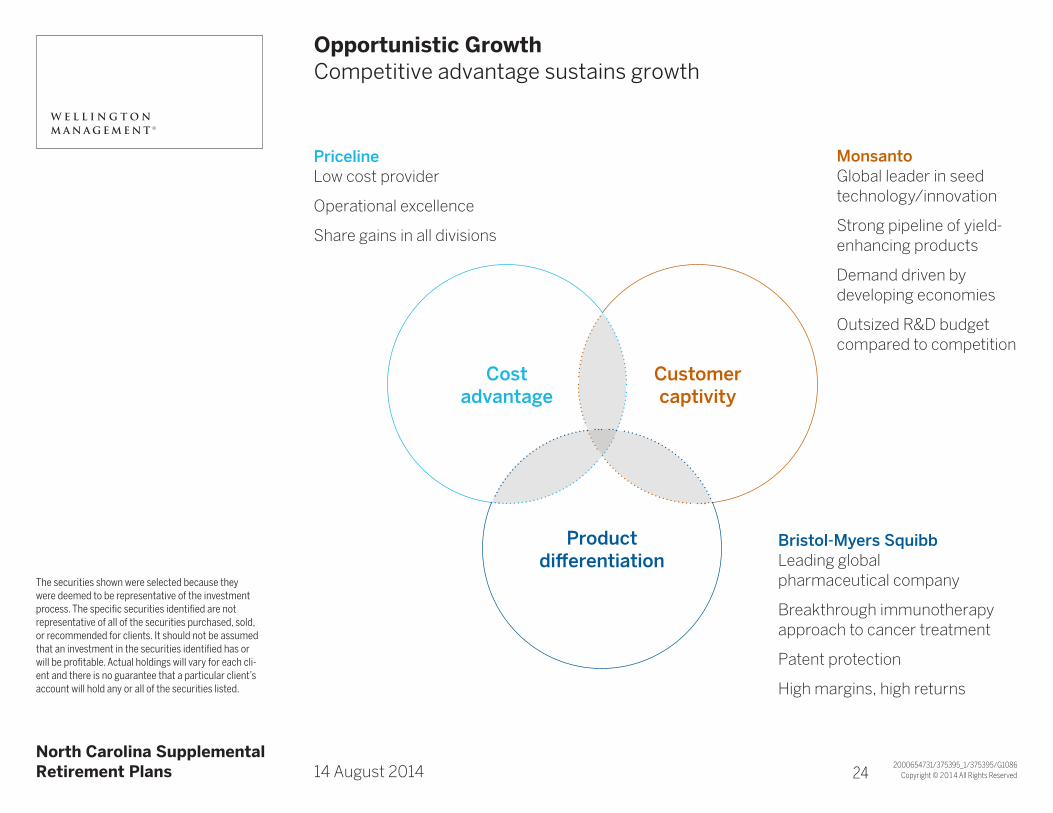
Opportunistic GrowthTitle Line 2Competitive advantage sustains growth
The securities shown were selected because they were deemed to be representative of the investment process. The specific securities identified are not representative of all of the securities purchased, sold, or recommended for clients. It should not be assumed that an investment in the securities identified has or will be profitable. Actual holdings will vary for each cli-ent and there is no guarantee that a particular client’s account will hold any or all of the securities listed.
Priceline Low cost provider
Operational excellence
Share gains in all divisions
Bristol-Myers Squibb Leading global pharmaceutical company
Breakthrough immunotherapy approach to cancer treatment
Patent protection
High margins, high returns
Monsanto Global leader in seed technology/innovation
Strong pipeline of yield-enhancing products
Demand driven by developing economies
Outsized R&D budget compared to competition
Customer captivity
Cost advantage
Product differentiation
A1 24

Copyright © 2013 All Rights Reserved2000561909/355156_1/G1086/G1086
A North Carolina SupplementalRetirement Plans A14 August 2014
Opportunistic GrowthTitle Line 2Price disciplined
Upside potentialPrice targets
Buy
Sell/trim
Free cash flow
Revenue growth3 – 5 year forecast
Organically driven
ProfitabilityNormal operating margins
Tax rates
Capital requirementsWorking capital
Capital expenditures
p 25age 1

Copyright © 2014 All Rights Reserved2000650403/374347_0/G1086/G1086
A North Carolina SupplementalRetirement Plans A14 August 2014
Opportunistic GrowthTitle Line 2Investment example – Google
The security shown was selected because it was deemed to be representative of the investment process. The specific security identified is not repre-sentative of all of the securities purchased, sold, or recommended for clients. It should not be assumed that an investment in the security identified has or will be profitable. Actual holdings will vary for each client and there is no guarantee that a particular client’s account will hold any or all of the securities listed. Refer to the GIPS® compliant presentation provided in the attachment for information regarding the composite.
GOOG
Fundamental research – idea generation
Superior business modelsRobust free cash flow generation
Proven ability to execute
Strong balance sheet
Sustainable growth focusStrong brands with global footprint
Tech leadership
Diversified portfolio of products
Demonstrated ability to invest in new platforms
Growth investment universeUS-based leading internet search provider
New product cycles support accelerating growth
Secular tailwind from the shift in advertising dollars
Buy/sell discipline
Attractive valuation
A1 26

Copyright © 2014 All Rights Reserved2000650402/375395_1/G1086/G1086
A North Carolina SupplementalRetirement Plans A14 August 2014
Opportunistic GrowthTitle Line 2Investment example – Bristol-Myers Squibb
The security shown was selected because it was deemed to be representative of the investment process. The specific security identified is not repre-sentative of all of the securities purchased, sold, or recommended for clients. It should not be assumed that an investment in the security identified has or will be profitable. Actual holdings will vary for each client and there is no guarantee that a particular client’s account will hold any or all of the securities listed. Refer to the GIPS® compliant presentation provided in the attachment for information regarding the composite.
BMY
Buy/sell discipline
Attractive valuation
Fundamental research – idea generation
Superior business models Strong management team
Improving returns
Investing for revenue growth
Sustainable growth focus Potential share of intellectual property rights to all immuno-oncology products worldwide
Diversified pipeline of immuno-oncology solutions
World-class research & development
Growth investment universe Global biopharmaceutical company
Strong immuno-oncology franchise
Empirically supported outcomes for lung cancer therapies
A1 27

Copyright © 2014 All Rights Reserved2000650400/375395_1/G1086/G1086
A North Carolina SupplementalRetirement Plans A14 August 2014
Leveraging broad resources across the firmTitle Line 2Collaboration drives more informed decisions
The security shown was selected because it was deemed to be representative of the investment process. The specific security identified is not representative of all of the securities purchased, sold, or recommended for clients. It should not be assumed that an investment in the security identified has or will be profitable. Actual holdings will vary for each client and there is no guarantee that a particular client’s account will hold any or all of the securities listed. Refer to the GIPS® compliant presentation provided in the attachment for information regarding the composite.
Lowe’s CompaniesSeth AbramowitzGlobal Equity Research Analyst
US Housing Cycle and HomebuildersGabriel KimGlobal Equity Research Analyst
Home Improvement RetailNathan KiefferGlobal Equity Research Analyst
Drew Shilling, CFAPortfolio Manager
Analyze a growth company
Home Depot: US-based home improvement retailer
Macro Analysis
Assess likely impact of macroeconomic fundamentals in US, including…
Industry Analysis
Create mosaic view of Home Depot’s growth potential, including analysis of…
Conclusion
Strong demand for home improvement retail
Conclusion
Superior business model and sustainable growth profile at attractive valuation
Conclusion
Sound housing fundamentals
Company Analysis
Assess company fundamentals and valuation. Collaborate with…
US Macro Environment and US Household FormationJuhi DhawanDirector, US Macroanalysis
US Mortgage SectorMichael GarrettFixed Income Portfolio Manager
Competitive Landscape in Home Improvement RetailAmit DesaiGlobal Retail and Consumer Durables Analyst
Consumer Financing and Mortgage SectorJohn CoffeyNorth American Bank Analyst
Assess Home Depot’s sustainable growth focus taking into account macroeconomic, industry, and company factors
A1 28

Copyright © 2014 All Rights Reserved2000654734/375395_0/375395/G1598A
A
North Carolina DC Opportunistic GrowthTitle Line 2Investment returns (US$) through 30 June 2014
Annualized returns (%)
3 mos 1 yr 3 yrs 5 yrs Since Inception1
North Carolina DC Opportunistic Growth 2.9 26.6 13.9 19.5 22.9
Russell 3000 Growth 4.9 26.8 16.1 19.3 23.0
YTD 2013 2012 2011 2010
North Carolina DC Opportunistic Growth 4.6 37.5 21.9 -8.7 22.0
Russell 3000 Growth 6.0 34.2 15.2 2.2 17.6
A North Carolina SupplementalRetirement Plans A14 August 2014
1Inception date of the portfolio is 12 March 2009. | Performance returns for periods one year or less are not annualized. Returns are shown net of the portfolio’s fees and expenses, and include the reinvestment of dividendsand capital gains. Portfolio returns also reflect the effect of any fee waiver or expense reimbursement in effect during the period. Index performance does not reflect the deduction of fees or expenses, but does reflect the reinvestment of dividends and capital gains. | PAST RESULTS ARE NOT NECESSARILY INDICATIVE OF FUTURE RESULTS AND AN INVESTMENT CAN LOSE VALUE.
A1 29
Copyright © 2014 All Rights Reserved2000654748/375595_0/375395/G1598A
A
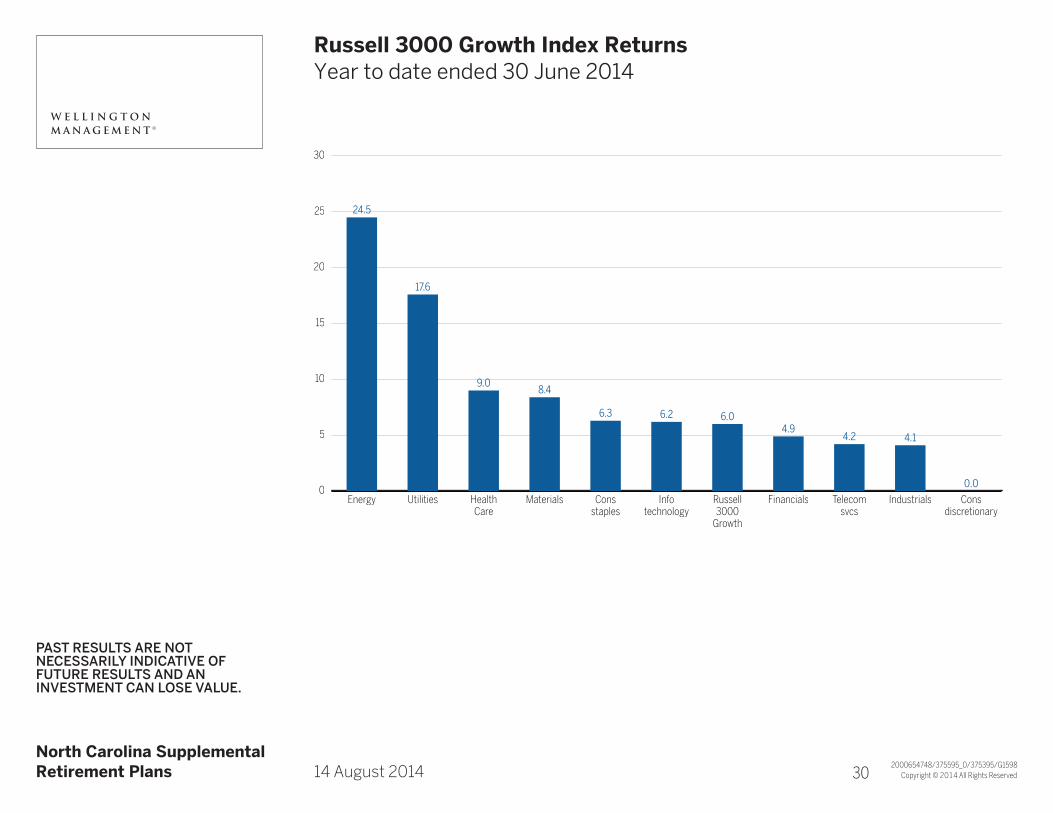
Russell 3000 Growth Index ReturnsTitle Line 2Year to date ended 30 June 2014
A North Carolina SupplementalRetirement Plans A14 August 2014
PAST RESULTS ARE NOT NECESSARILY INDICATIVE OF FUTURE RESULTS AND AN INVESTMENT CAN LOSE VALUE.
30
25
20
15
10
5
0
24.5
Energy
17.6
Utilities
9.0
HealthCare
8.4
Materials
6.3
Consstaples
6.2
Infotechnology
6.0
Russell3000Growth
4.9
Financials
4.2
Telecomsvcs
4.1
Industrials
0.0
Consdiscretionary
A1 30

Copyright © 2014 All Rights Reserved2000654750/375595_0/375395/G1598A
A
North Carolina DC Opportunistic GrowthTitle Line 2Performance review: year to date ended 30 June 2014Portfolio: 4.6%; Russell 3000 Growth: 6.0%
A North Carolina SupplementalRetirement Plans A14 August 2014
1Represents stocks that were not held in the portfolio | PAST RESULTS ARE NOT NECESSARILY INDICATIVE OF FUTURE RESULTS AND AN INVESTMENT CAN LOSE VALUE.
Allocation Security selection150
100
50
0
-50
-100
-150
Sector attribution (basis points)
Consdiscretionary
Consstaples
Materials Energy Utilities Telecomsvcs
HealthCare
Financials Industrials Infotechnology
Top Relative Contributors
Company SectorRelative impact
Keurig Green Mountain Cons staples 73 bps
Amazon.com1 Cons discretionary 34
TRW Automotive Cons discretionary 25
Continental Resource Energy 18
Facebook Info technology 17
Top Relative Detractors
Company SectorRelative Impact
Lululemon Athletica Cons discretionary -59 bps
Apple Info technology -51
LinkedIn Info technology -36
Schlumberger1 Energy -29
Microsoft Info technology -24
A1 31

Copyright © 2014 All Rights Reserved2000654752/375395_0/375395/G1598A
A
Russell 3000 Growth Index returnsTitle Line 2Three years ended 30 June 2014
A North Carolina SupplementalRetirement Plans A14 August 2014
PAST RESULTS ARE NOT NECESSARILY INDICATIVE OF FUTURE RESULTS AND AN INVESTMENT CAN LOSE VALUE.
24
22
20
18
16
14
12
10
23.1
HealthCare
18.7
Consdiscretionary
17.6
Energy
16.1
Russell3000Growth
15.5
Infotechnology
15.3
Financials
15.3
Industrials
14.8
Consstaples
14.6
Utilities
12.8
Materials
11.9
Telecomsvcs
A1 32
Copyright © 2014 All Rights Reserved2000654753/375395_1/375395/G1598A
A
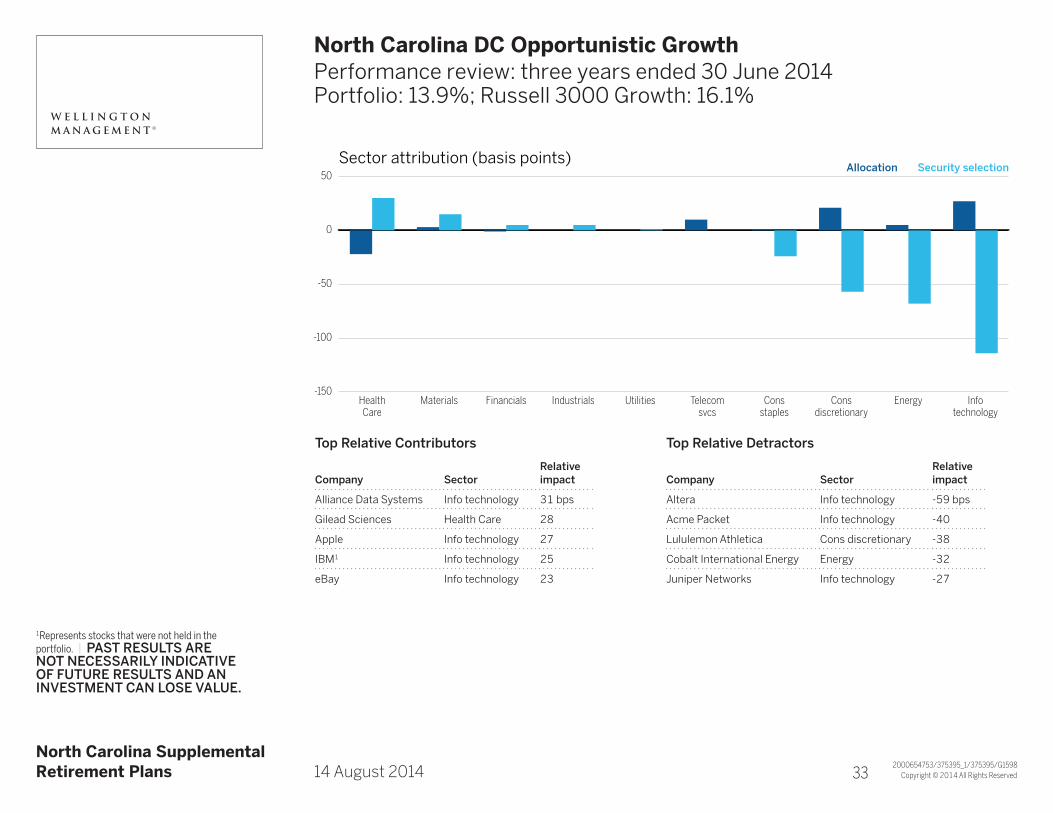
North Carolina DC Opportunistic GrowthTitle Line 2Performance review: three years ended 30 June 2014Portfolio: 13.9%; Russell 3000 Growth: 16.1%
A North Carolina SupplementalRetirement Plans A14 August 2014
1Represents stocks that were not held in the portfolio. | PAST RESULTS ARE NOT NECESSARILY INDICATIVE OF FUTURE RESULTS AND AN INVESTMENT CAN LOSE VALUE.
Allocation Security selection50
0
-50
-100
-150
Sector attribution (basis points)
HealthCare
Materials Financials Industrials Utilities Telecomsvcs
Consstaples
Consdiscretionary
Energy Infotechnology
Top Relative Contributors
Company SectorRelative impact
Alliance Data Systems Info technology 31 bps
Gilead Sciences Health Care 28
Apple Info technology 27
IBM1 Info technology 25
eBay Info technology 23
Top Relative Detractors
Company SectorRelative impact
Altera Info technology -59 bps
Acme Packet Info technology -40
Lululemon Athletica Cons discretionary -38
Cobalt International Energy Energy -32
Juniper Networks Info technology -27
A1 33

Copyright © 2014 All Rights Reserved2000654741/375395_0/375395/G1598A
A
North Carolina DC Opportunistic GrowthTitle Line 2Portfolio positioning as of 30 June 2014
A North Carolina SupplementalRetirement Plans A14 August 2014
1End weights as of 30 June 2014; totals may not sum to 100% due to rounding.
31 Dec 2013 30 Jun 201420
15
10
5
0
-5
-10
Active weights vs index (percent)
Consdiscretionary
Industrials HealthCare
Utilities Consstaples
Materials Telecomsvcs
Financials Energy Infotechnology
Portfolio* 32.6% 16.6% 14.1% 0.0% 9.1% 2.6% 0.0% 3.0% 3.1% 19.0%
Index* 18.2 12.4 13.5 0.1 9.9 4.4 2.2 5.4 6.3 27.5
A1 34

Copyright © 2014 All Rights Reserved2000654742/375395_0/375395/G1598A
A
North Carolina DC Opportunistic GrowthTitle Line 2Top ten holdings as of 30 June 2014
Company Industry% of equities
% of Russell 3000 Growth Index
Google Software & svcs 4.4 3.0
Facebook Software & svcs 2.5 1.2
Gilead Sciences Pharma, biotech & life sci 2.5 1.2
Home Depot Retailing 2.4 1.0
Bristol-Myers Squibb Pharma, biotech & life sci 2.1 0.3
Harley-Davidson Auto & components 2.0 0.1
Priceline Group Retailing 1.9 0.6
Monsanto Materials 1.9 0.6
21st Century Fox Media 1.9 0.4
AutoZone Retailing 1.9 0.2
Total of top ten 23.5 8.6
Number of equity names: 142
A North Carolina SupplementalRetirement Plans A14 August 2014
The specific securities identified are not representative of all of the securities purchased, sold, or recom-mended for clients. It should not be assumed that an investment in the securities identified has or will be profitable. Actual holdings will vary for each client and there is no guarantee that a particular client’s account will hold any or all of the securities listed.
A1 35
Copyright © 2014 All Rights Reserved2000654743/375395_0/375395/G1598A
A
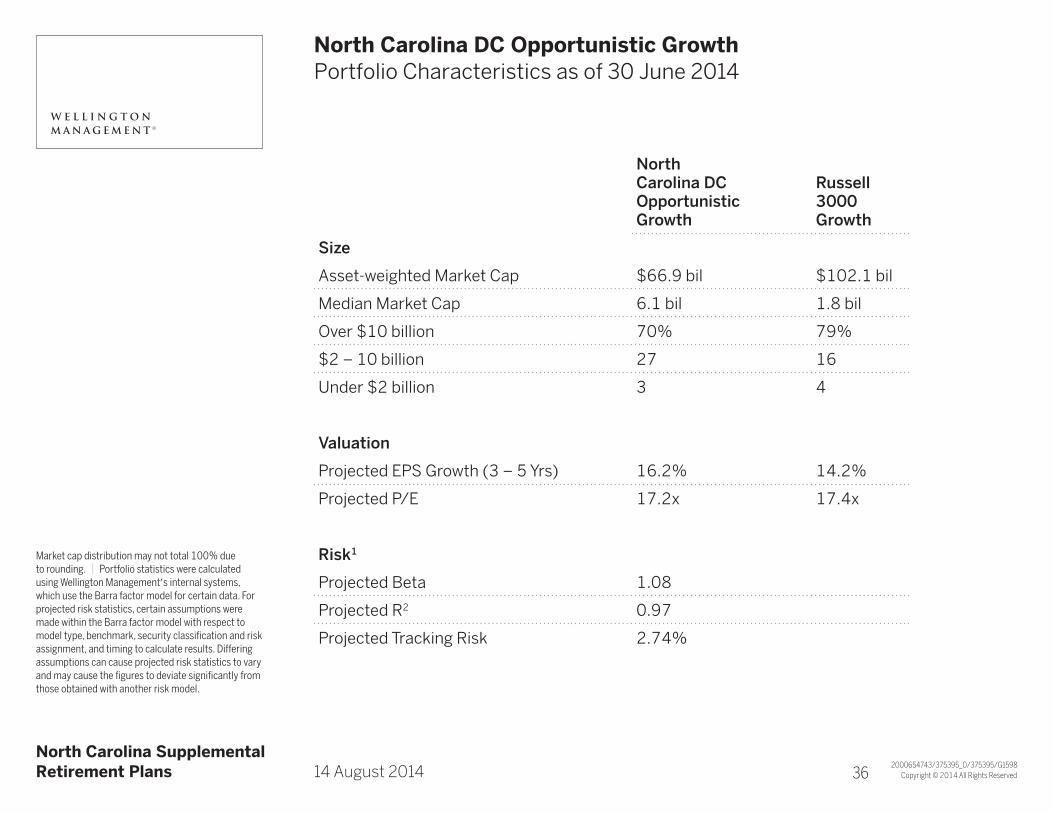
North Carolina DC Opportunistic GrowthTitle Line 2Portfolio Characteristics as of 30 June 2014
North Carolina DC Opportunistic Growth
Russell 3000 Growth
Size
Asset-weighted Market Cap $66.9 bil $102.1 bil
Median Market Cap 6.1 bil 1.8 bil
Over $10 billion 70% 79%
$2 – 10 billion 27 16
Under $2 billion 3 4
Valuation
Projected EPS Growth (3 – 5 Yrs) 16.2% 14.2%
Projected P/E 17.2x 17.4x
Risk1
Projected Beta 1.08
Projected R2 0.97
Projected Tracking Risk 2.74%
A North Carolina SupplementalRetirement Plans A14 August 2014
Market cap distribution may not total 100% due to rounding. | Portfolio statistics were calculated using Wellington Management’s internal systems, which use the Barra factor model for certain data. For projected risk statistics, certain assumptions were made within the Barra factor model with respect to model type, benchmark, security classification and risk assignment, and timing to calculate results. Differing assumptions can cause projected risk statistics to vary and may cause the figures to deviate significantly from those obtained with another risk model.
A1 36

4

Copyright © 2014 All Rights Reserved2000583419/375595_0/G2746/G2746
A North Carolina SupplementalRetirement Plans A14 August 2014
Global OpportunitiesTitle Line 2Investment team
Nicolas M. ChoumenkovitchEquity Portfolio ManagerSenior Vice President
University of Virginia (Darden) 1992, MBA
25 years of professional experience 19 years at Wellington Management
Tara E. Connolly Stilwell, CFAEquity Portfolio ManagerVice President
University of Pennsylvania (Wharton) 1994, BS
20 years of professional experience 6 years at Wellington Management
Anastasia A. Canty, CFAEquity Research AnalystVice President
Boston College (Carroll) 1999, MS
17 years of professional experience 8 years at Wellington Management
Yaroslav A. PanEquity Research AnalystVice President
Bowdoin College2004, BA
10 years of professional experience 9 years at Wellington Management
Erin C. Harrington, CFAEquity Research Associate
Boston College 2005, BS
10 years of professional experience 7 years at Wellington Management
Robert M. Gelwick, CFAInvestment DirectorVice President
Yale University 2001, MBA
16 years of professional experience 7 years at Wellington Management
A1 38

Copyright © 2014 All Rights Reserved2000583407/360219_0/G2746/G2746
A
A
Global OpportunitiesTitle Line 2Investment objective and distinguishing characteristics
Investment objectiveSeeks to outperform the MSCI All Country World Index consistently over rolling 3‑year periods
Distinguishing characteristicsExperienced team and broad research resources• Developedandemergingmarketsexperience• Industry,macro,andfixedincomespecialists
Return on capital approach• Underestimatedimprovementand/orsustainabilityofreturns• Emphasisonassetsandmanagement(cashgeneration,capitalallocation)• Macrodynamics:industrystructure,change(cyclical,secular)
Balanced portfolio construction across a broad universe• Diverseholdingsandeconomicexposures
A North Carolina SupplementalRetirement Plans A14 August 2014 A1 39

Copyright © 2014 All Rights Reserved
A North Carolina SupplementalRetirement Plans A14 August 2014
Global OpportunitiesTitle Line 2Dedicated team collaborating with global resources
30 June 2014
2000583427/375395_0/G2746/G2746
Nicolas
ChoumenkovitchEnergy, materials,
autos, services
Tara Connolly StilwellFinancials,
health care, telecom
Erin HarringtonResearch Associate
Yaroslav PanIndustrials, information technology,
media
Global Industry Analysts
52 members
Fixed Income Credit Analysts (includes Currency Analysts)
40 members
Quantitative Analysts11 equity members,
10 fixed Income members
Macroanalysts6 members
Equity Portfolio Managers55 members
Equity Research Analysts59 members
Anastasia CantyConsumer
discretionary, consumer staples,
utilities
p 40age 1

Copyright © 2014 All Rights Reserved2000583426/374402_0/G2746/G2746
A
A
Global OpportunitiesTitle Line 2Investment philosophy
We believeThe market focuses excessively on short-term earnings and growth (the income statement)
Market inefficiencies exist because investors narrowly focus on companies within a specific region or industry
Return on capital drives stock prices over time
Assets and capital allocation (the balance sheet) provide early insights into future returns
Return on capital can be mispriced at the company, industry, and macro levels
A North Carolina SupplementalRetirement Plans A14 August 2014 A1 41

Copyright © 2014 All Rights Reserved
A North Carolina SupplementalRetirement Plans A14 August 2014
Global OpportunitiesTitle Line 2Idea generation: Identify companies which we believe futurereturns on capital are underestimated
For illustrative purposes only. Not representative of an actual investment.
2000583424/375595_0/G2746/G2746
Retu
rn o
n ca
pita
l
Time
Retu
rn o
n ca
pita
l
Time
What we look for: changeValue of assets
Industry dynamics
Management/Capital allocation policy
What we look for: competitive advantageUnique assets (patents, brands, proprietary process, etc.)
Favorable industry structure
Management/Disciplined capital allocation policy
Improving returns Sustainable returns
Market expectation
Market expectation
Team’s forecast Team’s forecast
p 42age 1

Copyright © 2014 All Rights Reserved2000583421/373113_0/G2746/G2746
A North Carolina SupplementalRetirement Plans A14 August 2014
Global OpportunitiesTitle Line 2Investment process
The characteristics presented are sought during the portfolio management process. Actual experience may not reflect all of these characteristics, or may be outside of stated ranges.
Portfolio
70 – 120stocks
Proprietary research•Companymeetings•GlobalIndustryAnalysts
•OtherWellingtonManagementportfoliomanagementteams
•Investmentscreens
Industry/Assetchange
Managementchange
Uniqueassets
GlobalValueChain
Pricetarget
Upside/Downsideanalysis
Selldiscipline
Diversification–stocks,industries,regions,alphadrivers
Riskanalysis
Differentiatedinsight
Improvingorsustainablereturnoncapital
Valuation–cheapperunitofreturn•Discountedcashflow•Assetmultiples
Idea sources
Idea generation
Portfolio construction
Stock selection
A1 43
Copyright © 2014 All Rights Reserved2000654766/375395_1/375395/G2746A
A
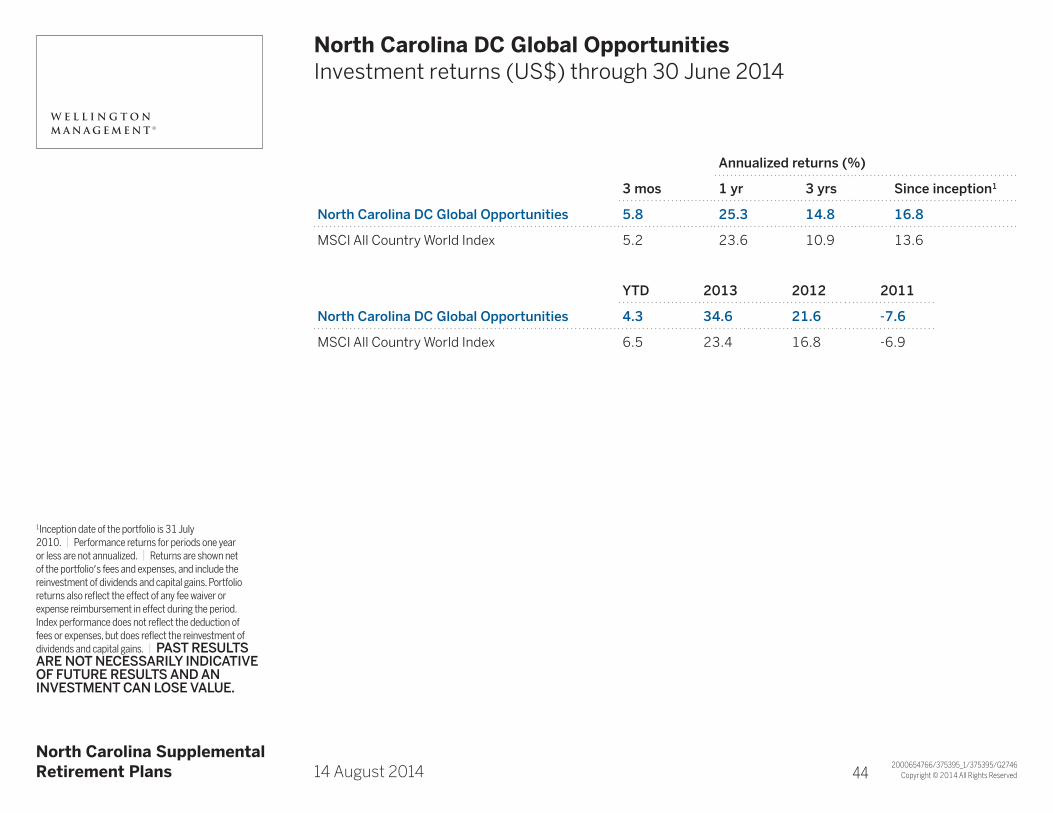
North Carolina DC Global OpportunitiesTitle Line 2Investment returns (US$) through 30 June 2014
Annualized returns (%)
3 mos 1 yr 3 yrs Since inception1
North Carolina DC Global Opportunities 5.8 25.3 14.8 16.8
MSCI All Country World Index 5.2 23.6 10.9 13.6
YTD 2013 2012 2011
North Carolina DC Global Opportunities 4.3 34.6 21.6 -7.6
MSCI All Country World Index 6.5 23.4 16.8 -6.9
A North Carolina SupplementalRetirement Plans A14 August 2014
1Inception date of the portfolio is 31 July 2010. | Performance returns for periods one year or less are not annualized. | Returns are shown net of the portfolio’s fees and expenses, and include the reinvestment of dividends and capital gains. Portfolio returns also reflect the effect of any fee waiver or expense reimbursement in effect during the period. Index performance does not reflect the deduction of fees or expenses, but does reflect the reinvestment of dividends and capital gains. | PAST RESULTS ARE NOT NECESSARILY INDICATIVE OF FUTURE RESULTS AND AN INVESTMENT CAN LOSE VALUE.
A1 44

Copyright © 2014 All Rights Reserved2000654768/375595_0/375395/G2746
A North Carolina SupplementalRetirement Plans A14 August 2014
Global Equity MarketsTitle Line 230 June 2014
All returns expressed in USD.
MSCINorth America
MSCI Paci cex Japan
MSCI AllCountry World
MSCIEmerging Markets
MSCIEurope
MSCIEAFE
MSCIJapan
-10
0
10
20YTD 3 years
Utilities Energy Healthcare
Infotechnology
Materials MSCIWorld
Consstaples
Financials Industrials Telecom Consdisc
-10
0
10
20
30MSCI sectors (%)
MSCI regions (%)
A1 45

Copyright © 2014 All Rights Reserved2000654769/375395_1/375395/G2746A
A
North Carolina DC Global OpportunitiesTitle Line 2Performance review: year to date ended 30 June 2014Portfolio: 4.3%; benchmark: 6.5%
A North Carolina SupplementalRetirement Plans A14 August 2014
PAST RESULTS ARE NOT NECESSARILY INDICATIVE OF FUTURE RESULTS AND AN INVESTMENT CAN LOSE VALUE.
Allocation Security selection50
0
-50
-100
-150
-200
Sector attribution (basis points)
Energy Infotechnology
Consstaples
HealthCare
Utilities Telecomsvcs
Materials Consdiscretionary
Industrials Financials
Top relative contributors
Company SectorRelative impact
NXP Semiconductors Info technology 40 bps
Anadarko Petroleum Energy 32
Pioneer Natural Resources Energy 27
SK Hynix Info technology 26
Halliburton Energy 22
Top relative detractors
Company SectorRelative impact
Rolls-Royce Industrials -26 bps
Julius Baer Group Financials -25
Citigroup Industrials -23
Wisdomtree Invest Financials -22
Sberbank of Russia Financials -21
A1 46

Copyright © 2014 All Rights Reserved2000654860/375595_0/375395/G2746A
A
North Carolina DC Global OpportunitiesTitle Line 2Performance by region: year to date ended 30 June 2014Portfolio: 4.3%; benchmark: 6.5%
A North Carolina SupplementalRetirement Plans A14 August 2014
PAST RESULTS ARE NOT NECESSARILY INDICATIVE OF FUTURE RESULTS AND AN INVESTMENT CAN LOSE VALUE.
Allocation Security selection20
0
-20
-40
-60
-80
-100
-120
Regional attribution (basis points)
EmergingMarkets
UK Japan Developed AsiaPaci�c ex Japan
Developed Europeex UK/Middle East
NorthAmerica
A1 47
Copyright © 2014 All Rights Reserved2000654865/375395_1/375395/G2746A
A
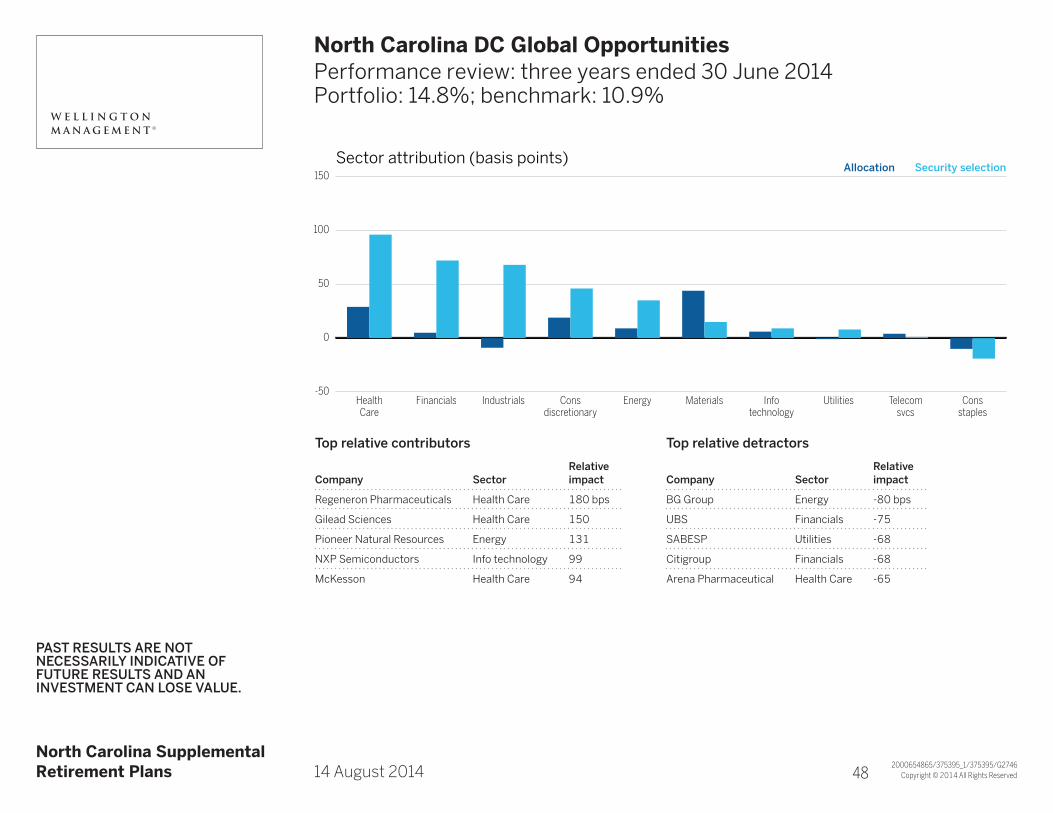
North Carolina DC Global OpportunitiesTitle Line 2Performance review: three years ended 30 June 2014Portfolio: 14.8%; benchmark: 10.9%
A North Carolina SupplementalRetirement Plans A14 August 2014
PAST RESULTS ARE NOT NECESSARILY INDICATIVE OF FUTURE RESULTS AND AN INVESTMENT CAN LOSE VALUE.
Allocation Security selection150
100
50
0
-50
Sector attribution (basis points)
HealthCare
Financials Industrials Consdiscretionary
Energy Materials Infotechnology
Utilities Telecomsvcs
Consstaples
Top relative contributors
Company SectorRelative impact
Regeneron Pharmaceuticals Health Care 180 bps
Gilead Sciences Health Care 150
Pioneer Natural Resources Energy 131
NXP Semiconductors Info technology 99
McKesson Health Care 94
Top relative detractors
Company SectorRelative impact
BG Group Energy -80 bps
UBS Financials -75
SABESP Utilities -68
Citigroup Financials -68
Arena Pharmaceutical Health Care -65
A1 48
Copyright © 2014 All Rights Reserved2000654989/375395_1/375395/G2746A
A
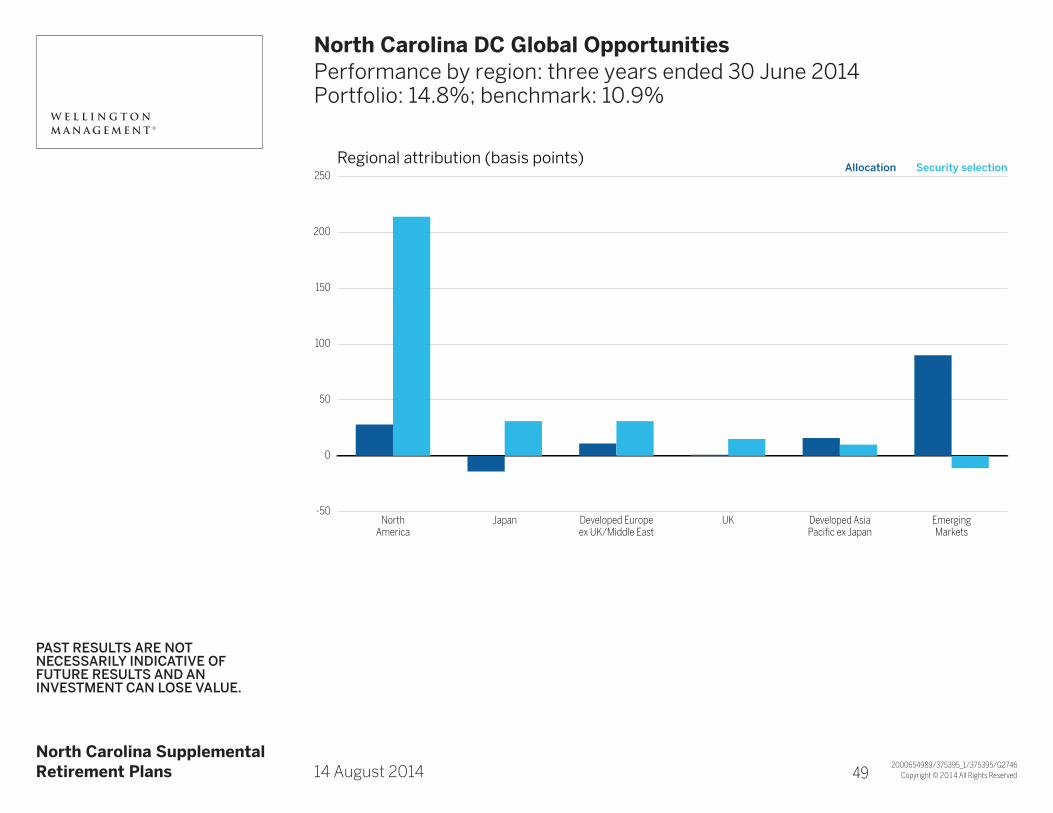
North Carolina DC Global OpportunitiesTitle Line 2Performance by region: three years ended 30 June 2014Portfolio: 14.8%; benchmark: 10.9%
A North Carolina SupplementalRetirement Plans A14 August 2014
PAST RESULTS ARE NOT NECESSARILY INDICATIVE OF FUTURE RESULTS AND AN INVESTMENT CAN LOSE VALUE.
Allocation Security selection250
200
150
100
50
0
-50
Regional attribution (basis points)
NorthAmerica
Japan Developed Europeex UK/Middle East
UK Developed AsiaPaci�c ex Japan
EmergingMarkets
A1 49

Copyright © 2014 All Rights Reserved2000654770/375395_0/375395/G2746A
A
North Carolina DC Global OpportunitiesTitle Line 2Sector positioning as of 30 June 2014
A North Carolina SupplementalRetirement Plans A14 August 2014
1End weights as of 30 June 2014; totals may not sum to 100% due to rounding.
31 Dec 2013 30 Jun 20148
6
4
2
0
-2
-4
-6
-8
Active weights vs index (percent)
HealthCare
Industrials Infotechnology
Consstaples
Consdiscretionary
Financials Materials Telecomsvcs
Energy Utilities
Portfolio1 17.2% 15.1% 12.4% 9.1% 10.7% 20.4% 4.9% 1.7% 7.9% 0.0%
Index1 10.6 10.6 12.8 9.6 11.6 21.3 6.0 3.8 10.2 3.4
A1 50

Copyright © 2014 All Rights Reserved2000654771/375395_0/375395/G2746A
A
North Carolina DC Global OpportunitiesTitle Line 2Regional positioning as of 30 June 2014
A North Carolina SupplementalRetirement Plans A14 August 2014
1End weights as of 30 June 2014; totals may not sum to 100% due to rounding.
31 Dec 2013 30 Jun 201410
5
0
-5
-10
Active weights vs index (percent)
NorthAmerica
Japan Europe ex UK/Middle East
UnitedKingdom
Developed AsiaPaci�c ex Japan
EmergingMarkets
Portfolio1 60.2% 13.9% 17.7% 5.7% 0.2% 2.3%
Index1 52.7 7.4 16.8 7.8 4.4 10.9
A1 51

Copyright © 2014 All Rights Reserved2000654772/375395_1/375395/G2746A
A
North Carolina DC Global OpportunitiesTitle Line 2Largest active positions as of 30 June 2014
Top five overweights
Company Industry Country% of equities
% of index1
Active position (%)
AstraZeneca Pharma, biotech & life sci United Kingdom 2.6 0.2 2.4
Anheuser-Busch InBev Food, beverage & tobacco Belgium 2.4 0.2 2.2
Air Liquide Materials France 2.1 0.1 2.0
Google Software & svcs United States 2.6 0.9 1.7
Bristol-Myers Squibb Pharma, biotech & life sci United States 2.0 0.2 1.8
Top five underweights
Company Industry Country% of equities
% of index1
Active position (%)
Apple Tech hardware & equip United States 0.0 1.5 -1.5
ExxonMobil Energy United States 0.0 1.2 -1.2
Microsoft Software & svcs United States 0.0 0.9 -0.9
Johnson & Johnson Pharma, biotech & life sci United States 0.0 0.8 -0.8
Royal Dutch Shell Energy United Kingdom 0.0 0.7 -0.7
A North Carolina SupplementalRetirement Plans A14 August 2014
1MSCI All Country World Index | Active weight is the difference between the portfolio and benchmark weights. The active weight may not calculate exactly due to rounding.
A1 52
Copyright © 2014 All Rights Reserved2000654773/375595_0/375395/G2746A
A
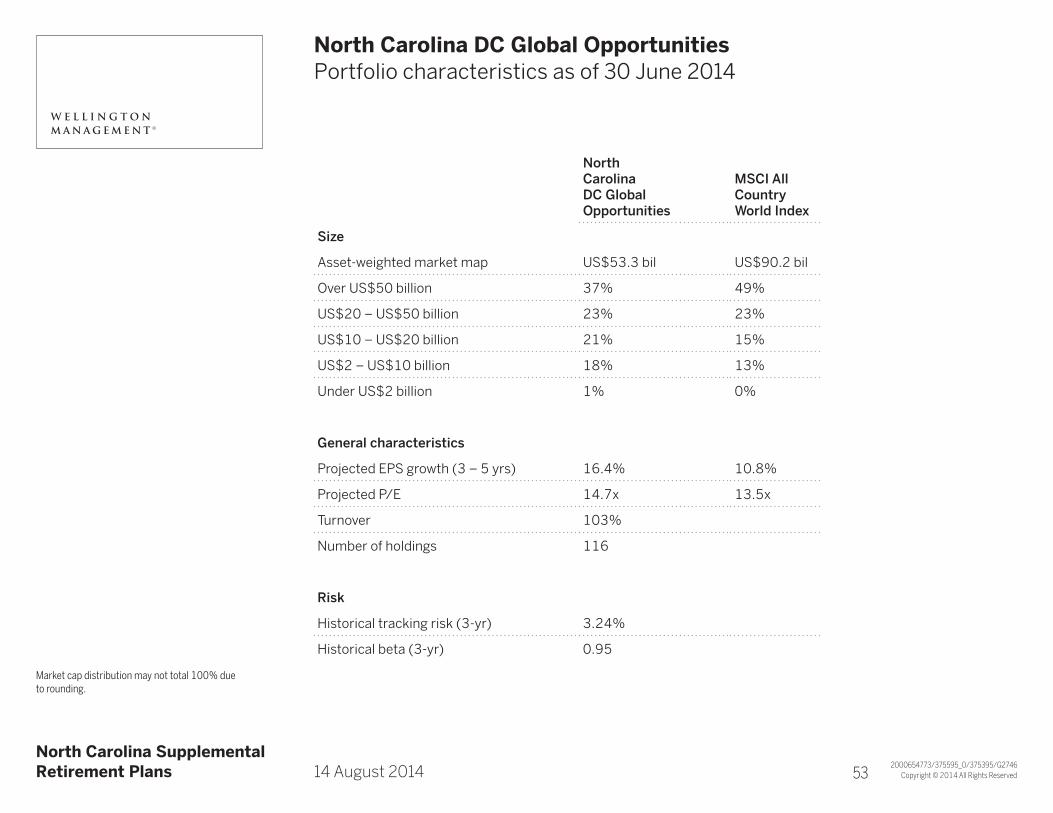
North Carolina DC Global OpportunitiesTitle Line 2Portfolio characteristics as of 30 June 2014
North Carolina DC Global Opportunities
MSCI All Country World Index
Size
Asset-weighted market map US$53.3 bil US$90.2 bil
Over US$50 billion 37% 49%
US$20 – US$50 billion 23% 23%
US$10 – US$20 billion 21% 15%
US$2 – US$10 billion 18% 13%
Under US$2 billion 1% 0%
General characteristics
Projected EPS growth (3 – 5 yrs) 16.4% 10.8%
Projected P/E 14.7x 13.5x
Turnover 103%
Number of holdings 116
Risk
Historical tracking risk (3-yr) 3.24%
Historical beta (3-yr) 0.95
A North Carolina SupplementalRetirement Plans A14 August 2014
Market cap distribution may not total 100% due to rounding.
A1 53

5

Copyright © 2014 All Rights Reserved2000654829/375395_1/375430/346529
A North Carolina SupplementalRetirement Plans A14 August 2014
Quality Value: historical active factor exposuresTitle Line 2(representative account)
1Units of cross-sectional standard devia-tion | Sources: FactSet, Barra | Factors are defined in the Barra risk models as identifiable sources of risk that can represent important drivers of both risk and return in equity markets. The active exposures in the table are presented relative to Russell 1000 Value Index.
31 Dec 20081 31 Dec 20091 31 Dec 20101 30 Dec 20111 31 Dec 20121 31 Dec 20131 30 June 20141
Size 0.03 0.28 0.33 0.33 0.24 0.25 0.25
Growth -0.02 0.11 0.13 0.18 0.09 -0.01 -0.01
Yield -0.15 0.11 0.06 0.07 0.14 0.06 0.05
Momentum 0.06 -0.06 -0.02 0.03 0.00 -0.04 0.06
Volatility -0.04 -0.27 -0.13 -0.16 -0.23 -0.13 -0.13
Earnings variation -0.05 -0.17 -0.14 -0.23 -0.26 -0.21 -0.17
Trading activity -0.12 -0.25 -0.19 -0.15 -0.22 -0.21 -0.24
Leverage -0.13 -0.28 -0.28 -0.29 -0.25 -0.23 -0.22
Value -0.23 -0.26 -0.25 -0.21 -0.27 -0.23 -0.21
31 Dec 2008 31 Dec 2009 31 Dec 2010 30 Dec 2011 31 Dec 2012 31 Dec 2013 30 June 2014
Size -5.63 -4.57 -4.71 -1.28 1.31 -0.73 -0.73
Growth -1.48 4.77 0.30 -0.39 -1.85 -1.07 -0.56
Yield 1.64 -0.98 1.48 -0.32 -2.93 -1.11 0.09
Momentum -4.19 -20.03 1.47 3.42 -0.04 0.64 0.22
Volatility -7.46 10.33 2.90 -4.15 1.54 3.09 -0.70
Earnings variation -6.94 1.23 0.36 -0.86 1.98 0.38 0.14
Trading activity -4.27 4.13 0.75 -2.17 0.62 -0.31 1.34
Leverage -8.48 0.20 1.29 -0.27 3.15 2.50 0.72
Value -3.30 0.40 1.56 -1.90 0.98 0.98 0.31
Quality value vs Russell 1000 ValueBarra – active exposureBarra US Long-Term Model (USE3L)US dollar
Barra – factor returnsBarra US Long-term model (USE3L)US dollar
A1 A1

Copyright © 2014 All Rights Reserved
A North Carolina SupplementalRetirement Plans A14 August 2014
Quality Value: market environmentTitle Line 2Emphasis on safety
Source: FactSet | Safety is defined as the average of low price volatility, low earnings volatility, and low bal-ance sheet leverage.
Quality value – Safety exposure over time relative to the R1000V
2000654830/375430_2/375430/356741
6/09 6/10 6/11 6/12 6/13 6/140
1
2
3
4
IRM safety
A1 A2

Copyright © 2014 All Rights Reserved2000654832/375595_0/375430/356741
A North Carolina SupplementalRetirement Plans A14 August 2014
Quality valueTitle Line 2Size undervalued vs ten-year average
Source: FactSet
Russell 1000 value: size relative P/E
3/03 3/04 4/05 4/06 4/07 4/08 4/09 4/10 5/11 5/12 6/13 6/140.90
0.95
1.00
1.05
1.10
Q1 size relative P/E Average Std dev
A1 A3

Copyright © 2014 All Rights Reserved2000654831/375595_0/375430/356741
A North Carolina SupplementalRetirement Plans A14 August 2014
Quality valueTitle Line 2Safety undervalued vs ten-year average
Source: FactSet | Quality is the average of high ROIC, low balance sheet leverage, and stable EPS growth.
Russell 1000 value: safety relative P/E
3/03 3/04 4/05 4/06 4/07 4/08 4/09 4/10 5/11 5/12 6/13 6/140.90
0.95
1.00
1.05
1.10
1.15
1.20
1.25
Q1 safety relative P/E Average Std dev
A1 A4

Copyright © 2014 All Rights Reserved2000654833/375395_1/375430/361570
A North Carolina SupplementalRetirement Plans A14 August 2014
Quality ValueTitle Line 2Lipper Large Cap Value top and bottom quartiles
10
20
30
40
-0.8 -0.4 0.0 0.4 0.8
Annu
alize
d re
turn
(%)
Active exposure
10
20
30
40
-0.6 -0.3 0.0 0.3 0.6
Annu
alize
d re
turn
(%)
Active exposure
Top quartile Bottom quartile Quality Value
10
20
30
40
-0.6 -0.3 0.0 0.3 0.6
Annu
alize
d re
turn
(%)
Active exposure
10
20
30
40
-0.6 -0.3 0.0 0.3 0.6
Annu
alize
d re
turn
(%)
Active exposure
Source Factset | Universe constructed using the top and bottom quartile of managers in the Lipper US Large Cap Value category based on trailing 2 year returns (as of 30 June 2014). Relative factor exposures calculated using the Russell 1000 Value Index and the Barra US Long Term Model (USE3L).
Returns by earnings size exposure Returns by yield exposure
Returns by volatility exposure Returns by leverage exposure
A1 A5

Copyright © 2014 All Rights Reserved
Source: Evestment | As of 30 June 2014
A North Carolina SupplementalRetirement Plans A14 August 2014
Quality Value: peer relative returnsTitle Line 2
Quality Value peer relative returns (YTD)
2000654877/375430_5/375430/375430
-24.5
-32.2
-35.4
-38.7
-46.6
46.8
30.4
25.0
20.5
14.1
10.9
8.6
7.6
6.4
4.5
5th Percentile
25th Percentile
Median
75th Percentile
95th Percentile
Wellington Management Company Quality Value
Russell 1000 Value
20.6
16.6
14.6
12.8
9.4
21.6
18.0
15.6
12.7
9.6
10.5
4.0
0.6
-2.9
-8.2
41.9
36.6
33.3
30.6
24.4
2008 20122010 YTD2009 20132011
# of
observations 526 517 499 482 445 415 385
A1 A6
Copyright © 2014 All Rights Reserved2000654870/375430_3/375430/375430
A North Carolina SupplementalRetirement Plans A14 August 2014
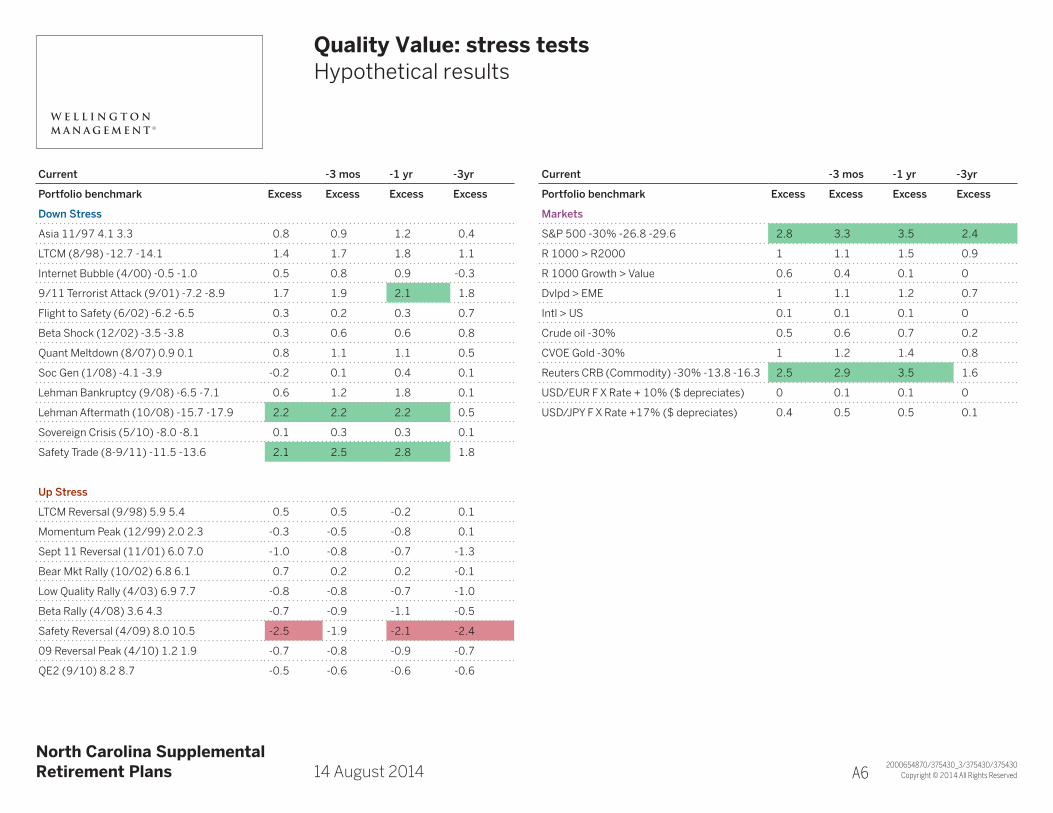
Quality Value: stress testsTitle Line 2Hypothetical results
Current -3 mos -1 yr -3yr
Portfolio benchmark Excess Excess Excess Excess
Down Stress
Asia 11/97 4.1 3.3 0.8 0.9 1.2 0.4
LTCM (8/98) -12.7 -14.1 1.4 1.7 1.8 1.1
Internet Bubble (4/00) -0.5 -1.0 0.5 0.8 0.9 -0.3
9/11 Terrorist Attack (9/01) -7.2 -8.9 1.7 1.9 2.1 1.8
Flight to Safety (6/02) -6.2 -6.5 0.3 0.2 0.3 0.7
Beta Shock (12/02) -3.5 -3.8 0.3 0.6 0.6 0.8
Quant Meltdown (8/07) 0.9 0.1 0.8 1.1 1.1 0.5
Soc Gen (1/08) -4.1 -3.9 -0.2 0.1 0.4 0.1
Lehman Bankruptcy (9/08) -6.5 -7.1 0.6 1.2 1.8 0.1
Lehman Aftermath (10/08) -15.7 -17.9 2.2 2.2 2.2 0.5
Sovereign Crisis (5/10) -8.0 -8.1 0.1 0.3 0.3 0.1
Safety Trade (8-9/11) -11.5 -13.6 2.1 2.5 2.8 1.8
Up Stress
LTCM Reversal (9/98) 5.9 5.4 0.5 0.5 -0.2 0.1
Momentum Peak (12/99) 2.0 2.3 -0.3 -0.5 -0.8 0.1
Sept 11 Reversal (11/01) 6.0 7.0 -1.0 -0.8 -0.7 -1.3
Bear Mkt Rally (10/02) 6.8 6.1 0.7 0.2 0.2 -0.1
Low Quality Rally (4/03) 6.9 7.7 -0.8 -0.8 -0.7 -1.0
Beta Rally (4/08) 3.6 4.3 -0.7 -0.9 -1.1 -0.5
Safety Reversal (4/09) 8.0 10.5 -2.5 -1.9 -2.1 -2.4
09 Reversal Peak (4/10) 1.2 1.9 -0.7 -0.8 -0.9 -0.7
QE2 (9/10) 8.2 8.7 -0.5 -0.6 -0.6 -0.6
Current -3 mos -1 yr -3yr
Portfolio benchmark Excess Excess Excess Excess
Markets
S&P 500 -30% -26.8 -29.6 2.8 3.3 3.5 2.4
R 1000 > R2000 1 1.1 1.5 0.9
R 1000 Growth > Value 0.6 0.4 0.1 0
Dvlpd > EME 1 1.1 1.2 0.7
Intl > US 0.1 0.1 0.1 0
Crude oil -30% 0.5 0.6 0.7 0.2
CVOE Gold -30% 1 1.2 1.4 0.8
Reuters CRB (Commodity) -30% -13.8 -16.3 2.5 2.9 3.5 1.6
USD/EUR F X Rate + 10% ($ depreciates) 0 0.1 0.1 0
USD/JPY F X Rate +17% ($ depreciates) 0.4 0.5 0.5 0.1
A1 A6
Copyright © 2014 All Rights Reserved2000654868/375430_1/375430/375430
A North Carolina SupplementalRetirement Plans A14 August 2014
Quality Value: stress testsTitle Line 2Hypothetical results
Stress testing is being provided upon request to NMSIC and is for their internal use only and is not for re-distribution. Source: FactSet, Barra US Long-Term Risk Model (USE3L). Barra stress testing allows users to understand the potential impact of market dislocations on portfolio values and sensitivities. The results represent hypothetical performance by replicating the historical factor returns of each specific historical market event and applying those factors to the portfolio, based on its holdings. As noted- the “current” section utilizes holdings of the portfolio and benchmark as of 6/30/14 in the analysis to simulate a 1 month return. -3 mos, -1 yr, -3 yr shows the hypothetical 1 month excess gain/loss utilizing portfolio holdings and benchmark holdings 3 months ago, 1 year ago and 3 years ago respectively. The simulated performance presented is hypothetical and is not representative of an actual account. Simulated performance is developed with the benefit of hindsight (i.e. actual knowledge of market conditions) and thus has many inherent limitations. Additional important disclosures continued on page 2.
Additional Disclosures: Extreme event stress tests based on market periods noted. Other stress test scenarios based on relationship of Barra factors and indices noted. Material is illustrative of data utilized as part of the risk management process. The material is for risk analysis purposes only and is not to be construed as representative of actual performance, historical or in the future. Except where indicated, hypothetical performance results are gross of commissions and other direct expenses, advisory fees, custody charges, withholding taxes, and other indirect expenses, and include reinvestment of dividends. If all expenses were reflected, the performance shown would be lower. Actual fees will vary depending on, among other things, the applicable fee schedule and account size. For example, if US$100,000 was invested and experienced a 10%annual return compounded monthly for ten years, its ending value, without giving effect to the deduction of advisory fees,would be US$270,704 with annualized compounded return of 10.47%. If an advisory fee of 0.95% of average net assets per year were deducted monthly for the ten-year period, the annualized compounded return would be 9.43% and the ending dollar value would be US$246,355. Information regarding the firm’s advisory fees is available upon request. Composite returns have the potential to be adjusted until reviewed and finalized 30 days following each calendar quarter end period. For use in one-one-one presentations only. This supplemental information complements the GIPS® compliant presentation.
Certain assumptions have been made for modeling purposes and may not be repeated. Changes in the assumptions may have a material impact on the simulated returns presented. Other periods would have different results. Past performance and hypothetical performance is no guarantee of future results.
Actual performance may differ substantially from the simulated performance presented. Some limitations may include: Historical factor returns are modeled by Barra and are based on numerous assumptions, market environments and extreme events can be unique and may not re-occur. The management of an actual client account would likely produce different results than the simulated performance presented. Factors not taken into consideration for the simulated performance include different cash flows, expenses, and performance calculation methods. Since trades have not been actually been executed, results may have under- or over-compensated for the impact, if any, of certain market factors, such as lack of liquidity, and may not reflect the impact that certain economic or market factors may have had on the decision-making process if client funds were actually managed in the manner shown.
Analysis utilizes holdings data for Quality Value. Holdings are based on a representative account which was selected by the firm because it was deemed to best represent this investment approach. As the designated representative account may change over time, different accounts may be reflected for the time period shown. Each client account is individually managed; actual holdings will vary for each client and there is no guarantee that a particular client’s account will have the same characteristics. Representative account information is supplemental to the GIPS® compliant presentation which is provided in the attachment. Stress tests indicate hypothetical excess return (loss) and are not representative of an actual account or actual performance. Hypothetical performance is subject to numerous limitations. Actual performance will vary, perhaps significantly.
A1 A8

6

Copyright © 2014 All Rights Reserved2000583425/374402_0/G2746/G2746A
A
Global OpportunitiesTitle Line 2Return on capital investment framework
Why return on capital?Comprehensive measure of shareholder value creation • Freecashflow/Capitalinvested• Incorporatesprofitabilityandcapitalinvested(incomestatement,balancesheet)• Leveragesinsightsoncompany,industry,andmacroenvironment
Flexibleandconsistentmeasureofvaluecreation• Allowscomparabilityacrosscountries,sectors,andbusinessmodels
Mispriced returns on capital drive stock prices • Underestimatedimprovementinreturns• Underestimatedsustainabilityofreturns
A North Carolina SupplementalRetirement Plans A14 August 2014 A1 B1

Copyright © 2013 All Rights Reserved
A North Carolina SupplementalRetirement Plans A14 August 2014
Global OpportunitiesTitle Line 2Analytical framework
For illustrative purposes only. Not representative of an actual investment.
We look for stocks which we believe future returns on capital are undervalued (shaded area)
Cash flow-based valuation metrics measure upside
2000583423/374402_0/G2746/G2746
Low return on capital High return on capital
Market line
“Growth”“Value”Return on capital
Valu
atio
n (a
sset
mul
tiple
)
Current return Forecasted return
Current return ≈ forecasted return
Stock B: sustainable returns
Stock A: improving returns
Upside
Upside
p B2age 1
Copyright © 2014 All Rights Reserved
A North Carolina SupplementalRetirement Plans A14 August 2014
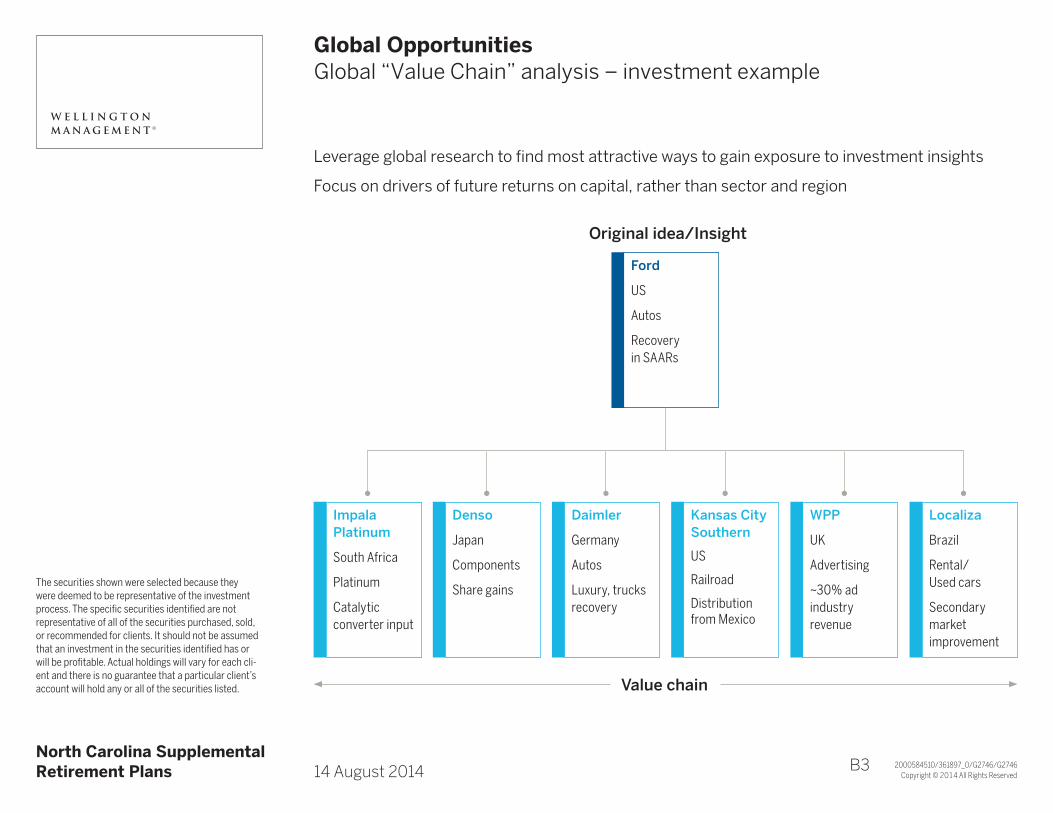
Global OpportunitiesTitle Line 2Global “Value Chain” analysis – investment example
The securities shown were selected because they were deemed to be representative of the investment process. The specific securities identified are not representative of all of the securities purchased, sold, or recommended for clients. It should not be assumed that an investment in the securities identified has or will be profitable. Actual holdings will vary for each cli-ent and there is no guarantee that a particular client’s account will hold any or all of the securities listed.
Leverage global research to find most attractive ways to gain exposure to investment insights
Focus on drivers of future returns on capital, rather than sector and region
Original idea/Insight
2000584510/361897_0/G2746/G2746
Value chain
Ford
US
Autos
Recovery in SAARs
Impala Platinum
South Africa
Platinum
Catalytic converter input
Denso
Japan
Components
Share gains
Kansas City Southern
US
Railroad
Distribution from Mexico
Daimler
Germany
Autos
Luxury, trucks recovery
WPP
UK
Advertising
~30% ad industry revenue
Localiza
Brazil
Rental/Used cars
Secondary market improvement
p B3age 1

Copyright © 2014 All Rights Reserved2000583384/361897_0/G2746/G2746
A North Carolina SupplementalRetirement Plans A14 August 2014
Global OpportunitiesTitle Line 2Risk oversight
Portfolio managementConduct in-depth fundamental research
Global Value Chain analysis
Detailed models: base case and downside case for each company
ESG review
Product managementConduct independent portfolio analysis
Style consistency/Factor risks/Stress testing
Capacity/Business risks
Investments and risk managementResearch and insight on risk and market trends
Lead independent Equity Risk Advisory Council
Develop new analytics/tools
Line management and senior management review groupsPhilosophy/Process/Performance/Characteristics
Resource assessment
ComplianceActive pre- and post-trade compliance monitoring
Riskmanagement
A1 B4
Copyright © 2014 All Rights Reserved2000347743/355123_3/G1068/G1068A
A
Quality ValueTitle Line 2Investment risks
A North Carolina SupplementalRetirement Plans A14 August 2014
Principal RisksEquity Market Risks – Equity markets are subject to many factors, including economic conditions, government regulations, market sentiment, local and international political events, and environmental and technological issues.
Manager Risk – Investment performance depends on the portfolio management team and the team’s investment strategies. If the investment strategies do not perform as expected, if opportunities to implement those strategies do not arise, or if the team does not implement its investment strategies successfully, an investment portfolio may underperform or suffer significant losses.
Additional RisksCurrency Risk – Investments in currencies, currency futures contracts, forward currency exchange contracts or similar instruments, as well as in securities that are denominated in foreign currency, are subject to the risk that the value of a particular currency will change in relation to one or more other currencies.
Foreign Market Risks (includes Emerging Markets) – Investments in foreign markets may present risks not typically associated with domestic markets. These risks may include changes in currency exchange rates; less-liquid markets and less available information; less government supervision of exchanges, brokers, and issuers; increased social, economic, and political uncertainty; and greater price volatility. These risks may be greater in emerging markets, which may also entail different risks from developed markets.
Issuer Specific Risk – A security issued by a particular issuer may be impacted by factors that are unique to that issuer and thus may cause that security’s return to differ from that of the market.
Risks of Derivative Instruments – Derivatives can be volatile and involve various degrees of risk. The value of derivative instruments may be affected by changes in overall market movements, the business or financial condition of specific companies, index volatility, changes in interest rates, or factors affecting a particular industry or region. Other relevant risks include the possible default of the counter-party to the transaction and the potential liquidity risk with respect to particular derivative instruments. Moreover, because many derivative instruments provide significantly more market exposure than the money paid or deposited when the transaction is entered into, a relatively small adverse market movement can not only result in the loss of the entire investment, but may also expose a portfolio to the possibility of a loss exceeding the original amount invested.
Risks of Investment in Other Pools – Investors in a fund that has invested in another fund will be subject to the same risks, in direct proportion to the amount of assets the first fund has invested in the second, as direct investors in that second fund.
Past results are not necessarily indicative of future resultsThere can be no assurance nor should it be assumed that future investment performance of any strategy will conform to any performance examples set forth in this material or that the portfolio’s underlying investments will be able to avoid losses. The investment results and any portfolio compositions set forth in this material are provided for illustrative purposes only and may not be indicative of the future investment results or future portfolio composition. The composition, size of, and risks associated with an investment in the strategy may differ substantially from the examples set forth in this material. An investment can lose value.
page 1

Copyright © 2014 All Rights Reserved2000347204/360779_0/G1085/G1085A
A
Opportunistic GrowthTitle Line 2Investment risks
A North Carolina SupplementalRetirement Plans A14 August 2014
Principal RisksEquity Market Risks – Equity markets are subject to many factors, including economic conditions, government regulations, market sentiment, local and international political events, and environmental and technological issues.
Manager Risk – Investment performance depends on the portfolio management team and the team’s investment strategies. If the investment strategies do not perform as expected, if opportunities to implement those strategies do not arise, or if the team does not implement its investment strategies successfully, an investment portfolio may underperform or suffer significant losses.
Additional RisksForeign Market Risks (includes Emerging Markets) – Investments in foreign markets may present risks not typically associated with domestic markets. These risks may include changes in currency exchange rates; less-liquid markets and less available information; less government supervision of exchanges, brokers, and issuers; increased social, economic, and political uncertainty; and greater price volatility. These risks may be greater in emerging markets, which may also entail different risks from developed markets.
Issuer Specific Risk – A security issued by a particular issuer may be impacted by factors that are unique to that issuer and thus may cause that security’s return to differ from that of the market.
Risks of Derivative Instruments – Derivatives can be volatile and involve various degrees of risk. The value of derivative instruments may be affected by changes in overall market movements, the business or financial condition of specific companies, index volatility, changes in interest rates, or factors affecting a particular industry or region. Other relevant risks include the possible default of the counterparty to the transaction and the potential liquidity risk with respect to particular derivative instruments. Moreover, because many derivative instruments provide significantly more market exposure than the money paid or deposited when the transaction is entered into, a relatively small adverse market movement can not only result in the loss of the entire investment, but may also expose a portfolio to the possibility of a loss exceeding the original amount invested.
Risks of Investment in Other Pools – Investors in a fund that has invested in another fund will be subject to the same risks, in direct proportion to the amount of assets the first fund has invested in the second, as direct investors in that second fund.
Smaller Capitalization Stock Risk – The share prices of small and mid-cap companies may exhibit greater volatility than the share prices of larger capitalization companies. In addition, shares of small and mid-cap companies are often less liquid than larger capitalization companies.
Past results are not necessarily indicative of future resultsThere can be no assurance nor should it be assumed that future investment performance of any strategy will conform to any performance examples set forth in this material or that the portfolio’s underlying investments will be able to avoid losses. The investment results and any portfolio compositions set forth in this material are provided for illustrative purposes only and may not be indicative of the future investment results or future portfolio composition. The composition, size of, and risks associated with an investment in the strategy may differ substantially from the examples set forth in this material. An investment can lose value.
page 1
Copyright © 2014 All Rights Reserved2000583418/360177_0/G2746/G2746
A
A
Global OpportunitiesTitle Line 2Investment risks
A North Carolina SupplementalRetirement Plans A14 August 2014
Principal RisksCurrency Risk – Investments in currencies, currency futures contracts, forward currency exchange contracts or similar instruments, as well as in securities that are denominated in foreign currency, are subject to the risk that the value of a particular currency will change in relation to one or more other currencies.
Equity Market Risks – Equity markets are subject to many factors, including economic conditions, government regulations, market sentiment, local and international political events, and environmental and technological issues.
Foreign Market Risks (includes Emerging Markets) – Investments in foreign markets may present risks not typically associated with domestic markets. These risks may include changes in currency exchange rates; less-liquid markets and less available information; less government supervision of exchanges, brokers, and issuers; increased social, economic, and political uncertainty; and greater price volatility. These risks may be greater in emerging markets, which may also entail different risks from developed markets.
Issuer Specific Risk – A security issued by a particular issuer may be impacted by factors that are unique to that issuer and thus may cause that security’s return to differ from that of the market.
Manager Risk – Investment performance depends on the portfolio management team and the team’s investment strategies. If the investment strategies do not perform as expected, if opportunities to implement those strategies do not arise, or if the team does not implement its investment strategies successfully, an investment portfolio may underperform or suffer significant losses.
Additional RisksLiquidity Risk – Investments with low liquidity can have significant changes in market value, and there is no guarantee that these securities could be sold at fair value.
Real Estate Securities Risk – Risks associated with investing in the securities of companies principally engaged in the real estate industry such as Real Estate Investment Trust (“REIT”) securities include: the cyclical nature of real estate values; risk related to general and local economic conditions; overbuilding and increased competition; demographic trends; and increases in interest rates and other real estate capital market influences.
Risks of Derivative Instruments – Derivatives can be volatile and involve various degrees of risk. The value of derivative instruments may be affected by changes in overall market movements, the business or financial condition of specific companies, index volatility, changes in interest rates, or factors affecting a particular industry or region. Other relevant risks include the possible default of the counterparty to the transaction and the potential liquidity risk with respect to particular derivative instruments. Moreover, because many derivative instruments provide significantly more market exposure than the money paid or deposited when the transaction is entered into, a relatively small adverse market movement can not only result in the loss of the entire investment, but may also expose a portfolio to the possibility of a loss exceeding the original amount invested.
Risks of Investment in Other Pools – Investors in a fund that has invested in another fund will be subject to the same risks, in direct proportion to the amount of assets the first fund has invested in the second, as direct investors in that second fund.
Smaller Capitalization Stock Risk – The share prices of small and mid-cap companies may exhibit greater volatility than the share prices of larger capitalization companies. In addition, shares of small and mid-cap companies are often less liquid than larger capitalization companies.
Past results are not necessarily indicative of future resultsThere can be no assurance nor should it be assumed that future investment performance of any strategy will conform to any performance examples set forth in this material or that the portfolio’s underlying investments will be able to avoid losses. The investment results and any portfolio compositions set forth in this material are provided for illustrative purposes only and may not be indicative of the future investment results or future portfolio composition. The composition, size of, and risks associated with an investment in the strategy may differ substantially from the examples set forth in this material. An investment can lose value.
page 1

Copyright © 2014 All Rights Reserved2000000298/373027_0/G1422/G1422
A North Carolina SupplementalRetirement Plans A14 August 2014
Important NoticeTitle Line 2
©2014 Wellington Management. All rights reserved. | As of May 2014
Wellington Management Company llp (WMC) is an independently owned investment adviser registered with the US Securities and Exchange Commission (SEC). WMC is also a commodity trading advisor (CTA) registered with the US Commodity Futures Trading Commission. In certain circumstances, WMC provides commodity trading advice to clients in reliance on exemptions from CTA registration. WMC, along with its subsidiaries and affiliates (collectively, Wellington Management), provides investment management and investment advisory services to institutions around the world. Located in Boston, Massachusetts, Wellington Management also has offices in Chicago, Illinois; Radnor, Pennsylvania; San Francisco, California; Beijing; Frankfurt; Hong Kong; London; Singapore; Sydney; Tokyo; and Zurich. This material is prepared for, and authorized for internal use by, designated institutional and professional investors and their consultants or for such other use as may be authorized by Wellington Management. This material and/or its contents are current at the time of writing and may not be reproduced or distributed in whole or in part, for any purpose, without the express written consent of Wellington Management. This material is not intended to constitute investment advice or an offer to sell, or the solicitation of an offer to purchase shares or other securities. Investors should always obtain and read an up‑to‑date investment services description or prospectus before deciding whether to appoint an investment manager or to invest in a fund. Any views expressed herein are those of the author(s), are based on available information, and are subject to change without notice. Individual portfolio management teams may hold different views and may make different investment decisions for different clients.
In the UK, this material is provided by Wellington Management International Limited (WMIL), a firm authorized and regulated by the Financial Conduct Authority (FCA). This material is directed only at persons (Relevant Persons) who are classified as eligible counterparties or professional clients under the rules of the FCA. This material must not be acted on or relied on by persons who are not Relevant Persons. Any investment or investment service to which this material relates is available only to Relevant Persons and will be engaged in only with Relevant Persons. In Germany, this material is provided by Wellington Management International Limited, Niederlassung Deutschland, the German branch of WMIL, which is authorized and regulated by the FCA and in respect of certain of its activities by the Bundesanstalt für Finanzdienstleistungsaufsicht (BaFin). This material is directed only at persons (Relevant Persons) who are classified as eligible counterparties or professional clients under the German Securities Trading Act. This material does not constitute investment advice, a solicitation to invest in financial instruments or financial analysis within the meaning of Section 34b of the German Securities Trading Act. It does not meet all legal requirements designed to guarantee the independence of financial analyses and is not subject to any prohibition on dealing ahead of the publication of financial analyses. This material does not constitute a prospectus for the purposes of the German Investment Fund Act, the German Securities Sales Prospectus Act or the German Securities Prospectus Act. In Hong Kong, this material is provided to you by Wellington Global Investment Management Limited (WGIM), a corporation licensed by the Securities and Futures Commission to conduct Type 1 (dealing in securities), Type 2 (dealing in futures contracts), Type 4 (advising on securities), and Type 9 (asset management) regulated activities, on the basis that you are a Professional Investor as defined in the Securities and Futures Ordinance. By accepting this material you acknowledge and agree that this material is provided for your use only and that you will not distribute or otherwise make this material available to any person. In Singapore, this material is provided for your use only by Wellington International Management Company Pte Ltd (WIM) (Registration Number 199504987R), regulated by the Monetary Authority of Singapore with a Capital Markets Services Licence to conduct fund management activities. By accepting this material you represent that you are a non‑retail investor and that you will not copy, distribute or otherwise make this material available to any person. In Australia, Wellington International Management Company Pte Ltd (WIM) has authorized the issue of this material for use solely by wholesale clients (as defined in the Corporations Act 2001). By accepting this material, you acknowledge and agree that this material is provided for your use only and that you will not distribute or otherwise make this material available to any person. Wellington Management Company llp is exempt from the requirement to hold an Australian financial services licence (AFSL) under the Corporations Act 2001 in respect of financial services, in reliance on class order 03/1100, a copy of which may be obtained at the web site of the Australian Securities and Investments Commission, http://www.asic.gov.au. The class order exempts a registered investment adviser regulated by the SEC, among others, from the need to hold an AFSL for financial services provided to Australian wholesale clients on certain conditions. Financial services provided by Wellington Management Company llp are regulated by the SEC under the laws and regulatory requirements of the United States, which are different from the laws applying in Australia. In Japan, Wellington International Management Company Pte Ltd (WIM) has been registered as a Financial Instruments Firm with registered number: Director General of Kanto Local Finance Bureau (Kin‑Sho) Number 428. WIM is a member of the Japan Investment Advisers Association (JIAA) and the Investment Trusts Association, Japan (ITA). WMIL, WGIM, and WIM are also registered as investment advisers with the SEC; however, they will comply with the substantive provisions of the US Investment Advisers Act only with respect to their US clients.
A1