north carolina statewide model roberto miquel, aicp … model user groups...this includes converting...
TRANSCRIPT

November 6, 2017
North Carolina Statewide ModelRecent and Upcoming Enhancements
Roberto Miquel, AICP
Vince Bernardin, Ph.D.

Agenda
Introductions
Status of Study
Short Term Enhancements
Long Term Enhancements
Q & A / Discussion
2

Introductions

Who We Are
CDM Smith Roberto Miquel, AICP
RSG Vince Bernardin, Ph.D.

Status of the Study
Tasks Completed
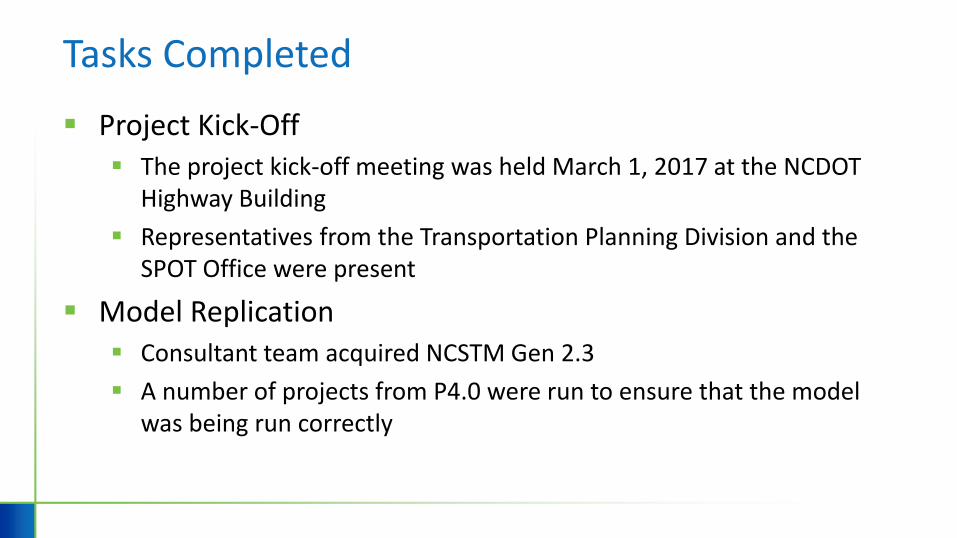
Project Kick-Off The project kick-off meeting was held March 1, 2017 at the NCDOT
Highway Building
Representatives from the Transportation Planning Division and the SPOT Office were present
Model Replication Consultant team acquired NCSTM Gen 2.3
A number of projects from P4.0 were run to ensure that the model was being run correctly
Tasks Completed (cont.)
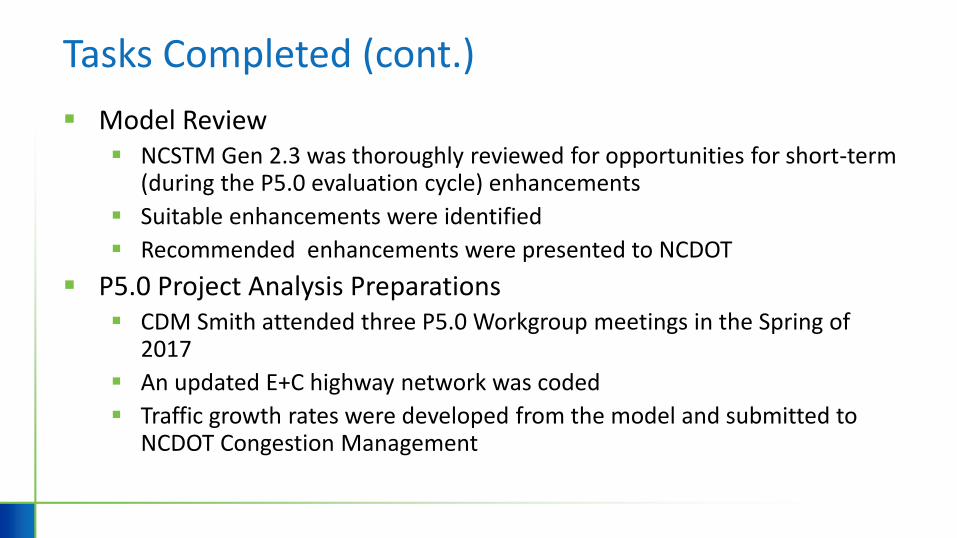
Model Review NCSTM Gen 2.3 was thoroughly reviewed for opportunities for short-term
(during the P5.0 evaluation cycle) enhancements
Suitable enhancements were identified
Recommended enhancements were presented to NCDOT
P5.0 Project Analysis Preparations CDM Smith attended three P5.0 Workgroup meetings in the Spring of
2017
An updated E+C highway network was coded
Traffic growth rates were developed from the model and submitted to NCDOT Congestion Management
Tasks Completed (cont.)
Short Term Enhancements The enhancements identified during model review were approved by
NCDOT and implemented into the model
This includes converting the model to TransCAD 7 Build 12375
Additional enhancements detailed later in this presentation

Tasks in Progress
P5.0 Project Evaluations P5.0 Carryover Projects have been run and are undergoing internal
QA/QC
P5.0 submittals have been completed and are being assessed by the SPOT Office
9

Upcoming Tasks
P5.0 Project Evaluations Run and analyze submitted P5.0 projects
Long Term Road Map Assess model enhancement needs suitable for longer-term
implementation
Develop a multi-year model improvement roadmap that will take the NCSTM through P6.0 and beyond
10

Short Term Enhancements

Streamline Macro Calls to Reduce Runtime
Converting Skims from Matrix to CSV Was running in every iteration for long distance Will now run only in the first iteration
Similarly converting the long distance trips from CSV to Matrix was also being repeated Will now happen only in first iteration
There were cases where only partial long distance files were being read from the CSV when converting to matrix form This has now been corrected
The long distance trucks macro now updates the messages on screen and waits for only the necessary amount of time to read outputs from external JAVA model

Robust JAVA – TransCAD Handshake
Critical components of the NCSTM written in JAVA instead of GISDK
JAVA would write out files and GISDK would begin scanning for this file periodically before advancing to the next model step
On occasion, the JAVA output files would be written but incomplete when GISDK scanned for the files and found them
Robust JAVA – TransCAD Handshake (cont.)
A more robust handshake protocol was introduced
JAVA now writes out a “working file” while it is running and deletes it when complete; TransCAD waits to proceed while this file still exists
This allows GISDK to continue only when certain that the JAVA components of the model have successfully completed
Additional checks have been introduced to make sure JAVA outputs are converted in entirety from CSV to matrix form
Traffic Assignment Algorithms
Several changes were made to the traffic assignment procedure
Parallel processing of four time periods (two at a time) to save run time
Using tri-conjugate Frank-Wolfe algorithm
Using relative gap = 10-6 and 500 iterations to ensure the assignments converges
Using VOT based vehicles classes
The long distance trucks and autos are always preloaded while the short distance trucks are assignment with remaining trips
The GISDK scripts were edited to properly model toll roads and were tested on Triangle Expressway for validation
Traffic Assignment Algorithms
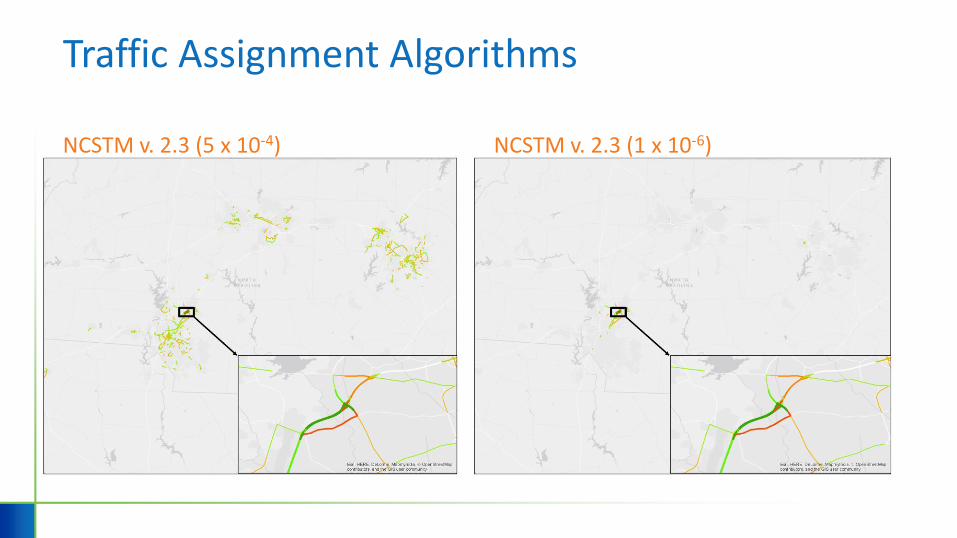
NCSTM v. 2.3 (5 x 10⁻⁴) NCSTM v. 2.3 (1 x 10⁻⁶)

Destination Choice Enhancements
Focus on runtime improvements (15min down to 3min)
Validation of trip length frequency distribution
HBW HBO HBS NHB NHBAW
Gen2 11.52 7.93 7.26 6.58 7.84
Gen2.3 14.49 7.19 7.12 8.30 5.51
Gen3 11.59 7.71 7.02 6.32 7.5
0
2
4
6
8
10
12
14
16
Average TLFD (miles)
Toll Choice Modeling
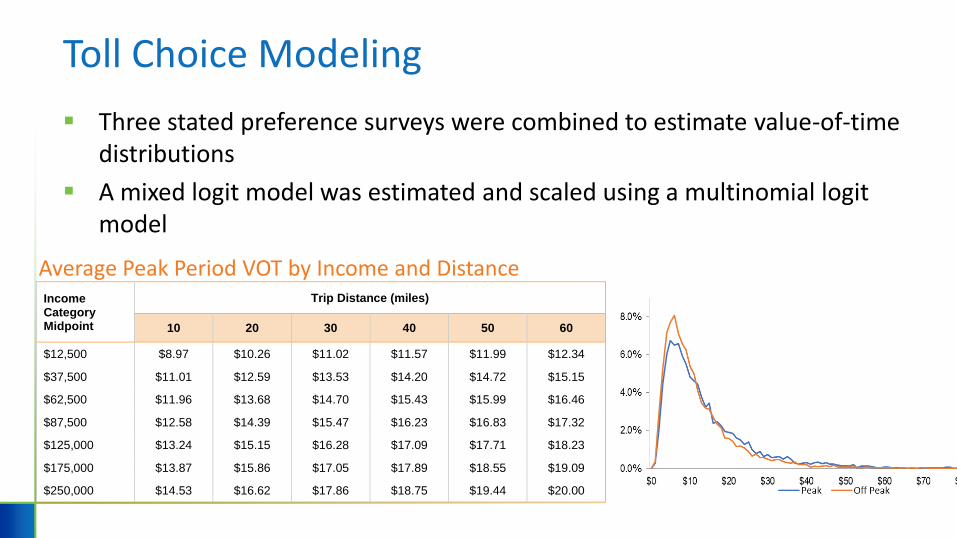
Three stated preference surveys were combined to estimate value-of-time distributions
A mixed logit model was estimated and scaled using a multinomial logit model
Income Category Midpoint
Trip Distance (miles)
10 20 30 40 50 60
$12,500 $8.97 $10.26 $11.02 $11.57 $11.99 $12.34
$37,500 $11.01 $12.59 $13.53 $14.20 $14.72 $15.15
$62,500 $11.96 $13.68 $14.70 $15.43 $15.99 $16.46
$87,500 $12.58 $14.39 $15.47 $16.23 $16.83 $17.32
$125,000 $13.24 $15.15 $16.28 $17.09 $17.71 $18.23
$175,000 $13.87 $15.86 $17.05 $17.89 $18.55 $19.09
$250,000 $14.53 $16.62 $17.86 $18.75 $19.44 $20.00
Average Peak Period VOT by Income and Distance

Toll Choice Modeling
This VOT distributions estimated from the surveys were applied to the NCSTM and used to divide auto trips in to five market segments with the following average VOTs:
PeakVOT OffPeakVOT Avg. Auto VOT
3.28 3.22 3.24
7.15 7.08 7.11
12.29 12.21 12.24
19.53 19.41 19.46
38.58 36.37 37.28

Toll Choice Modeling (cont.)
Similarly, five market segments were developed for muti-unit trucks and three for single unit trucks.
Single Unit Truck VOT Multi Unit Truck VOT
20.52 12.57
38.79 31.12
56.75 49.54
- 67.95
- 88.34
Toll Choice Modeling
The toll model was calibrated for volumes on the Triangle Expressway by adding a calibration constant to scale up the travel time savings of toll roads to account for travel time reliability, and other factors ignored in this version of the model
The final adjustment was a 50% increase in the benefit of toll roads, which is reasonable and broadly consistent with the contribution of reliability in other toll models
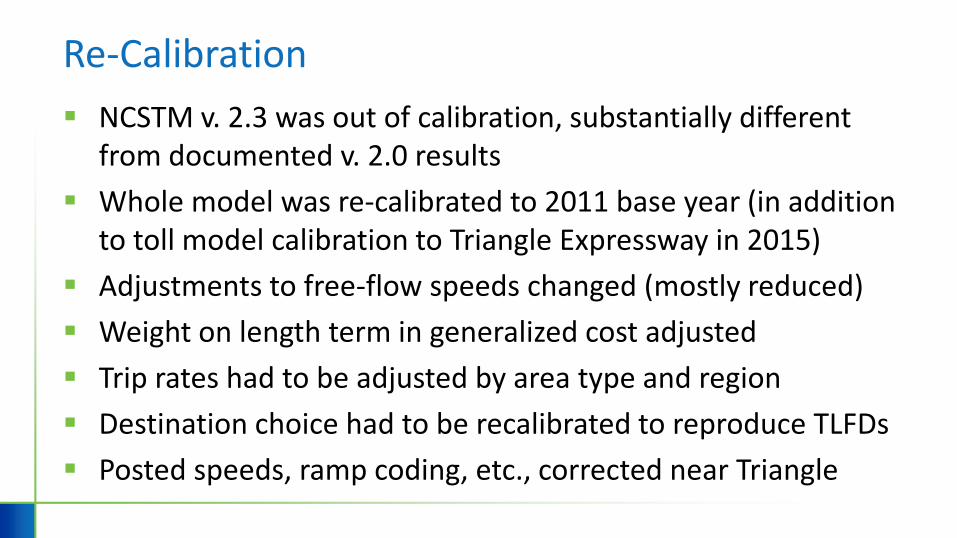
Re-Calibration
NCSTM v. 2.3 was out of calibration, substantially different from documented v. 2.0 results
Whole model was re-calibrated to 2011 base year (in addition to toll model calibration to Triangle Expressway in 2015)
Adjustments to free-flow speeds changed (mostly reduced)
Weight on length term in generalized cost adjusted
Trip rates had to be adjusted by area type and region
Destination choice had to be recalibrated to reproduce TLFDs
Posted speeds, ramp coding, etc., corrected near Triangle
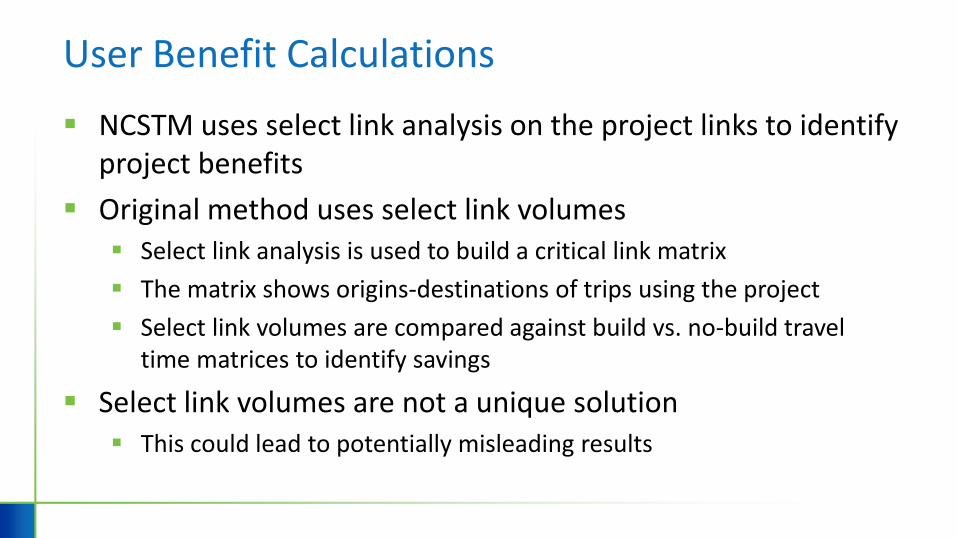
User Benefit Calculations
NCSTM uses select link analysis on the project links to identify project benefits
Original method uses select link volumes Select link analysis is used to build a critical link matrix
The matrix shows origins-destinations of trips using the project
Select link volumes are compared against build vs. no-build travel time matrices to identify savings
Select link volumes are not a unique solution This could lead to potentially misleading results

User Benefits Calculations (cont.)
New method still uses select links, but in a different way Select link analysis is used to identify project origins-destinations
Actual select link volumes are disregarded
All trips are analyzed if they possess an origin and destination identical to those revealed by the select link analysis
Captures the direct and some indirect benefits of the project
Still restricts the set of beneficiaries to those who could reasonably benefit, less strictly than before, but still excluding some legitimate beneficiaries
Still avoids spurious benefits due to model noise
24
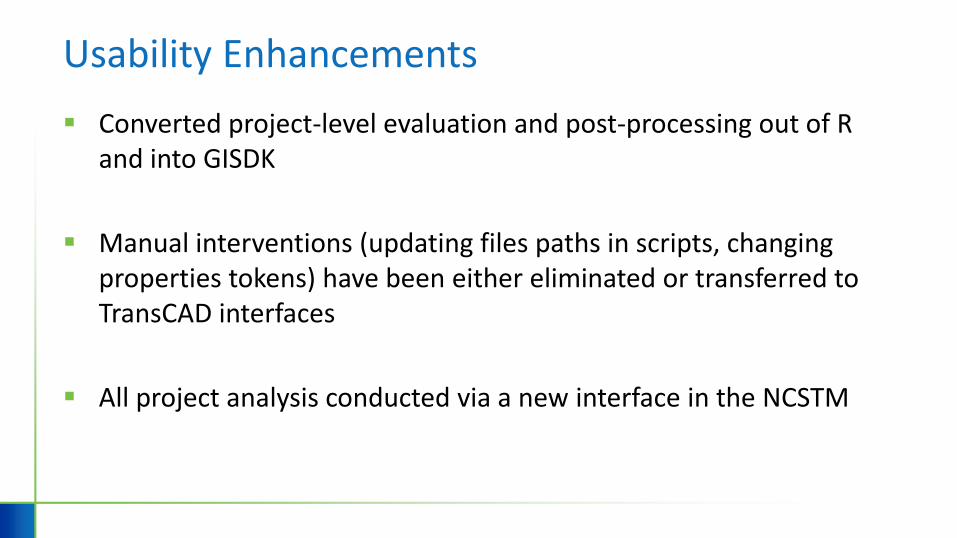
Usability Enhancements
Converted project-level evaluation and post-processing out of R and into GISDK
Manual interventions (updating files paths in scripts, changing properties tokens) have been either eliminated or transferred to TransCAD interfaces
All project analysis conducted via a new interface in the NCSTM

Long Term Enhancements
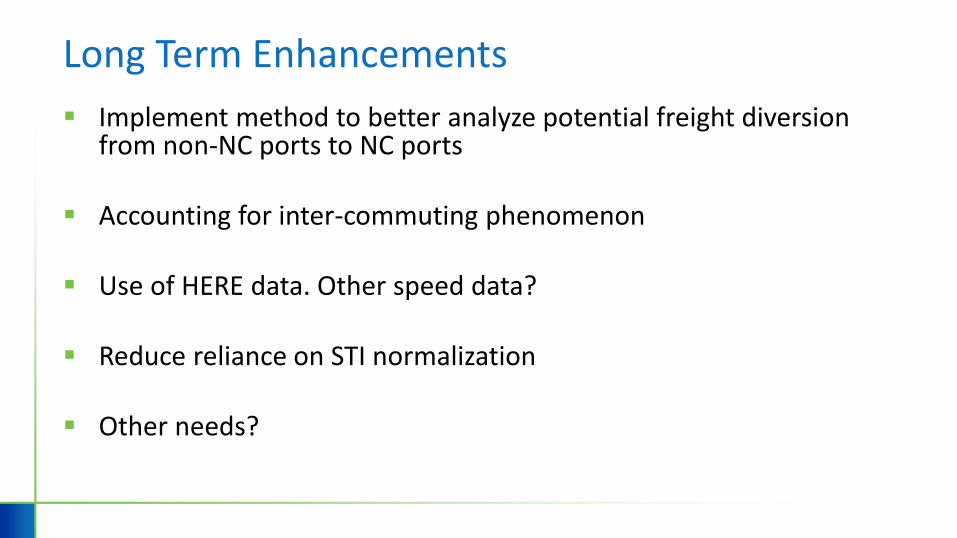
Long Term Enhancements
Implement method to better analyze potential freight diversion from non-NC ports to NC ports
Accounting for inter-commuting phenomenon
Use of HERE data. Other speed data?
Reduce reliance on STI normalization
Other needs?

Questions/Discussion

Contact Information:
29
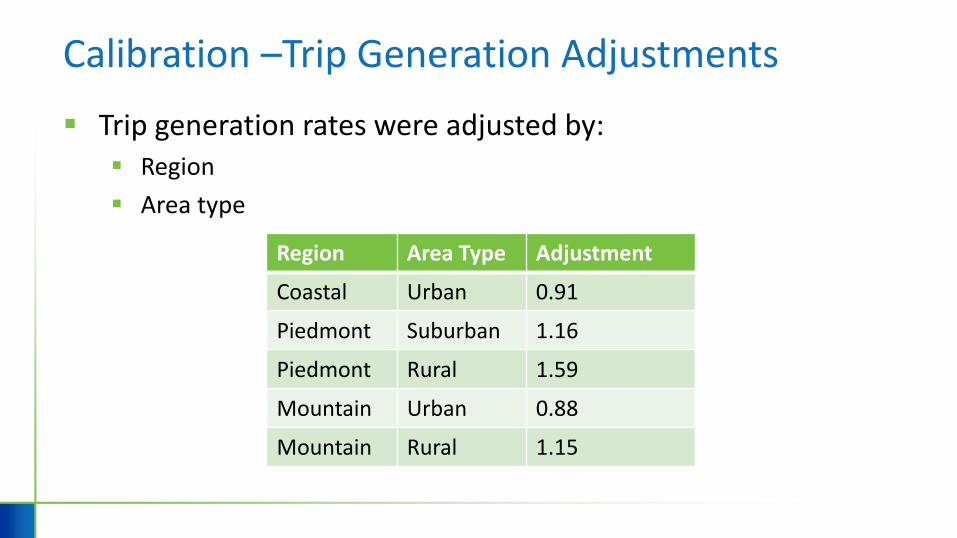
Calibration –Trip Generation Adjustments
Trip generation rates were adjusted by: Region
Area type
Region Area Type Adjustment
Coastal Urban 0.91
Piedmont Suburban 1.16
Piedmont Rural 1.59
Mountain Urban 0.88
Mountain Rural 1.15
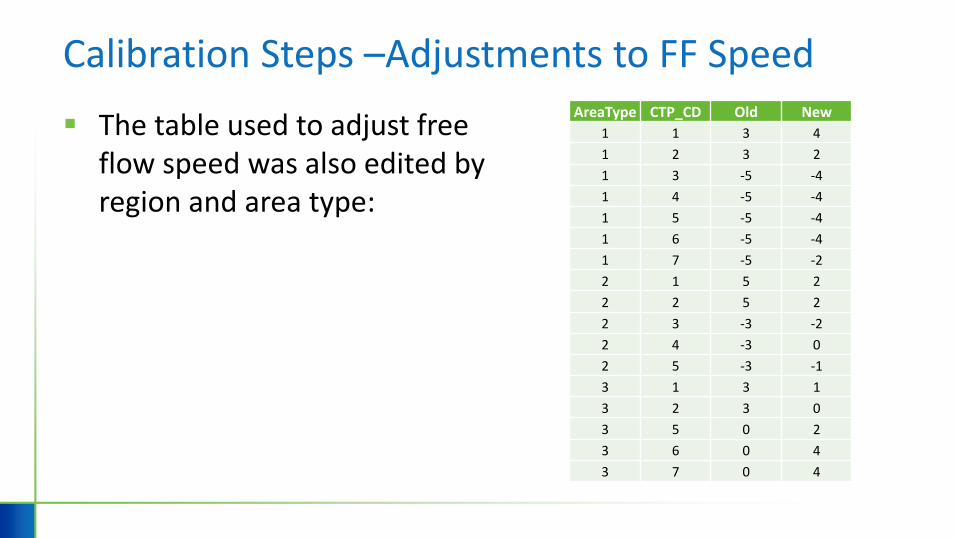
Calibration Steps –Adjustments to FF Speed
The table used to adjust free flow speed was also edited by region and area type:
AreaType CTP_CD Old New
1 1 3 4
1 2 3 2
1 3 -5 -4
1 4 -5 -4
1 5 -5 -4
1 6 -5 -4
1 7 -5 -2
2 1 5 2
2 2 5 2
2 3 -3 -2
2 4 -3 0
2 5 -3 -1
3 1 3 1
3 2 3 0
3 5 0 2
3 6 0 4
3 7 0 4

Calibration Steps – Other Adjustments
During calibration, in addition to changes listed above, some additional things were adjusted and are listed below. Several missing ramps were coded in the master network for Triangle
Expressway;
The posted speeds on Triangle Expressway and parallel roadways were adjusted to match the correct information from Google street view;
The centroid connector near Triangle Expressway were adjusted in length to calibrate the volumes on the toll roadway;
During network setup, the length penalty for calculating Fixed Toll (impedance) was reduced by 20%.