north carolina state university 2015 campus climate · pdf filenorth carolina state university...
TRANSCRIPT

North Carolina State University
2015 Campus Climate Survey (Undergraduate Students)
Poole College of Management
Section D: The Role of Diversity in Higher Education
Tables of Results by Student Demographic Profile
* Statistically significant difference (p<.05) between group
Prepared by Office of Institutional Research and Planning
Page 1
D1: Importance that NCSU
holds diversity as
essential value
Mean Rating
4: Very important
3: Somewhat important
2: Not very
important
1: Not at all
important Total (N)
Total (N) 3.4 55.3% 34.1% 6.1% 4.5% 132
D1: Importance that NCSU holds diversity as
essential value Mean Rating
4: Very important
3: Somewhat important
2: Not very
important
1: Not at all
important Total (N)
Gender
3.3 47.3% 40.0% 7.3% 5.5% 55 .....Male
.....Female 3.5 60.8% 31.1% 5.4% 2.7% 74
D1: Importance that NCSU holds diversity as
essential value Mean Rating
4: Very important
3: Somewhat important
2: Not very
important
1: Not at all
important Total (N)
Race/Ethnicity
3.3 50.9% 37.7% 5.7% 5.7% 106 .....White/Caucasian
.....Students of Color 3.7 73.1% 19.2% 7.7% . 26
D1: Importance that NCSU holds diversity as essential
value Mean Rating
4: Very important
3: Somewhat important
2: Not very
important
1: Not at all
important Total (N)
Socioeconomic Background
3.5 60.0% 30.0% 5.0% 5.0% 20 .....Poor/Working class
.....Middle class 3.4 58.9% 32.1% 3.6% 5.4% 56
.....Upper middle/Upper class 3.4 52.5% 37.5% 5.0% 5.0% 40

North Carolina State University
2015 Campus Climate Survey (Undergraduate Students)
Poole College of Management
Section D: The Role of Diversity in Higher Education
Tables of Results by Student Demographic Profile
* Statistically significant difference (p<.05) between group
Prepared by Office of Institutional Research and Planning
Page 2
D2a: NCSU
has made
diversity a
priority Mean Rating
5: Strongly
agree 4:
Agree
3: Neither agree nor
disagree 2:
Disagree
1: Strongly disagree Total (N)
Total (N) 4.2 36.5% 52.4% 7.1% 3.2% 0.8% 126
D2a: NCSU has made diversity a priority
Mean Rating
5: Strongly
agree 4:
Agree
3: Neither agree nor
disagree 2:
Disagree
1: Strongly disagree Total (N)
Gender*
4.3 32.7% 63.5% 3.8% . . 52 .....Male
.....Female 4.2 40.8% 45.1% 9.9% 2.8% 1.4% 71
D2a: NCSU has made diversity a
priority Mean Rating
5: Strongly
agree 4:
Agree
3: Neither agree nor
disagree 2:
Disagree
1: Strongly disagree Total (N)
Race/Ethnicity*
4.3 36.0% 57.0% 5.0% 2.0% . 100 .....White/Caucasian
.....Students of Color 4.0 38.5% 34.6% 15.4% 7.7% 3.8% 26
D2a: NCSU has made diversity a priority
Mean Rating
5: Strongly
agree 4:
Agree
3: Neither agree nor
disagree 2:
Disagree
1: Strongly disagree Total (N)
Socioeconomic Background
4.0 25.0% 55.0% 15.0% . 5.0% 20 .....Poor/Working class
.....Middle class 4.2 36.4% 50.9% 9.1% 3.6% . 55
.....Upper middle/Upper class 4.3 45.0% 47.5% 2.5% 5.0% . 40

North Carolina State University
2015 Campus Climate Survey (Undergraduate Students)
Poole College of Management
Section D: The Role of Diversity in Higher Education
Tables of Results by Student Demographic Profile
* Statistically significant difference (p<.05) between group
Prepared by Office of Institutional Research and Planning
Page 3
D2b: NCSU does good job of
implementng policies/practices,
reinforce commitment to
diversity Mean Rating
5: Strongly
agree 4:
Agree
3: Neither agree nor
disagree 2:
Disagree
1: Strongly disagree Total (N)
Total (N) 4.1 28.6% 54.8% 12.7% 2.4% 1.6% 126
D2b: NCSU does good job of implementng
policies/practices, reinforce commitment to
diversity Mean Rating
5: Strongly
agree 4:
Agree
3: Neither agree nor
disagree 2:
Disagree
1: Strongly disagree Total (N)
Gender*
4.1 26.9% 57.7% 13.5% 1.9% . 52 .....Male
.....Female 4.1 31.0% 54.9% 12.7% . 1.4% 71
D2b: NCSU does good job of
implementng policies/practices,
reinforce commitment to
diversity Mean Rating
5: Strongly
agree 4:
Agree
3: Neither agree nor
disagree 2:
Disagree
1: Strongly disagree Total (N)
Race/Ethnicity
4.1 28.0% 57.0% 11.0% 3.0% 1.0% 100 .....White/Caucasian
.....Students of Color 4.0 30.8% 46.2% 19.2% . 3.8% 26
D2b: NCSU does good job of implementng
policies/practices, reinforce commitment to diversity
Mean Rating
5: Strongly
agree 4:
Agree
3: Neither agree nor
disagree 2:
Disagree
1: Strongly disagree Total (N)
Socioeconomic Background*
3.6 10.0% 60.0% 20.0% . 10.0% 20 .....Poor/Working class
.....Middle class 4.1 27.3% 54.5% 14.5% 3.6% . 55
.....Upper middle/Upper class 4.3 42.5% 47.5% 7.5% 2.5% . 40

North Carolina State University
2015 Campus Climate Survey (Undergraduate Students)
Poole College of Management
Section D: The Role of Diversity in Higher Education
Tables of Results by Student Demographic Profile
* Statistically significant difference (p<.05) between group
Prepared by Office of Institutional Research and Planning
Page 4
D2c: Expectations
for respect/civility
clearly articulated at
NCSU Mean Rating
5: Strongly
agree 4:
Agree
3: Neither agree nor
disagree 2:
Disagree
1: Strongly disagree Total (N)
Total (N) 4.2 38.9% 47.6% 7.9% 2.4% 3.2% 126
D2c: Expectations for respect/civility clearly articulated at NCSU Mean
Rating
5: Strongly
agree 4:
Agree
3: Neither agree nor
disagree 2:
Disagree
1: Strongly disagree Total (N)
Gender*
4.3 36.5% 51.9% 11.5% . . 52 .....Male
.....Female 4.2 42.3% 45.1% 5.6% 2.8% 4.2% 71
D2c: Expectations for respect/civility
clearly articulated at NCSU
Mean Rating
5: Strongly
agree 4:
Agree
3: Neither agree nor
disagree 2:
Disagree
1: Strongly disagree Total (N)
Race/Ethnicity
4.2 40.0% 49.0% 8.0% 1.0% 2.0% 100 .....White/Caucasian
.....Students of Color 3.9 34.6% 42.3% 7.7% 7.7% 7.7% 26
D2c: Expectations for respect/civility clearly articulated at NCSU Mean
Rating
5: Strongly
agree 4:
Agree
3: Neither agree nor
disagree 2:
Disagree
1: Strongly disagree Total (N)
Socioeconomic Background
3.9 20.0% 65.0% . 10.0% 5.0% 20 .....Poor/Working class
.....Middle class 4.2 41.8% 43.6% 10.9% 1.8% 1.8% 55
.....Upper middle/Upper class 4.3 47.5% 40.0% 7.5% . 5.0% 40

North Carolina State University
2015 Campus Climate Survey (Undergraduate Students)
Poole College of Management
Section D: The Role of Diversity in Higher Education
Tables of Results by Student Demographic Profile
* Statistically significant difference (p<.05) between group
Prepared by Office of Institutional Research and Planning
Page 5
D2d: Consistent messages
about diversity
from campus leaders across
sources Mean Rating
5: Strongly
agree 4:
Agree
3: Neither agree nor
disagree 2:
Disagree Total (N)
Total (N) 4.1 34.4% 48.8% 11.2% 5.6% 125
D2d: Consistent messages about diversity from
campus leaders across sources
Mean Rating
5: Strongly
agree 4:
Agree
3: Neither agree nor
disagree 2:
Disagree Total (N)
Gender*
4.2 31.4% 54.9% 11.8% 2.0% 51 .....Male
.....Female 4.2 38.0% 46.5% 11.3% 4.2% 71
D2d: Consistent messages about
diversity from campus leaders across sources
Mean Rating
5: Strongly
agree 4:
Agree
3: Neither agree nor
disagree 2:
Disagree Total (N)
Race/Ethnicity
4.2 34.3% 50.5% 11.1% 4.0% 99 .....White/Caucasian
.....Students of Color 4.0 34.6% 42.3% 11.5% 11.5% 26
D2d: Consistent messages about diversity from campus
leaders across sources Mean Rating
5: Strongly
agree 4:
Agree
3: Neither agree nor
disagree 2:
Disagree Total (N)
Socioeconomic Background
3.8 20.0% 50.0% 20.0% 10.0% 20 .....Poor/Working class
.....Middle class 4.1 33.3% 50.0% 9.3% 7.4% 54
.....Upper middle/Upper class 4.3 45.0% 42.5% 10.0% 2.5% 40

North Carolina State University
2015 Campus Climate Survey (Undergraduate Students)
Poole College of Management
Section D: The Role of Diversity in Higher Education
Tables of Results by Student Demographic Profile
* Statistically significant difference (p<.05) between group
Prepared by Office of Institutional Research and Planning
Page 6
D2e: NCSU provides environment for free
expression of ideas/opinions/beliefs
Mean Rating
5: Strongly
agree 4:
Agree
3: Neither agree nor
disagree 2:
Disagree
1: Strongly disagree Total (N)
Total (N) 4.2 37.9% 50.0% 6.5% 2.4% 3.2% 124
D2e: NCSU provides environment for free
expression of ideas/opinions/beliefs
Mean Rating
5: Strongly
agree 4:
Agree
3: Neither agree nor
disagree 2:
Disagree
1: Strongly disagree Total (N)
Gender*
4.3 37.3% 56.9% 5.9% . . 51 .....Male
.....Female 4.2 40.0% 47.1% 7.1% 2.9% 2.9% 70
D2e: NCSU provides environment for free
expression of ideas/opinions/beliefs
Mean Rating
5: Strongly
agree 4:
Agree
3: Neither agree nor
disagree 2:
Disagree
1: Strongly disagree Total (N)
Race/Ethnicity
4.2 37.8% 51.0% 6.1% 2.0% 3.1% 98 .....White/Caucasian
.....Students of Color 4.1 38.5% 46.2% 7.7% 3.8% 3.8% 26
D2e: NCSU provides environment for free
expression of ideas/opinions/beliefs
Mean Rating
5: Strongly
agree 4:
Agree
3: Neither agree nor
disagree 2:
Disagree
1: Strongly disagree Total (N)
Socioeconomic Background
3.9 20.0% 65.0% 5.0% 5.0% 5.0% 20 .....Poor/Working class
.....Middle class 4.3 38.9% 55.6% 1.9% 1.9% 1.9% 54
.....Upper middle/Upper class 4.2 46.2% 35.9% 10.3% 2.6% 5.1% 39

North Carolina State University
2015 Campus Climate Survey (Undergraduate Students)
Poole College of Management
Section D: The Role of Diversity in Higher Education
Tables of Results by Student Demographic Profile
* Statistically significant difference (p<.05) between group
Prepared by Office of Institutional Research and Planning
Page 7
D2f: NCSU leaders
distinguish between free and
hate speech,
respond to hate
speech adequately
Mean Rating
5: Strongly
agree 4:
Agree
3: Neither agree nor
disagree 2:
Disagree
1: Strongly disagree Total (N)
Total (N) 4.0 32.3% 44.4% 16.9% 4.0% 2.4% 124
D2f: NCSU leaders distinguish between free
and hate speech, respond to hate speech adequately
Mean Rating
5: Strongly
agree 4:
Agree
3: Neither agree nor
disagree 2:
Disagree
1: Strongly disagree Total (N)
Gender*
4.1 31.4% 51.0% 11.8% 5.9% . 51 .....Male
.....Female 4.0 34.3% 41.4% 20.0% 1.4% 2.9% 70
D2f: NCSU leaders distinguish between
free and hate speech, respond to
hate speech adequately
Mean Rating
5: Strongly
agree 4:
Agree
3: Neither agree nor
disagree 2:
Disagree
1: Strongly disagree Total (N)
Race/Ethnicity
4.0 31.6% 42.9% 18.4% 5.1% 2.0% 98 .....White/Caucasian
.....Students of Color 4.1 34.6% 50.0% 11.5% . 3.8% 26
D2f: NCSU leaders distinguish between free and hate speech, respond to hate
speech adequately Mean Rating
5: Strongly
agree 4:
Agree
3: Neither agree nor
disagree 2:
Disagree
1: Strongly disagree Total (N)
Socioeconomic Background
3.6 15.0% 50.0% 25.0% . 10.0% 20 .....Poor/Working class
.....Middle class 4.1 35.2% 40.7% 18.5% 5.6% . 54
.....Upper middle/Upper class 4.1 35.9% 46.2% 10.3% 5.1% 2.6% 39

North Carolina State University
2015 Campus Climate Survey (Undergraduate Students)
Poole College of Management
Section D: The Role of Diversity in Higher Education
Tables of Results by Student Demographic Profile
* Statistically significant difference (p<.05) between group
Prepared by Office of Institutional Research and Planning
Page 8
D2g: NCSU is good place to learn about
multicultural issues/perspectives
Mean Rating
5: Strongly
agree 4:
Agree
3: Neither agree nor
disagree 2:
Disagree
1: Strongly disagree Total (N)
Total (N) 4.0 25.8% 53.2% 14.5% 4.0% 2.4% 124
D2g: NCSU is good place to learn about multicultural
issues/perspectives Mean Rating
5: Strongly
agree 4:
Agree
3: Neither agree nor
disagree 2:
Disagree
1: Strongly disagree Total (N)
Gender*
4.1 25.5% 60.8% 9.8% 3.9% . 51 .....Male
.....Female 4.0 27.1% 50.0% 17.1% 2.9% 2.9% 70
D2g: NCSU is good place to learn about
multicultural issues/perspectives
Mean Rating
5: Strongly
agree 4:
Agree
3: Neither agree nor
disagree 2:
Disagree
1: Strongly disagree Total (N)
Race/Ethnicity*
4.0 24.5% 58.2% 15.3% 1.0% 1.0% 98 .....White/Caucasian
.....Students of Color 3.7 30.8% 34.6% 11.5% 15.4% 7.7% 26
D2g: NCSU is good place to learn about multicultural
issues/perspectives Mean Rating
5: Strongly
agree 4:
Agree
3: Neither agree nor
disagree 2:
Disagree
1: Strongly disagree Total (N)
Socioeconomic Background
3.7 20.0% 50.0% 15.0% 10.0% 5.0% 20 .....Poor/Working class
.....Middle class 4.0 27.8% 51.9% 14.8% 1.9% 3.7% 54
.....Upper middle/Upper class 4.0 28.2% 51.3% 15.4% 5.1% . 39

North Carolina State University
2015 Campus Climate Survey (Undergraduate Students)
Poole College of Management
Section D: The Role of Diversity in Higher Education
Tables of Results by Student Demographic Profile
* Statistically significant difference (p<.05) between group
Prepared by Office of Institutional Research and Planning
Page 9
D2h: NCSU places
too much emphasis
on diversity
Mean Rating
5: Strongly
agree 4:
Agree
3: Neither agree nor
disagree 2:
Disagree
1: Strongly disagree Total (N)
Total (N) 2.9 9.7% 21.8% 29.8% 23.4% 15.3% 124
D2h: NCSU places too much emphasis on
diversity Mean Rating
5: Strongly
agree 4:
Agree
3: Neither agree nor
disagree 2:
Disagree
1: Strongly disagree Total (N)
Gender
3.0 7.8% 29.4% 29.4% 21.6% 11.8% 51 .....Male
.....Female 2.8 10.0% 17.1% 31.4% 25.7% 15.7% 70
D2h: NCSU places too much emphasis
on diversity Mean Rating
5: Strongly
agree 4:
Agree
3: Neither agree nor
disagree 2:
Disagree
1: Strongly disagree Total (N)
Race/Ethnicity
3.0 11.2% 22.4% 31.6% 22.4% 12.2% 98 .....White/Caucasian
.....Students of Color 2.5 3.8% 19.2% 23.1% 26.9% 26.9% 26
D2h: NCSU places too much emphasis on diversity
Mean Rating
5: Strongly
agree 4:
Agree
3: Neither agree nor
disagree 2:
Disagree
1: Strongly disagree Total (N)
Socioeconomic Background
2.4 . 20.0% 20.0% 35.0% 25.0% 20 .....Poor/Working class
.....Middle class 2.9 14.8% 20.4% 22.2% 20.4% 22.2% 54
.....Upper middle/Upper class 3.0 7.7% 20.5% 43.6% 23.1% 5.1% 39

North Carolina State University
2015 Campus Climate Survey (Undergraduate Students)
Poole College of Management
Section D: The Role of Diversity in Higher Education
Tables of Results by Student Demographic Profile
* Statistically significant difference (p<.05) between group
Prepared by Office of Institutional Research and Planning
Page 10
D2i: NCSU is
committed to help
minority students succeed
Mean Rating
5: Strongly
agree 4:
Agree
3: Neither agree nor
disagree 2:
Disagree
1: Strongly disagree Total (N)
Total (N) 3.9 25.0% 42.7% 29.0% 2.4% 0.8% 124
D2i: NCSU is committed to help minority students
succeed Mean Rating
5: Strongly
agree 4:
Agree
3: Neither agree nor
disagree 2:
Disagree
1: Strongly disagree Total (N)
Gender*
4.1 25.5% 54.9% 19.6% . . 51 .....Male
.....Female 3.8 25.7% 35.7% 34.3% 2.9% 1.4% 70
D2i: NCSU is committed to help minority students
succeed Mean Rating
5: Strongly
agree 4:
Agree
3: Neither agree nor
disagree 2:
Disagree
1: Strongly disagree Total (N)
Race/Ethnicity
3.9 24.5% 41.8% 31.6% 2.0% . 98 .....White/Caucasian
.....Students of Color 3.9 26.9% 46.2% 19.2% 3.8% 3.8% 26
D2i: NCSU is committed to help minority students
succeed Mean Rating
5: Strongly
agree 4:
Agree
3: Neither agree nor
disagree 2:
Disagree
1: Strongly disagree Total (N)
Socioeconomic Background
3.7 20.0% 40.0% 30.0% 5.0% 5.0% 20 .....Poor/Working class
.....Middle class 3.9 22.2% 48.1% 29.6% . . 54
.....Upper middle/Upper class 3.9 33.3% 30.8% 30.8% 5.1% . 39

North Carolina State University
2015 Campus Climate Survey (Undergraduate Students)
Poole College of Management
Section D: The Role of Diversity in Higher Education
Tables of Results by Student Demographic Profile
* Statistically significant difference (p<.05) between group
Prepared by Office of Institutional Research and Planning
Page 11
D2j: Diversity is good
for NCSU
Mean Rating
5: Strongly
agree 4:
Agree
3: Neither agree nor
disagree 2:
Disagree
1: Strongly disagree Total (N)
Total (N) 4.3 46.0% 43.5% 8.1% 1.6% 0.8% 124
D2j: Diversity is good for NCSU
Mean Rating
5: Strongly
agree 4:
Agree
3: Neither agree nor
disagree 2:
Disagree
1: Strongly disagree Total (N)
Gender*
4.3 41.2% 51.0% 7.8% . . 51 .....Male
.....Female 4.3 48.6% 40.0% 8.6% 2.9% . 70
D2j: Diversity is good for NCSU
Mean Rating
5: Strongly
agree 4:
Agree
3: Neither agree nor
disagree 2:
Disagree
1: Strongly disagree Total (N)
Race/Ethnicity
4.3 41.8% 45.9% 9.2% 2.0% 1.0% 98 .....White/Caucasian
.....Students of Color 4.6 61.5% 34.6% 3.8% . . 26
D2j: Diversity is good for NCSU
Mean Rating
5: Strongly
agree 4:
Agree
3: Neither agree nor
disagree 2:
Disagree
1: Strongly disagree Total (N)
Socioeconomic Background
4.5 55.0% 40.0% . 5.0% . 20 .....Poor/Working class
.....Middle class 4.3 48.1% 38.9% 11.1% . 1.9% 54
.....Upper middle/Upper class 4.4 46.2% 46.2% 5.1% 2.6% . 39

North Carolina State University
2015 Campus Climate Survey (Undergraduate Students)
Poole College of Management
Section D: The Role of Diversity in Higher Education
Tables of Results by Student Demographic Profile
* Statistically significant difference (p<.05) between group
Prepared by Office of Institutional Research and Planning
Page 12
D2k: Efforts to increase diversity lead to
admission of less
qualified students
Mean Rating
5: Strongly
agree 4:
Agree
3: Neither agree nor
disagree 2:
Disagree
1: Strongly disagree Total (N)
Total (N) 3.1 11.3% 29.0% 25.0% 23.4% 11.3% 124
D2k: Efforts to increase diversity lead to admission of less qualified students Mean
Rating
5: Strongly
agree 4:
Agree
3: Neither agree nor
disagree 2:
Disagree
1: Strongly disagree Total (N)
Gender*
3.3 15.7% 27.5% 31.4% 17.6% 7.8% 51 .....Male
.....Female 2.9 7.1% 31.4% 21.4% 28.6% 11.4% 70
D2k: Efforts to increase diversity
lead to admission of less qualified
students Mean Rating
5: Strongly
agree 4:
Agree
3: Neither agree nor
disagree 2:
Disagree
1: Strongly disagree Total (N)
Race/Ethnicity*
3.2 13.3% 31.6% 27.6% 19.4% 8.2% 98 .....White/Caucasian
.....Students of Color 2.4 3.8% 19.2% 15.4% 38.5% 23.1% 26
D2k: Efforts to increase diversity lead to admission of less qualified students Mean
Rating
5: Strongly
agree 4:
Agree
3: Neither agree nor
disagree 2:
Disagree
1: Strongly disagree Total (N)
Socioeconomic Background
2.7 . 25.0% 35.0% 25.0% 15.0% 20 .....Poor/Working class
.....Middle class 2.9 9.3% 24.1% 25.9% 25.9% 14.8% 54
.....Upper middle/Upper class 3.3 17.9% 30.8% 20.5% 23.1% 7.7% 39

North Carolina State University
2015 Campus Climate Survey (Undergraduate Students)
Poole College of Management
Section D: The Role of Diversity in Higher Education
Tables of Results by Student Demographic Profile
* Statistically significant difference (p<.05) between group
Prepared by Office of Institutional Research and Planning
Page 13
D2l: Efforts to increase diversity
lead to less qualified
faculty/staff/admin Mean Rating
5: Strongly
agree 4:
Agree
3: Neither agree nor
disagree 2:
Disagree
1: Strongly disagree Total (N)
Total (N) 2.8 8.1% 21.8% 27.4% 28.2% 14.5% 124
D2l: Efforts to increase diversity lead to less
qualified faculty/staff/admin
Mean Rating
5: Strongly
agree 4:
Agree
3: Neither agree nor
disagree 2:
Disagree
1: Strongly disagree Total (N)
Gender
3.0 9.8% 21.6% 33.3% 25.5% 9.8% 51 .....Male
.....Female 2.7 5.7% 22.9% 24.3% 31.4% 15.7% 70
D2l: Efforts to increase diversity
lead to less qualified faculty/staff/admin
Mean Rating
5: Strongly
agree 4:
Agree
3: Neither agree nor
disagree 2:
Disagree
1: Strongly disagree Total (N)
Race/Ethnicity
3.0 10.2% 23.5% 29.6% 25.5% 11.2% 98 .....White/Caucasian
.....Students of Color 2.2 . 15.4% 19.2% 38.5% 26.9% 26
D2l: Efforts to increase diversity lead to less
qualified faculty/staff/admin Mean Rating
5: Strongly
agree 4:
Agree
3: Neither agree nor
disagree 2:
Disagree
1: Strongly disagree Total (N)
Socioeconomic Background
2.7 . 25.0% 30.0% 30.0% 15.0% 20 .....Poor/Working class
.....Middle class 2.6 7.4% 22.2% 20.4% 27.8% 22.2% 54
.....Upper middle/Upper class 2.9 12.8% 12.8% 35.9% 30.8% 7.7% 39

North Carolina State University
2015 Campus Climate Survey (Undergraduate Students)
Poole College of Management
Section D: The Role of Diversity in Higher Education
Tables of Results by Student Demographic Profile
* Statistically significant difference (p<.05) between group
Prepared by Office of Institutional Research and Planning
Page 14
D2m: Enhancing ability to partic in
multicultural society
should be part of univ
mission Mean Rating
5: Strongly
agree 4:
Agree
3: Neither agree nor
disagree 2:
Disagree
1: Strongly disagree Total (N)
Total (N) 3.9 23.4% 55.6% 13.7% 6.5% 0.8% 124
D2m: Enhancing ability to partic in multicultural
society should be part of univ mission
Mean Rating
5: Strongly
agree 4:
Agree
3: Neither agree nor
disagree 2:
Disagree
1: Strongly disagree Total (N)
Gender
4.0 19.6% 66.7% 7.8% 5.9% . 51 .....Male
.....Female 3.9 25.7% 48.6% 18.6% 5.7% 1.4% 70
D2m: Enhancing ability to partic in
multicultural society should be part of
univ mission Mean Rating
5: Strongly
agree 4:
Agree
3: Neither agree nor
disagree 2:
Disagree
1: Strongly disagree Total (N)
Race/Ethnicity
3.8 20.4% 54.1% 16.3% 8.2% 1.0% 98 .....White/Caucasian
.....Students of Color 4.3 34.6% 61.5% 3.8% . . 26
D2m: Enhancing ability to partic in multicultural society
should be part of univ mission
Mean Rating
5: Strongly
agree 4:
Agree
3: Neither agree nor
disagree 2:
Disagree
1: Strongly disagree Total (N)
Socioeconomic Background
4.1 35.0% 45.0% 15.0% 5.0% . 20 .....Poor/Working class
.....Middle class 4.0 24.1% 57.4% 9.3% 9.3% . 54
.....Upper middle/Upper class 3.8 17.9% 53.8% 23.1% 2.6% 2.6% 39

North Carolina State University
2015 Campus Climate Survey (Undergraduate Students)
Poole College of Management
Section D: The Role of Diversity in Higher Education
Tables of Results by Student Demographic Profile
* Statistically significant difference (p<.05) between group
Prepared by Office of Institutional Research and Planning
Page 15
D2n: Fostering
intellectual diversity
should be goal of NCSU
Mean Rating
5: Strongly
agree 4:
Agree
3: Neither agree nor
disagree 2:
Disagree Total (N)
Total (N) 4.2 36.3% 49.2% 10.5% 4.0% 124
D2n: Fostering intellectual diversity should be goal of
NCSU Mean Rating
5: Strongly
agree 4:
Agree
3: Neither agree nor
disagree 2:
Disagree Total (N)
Gender
4.3 39.2% 52.9% 5.9% 2.0% 51 .....Male
.....Female 4.1 32.9% 48.6% 12.9% 5.7% 70
D2n: Fostering intellectual diversity
should be goal of NCSU
Mean Rating
5: Strongly
agree 4:
Agree
3: Neither agree nor
disagree 2:
Disagree Total (N)
Race/Ethnicity
4.1 33.7% 49.0% 13.3% 4.1% 98 .....White/Caucasian
.....Students of Color 4.4 46.2% 50.0% . 3.8% 26
D2n: Fostering intellectual diversity should be goal of
NCSU Mean Rating
5: Strongly
agree 4:
Agree
3: Neither agree nor
disagree 2:
Disagree Total (N)
Socioeconomic Background
4.3 35.0% 55.0% 10.0% . 20 .....Poor/Working class
.....Middle class 4.1 37.0% 44.4% 11.1% 7.4% 54
.....Upper middle/Upper class 4.2 35.9% 48.7% 12.8% 2.6% 39

North Carolina State University
2015 Campus Climate Survey (Undergraduate Students)
Poole College of Management
Section D: The Role of Diversity in Higher Education
Tables of Results by Student Demographic Profile
* Statistically significant difference (p<.05) between group
Prepared by Office of Institutional Research and Planning
Page 16
D2o: Building diverse/inclusive
community should be key goal of NCSU
Mean Rating
5: Strongly
agree 4:
Agree
3: Neither agree nor
disagree 2:
Disagree
1: Strongly disagree Total (N)
Total (N) 4.1 37.1% 47.6% 8.9% 5.6% 0.8% 124
D2o: Building diverse/inclusive
community should be key goal of NCSU
Mean Rating
5: Strongly
agree 4:
Agree
3: Neither agree nor
disagree 2:
Disagree
1: Strongly disagree Total (N)
Gender*
4.1 29.4% 54.9% 9.8% 5.9% . 51 .....Male
.....Female 4.2 41.4% 44.3% 8.6% 5.7% . 70
D2o: Building diverse/inclusive
community should be key goal of NCSU
Mean Rating
5: Strongly
agree 4:
Agree
3: Neither agree nor
disagree 2:
Disagree
1: Strongly disagree Total (N)
Race/Ethnicity
4.1 35.7% 48.0% 9.2% 6.1% 1.0% 98 .....White/Caucasian
.....Students of Color 4.3 42.3% 46.2% 7.7% 3.8% . 26
D2o: Building diverse/inclusive community should be key goal of NCSU Mean
Rating
5: Strongly
agree 4:
Agree
3: Neither agree nor
disagree 2:
Disagree
1: Strongly disagree Total (N)
Socioeconomic Background
4.3 45.0% 45.0% . 10.0% . 20 .....Poor/Working class
.....Middle class 4.1 42.6% 38.9% 11.1% 5.6% 1.9% 54
.....Upper middle/Upper class 4.1 30.8% 53.8% 10.3% 5.1% . 39

North Carolina State University
2015 Campus Climate Survey (Undergraduate Students)
Poole College of Management
Section D: The Role of Diversity in Higher Education
Tables of Results by Student Demographic Profile
* Statistically significant difference (p<.05) between group
Prepared by Office of Institutional Research and Planning
Page 17
D2p: Easy to
find diversity info on NCSU
website Mean Rating
5: Strongly
agree 4:
Agree
3: Neither agree nor
disagree 2:
Disagree
1: Strongly disagree Total (N)
Total (N) 3.8 19.4% 45.2% 33.1% 1.6% 0.8% 124
D2p: Easy to find diversity info on NCSU website
Mean Rating
5: Strongly
agree 4:
Agree
3: Neither agree nor
disagree 2:
Disagree
1: Strongly disagree Total (N)
Gender
3.8 13.7% 52.9% 31.4% 2.0% . 51 .....Male
.....Female 3.8 22.9% 41.4% 32.9% 1.4% 1.4% 70
D2p: Easy to find diversity info on NCSU website Mean
Rating
5: Strongly
agree 4:
Agree
3: Neither agree nor
disagree 2:
Disagree
1: Strongly disagree Total (N)
Race/Ethnicity
3.9 20.4% 45.9% 32.7% 1.0% . 98 .....White/Caucasian
.....Students of Color 3.6 15.4% 42.3% 34.6% 3.8% 3.8% 26
D2p: Easy to find diversity info on NCSU website
Mean Rating
5: Strongly
agree 4:
Agree
3: Neither agree nor
disagree 2:
Disagree
1: Strongly disagree Total (N)
Socioeconomic Background
3.5 10.0% 40.0% 40.0% 5.0% 5.0% 20 .....Poor/Working class
.....Middle class 3.9 24.1% 40.7% 33.3% 1.9% . 54
.....Upper middle/Upper class 3.8 17.9% 48.7% 33.3% . . 39

North Carolina State University
2015 Campus Climate Survey (Undergraduate Students)
Poole College of Management
Section D: The Role of Diversity in Higher Education
Tables of Results by Student Demographic Profile
* Statistically significant difference (p<.05) between group
Prepared by Office of Institutional Research and Planning
Page 18
D3a: Learning
about different cultures
is important
part of college
education Mean Rating
5: Strongly
agree 4:
Agree
3: Neither agree nor
disagree 2:
Disagree
1: Strongly disagree Total (N)
Total (N) 4.0 37.9% 34.7% 16.9% 9.7% 0.8% 124
D3a: Learning about different cultures is
important part of college education
Mean Rating
5: Strongly
agree 4:
Agree
3: Neither agree nor
disagree 2:
Disagree
1: Strongly disagree Total (N)
Gender
3.8 29.4% 37.3% 21.6% 11.8% . 51 .....Male
.....Female 4.1 41.4% 34.3% 14.3% 8.6% 1.4% 70
D3a: Learning about different cultures is
important part of college education
Mean Rating
5: Strongly
agree 4:
Agree
3: Neither agree nor
disagree 2:
Disagree
1: Strongly disagree Total (N)
Race/Ethnicity*
3.9 30.6% 38.8% 18.4% 11.2% 1.0% 98 .....White/Caucasian
.....Students of Color 4.5 65.4% 19.2% 11.5% 3.8% . 26
D3a: Learning about different cultures is important part of
college education Mean Rating
5: Strongly
agree 4:
Agree
3: Neither agree nor
disagree 2:
Disagree
1: Strongly disagree Total (N)
Socioeconomic Background
4.2 50.0% 25.0% 15.0% 10.0% . 20 .....Poor/Working class
.....Middle class 4.0 40.0% 34.5% 12.7% 10.9% 1.8% 55
.....Upper middle/Upper class 4.0 35.0% 32.5% 25.0% 7.5% . 40
North Carolina State University
2015 Campus Climate Survey (Undergraduate Students)
Poole College of Management
Section D: The Role of Diversity in Higher Education
Tables of Results by Student Demographic Profile
* Statistically significant difference (p<.05) between group
Prepared by Office of Institutional Research and Planning
Page 19
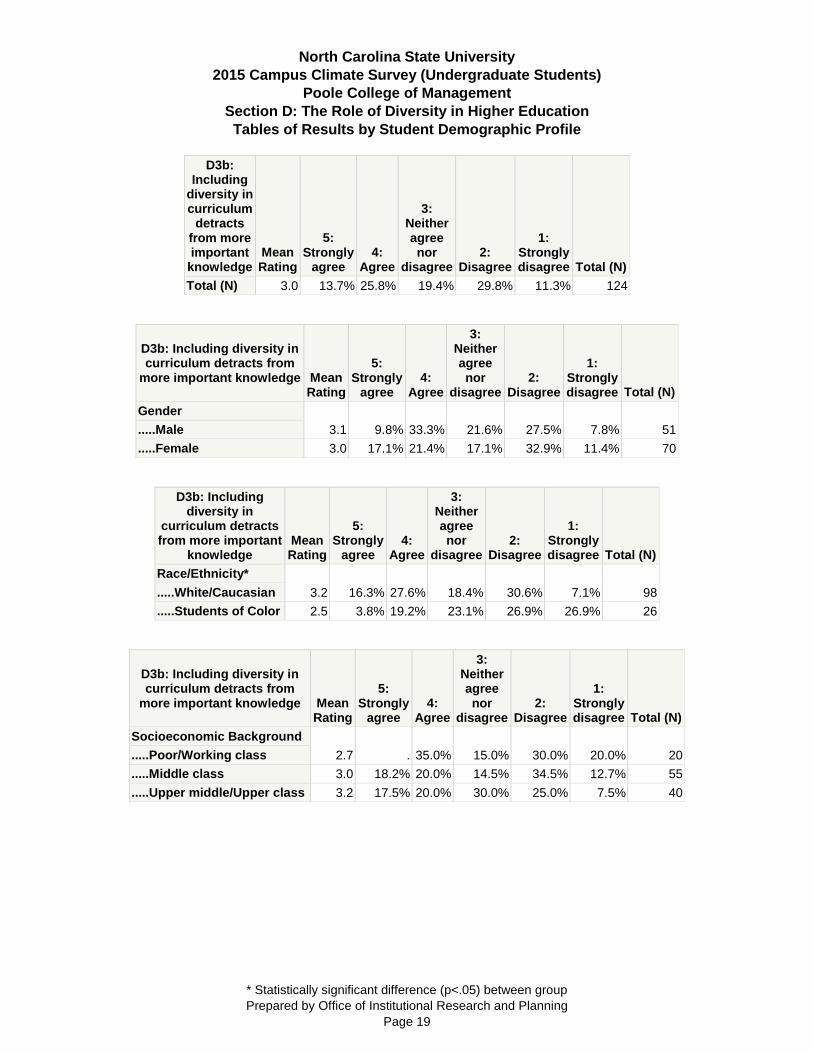
D3b: Including
diversity in curriculum
detracts from more important
knowledge Mean Rating
5: Strongly
agree 4:
Agree
3: Neither agree nor
disagree 2:
Disagree
1: Strongly disagree Total (N)
Total (N) 3.0 13.7% 25.8% 19.4% 29.8% 11.3% 124
D3b: Including diversity in curriculum detracts from
more important knowledge Mean Rating
5: Strongly
agree 4:
Agree
3: Neither agree nor
disagree 2:
Disagree
1: Strongly disagree Total (N)
Gender
3.1 9.8% 33.3% 21.6% 27.5% 7.8% 51 .....Male
.....Female 3.0 17.1% 21.4% 17.1% 32.9% 11.4% 70
D3b: Including diversity in
curriculum detracts from more important
knowledge Mean Rating
5: Strongly
agree 4:
Agree
3: Neither agree nor
disagree 2:
Disagree
1: Strongly disagree Total (N)
Race/Ethnicity*
3.2 16.3% 27.6% 18.4% 30.6% 7.1% 98 .....White/Caucasian
.....Students of Color 2.5 3.8% 19.2% 23.1% 26.9% 26.9% 26
D3b: Including diversity in curriculum detracts from
more important knowledge Mean Rating
5: Strongly
agree 4:
Agree
3: Neither agree nor
disagree 2:
Disagree
1: Strongly disagree Total (N)
Socioeconomic Background
2.7 . 35.0% 15.0% 30.0% 20.0% 20 .....Poor/Working class
.....Middle class 3.0 18.2% 20.0% 14.5% 34.5% 12.7% 55
.....Upper middle/Upper class 3.2 17.5% 20.0% 30.0% 25.0% 7.5% 40
North Carolina State University
2015 Campus Climate Survey (Undergraduate Students)
Poole College of Management
Section D: The Role of Diversity in Higher Education
Tables of Results by Student Demographic Profile
* Statistically significant difference (p<.05) between group
Prepared by Office of Institutional Research and Planning
Page 20
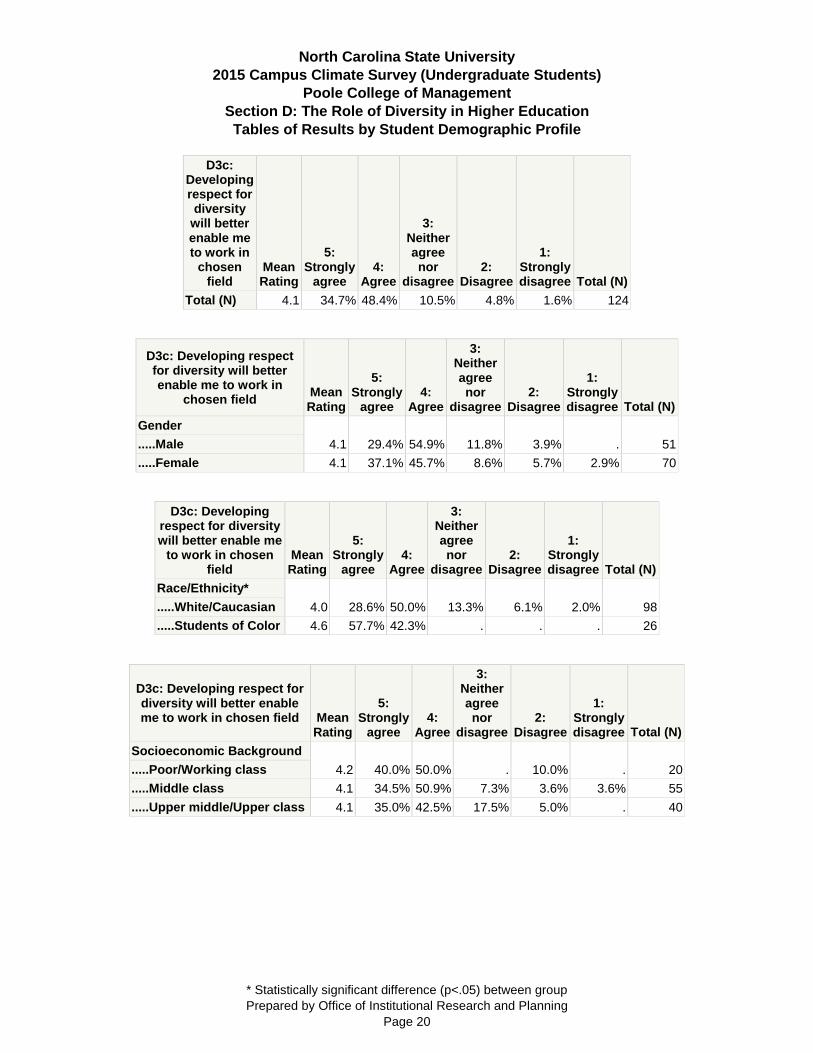
D3c: Developing respect for diversity
will better enable me to work in
chosen field
Mean Rating
5: Strongly
agree 4:
Agree
3: Neither agree nor
disagree 2:
Disagree
1: Strongly disagree Total (N)
Total (N) 4.1 34.7% 48.4% 10.5% 4.8% 1.6% 124
D3c: Developing respect for diversity will better enable me to work in
chosen field Mean Rating
5: Strongly
agree 4:
Agree
3: Neither agree nor
disagree 2:
Disagree
1: Strongly disagree Total (N)
Gender
4.1 29.4% 54.9% 11.8% 3.9% . 51 .....Male
.....Female 4.1 37.1% 45.7% 8.6% 5.7% 2.9% 70
D3c: Developing respect for diversity will better enable me
to work in chosen field
Mean Rating
5: Strongly
agree 4:
Agree
3: Neither agree nor
disagree 2:
Disagree
1: Strongly disagree Total (N)
Race/Ethnicity*
4.0 28.6% 50.0% 13.3% 6.1% 2.0% 98 .....White/Caucasian
.....Students of Color 4.6 57.7% 42.3% . . . 26
D3c: Developing respect for diversity will better enable me to work in chosen field Mean
Rating
5: Strongly
agree 4:
Agree
3: Neither agree nor
disagree 2:
Disagree
1: Strongly disagree Total (N)
Socioeconomic Background
4.2 40.0% 50.0% . 10.0% . 20 .....Poor/Working class
.....Middle class 4.1 34.5% 50.9% 7.3% 3.6% 3.6% 55
.....Upper middle/Upper class 4.1 35.0% 42.5% 17.5% 5.0% . 40

North Carolina State University
2015 Campus Climate Survey (Undergraduate Students)
Poole College of Management
Section D: The Role of Diversity in Higher Education
Tables of Results by Student Demographic Profile
* Statistically significant difference (p<.05) between group
Prepared by Office of Institutional Research and Planning
Page 21
D3d: Developing respect for diversity
will better enable me live in my
community Mean Rating
5: Strongly
agree 4:
Agree
3: Neither agree nor
disagree 2:
Disagree
1: Strongly disagree Total (N)
Total (N) 4.1 35.0% 51.2% 4.9% 7.3% 1.6% 123
D3d: Developing respect for diversity will better enable me live in my
community Mean Rating
5: Strongly
agree 4:
Agree
3: Neither agree nor
disagree 2:
Disagree
1: Strongly disagree Total (N)
Gender
4.1 31.4% 52.9% 7.8% 7.8% . 51 .....Male
.....Female 4.1 36.2% 52.2% 1.4% 7.2% 2.9% 69
D3d: Developing respect for diversity will better enable me
live in my community
Mean Rating
5: Strongly
agree 4:
Agree
3: Neither agree nor
disagree 2:
Disagree
1: Strongly disagree Total (N)
Race/Ethnicity
4.0 29.6% 53.1% 6.1% 9.2% 2.0% 98 .....White/Caucasian
.....Students of Color 4.6 56.0% 44.0% . . . 25
D3d: Developing respect for diversity will better enable me live in my community Mean
Rating
5: Strongly
agree 4:
Agree
3: Neither agree nor
disagree 2:
Disagree
1: Strongly disagree Total (N)
Socioeconomic Background
4.2 42.1% 42.1% 5.3% 10.5% . 19 .....Poor/Working class
.....Middle class 4.2 38.2% 50.9% 3.6% 3.6% 3.6% 55
.....Upper middle/Upper class 4.0 30.0% 52.5% 7.5% 10.0% . 40

North Carolina State University
2015 Campus Climate Survey (Undergraduate Students)
Poole College of Management
Section D: The Role of Diversity in Higher Education
Tables of Results by Student Demographic Profile
* Statistically significant difference (p<.05) between group
Prepared by Office of Institutional Research and Planning
Page 22
D3f: Interaction
with different people is essential
part of college
education Mean Rating
5: Strongly
agree 4:
Agree
3: Neither agree nor
disagree 2:
Disagree
1: Strongly disagree Total (N)
Total (N) 3.9 30.6% 42.7% 15.3% 7.3% 4.0% 124
D3f: Interaction with different people is
essential part of college education
Mean Rating
5: Strongly
agree 4:
Agree
3: Neither agree nor
disagree 2:
Disagree
1: Strongly disagree Total (N)
Gender
3.9 27.5% 45.1% 17.6% 7.8% 2.0% 51 .....Male
.....Female 3.9 31.4% 42.9% 14.3% 7.1% 4.3% 70
D3f: Interaction with different people is essential part of
college education Mean Rating
5: Strongly
agree 4:
Agree
3: Neither agree nor
disagree 2:
Disagree
1: Strongly disagree Total (N)
Race/Ethnicity
3.8 26.5% 45.9% 14.3% 8.2% 5.1% 98 .....White/Caucasian
.....Students of Color 4.2 46.2% 30.8% 19.2% 3.8% . 26
D3f: Interaction with different people is essential part of
college education Mean Rating
5: Strongly
agree 4:
Agree
3: Neither agree nor
disagree 2:
Disagree
1: Strongly disagree Total (N)
Socioeconomic Background
4.2 35.0% 50.0% 10.0% 5.0% . 20 .....Poor/Working class
.....Middle class 3.9 34.5% 36.4% 16.4% 7.3% 5.5% 55
.....Upper middle/Upper class 3.9 27.5% 42.5% 20.0% 7.5% 2.5% 40