north and central america - unep grid sioux falls · sites for north and central america...
TRANSCRIPT

75
North andCentral America
At A Glance
Population: 493 million
Percent of World’s Population: 8.03%
Land Area: 24,474,000 sq km
Percent of Earth’s Land: 16.5%
Key Environmental Issues:Land degradationHabitat lossConversion of fragile ecosystemsGreenhouse gas emissions and climate changeExploitation of groundwaterDegradation of coastal and marine areasUrban sprawl
Sites for North andCentral America
Everglades, United States
Gulf of Fonesca, Honduras
Hayman Wildfires, United States
Las Vegas, United States
Mexico City, Mexico
Mount St. Helens, United States
Tensas River Basin, United States
Vancouver and Seattle, Canada/United States

verglades National Park is situatedon the southern tip of the FloridaPeninsula, 16km from Florida City.
The Everglades is the largest subtropicalwetland in the United States with 6,100 sq.km. of area. Everglades National park wasincluded on the list of World Heritage sitesin 1993. The sawgrass marshes are the largestin the world and serve as a protected refugefor over 400 species of birds and some 800species of land and water vertebrates. Thethreats to the region are evident, as urbangrowth, overpopulation, agricultural pollu-tion from fertilizers, mercury poisoning offish and wildlife and drought severely stressthe system.
Escalating population is the singlebiggest threat to the Florida Everglades.Four-fifths of the historic boundaries of theEverglades lie outside the protected regionof the park and are threatened by agricul-tural and urban conversion. The satelliteimages show that urban population growthhas been particularly intense in the countiesin the lower east coast rim of the Everglades,straining the natural buffer zone of man-grove forests and sawgrass marshes.
Everglades, United States
Urban Encroachment into the Wetlands
E
77
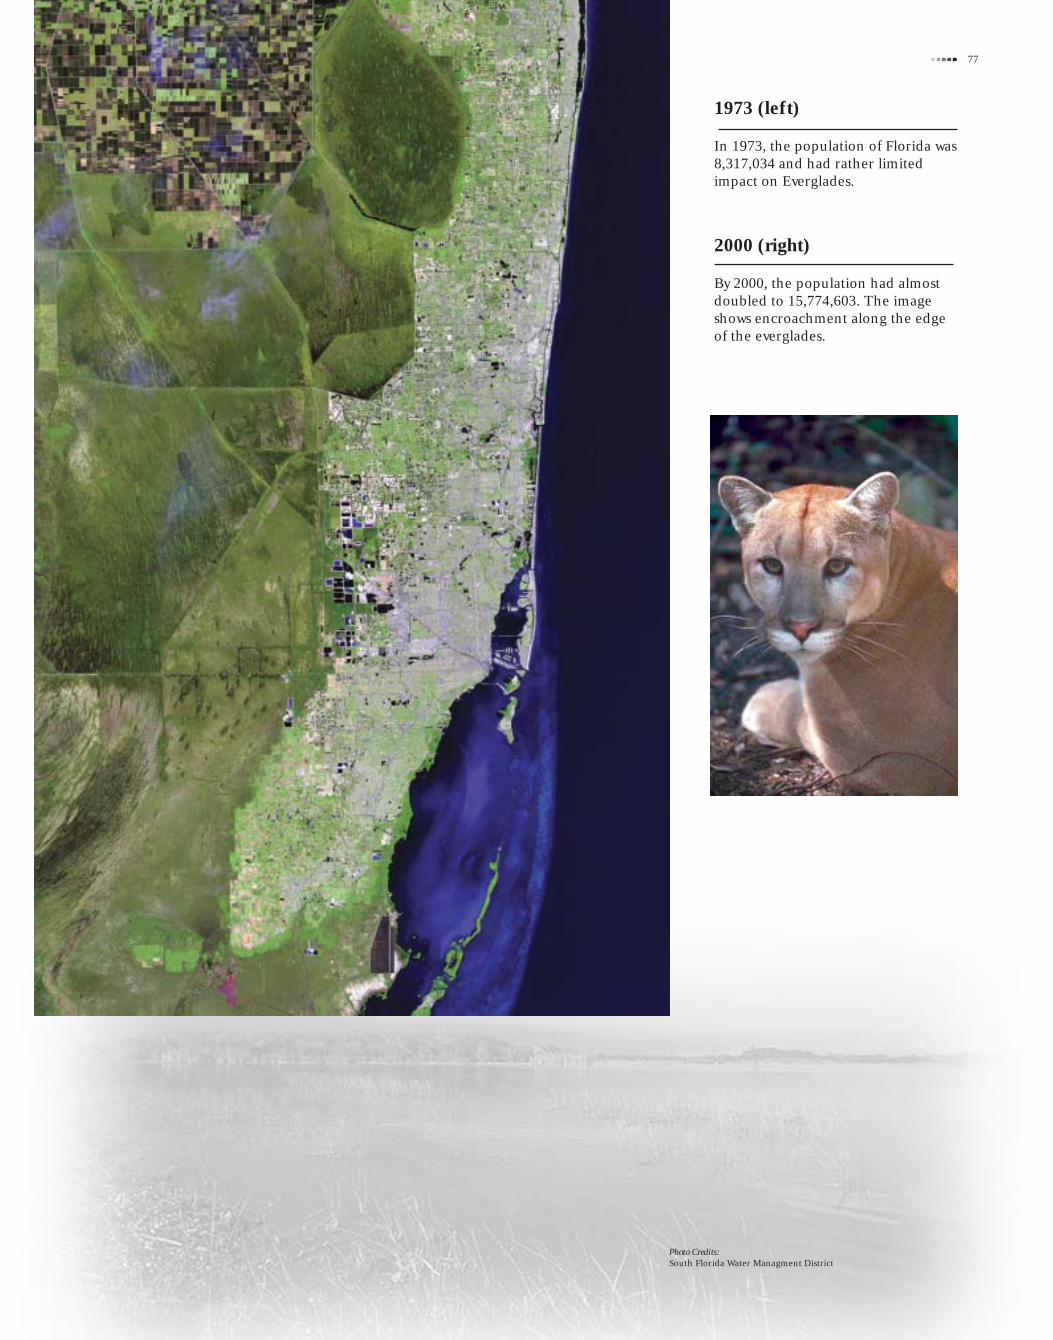
1973 (left)
In 1973, the population of Florida was8,317,034 and had rather limitedimpact on Everglades.
2000 (right)
By 2000, the population had almostdoubled to 15,774,603. The imageshows encroachment along the edgeof the everglades.
Photo Credits:South Florida Water Managment District

onduras is second only to Ecua-dor in the production and exportof cultured shrimp from Latin
America. Shrimp aquaculture in Hondurasbegan in the early 1970s and continued inthe 1980s with the support of internationalfinancial organizations and the Hondurangovernment. The private national andinternational enterprises converted vastareas of humid coastline into farms for thecultivation of shrimp. This industry boomedto become one of the top grossing indus-tries of the country by the 1990s.
The increase in the production ofshrimp is directly proportional to therequirement for land. This land is obtainedthrough the conversion of highly produc-tive coastal wetlands to shrimp farms. Therapid growth of aquaculture in Hondurashas caused both environmental and socialproblems. Shrimp farmers are deprivingfishermen, farmers and others access tomangroves, estuaries and seasonal lagoons.The destruction of mangrove ecosystems;alteration of the hydrology of the region;degradation of water quality; destruction ofthe habitats of other flora and fauna, whichprecipitates a decline in biodiversity, andthe decline in Gulf fisheries through theindiscriminate capture of other speciescaught with the shrimp post larvae used tostock ponds degrade the overall well-beingof local populations.
Gulf of Fonesca, Honduras
Hondurian Shrimp Farming
H

79
1987 (left)
This image shows the Gulf of Fonescabefore the beginning of intensiveshrimp cultivation.
2000 (right)
Over 250 sq. km. in the Gulf ofFonesca has been leased throughconcessions. The 2000 image docu-ments the resulting conversion ofwetlands. Estimates of mangrove lossdue directly to the construction ofshrimp farms range from about 20 to40 sq. km. If conservation policies arenot put in place, estimates suggestthat all the mangroves will disappearwithin 20 years.
Photo Credits:UVic Shrimp Aquaculture Research GroupNOAA/NERR

he Hayman wild fire near Denver,Colorado caused the destruction ofnearly 60,750 ha of forest. The fire
forced about 6,000 people in the communi-ties south and west of Denver to evacuate,and destroyed at least 115 homes and 10commercial buildings. The cost of fightingthe wildfire was $3 million a day. Wildfireactivity in 2002 was much higher thannormal across the country with over567,000 ha burned by June, nearly twicethe 10-year average.
Hayman Wild Fires, United States
Wild Fires in the Western United States
T

81
May 12, 2001 (left)
The satellite image shows healthyvegetation in various shades ofgreen. In the pre-Hayman fireimage, evergreen forests aregenerally dark green, whiledeciduous trees leafy plants are alighter green color. Water andcloud shadows are black, andurban areas are gray.
July 2, 2001 (right)
The satellite image provides aview of the Hayman fire after itburned an estimated4,600 ha.Recently burned areas appearblack, some smoke plumesappear light blue or gray andclouds are white. The Haymanfire scar is clearly visible whereolder fires show shades of grayimmediately north of theHayman fire.
Photo Credits:USDA/NRCS—Gene AlexandraUSDA—Bob Nichols

he built-up area data for Las Vegasprovide a dramatic illustration ofthe spatial patterns and rates of
change resulting from urban sprawl. Popula-tion growth in the Las Vegas Valley was fairlyslow during the first half of this century, butas the gaming and tourism industry blos-somed, population began to increase rap-idly. For example, the population of LasVegas in 1950 was 24,624 and in 1960, itincreased to 64,405. By 1980, Las Vegas hada population of 164,674. Today, the LasVegas Valley’s population tops one million,and this does not include the tourist popula-tion. Las Vegas is the fastest growing metro-politan area in the USA. One estimate is thatthe population will double by 2015, causingthe rate of conversion of the arable andforestlands to urban use to grow in the sameproportion as the population.
The city of Las Vegas is shown in thecentral portion of the satellite images of1973 and 1999. These show that modernurbanization in arid environments result inprofound modifications to the landscape,specifically the proliferation of asphalt andconcrete along with the displacement of thefew vegetated lands, such as agricultural andforest lands.
Las Vegas, United States
Urban Land Use Change
T

83
1972 (left)
This 1972 satellite image shows thestatus of Las Vegas in 1972. Las Vegaswas just a stop along the railroad thatpasses through the town.
2000 (right)
By 2000, the town had grown andsprawled in almost all directions withemphases on the northwest andsoutheast directions. Several trans-portation networks emerged to servethe city.
Photo Credits:USDA/NRCS—Lynn Betts

exico City, Mexico had apopulation of 17.9 million in1999 which makes it the
second largest metropolitan area in theworld behind Tokyo, Japan. The satel-lite images show dramatic urban growthin Mexico City between 1973 and 2000.The purple color shows urban infra-structure and green shows naturalvegetation. The forests in the moun-tains west and south of the city havesuffered significant deforestation.
Mexico City, Mexico
Growth of a Megacity
M

85
1973 (left)
The satellite image of 1973 showsurban growth concentrated in thecenter of Mexico City, when thepopulation was 9 million.
2000 (right)
The satellite image of 2000 showsdramatic urban expansion of the cityinto its surrounding areas. The megacity had a population of 14 millionin 1986 and is heading for a popula-tion of 20 million within the nextfew years.
Photo Credits:CentroGeo—José de Jesús Campos Enríquez
1910
1929
1941
1959
1970

efore 1980, Mount St. Helens was aquiet mountain retreat and a popu-lar location for skiing, hiking,
camping, and fishing. However, in a matterof minutes on May 18, 1980, the landscapechanged from dense forest to devastatedmoonscape. Following two months ofunrest the volcano erupted catastrophically,resulting in a massive landslide into theToutle River valley and devastating mud-flows down several drainages. The eruptionkilled 57 people, flattened over 600 sq. km.of trees, and left the area barren and nearlydevoid of life for some years. A verticaleruption column persisted for 9 hours,sending a stream of ash and pumice 15miles into the atmosphere.
While the 1980 eruption of Mount St.Helens destroyed the landscape, it grantedbiologists an unprecedented view into thecolonization and recovery of natural sys-tems. Future eruptions of other volcanoesin the Cascade Range are inevitable, andlessons from Mount St. Helens will beinvaluable to geologists and biologists forpredicting such activity and anticipatingtheir ecological impacts.
Mount St. Helens, United States
Change At Mount St. Helens
B

87
1973 (left)
In 1973 before the volcanic eruption in1980, Mount St. Helens was a quiet moun-tain retreat and a popular location forskiing, hiking, camping, and fishing.
1983 (upper right)
This image shows Mount St. Helens after iterupted in May 1980 with the entire northflank of the mountain collapsed into theToutle River. This reduced the height of itspeak by 400 metres, and in the years thatfollowed, a dome of viscous lava formed onthe crater floor, eventually reaching aheight of 300 metres when it stoppedgrowing in 1986. In addition, two newlakes, Castle and Coldwater, formed wherethe landslide debris dammed tributaries ofthe Toutle River.
2000 (lower right)
By the year 2000, life had returned in areasaffected by the eruption including thedevastated blast zone. Seeds that wereblown in by the wind took root in theavalanche deposit and soon shrubs andgrasses began to grow. Elk, rodents, insects,and other animals followed the plants, andtoday, 22 years after the eruption, a thrivingecosystem is evolving.
Photo Credits:USGS/Cascades Volcano Observatory—Austin PostUSGS/Cascades Volcano Observatory— Lyn TopinkaUSGS/Cascades Volcano Observatory— Harry Glicken

he Tensas River Basin encompassesapproximately 375,000 ha. ofMississippi River alluvial flood plain
in Northeast Louisiana. Historically, most ofthe Basin was covered with bottomlandhardwood forested wetlands. The bottom-land hardwood wetlands of the Tensas RiverBasin have been described as some of therichest ecosystems in the United States interms of diversity and productivity of plantand animal species. At the same time, thecleared lands are recognized as some of thecountry’s most productive farmland for grainand fiber.
In past years, the freshwater marshes,stream banks, and bottomland swamps of theTensas River Basin were under strong devel-opment pressures. Large portions of theforest near streams and in backwater swampswere converted to agriculture. In 1972 theamount of forest land in the Tensas RiverBasin was 126,298 hectares compared to244,522 hectares for human use. Theserepresent 33.6% and 65.1% of the totalTensas River Basin area. In 1991-1992 theamount of forest area was 80,807 hectaresand human use was 290,336 hectares. Theserepresent 21.5% and 77.3% of the totalTensas River Basin. The satellite images showthe land use change in the basin.
Tensas River Basin, United States
Conversion of Forest to Agriculture
T
89
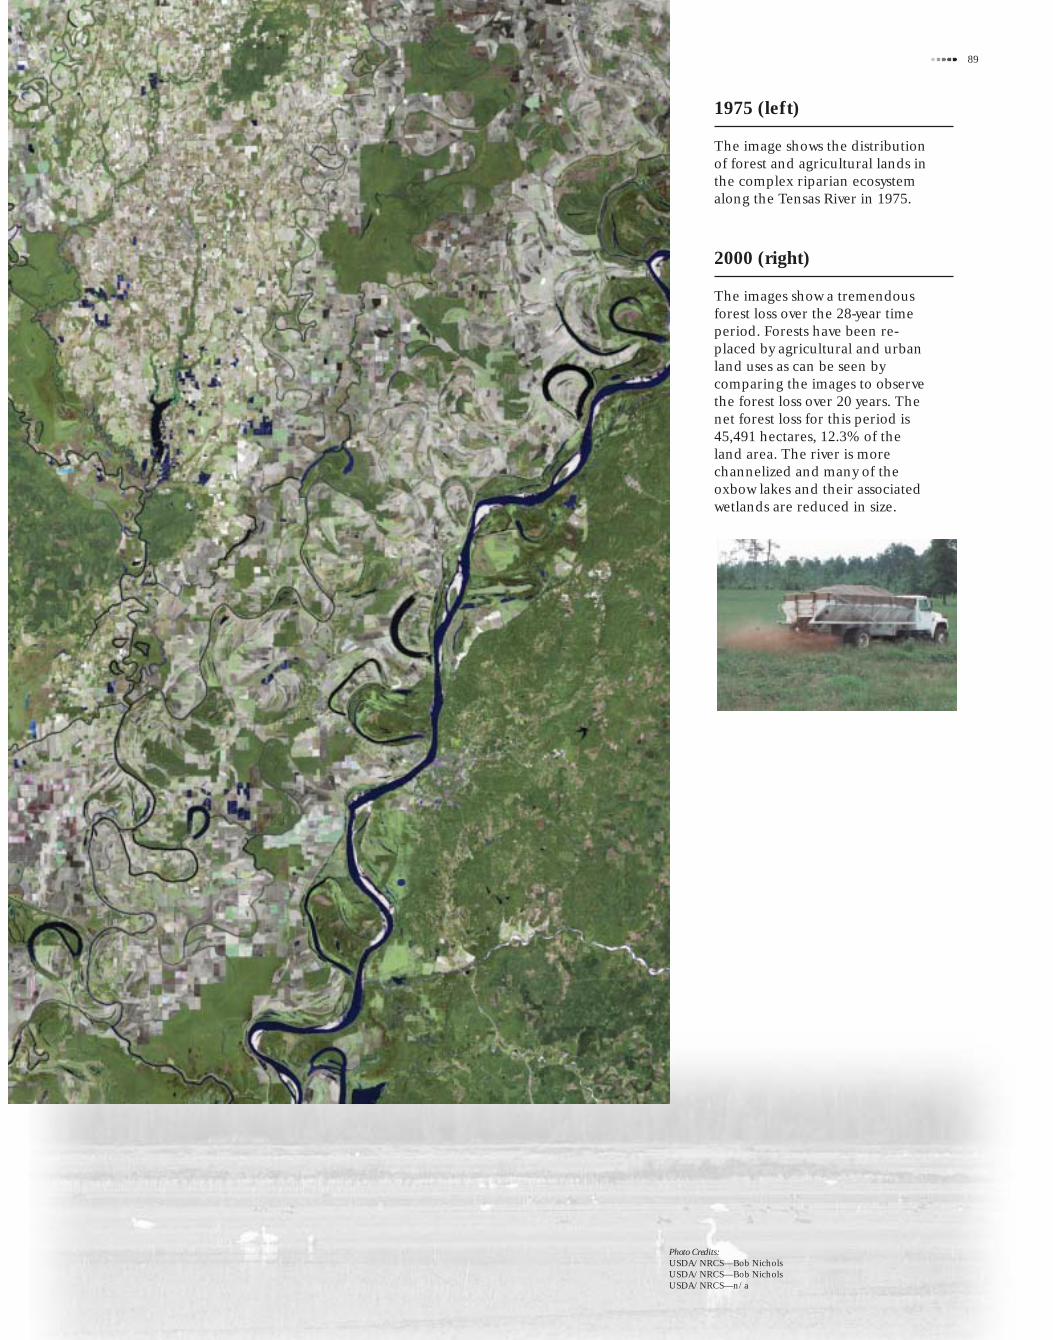
1975 (left)
The image shows the distributionof forest and agricultural lands inthe complex riparian ecosystemalong the Tensas River in 1975.
2000 (right)
The images show a tremendousforest loss over the 28-year timeperiod. Forests have been re-placed by agricultural and urbanland uses as can be seen bycomparing the images to observethe forest loss over 20 years. Thenet forest loss for this period is45,491 hectares, 12.3% of theland area. The river is morechannelized and many of theoxbow lakes and their associatedwetlands are reduced in size.
Photo Credits:USDA/NRCS—Bob NicholsUSDA/NRCS—Bob NicholsUSDA/NRCS—n/a

he Pacific Northwest’s two majormetropolitan areas, Seattle andVancouver, each grew by about the
same number of people in the 1990s, butsatellite images reveal that more previouslyundeveloped land was paved over ingreater Seattle than in Vancouver. Onaverage, ten 4 ha. were developed per dayin greater Seattle, but only 1.6 ha per dayin greater Vancouver.
During the 1990s, the two main PacificNorthwest metro areas (Vancouver andSeattle) have experienced a very similargrowth in population (approx 450,000 to500,000 people). However, the patterns ofgrowth are very different as can be seen inthe satellite images.
Vancouver and Seattle, Canada/US
Urban Growth In The Pacific Northwest
T

91
Vancouver, 1976 (upper left)
The Vancouver, B.C., urban area grewdenser since the 1980s. Compact, pedestrian-friendly neighborhoods contained 80 per-cent of the city’s growth between 1986 and1996. The Vancouver, B.C., metro area lostabout 1.6 ha. a day for development.
Vancouver, 2000 (lower left)
The population is nearly 2 million in 2001compared to 1.3 million in 1976. The 2000satellite image shows the increased urbanarea in the Vancouver region.
Seattle, 1985 (upper right)
Seattle has sprawled since 1980’s. Low-density residential areas made up three-fifthsof the Seattle-Tacoma urban area’s growthduring the 1990s. During the decade, theSeattle-Tacoma metro area lost an average of4 ha. of open space per day to suburbandevelopment, as measured by satelliteimagery. There was an overall increase of500,000 people from 1990-2000.
Seattle, 2000 (lower right)
The current population is 3.2 million and ofthat, 2.5 million were living in “car-depen-dent” low-density neighborhoods.
Photo Credits:USDA/NRCS—Gary WilsonCourtesy of Louise Krohn, www.krohn.org
