north american oil sands: history of development ... · north american oil sands: history of...
TRANSCRIPT
Order Code RL34258
North American Oil Sands: History ofDevelopment, Prospects for the Future
Updated January 17, 2008
Marc HumphriesAnalyst in Energy Policy
Resources, Science, and Industry Division

North American Oil Sands: History of Development,Prospects for the Future
Summary
When it comes to future reliable oil supplies, Canada’s oil sands will likelyaccount for a greater share of U.S. oil imports. Oil sands account for about 46% ofCanada’s total oil production and oil sands production is increasing as conventionaloil production declines. Since 2004, when a substantial portion of Canada’s oil sandswere deemed economic, Canada, with about 175 billion barrels of proved oil sandsreserves, has ranked second behind Saudi Arabia in oil reserves. Canadian crude oilexports were about 1.82 million barrels per day (mbd) in 2006, of which 1.8 mbd or99% went to the United States. Canadian crude oil accounts for about 18% of U.S.net imports and about 12% of all U.S. crude oil supply.
Oil sands, a mixture of sand, bitumen (a heavy crude that does not flownaturally), and water, can be mined or the oil can be extracted in-situ using thermalrecovery techniques. Typically, oil sands contain about 75% inorganic matter, 10%bitumen, 10% silt and clay, and 5% water. Oil sand is sold in two forms: (1) as a rawbitumen that must be blended with a diluent for transport and (2) as a synthetic crudeoil (SCO) after being upgraded to constitute a light crude. Bitumen is a thick tar-likesubstance that must be upgraded by adding hydrogen or removing some of thecarbon.
Exploitation of oil sands in Canada began in 1967, after decades of research anddevelopment that began in the early 1900s. The Alberta Research Council (ARC),established by the provincial government in 1921, supported early research onseparating bitumen from the sand and other materials. Demonstration projectscontinued through the 1940s and 1950s. The Great Canadian Oil Sands company(GCOS), established by U.S.-based Sunoco, later renamed Suncor, began commercialproduction in 1967 at 12,000 barrels per day.
The U.S. experience with oil sands has been much different. The U.S.government collaborated with several major oil companies as early as the 1930s todemonstrate mining of and in-situ production from U.S. oil sand deposits. However,a number of obstacles, including the remote and difficult topography, scattereddeposits, and lack of water, have resulted in an uneconomic oil resource base. Onlymodest amounts are being produced in Utah and California. U.S. oil sands wouldlikely require significant R&D and capital investment over many years to becommercially viable. An issue for Congress might be the level of R&D investmentin oil sands over the long term.
As oil sands production in Canada is predicted to increase to 2.8 million barrelsper day by 2015, environmental issues are a cause for concern. Air quality, land use,and water availability are all impacted. Socio-economic issues such as housing,skilled labor, traffic, and aboriginal concerns may also become a constraint ongrowth. Additionally, a royalty regime favorable to the industry has recently beenmodified to increase revenue to the Alberta government. However, despite theseissues and potential constraints, investment in Canadian oil sands will likely continueto be an energy supply strategy for the major oil companies.

Contents
Introduction . . . . . . . . . . . . . . . . . . . . . . . . . . . . . . . . . . . . . . . . . . . . . . . . . . . . . . 1
World Oil Sands Reserves and Resources . . . . . . . . . . . . . . . . . . . . . . . . . . . . . . . 2What Are Oil Sands? . . . . . . . . . . . . . . . . . . . . . . . . . . . . . . . . . . . . . . . . . . . 3U.S. Oil Sand Resources . . . . . . . . . . . . . . . . . . . . . . . . . . . . . . . . . . . . . . . . 3Canadian Oil Sand Resources . . . . . . . . . . . . . . . . . . . . . . . . . . . . . . . . . . . . 4
History of Development . . . . . . . . . . . . . . . . . . . . . . . . . . . . . . . . . . . . . . . . . . . . . 6Role of Industry and Government . . . . . . . . . . . . . . . . . . . . . . . . . . . . . . . . . 6
U.S. Oil Sands . . . . . . . . . . . . . . . . . . . . . . . . . . . . . . . . . . . . . . . . . . . . 6Canadian Oil Sands . . . . . . . . . . . . . . . . . . . . . . . . . . . . . . . . . . . . . . . . 7
Oil Sands Production Process . . . . . . . . . . . . . . . . . . . . . . . . . . . . . . . . . . . 10Extraction Process . . . . . . . . . . . . . . . . . . . . . . . . . . . . . . . . . . . . . . . . 11Production Technology . . . . . . . . . . . . . . . . . . . . . . . . . . . . . . . . . . . . 12Upgrading . . . . . . . . . . . . . . . . . . . . . . . . . . . . . . . . . . . . . . . . . . . . . . 14Cost of Development and Production . . . . . . . . . . . . . . . . . . . . . . . . . 16Tax and Royalty on Oil Sands . . . . . . . . . . . . . . . . . . . . . . . . . . . . . . . 18
U.S. Markets . . . . . . . . . . . . . . . . . . . . . . . . . . . . . . . . . . . . . . . . . . . . . . . . 19Pipelines . . . . . . . . . . . . . . . . . . . . . . . . . . . . . . . . . . . . . . . . . . . . . . . . 20
Issues for Congress . . . . . . . . . . . . . . . . . . . . . . . . . . . . . . . . . . . . . . . . . . . . . . . 23
Appendix A . . . . . . . . . . . . . . . . . . . . . . . . . . . . . . . . . . . . . . . . . . . . . . . . . . . . . 25
Appendix B . . . . . . . . . . . . . . . . . . . . . . . . . . . . . . . . . . . . . . . . . . . . . . . . . . . . . 26
Acronyms and Abbreviations . . . . . . . . . . . . . . . . . . . . . . . . . . . . . . . . . . . . . . . . 27
List of Figures
Figure 1. Tar (Oil) Sand Deposits of the United States . . . . . . . . . . . . . . . . . . . . 4Figure 2. Oil Sands Areas in Alberta, Canada . . . . . . . . . . . . . . . . . . . . . . . . . . . 5Figure 3. Major Mining Process Steps . . . . . . . . . . . . . . . . . . . . . . . . . . . . . . . . 10Figure 4. In-SITU Recovery . . . . . . . . . . . . . . . . . . . . . . . . . . . . . . . . . . . . . . . . 12Figure 5. Upgrading to SCO . . . . . . . . . . . . . . . . . . . . . . . . . . . . . . . . . . . . . . . . 14Figure 6. Oil Sands Processing Chain . . . . . . . . . . . . . . . . . . . . . . . . . . . . . . . . . 15Figure 7. Major Canadian and U.S. (Lower 48) Crude Oil Pipelines and
Markets . . . . . . . . . . . . . . . . . . . . . . . . . . . . . . . . . . . . . . . . . . . . . . . . . . . . 20
List of Tables
Table 1. Canada’s Bitumen Resources . . . . . . . . . . . . . . . . . . . . . . . . . . . . . . . . . 5Table 2. Leading Oil Sands Producers . . . . . . . . . . . . . . . . . . . . . . . . . . . . . . . . 11Table 3. Estimated Operating and Supply Cost by Recovery Type . . . . . . . . . . 17Table A1. Estimated World Oil Resources . . . . . . . . . . . . . . . . . . . . . . . . . . . . . 25Table B1. Regional Distribution of Estimated Technically Recoverable
Heavy Oil and Natural Bitumen . . . . . . . . . . . . . . . . . . . . . . . . . . . . . . . . . . 26

1 DOE, EIA, International Energy Outlook, 2006, p. 29. 2 U.S. Department of Energy, EIA, Annual Energy Outlook, 2006.
North American Oil Sands: History ofDevelopment, Prospects for the Future
Introduction
Current world oil reserves are estimated at 1.292 trillion barrels. The MiddleEast accounts for 58% of world oil reserves, and the Organization of PetroleumExporting Countries (OPEC) accounts for 70%. The Middle East also leads inreserve growth and undiscovered potential, according to the Energy InformationAdministration (EIA).1
The United States’ total oil reserves are estimated at 22.7 billion barrels, a scant1.8% of the world’s total (see Appendix A). U.S. crude oil production is expected tofall from 5.4 million barrels per day (mbd) in 2004 to 4.6 mbd in 2030, while demandedges up at just over 1% annually. Net imports of petroleum are estimated by theEIA to increase from 12.1 mbd (58% of U.S. consumption) to 17.2 mbd (62% of U.S.consumption) over the same time period.2
When it comes to future reliable oil supplies, Canadian oil sands will likelyaccount for a larger share of U.S. oil imports. Oil sands account for about 46% ofCanada’s total oil production, and oil sand production is increasing as conventionaloil production declines. Since 2004, when a substantial portion of Canada’s oil sandswere deemed economic, Canada has been ranked second behind Saudi Arabia in oilreserves. Canadian crude oil exports were about 1.82 million barrels per day in 2006,of which 1.8 mbd or 99% went to the United States. Canadian crude oil accounts forabout 18% of U.S. net imports and about 12% of all U.S. crude oil supply.
An infrastructure to produce oil, upgrade, refine, and transport it from Canadianoil sand reserves to the United States is already in place. Oil sands production isexpected to rise from its current level of 1.2 (mbd) to 2.8 mbd by 2015. However,infrastructure expansions and skilled labor are necessary to significantly increase theflow of oil from Canada. For example, many refineries are optimized to refine onlyspecific types of crude oil and may not process bitumen from oil sands. One issuelikely to be contentious is the regulatory permitting of any new refinery capacitybecause of environmental concerns such as water pollution and emissions ofgreenhouse gases.
Challenges such as higher energy costs, infrastructure requirements, and theenvironment, may slow the growth of the industry. For example, high capital and

CRS-2
3 Oil Sands Fever, The Environmental Implications of Canada’s Oil Sand Rush, by DanWoynillowicz, et. al, The Pembina Institute, November 2005.4 Reserves are defined by the EIA as estimated quantities that geological and engineeringdata demonstrate with reasonable certainty to be recoverable in future years from knownreservoirs under existing economic and operating conditions. Resources are definedtypically as undiscovered hydrocarbons estimated on the basis of geologic knowledge andtheory to exist outside of known accumulations. Technically recoverable resources are thoseresources producible with current technology without consideration of economic viability.
energy input costs have made some projects less economically viable despite recenthigh oil prices. Canada ratified the Kyoto Protocol in 2002, which bound Canada toreducing its greenhouse gas (GHG) emissions significantly by 2012 but according tothe government of Canada they will not meet their Kyoto air emission goals by 2012.The Pembina Institute reports that the oil sands industry accounts for the largestshare of GHG emissions growth in Canada.3
Major U.S. oil companies (Sunoco, Exxon/Mobil, Conoco Phillips, and
Chevron) continue to make significant financial commitments to develop Canada’soil sand resources. Taken together, these companies have already committed severalbillion dollars for oil sands, with some projects already operating, and others still inthe planning stages. Many of these same firms, with the U.S. government, did aconsiderable amount of exploration and development on “tar sands” in the UnitedStates, conducting several pilot projects. These U.S. pilot projects did not prove tobe commercially viable for oil production and have since been abandoned. Becauseof the disappointing results in the United States and the expansive reserves inCanada, the technical expertise and financial resources for oil sands development hasshifted almost exclusively to Canada and are likely to stay in Canada for theforeseeable future. However, with current oil prices above $60 per barrel and thepossibility of sustained high prices, some oil sand experts want to re-evaluate thecommercial prospects of U.S. oil sands, particularly in Utah.
This CRS report examines the oil sands resource base in the world, the historyof oil sands development in the United States and Canada, oil sand production,technology, development, and production costs, and the environmental and socialimpacts. The role of government — including direct financial support, and tax androyalty incentives — is also assessed.
World Oil Sands Reserves and Resources4
Over 80% of the earth’s technically recoverable natural bitumen (oil sands) liesin North America, according to the U.S. Geological Survey (USGS) (see AppendixB). Canadian oil sands account for about 14% of world oil reserves and about 11%of the world’s technically recoverable oil resources.

CRS-3
5 In-situ mining extracts minerals from an orebody that is left in place.6 Canada’s Oil Sands: Opportunities and Challenges to 2015, An Energy MarketAssessment, National Energy Board, Canada, May 2004, p. 5.7 API represents the American Petroleum Institute method for specifying the density ofcrude petroleum. Also called API gravity. 8 Diluents are usually any lighter hydrocarbon; e.g., pentane is added to heavy crude orbitumen in order to facilitate pipeline transport.9 Canada’s Oil Sands, May 2004, p. 10.
What Are Oil Sands?
Oil sands (also called tar sands) are mixtures of organic matter, quartz sand,bitumen, and water that can either be mined or extracted in-situ5 using thermalrecovery techniques. Typically, oil sands contain about 75% inorganic matter, 10%bitumen, 10% silt and clay, and 5% water.6 Bitumen is a heavy crude that does notflow naturally because of its low API7 (less than 10 degrees) and high sulfur content.The bitumen has high density, high viscosity, and high metal concentration. Thereis also a high carbon-to-hydrogen molecule count (i.e. oil sands are low in hydrogen).This thick, black, tar-like substance must be upgraded with an injection of hydrogenor by the removal of some of the carbon before it can be processed.
Oil sand products are sold in two forms: (1) as a raw bitumen that must beblended with a diluent8 (becoming a bit-blend) for transport and (2) as a syntheticcrude oil (SCO) after being upgraded to constitute a light crude. The diluent used forblending is less viscous and often a by-product of natural gas, e.g., a natural gascondensate. The specifications for the bit blend (heavy oil) are 21.5 API and a 3.3%sulfur content and for the SCO (light oil) are 36 API and a 0.015% sulfur content.9
U.S. Oil Sand Resources
The USGS, in collaboration with the U.S. Bureau of Mines, concluded in a1984 study that 53.7 billion barrels (21.6 billion measured plus 32.1 billionspeculative) of oil sands could be identified in the United States. An estimated 11billion barrels of those oil sands could be recoverable. Thirty-three major depositseach contain an estimated 100 million barrels or more. Fifteen percent wereconsidered mineable and 85% would require in-situ production. Some of the largestmeasured U.S. oil sand deposits exist in Utah and Texas. There are smaller depositslocated in Kentucky, Alabama, and California. Most of the deposits are scatteredthroughout the various states listed above. As of the 1980s, none of these depositswere economically recoverable for oil supply. They are still not classified as reserves(see Figure 1).

CRS-4
10 Canada’s Oil Sands, May 2004, p. 4 11 DOE, EIA, International Energy Outlook, 2006, p. 29
Source: Major Tar Sand and Heavy Oil Deposits of the United States, Interstate Oil CompactCommission, 1984, p. 2.
Canadian Oil Sand Resources
Canadian oil sand resources are located almost entirely in the province ofAlberta. The Alberta Energy and Utility Board (AEUB) estimates that there are 1.6trillion barrels of oil sands in place, of which 11% are recoverable (175 billionbarrels) under current economic conditions (see Table 1). Mineable reserves at thesurface account for 35 billion barrels (20%) and in-situ reserves at 141 billion barrels(80%). The AEUB estimates that the ultimate amount to be discovered (ultimatevolume-in place) is 2.5 trillion barrels: about 2.4 trillion in-situ and 140 billionsurface-mineable. Of this ultimate discovered amount, about 314 billion barrels areexpected to be recovered (175 billion barrels in reserves now and another 143 billionbarrels anticipated. See Table 1).10 However, EIA estimates only 45.1 billion barrels(reserve growth and undiscovered potential) to be added to Canada’s reserve base by2025.11
Oil sands occur primarily in three areas of Alberta: Peace River, Athabasca, andCold Lake (see Figure 2 below). Current production is 1.1 million barrels per day
Figure 1. Tar (Oil) Sand Deposits of the United States

CRS-5
12 Canada’s Oil Sands, NEB, June 2006.13 World Energy Investment Outlook, 2003 Insights, International Energy Agency (IEA),2003.
Figure 2. Oil Sands Areas in Alberta, Canada
and is expected to reach 2.0 mbd by 2010 and 3.0 mbd by 2015.12 According to theInternational Energy Agency (IEA), Canada’s oil sands production could exceed 5.0mbd by 2033 but would require at least $90 billion in investment.13
Source: National Energy Board, Alberta, Canada.
Table 1. Canada’s Bitumen Resources
BillionBarrels
UltimateVolume in
Place
InitialVolumein Place
UltimateRecoverable
Volume
InitialEstablished
Reserves
CumulativeProduction
RemainingEstablished
Reserves
Mineable
Athabasca 138.0 113.0 69.0 35.0 2.5 32.7
In Situ
Athabasca N/A 1,188.0 N/A N/A N/A N/A
Cold Lake N/A 201.0 N/A N/A N/A N/A
PeaceRiver
N/A 129.0 N/A N/A N/A N/A
Subtotal 2,378.0 1,518.0 245.0 142.8 1.26 141.5
Total 2,516.0 1,631.0 314.0 177.8 3.76 174.2
Source: Alberta Energy Utility Board.

CRS-6
14 Canadian Oil Sands, May 2004, p. 25.15 The U.S.-Canadian dollar exchange rate fluctuates daily. As of early October 2007 theexchange rate is U.S.$1 = C$0.9969. In December 2006 the exchange rate was U.S.$1 =C$1.15. 16 Oil Industry Update, Alberta Economic Development, Spring 2005.17 Oil shale is a compact rock (shale) containing organic matter capable of yielding oil. 18 U.S. Tar-Sand Oil Recovery Projects — 1984, L.C. Marchant, Western Research Institute,Laramie, WY, p. 625.19 Hydrocarbon-wetted oil sand deposits require different technology for bitumen extractionthan that used for Alberta’s water-wetted deposits. Oil sands are characterized as having awet interface between the sand grain and the oil coating; this allows for the separation of oil
(continued...)
As a result of recent high oil prices, 44 new oil sands projects are planned forAlberta between 2004 and 2012, 26 in-situ and 18 surface-mining.14 If all projectswere to go forward, an estimated C$60 billion would be required for construction.Several of the projects are expansions of current operations. The National EnergyBoard (NEB) projects as much as C$81.6 billion being spent between 2006 and2016.15 Eighty-two percent of the projected investment — expected to peak in 2008 — is directed towards the Fort McMurray/Woods Buffalo Region of Alberta. Atotal of C$29 billion was spent on oil sands development between 1996 and 2004.16
History of Development
Role of Industry and Government
U.S. Oil Sands. Interest in U.S. oil sand deposits dates back to the 1930s.Throughout the 1960s and 1970s, 52 pilot projects involving mining and in-situtechniques were supported by the U.S. government in collaboration with major oilcompanies such as Conoco, Phillips Petroleum, Gulf Oil, Mobil, Exxon, Chevron,and Shell. Several steam-assisted technologies were being explored for in-situproduction. These sources have had little economic potential as oil supply. TheEnergy Policy Act of 2005 (P.L. 109-58), however, established a public lands leasingprogram for oil sands and oil shale17 R&D.
Based on the Canadian experience with oil sands production, it was establishedthat commercial success in mining oil sands is a function of the ratio of overburdento oil sand thickness.18 This ratio should not exceed one. In other words, thethickness of the overlying rock should not be greater than the thickness of the sanddeposit. It was estimated by the USGS that only about 15% of the U.S. resource basehas a ratio of one or less.
Major development obstacles to the U.S. oil sands resource base include remoteand difficult topography, scattered deposits, and the lack of water for in-situproduction (steam recovery and hot water separation) or undeveloped technology toextract oil from U.S. “hydrocarbon-wetted” deposits.19 The Canadian technology
CRS-7
19 (...continued)from the grain. U.S. oil sands do not have a wet interface making the separation difficult.20 Phone communication with B. Tripp, Geologist, Utah Geological Survey, May 2004.21 Phone communication with Richard Meyers, Department of the Interior specialist in oilsands, September 2004.22 Presentation by Earth Energy Resources, Inc., at the Western U.S. Oil Sands Conference,University of Utah, September 21, 2006. 23 Development of America’s Strategic Unconventional Fuels Resources, Initial Report tothe President and the Congress of the United States, Task Force on StrategicUnconventional Fuels, September 2006.24 The measured pace is based on sufficient private investment capital as a result ofgovernment policies but little direct government investment. An accelerated pace wouldimply a global oil supply shortage and rely more on significant government investment. 25 Development of America’s Strategic Unconventional Fuels Resources, Initial Report tothe President and the Congress of the United States, Reference no. 17.
may not be suited for many U.S. deposits. In Texas, deposits were considered byConoco Oil to be too viscous to produce in-situ. A Bureau of Mines experiment withoil sands production in Kentucky proved to be commercially infeasible. In Utah,there were attempts at commercial production over the past three decades by severaloil companies but projects were considered uneconomic and abandoned. As of 2004,some oil sands were being quarried on Utah state lands for asphalt used in roadconstruction, and a small amount of production is taking place in California.20 “Sincethe 1980s there has been little production for road material and no governmentfunding of oil sands R&D,” according to an official at the Department of theInterior.21
A 2006 conference on oil sands held at the University of Utah indicated renewedinterest in U.S. oil sands but reiterated the development challenges mentioned above.Speakers also pointed out new technologies on the horizon that are being tested inUtah.22 Conference organizers concurred that long-term research and developmentfunding and huge capital development costs would be needed to demonstrate anycommercial potential of U.S. oil sand deposits. A recent report23 on U.S.unconventional fuels (an interagency and multistate collaboration) makes a numberof general recommendations (for the development of oil sands and otherunconventional fuels), which include economic incentives, establishing a regulatoryframework, technology R&D, and an infrastructure plan. A recommendation specificto oil sands calls for closer U.S. collaboration with the government of Alberta tobetter understand Canadian oil sands development over the last 100 years. Thereport’s task force estimates that based on a “measured” or “accelerated”development pace scenario,24 U.S. oil sand production could reach 340,000-352,000barrels per day by 2025.25
Canadian Oil Sands. Canada began producing its oil sands in 1967 afterdecades of research and development that began in the early 1900s. Wells weredrilled between 1906 and 1917 in anticipation of finding major conventional oildeposits. The area around Fort McMurray, Alberta, was mapped for bituminous sand

CRS-8
26 The ARC was established in 1921, housed at the University of Alberta in Edmonton, andfunded by the provincial government of Alberta. Its mandate was to document Alberta’smineral and natural resources. Today, the ARC is a wholly-owned subsidiary of the AlbertaScience and Research Authority (ASRA) within Alberta’s Ministry of Innovation andScience. The ARC has an annual budget of $85 million.27 The Influence of Interfacial Tension in the Hot-Water Process for Recovering BitumenFrom the Athabasca Oil Sands, by L.L. Schramm, E.N. Stasiuk, and D. Turner, presentedat the Canadian International Petroleum Conference, paper 2001-136, June 2001. 28 Syncrude Canada Ltd. when first organized as a consortium of major oil companiescomprised: Imperial Oil (an affiliate of Exxon), Atlantic Richfield (ARCO), Royalite Oil(later combined with Gulf Canada), and Cities Services R&D (See The Syncrude Story, p.5). Its ownership has changed over the years as indicated in the text. Its current ownershipstructure is as follows: Canadian Oil Sands Ltd. (31.74%), Imperial Oil (25%), Petro-Canada Oil and Gas (12%), Conoco Phillips Oil Sands Partnership II (9.03%), Nexen Inc.(7.23%), Murphy Oil Co. Ltd. (5%), Mocal Energy Ltd. (5%) and the Canadian Oil SandsLimited Partnership (5%).29 GCOS, Ltd., was later renamed Suncor.
exposures in 1913 by Canada’s Federal Department of Mines. By 1919, the Scientificand Industrial Research Council of Alberta (SIRCA), predecessor to the AlbertaResearch Council (ARC),26 became interested in oil sands development. One of itsnewly recruited scientists, Dr. Karl Clark, began his pioneering work on a hot-waterflotation process for separating the bitumen from the sand. In this separation process,the mined oil sand is mixed with water and a sodium hydroxide base and rotated27 ina horizontal drum at 80 degrees centigrade. Dr. Clark’s efforts led to a pilot plant in1923 and a patented process by 1929. He continued to improve the process throughseveral experimental extraction facilities through the 1940s.
The technical feasibility was demonstrated in 1949 and 1950 at a facility inBitumont, Alberta, located on the Athabasca River near Fort McMurray. Thetechnology being tested was largely adopted by the early producers of oil sands —Great Canadian Oil Sands (GCOS), Ltd., and Syncrude. Sunoco established GCOS,Ltd., in 1952 and then invested $250 million in its oil sands project. Another majorplayer in the oil sands business in Canada was Cities Services, based in Louisiana.Cities Services purchased a controlling interest in the Bitumont plant in 1958, thenin 1964, along with Imperial Oil, Atlantic Richfield (ARCO), and Royalite Oil,formed the Syncrude consortium.28
The ARC continued its involvement with oil sands R&D throughout the 1950sand 1960s. Several pilot projects were established during that period. Suncor 29 beganconstruction of the first commercial oil sands production/separation facility in 1964and began production in 1967, using the hot water extraction method developed andtested by ARC. In 1967, Suncor began to produce oil sands at a rate of 12,000barrels per day.
Just a year later, in 1968, the government of Alberta deferred an application bySyncrude Canada for a $200 million, 80,000 barrel oil sands facility. Eventually, in1978, the Energy Resources Conservation Board of Alberta approved Syncrude’sproposal to build a $1 billion plant that would produce up to 129,000 barrels per day.
CRS-9
30 A Billion Barrels for Canada, The Syncrude Story, pp. 44-45.31 The Alberta Energy Company (AEC) was created by the government of Alberta in 1975.Fifty percent was publicly owned. The government phased out is equity interest and in 1993sold its remaining interest. The AEC and PanCanadian Energy Corporation merged in 2002and became EnCana. EnCana sold its interest in Syncrude in 2003. For more details seeAlexander’s Oil and Gas Connection, “Company News North America,” January 15, 2004.32 The Syncrude Story, pp. 72-73.33 Ibid, p. 98-99.34 Ibid, p.10435 Ibid, p. 122.36 Ibid, p. 136.
However, ARCO, which represented 30% of the project, pulled out of the consortiumas costs of the plant climbed toward $2 billion. At that point (1978) the federal andprovincial governments joined in. The federal government purchased a 15% share,Alberta a 10% share, and Ontario 5%, making up the 30% deficit. At the time, theCanadian government was promoting the goal of energy self-sufficiency, and theAlberta government agreed to a 50/50 profit-sharing arrangement instead of normalroyalties for Syncrude.30
The Alberta Energy Company31 purchased 20% of Syncrude and then sold 10%of its share to Petrofina Canada, Ltd., and Hudson Bay Oil and Gas, Ltd.32 Theconsortium grew from four to nine owners. From 1983 to 1988 Syncrude spent $1.6billion to boost production to 50 million barrels per year. In 1984, the governmentof Alberta agreed to a new royalty structure for oil sands producers coinciding withSyncrude’s capital expansion plans. In 1985, the Alberta government announced thatexisting oil sands operations and new plants would not be taxed on revenues, and thepetroleum gas revenue tax would be phased out. During the same time-frame,Syncrude’s cash operating costs were just under $18 per barrel with total costs over$20 per barrel,33 while the market price of oil fluctuated under $20 per barrel.
Because of huge capital requirements, oil sands producers lobbied for continuedroyalty relief and thought the government should “defer tax and royalty revenuesuntil project expansions were completed.”34 In 1994, the National Oil Sands TaskForce (an industry/government group) was created, and the Canadian Oil SandsNetwork for R&D (CONRAD) agreed to spend $105 million annually to boostproduction and trim costs. Costs continued to fall ($15.39/bbl in 199235 to under $14/bbl in 199436) as Syncrude ownership continued to change. In 1996, the National OilSands Task Force recommended a package of royalty and tax terms to ensureconsistent and equal treatment of projects, because oil sand projects previously weretreated on a project-by-project basis. The implementation of favorable royaltytreatment is discussed below.
The ARC has had a successful partnership with the private sector in oil sandsresearch and development. As a result of favorable royalty and tax terms andAlberta’s $700 million R&D investment in oil sands extraction (from 1976-2001),the private sector has invested billions of dollars of development capital in oil sand
CRS-10
37 The Alberta Energy Research Institute: Strategic Research Plan, 2003.38 ARC, Guide to the ARC, 2001-02. The ARC’s more recent focus on developing in-situtechnologies is beginning to shift back to surface mining R&D. They believe that their roleis to help many of the newcomers to the industry develop “best practices” technology. TheARC sees itself as an ongoing player in the R&D business because of the huge challengesrelated to environmental quality, cost reductions, and the need for new upgradingtechnologies and refinery expansions.39 Oil Sands Technology Roadmap, p. 20.
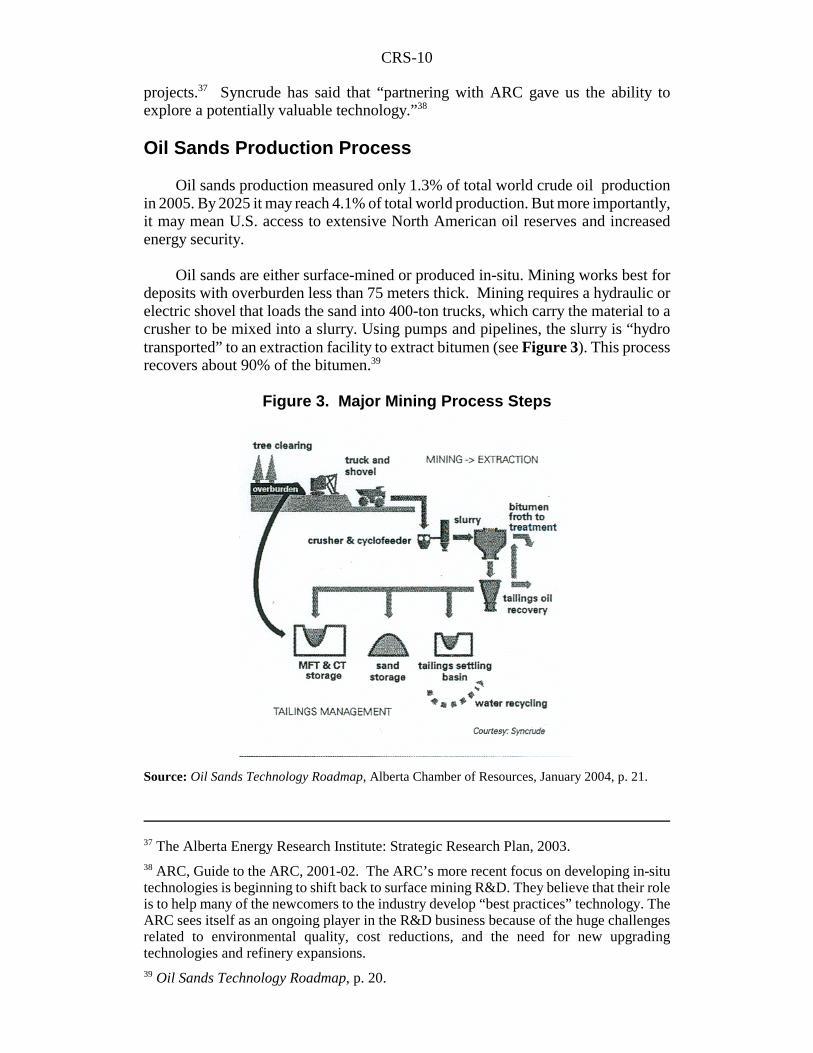
Figure 3. Major Mining Process Steps
projects.37 Syncrude has said that “partnering with ARC gave us the ability toexplore a potentially valuable technology.”38
Oil Sands Production Process
Oil sands production measured only 1.3% of total world crude oil productionin 2005. By 2025 it may reach 4.1% of total world production. But more importantly,it may mean U.S. access to extensive North American oil reserves and increasedenergy security.
Oil sands are either surface-mined or produced in-situ. Mining works best fordeposits with overburden less than 75 meters thick. Mining requires a hydraulic orelectric shovel that loads the sand into 400-ton trucks, which carry the material to acrusher to be mixed into a slurry. Using pumps and pipelines, the slurry is “hydrotransported” to an extraction facility to extract bitumen (see Figure 3). This processrecovers about 90% of the bitumen.39
Source: Oil Sands Technology Roadmap, Alberta Chamber of Resources, January 2004, p. 21.

CRS-11
40 Oil Sands Industry Update, AED, June 2006, p. 7.41 Oil Sands Technology Roadmap: Unlocking the Potential, Alberta Chamber ofResources, January 2004 p. 23.
In 2005, mining accounted for about 52% of Alberta’s oil sand production(572,000 b/d); in-situ accounted for about 48% (528,000 b/d), one-third of which wasproduced using the Cold Production method in which oil sands are light enough toflow without heat. The in-situ approach, which was put into commercial productionin 1985,40 is estimated to grow to 926,000 barrels per day by 2012. Currently, thelargest production projects are in the Fort McMurray area operated by Syncrude andSuncor (see Table 4 for leading producers of oil sands).
Extraction Process. The extraction process separates the bitumen from oilsands using warm water (75 degrees Fahrenheit) and chemicals. Extracting the oilfrom the sand after it is slurried consists of two main steps. First is the separation ofbitumen in a primary separation vessel. Second, the material is sent to the froth tankfor diluted froth treatment to recover the bitumen and reject the residual water andsolids. The bitumen is treated either with a naphtha solvent or a paraffinic solvent tocause the solids to easily settle. The newer paraffinic treatment results in a cleanerproduct.41 This cleaner bitumen is pipeline quality and more easily blended withrefinery feedstock. After processing, the oil is sold as raw bitumen or upgraded andsold as SCO.
Table 2. Leading Oil Sands Producers(barrels per day)
Project Owner Type ofProject 2002 2003 2006
1st Quarter
PlannedProduction
Targets
Suncor Mining 206,000 217,000 264,400 410,000
Syncrude Mining 230,000 212,000 205,000 560,00
Athabasca OilSands (Shell, Chevron,and MarathonOil)a
Mining N/A 130,000 77,400 525,000
Imperial Oil In-situ 112,000 130,000 150,000 180,000
CNRL In-situ N/A 35,000 122,000 500,000
Petro Canada In-situ 4,500 16,000 21,000(2005)
100,000
EnCana In-situ N/A 5,300 36,000 250,000
Source: Oil Sands Industry Update, Alberta Economic Development, 2004 and 2006.
a. Marathon Oil Corp. acquired Western Oil Sands, Inc. on October 18, 2007.

CRS-12
Figure 4. In-SITU Recovery
Source: Oil Sands Technology Roadmap, p. 28.
Production Technology. For in-situ thermal recovery, wells are drilled, thensteam is injected to heat the bitumen so it flows like conventional oil. In-situproduction involves using various techniques.
One technique is the Cyclic Steam Stimulator (CSS), also known as “huff andpuff.” CSS is the most widely used in-situ technology. In this process, steam isadded to the oil sands via vertical wells, and the liquefied bitumen is pumped to thesurface using the same well.

CRS-13
42 According to the National Energy Board Report, one thousand cubic feet of natural gasis required per barrel of bitumin for SAGD operations. Canada’s Oil Sands, May 2004.43 Canada’s Oil Sands, June 2006 p. 4. 44 Canada’s Oil Sands, Opportunities and Challenges to 2015, An Energy MarketAssessment, May 2004, National Energy Board, Canada, p. 108.
But a relatively new technology — steam-assisted gravity drainage (SAGD) —has demonstrated that its operations can recover as much as 70% of the bitumen in-place. Using SAGD, steam is added to the oil sands using a horizontal well, then theliquefied bitumen is pumped simultaneously using another horizontal well locatedbelow the steam injection well (see Figure 4). The SAGD process has a recoveryadvantage over the CSS process, which only recovers 25%-30% of the naturalbitumen. Also, the lower steam to oil ratio (the measurement of the volume of steamrequired to extract the bitumen) of SAGD results in a more efficient process that usesless natural gas.42 SAGD operations are limited to thick, clean sand reservoirs, butit is reported by the industry that most of the new in-situ projects will use SAGDtechnology.43 A number of enhanced SAGD methods are being tested by the AlbertaResearch Council. They could lead to increased recovery rates, greater efficiency, andreduced water requirements.
The emerging Vapor Extraction Process (VAPEX) technology operates similarlyto SAGD. But instead of steam, ethane, butane, or propane is injected into thereservoir to mobilize the hydrocarbons towards the production well. This processeliminates the cost of steam generators and natural gas. This method requires nowater and processing or recycling and is 25% lower in capital costs than the SAGDprocess. Operating costs are half that of the SAGD process.44
A fourth technique is cold production, suitable for oil sands lighter than thoserecovered using thermal assisted methods or mining. This process involves the co-production of sand with the bitumen and allows the oil sands to flow to the well borewithout heat. Imperial Oil uses this process at its Cold Lake site. Oil sand producedusing in-situ techniques is sold as natural bitumen blended with a diluent for pipelinetransport.

CRS-14
45 Canada’s Oil Sands, June 2006.46 Overview of Canada’s Oil Sands, TD Securities, January 2004, p. 19.
Source: Oil Sands Technology Roadmap, p. 41.
The overall result of technology R&D has been to reduce operating costs fromover $20/barrel in the early 1970s to $8-12/barrel in 2000. While technologyimprovements helped reduce some costs since 2000, total costs have risensignificantly as discussed below, because of rising capital and energy costs.45
Upgrading.46 Upgrading the bitumen uses the process of coking for carbonremoval or hydro-cracking for hydrogen addition (see Figure 5). Coking is acommon carbon removal technique that “cracks” the bitumen using heat andcatalysts, producing light oils, natural gas, and coke (a solid carbon byproduct). Thecoking process is highly aromatic and produces a low quality product. The productmust be converted in a refinery to a lighter gas and distillate. Hydrocracking alsocracks the oil into light oils but produces no coke byproduct. Hydrocracking requiresnatural gas for conversion to hydrogen. Hydrocracking, used often in Canada, betterhandles the aromatics. The resulting SCO has zero residues which help keep itsmarket value high, equivalent to light crude.
Partial upgrading raises the API of the bitumen to 20-25 degrees for pipelinequality crude. A full upgrade would raise the API to between 30-43 degrees — closerto conventional crude. An integrated mining operation includes mining andupgrading. Many of the mining operations have an on-site upgrading facility,including those of Suncor and Syncrude. Suncor uses the coking process for
Figure 5. Upgrading to SCO

CRS-15
47 NEB, June 2006, pp. 20-21.
Figure 6. Oil Sands Processing Chain
upgrading, while Syncrude uses both coking and hydrocracking and Shell useshydrocracking. (For the complete oil sands processing chain, see Figure 6.)
A major trend among both mining and in situ producers is to integrate theupgrading with the refinery to cut costs; e.g., linking SAGD production with currentrefinery capabilities. Long-term processing success of oil sands will depend on howwell this integration takes place and how well the industry addresses the followingissues:
! cost overruns, ! cost effective upgrading, reducing highly aromatic, high-sulfur SCO,
and ! dependence on and price of natural gas for hydrogen production
(originally used because of its low price but now considered by someto be too expensive).
The wide heavy-oil/light-oil price differential has been an incentive to increaseupgrading. The price for heavy crude was as low as $12 per barrel in early 2006 andits market is limited by refineries that can process it and by its end use as asphalt. Inits June 2006 report, the NEB describes numerous proposals for building upgraders.47
Source: Overview of Canada’s Oil Sands, TD Securities, p. 15.

CRS-16
48 COS, 2004, p. 9.49 COS, 2006, p. 5.
Cost overruns for the integrated mining projects or expansions, sometimes asmuch as 50% or more of the original estimates, have been a huge problem for theindustry. The main reasons cited by the COS report are poor management, lack ofskilled workers, project size, and engineering issues.
Cost of Development and Production. Operating and total supply costshave come down significantly since the 1970s. Early supply costs were near C$35per barrel (in 1970s dollars). Reductions came as a result of two major innovationsin the production process. First, power shovels and energy efficient trucks replaceddraglines and bucketwheel reclaimers, and second, hydrotransport replaced conveyorbelts to transport oil sands to the processing plant.48
Operating costs include removal of overburden, mining and hydro transport,primary extraction, treatment, and tailings removal. The recovery rate, overburdenvolumes, cost of energy, transport distances, and infrastructure maintenance all havean impact on operating costs.
Supply costs (total costs) include the operating costs, capital costs, taxes androyalties, plus a 10% return on investment (ROI). When compared to conventionalnew oil production starts, an oil sands project may have operating costs over 30%higher than the world average for conventional new starts. However, its nearlynonexistent royalty and tax charge makes the total cost per barrel of energysignificantly less than the conventional oil project. The NEB in its Energy MarketAssessment estimated that between US$30-$35 per barrel oil is required to achievea 10% ROI.49
Operating costs for mining bitumen were estimated at around C$9-$12 perbarrel (C$2005) — an increase of up to C$4 per barrel since the 2004 NEB estimates.Supply cost of an integrated mining/upgrading operation is between C$36 and $40/barrel for SCO — a dramatic increase over the C$22-$28 estimate made in 2004.These supply costs for an integrated mining/upgrading operation were expected todecline with improvements in technologies (see Table 3). However, natural gasprices rose 88% and capital costs rose 45% over the past two years.
Operating costs for SAGD in-situ production in 2005 were about C$10-$14 perbarrel of bitumin, up from C$7.40 per barrel in 2004. Recovery rates are lower thanwith mining, at 40%-70%, and the price of energy needed for production is a muchlarger factor. The SAGD operations are typically phased-in over time, thus are lessrisky, make less of a “footprint” on the landscape than a mining operation, andrequire a smaller workforce. SAGD supply cost for Athabasca oil sand rose frombetween C$11-$17/barrel (bitumen) to C$18-$22/barrel; using the CSS recoverytechnique, supply costs are estimated higher at between C$20-$24/barrel, an increasefrom C$13-$19/barrel. Cost increases/decreases for in-situ operations are largelydependent on the quality of the reservoir and natural gas prices, but as SAGD andother new technologies (e.g. VAPEX) become more efficient, industry is expecting

CRS-17
50 COS, 2004, p. 18.
some cost declines. SAGD (in-situ) supply costs are less sensitive to capital coststhan mining projects because the capital investment is far less.
Natural gas is a major input and cost for mining, upgrading, and in situ recovery:Mining requires natural gas to generate heat for the hot water extraction process,upgraders need it for heat and steam, and in situ producers use natural gas to producesteam which is injected underground to induce the flow of bitumen. Natural gasaccounts for 15% of the operating costs in mining operations compared to 60% ofoperating costs in SAGD in-situ production. The major cost for thermal in-situprojects (SAGD, CSS) is for the natural gas that powers the steam-producinggenerators. For SAGD projects, 1 thousand cubic feet is needed per barrel ofbitumen. Reducing the steam-to-oil ratio (SOR) — the quantity of steam needed perbarrel of oil produced — is critical for lowering natural gas use and costs.50 SAGDhas a lower SOR than CSS projects but cannot be used for all oil sand in-situproduction. However, most new in-situ projects will use SAGD.
Canadian oil sand producers continue to evaluate energy options that couldreduce or replace the need for natural gas. Those options include, among other things,the use of gasification technology, cogeneration, coal, and nuclear power.
Table 3. Estimated Operating and Supply Cost by Recovery Type
(C$2005 Per Barrel at the Plant Gate)
CrudeType
Operating Cost
Supply Cost
Cold Production - Wabasca, Seal Bitumen 6-9 14-18
Cold Heavy Oil Production and Sand(CHOPS) - Cold Lake Bitumen 8-10 16-19
Cyclic Stream Stimulation (CSS) Bitumen 10-14 20-24
Steam Assisted Gravity Drainage (SAGD) Bitumen 10-14 18-22
Mining/Extraction Bitumen 9-12 18-20
Integrated Mining/Upgrading SCO 18-22 36-40
Source: Canada’s Oil Sands, Opportunities and Challenges to 2015, National Energy Board,Canada, June 2006.
Note: Supply costs for the first five technologies do not include the coat of upgrading bitumen toSCO.

CRS-18
51 The generic oil sands royalty regime consists of three parts: the lease sale, a minimum 1%pre-payout gross revenue royalty, and a 25% post-payout net revenue royalty. The payoutperiod is the time it takes a firm to recover all allowable capital costs including a rater ofreturn.52 Oil and Gas Fiscal Regime, Alberta Resource Development of Western CanadianProvinces and Territories, p. 39, 1999. 53 Oil Sands, Benefits to Alberta and Canada, Today and Tomorrow, Through a Fair, Stableand Competitive Fiscal Regime, Canadian Association of Petroleum Producers, May 2007,Appendix B.54 Our Fair Share, Report of the Alberta Royalty Review Panel, September 18, 2007, p. 7.55 Ibid., p. 27.
Tax and Royalty on Oil Sands. In 1997 the Alberta governmentimplemented a “Generic Oil Sands Royalty Regime”51 specific to oil sands for allnew investments or expansions of current projects. Since then, oil sand producershave had to pay a 1% minimum royalty based on gross revenue until all capital costsincluding a rate of return are recovered. After that, the royalty is either 25% of netproject revenues or 1% of the gross revenues, whichever is greater.52 The 1% pre-payout royalty rate is in stark contrast to conventional world royalties. Net projectrevenues (essentially net profits before tax) include revenues after project cash costs,such as operating costs, capital, and R&D are deducted. Royalty payments may bebased on the value of bitumen or SCO if the project includes an upgrader. Currently,51% of oil sand projects (or 75% of production volume) under the Generic Royaltyregime are paying the 25% royalty rate. Two major oil sands producers, Suncor andSyncrude (accounting for 49% of bitumen production) have “Crown Agreements” inplace with the province that have allowed the firms to pay royalties based on thevalue of synthetic crude oil (SCO) production with the option to switch to payingroyalties on the value of bitumen beginning as early as 2009. Royalties paid onbitumen, which is valued much lower than SCO, would result in less revenue for thegovernment. The agreements expire in 2016.
Royalty revenues from oil sands fluctuated widely between 1997 and 2005. Forexample, royalties from oil sands were less than $100 million in 1999, then rose to$700 million in 2000/2001, but fell in 2002/2003 to about $200 million as productioncontinued to rise. Royalties from oil sands rose dramatically in 2005/2006 to $1billion, and the Government of Alberta forecasts royalties of $2.5 billion in2006/2007 and $1.8 billion in 2007/2008.53 Oil price fluctuations are the primarycause for such swings in royalty revenues.
The Albertan provincial government established a Royalty Review Panel inFebruary 2007 to examine whether Alberta was receiving its fair share of royaltyrevenues from the energy sector and to make recommendations if changes areneeded. In its September 2007 report, the panel concluded that “Albertans do notreceive their fair share from energy development.”54 When the oil sands industry wasranked against other heavy oil and offshore producers such as Norway, Venezuela,Angola, United Kingdom, and the U.S. Gulf of Mexico, Alberta received the smallestgovernment share.55 This is, however, a difficult comparison to make because it isnot among oil sand producers only and the fiscal regimes of the various producing
CRS-19
56 Overview of Canada’s Oil Sands, T.D. Securities, January 2004, p. 7.57 The New Royalty Framework, October 25, 2007.58 Oil and Gas Taxation in Canada, January 2000, PriceWaterhouseCoopers.59 Canadian Department of Finance, Economic Statement, October 30, 2007.60 There are 5 PADD’s in the United States. PADDs were created during World War II asa way to organize the distribution of fuel in the United States.
countries is dynamic. However, based on a general analysis by T.D. Securities,typically, on average, world royalty rates could add as much as 45% to operatingcosts while the 1% rate may add only 3% to operating costs.56
The Panel recommended keeping the “pre-payout, post-payout” frameworkintact (see footnote 52), which would retain the 1% pre-payout royalty rate, but in thepost-payout phase, firms would be required to pay a higher net revenue royalty rateof 33% plus continue to pay the 1% base royalty.
On October 25, 2007, the Alberta Government announced and published itsresponse to the Royalty Review Panel’s report.57 It retained the “pre-payout,” “post-payout” royalty framework but concluded that a sliding-scale rate structure wouldbest achieve increasing the government’s share of revenues from oil sandsproduction. The pre-payout base rate would start at 1%, then increase for everydollar above US$55 per barrel (using the West Texas Intermediate or WTI price)reaching a maximum increase of 9% when prices are at or above $120 per barrel. Inthe post-payout phase, the net revenue rate will start at 25%, then rise for every dollaroil in priced above US$55 per barrel, reaching a maximum of 40% of net revenueswhen oil is $120 per barrel or higher. The new rate structure will take effect in 2009.The Government of Alberta has initiated negotiations with Suncor and Syncrude inan attempt to include them under the new oil sands royalty framework by 2009.
Oil sand firms pay federal and provincial income taxes and some differencesexist in the tax treatment of the oil sands and conventional oil industries. Since theProvincial 1996 Income Tax Act, both mineable and in-situ oil sand deposits areclassified as a mineral resource for Capital Cost Allowance (CCA) purposes whichmeans mineral deposits receive higher cost deductions than conventional oil and gasoperations (i.e. acquisition costs and intangible drilling costs).58 The provincialgovernment of Alberta has agreed to the 2007 federal budget proposal to eliminatethe CCA deduction for oil sands. The Royalty Review Panel also supported thischange in its report. The federal government of Canada, however, provided somebalance by reducing the general federal corporate income tax rate from 22.1% to 15%beginning in 2012.59
U.S. Markets
Oil sand producers continue to look to the United States for the majority of theirexports. Seventy-five percent of Canadian nonconventional oil exported to the UnitedStates is delivered to the Petroleum Administration for Defense District (PADD)60
II in the Midwest. This region is well positioned to receive larger volumes of

CRS-20
61 DOE/EIA, Annual Energy Outlook 2006 with Projections to 2030, February 2006.
Figure 7. Major Canadian and U.S. (Lower 48) Crude Oil Pipelinesand Markets
nonconventional oil from Canada because of its refinery capabilities. Several U.S.-based refinery expansions have been announced that would come online between2007-2015. If Canada were to reach its optimistic forecasted oil sands output levelof 5 mbd in 2030, and maintained its export level to the United States at around 90%,it would be exporting about 4.5 mbd to the United States. This would mean thatimports from Canada would reach nearly 30% of all U.S. crude oil imports. U.S.refinery capacity is forecast to increase from 16.9 mbd in 2004 to nearly 19.3 mbdin 2030,61 a 2.4 mbd increase — significant but perhaps not enough to accommodatelarger volumes of oil from Canada, even if refinery expansions would have thetechnology to process heavier oil blends. Canada is pursuing additional refinerycapacity for its heavier oil.
Pipelines. Oil sands are currently moved by two major pipelines (theAthabasca and the Corridor, not shown in Figure 7) as diluted bitumen to processingfacilities in Edmonton. After reaching refineries in Edmonton, the synthetic crude orbitumen is moved by one of several pipelines to the United States (see Figure 7). TheAthabasca pipeline has capacity of 570,000 barrels per day (b/d) while the Corridorhas capacity of less than 200,000 b/d. Current pipeline capacity has nearly reachedits limit. However, there are plans to increase Corridor’s capacity to 610,000 b/d by2010.
Source: Canada’s Oil Sands, Opportunities and Challenges to 2015: An Update, June 2006.

CRS-21
62 “Oil Sands Producers Facing Pipeline Capacity Constraints,” The Energy Daily, August7, 2007.63 Greenhouse gas emissions include carbon dioxide, methane, nitrous oxide,hydrofluorocarbons, perfluorocarbons, and sulfur hexafluoride. 64 COS, 2004, p. 62.65 Ibid., p. 63.66 Oil Sands Fever, by Dan Woynillowicz, et al., The Pembina Institute, November 2005.67 COS, June 2006, p. 39.
A number of new pipeline projects have been proposed or initiated that wouldincrease the flow of oil from Canada to the United State’s PADDs II, III, and V. Most of the new projects are scheduled to come online between 2008 and 2012. Inaddition, a couple of U.S. pipelines reversed their flow of crude oil (from south tonorth) to now carry Canadian heavy crude, originating from oil sands, to CushingOklahoma and Southeast Texas. Pipeline capacity could be a constraint to growthin the near term but the NEB predicts some excess pipeline capacity by 2009. Anestimated $31.7 billion has been invested in pipeline projects for oil sands in westernCanada.62
Environmental and Social Issues
The Federal Government of Canada classified the oil sands industry as a largeindustrial air pollution emitter (i.e., emitting over 8,000 tons CO2/year) and expectsit to produce half of Canada’s growth in greenhouse gas (GHG) emissions63 (about8% total GHG emissions) by 2010. The oil sands industry has reduced its “emissionintensity” by 29% between 1995-2004 while production was rising. CO2 emissionshave declined from 0.14 tons/bbl to about 0.08 tons/bbl or about 88 megatons since1990.64 Alberta’s GHG goals of 238 megatons of CO2 in 2010, and 218 megatonsCO2 in 2020 are not expected to be met.65 Reducing air emissions is one of the mostserious challenges facing the oil sands industry. However, according to the PembinaInstitute, a sustainable energy advocate, greenhouse gas emissions intensity(CO2/barrel) from oil sands is three times as high as that from conventional oilproduction.66 The industry believes if it can reduce energy use it can reduce itsemissions. As emissions per barrel of oil from oil sands decline overall, the Canadiangovernment projects that total GHG emissions will continue to rise through 2020,attributing much of the increase to increased oil sands production.67
Water supply and waste water disposal are among the most serious concernsbecause of heavy use of water to extract bitumen from the sands. For an oil sandsmining operation, about 2-3 barrels of water are used from the Athabasca river foreach barrel of bitumen produced; but when recycled produced water is included, 0.5barrels of “make-up” water is required, according to the Alberta Department ofEnergy. Oil sands projects currently divert 150 million cubic meters of waterannually from the Athabasca River but are approved to use up to 350 million cubic
CRS-22
68 Oil Sands Fever, op. cit.69 Canada’s Oil Sands (water conservation initiatives), pp. 66-68.70 Canada’s Oil Sands, p. 68.71 Ibid., p. 69.72 For more on byproducts, see Canada’s Oil Sands, p. 70.73 Ibid., p. 71.
meters.68 Concerns, however, arise over the inadequate flow of the river to maintaina healthy ecosystem and meet future needs of the oil sands industry. Additionally,mining operations impact freshwater aquifers by drawing down water to prevent pitflooding.
The freshwater used for in-situ operations is needed to generate steam, separatebitumen from the sand, hydrotransport the bitumen slurry, and upgrade the bitumento a light crude. For SAGD operations, 90-95% of all the water used is recycled.Since some water is lost in the treatment process, additional freshwater is needed.To minimize the use of new freshwater supplies, SAGD operators use saline waterfrom deeper underground aquifers. The use of saline water, however, generates hugevolumes of solid waste which has posed serious disposal problems.
Wastewater tailings (a bitumen, sand, silt, and fine clay particles slurry) alsoknown as “fluid fine tailings” are disposed in large ponds until the residue is used tofill mined-out pits. Seepage from the disposal ponds can result from erosion,breaching, and foundation creep.69 The principal environmental threat is themigration of tails to a groundwater system and leaks that might contaminate the soiland surface water.70 The tailings are expected to reach 1 billion cubic meters by 2020.Impounding the tailings will continue to be an issue even after efforts are made to usealternative extraction technology that minimizes the amount of tails. Tailingsmanagement criteria were established by the Alberta Energy and UtilitiesBoard/Canadian Environmental Assessment Agency in June 2005. Ongoingextensive research by the Canadian Oil Sands Network for Research andDevelopment (CONRAD) is focused on the consolidation of wastewater tailings,detoxifying tailings water ponds, and reprocessing tailings. Some R&D progress isbeing made in the areas of the cleanup and reclamation of tailings usingbioremediation and electrocoagulation.71
The National Research Council of Canada (NRC) is conducting research to treatwastewater tailings and recover their byproduct residual bitumen, heavy metals, andamorphous solids (fertilizers). A pilot project is underway to clean and sort tailings,and recover metals such as aluminum and titanium.72
Surface disturbance is another major issue. The oil sands industry practiceleaves land in its disturbed state and left to revegetate naturally. Operators, however,are responsible over the long term to restore the land to its previous potential.73
Under an Alberta Energy Utility Board directive (AEUB), Alberta’s Upstream Oiland Gas Reclamation and Remediation Program has expanded industry liability for

CRS-23
74 Ibid.75 Oil Sands Industry Update, AED, June 2006, p. 29.76 Section 369 of Energy Policy Act of 2005.
reclaiming sites. The directive requires a “site-specific liability assessment” thatwould estimate the costs to abandon or reclaim a site.74
The government of Alberta’s Department of the Environment established a“Regional Sustainable Development Strategy” whose purpose is, among other things,to “ensure” implementation of management strategies that address regionalcumulative environmental impacts.75 The oil sands industry is regulated under theEnvironmental Protection and Enhancement Act, Water Act, and Public Lands Act.Oil sands development proposals are reviewed by AEUB, Alberta Environment, andthe Alberta Sustainable Resource Development at the provincial level. Review at thefederal level may also occur.
Issues for Congress
The Energy Policy Act of 2005 (P.L. 109-58) describes U.S. oil sands (alongwith oil shale and other unconventional fuels) as a strategically important domesticresource “that should be developed to reduce the growing dependence of the UnitedStates on politically and economically unstable sources of foreign oil imports.”76 Theprovision also requires that a leasing program for oil sands R&D be established.Given U.S. oil sands’ strategic importance, but limited commercial success asdiscussed above, what level of federal investment is appropriate to reach U.S. energypolicy goals? While an estimated 11 billion barrels of U.S. oil sands may besignificant if it were economic, it represents a small share of the potentiallyrecoverable resource base of unconventional fuels (e.g., 800 billion barrels ofpotentially recoverable oil from oil shale and another 20 billion barrels of recoverableheavy oil). Where is the best return on the R&D dollar invested for increaseddomestic energy supply and what are the long-term prospects for commercialapplication of unconventional fuels technology? Another important consideration tolook at is where the oil industry is investing its capital and R&D for oil sandsprojects.
In light of the environmental and social problems associated with oil sandsdevelopment, e.g., water requirements, toxic tailings, carbon dioxide emissions, andskilled labor shortages, and given the fact that Canada has 175 billion barrels ofreserves and a total of over 300 billion barrels of potentially recoverable oil sands (anattractive investment under current conditions demonstrated by the billions of dollarsalready committed to Canadian development), the smaller U.S. oil sands base maynot be a very attractive investment in the near-term.
U.S. refinery and pipeline expansions are needed to accommodate Canadian oilsands developments. Those expansions will have environmental impacts, but thenew infrastructure could strengthen the flow of oil from Canadian oil sands. Thisexpanded capacity will likely lead to even greater investment in Canada.

CRS-24
77 Development of America’s Strategic Unconventional Fuels Resources, September 2006,p. 5.
Whether U.S. oil sands are developed, Congress will continue to be faced withregulatory matters. Oil imports from oil sands are likely to increase from Canada andthe permitting of new or expanded oil refineries will continue to be an issue becauseof the need to balance concerns over the environment on one hand and energysecurity on the other.
Prospects for the Future
Because capital requirements for oil sands development has been enormous andrisky, government involvement was seen as being essential in Canada, particularlyduring sustained periods of low oil prices. This private sector/government partnershipin R&D, equity ownership, and public policy initiatives over the last 100 years hasopened the way for the current expansion of the oil sands industry in Alberta.
Ongoing R&D efforts by the public and private sectors, sustained high oilprices, and favorable tax and royalty treatment are likely to continue to attract theincreasing capital expenditures needed for growth in Canada’s oil sands industry.Planned pipeline and refinery expansions and new upgrading capacity are underwayto accommodate the increased volumes of oil sands production in Canada. U.S.markets will continue to be a major growth area for oil production from Canadian oilsands. Currently, about 5% of the total oil refined in the United States is fromCanada’s oil sands.
Even though prospects for Canadian oil sands appear favorable, factors such aswater availability, waste water disposal, air emissions, high natural gas costs,insufficient skilled labor, and infrastructure demands may slow the pace ofexpansion.
Prospects for commercial development of U.S. oil sands are uncertain at bestbecause of the huge capital investment required and the relatively small andfragmented resource base. The Task Force on Strategic Unconventional Fuelsreported that oil sands comprise only about 0.6% of U.S. solid and liquid fuelresources, while oil shale accounts for nearly 25% of the total resource base.77
CRS-25
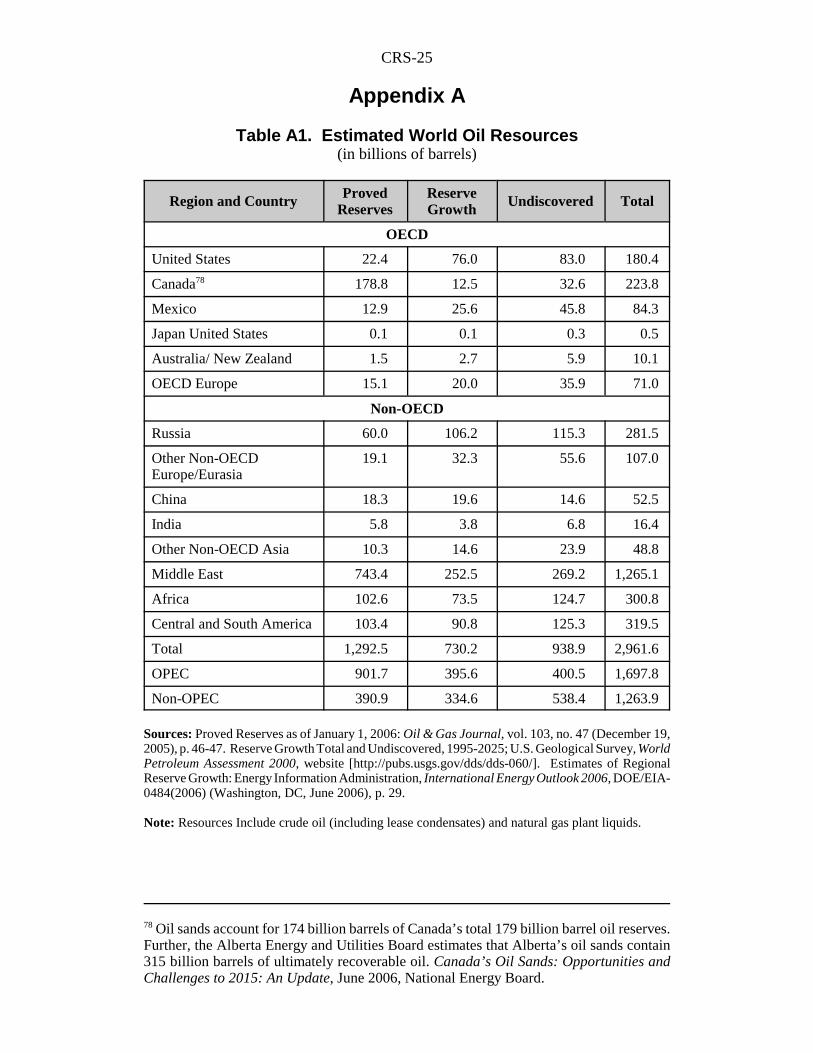
78 Oil sands account for 174 billion barrels of Canada’s total 179 billion barrel oil reserves.Further, the Alberta Energy and Utilities Board estimates that Alberta’s oil sands contain315 billion barrels of ultimately recoverable oil. Canada’s Oil Sands: Opportunities andChallenges to 2015: An Update, June 2006, National Energy Board.
Appendix A
Table A1. Estimated World Oil Resources(in billions of barrels)
Region and Country ProvedReserves
ReserveGrowth Undiscovered Total
OECD
United States 22.4 76.0 83.0 180.4
Canada78 178.8 12.5 32.6 223.8
Mexico 12.9 25.6 45.8 84.3
Japan United States 0.1 0.1 0.3 0.5
Australia/ New Zealand 1.5 2.7 5.9 10.1
OECD Europe 15.1 20.0 35.9 71.0
Non-OECD
Russia 60.0 106.2 115.3 281.5
Other Non-OECDEurope/Eurasia
19.1 32.3 55.6 107.0
China 18.3 19.6 14.6 52.5
India 5.8 3.8 6.8 16.4
Other Non-OECD Asia 10.3 14.6 23.9 48.8
Middle East 743.4 252.5 269.2 1,265.1
Africa 102.6 73.5 124.7 300.8
Central and South America 103.4 90.8 125.3 319.5
Total 1,292.5 730.2 938.9 2,961.6
OPEC 901.7 395.6 400.5 1,697.8
Non-OPEC 390.9 334.6 538.4 1,263.9
Sources: Proved Reserves as of January 1, 2006: Oil & Gas Journal, vol. 103, no. 47 (December 19,2005), p. 46-47. Reserve Growth Total and Undiscovered, 1995-2025; U.S. Geological Survey, WorldPetroleum Assessment 2000, website [http://pubs.usgs.gov/dds/dds-060/]. Estimates of RegionalReserve Growth: Energy Information Administration, International Energy Outlook 2006, DOE/EIA-0484(2006) (Washington, DC, June 2006), p. 29.
Note: Resources Include crude oil (including lease condensates) and natural gas plant liquids.

CRS-26
79 In-place oil is a continuous ore body that has maintained its original characteristics.
Appendix B
Table B1. Regional Distribution of Estimated TechnicallyRecoverable Heavy Oil and Natural Bitumen
(in billions of barrels)
RegionHeavy Oil Natural Bitumen
(oil sands)
RecoveryFactora
TechnicallyRecoverable
RecoveryFactora
TechnicallyRecoverable
North America 0.19 35.3 0.32 530.9
South America(Venezuela)
0.13 265.7 0.09 0.1
W. Hemisphere 0.13 301.0 0.32 531.0
Africa 0.18 7.2 0.10 43.0
Europe 0.15 4.9 0.14 0.2
Middle East 0.12 78.2 0.10 0.0
Asia 0.14 29.6 0.16 42.8
Russia 0.13 13.4 0.13 33.7b
E. Hemisphere 0.13 133.3 0.13 119.7
World 434.3 650.7
Source: U.S. Department of the Interior. U.S. Geological Survey Fact Sheet, FS 070-03 August 2003.
Note: Heavy oil and natural bitumen are resources in known accumulations.
a. Recovery factors were based on published estimates of technically recoverable and in-place79 oilor bitumen by accumulation. Where unavailable, recovery factors of 10% and 5% of heavy oilor bitumen in-place were assumed for sandstone and carbonate accumulations, respectively.
b. In addition, 212.4 billion barrels of natural bitumen in-place is located in Russia but is either insmall deposits or in remote areas in eastern Siberia.

CRS-27
Acronyms and Abbreviations
AEUB Alberta Energy and Utility BoardAPI American Petroleum InstituteARC Alberta Research CouncilARCO Atlantic Richfield CompanyCCA Capital Cost AllowanceCONRAD Canadian Oil Sands Network for Research and Development COS Canadian Oil SandsCSS Cyclic Steam StimulatorEIA Energy Information AdministrationGCOS Great Canadian Oil Sands CompanyGHG greenhouse gasesIEA International Energy Agencymbd million barrels per dayNEB National Energy BoardOPEC Organization of Petroleum Exporting CountriesPADD Petroleum Administration for Defense DistrictR&D research and developmentROI return on investmentSAGD steam-assisted gravity drainageSCO synthetic crude oilSIRCA Scientific and Industrial Research Council of AlbertaUSGS United States Geological SurveyVAPEX Vapor Extraction Process