north american light vehicle production - autosteel/media/files/autosteel/great designs in...
TRANSCRIPT
North American Light Vehicle Production: A Decade of Change Within a Globally
Integrated Industry
Michael Robinet
Managing Director, IHS Automotive
Advisory Services Practice
May 14, 2014
© 2014 IHS

NA Production Update
1) Inserted Into a Global Framework
2) Changing With The Times
3) Summary
2

IHS Corporate Overview
3
• In business since 1959, we are a leading global source of information and expert
analysis in pivotal areas shaping today’s global business landscape
• Data and expertise from industry-specialized professionals enables innovative and
successful decision making
• Helping governments, multi-national organizations , regional companies and
technical professionals in more than 180 countries
• Approx. 8,000+ IHS colleagues in 140 offices located in 31 countries speaking 42
languages
• IHS customers include 80% of the Global Fortune 500, and nearly 70% of the US
Fortune 1,000
• IHS is a publically traded company on the NYSE under the “IHS” symbol
-1.0
0.0
1.0
2.0
3.0
4.0
5.0
6.0
7.0
8.0
9.0
World USA Japan EuroZone
Brazil Russia India China
2013 2014 2015 Avg 2016-2021
An
nu
al R
ea
l G
DP
Gro
wth
in
%
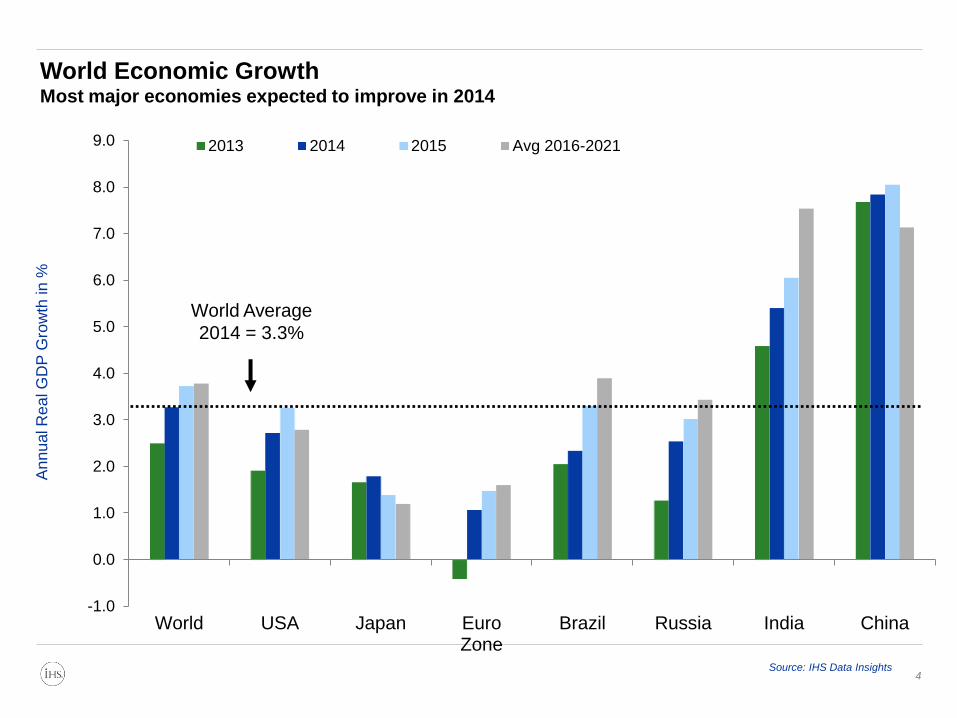
Source: IHS Data Insights
World Average
2014 = 3.3%
World Economic Growth Most major economies expected to improve in 2014
4

0.6
0.8
1.0
1.2
1.4
1.6
1.8
1998 2000 2002 2004 2006 2008 2010 2012 2014 20160.5
0.6
0.7
0.8
0.9
1.0
1.1
1.2
1998 2000 2002 2004 2006 2008 2010 2012 2014 2016
Canadian dollar Euro
Japanese yen Chinese renminbi
(Canadian dollars per US dollar, quarterly averages) (Euro per US dollar, quarterly averages)
(Yen per US dollar, quarterly averages)
4
5
6
7
8
9
1998 2000 2002 2004 2006 2008 2010 2012 2014 2016
(Yuan per US dollar, quarterly averages)
Exchange rates per US dollar
5
60
80
100
120
140
1998 2000 2002 2004 2006 2008 2010 2012 2014 2016
© 2014 IHS
IHS AUTOMOTIVE driven by POLK

© 2014 IHS 7
IHS AUTOMOTIVE driven by POLK
Global Production
(45%=C/E EU)
(65%=Mexico)

106
1.5
7.6
6.7
2.5 0.5 2.2
85
40
50
60
70
80
90
100
201
3 A B C D E
FF
202
1
Glo
ba
l LV
Pro
du
cti
on
(m
il)
7%
36%
32%
12%
10%
A
B
C
D
E
FF
106
2.5 2.4
1.2 1.0 1.0 0.9 0.9 0.7 0.6 0.6 9.0
85
40
50
60
70
80
90
100
201
3
Oth
er
202
1
Glo
bal LV
Pro
du
cti
on
(m
il)
Global Production Outlook
2013 – 2021: Market Growth
IHS AUTOMOTIVE driven by POLK
Variance By Global Segment Top 10 - Variance By OEM
© 2014 IHS 8

0.0
0.5
1.0
1.5
2.0
2.5
3.0
3.5
4.0
4.5
5.0
2010 2012 2014 2016 2018 2020
Weig
hte
d C
ad
en
ce (
Years
) Program Cadence
20%
40%
60%
80%
2000 2010 2020
Mu
lti R
egio
n S
har
e
Multi-Region Platforms
101
85
134
117 130
136
107 112
151
125
0
20
40
60
80
100
120
140
160
2010 2011 2012 2013 2014 2015 2016 2017 2018 2019
Lau
nch
Ev
en
t C
ou
nt
Global Launch Events
0 100,000 200,000 300,000 400,000 500,000
2010
2015
2020
Average Platform Volume (Over 50K/Year)
Faster, Greater Scale & Integrated Industry Pace and Risk Rises …

Global Segment Shifts Growing Smaller & Converging ….
A-Segment
B-Segment
C-Segment
D-Segment
Full-Size
Full-Frame
E-Segment
Mini/Compact
Full-Frame
6% 17%
25% 18%
10%
14%
10%
8%
22%
27%
17%
6%
12%
8%
6%
25%
30%
16%
6%
10%
7%
Global Production by Segment
1% 19%
22%
17%
17%
24%
2%
22%
33%
16%
6%
21%
6%
26%
35%
13%
4%
16%
NAFTA Production by Segment
2000 2010
2020
2000
2010
2020
• NAFTA begins to converge with global trends in the mid-segments (B, C & D)
• Greater than 60% of global volume is C-segment or smaller by 2020
• In NAFTA, more than 75% of volume is D-segment and smaller by 2020
10

© 2014 IHS 13
15
.8
15
.3
15
.1 12
.6
8.6
11
.9
13.1
15
.4
16
.2
16
.8
17
.3
17
.7
17
.8
18
.0
18.2
18
.2
0%
20%
40%
60%
80%
100%
0
4
8
12
16
20
2005 2010 2015 2020
Millio
ns
NA Production Underutilized Capacity % Utilization
IHS AUTOMOTIVE driven by POLK
16 vehicles
NA Light Vehicle Production
14
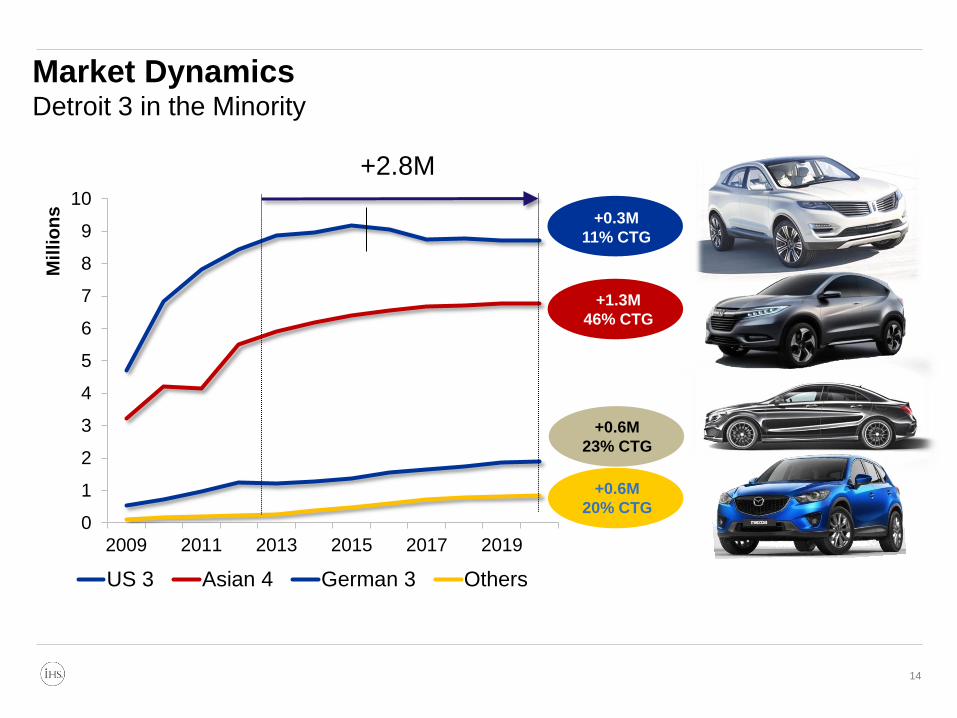
Market Dynamics Detroit 3 in the Minority
0
1
2
3
4
5
6
7
8
9
10
2009 2011 2013 2015 2017 2019
Mil
lio
ns
US 3 Asian 4 German 3 Others
+0.3M
11% CTG
+1.3M
46% CTG
+0.6M
23% CTG
+0.6M
20% CTG
+2.8M

30
43
24 23
20 19 19
25
17
43
33
37
35
39 37
32
0
10
20
30
40
50
2005 2007 2009 2011 2013 2015 2017 2019
North American Program Launches
15 Source: IHS Automotive Light Vehicle Production Forecast
Market Dynamics Launch Activity Surges, Investment & Competition Too

NAFTA Output By Region Shifting Towards the US South & Mexico
19
2.3
1.9
1.3
1.3
0.9
0.6
0.7
0.7
0.9
0.9
0
1
2
3
4
2000 2005 2010 2015 2020
Mill
ion
s Canada 2.9
2.6
1.9 2.2
1.8
6.5
5.7
3.3
5.2
5.1
1.3
1.2
1.2
1.5
1.6
0
1
2
3
4
5
6
7
8
9
2000 2005 2010 2015 2020
Mill
ion
s Mid West 7.8 6.9
4.5
6.8 6.7
1.9
1.7
0.4
0.8
0.9
1.0
2.0
1.9
3.5
3.6
0
1
2
3
4
5
2000 2005 2010 2015 2020
Mill
ion
s South East
2.9
3.7
2.3
4.4 4.6
1.0
1.5
2.8
2.7
2.3
3.4
4.2
2.4
2.7
3.8
0
2
4
6
8
10
2000 2005 2010 2015 2020
x 1
00
00
0 South West & CA
440K
570K 520K 550K
610K
1.1
0.9
1.2
1.6
1.8
0.8
0.7
1.1
1.8
2.6
0
1
2
3
4
5
2000 2005 2010 2015 2020
Mill
ion
s Mexico
18%
38% 20%
5%
19%
13%
39% 25%
3%
20%
10%
37%
25%
4%
24%
Share by Region
2020
2015
2010
US Midwest
US Southeast
US SW
& CA
Detroit 3
Non-Domestic
4.0
0
1
2
3
4
5
2000 2005 2010 2015 2020
x 1
00
00
0 North East
40K
400K
Over 50% of NA output will be
south of Ohio by 2014
1.9 1.6
2.3
3.3
4.4
Mexican production growth is one of the
fastest through the balance of the decade –
rivaling Brazil, Russia and India

© 2014 IHS 20
IHS AUTOMOTIVE driven by POLK
LV Production Locational Analysis 2013-16 Change
20
+750-1,000
+500-750
+250-500
+100-250
-100-100
-100-250
-250-500
-500-750
-750-1000
(Thousands)
Cambridge
Detroit
Columbus
Georgetown Kansas
City
Greenville Chattanooga
Montgomery Canton Arlington
Hermosillo
Monterrey
Queretaro
Puebla
1, 2 & 4 hour
logistics circles

© 2014 IHS 21
IHS AUTOMOTIVE driven by POLK
LV Production Locational Analysis 2016-20 Change
21
Cambridge
Detroit
Columbus
Georgetown Kansas
City
Greenville Chattanooga
Montgomery Canton Arlington
Hermosillo
Monterrey
Queretaro
Puebla
+750-1,000
+500-750
+250-500
+100-250
-100-100
-100-250
-250-500
-500-750
-750-1000
(Thousands)
1, 2 & 4 hour
logistics circles

NA Production Update
1) Inserted Into a Global Framework
2) Changing With The Times
3) Summary
22

We Too Can Change ..
© 2014 IHS 23
IHS AUTOMOTIVE driven by POLK

Efficiency Tradeoffs Shift Over Time
• Efficiency gains emanate from several sources with a cost:
• Lightweighting costs $80-180 per 1% FE increase
• Diesel technology costs $130 per 1% FE increase
• Hybrid powertrains cost $110-220 per 1% FE improvement
• Fuel economy regulations stiffen by 5% per year after 2015MY
• Each cycle will need to reach gains of 20-25% by the end of the cycle
• Every OEM has mass reduction goals averaging 3-5% per year
depending upon CAFE credits, current vehicle mass, supplier affiliations
and capital infrastructure
© 2014 IHS 24
Propulsion
• Hybrids, Electrics
• Boosting & Valve Technology
• Transmission & Driveline
Weight
• BIW & Closures
• Build Process
• Joining and corrosion
• Safety & Tradeoffs
Parasitics
• Aerodynamics
• Rolling Resistance
• Energy/Thermal Management

Powertrain Technology Trends
25
• VVT almost standard on any new engine; many migrating to advanced designs
• GDI and gas boosting both ramp up quickly. The initial rollout is being led by American and
German manufacturers, although the others aren’t far behind
• Stop/Start technology growing, helped by CAFE off-cycle credits
• Diesel and Hybrid/EV still relatively low-volume players in North American market, though
Hybrids gain traction late in the decade
0
2
3
5
6
8
10
11
13
14
16
18
2006 2007 2008 2009 2010 2011 2012 2013 2014 2015 2016 2017 2018 2019 2020
Un
its (
Mill
ion
s)
Variable Valve Timing
Gas Direct Injection
E85
Gas Boosted
Cylinder Deactivation
Diesel
Hybrid/EV
Stop/Start
AdvancedTransmissions*
North American Installations
* 6+ Speed/CVT/DCT/EV
Source: IHS Automotive Powertrain and Component Forecasts

Massive Structural Change Through 2025
Development Production Aftermarket
26
Development Production Aftermarket
2014 2017 2022 2027
Technologies required to meet
FE gains due for the 2025 period
are required to be tested, cost
proven and design integrated by
the 2017-19 timeframe.
Vehicle Cycle 1
Vehicle Cycle 2
Vehicle design cycles
starting in 2013 have
less than 2 cycles to
comply with the 2025
NHTSA standards – an
increase of over 45%
from 2016 levels.
US Fuel Economy/Emission Standards 2025
FE standards stiffen by 45% from 2016 to 2025
Mid-Cycle Review is gearing to be a
substantial battle with OEMs and
suppliers on both sides

New Platform Concepts
27
Vehicle Height
Vehicle Ride
Height
EMP2
“Advanced modularity allows for
new combinations: Four different
track widths; Five wheelbases;
Two cockpit and cowl solutions;
Two rear suspension
architectures”
•2020 scale: 1.7 million units
•2020 program count: 50+
MQB A/B
“One of the prominent
characteristics of the Modular
Transverse Matrix is the uniform
mounting position of ALL engines.
Assembly kit allows for synergies
between all vehicle classes”
•2020 scale: 5.6 million units
•2020 program count: 130+
CMF1
“Common Module Family is based
on the assembly of compatible
Big Modules: engine bay, cockpit,
front underbody, rear underbody
and electrical/electronic
architecture”
•2020 scale: 1.7 million units
•2020 program count: 50+

Mass Distribution and System Pressures
40
24
16
15
5
Body
Chassis
Powertrain
Interior
Electrical65 9
7
8
1 10
Conventional Steel
High/Medium Strength Steel
Polymer/Composite
Aluminum
Magnesium
Other
Vehicle Composition by Material
Source = Oak Ridge National Library Source = Oak Ridge National Library
Vehicle System Weight Distribution
•Pressure for weight reduction is slated to focus on body and structure first as aluminum,
advanced high strength steels and lighter forgings begin to penetrate the body and structure
•Second focal point will be chassis/suspension with a material shift towards New steel
forming processes, aluminum and new drive designs.

A Decade of Structural Change Emerges
Regulations
Safety
Consumers
Product Design
Manufacturing
© 2014 IHS 29
• A & B segment • Steel
Intensive
• C & D & FF
segment • Steel and
Aluminum
• D, E segment • Aluminum
intensive
• Forming
• Recycling
• Joining
• Durability
• Multi-material
construction
What Impacts Material
Substitution?
• OEM capital & supplier
infrastructure
• Efficiency of other FE
measures
• Competition & CAFE credits
• Cost and engineering
capability
• Vehicle vocation/durability
• Cadence & tooling
• Platform cycle position
• Global production and supply
• Safety compliance

NA Production Update
1) Inserted Into a Global Framework
2) Changing With The Times
3) Summary
30

© 2014 IHS 31
Vehicle Efficiency
Relative Costs/ Risk Mitigation
Global Integration
Logistics Pressures
Skills & Supplier
Capability/ Capacity
Currency Stability
• Material shifts have long-
term impacts: build
process, durability, safety,
internal skills,
infrastructure, warranty
and speed to market
• Each OEM has an
implementation path
dependent on platform
cadence, credits, supplier
capability and capital
• Supply base requires a
healthy regional industry –
think clusters
• Not business as usual …
IHS AUTOMOTIVE driven by POLK
The Decade of Challenges ….
© 2014 IHS
Thank You
Michael Robinet
Managing Director, IHS Automotive
Advisory Services

w w w . a u t o s t e e l . o r g
North American
Light Vehicle Metallic Material Trends
Great Designs in Steel is Sponsored by:
Use your web-enabled device to download the presentations from today’s event
PRESENTATIONS WILL BE AVAILABLE MAY 16