north american industrial highlights 4q-12
DESCRIPTION
Colliers International North American Industrial Real Estate ReportTRANSCRIPT
HIGHLIGHTSNORTH AMERICA
WWW.COLLIERS.COM
Q4 2012 | INDUSTRIAL
N.A. INDUSTRIAL MARKETSUMMARY STATISTICS, Q4 2012
Industrial Measures are in a Near-Perfect V Formation.
Sq. Ft. By Region
4.00000000
2.00000000
4.00000000
Occupied SF
Vacant SF
Absorption Per Market (SF)q3 '12 - q4 '12
3,000,000
1,500,000
300,000-300,000
-1,500,000
-3,000,000
4 billion
2 billion
400 mil
Occupied Sq. Ft.
Vacant Sq. Ft.
US Q4
2012
US Q1
2013*
Canada Q4
2012
Canada Q1
2013*
VACANCY
NET ABSORPTION
CONSTRUCTION
RENTAL RATE**
*Projected, relative to prior period**Warehouse rents
MARKET INDICATORSRelative to prior period
US CAN NA
VACANCY RATE 8.92 4.25 8.42
Change from Q3 2012 (%) -0.31 -0.24 -0.30
ABSORPTION (MSF) 64.0 6.9 70.9
NEW CONSTRUCTION (MSF) 24.0 3.7 27.7
UNDER CONSTRUCTION (MSF) 56.0 14.1 70.1
ASKING RENTS PER SF (USD/CAD) US CAN
Average Warehouse/Distribution Center
4.82 7.55
Change from Q3 2012 (%) 1.07 0.66
K.C. CONWAY EMD | Market Analytics
Key Takeaways
• Q4 was the best quarter for industrial warehouse property transactions since Q3 2007. Industrial warehouse property transactions were up 4% in 2012 to $36.9 billion. Approximately 37% of these transactions ($13.5 billion) occurred in Q4 2012
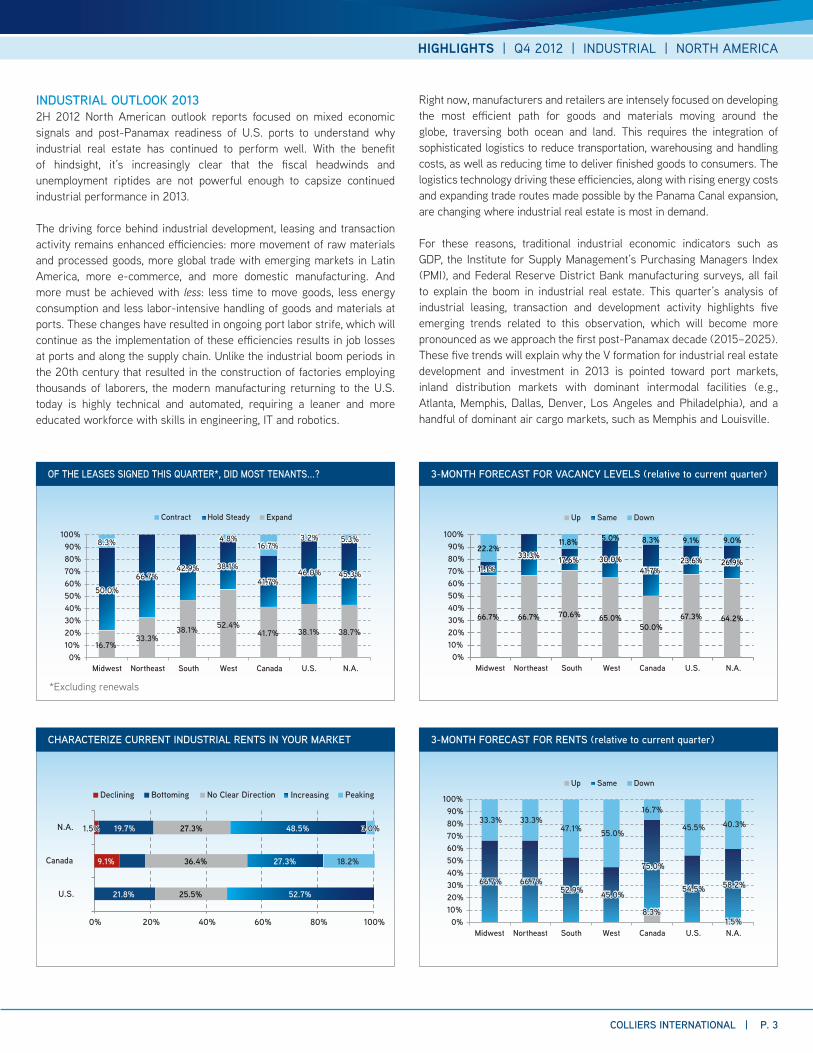
• 2012 net absorption in Colliers’ 75 primary North American industrial markets surpassed 160 million square feet. 70.9 MSF were absorbed in Q4, or 40% of the 2012 total. Approximately 90% of Q4 leasing activity occurred in the U.S.
• 30% of Q4 North American net absorption occurred in just five MSAs: Toronto (4.95 MSF), Detroit (4.7 MSF), Los Angeles – Inland Empire (4.4 MSF), Dallas/Ft. Worth (3.2 MSF), and Memphis (2.9 MSF). All five markets are home to the nation’s busiest intermodal rail operations, with the exception of Chicago.
• The North American industrial vacancy rate dropped 30 basis points in Q4 to end 2012 below 9.0%. The North American vacancy rate ended 2012 at 8.42%, and the U.S. vacancy rate at 8.92%.
• Ten major North American markets have vacancy rates at or below 6.5 percent. Montreal (4.3%) and Calgary (5.0%) in Canada; Orange County, CA (4.9%), Omaha (5.1%), Houston (5.2%), Indianapolis (5.3%), Long Island, NY (5.6%), Seattle (5.8%), Los Angeles – Inland Empire (6.5%) and Milwaukee (6.5%) in the U.S.
NORTH AMERICAN INDUSTRIAL VACANCY, INVENTORY AND ABSORPTION | Q4 2012

P. 2 | COLLIERS INTERNATIONAL
HIGHLIGHTS | Q4 2012 | INDUSTRIAL | NORTH AMERICA
• Post-Panamax readiness progresses on the East Coast: Baltimore joined Norfolk, VA, as the only other post-Panamax port on the East Coast in 2012. New York is progressing with project to raise the Bayonne Bridge 60 feet. Miami has ordered new post-Panamax cranes. Charleston is on track as well.
Port of Baltimore has deployed new PPMX cranes Photo: dol.gov
• Four of the top 5 U.S. cities for in investment were port cities, according to AFIRE (the Association for Foreign Investment in Real Estate): New York, San Francisco, Houston and Boston. Houston was also in the top five globally for the first time.
• Recovery in housing is an overlooked industrial demand driver that will gain additional traction in 2013.
WHAT DO NATURE AND PHYSICS TELL US ABOUT THE “V FORMATION,” AND HOW DOES IT APPLY TO INDUSTRIAL REAL ESTATE? Geese are iconic North American birds, most often seen migrating in a signature V formation. This is no accident: the formation is more aerodynamically efficient, reducing the energy the geese expend in flight by as much as 50 percent. This is analogous to what’s happening in North American industrial real estate with the growth in e-commerce and the expansion of the Panama Canal lock system. Just as Mother Nature aided geese in configuring their flight, so too is “Mother Intermodal” guiding distributors, producers, retailers and suppliers to re-engineer their supply chains.
The driving force behind demand for industrial real estate as we approach the first post-Panamax decade (2015–2025) is efficiency: reduced cost, handling, and time. Several factors are forcing rapid evolution, eliminating the traditional choke points and “drag” in the system. Container ships two or three times the size of those in service today will soon make regular calls on North American ports, and not just on the West Coast. New hours-worked rules for over-the-road truck freight carriers will shift freight to intermodal and rail. Increasing demand for same-day delivery of goods purchased online will force more collaboration between air cargo and ocean container distribution in both port and air cargo markets, such as Memphis (FedEx) and Louisville (UPS).
The effects of this natural streamlining process are already visible. This report examines key Q4 2012 metrics pertaining to absorption, vacancy, rail carload volume and intermodal traffic, which define the new V formation driving the future demand for North American industrial real estate, and provide the real definition of INTERMODAL: Industrial Now Turns Especially to Rail to Move Ocean Distribution Across Land.
Existing Bayonne Bridge to be raised 60 feet by 2015 Photo: Ines Hegedus-Garcia
Geese migrating in their iconic “V formation” use significantly less energy than flying solo
HIGHLIGHTS | Q4 2012 | INDUSTRIAL | NORTH AMERICA
COLLIERS INTERNATIONAL | P. 3
INDUSTRIAL OUTLOOK 20132H 2012 North American outlook reports focused on mixed economic signals and post-Panamax readiness of U.S. ports to understand why industrial real estate has continued to perform well. With the benefit of hindsight, it’s increasingly clear that the fiscal headwinds and unemployment riptides are not powerful enough to capsize continued industrial performance in 2013.
The driving force behind industrial development, leasing and transaction activity remains enhanced efficiencies: more movement of raw materials and processed goods, more global trade with emerging markets in Latin America, more e-commerce, and more domestic manufacturing. And more must be achieved with less: less time to move goods, less energy consumption and less labor-intensive handling of goods and materials at ports. These changes have resulted in ongoing port labor strife, which will continue as the implementation of these efficiencies results in job losses at ports and along the supply chain. Unlike the industrial boom periods in the 20th century that resulted in the construction of factories employing thousands of laborers, the modern manufacturing returning to the U.S. today is highly technical and automated, requiring a leaner and more educated workforce with skills in engineering, IT and robotics.
0%10%20%30%40%50%60%70%80%90%
100%
Midwest Northeast South West Canada U.S. N.A.
ExpandHold SteadyContract
16.7% 33.3%
38.1% 52.4% 41.7% 38.1% 38.7%
50.0% 66.7%
42.9% 38.1%
41.7% 46.0% 45.3%
8.3% 4.8% 16.7%
3.2% 5.3%
50.0% 66.7%
42.9% 38.1%
41.7% 46.0% 45.3%
8.3% 4.8% 16.7%
3.2% 5.3%
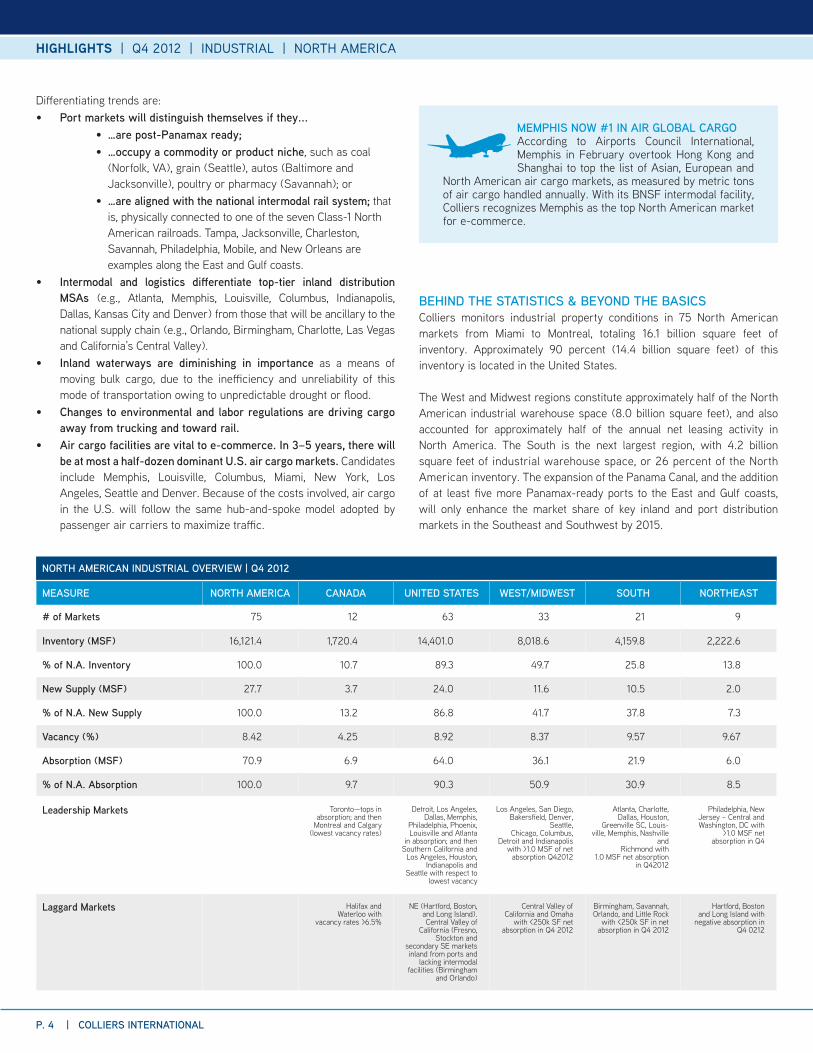
OF THE LEASES SIGNED THIS QUARTER*, DID MOST TENANTS...?
3
0% 20% 40% 60% 80% 100%
U.S.
Canada
N.A.
Declining Bottoming No Clear Direction Increasing Peaking
9.1%
1.5% 3.0%
21.8%
19.7%
25.5%
36.4%
27.3%
52.7%
27.3%
48.5%
18.2%
1.5% 3.0%
CHARACTERIZE CURRENT INDUSTRIAL RENTS IN YOUR MARKET
0%10%20%30%40%50%60%70%80%90%
100%
Midwest Northeast South West Canada U.S. N.A.
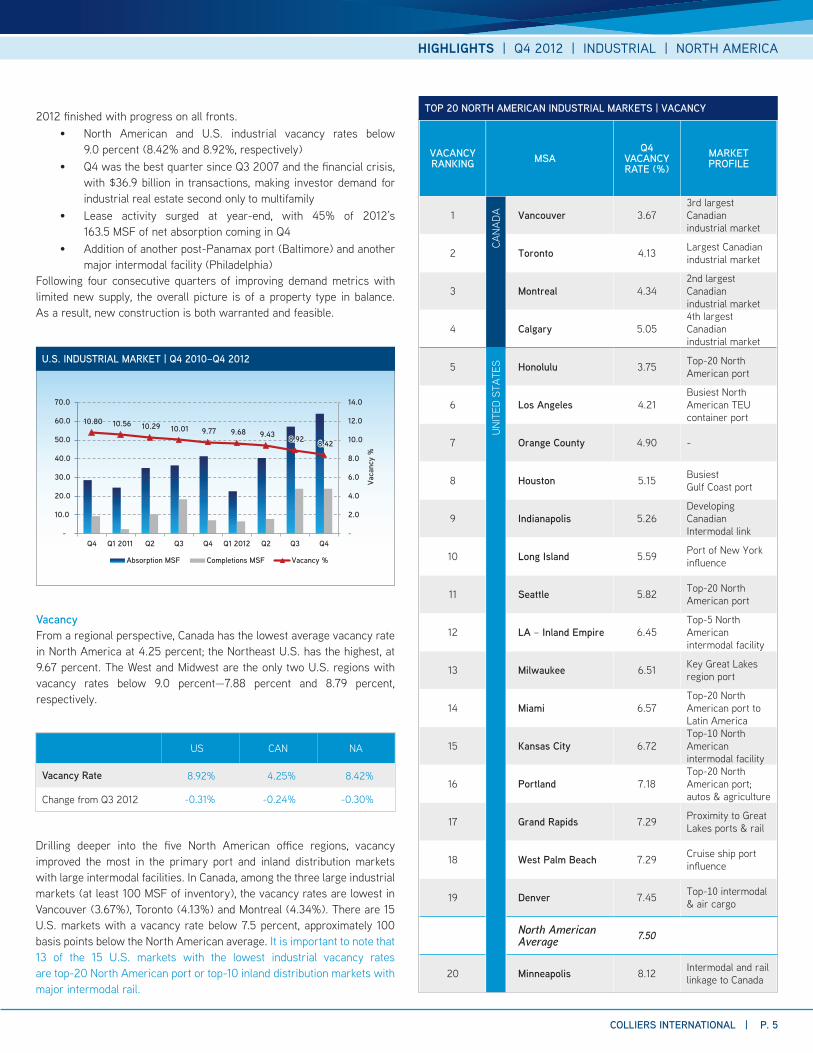
DownSameUp
66.7% 66.7% 70.6% 65.0% 50.0%
67.3% 64.2%
11.1%
33.3% 17.6% 30.0% 41.7%
23.6% 26.9%
22.2% 11.8% 5.0% 8.3% 9.1% 9.0%
11.1%
33.3% 17.6% 30.0% 41.7%
23.6% 26.9%
3-MONTH FORECAST FOR VACANCY LEVELS (relative to current quarter)
8.3% 1.5% 1.5%
66.7% 66.7% 52.9% 45.0%
75.0%
54.5% 58.2%66.7% 66.7%52.9% 45.0%
75.0%
8.3%
54.5% 58.2%
33.3% 33.3% 47.1% 55.0%
16.7%
45.5% 40.3%
0%10%20%30%40%50%60%70%80%90%
100%
Midwest Northeast South West Canada U.S. N.A.
DownSameUp
3-MONTH FORECAST FOR RENTS (relative to current quarter)
Right now, manufacturers and retailers are intensely focused on developing the most efficient path for goods and materials moving around the globe, traversing both ocean and land. This requires the integration of sophisticated logistics to reduce transportation, warehousing and handling costs, as well as reducing time to deliver finished goods to consumers. The logistics technology driving these efficiencies, along with rising energy costs and expanding trade routes made possible by the Panama Canal expansion, are changing where industrial real estate is most in demand.
For these reasons, traditional industrial economic indicators such as GDP, the Institute for Supply Management’s Purchasing Managers Index (PMI), and Federal Reserve District Bank manufacturing surveys, all fail to explain the boom in industrial real estate. This quarter’s analysis of industrial leasing, transaction and development activity highlights five emerging trends related to this observation, which will become more pronounced as we approach the first post-Panamax decade (2015–2025). These five trends will explain why the V formation for industrial real estate development and investment in 2013 is pointed toward port markets, inland distribution markets with dominant intermodal facilities (e.g., Atlanta, Memphis, Dallas, Denver, Los Angeles and Philadelphia), and a handful of dominant air cargo markets, such as Memphis and Louisville.
*Excluding renewals
P. 4 | COLLIERS INTERNATIONAL
HIGHLIGHTS | Q4 2012 | INDUSTRIAL | NORTH AMERICA
NORTH AMERICAN INDUSTRIAL OVERVIEW | Q4 2012
MEASURE NORTH AMERICA CANADA UNITED STATES WEST/MIDWEST SOUTH NORTHEAST
# of Markets 75 12 63 33 21 9
Inventory (MSF) 16,121.4 1,720.4 14,401.0 8,018.6 4,159.8 2,222.6
% of N.A. Inventory 100.0 10.7 89.3 49.7 25.8 13.8
New Supply (MSF) 27.7 3.7 24.0 11.6 10.5 2.0
% of N.A. New Supply 100.0 13.2 86.8 41.7 37.8 7.3
Vacancy (%) 8.42 4.25 8.92 8.37 9.57 9.67
Absorption (MSF) 70.9 6.9 64.0 36.1 21.9 6.0
% of N.A. Absorption 100.0 9.7 90.3 50.9 30.9 8.5
Leadership Markets Toronto—tops in absorption; and then
Montreal and Calgary (lowest vacancy rates)
Detroit, Los Angeles, Dallas, Memphis,
Philadelphia, Phoenix, Louisville and Atlanta
in absorption; and then Southern California and
Los Angeles, Houston, Indianapolis and
Seattle with respect to lowest vacancy
Los Angeles, San Diego, Bakersfield, Denver,
Seattle, Chicago, Columbus,
Detroit and Indianapolis with >1.0 MSF of net
absorption Q42012
Atlanta, Charlotte, Dallas, Houston,
Greenville SC, Louis-ville, Memphis, Nashville
and Richmond with
1.0 MSF net absorption in Q42012
Philadelphia, New Jersey – Central and Washington, DC with
>1.0 MSF net absorption in Q4
Laggard Markets Halifax and Waterloo with
vacancy rates >6.5%
NE (Hartford, Boston, and Long Island). Central Valley of
California (Fresno, Stockton and
secondary SE markets inland from ports and
lacking intermodal facilities (Birmingham
and Orlando)
Central Valley of California and Omaha
with <250k SF net absorption in Q4 2012
Birmingham, Savannah, Orlando, and Little Rock
with <250k SF in net absorption in Q4 2012
Hartford, Boston and Long Island with
negative absorption in Q4 0212
Differentiating trends are:• Port markets will distinguish themselves if they...
• …are post-Panamax ready; • …occupy a commodity or product niche, such as coal
(Norfolk, VA), grain (Seattle), autos (Baltimore and Jacksonville), poultry or pharmacy (Savannah); or
• …are aligned with the national intermodal rail system; that is, physically connected to one of the seven Class-1 North American railroads. Tampa, Jacksonville, Charleston, Savannah, Philadelphia, Mobile, and New Orleans are examples along the East and Gulf coasts.
• Intermodal and logistics differentiate top-tier inland distribution MSAs (e.g., Atlanta, Memphis, Louisville, Columbus, Indianapolis, Dallas, Kansas City and Denver) from those that will be ancillary to the national supply chain (e.g., Orlando, Birmingham, Charlotte, Las Vegas and California’s Central Valley).
• Inland waterways are diminishing in importance as a means of moving bulk cargo, due to the inefficiency and unreliability of this mode of transportation owing to unpredictable drought or flood.
• Changes to environmental and labor regulations are driving cargo away from trucking and toward rail.
• Air cargo facilities are vital to e-commerce. In 3–5 years, there will be at most a half-dozen dominant U.S. air cargo markets. Candidates include Memphis, Louisville, Columbus, Miami, New York, Los Angeles, Seattle and Denver. Because of the costs involved, air cargo in the U.S. will follow the same hub-and-spoke model adopted by passenger air carriers to maximize traffic.
BEHIND THE STATISTICS & BEYOND THE BASICSColliers monitors industrial property conditions in 75 North American markets from Miami to Montreal, totaling 16.1 billion square feet of inventory. Approximately 90 percent (14.4 billion square feet) of this inventory is located in the United States. The West and Midwest regions constitute approximately half of the North American industrial warehouse space (8.0 billion square feet), and also accounted for approximately half of the annual net leasing activity in North America. The South is the next largest region, with 4.2 billion square feet of industrial warehouse space, or 26 percent of the North American inventory. The expansion of the Panama Canal, and the addition of at least five more Panamax-ready ports to the East and Gulf coasts, will only enhance the market share of key inland and port distribution markets in the Southeast and Southwest by 2015.
MEMPHIS NOW #1 IN AIR GLOBAL CARGOAccording to Airports Council International, Memphis in February overtook Hong Kong and Shanghai to top the list of Asian, European and
North American air cargo markets, as measured by metric tons of air cargo handled annually. With its BNSF intermodal facility, Colliers recognizes Memphis as the top North American market for e-commerce.
HIGHLIGHTS | Q4 2012 | INDUSTRIAL | NORTH AMERICA
COLLIERS INTERNATIONAL | P. 5
2012 finished with progress on all fronts.• North American and U.S. industrial vacancy rates below
9.0 percent (8.42% and 8.92%, respectively)• Q4 was the best quarter since Q3 2007 and the financial crisis,
with $36.9 billion in transactions, making investor demand for industrial real estate second only to multifamily
• Lease activity surged at year-end, with 45% of 2012’s 163.5 MSF of net absorption coming in Q4
• Addition of another post-Panamax port (Baltimore) and another major intermodal facility (Philadelphia)
Following four consecutive quarters of improving demand metrics with limited new supply, the overall picture is of a property type in balance. As a result, new construction is both warranted and feasible.
10.80 10.56 10.29 10.01 9.77 9.68 9.43 8.92 8.92 8.42
-
2.0
4.0
6.0
8.0
10.0
12.0
14.0
-
10.0
20.0
30.0
40.0
50.0
60.0
70.0
Q4 Q1 2011 Q2 Q3 Q4 Q1 2012 Q2 Q3 Q4
Vaca
ncy
%
Absorption MSF Completions MSF Vacancy %
8.42
U.S. INDUSTRIAL MARKET | Q4 2010–Q4 2012
VacancyFrom a regional perspective, Canada has the lowest average vacancy rate in North America at 4.25 percent; the Northeast U.S. has the highest, at 9.67 percent. The West and Midwest are the only two U.S. regions with vacancy rates below 9.0 percent—7.88 percent and 8.79 percent, respectively.
US CAN NA
Vacancy Rate 8.92% 4.25% 8.42%
Change from Q3 2012 -0.31% -0.24% -0.30%
Drilling deeper into the five North American office regions, vacancy improved the most in the primary port and inland distribution markets with large intermodal facilities. In Canada, among the three large industrial markets (at least 100 MSF of inventory), the vacancy rates are lowest in Vancouver (3.67%), Toronto (4.13%) and Montreal (4.34%). There are 15 U.S. markets with a vacancy rate below 7.5 percent, approximately 100 basis points below the North American average. It is important to note that 13 of the 15 U.S. markets with the lowest industrial vacancy rates are top-20 North American port or top-10 inland distribution markets with major intermodal rail.
VACANCY RANKING MSA
Q4 VACANCY RATE (%)
MARKET PROFILE
1
CANA
DA Vancouver 3.673rd largest Canadian industrial market
2 Toronto 4.13 Largest Canadian industrial market
3 Montreal 4.342nd largest Canadian industrial market
4 Calgary 5.054th largest Canadian industrial market
5
UNI
TED
STAT
ES Honolulu 3.75 Top-20 North American port
6 Los Angeles 4.21Busiest North American TEU container port
7 Orange County 4.90 -
8 Houston 5.15 Busiest Gulf Coast port
9 Indianapolis 5.26Developing Canadian Intermodal link
10 Long Island 5.59 Port of New York influence
11 Seattle 5.82 Top-20 North American port
12 LA – Inland Empire 6.45Top-5 North American intermodal facility
13 Milwaukee 6.51 Key Great Lakes region port
14 Miami 6.57Top-20 North American port to Latin America
15 Kansas City 6.72Top-10 North American intermodal facility
16 Portland 7.18Top-20 North American port; autos & agriculture
17 Grand Rapids 7.29 Proximity to Great Lakes ports & rail
18 West Palm Beach 7.29 Cruise ship port influence
19 Denver 7.45 Top-10 intermodal & air cargo
North American Average 7.50
20 Minneapolis 8.12 Intermodal and rail linkage to Canada
TOP 20 NORTH AMERICAN INDUSTRIAL MARKETS | VACANCY

P. 6 | COLLIERS INTERNATIONAL
HIGHLIGHTS | Q4 2012 | INDUSTRIAL | NORTH AMERICA
AbsorptionThe final tally on 2012 net industrial absorption was not in the cards at mid-2012, when it appeared that retailers and manufacturers were pulling back from warehouse leasing activity and capital expenditures for supply-chain makeover. However, despite the market’s anxiety over the November 2012 election and the Fiscal Cliff, net industrial absorption had its best performance in 2012 since the 2008–2009 financial crisis, and Q4 net absorption accounted for 45 percent of aggregate 2012 net leasing activity.
Which markets outperformed and why? As was revealed by the year-end vacancy statistics, there is another strong correlation to port and intermodal markets with two wrinkles: Detroit (influenced by the auto recovery), and Phoenix (influenced by the housing recovery). The fiscal headwinds and unemployment riptides are not powerful enough to capsize continued industrial performance because development and leasing activity is fueled by distributors, manufacturers, retailers and shippers who need to re-engineer their supply chain to gain efficiencies required in the post-Panamax era, just two years away. Eight of the top ten U.S. markets for both Q4 and CY 2012 absorption were top-ten North American port or intermodal industrial markets.
Looking forward to 2013, the only brake on industrial leasing activity in key port and intermodal markets will be the delayed delivery of new space under construction: Los Angeles, Houston, Seattle and Memphis can’t complete new space fast enough to keep pace with demand. Market forces will see disproportionately higher 2H 2013 net leasing activity than 1H 2013, as was the case in 2012.
Construction ActivityThere is no change from the prior North American Outlook report. Bottom line: there remains a dearth of new speculative warehouse development. Construction activity is still subdued, and predominantly driven by owner-users expanding e-commerce capabilities by redeveloping their supply chain. National retailers such as Amazon, Family Dollar, FedEx, Home Depot, Lowes, Publix, Target, Tractor Supply and Whole Foods are constructing in excess of 9.0 MSF of modern distribution and logistics centers from coast to coast. These new centers account for approximately 30 percent of the 32 MSF of new warehouse construction under way at year-end 2012. Another 30 percent of this total is for modern parts and distribution centers for manufacturers, such as Boeing, Volkswagen and Whirlpool.
-0.5 0.0 0.5 1.0 1.5 2.0 2.5 3.0 3.5 4.0 4.5 5.0 5.5
Winnipeg, MB Halifax, NS Calgary, AB
Montréal, QC Victoria, BC
Ottawa, ON Waterloo Region, ON
Saskatoon, SK Regina, SK
Edmonton, AB Vancouver, BC
Toronto, ON
Millions
ABSORPTION (SF) | CANADIAN MARKETS | Q4 2012
0.0 2.0 4.0 6.0 8.0
Savannah, GA
New Jersey - Northern
New Jersey - Central
Indianapolis, IN
Atlanta, GA
Los Angeles, CA
Dallas-Ft. Worth, TX
Los Angeles - Inland Empire, CA
Detroit, MI
Chicago, IL
Millions
ABSORPTION (SF) | SELECT U.S. MARKETS | Q4 2012
MSA Q4 2012 (MSF) MSA CY 2012 (MSF)
1Chicago
(Intermodal)7.006 Chicago
13.438 (Intermodal)
2Detroit (Auto +
Housing)4.685
Dallas/ Ft. Worth
9.728(Intermodal)
3Los Angeles– Inland Empire (Intermodal)
4.405 Detroit9.169
(Auto-recovery)
4Dallas/
Ft. Worth(Intermodal)
3.223Los Angeles–Inland Empire
8.470(Intermodal)
5Memphis
(Intermodal)2.905
Los Angeles–Coastal
8.375 (Port)
6Philadelphia
(Port + Intermodal)
2.900 Atlanta7,400
(Intermodal)
7Phoenix
(Housing)2.519 Houston
6.245 (Port)
8Los Angeles
(Port)2.235 Phoenix
5.137 (Housing Recovery)
9Louisville
(Air Cargo)2.227 Columbus
4.916 (Air Cargo)
10Richmond
(Port)2.223 Seattle
3.916 (Port)
TOP 10 U.S. INDUSTRIAL MARKETS | ABSORPTION

HIGHLIGHTS | Q4 2012 | INDUSTRIAL | NORTH AMERICA
COLLIERS INTERNATIONAL | P. 7
The 5 states with the most warehouse construction under way, along with their largest distribution or logistics project: BURGEONING OPPORTUNITY IN
DISTRIBUTION FOR HEALTHCARE United Parcel Service (UPS) has jumped out as a leader in developing a healthcare distribution
network. Approximately 6.0 MSF of distribution space is dedicated to healthcare distribution in the U.S., Canada and Europe, and UPS is adding 800,000 SF more in 2013—the largest portion in Atlanta. In the U.S., UPS is focused on growing this distribution niche in Atlanta, Louisville, Mira Loma, CA and Reno. In light of the aging U.S. population and a rapidly growing healthcare industry, healthcare distribution is certainly a niche to monitor. However, its higher regulatory scrutiny and unique design requirements (such as temperature-controlled facilities) are steep barriers to entry for those lacking capital and knowledge of the healthcare industry.
ENGINEERING NEWS-RECORD’S CONSTRUCTION COST INDEX
YEAR JAN FEB MAR APR MAY JUN JUL AUG SEP OCT NOV DEC AVG
2013 9437 9453 NOTE: CONSTRUCTION COSTS NEVER DROPPED POST-2007 & ARE RISING AT A FASTER PACE.
2012 9176 9198 9268 9273 9290 9291 9324 9351 9341 9376 9398 9412 9308
2011 8938 8998 9011 9027 9035 9053 9080 9088 9116 9147 9173 9172 9070
2010 8660 8672 8671 8677 8761 8055 8844 8837 8836 8921 8951 8952 8799
2009 8549 8533 8534 8528 8574 8578 8566 8564 8586 8596 8592 8641 8570
2008 8090 8094 8109 8112 8141 8185 8293 8362 8557 8623 8602 8551 8310
2007 7880 7880 7856 7865 7942 7939 7959 8007 8050 8045 8092 8089 7966
2006 7660 7689 7692 7695 7691 7700 7721 7722 7763 7883 7911 7888 7751
2005 7297 7298 7309 7355 7398 7415 7422 7479 7540 7563 7630 7647 7446
2004 6825 6862 6957 7017 7065 7109 7126 7188 7298 7314 7312 7308 7115
2003 6581 6640 6627 6635 6642 6694 6695 6733 6741 6771 6794 6782 6694
2002 6462 6462 6502 6480 6512 6532 6605 6592 6589 6579 6578 6563 6538
2001 6281 6272 6279 6286 6288 6318 6404 6389 6391 6397 6410 6390 6343
2000 6130 6160 6202 6201 6233 6238 6225 6233 6224 6259 6266 6283 6221
INDEX METHODOLOGY: 200 hours of common labor at the 20-city average of common labor rates, plus 25 cwt of standard structural steel shapes at the mill price prior to 1996 and the fabricated 20-city price from 1996, plus 1.128 tons of portland cement at the 20-city price, plus 1,088 board-ft of 2x4 lumber at the 20-city price.
However, rising construction costs are a concern that spans all commercial property types. It may surprise many to learn that construction costs never actually declined during the 2008–2009 financial crisis and the ensuing recession. As documented by ENR Construction, costs have risen 17% since the end of 2007, and are up over 5.0 percent since February 2011. Investors and developers considering new construction investments should budget construction cost increases at double the CPI for 2013 and 2014, due to pressures on labor and materials.
STATETOTAL NEW
CONSTRUCTION UNDERWAY (MSF)
LARGEST DISTRIBUTION/LOGISTICS PROJECT U/C
1 Georgia 3.4 1.4 MSF by Lowes
2 Tennessee 1.8 1.0 MSF by Amazon
3 Ohio 1.7 800k SF by Rubbermaid ; 400k by Target
4/5 California 1.5 300,000 SF by Chino
4/5 Arizona 1.5 600,000 SF by Estrela Logistics
Capital for new construction is scarce, as banks remain on the sidelines unless the warehouse project is a build-to-suit for owner occupancy or is pre-leased to ensure break-even debt service. The risk of overbuilding is low, given the scarcity of debt capital for speculative construction and the limited degree of speculative warehouse construction under way at year-end 2012 (less than 10 MSF), so prospects for further improvement in both vacancy and rental rates remain favorable for 2013.

P. 8 | COLLIERS INTERNATIONAL
HIGHLIGHTS | Q4 2012 | INDUSTRIAL | NORTH AMERICA
Transaction ActivityIndustrial warehouse property transactions were up 4 percent in 2012 to $36.9 billion, despite a dearth of portfolios and investment-grade warehouses for sale. Approximately 37 percent of these transactions (13.5 billion) occurred in Q4 2012, making it the most active quarter for industrial warehouse transactions since Q3 2007. Cap rates continue to compress, and prices were up 6 percent over 2011, according to Real Capital Analytics Industrial Year in Review.
Capital MarketsWhat is better than improving office property type fundamentals? For those that purchased any of the 4,000 industrial warehouse properties that traded in 2012, the answer is availability of capital. Domestic and foreign sources are flush with capital ready to invest in tangible assets like real estate, that can offer 2.5 to 3.0 times the yield offered by the U.S. government’s 10-year Treasury bond. And, the CMBS debt markets are opening up again after four consecutive years of annual new issuance below $50 billion. Underwriting terms and pricing spreads have also compressed in favor of borrowers. Improving market conditions have enabled even properties with elevated vacancy rates to become financeable again due to the low DSCR hurdle provided by sub-5.0 percent interest rates and 90 percent LTVs. Declining CMBS delinquency rates have further aided new issuance interest, and have CMBS investors enthusiastic about 2013 new issuance increasing 50 percent over 2012’s $50 billion level to 75 billion. If you have tenants, and can meet a 1.4 DSCR using a 4.5% loan coupon, the capital markets are once again open to refinance your industrial building.
JAN ‘13 DEC ‘12 NOV ‘12 3 MON 6 MON 1 YEAR
INDUSTRIAL 11.32 11.24 11.48 11.53 11.72 12.14
LODGING 11.77 11.73 12.24 11.24 13.06 12.09
MULTIFAMILY 13.43 13.98 14.21 14.26 15.69 15.39
OFFICE 10.48 10.66 10.37 10.20 10.69 8.90
RETAIL 7.79 7.62 7.75 8.03 8.03 7.88
Source: Trepp – January 2013 CMBS Delinquency Report
PERCENTAGE 30+ DAYS DELINQUENT BY PROPERTY TYPE
CONCLUSIONLet’s return to the question posed at the beginning of this report:
Q. What do nature and physics tell us about the V formation, and how is it applicable to industrial real estate?
A. It tells us that it is the most efficient pattern of movement that expends 50 percent less energy.
The North American industrial markets are re-engineering their supply chains and distribution channels with a V formation in mind—and a goal of achieving enhanced efficiencies in both costs and time. The growth in e-commerce and expansion of the Panama Canal lock system are converging to force manufacturers, retailers, and suppliers to make large CapEx investments in new facilities, particularly in markets aligned with post-Panamax ports, with intermodal facilities along one or more Class-1 railroads, and in proximity to the most efficient overnight air cargo airports.
The driving force behind demand for industrial real estate as we approach the first post-Panamax decade is increased efficiency, in order to offset global competition and pressure of a global economic climate mired in debt, and likely to see ongoing tepid GDP growth.
$@
Industrial markets V formation

HIGHLIGHTS | Q4 2012 | INDUSTRIAL | NORTH AMERICA
COLLIERS INTERNATIONAL | P. 9
UNITED STATES | INDUSTRIAL SURVEY
MARKETINVENTORY
DEC. 31, 2012(SF)
NEW CONSTRUCTION
Q4 2012 (SF)
CURRENTLY UNDER CONSTRUCTION
(SF)
ABSORPTION Q4 2012 (SF)
VACANCY RATE SEPT. 30, 2012 (%)
VACANCY RATE DEC. 31, 2012 (%)
NORTHEAST
Baltimore, MD 225,922,841 67,120 392,620 777,065 10.53 10.21
Boston, MA 154,079,047 128,874 1,109,585 (263,862) 17.14 17.38
Hartford, CT 97,321,923 224,061 - (273,114) 8.93 9.19
Long Island, NY 161,321,096 - - (385,086) 5.36 5.59
New Jersey – Central 353,576,306 287,800 1,027,000 1,032,423 9.39 9.17
New Jersey – Northern 374,424,353 - - 824,363 8.55 8.35
Philadelphia, PA 409,316,988 1,265,000 2,204,530 2,900,169 10.18 9.75
Pittsburgh, PA 168,333,439 - 146,313 191,368 8.32 8.21
Washington, DC 278,296,443 49,600 1,933,098 1,223,202 11.14 10.71
Northeast Total 2,222,592,436 2,022,455 6,813,146 6,026,528 9.87 9.67
SOUTH
Atlanta, GA 608,573,705 1,370,640 4,521,578 1,791,217 12.71 12.41
Birmingham, AL 110,692,974 - 150,000 136,337 9.57 9.39
Charleston, SC 32,042,029 200,000 768,000 338,899 10.86 10.36
Charlotte, NC 295,314,817 160,988 509,765 1,615,340 12.28 11.78
Columbia, SC 37,853,794 - - 58,608 8.90 8.78
Dallas-Ft. Worth, TX 717,071,304 1,693,118 1,279,743 3,223,281 9.72 9.48
Ft. Lauderdale-Broward, FL 123,353,931 - 381,969 (14,666) 8.34 8.35
Greenville/Spartanburg, SC 183,028,727 1,015,740 - 1,730,134 9.61 9.16
Houston, TX 482,535,159 949,497 2,554,598 1,440,472 5.26 5.15
Jacksonville, FL 121,961,127 41,808 - 512,271 10.47 10.08
Little Rock, AR 45,018,927 18,376 497,443 59,518 11.29 11.17
Louisville, KY 180,269,470 16,000 - 2,227,336 10.19 8.96
Memphis, TN 217,057,417 1,372,305 1,219,892 2,905,072 13.25 12.46
Miami, FL 220,661,704 53,000 1,008,421 858,752 6.94 6.57
Nashville, TN 88,921,700 1,300,000 - 1,369,010 9.03 8.82
Orlando, FL 145,229,723 87,814 - 136,471 10.25 10.21
Raleigh, NC 120,097,770 36,554 135,696 254,180 10.42 10.23
Richmond, VA 112,863,513 2,146,494 482,489 2,223,096 10.24 9.98
Savannah, GA 44,421,300 - 881,000 144,657 12.16 11.84
Tampa Bay, FL 212,832,724 - 35,519 734,755 9.70 9.36
West Palm Beach, FL 60,002,683 - 20,900 186,192 7.60 7.29
South Total 4,159,804,498 10,462,334 14,447,013 21,930,932 9.90 9.57

P. 10 | COLLIERS INTERNATIONAL
HIGHLIGHTS | Q4 2012 | INDUSTRIAL | NORTH AMERICA
UNITED STATES | INDUSTRIAL SURVEY
MARKETINVENTORY
DEC. 31, 2012(SF)
NEW CONSTRUCTION
Q4 2012 (SF)
CURRENTLY UNDER CONSTRUCTION
(SF)
ABSORPTION Q4 2012 (SF)
VACANCY RATE SEPT. 30, 2012 (%)
VACANCY RATE DEC. 31, 2012 (%)
MIDWEST
Chicago, IL 1,310,785,800 900,153 4,768,149 7,006,883 10.04 9.53
Cincinnati, OH 274,600,585 - 553,338 856,364 9.53 9.22
Cleveland, OH 477,772,867 153,492 22,538 738,868 9.18 9.05
Columbus, OH 211,821,516 448,665 924,103 1,455,132 9.11 8.76
Detroit, MI 556,741,643 1,640,405 - 4,685,051 12.03 11.45
Grand Rapids, MI 108,946,869 - 285,000 370,606 7.56 7.29
Indianapolis, IN 282,953,005 1,306,295 2,303,616 1,091,779 5.21 5.26
Kansas City, MO-KS 234,052,197 212,441 2,466,743 761,402 6.96 6.72
Milwaukee, WI 223,336,664 322,050 - 358,540 6.57 6.51
Minneapolis/St. Paul, MN 252,239,046 647,000 1,585,000 764,750 8.35 8.12
Omaha, NE 67,749,057 - 35,636 153,296 5.41 5.09
St. Louis, MO 260,993,881 - 209,050 487,411 8.61 8.42
Midwest Total 4,261,993,130 5,630,501 13,153,173 18,730,082 9.13 8.79
WEST
Bakersfield, CA 33,401,923 495,000 291,085 1,026,063 4.45 2.80
Boise, ID 35,010,541 169,680 210,000 643,826 10.92 9.51
Denver, CO 215,855,262 340,928 855,271 1,298,425 7.86 7.45
Fairfield, CA 46,831,953 - 48,133 514,997 12.40 11.30
Fresno, CA 48,600,000 - - 214,000 9.70 9.26
Honolulu, HI 39,179,616 - - 205,646 4.27 3.75
Las Vegas, NV 109,030,779 - 658,320 284,707 16.05 15.53
Los Angeles – Inland Empire, CA 386,235,800 1,759,500 8,741,800 4,405,800 6.89 6.45
Los Angeles, CA 882,677,700 848,500 1,608,600 2,235,500 4.35 4.21
Oakland, CA 141,540,855 - 517,575 99,250 8.46 8.23
Orange County, CA 200,123,900 - 183,200 (576,500) 4.60 4.90
Phoenix, AZ 272,634,685 2,008,075 4,683,704 2,519,378 13.09 12.81
Pleasanton/Walnut Creek, CA 33,187,680 - - 918,170 12.99 10.22
Portland, OR 200,393,745 - 2,170,447 186,166 7.27 7.18
Reno, NV 87,415,483 - - 399,516 11.43 10.97
Sacramento, CA 188,076,142 - 235,553 720,631 13.30 12.92
San Diego, CA 186,979,756 129,845 172,656 1,031,268 10.36 9.87
San Francisco Peninsula, CA 41,071,873 - - (242,772) 9.26 9.85
San Jose/Silicon Valley 251,868,566 99,800 111,100 (77,141) 10.69 10.73
Seattle/Puget Sound, WA 262,474,244 - 693,758 1,150,355 6.50 5.82
Stockton/San Joaquin County, CA 94,049,012 29,095 - 377,094 13.77 13.45
West Total 3,756,639,515 5,880,423 21,181,202 17,334,379 8.20 7.88
U.S. TOTAL 14,401,029,579 23,995,713 55,594,534 64,021,921 9.22 8.92
(continued)

HIGHLIGHTS | Q4 2012 | INDUSTRIAL | NORTH AMERICA
COLLIERS INTERNATIONAL | P. 11
UNITED STATES | INDUSTRIAL SURVEY | SALES PRICE AND CAP RATE AS OF DECEMBER 2012
MARKET SALES PRICE (USD PSF)
CAP RATE (%)
VACANCY FORECAST (3 MONTHS)
ABSORPTION FORECAST (3 MONTHS)
RENT FORECAST (3 MONTHS)
NORTHEAST
Baltimore, MD 60.74 6.36
Boston, MA 65.00
Hartford, CT 38.00 8.50
Long Island, NY 67.44 7.67 Close to zero
New Jersey – Central 59.00 6.30
New Jersey – Northern 67.00
Philadelphia, PA 58.95 7.84
Pittsburgh, PA 50.00 7.75
Washington, DC 151.43 6.52
Northeast Total* 68.62 7.28
SOUTH
Atlanta, GA 38.06 7.90
Birmingham, AL
Charleston, SC 46.00 7.50
Charlotte, NC
Columbia, SC
Dallas-Ft. Worth, TX 60.00 7.30
Ft. Lauderdale-Broward, FL 51.00 4.16
Greenville/Spartanburg, SC
Houston, TX 63.00 7.90
Jacksonville, FL 32.00 9.00
Little Rock, AR 65.45 9.00 Close to zero
Louisville, KY
Memphis, TN 32.50 7.75
Miami, FL 85.00 7.00
Nashville, TN 35.00 10.32
Orlando, FL 52.00 7.50
Raleigh, NC
Richmond, VA Close to zero
Savannah, GA 36.00 8.50 Close to zero
Tampa Bay, FL 30.09 8.75
West Palm Beach, FL 85.00 6.94
South Total* 50.79 7.82
* Straight averages used.
P. 12 | COLLIERS INTERNATIONAL
HIGHLIGHTS | Q4 2012 | INDUSTRIAL | NORTH AMERICA
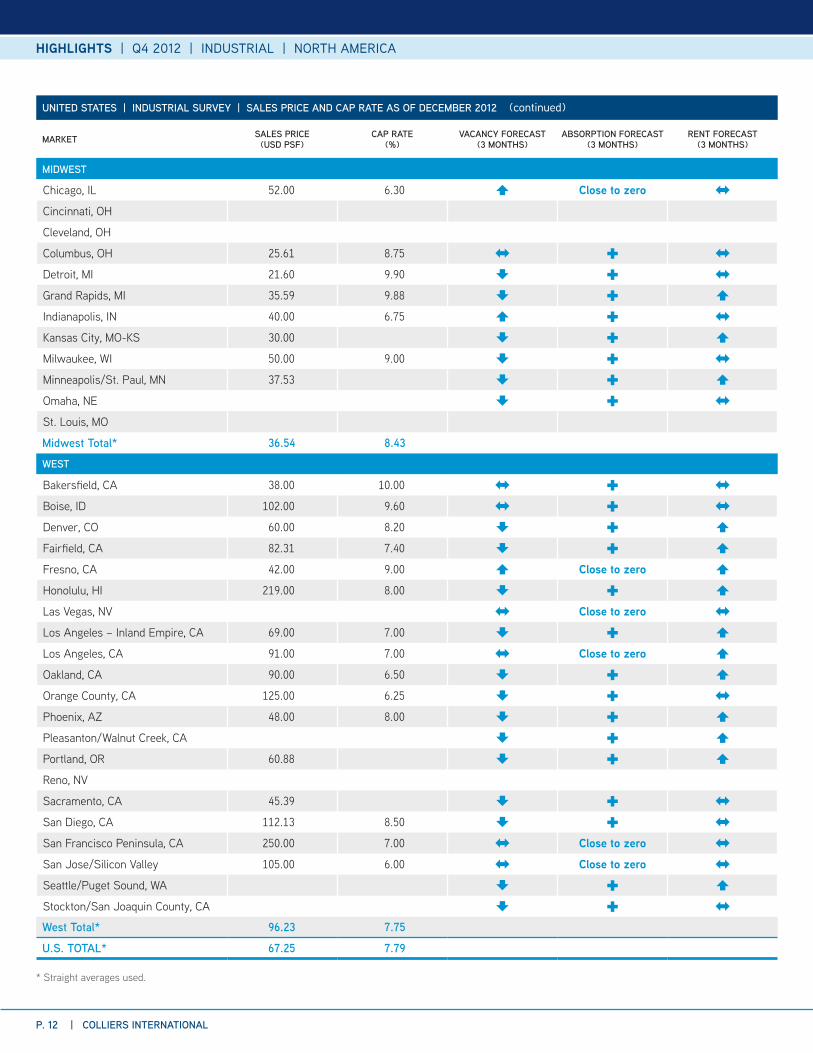
UNITED STATES | INDUSTRIAL SURVEY | SALES PRICE AND CAP RATE AS OF DECEMBER 2012
MARKET SALES PRICE (USD PSF)
CAP RATE (%)
VACANCY FORECAST (3 MONTHS)
ABSORPTION FORECAST (3 MONTHS)
RENT FORECAST (3 MONTHS)
MIDWEST
Chicago, IL 52.00 6.30 Close to zero
Cincinnati, OH
Cleveland, OH
Columbus, OH 25.61 8.75
Detroit, MI 21.60 9.90
Grand Rapids, MI 35.59 9.88
Indianapolis, IN 40.00 6.75
Kansas City, MO-KS 30.00
Milwaukee, WI 50.00 9.00
Minneapolis/St. Paul, MN 37.53
Omaha, NE
St. Louis, MO
Midwest Total* 36.54 8.43
WEST
Bakersfield, CA 38.00 10.00
Boise, ID 102.00 9.60
Denver, CO 60.00 8.20
Fairfield, CA 82.31 7.40
Fresno, CA 42.00 9.00 Close to zero
Honolulu, HI 219.00 8.00
Las Vegas, NV Close to zero
Los Angeles – Inland Empire, CA 69.00 7.00
Los Angeles, CA 91.00 7.00 Close to zero
Oakland, CA 90.00 6.50
Orange County, CA 125.00 6.25
Phoenix, AZ 48.00 8.00
Pleasanton/Walnut Creek, CA
Portland, OR 60.88
Reno, NV
Sacramento, CA 45.39
San Diego, CA 112.13 8.50
San Francisco Peninsula, CA 250.00 7.00 Close to zero
San Jose/Silicon Valley 105.00 6.00 Close to zero
Seattle/Puget Sound, WA
Stockton/San Joaquin County, CA
West Total* 96.23 7.75
U.S. TOTAL* 67.25 7.79
(continued)
* Straight averages used.
HIGHLIGHTS | Q4 2012 | INDUSTRIAL | NORTH AMERICA
COLLIERS INTERNATIONAL | P. 13
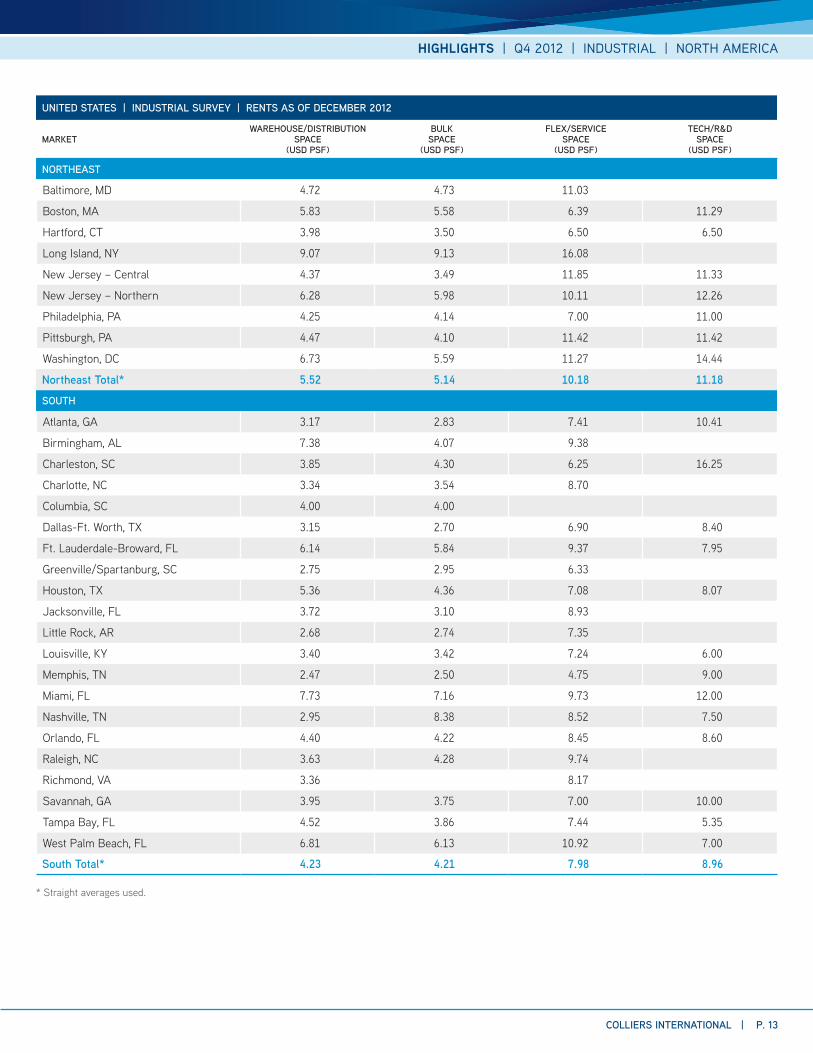
UNITED STATES | INDUSTRIAL SURVEY | RENTS AS OF DECEMBER 2012
MARKETWAREHOUSE/DISTRIBUTION
SPACE (USD PSF)
BULK SPACE
(USD PSF)
FLEX/SERVICE SPACE
(USD PSF)
TECH/R&D SPACE
(USD PSF)
NORTHEAST
Baltimore, MD 4.72 4.73 11.03
Boston, MA 5.83 5.58 6.39 11.29
Hartford, CT 3.98 3.50 6.50 6.50
Long Island, NY 9.07 9.13 16.08
New Jersey – Central 4.37 3.49 11.85 11.33
New Jersey – Northern 6.28 5.98 10.11 12.26
Philadelphia, PA 4.25 4.14 7.00 11.00
Pittsburgh, PA 4.47 4.10 11.42 11.42
Washington, DC 6.73 5.59 11.27 14.44
Northeast Total* 5.52 5.14 10.18 11.18
SOUTH
Atlanta, GA 3.17 2.83 7.41 10.41
Birmingham, AL 7.38 4.07 9.38
Charleston, SC 3.85 4.30 6.25 16.25
Charlotte, NC 3.34 3.54 8.70
Columbia, SC 4.00 4.00
Dallas-Ft. Worth, TX 3.15 2.70 6.90 8.40
Ft. Lauderdale-Broward, FL 6.14 5.84 9.37 7.95
Greenville/Spartanburg, SC 2.75 2.95 6.33
Houston, TX 5.36 4.36 7.08 8.07
Jacksonville, FL 3.72 3.10 8.93
Little Rock, AR 2.68 2.74 7.35
Louisville, KY 3.40 3.42 7.24 6.00
Memphis, TN 2.47 2.50 4.75 9.00
Miami, FL 7.73 7.16 9.73 12.00
Nashville, TN 2.95 8.38 8.52 7.50
Orlando, FL 4.40 4.22 8.45 8.60
Raleigh, NC 3.63 4.28 9.74
Richmond, VA 3.36 8.17
Savannah, GA 3.95 3.75 7.00 10.00
Tampa Bay, FL 4.52 3.86 7.44 5.35
West Palm Beach, FL 6.81 6.13 10.92 7.00
South Total* 4.23 4.21 7.98 8.96
* Straight averages used.
P. 14 | COLLIERS INTERNATIONAL
HIGHLIGHTS | Q4 2012 | INDUSTRIAL | NORTH AMERICA
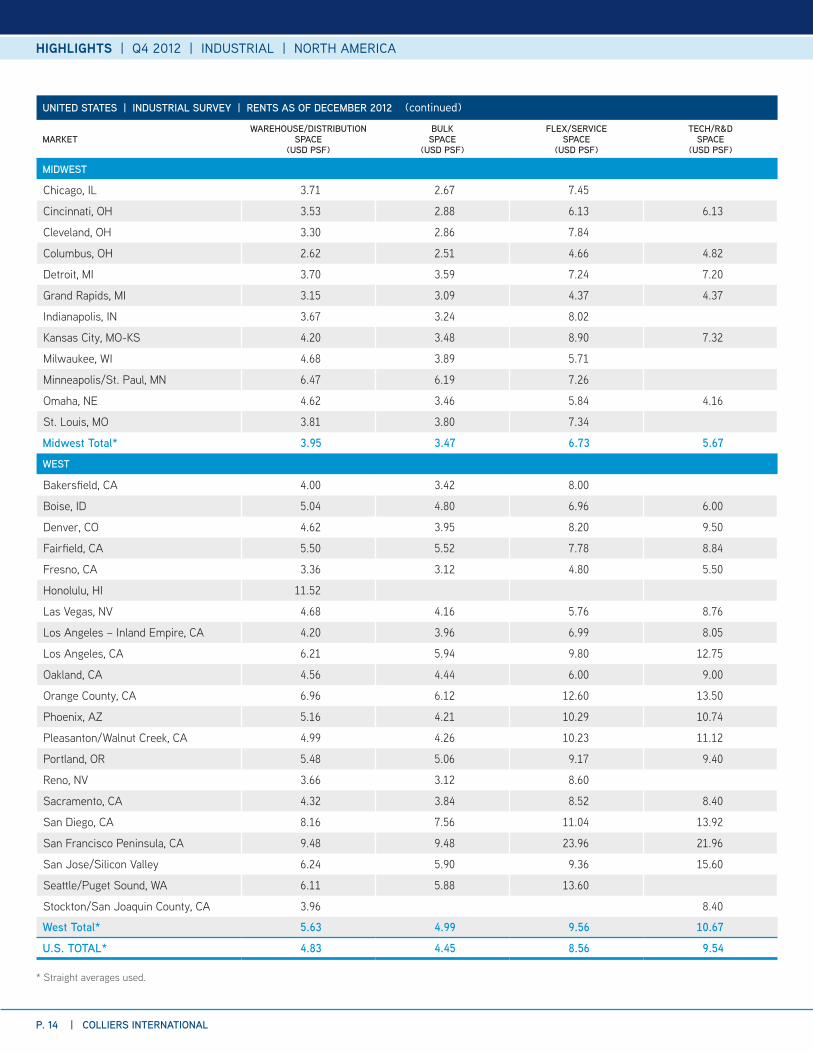
UNITED STATES | INDUSTRIAL SURVEY | RENTS AS OF DECEMBER 2012
MARKETWAREHOUSE/DISTRIBUTION
SPACE (USD PSF)
BULK SPACE
(USD PSF)
FLEX/SERVICE SPACE
(USD PSF)
TECH/R&D SPACE
(USD PSF)
MIDWEST
Chicago, IL 3.71 2.67 7.45
Cincinnati, OH 3.53 2.88 6.13 6.13
Cleveland, OH 3.30 2.86 7.84
Columbus, OH 2.62 2.51 4.66 4.82
Detroit, MI 3.70 3.59 7.24 7.20
Grand Rapids, MI 3.15 3.09 4.37 4.37
Indianapolis, IN 3.67 3.24 8.02
Kansas City, MO-KS 4.20 3.48 8.90 7.32
Milwaukee, WI 4.68 3.89 5.71
Minneapolis/St. Paul, MN 6.47 6.19 7.26
Omaha, NE 4.62 3.46 5.84 4.16
St. Louis, MO 3.81 3.80 7.34
Midwest Total* 3.95 3.47 6.73 5.67
WEST
Bakersfield, CA 4.00 3.42 8.00
Boise, ID 5.04 4.80 6.96 6.00
Denver, CO 4.62 3.95 8.20 9.50
Fairfield, CA 5.50 5.52 7.78 8.84
Fresno, CA 3.36 3.12 4.80 5.50
Honolulu, HI 11.52
Las Vegas, NV 4.68 4.16 5.76 8.76
Los Angeles – Inland Empire, CA 4.20 3.96 6.99 8.05
Los Angeles, CA 6.21 5.94 9.80 12.75
Oakland, CA 4.56 4.44 6.00 9.00
Orange County, CA 6.96 6.12 12.60 13.50
Phoenix, AZ 5.16 4.21 10.29 10.74
Pleasanton/Walnut Creek, CA 4.99 4.26 10.23 11.12
Portland, OR 5.48 5.06 9.17 9.40
Reno, NV 3.66 3.12 8.60
Sacramento, CA 4.32 3.84 8.52 8.40
San Diego, CA 8.16 7.56 11.04 13.92
San Francisco Peninsula, CA 9.48 9.48 23.96 21.96
San Jose/Silicon Valley 6.24 5.90 9.36 15.60
Seattle/Puget Sound, WA 6.11 5.88 13.60
Stockton/San Joaquin County, CA 3.96 8.40
West Total* 5.63 4.99 9.56 10.67
U.S. TOTAL* 4.83 4.45 8.56 9.54
* Straight averages used.
(continued)

HIGHLIGHTS | Q4 2012 | INDUSTRIAL | NORTH AMERICA
COLLIERS INTERNATIONAL | P. 15
CANADA | INDUSTRIAL SURVEY
MARKETEXISTING
INVENTORY DEC. 31, 2012 (SF)
NEW CONSTRUCTION
Q4 2012 (SF)
CURRENTLY UNDER CONSTRUCTION (SF)
Calgary, AB 125,068,494 338,126 2,706,068
Edmonton, AB 79,221,653 192,632 1,449,743
Halifax, NS 7,604,256 7,625 135,000
Montréal, QC 347,995,640 225,053 312,060
Ottawa, ON 28,070,055 - 111,500
Regina, SK 16,897,836 144,000 150,000
Saskatoon, SK 20,840,000 120,000 550,000
Toronto, ON 762,813,784 1,300,000 5,621,750
Vancouver, BC 182,663,027 1,147,498 213,791
Victoria, BC 8,883,924 161,402 561,030
Waterloo Region, ON 60,658,893 - 98,454
Winnipeg, MB 79,692,082 35,000 245,435
CANADA TOTAL 1,720,409,644 3,671,336 12,154,831
CANADA | INDUSTRIAL SURVEY
MARKET ABSORPTION Q4 2012 (SF)
VACANCY RATE SEPT. 30, 2012 (%)
VACANCY RATE DEC. 31, 2012 (%)
Calgary, AB (106,694) 4.71 5.05
Edmonton, AB 507,583 3.75 3.35
Halifax, NS (115,054) 8.05 9.65
Montréal, QC (1,484) 4.28 4.34
Ottawa, ON 67,703 6.00 5.76
Regina, SK 190,000 2.91 3.51
Saskatoon, SK 90,000 4.83 4.94
Toronto, ON 4,958,865 4.71 4.13
Vancouver, BC 1,399,479 3.80 3.67
Victoria, BC - 4.15 4.15
Waterloo Region, ON 36,198 6.92 6.80
Winnipeg, MB (130,105) 2.77 2.97
CANADA TOTAL* 6,896,491 4.49% 4.25%
* Straight averages used.

P. 16 | COLLIERS INTERNATIONAL
HIGHLIGHTS | Q4 2012 | INDUSTRIAL | NORTH AMERICA
CANADA | INDUSTRIAL SURVEY | SALES PRICE AND CAP RATE AS OF DECEMBER 2012
MARKET SALES PRICE (CAD PSF)
CAP RATE (%)
VACANCY FORECAST (3 MONTHS)
ABSORPTION FORECAST (3 MONTHS)
RENT FORECAST (3 MONTHS)
Calgary, AB 155.00 7.00
Edmonton, AB 133.35 6.66
Halifax, NS 120.00 7.25
Montréal, QC 68.00 7.25
Ottawa, ON 110.00 7.50
Regina, SK 130.00 7.40
Saskatoon, SK 150.00 7.15
Toronto, ON 82.00 6.50
Vancouver, BC 180.00 5.70
Victoria, BC 170.00 7.00 Close to zero
Waterloo Region, ON 61.00 7.90
Winnipeg, MB 71.25 8.25 Close to zero
CANADA TOTAL* 119.22 7.13
CANADA | INDUSTRIAL SURVEY | RENTS AS OF DECEMBER 2012
MARKET WAREHOUSE/DISTRIBUTION SPACE (CAD PSF)
BULK SPACE(CAD PSF)
FLEX/SERVICE SPACE (CAD PSF)
TECH/R&D SPACE (CAD PSF)
Calgary, AB 8.50 7.25 12.00 12.00
Edmonton, AB 8.00 7.50 10.00 12.00
Halifax, NS 7.75 6.75 10.50 15.00
Montréal, QC 4.75 4.25 6.00 8.00
Ottawa, ON 8.25 7.50 8.50 11.00
Regina, SK 9.00 9.00 11.00 13.00
Saskatoon, SK 10.00 9.00 12.00 14.00
Toronto, ON 4.83
Vancouver, BC 7.60 6.80 9.65 14.00
Victoria, BC 12.00 10.00 13.50 13.50
Waterloo Region, ON 3.97 3.12 8.29 8.29
Winnipeg, MB 6.00 5.25 9.95 12.75
CANADA TOTAL* 7.55 6.95 10.13 12.14
* Straight averages used
* Straight averages used
HIGHLIGHTS | Q4 2012 | INDUSTRIAL | NORTH AMERICA
COLLIERS INTERNATIONAL | P. 17
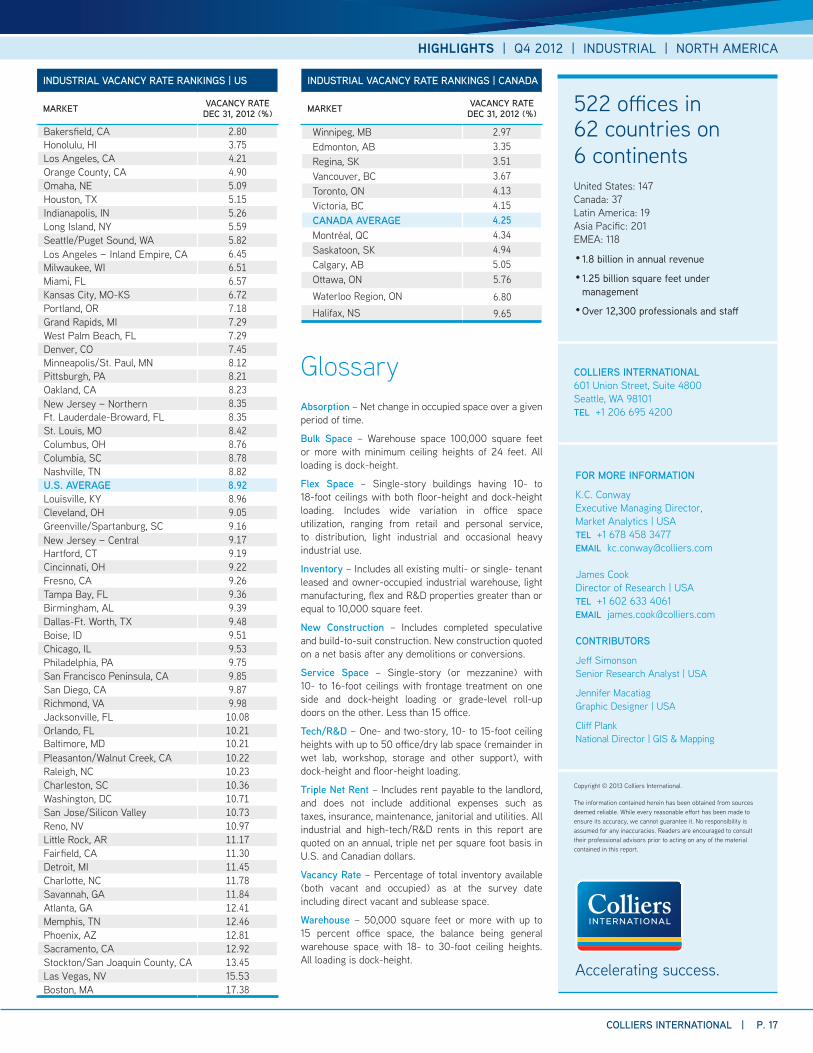
INDUSTRIAL VACANCY RATE RANKINGS | US
MARKET VACANCY RATEDEC 31, 2012 (%)
Bakersfield, CA 2.80Honolulu, HI 3.75Los Angeles, CA 4.21Orange County, CA 4.90Omaha, NE 5.09Houston, TX 5.15Indianapolis, IN 5.26Long Island, NY 5.59Seattle/Puget Sound, WA 5.82Los Angeles – Inland Empire, CA 6.45Milwaukee, WI 6.51Miami, FL 6.57Kansas City, MO-KS 6.72Portland, OR 7.18Grand Rapids, MI 7.29West Palm Beach, FL 7.29Denver, CO 7.45Minneapolis/St. Paul, MN 8.12Pittsburgh, PA 8.21Oakland, CA 8.23New Jersey – Northern 8.35Ft. Lauderdale-Broward, FL 8.35St. Louis, MO 8.42Columbus, OH 8.76Columbia, SC 8.78Nashville, TN 8.82U.S. AVERAGE 8.92Louisville, KY 8.96Cleveland, OH 9.05Greenville/Spartanburg, SC 9.16New Jersey – Central 9.17Hartford, CT 9.19Cincinnati, OH 9.22Fresno, CA 9.26Tampa Bay, FL 9.36Birmingham, AL 9.39Dallas-Ft. Worth, TX 9.48Boise, ID 9.51Chicago, IL 9.53Philadelphia, PA 9.75San Francisco Peninsula, CA 9.85San Diego, CA 9.87Richmond, VA 9.98Jacksonville, FL 10.08Orlando, FL 10.21Baltimore, MD 10.21Pleasanton/Walnut Creek, CA 10.22Raleigh, NC 10.23Charleston, SC 10.36Washington, DC 10.71San Jose/Silicon Valley 10.73Reno, NV 10.97Little Rock, AR 11.17Fairfield, CA 11.30Detroit, MI 11.45Charlotte, NC 11.78Savannah, GA 11.84Atlanta, GA 12.41Memphis, TN 12.46Phoenix, AZ 12.81Sacramento, CA 12.92Stockton/San Joaquin County, CA 13.45Las Vegas, NV 15.53Boston, MA 17.38
INDUSTRIAL VACANCY RATE RANKINGS | CANADA
MARKET VACANCY RATEDEC 31, 2012 (%)
Winnipeg, MB 2.97Edmonton, AB 3.35Regina, SK 3.51Vancouver, BC 3.67Toronto, ON 4.13Victoria, BC 4.15CANADA AVERAGE 4.25Montréal, QC 4.34Saskatoon, SK 4.94Calgary, AB 5.05Ottawa, ON 5.76Waterloo Region, ON 6.80Halifax, NS 9.65
COLLIERS INTERNATIONAL601 Union Street, Suite 4800Seattle, WA 98101TEL +1 206 695 4200
FOR MORE INFORMATION
K.C. Conway Executive Managing Director, Market Analytics | USATEL + 1 678 458 3477EMAIL [email protected]
James CookDirector of Research | USA TEL +1 602 633 4061 EMAIL [email protected]
CONTRIBUTORS
Jeff Simonson Senior Research Analyst | USA
Jennifer Macatiag Graphic Designer | USA
Cliff Plank National Director | GIS & Mapping
522 offices in 62 countries on 6 continentsUnited States: 147Canada: 37Latin America: 19Asia Pacific: 201EMEA: 118
• 1.8 billion in annual revenue
• 1.25 billion square feet under management
• Over 12,300 professionals and staff
Copyright © 2013 Colliers International.
The information contained herein has been obtained from sources deemed reliable. While every reasonable effort has been made to ensure its accuracy, we cannot guarantee it. No responsibility is assumed for any inaccuracies. Readers are encouraged to consult their professional advisors prior to acting on any of the material contained in this report.
Accelerating success.
GlossaryAbsorption – Net change in occupied space over a given period of time.
Bulk Space – Warehouse space 100,000 square feet or more with minimum ceiling heights of 24 feet. All loading is dock-height.
Flex Space – Single-story buildings having 10- to 18-foot ceilings with both floor-height and dock-height loading. Includes wide variation in office space utilization, ranging from retail and personal service, to distribution, light industrial and occasional heavy industrial use.
Inventory – Includes all existing multi- or single- tenant leased and owner-occupied industrial warehouse, light manufacturing, flex and R&D properties greater than or equal to 10,000 square feet.
New Construction – Includes completed speculative and build-to-suit construction. New construction quoted on a net basis after any demolitions or conversions.
Service Space – Single-story (or mezzanine) with 10- to 16-foot ceilings with frontage treatment on one side and dock-height loading or grade-level roll-up doors on the other. Less than 15 office.
Tech/R&D – One- and two-story, 10- to 15-foot ceiling heights with up to 50 office/dry lab space (remainder in wet lab, workshop, storage and other support), with dock-height and floor-height loading.
Triple Net Rent – Includes rent payable to the landlord, and does not include additional expenses such as taxes, insurance, maintenance, janitorial and utilities. All industrial and high-tech/R&D rents in this report are quoted on an annual, triple net per square foot basis in U.S. and Canadian dollars.
Vacancy Rate – Percentage of total inventory available (both vacant and occupied) as at the survey date including direct vacant and sublease space.
Warehouse – 50,000 square feet or more with up to 15 percent office space, the balance being general warehouse space with 18- to 30-foot ceiling heights. All loading is dock-height.