north america - unece
TRANSCRIPT

North America: Housing, the Economy and Timber Harvest
Silva 2015
“The Value of Forests”
Wood and wood products markets
November 3, 2015
Engelberg, Switzerland
©2015 Forest2Market®, Inc. 2
Today’s Agenda
• US housing and the forest industry
• The future for building with wood
• Canadian lumber production
• US regional production trends
• “Softwood Lumber Agreement”
• Pulp and paper outlook
• North American forest product exports
©2015 Forest2Market®, Inc. 3

©2015 Forest2Market®, Inc. 4
Principal timber regions In North America
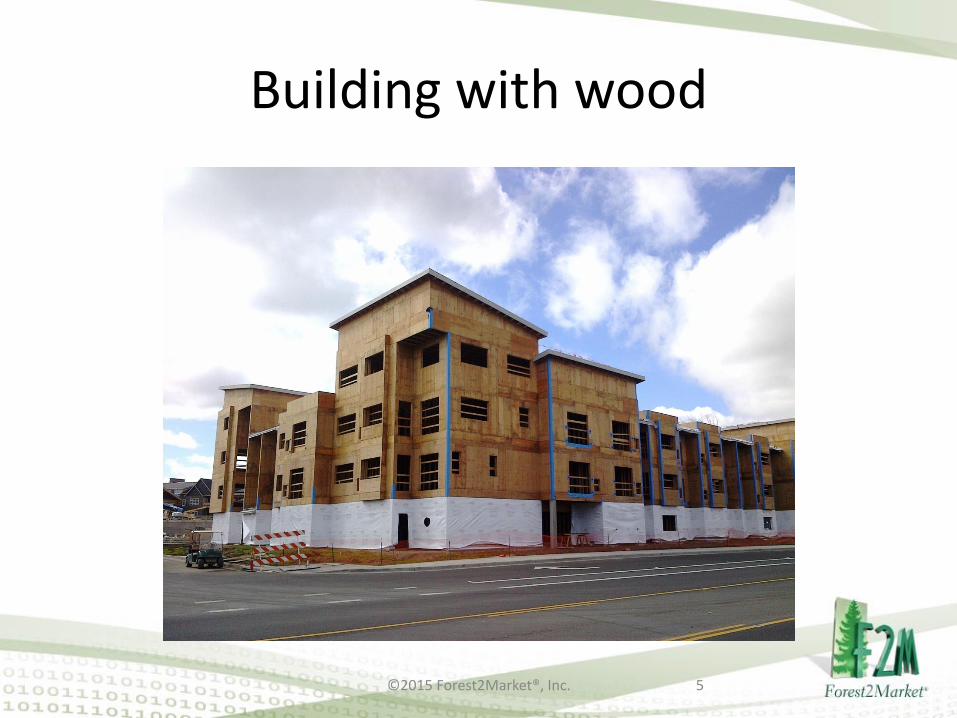
Building with wood
©2015 Forest2Market®, Inc. 5
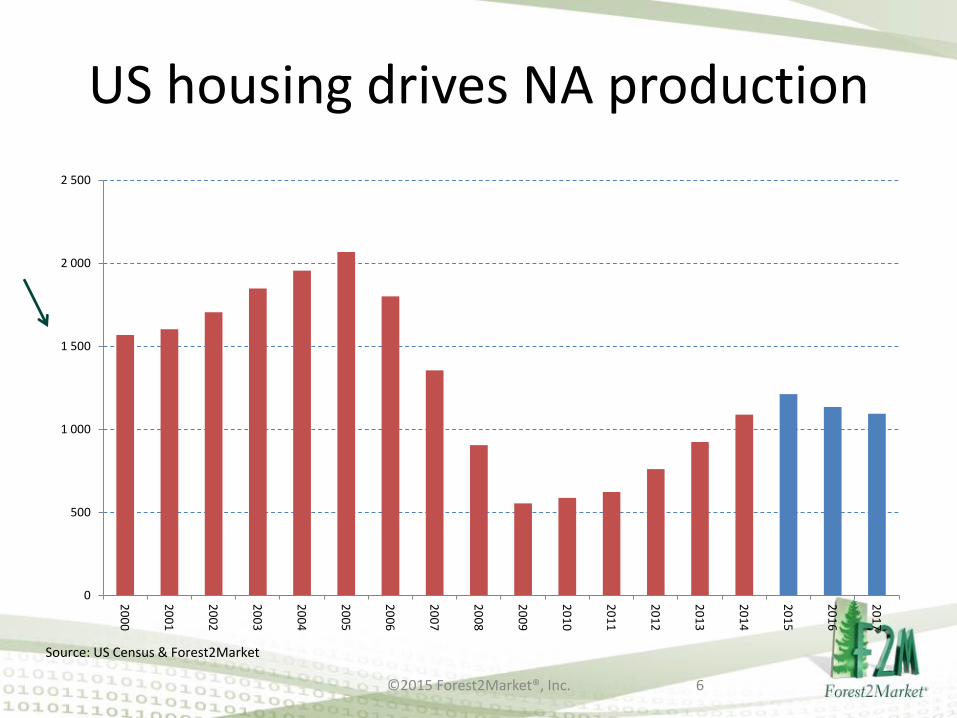
US housing drives NA production
©2015 Forest2Market®, Inc. 6
Source: US Census & Forest2Market
0
500
1 000
1 500
2 000
2 500
20
00
20
01
20
02
20
03
20
04
20
05
20
06
20
07
20
08
20
09
20
10
20
11
20
12
20
13
20
14
20
15
20
16
20
17

0
500
1 000
1 500
2 000
2 500
19591961196319651967196919711973197519771979198119831985198719891991199319951997199920012003200520072009201120132015
Total starts Single family Poly. (Single family)
Changing demographics of housing
©2015 Forest2Market®, Inc. 7
1993 87% single
Source: US Census
2015 61% single
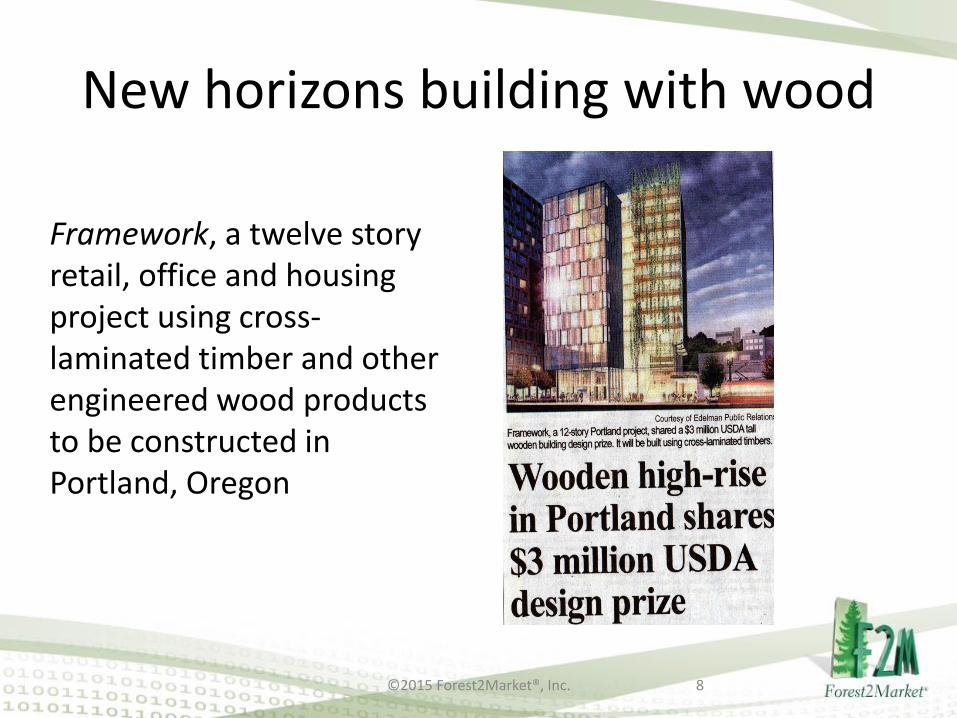
New horizons building with wood
Framework, a twelve story retail, office and housing project using cross-laminated timber and other engineered wood products to be constructed in Portland, Oregon
©2015 Forest2Market®, Inc. 8

Canadian forest industry
©2015 Forest2Market®, Inc. 9
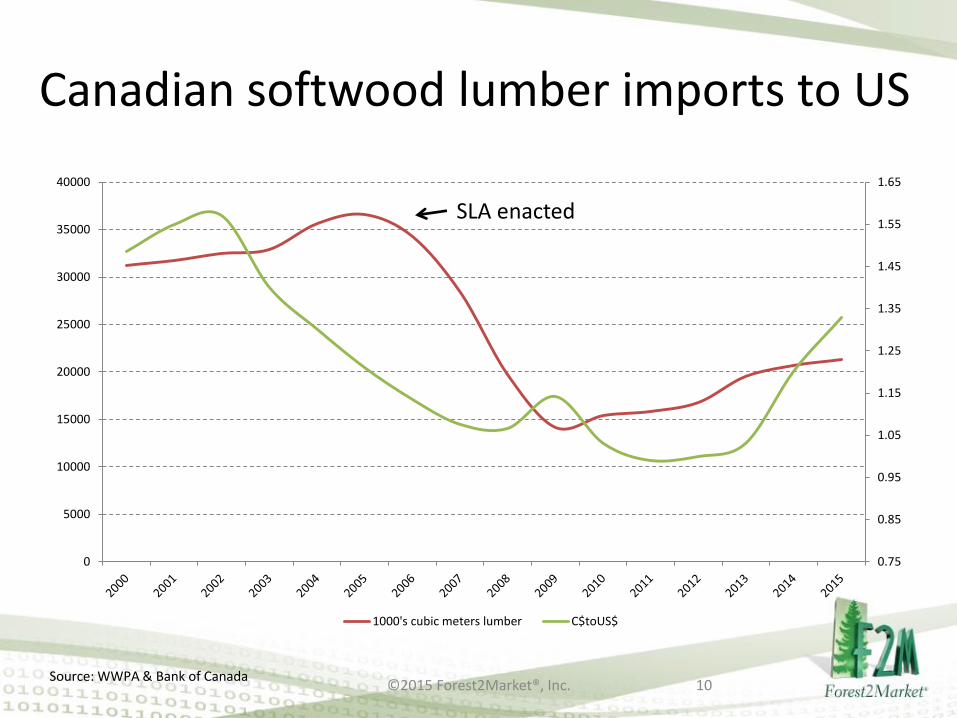
Canadian softwood lumber imports to US
©2015 Forest2Market®, Inc. 10Source: WWPA & Bank of Canada
0.75
0.85
0.95
1.05
1.15
1.25
1.35
1.45
1.55
1.65
0
5000
10000
15000
20000
25000
30000
35000
40000
1000's cubic meters lumber C$toUS$
SLA enacted
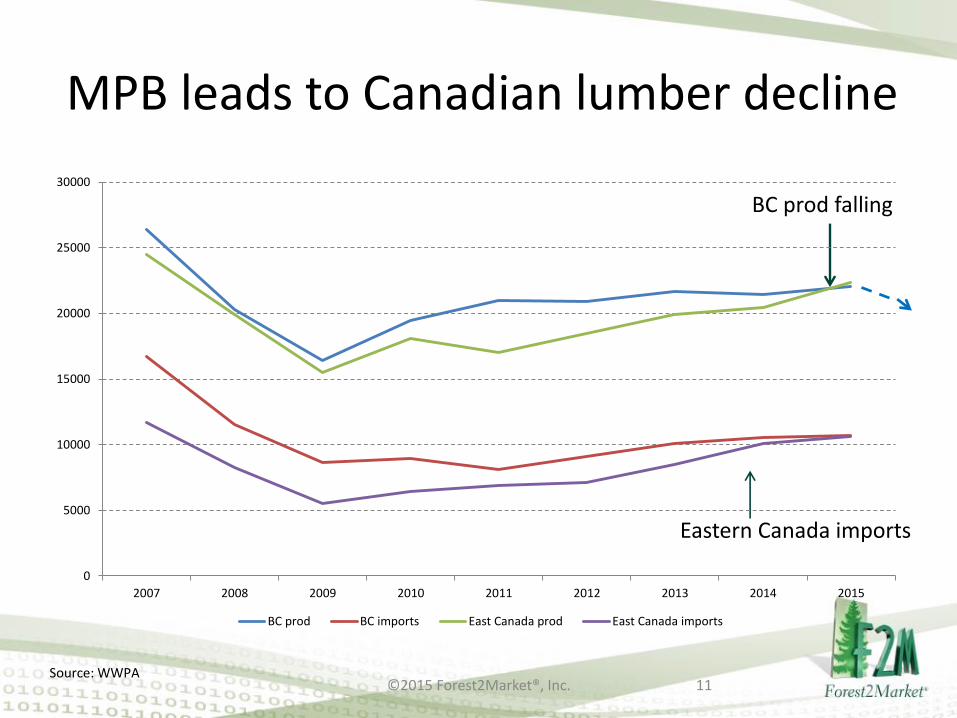
MPB leads to Canadian lumber decline
©2015 Forest2Market®, Inc. 11
BC prod falling
Eastern Canada imports
Source: WWPA
0
5000
10000
15000
20000
25000
30000
2007 2008 2009 2010 2011 2012 2013 2014 2015
BC prod BC imports East Canada prod East Canada imports
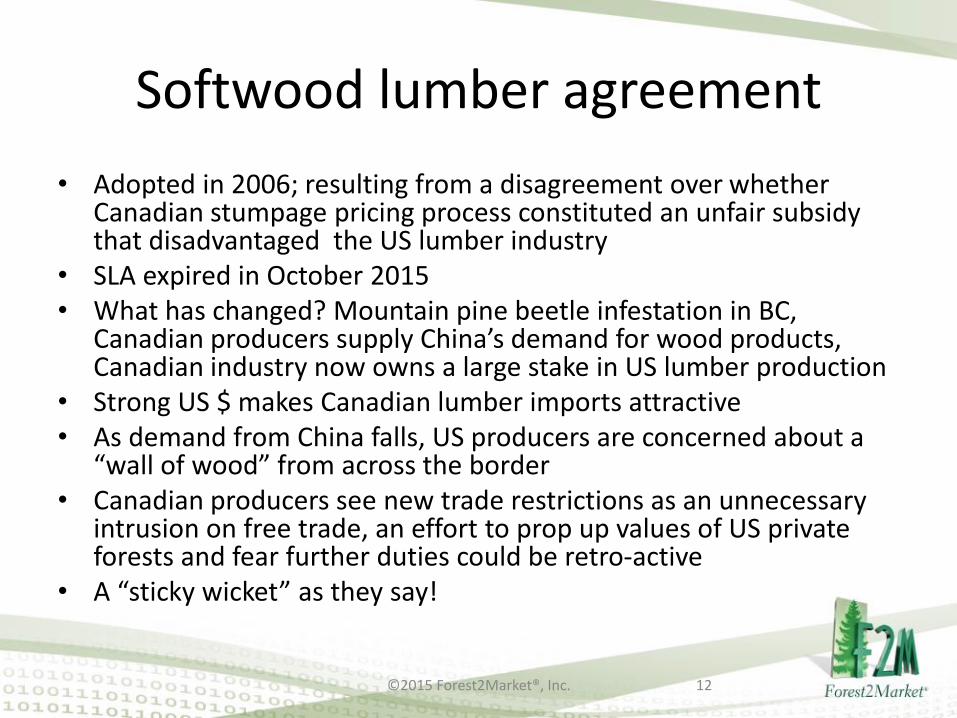
Softwood lumber agreement
• Adopted in 2006; resulting from a disagreement over whether Canadian stumpage pricing process constituted an unfair subsidy that disadvantaged the US lumber industry
• SLA expired in October 2015 • What has changed? Mountain pine beetle infestation in BC,
Canadian producers supply China’s demand for wood products, Canadian industry now owns a large stake in US lumber production
• Strong US $ makes Canadian lumber imports attractive• As demand from China falls, US producers are concerned about a
“wall of wood” from across the border• Canadian producers see new trade restrictions as an unnecessary
intrusion on free trade, an effort to prop up values of US private forests and fear further duties could be retro-active
• A “sticky wicket” as they say!
©2015 Forest2Market®, Inc. 12
US industry outlook
©2015 Forest2Market®, Inc. 13
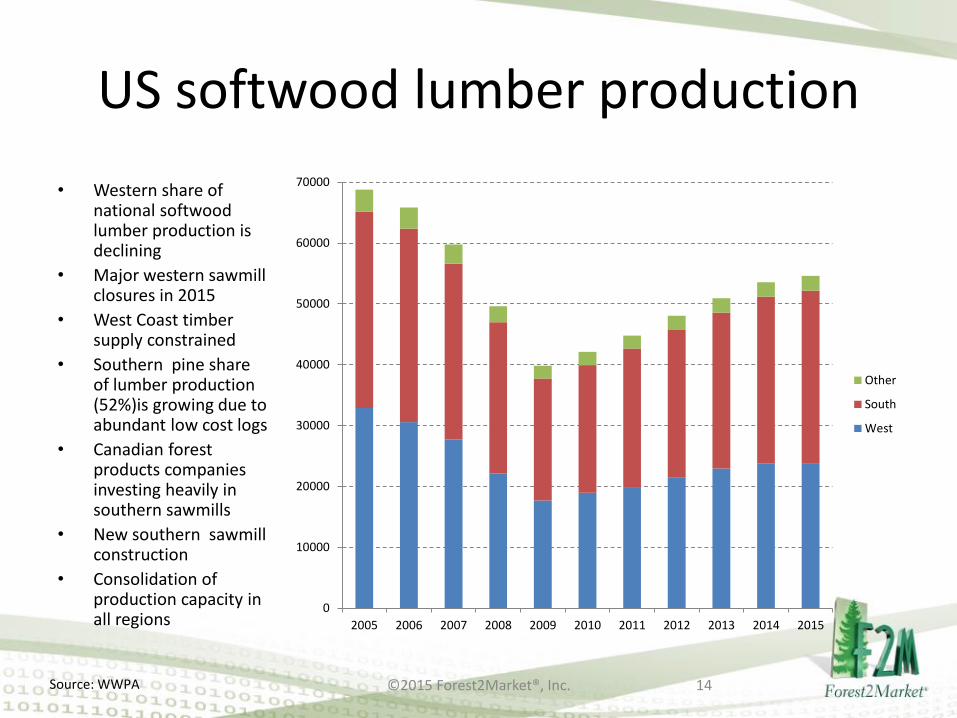
US softwood lumber production
• Western share of national softwood lumber production is declining
• Major western sawmill closures in 2015
• West Coast timber supply constrained
• Southern pine share of lumber production (52%)is growing due to abundant low cost logs
• Canadian forest products companies investing heavily in southern sawmills
• New southern sawmill construction
• Consolidation of production capacity in all regions
©2015 Forest2Market®, Inc. 14Source: WWPA
0
10000
20000
30000
40000
50000
60000
70000
2005 2006 2007 2008 2009 2010 2011 2012 2013 2014 2015
Other
South
West

US Pacific Northwest
©2015 Forest2Market®, Inc. 15
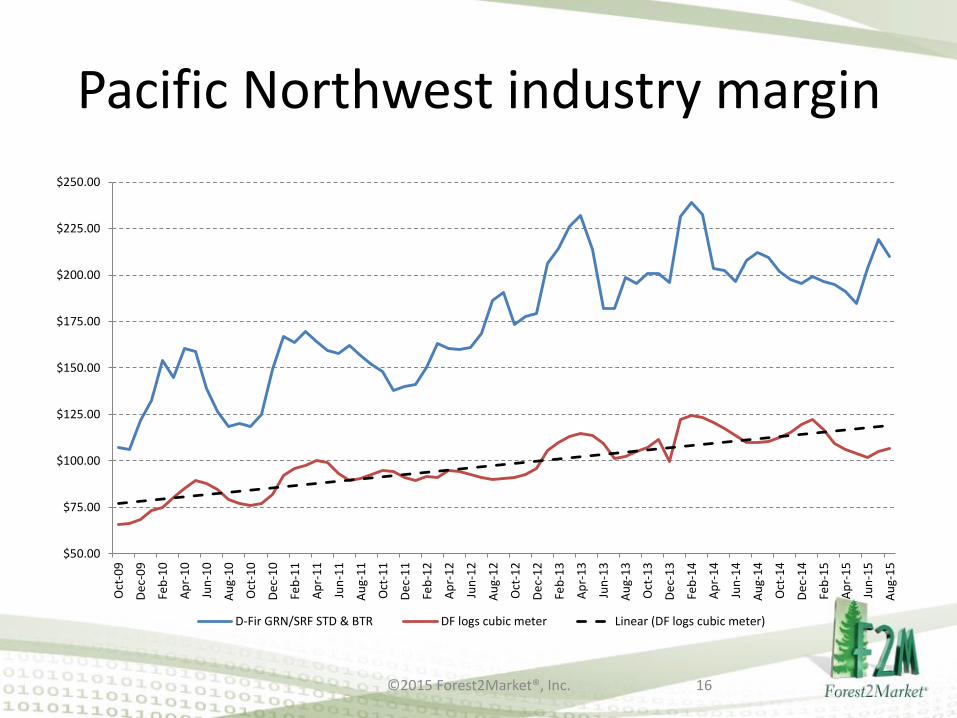
Pacific Northwest industry margin
©2015 Forest2Market®, Inc. 16
$50.00
$75.00
$100.00
$125.00
$150.00
$175.00
$200.00
$225.00
$250.00
Oct
-09
De
c-0
9
Feb
-10
Ap
r-1
0
Jun
-10
Au
g-1
0
Oct
-10
De
c-1
0
Feb
-11
Ap
r-1
1
Jun
-11
Au
g-1
1
Oct
-11
De
c-1
1
Feb
-12
Ap
r-1
2
Jun
-12
Au
g-1
2
Oct
-12
De
c-1
2
Feb
-13
Ap
r-1
3
Jun
-13
Au
g-1
3
Oct
-13
De
c-1
3
Feb
-14
Ap
r-1
4
Jun
-14
Au
g-1
4
Oct
-14
De
c-1
4
Feb
-15
Ap
r-1
5
Jun
-15
Au
g-1
5
D-Fir GRN/SRF STD & BTR DF logs cubic meter Linear (DF logs cubic meter)
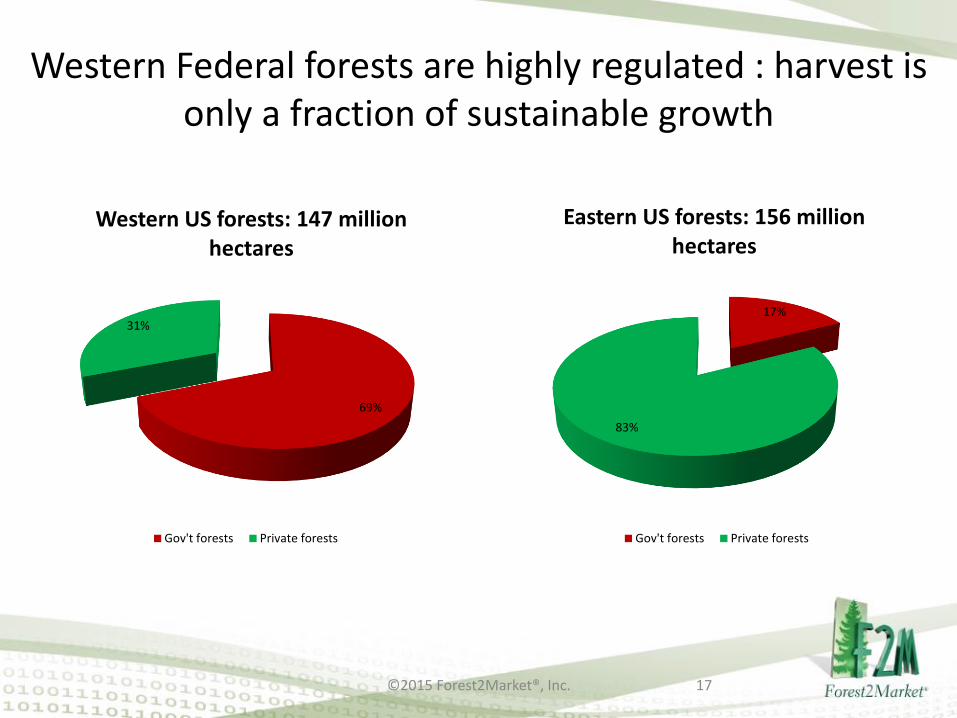
Western Federal forests are highly regulated : harvest is only a fraction of sustainable growth
©2015 Forest2Market®, Inc. 17
69%
31%
Western US forests: 147 million hectares
Gov't forests Private forests
17%
83%
Eastern US forests: 156 million hectares
Gov't forests Private forests
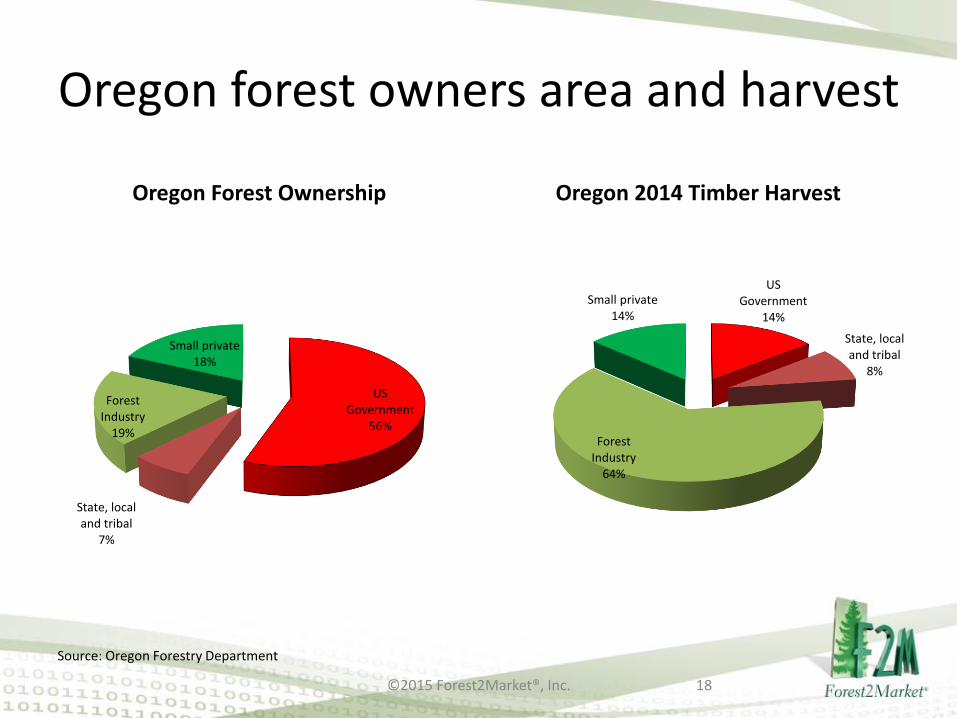
Oregon forest owners area and harvest
©2015 Forest2Market®, Inc. 18
US Government
56%
State, local and tribal
7%
Forest Industry
19%
Small private18%
Oregon Forest Ownership
US Government
14%
State, local and tribal
8%
Forest Industry
64%
Small private14%
Oregon 2014 Timber Harvest
Source: Oregon Forestry Department

US Southern pine
©2015 Forest2Market®, Inc. 19
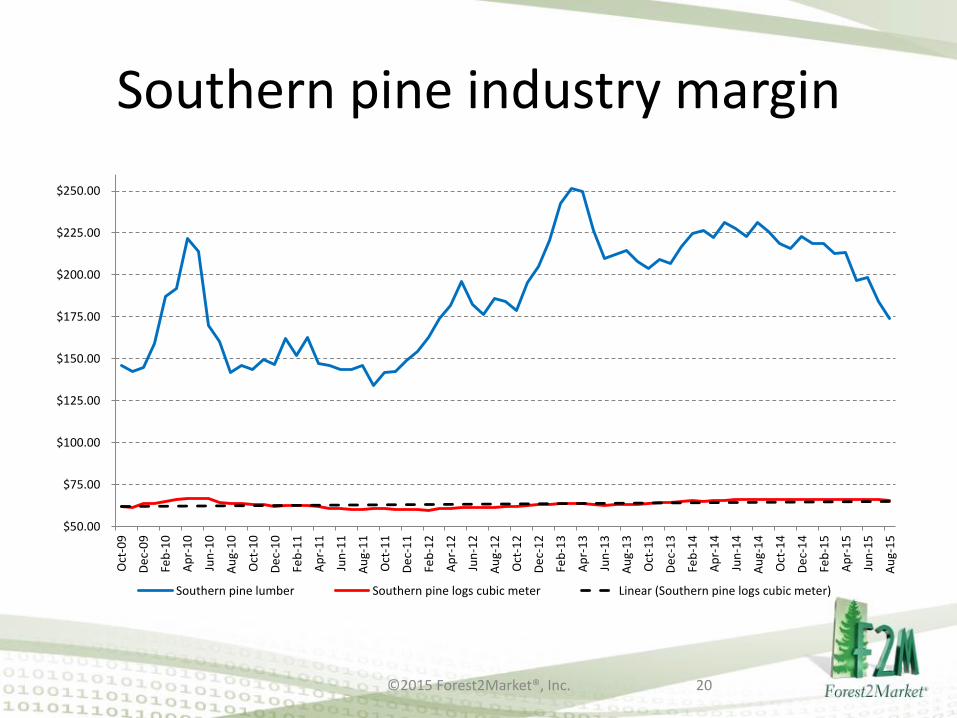
Southern pine industry margin
©2015 Forest2Market®, Inc. 20
$50.00
$75.00
$100.00
$125.00
$150.00
$175.00
$200.00
$225.00
$250.00
Oct
-09
De
c-0
9
Feb
-10
Ap
r-1
0
Jun
-10
Au
g-1
0
Oct
-10
De
c-1
0
Feb
-11
Ap
r-1
1
Jun
-11
Au
g-1
1
Oct
-11
De
c-1
1
Feb
-12
Ap
r-1
2
Jun
-12
Au
g-1
2
Oct
-12
De
c-1
2
Feb
-13
Ap
r-1
3
Jun
-13
Au
g-1
3
Oct
-13
De
c-1
3
Feb
-14
Ap
r-1
4
Jun
-14
Au
g-1
4
Oct
-14
De
c-1
4
Feb
-15
Ap
r-1
5
Jun
-15
Au
g-1
5
Southern pine lumber Southern pine logs cubic meter Linear (Southern pine logs cubic meter)
Canadian forest industry moves south
• The Southern US pine region has abundant, low cost timber from productive, well managed private forests
• Canfor, West Fraser and Interfor; leading Canadian forest products companies hedge their bets
• 35 pine sawmills in Texas, Arkansas, Louisiana, Mississippi, Alabama, Georgia, South Carolina, North Carolina and Florida are now owned by these three companies
• 11,000,000 cubic meters of production capacity• 30 % of Southern pine framing construction lumber
production
©2015 Forest2Market®, Inc. 21

US pulp and paper industry
©2015 Forest2Market®, Inc. 22
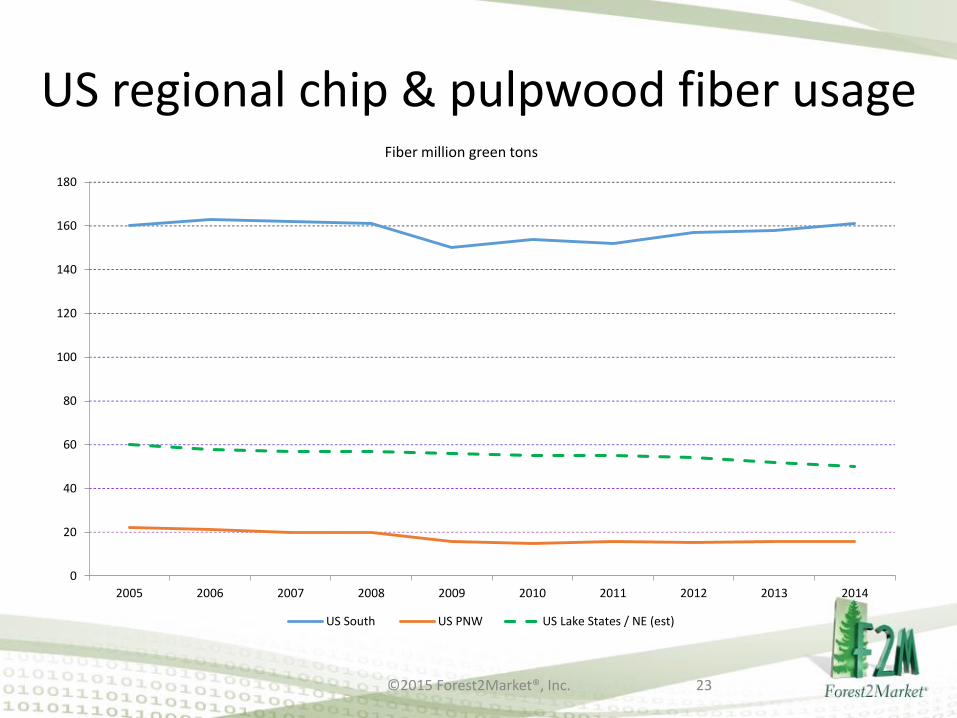
US regional chip & pulpwood fiber usage
©2015 Forest2Market®, Inc. 23
Fiber million green tons
0
20
40
60
80
100
120
140
160
180
2005 2006 2007 2008 2009 2010 2011 2012 2013 2014
US South US PNW US Lake States / NE (est)

Regional US pulpwood pricing
©2015 Forest2Market®, Inc. 24
$20.00
$25.00
$30.00
$35.00
$40.00
$45.00
$50.00
$55.00
$60.00
4Q2012 1Q2013 2Q2013 3Q2013 4Q2013 1Q2014 2Q2014 3Q2014 4Q2014 1Q2015 2Q2015 3Q2015
South PNW Lake States/Northeast
US Dollars per green ton
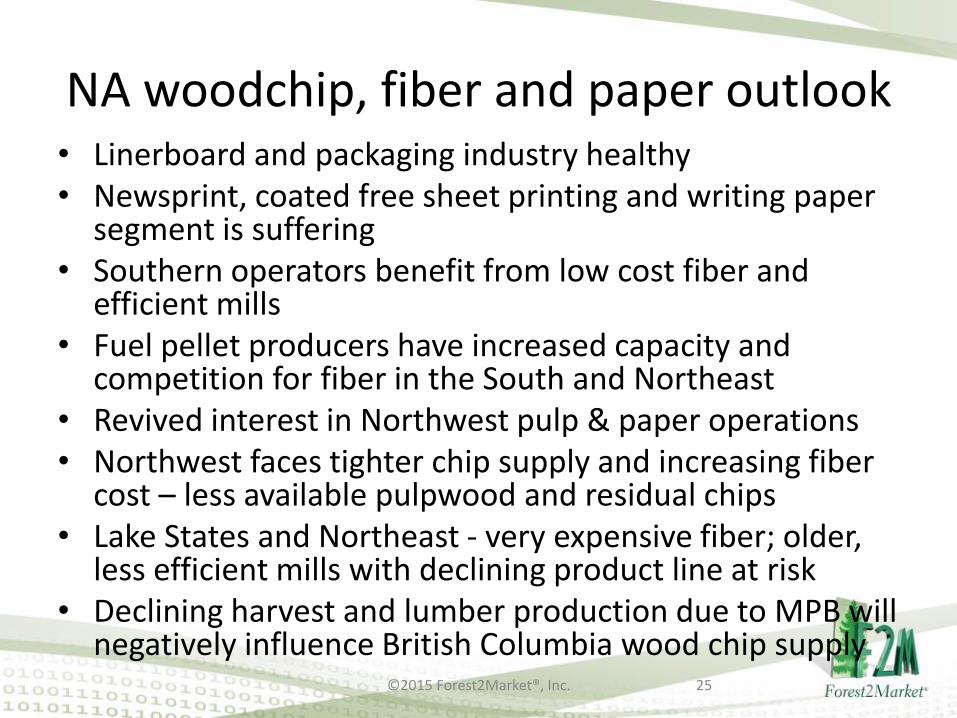
NA woodchip, fiber and paper outlook• Linerboard and packaging industry healthy• Newsprint, coated free sheet printing and writing paper
segment is suffering• Southern operators benefit from low cost fiber and
efficient mills• Fuel pellet producers have increased capacity and
competition for fiber in the South and Northeast• Revived interest in Northwest pulp & paper operations• Northwest faces tighter chip supply and increasing fiber
cost – less available pulpwood and residual chips• Lake States and Northeast - very expensive fiber; older,
less efficient mills with declining product line at risk • Declining harvest and lumber production due to MPB will
negatively influence British Columbia wood chip supply ©2015 Forest2Market®, Inc. 25
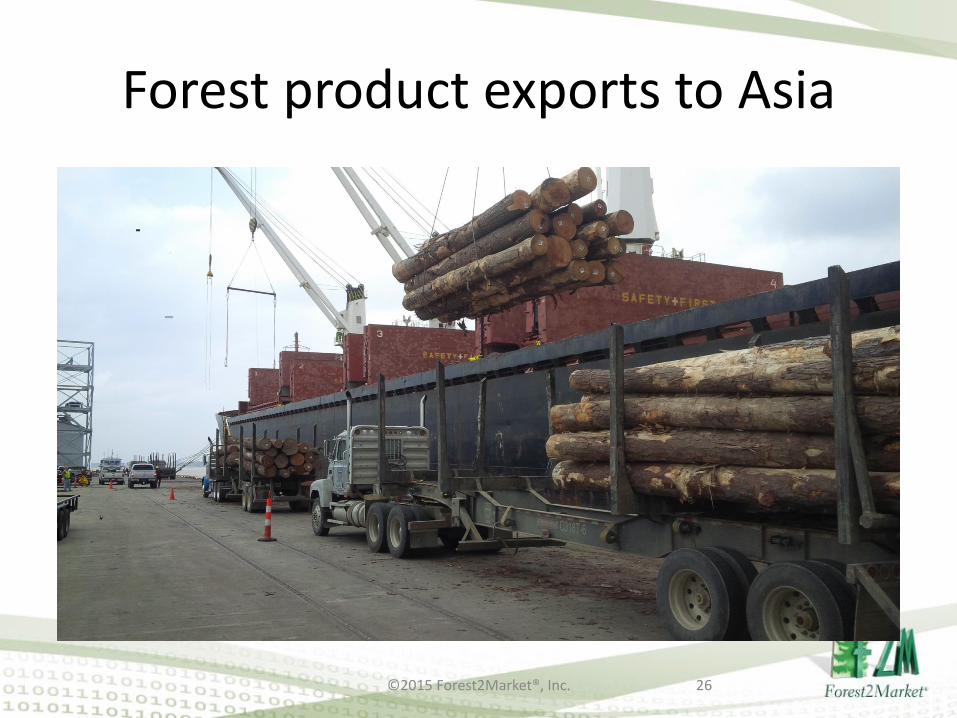
Forest product exports to Asia
©2015 Forest2Market®, Inc. 26

Strong $ benefits New Zealand loggers
©2015 Forest2Market®, Inc. 27
0
5000
10000
15000
20000
25000
30000
2006 2007 2008 2009 2010 2011 2012 2013 2014 2015
vo
lum
e c
ub
ic m
ete
rs
China log imports by selected country
Russia New Zealand USA CanadaSource: China Customs

Asian demand for US logs slowing
©2015 Forest2Market®, Inc. 28
0
1000
2000
3000
4000
5000
6000
7000
8000
Vo
lum
e 1
000's
cu
bic
mete
r
Northwest Log Exports to Asia - Breakbulk Volume
Japan Korea ChinaSource: US Dept of CommerceSource: US Dept of Commerce
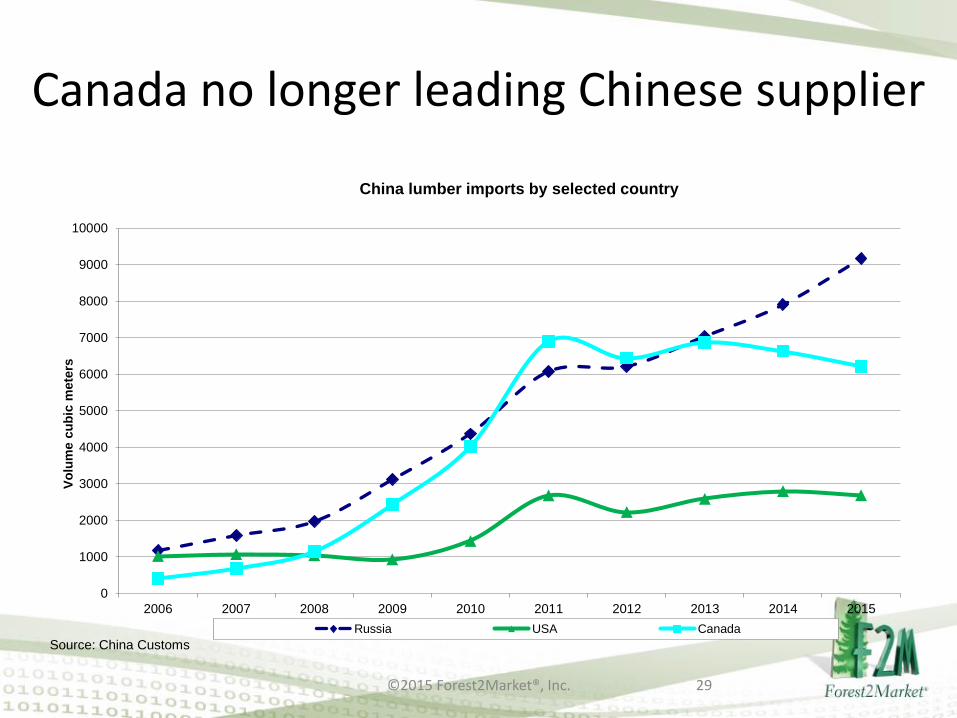
Canada no longer leading Chinese supplier
©2015 Forest2Market®, Inc. 29
0
1000
2000
3000
4000
5000
6000
7000
8000
9000
10000
2006 2007 2008 2009 2010 2011 2012 2013 2014 2015
Vo
lum
e c
ub
ic m
ete
rs
China lumber imports by selected country
Russia USA Canada
Source: China Customs

Concluding thoughts
• Soft recovery for US housing market
• Multi-level building with wood
• British Columbia production declining
• Growth for Southern US pine industry
• US linerboard, packaging business is strong
• Strong US $ influence on wood imports & exports
• China’s demand for wood products is slowing
• South American imports: productive plantations, modern pulp and panel mills, Asia and US $ ?
©2015 Forest2Market®, Inc. 30

Forest2Market: The highest quality wood raw material analysis available
Gordon CulbertsonDirector-International Business Development
(541) 285 [email protected]
Forest2Market®15720 Brixham Hill Avenue, Suite 550Charlotte, NC 28277
www.forest2market.com
©2015 Forest2Market®, Inc. 31

Merci vielmal!
©2015 Forest2Market®, Inc. 32