norms of fairness - university of michigan
TRANSCRIPT

Norms of Fairness
by
Alexander Kikuta Chavez
A dissertation submitted in partial fulfillment
of the requirements for the degree of
Doctor of Philosophy
(Psychology)
in the University of Michigan
2011
Doctoral Committee:
Professor Richard D. Gonzalez, Chair
Professor Shinobu Kitayama
Professor Carolyn Yung-Jin Yoon
Assistant Professor Stephen M. Garcia
Professor Cristina Bicchieri, University of Pennsylvania

ii
Acknowledgements
I would like to express my gratitude to Richard Gonzalez, for his guidance, instruction,
and support throughout my doctoral career, to Cristina Bicchieri, for her overall support
and for influencing the way I think about social interactions, to the other members of my
doctoral committee, Shinobu Kitayama, Carolyn Yoon, and Stephen Garcia, for
volunteering their time and effort to help me to complete my dissertation, and to the
teachers who are too many to name who have shaped and influenced my intellect over the
years. For their support in getting me into or through graduate school, I thank especially
my parents for their sacrifices, Richard Gonzalez, Cristina Bicchieri, Jun Zhang, Jacqui
Smith, Steve Kimbrough, Rob Kurzban, Dario Salvucci, and my partner, friends, and
family.

iii
Table of Contents
Acknowledgements……………………………………………………………..…… ii
List of Figures……………………………………………………………………..… iv
List of Tables………………………………………………………………………… vi
Abstract……………………………………………………………………………… vii
Chapter 1: Introduction ....................................................................................................... 1
Chapter 2: Upholding Different Norms of Fairness ........................................................... 9
Chapter 3: Behaving as Expected: Public Information and Fairness Norms .................... 31
Chapter 4: Norm Conformity, Manipulation, and Evasion: Experimental Evidence ....... 66
Chapter 5: Conclusion....................................................................................................... 94
iv
List of Figures
Figure 2.1 Mean payoff adjustments by fairness context, offer, and punishment condition.
To depict directions (but not magnitudes) of covariation, ellipses are drawn
corresponding to bivariate Normal quantiles with correlations matched to the data. No
ellipses are drawn for the several cells in the punish-only condition in which all
participants made an adjustment of $0.00 to the Proposer or Responder. ........................ 14
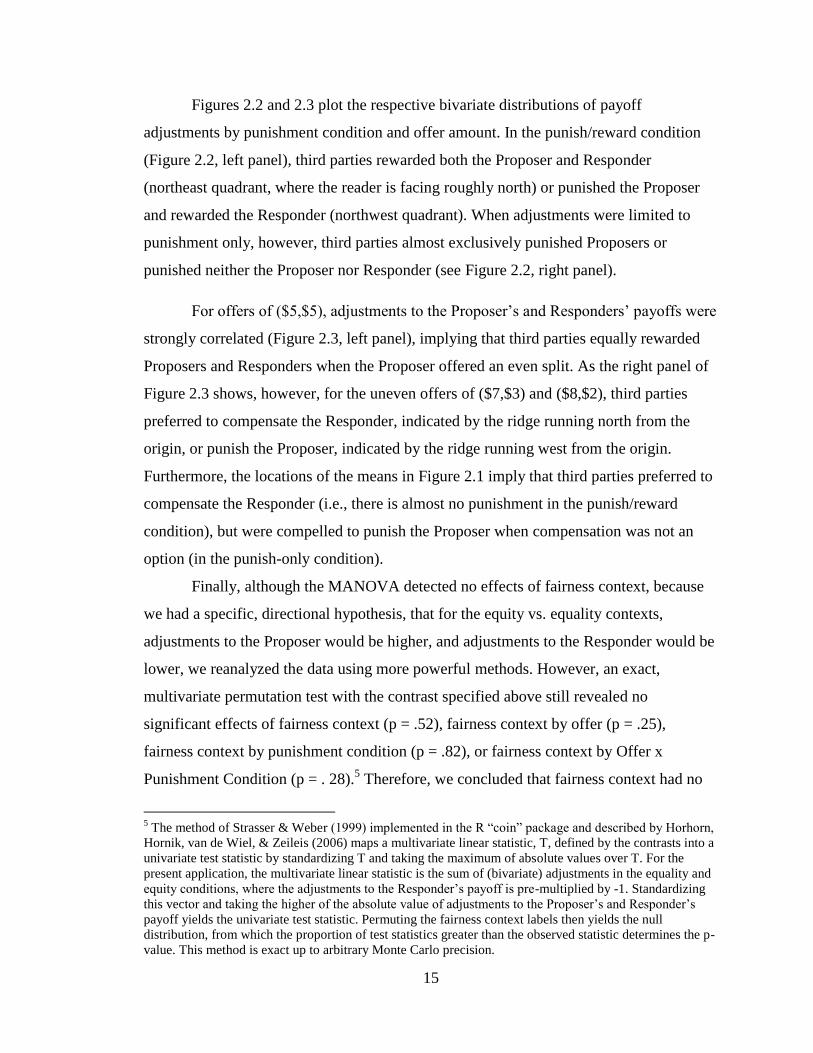
Figure 2.2. Distribution of payoff adjustments by punishment condition. ....................... 16
Figure 2.3. Distribution of payoff adjustments by offer. .................................................. 16
Figure 3.1. Choice proportions of (5,5), (8,2), and coin in each level of Information x
Salience. Error bars are bootstrap estimates of one standard error of the choice
proportion. ......................................................................................................................... 42
Figure 3.2. Boxplots of beliefs about normative expectations in the full information
condition. Responders‟ mean beliefs were 97.0%, 12.6%, and 63.6%, for (5,5), (8,2), and
Coin, respectively. Proposers‟ mean beliefs were 96.6%, 14.9%, 65.0%. ....................... 46
Figure 3.3. Boxplots of beliefs about normative expectations in the private information
condition. Responders‟ mean beliefs were 98.1% and 16.0%, for (5,5) and (8,2),
respectively. Proposers‟ mean beliefs were 99.1% and 12.5%......................................... 47
Figure 3.4. Boxplots of beliefs about normative expectations in the limited information
condition. Responders‟ mean beliefs were 96.0%, 10.0%, and 54.4%, for (5,5), (8,2), and
Coin, respectively. Proposers‟ mean beliefs were 98.8%, 17.6%, 49.3%. ....................... 48
Figure 3.5. Predicted probability of (8,2) as a function of the Proposer‟s estimate of the
proportion of Responders who considered a) (8,2) fair, and b) Coin fair, by condition. For
each graph, the other beliefs are held fixed at their median values. ................................. 51
Figure 3.6. Predicted probability of Coin as a function of the Proposer‟s belief about
Responders‟ normative expectations by condition. The other beliefs are held fixed at their
median values.................................................................................................................... 53
Figure 4.1. Proportions/counts of (5,5), (8,2), and Coin choices (indexed by lines labeled
5, 8, and C) by condition. N = 32 for each condition. ...................................................... 74
v
Figure 4.2. Predicted choice probabilities in the full information condition, by Factors 1
and 2, based on the model in Table 4.4. To compute the predicted probability as a
function of Factor 1 (left graph), the value of Factor 3 was held fixed at its mean.
Analogously, the value of Factor 1 was held fixed at its mean in the right graph. ........... 83
Figure 4.3. Predicted choice probabilities in the private information condition by Factors
1 and 4, based on the model in Table 4.4. To compute the predicted probability as a
function of Factor 1 (left graph), the value of Factor 4 was held fixed at its mean.
Analogously, the value of Factor 1 was held fixed at its mean in the right graph. ........... 84
Figure 4.4. Predicted choice probabilities in the limited information condition by Factor
3......................................................................................................................................... 84

vi
List of Tables
Table 2.1 Summary of Fairness Beliefs by Fairness Context ........................................... 18
Table 2.2 Factor Loadings for Fairness Beliefs from a Five-Factor EFA ....................... 19
Table 2.3 Logistic Regression of Fairness Context on Factor Scores .............................. 21
Table 3.1 Model comparisons for information and salience. P-values are based on
bootstrap quantiles (see Appendix A for details), and not the χ2 distribution. ................. 43
Table 3.2 Multinomial logit model of information and salience as predictors of choices.
Maximum likelihood (ML) and bootstrap standard error estimates are included. P-values
are based on bootstrap quantiles (see Appendix A for details). The reference level for
choice is Coin, for information is the full condition, and for salience is the salient
condition. .......................................................................................................................... 44
Table 3.3 Normative expectations of Responders. Each cell contains the proportion
(fraction) of Responders who indicated that the choice was fair. .................................... 46
Table 3.4 Multinomial logit model of information and beliefs about Responders’
normative expectations as predictors of choices. The model was selected via a stepwise
search (AIC = 166.83). ..................................................................................................... 50
Table 3.5 Rejection rates and frequencies by offer source, offer, and condition. ............ 53
Table 4.1 Proposers’ beliefs about whether the majority of Responders would accept
(5,5) and (8,2) by information condition and offer source. .............................................. 71
Table 4.2 Means (SEMs) for the Belief Data .................................................................... 76
Table 4.3 Factor Loadings for Proposers’ Belief Data from a Four-Factor EFA ........... 80
Table 4.4 Logit Coefficients of Factor Scores as Predictors of Proposers’ Choice, by
Information Condition ...................................................................................................... 83
Table 4.5 Tabulation of Offer Patterns Across Conditions .............................................. 86
Table 4.6 Conditional Choice Probabilities for a Two-Class Latent Class Model .......... 87

vii
ABSTRACT
Norms of Fairness
by
Alexander Kikuta Chavez
Chair: Richard D. Gonzalez
Chapter 1 introduces the topic of fairness. Chapter 2 measures the beliefs and behavior of
third parties who were given the opportunity to sanction or reward individuals who
engaged in an economic bargaining game under different social contexts. Third parties
preferred to compensate the victim of an unfair bargaining outcome rather than sanction
the perpetrator, but were willing to punish the perpetrator when this was the only option
available. Third party beliefs about whether unequal bargaining outcomes were fair
differed based on the bargaining context, but actual sanctioning and compensation
behavior did not.
Chapter 3 uses an economic bargaining game to demonstrate that both fair
behavior and perceptions of fairness depend upon beliefs about what one ought to do in a
situation – that is, upon normative expectations. We manipulated such expectations by
creating informational asymmetries about the offer choices available to the Proposer, and

viii
found that behavior varies accordingly. Proposers and Responders showed a remarkable
degree of agreement in their beliefs about which choices are considered fair. We discuss
how these results fit into a theory of social norms.
Chapter 4 uses an economic bargaining game to test for the existence of two
phenomena related to social norms, namely norm manipulation – the selection of an
interpretation of the norm that best suits an individual – and norm evasion – the
deliberate, private violation of a social norm. We found that the manipulation of a norm
of fairness was characterized by a self-serving bias in beliefs about what constituted
normatively acceptable behavior, so that an individual who made an uneven bargaining
offer genuinely believed it was fair, even though recipients of the offer considered it to be
unfair. In contrast, norm evasion operated as a highly explicit process. When they could
do so without the recipient‟s knowledge, individuals made uneven offers despite knowing
that their behavior was unfair. Chapter 5 concludes.
1
Chapter 1
Introduction
What is considered fair depends on context. Consider two cake-loving children who
bargain over how to divide a cake. If one child did all the work – finding the recipe,
mixing the batter, decorating the cake – while the other went outside to play, the hard
worker might demand more of the cake, and the loafer would consider this demand fair.
If instead a parent gave the cake to the children, each child would expect a share of one-
half; any other division would be considered unfair, everything else being equal. In the
first case, equity defines fair division, and in the second, equality defines fair division.
One way of understanding situations such the above is through the Ultimatum
Game (Guth, Schmittberger, & Schwarze, 1982) in which Proposers propose a division
of a sum of money – e.g., $10.00 – to Responders, who accept or reject the offer. In the
case of a rejection, both parties get nothing. In the case of an acceptance, each player
receives the amount specified by the proposal. Camerer (2003, p. 9) argues that the game
is a model of the last steps in bargaining, such as the final offer before a strike goes into
effect or the last moment for a plea bargain to be considered before a case goes to trial,
and is therefore a useful fundamental component in constructing more complex theories
of unstructured bargaining. Studied in a game theoretic framework, the Ultimatum Game
provides a unique predicted outcome: assuming the Responder is self interested and
therefore prefers some money over none, the Proposer will reason backwards and offer
the smallest divisible amount (e.g., $0.01) of the total, which the Responder will accept.
But both introspection and a slew of behavioral studies tell us that this prediction is
wrong. An offer of $0.01 will be considered unfair – perhaps insulting – and will be
rejected by Responders; Responders, Proposers, and even uninvolved third party
observers all can predict this, and Proposers will offer a larger, “fairer” fraction of the
sum.
2
Background. But which bargaining outcomes are considered fair? What portion of the
sum will Proposers offer, what are the rejection rates of Responders for offers? And most
importantly, what psychological constructs motivate these judgments and decisions? In a
review, Camerer (2003) reported that Proposers offer 40% or 50% on average, and that
Responders reject offers of 20% or less about half the time. In their original experiment,
which varied the total sum being bargained over, Guth et al. (1982, p. 384) attributed
their mean offer of 35% and low rejection rates to considerations both of fairness and
absolute cost, stating that Responders seemed to accept all “fair amount[s]” but would
only punish unfair amounts if the absolute cost of rejection was small, and that Proposers
anticipated this. An implication of this interpretation is that if stakes were raised,
Responders would accept offers that were less equal because the absolute cost of
rejection would be higher, and that Proposers would anticipate this, and therefore make
less equal offers.
This interpretation proved to be incorrect, however, as neither rejection rates nor
the distribution of offer amounts varied (much) when the amount being bargained over
was manipulated in a variety of studies, even for very large stakes, at least for
inexperienced play (i.e., first-round behavior). Hoffman, McCabe, & Smith (1996) found
no differences in Responders‟ rejection rates or in the distributions of Proposers‟ offers in
the United States for stakes of $10.00 vs. $100.00. List & Cherry (2000) found no
differences in mean proportional offer amounts or rejection rates for stakes of $20.00 vs.
$400.00 in the United States – the lack of a difference in rejection rates applied even
when controlling for the effect of the proportion of the sum being offered in a logistic
regression. Slonim & Roth (1998) found no differences using stakes that varied by a
factor of 25 (60 Sk vs. 1500 Sk) in the Slovak Republic. Cameron (1999) found no
differences in Indonesia for very large stakes of 5,000 vs. 200,000 Rupiah – roughly three
times the monthly expenditure of the average participant, although she found some
evidence that Proposers offered larger proportions of the sum as stakes increase, likely
due to risk aversion.
Models of fairness. The finding that rejection rates remain constant across large changes
in stakes implies that Responders‟ judgments about the fairness of an offer are not in
3
absolute terms, but in relation to the Proposer‟s payoff or the total sum being divided.
Fehr & Schmidt (1999) formalized a general theory of inequality aversion in which an
individual‟s choice utility is defined as a combination of self-interest and the difference
between the individual‟s and others‟ payoffs. For example, in a $10.00 Ultimatum Game,
a Proposer‟s utility for an even-split outcome in which there is no inequality would be
5.00 (the Proposer‟s payoff), but for an uneven split where the Proposer receives $8.00
and the Responder $2.00 would be 8.00 - 6.00β, where 8.00 is the Proposer‟s payoff, 6.00
is the difference between the Proposer‟s and Responder‟s payoffs (i.e., the amount of
inequality), and β which is specified to be less than 1.00 and greater than 0.00 is a
parameter that represents the degree to which the individual dislikes inequality.1 As
Chapter 3 discusses, however, this model of inequality aversion – and any model where
the utility function only includes the distribution of players‟ payoffs – cannot explain
differences in behavior when material consequences are held fixed, but context varies. An
unequal division of a cake is considered unfair when two people share equally in
preparing the cake, but is considered fair when one person does all the work; in a
bargaining context, proposals for how to divide a good fairly reflect such non-material,
contextual considerations.
Incorporating beliefs. An alternative theoretical approach that I adopt is that of
psychological games (Geanakoplos, Pearce, & Stacchetti, 1989), in which players‟ beliefs
enter directly into the utility function. Rabin (1993) provides an early and important
example applied to the concept of fairness, which I sketch here. In a game with players A
and B, player A‟s utility depends on a combination of A‟s own payoff, how kind A
perceives B as being, and the product of how kind A perceives B as being and how kind
A perceives A as being. Kindness is operationalized in kindness functions that specify
how much A believes A‟s and B‟s payoffs deviate from their “equitable payoffs,” which I
discuss subsequently. B‟s utility and kindness functions are defined analogously. Note
that for A to determine how kind B is being, A must fix a second-order belief about what
B believes A will do. To summarize, both players prefer greater payoffs, all else held
equal, but suffer a disutility if they believe the other player is being unkind to them
1 Fehr & Schmidt (1999) also include a disutility term for payoff inequalities that are not in favor of the
individual to represent envy; we do not discuss this aspect off their model further.
4
(giving them less than their equitable payoff), and suffer a separate product utility or
disutility that depends on whether they are being kind or unkind and whether they
perceive the other player as being kind or unkind. The last term models both positive and
negativity reciprocity; ceteris paribus, each player prefers to be kind if the other player is
being kind, but prefers to be unkind if the other player is be unkind. Finally, the relative
weights of preferences for selfishness and kindness / reciprocity are controlled by a
parameter, β.2
Rabin‟s model allows utilities to vary as a function of context – and consequently,
as a function of what is considered fair – but only indirectly. He defines the “equitable
payoff” for A as the average of A‟s highest and lowest possible payoffs given whatever B
believes A will do, and for B the average of B‟s highest and lowest possible payoffs given
whatever A believes B will do.3 If context changes, B‟s belief about what A will do may
change, and A‟s belief about what B will do may change; hence, equitable payoffs may
change. This approach to modeling fairness is too broad, however, as can be seen by
considering behavioral regularities that do not involve normative expectations.
Suppose two cars (A and B) are driving toward each other on a narrow road, and
can choose to move to their respective right (R) or left (L) to avoid each other. If both
cars move to their right or both cars move to their left, no collision occurs; if one moves
to the right and the other left, they collide. Let collision yield a payoff of -1.0 and no
collision 1.0. If A believes B will choose R, but also holds the second-order belief that B
believes A will choose L (which would result in a collision), then A suffers disutility
because B is being “unkind” (according to A‟s beliefs, B is intentionally choosing the
outcome of collision). In this case, A‟s payoff for choosing R (no collision) can be shown
to be 1.0-β, and A‟s payoff for choosing L (collision) can be shown to be -1.0.4 This
2 The parameter β is not in Rabin‟s original model, but is an addition by Camerer (2003, p. 106). Rabin
(1993, p. 1287) normalizes his kindness functions, which bounds them in the interval [-1, .5]. Therefore,
kindness functions (but not utilities) are invariant to affine transformations of the payoffs, which implies
that the model‟s predictions depend on the payoff scale. Adding a weighting parameter explicitly models
the relative preferences for fairness and selfishness. 3 Rabin also requires that the outcomes corresponding to each of these payoffs must be Pareto efficient,
which means that neither player can improve her/his payoff without decreasing the other‟s payoff. 4 Because collision is not a Pareto efficient outcome (since either player could move to the other side of the
road and increase both players‟ payoffs), there is a single outcome of no collision on the Pareto frontier, so
each player‟s equitable payoff is 1.0. By choosing R, A experiences a utility of 1.0 from the payoff
5
implies that if β > 1, A will actually prefer to collide with B because of A‟s distaste for
unkindness. In fact, collision can be an equilibrium in Rabin‟s model (see the similar
“Battle of the Sexes” example on pp. 1285-1288).
Rabin‟s model embeds a notion of equity (or kindness) defined solely by payoff
inequalities, leading to the bizarre prediction that A can prefer the outcome of collision if
A believes 1) that B will move to the right and 2) that B believes A will move to the left,
because B is being mean. As I argued at the beginning of this chapter, fairness depends
on context. Payoff inequalities are not always inequitable, unkind, or unfair, and Chapters
2-4 provide demonstrations of this claim in several different contexts. Thus, if a model of
fairness preferences is to be successful, it must not endogenize what it means to be fair.
At the same time, beliefs matter, and the expectations of others can enter directly into the
utility function, as I argue below.
Social norms. Bicchieri (2006, p. 52) defines a utility function in which player i derives
utility from i‟s payoff and disutility from the maximum payoff difference that i generates
from violating a relevant social norm. The logic is simple: if there is no social norm that
applies, there can be no norm violation, and player i‟s utility equals i‟s payoff. If there is
a relevant social norm that applies (e.g., split the cake equally, or split the cake
equitably), and player i violates this norm to the effect of causing some other player j a
lower payoff than j could have received had i conformed to the norm, i suffers a
disutility. To complete the model, Bicchieri defines a social norm as a rule that applies to
a specific population and context that individuals in that population prefer to follow if
they (a) expect others in the population follow the rule (empirical expectations) and (b)
believe that others in the population expect them to follow the rule and may sanction
transgressions (normative expectations). In order for the social norm to be followed,
individuals must know the social norm exists, and believe that empirical and normative
expectations are present. Driving on the right side of the road is a convention, not a social
corresponding to no collision, and a utility of -β from the unkindness A perceives in B (B is “unkind” by
choosing to give A a payoff of -1.0 when A‟s equitable payoff is 1.0; this difference is normalized by
dividing by 2.0, the difference between A‟s highest and lowest possible payoffs), for a sum equaling 1 - β.
By choosing L, A experiences a utility of -1.0 from the payoff corresponding to a collision, a utility of -β
from B‟s unkindness (see above), and a utility of β from the product term (A‟s utility from B‟s perceived
unkindness is -1.0, and A‟s perceived unkindness toward B is also -1.0, so that their product is 1.0), for a
sum of -1.0.

6
norm, because individuals prefer to follow the rule regardless of the presence of
normative expectations (see Bicchieri, 2006, pp. 39-44). In fact, the necessity of
normative expectations is what distinguishes social norms from other types of behavioral
regularities in Bicchieri‟s model (for conventions, a conditional preference based on the
presence of empirical expectations is sufficient for conformity to the rule).
Because there is no social norm of driving on the right side of the road, according
to Bicchieri‟s model, individuals suffer no disutility from unequal payoffs, and no
predictions such as voluntary collision arise. On the other hand, when there is a social
norm that is followed, such as splitting the cake equally, individuals avoid violating it
(unless payoffs are sufficiently high) because it creates disutility.
Context. From the discussion above, it is clear that context affects what is considered fair,
and more generally, rules for how to divide goods. Perhaps the most obvious variable that
can be manipulated to explore the effect of context is culture. In a large cross-cultural
study of bargaining in small-scale societies, Henrich et al. (2001) found that Aché of
Paraguay and Lamelara of Indonesia made hyperfair offers (offers greater than 50% of
the sum being divided) on average which Responders accepted. They attributed this
behavior to norms of oversharing, as Lamelara are whale hunters who often have a
surplus of whale meat that they must find efficient ways of dividing, and, “Aché hunters,
returning home, quietly leave their kill at the edge of camp, often claiming that the hunt
was fruitless; their catch is later discovered and collected by others and then meticulously
shared among all in the camp” (p. 76). The Au and Gnau of Papua New Guinea, on the
other hand, also made more hyperfair offers than average, but Responders in these
cultures had high rejection rates for these offers, which the authors attributed to a norm
of competitive gift-giving in which accepting a gift can incur a repayment obligation.
Lastly, the Machiguenga of Peru showed some of the lowest rates of cooperation, with a
mean offer of 26%; moreover, Responders almost never rejected an offer, indicating that
no equality norm of fairness applied.
Chapter 2 reviews evidence that norms of fair division can depend on
experimentally-induced contexts of equity or equality. In a classic paradigm, Hoffman,
McCabe, Keith, & Smith (1994) described a $10.00 Ultimatum Game as a market

7
exchange in which a seller (a Proposer) set a price (chose an offer amount) for a good
that a buyer (a Responder) could buy (accept or reject) and compared their results to
those from studies using normal framing. They also assigned roles of buyer and seller
either at random or based on performance on an arbitrary quiz, where higher-scoring
participants were assigned the role of Proposer. Offers were smaller both in the market
context and when roles were based on quiz performance, with less than 45% of offers
being $4.00 or greater for the combination of these two conditions, compared to 85% of
offers being $4.00 or greater for the non-market, random-assignment condition. By
manipulating instructions, Hoffman et al. manipulated the relevant norm that governed
behavior.
Summary. As the examples from cross-cultural studies and the results of Hoffman et al.
(1994) show, what is considered fair varies by culture and context. It is natural to expect
that the relationship between social context and behavior is mediated by measureable
beliefs, and the chapters that follow demonstrate using experimental, laboratory methods
that beliefs about what is fair and what others consider fair can affect behavior. Chapter
2 investigates third party sanctioning and compensation behavior under different contexts
of fairness, namely fairness as equal division and fairness as equitable division. Chapter 3
defines a social norm as a behavioral rule that people prefer to follow only under certain
belief-conditions, and argues that fairness is such a rule. By manipulating individuals‟
beliefs that others expect them to follow, we showed that people at times behave fairly
and at other times unfairly in a bargaining task despite identical material consequences.
Chapter 4 builds on Chapter 3 by further investigating the link between fairness beliefs
and behavior, and tests for the presence of two phenomena related to social norms,
namely their manipulation and evasion. By directly measuring beliefs, these studies
extend the large, existing literature that often implicitly assumes beliefs about what is
considered fair mediate the relationship between context and behavior. Chapter 5
concludes.
8
References
Bicchieri, C. (2006). The grammar of society: The nature and dynamics of social norms.
Cambridge: Cambridge University Press.
Camerer, C. (2003). Behavioral game theory: Experiments on strategic interaction.
Princeton, NJ: Princeton University Press.
Cameron, L. A. (1999). Raising the stakes in the ultimatum game: Experimental evidence
from Indonesia. Economic Inquiry, 27, 47-59.
Geanakoplos, J., Pearce, D., & Stacchetti, E. (1989). Psychological games and sequential
rationality. Games and economic behavior, 1, 60-79.
Guth, W., Schmittberger, R., & Schwarze, B. (1982). An experimental analysis of
ultimatum bargaining. Journal of Economic Behavior and Organization, 3, 367–
388.
Fehr, E. & Schmidt, K. M. (1999). A theory of fairness, competition and cooperation.
Quarterly Journal of Economics, 114, 817-868.
Henrich, J., Boyd, R., Bowles, S., Camerer, C., Fehr, E., et al. (2001). In search of homo
economicus: Behavioral experiments in 15 small-scale societies. American
Economic Review, 91(2), 73-78.
Hoffman, E., McCabe, K. A., Keith, S., & Smith, V. (1994). Preferences, property rights,
and anonymity in bargaining games. Games and Economic Behavior, 7, 346–380.
Hoffman, E., McCabe, K. A., & Smith, V. (1996). On expectations and the monetary
stakes in ultimatum games. International Journal of Game Theory, 25(3), 289-
301.
List, J. A. & Cherry, T. L. (2000). Learning to accept in ultimatum games: Evidence from
an experimental design that generates low offers. Experimental Economics, 3, 11-
31.
Rabin, M. (1993). Incorporating fairness into game theory and economics. American
Economic Review, 83, 1281-1302.
Slonim, R. L. & Roth, A. E. (1998). Learning in high takes ultimatum games: An
experiment in the Slovak Republic. Econometrica, 66, 569-596.
9
Chapter 2
Upholding Different Norms of Fairness
Abstract. We measured the beliefs and behavior of third parties who were given the
opportunity to sanction or reward individuals who engaged in an economic bargaining
game under different social contexts. Third parties preferred to compensate the victim of
an unfair bargaining outcome rather than sanction the perpetrator, but were willing to
punish the perpetrator when this was the only option available. Third party beliefs about
whether unequal bargaining outcomes were fair differed based on the bargaining context,
but actual sanctioning and compensation behavior did not.
Introduction
Without legal enforcement, social norms rely on the threat of informal sanctions to
produce norm-conforming behavior. Although sanctions may be enacted by victims of
norm violations, they may be also be imposed by third parties, who are not directly
affected by the violation. Empirical studies have reported evidence of third party
punishment when one party transgresses against another (Kahneman, Knetsch, & Thaler,
1986; Fehr & Fischbacher, 2004; Kurzban, DeScioli, & O‟Brien, 2007). However, these
studies do not distinguish whether punishment is a general response to one party harming
another, or a response to the violation of a specific social norm. Under the first
hypothesis, third parties should sanction transgressors regardless of context. Under the
second hypothesis, sanctioning should depend on the existence and nature of the norm in
question.
An example is the sanctioning of individual who divide a good unfairly, when the
understanding of what constitutes fair division may depend on context. Under contexts of
equality, a fair division is one in which goods are allocated equally amongst all involved
parties. Under contexts of equity, a fair division is one that divides goods according to
each party‟s share due to merit or natural right. If third party punishment is a general
10
mechanism unspecific to context, punishment levels should not differ for contexts that
invoke rules of equity or equality. Alternatively, if punishment is norm-specific, uneven
divisions should be punished less under equity contexts in which one party was entitled to
a greater share of the good.
To test this hypothesis, we focused on a version of the Ultimatum Game (Guth,
Schmittberger, & Schwarze, 1982) in which Proposers proposed a division of a sum of
$10.00 to Responders, who accepted or rejected the offer. In the case of a rejection, both
parties got nothing. Previous studies provided evidence that both Proposer behavior and
second-party punishment are sensitive to different fairness contexts. When the roles of
Proposer and Responder are assigned randomly, Proposers offer an average of 45% of the
sum (for a review, see Camerer, 2003, Chapter 2), which may be attributed to an equality
norm of fairness. But when the role of Proposer was earned by higher scorers on a
general knowledge quiz, Proposers offered an average of only 30% of the sum; moreover,
for low offers such as 20%, rejection rates were the same whether roles were assigned
randomly or based on quiz performance (Hoffman, McCabe, Keith, & Smith, 1994). This
suggests that not only Proposers but also Responders felt that Proposers were entitled to a
larger share under an equity context. Similarly, Falk, Fehr, & Fischbacher (2003) created
different offer contexts by allowing the Proposer to 1) choose between offering 20% and
50%, and 2) choose between offering 20% and 0%. They found that in the first context,
Proposers offered 20% only 31% of the time, but in the second context, always offered
20%. Moreover, in the first context, Responders who were offered 20% rejected the offer
44% of the time, whereas in the second text, Responders who were offered 20% rejected
only 9% of the time. We attribute the differences in Proposer‟s and Responder‟s behavior
to the presence of a norm of equality in the first case.
Is third party punishment also specific to fairness context? To test this hypothesis,
we conducted a two-stage study in which participants engaged in an Ultimatum Game for
$10.00 under an equity or equality context in Stage 1, and in Stage 2, third parties
decided to punish participants from Stage 1 based on their bargaining outcome. To
explore a separate hypothesis that third parties would trade off compensation for
punishment when given the opportunity to do so, we also gave third parties the
11
opportunity to add to the payoffs of the Proposer or Responder. The present paper only
discusses data from Stage 2, as our focus was on sanctioning and compensation behavior.
Methods
Participants. 197 college-age participants took part in our study across 21 experimental
sessions. Advertisements specified that participants would earn 5 USD in addition to an
amount that would depend on decisions made during the experiment.
Procedure. In Stage 1, participants were asked to read an article and were then quizzed
on the contents of the article. They then played a single Ultimatum Game, in which a
Proposer was randomly and anonymously paired with a Responder, and offered a
division of $10.00 in increments of $1.00 to the Responder. That is, the Proposer chose
an offer of $10.00 for the Proposer and $0.00 for the Responder, $9.00 for the Proposer
and $1.00 for the Responder, $8.00 for the Proposer and $2.00 for the Responder, et
cetera, so that the two amounts summed to $10.00 – hereafter, these divisions are denoted
($10,$0), ($9,$1), ($8,$2), and so on, where the first amount is the Proposer‟s payoff and
the second amount is the Responder‟s payoff. The Responder then chose to accept or
reject the offer; in the case of an acceptance, the Proposer and Responder earned the
amounts specified by the offer, but in the case of a rejection, both parties earned nothing.
In the equity condition, the roles of Proposer and Responder were assigned based on quiz
performance, where the instructions emphasized the entitlement of the Proposer: “[T]here
is a definite advantage to being a Proposer,” and, “[T]hose of you who scored in the top
half on the quiz have earned the right to be a Proposer” (see the Appendix for full
details). In the equality condition, roles were assigned randomly.
In Stage 2, participants read a detailed description of the Stage 1 task described
above, including the instructions that Stage 1 participants received in either the equity
condition or the equality condition. Participants in Stage 2 were then given an
opportunity to adjust the payoffs of one pair of participants from Stage 1 whose
photocopied bargaining sheet they saw. The bargaining outcomes we used were ones in
which the Proposer offered ($5,$5), ($7,$3), or ($8,$2).

12
In the punish/reward condition, participants were given $2.50 that they could use
at a ratio of 1:4 to add to or deduct from the actual payoff of a Proposer from Stage 1, and
another $2.50 that they could use at a ratio of 1:4 to add to or deduct from the payoff the
Responder who was paired with the Proposer. The punish-only condition was the same as
the punish/reward condition, except that participants could adjust the Proposer‟s and
Responder‟s payoffs only by deducting from them. Participants were told that they would
have to announce their decision to the room full of other third parties at the end of the
experiment, and that they decisions were therefore not anonymous. The Appendix
provides the full set of instructions that Stage 2 participants saw for the punish/reward
condition; the instructions for the punish-only condition were the same except that the
references to adding to the Proposer‟s payment were removed.
Finally, at the end of the study, Stage 2 participants were given a questionnaire.
The first question read, “Do you believe the following proposal is fair for both the
Proposer and the Responder?” and then listed the 11 possible divisions of the $10.00
sum. The second question read:
“The questions below refer to the first page of this survey, which all participants
in this experiment are answering. After we collect all participants‟ forms, we will
randomly select three questions from this page, for which you will earn a $1.00
bonus each, if you guessed correctly. Now for each line below, please guess
whether the majority of the participants in this room thought that that particular
proposal was fair. Circle your answers,”
and then listed the 11 possible divisions again. The binary responses to these 22 variables
comprise the belief data, which were designed to measure third parties‟ first- and second-
order beliefs about the fairness of each offer.
Design. This led to a 2 x 3 x 2 between-participants design of punishment condition
(punish-only or punish/reward), offer (($5,$5), ($7,$3), or ($8,$2)), and fairness context
(equity or equality). The dependent variable was the pair of adjustments in USD that the
third party made to the Proposer‟s and Responder‟s payoffs. We predicted that the
amounts used to punish the Proposer and reward the Responder would increase with the
amount that the Proposer offered to the Responder, as third parties would find fewer
reasons to adjust payoffs for divisions which were closer to equality. However, we

13
expected the effect of offer would be moderated by fairness context, as uneven offers
would be interpreted as unfair under an equality context but not under an equity context.
As a separate hypothesis, we predicted that participants would trade off punishment and
compensation in the punishment/reward condition, so that the amounts they deducted
from the Proposer‟s payoff would be greater in the punish-only vs. the punish/reward
condition.
Note that MANOVA F-tests used Pillai-Bartlett‟s statistic. All analyses of
variance respected the principle of marginality; i.e., they used Type-II sums of squares.
Results
Overview. Figure 2.1 shows bivariate mean payoff adjustments by fairness context, offer,
and punishment condition. As expected, there was a clear main effect of punishment
condition, as third parties on average made positive adjustments to payoffs in the
punish/reward condition, and made negative adjustments to payoffs in the punish-only
condition. In addition, the amount that the Proposer offered had a strong effect on the
adjustments third parties made to the Proposer‟s and Responder‟s payoffs. There
appeared to be no effect of fairness context.
Adjustment Behavior. A 3 x 2 x 2 MANOVA of adjustments made to the Proposer‟s and
Responder‟s payoffs confirmed significant main effects of offer (F(4, 370) = 11.0, p <
.0001) and punishment condition (F(2, 184) = 46.1, p < .0001)). There were no
significant effects of fairness context (F(2, 184) = 0.4, p = .67), Offer x Fairness Context
(F(4, 370) = 1.7, p = .15), Division x Punishment Condition (F(4, 370) = 0.67, p = .61),
Fairness Context x Punishment Condition (F(2, 184) = 0.1, p =.94), or Fairness Context x
Division x Punishment Condition (F(4, 370) = 1.0, p = 0.44). The effect of punishment
condition was driven by lower adjustments in the punish-only condition vs. the
punish/reward condition, for both the Proposer‟s payoff ($0.85 vs. -$1.79, p < .0001) and
Responder‟s payoff ($2.96 vs. -$0.14, p < .0001). The effect of offer amount was driven
by higher adjustments for offers of ($5,$5) vs. ($7,3), or ($5,$5) vs. ($8,2), for both the
Proposer‟s payoff ($2.33 vs. -$0.95, p < .0001, or $2.33 vs. $1.26, p < .0001) and the
Responder‟s payoff ($2.87 vs. $1.08, p < .001, or $2.87 vs. $1.35, p < .01). There were

14
no differences in adjustments for ($7,3) vs. ($8,2) (p > .05 for both the Proposer‟s and
Responder‟s payoffs).
Figure 2.1 Mean payoff adjustments by fairness context, offer, and punishment condition.
To depict directions (but not magnitudes) of covariation, ellipses are drawn
corresponding to bivariate Normal quantiles with correlations matched to the data. No
ellipses are drawn for the several cells in the punish-only condition in which all
participants made an adjustment of $0.00 to the Proposer or Responder.
That adjustments to the Proposer‟s payoff were higher when the Proposer offered an even
split of ($5,$5) vs. and uneven split of ($7,$3) or ($8,$2) was consistent with our
predictions. However, we did not expect adjustments to the Responder‟s payoff to also be
higher for even splits; in fact, we predicted the opposite, that third parties would
compensate the Responder more for uneven offer. This unexpected finding may be due to
third parties experiencing generalized altruistic motivations from seeing an even split;
alternatively, third parties may have rewarded Responders because they did not want to
create inequality by rewarding only Proposers.
15
Figures 2.2 and 2.3 plot the respective bivariate distributions of payoff
adjustments by punishment condition and offer amount. In the punish/reward condition
(Figure 2.2, left panel), third parties rewarded both the Proposer and Responder
(northeast quadrant, where the reader is facing roughly north) or punished the Proposer
and rewarded the Responder (northwest quadrant). When adjustments were limited to
punishment only, however, third parties almost exclusively punished Proposers or
punished neither the Proposer nor Responder (see Figure 2.2, right panel).
For offers of ($5,$5), adjustments to the Proposer‟s and Responders‟ payoffs were
strongly correlated (Figure 2.3, left panel), implying that third parties equally rewarded
Proposers and Responders when the Proposer offered an even split. As the right panel of
Figure 2.3 shows, however, for the uneven offers of ($7,$3) and ($8,$2), third parties
preferred to compensate the Responder, indicated by the ridge running north from the
origin, or punish the Proposer, indicated by the ridge running west from the origin.
Furthermore, the locations of the means in Figure 2.1 imply that third parties preferred to
compensate the Responder (i.e., there is almost no punishment in the punish/reward
condition), but were compelled to punish the Proposer when compensation was not an
option (in the punish-only condition).
Finally, although the MANOVA detected no effects of fairness context, because
we had a specific, directional hypothesis, that for the equity vs. equality contexts,
adjustments to the Proposer would be higher, and adjustments to the Responder would be
lower, we reanalyzed the data using more powerful methods. However, an exact,
multivariate permutation test with the contrast specified above still revealed no
significant effects of fairness context (p = .52), fairness context by offer (p = .25),
fairness context by punishment condition (p = .82), or fairness context by Offer x
Punishment Condition (p = . 28).5 Therefore, we concluded that fairness context had no
5 The method of Strasser & Weber (1999) implemented in the R “coin” package and described by Horhorn,
Hornik, van de Wiel, & Zeileis (2006) maps a multivariate linear statistic, T, defined by the contrasts into a
univariate test statistic by standardizing T and taking the maximum of absolute values over T. For the
present application, the multivariate linear statistic is the sum of (bivariate) adjustments in the equality and
equity conditions, where the adjustments to the Responder‟s payoff is pre-multiplied by -1. Standardizing
this vector and taking the higher of the absolute value of adjustments to the Proposer‟s and Responder‟s
payoff yields the univariate test statistic. Permuting the fairness context labels then yields the null
distribution, from which the proportion of test statistics greater than the observed statistic determines the p-
value. This method is exact up to arbitrary Monte Carlo precision.

16
effect on the level of adjustments that third parties made to the payoffs of the Proposer or
Responder.
Figure 2.2. Distribution of payoff adjustments by punishment condition.
Figure 2.3. Distribution of payoff adjustments by offer.
17
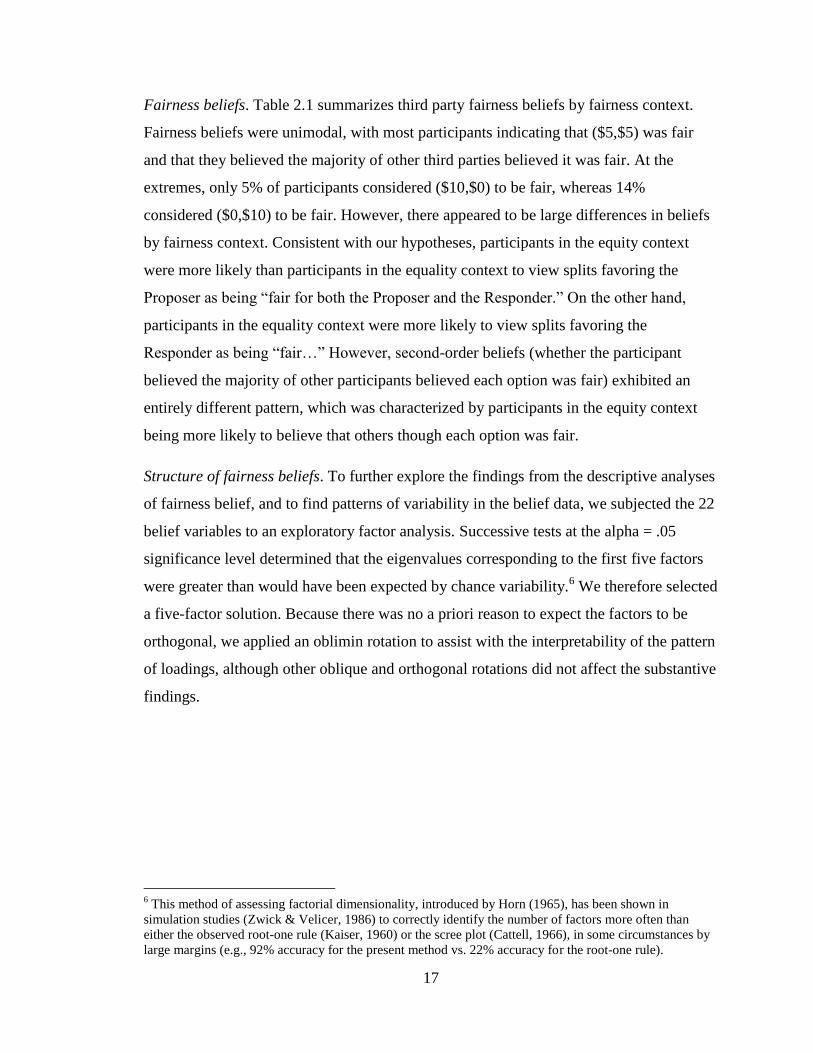
Fairness beliefs. Table 2.1 summarizes third party fairness beliefs by fairness context.
Fairness beliefs were unimodal, with most participants indicating that ($5,$5) was fair
and that they believed the majority of other third parties believed it was fair. At the
extremes, only 5% of participants considered ($10,$0) to be fair, whereas 14%
considered ($0,$10) to be fair. However, there appeared to be large differences in beliefs
by fairness context. Consistent with our hypotheses, participants in the equity context
were more likely than participants in the equality context to view splits favoring the
Proposer as being “fair for both the Proposer and the Responder.” On the other hand,
participants in the equality context were more likely to view splits favoring the
Responder as being “fair…” However, second-order beliefs (whether the participant
believed the majority of other participants believed each option was fair) exhibited an
entirely different pattern, which was characterized by participants in the equity context
being more likely to believe that others though each option was fair.
Structure of fairness beliefs. To further explore the findings from the descriptive analyses
of fairness belief, and to find patterns of variability in the belief data, we subjected the 22
belief variables to an exploratory factor analysis. Successive tests at the alpha = .05
significance level determined that the eigenvalues corresponding to the first five factors
were greater than would have been expected by chance variability.6 We therefore selected
a five-factor solution. Because there was no a priori reason to expect the factors to be
orthogonal, we applied an oblimin rotation to assist with the interpretability of the pattern
of loadings, although other oblique and orthogonal rotations did not affect the substantive
findings.
6 This method of assessing factorial dimensionality, introduced by Horn (1965), has been shown in
simulation studies (Zwick & Velicer, 1986) to correctly identify the number of factors more often than
either the observed root-one rule (Kaiser, 1960) or the scree plot (Cattell, 1966), in some circumstances by
large margins (e.g., 92% accuracy for the present method vs. 22% accuracy for the root-one rule).

18
Table 2.1
Summary of Fairness Beliefs by Fairness Context
Fairness Context
Offer Equity Equality All
Is the offer fair for the both Proposer and the Responder?
($10,$0) 5% 4% 5%
($9,$1) 11% 4% 7%
($8,$2) 23% 5% 14%
($7,$3) 37% 18% 28%
($6,$4) 72% 52% 62%
($5,$5) 93% 100% 96%
($4,$6) 41% 61% 51%
($3,$7) 17% 27% 22%
($2,$8) 9% 23% 16%
($1,$9) 9% 22% 16%
($0,$10) 8% 21% 14%
Do the majority of other participants believe the offer is fair?
($10,$0) 8% 0% 1%
($9,$1) 1% 0% 3%
($8,$2) 7% 3% 10%
($7,$3) 17% 18% 34%
($6,$4) 49% 65% 73%
($5,$5) 80% 100% 97%
($4,$6) 95% 61% 55%
($3,$7) 48% 23% 22%
($2,$8) 21% 12% 9%
($1,$9) 7% 9% 7%
($0,$10) 4% 8% 6%
N 75 77 152

19
Table 2.2
Factor Loadings for Fairness Beliefs from a Five-Factor EFA
Variable Factor 1 Factor 2 Factor 3 Factor 4 Factor 5
Offer fair for
both Proposer
and Responder?
($10,$0)
0.2 0.64
0.20
($9,$1) 0.18
0.86
($8,$2) 0.16
0.64
-0.22
($7,$3)
0.41 0.34 -0.35
($6,$4)
0.15 0.65 -0.13
($5,$5)
0.11 0.49
($4,$6) 0.26
0.62 0.25
($3,$7) 0.76
0.23
($2,$8) 0.98
($1,$9) 0.99
($0,$10) 0.90 0.1
Majority of
others believe
offer is fair?
($10,$0) -0.19
0.48
($9,$1) -0.11
0.63
($8,$2)
0.11 0.33
-0.52
($7,$3) -0.16
0.18 0.44 -0.46
($6,$4)
-0.15
0.7 0.16
($5,$5) -0.11
0.22 0.11 0.65
($4,$6)
0.13 -0.14 0.71 -0.2
($3,$7) 0.25 0.32 -0.1 0.43
($2,$8) 0.11 0.77
($1,$9)
0.98
($0,$10) 0.97
Proportion Var. 0.18 0.13 0.12 0.11 0.07
Cumulative Var. 0.18 0.31 0.43 0.54 0.62
Corr. Factor
Scores 1.00 0.99 0.94 0.92 0.87
Note. Only loadings with a magnitude of at least 0.10 are shown. An oblimin rotation was
applied. Loadings used to interpret each factor are bolded.

20
Table 2.2 shows the resulting factor solution. The pattern of loadings led to five clearly
interpretable factors with a simple structure. Factor 1 loaded on beliefs that splits
favoring the Responder were fair. Factor 2 loaded on beliefs that others considered
Responder-favoring splits to be fair. The interfactor correlation of these factors was .61,
indicating that they measured similar constructs. Factor 3 loaded on first- and second-
order beliefs that Proposer-favoring splits were fair. Factor 4 loaded on beliefs that
moderately uneven splits (($7,$3), ($6,$4), ($4,$6), and ($3, $7)) were fair. Finally,
Factor 5 loaded on beliefs that ($5,$5) was fair and that Proposer-favoring splits were
unfair.
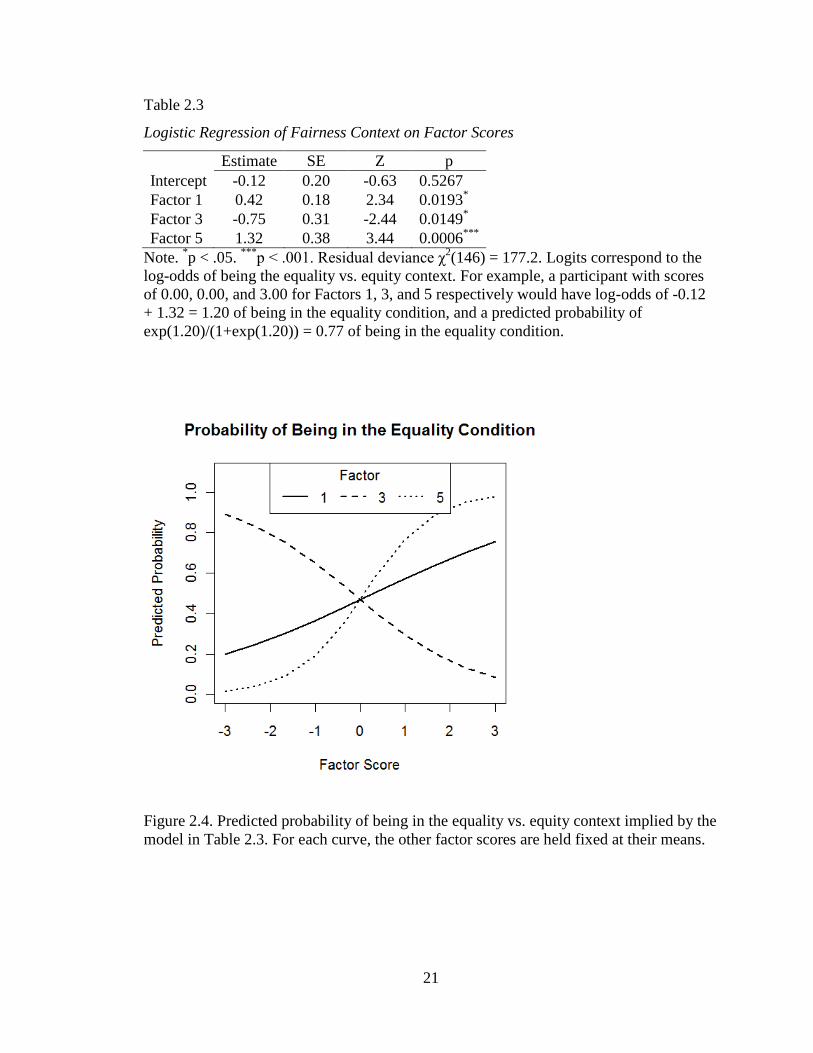
Fairness context, beliefs, and behavior. To determine whether third parties‟ fairness
beliefs were associated with fairness context, we used a logistic regression of fairness
context on standardized regression factor scores (Thurstone, 1935). Significant effects of
Factor 1 (χ2(1) = 8.4, p = .0037), Factor 3 (χ
2(1) = 9.3, p = .0023), and Factor 5 (χ
2(1) =
24.4, p < .0001) indicated that there were differences by context in beliefs about,
respectively, whether Responder-favoring splits were fair (Factor 1), Proposer-favoring
splits were fair (Factor 3), and ($5,$5) was fair (Factor 5). Table 2.3 shows the estimates
from the resulting model. The log-odds of being in the equality condition vs. the equity
condition increased with Factors 1 and 5, and decreased with Factor 3. Thus, the equality
context led participants to adopt beliefs that ($5,$5) and Responder-favoring splits were
fair, whereas the equity context led participant to believe that Proposer-favoring splits
were fair. Figure 2.4 shows the predicted probabilities of being in the equality condition
as a function of factor scores.
Although fairness beliefs was associated with fairness context, they did not
predict adjustments to the Proposer‟s or Responder‟s payoffs in a bivariate regression (for
Factors 1-5, respectively, F(2,143) = 0.1, F(2,143) = 0.3, F(2,143) = 0.2, F(2,143) = 2.4,
F(2,143) = 1.8, each p > .05). Thus, third party behavior was not predicted by either
fairness beliefs or fairness context, contrary to our hypotheses.
21
Table 2.3
Logistic Regression of Fairness Context on Factor Scores
Estimate SE Z p
Intercept -0.12 0.20 -0.63 0.5267
Factor 1 0.42 0.18 2.34 0.0193*
Factor 3 -0.75 0.31 -2.44 0.0149*
Factor 5 1.32 0.38 3.44 0.0006***
Note. *p < .05.
***p < .001. Residual deviance χ
2(146) = 177.2. Logits correspond to the
log-odds of being the equality vs. equity context. For example, a participant with scores
of 0.00, 0.00, and 3.00 for Factors 1, 3, and 5 respectively would have log-odds of -0.12
+ 1.32 = 1.20 of being in the equality condition, and a predicted probability of
exp(1.20)/(1+exp(1.20)) = 0.77 of being in the equality condition.
Figure 2.4. Predicted probability of being in the equality vs. equity context implied by the
model in Table 2.3. For each curve, the other factor scores are held fixed at their means.
22
Conclusion
The context in which the roles of Proposer and Responder were assigned affected the
fairness beliefs of third parties in dramatic ways. When roles were assigned randomly,
third parties focused on the even ($5,$5) split and generally considered divisions that
favored the Responder as being “fair for both the Proposer and the Responder.” When
roles were assigned based on performance on an arbitrary quiz, with higher-scoring
participants having “earned the right to be a Proposer,” third parties adopted beliefs that
legitimized the entitlement of the Proposer to greater shares of the sum being bargained
over.
However, the fairness beliefs of third parties did not carry over to behavior, nor
did the manner in which roles were assigned to Proposers and Responders affect the
sanctioning and compensating behavior of third parties. Because our analyses showed
strong effects of fairness context on fairness beliefs, we consider our manipulation of the
relevant fairness norm – equality, in the case of random role assignment, and equity, in
the case of performance-based role assignment – to have been successful. Against the
background of previous findings that equity contexts lowered offers (Hoffman et al.,
1994), one possible interpretation of our findings is that Proposers and third parties
considered a range of offers to be normatively acceptable, and chose the one that best
served their interests. Such behavior would be an example of norm manipulation
(Bicchieri, 2006; Bicchieri, 2008; Bicchieri & Chavez, 2010), in which several
interpretations of a norm apply and an individual selects the one that best suits her or
him. Under this view, it is unsurprising that fairness context affected third parties‟ beliefs
but not their behavior; given that third parties found a range of offers to be fair, it is
plausible that they had little incentive to incur additional monetary costs to sanction or
compensate.
Do third parties attempt to equalize the payoffs of Proposers and Responders? An
ANOVA of the difference between the Proposer‟s and Responder‟s adjusted payoffs
revealed significant effects of offer amount (F(2, 185) = 28.7, p < .0001) and punishment
condition (F(1, 185) = 5.5, p = .02), and no other main effects or interactions. The
Proposer‟s adjusted payoff was $3.40 higher than the Responder‟s for offers of ($8,$2), p
23
< .0001, $1.97 higher for offers of ($7,$3) , p < .0001, but not significantly different for
offers of ($5,$5), p = .14. In the punish/reward condition, the Proposer‟s adjusted payoff
was $1.28 higher than the Responder‟s (p < .0001), and $2.81 higher in the punish-only
condition (p < .0001). These remaining payoff inequalities should be judged relative to
the original inequalities, which were $0.00 for offers of ($5,$5), $4.00 for ($7,$3), and
$6.00 for ($8,$2). Thus, on the whole, third parties reduced the amount of inequality
between the Proposer‟s and Respoder‟s payoffs, but did not equalize them, as indicated
by the sizable and statistically differences.
Finally, it is worthwhile to ask whether the cost that third parties incurred to
adjust Proposer‟s and Responder‟s payoffs differed by condition. Because third parties
had to spend $0.25 for each $1.00 they added to or deducted from the Proposer‟s or
Responder‟s payoffs, total expenditures could reach $5.00. An ANOVA of the amounts
spent by third parties revealed significant effects of offer amount (F(2,185) = 3.7, p =
.0268), punishment condition (F(1,185) = 21.0, p < .0001), and their interaction (F(2,185)
= 8.7, p = .0063). No other main effects or interactions reached significant. For the
punishment-only condition, expenditures were $0.00 for offers of ($5,$5), $0.43 for
offers of ($7,$3), and $0.65 for offers of ($8,$2). For the punish/reward condition, third
parties spent $1.66 for offers of ($5,$5), $0.88 for ($7,$3), and $1.08 for ($8,$2). Of
particular note is that the respective expenditures by offer amount in the punish/reward
were all significantly higher than in the punish-only condition. Thus, third parties were
more willing to incur personal costs to modify the payoffs of other when they had the
opportunity to sanction or compensate, as opposed to having only the option to sanction.
This finding is relevant to theories of justice in which the compensation of a victim is
traded off against the punishment of a perpetrator, and suggests that on the whole, third
parties are averse to punishing and prefer instead to compensate.

24
Appendix: Stage 2 Instructions
INSTRUCTIONS
Please read the instructions before making any decisions.
This is a decision-making experiment. Please do not talk or try to communicate with any
other participants during this experiment. If you have any questions, please raise your
hand or otherwise get the attention of an experimenter, and someone will come by to help
you.
In the large envelope you will find two empty labeled envelopes, and one unlabeled
envelope containing 15 dollars, which includes your $5 payment for arriving on time.
Prior to your experimental session, we conducted two sessions comprising the first part of
this experiment. The participants in these earlier sessions received the following
instructions:
[The text below was present only for the equity condition.]
General Instructions
In the first part of today’s study, we would like you to analyze some arguments
about a topic of contemporary interest, which we will reveal shortly. You will
have 20 minutes to read one article on this topic. You should devote your time to
carefully understanding the details of the arguments presented in the article. At
the end of today’s study, we will ask you to fill out a short survey giving us
feedback on this topic.
They then read a 12-page article on the topic of intelligence design. We administered a
quiz on this topic, and ranked participants based on their quiz scores. Finally, they read
the following instructions:
[The text above was present only for the equity condition.]

25
Opportunity to add to your earnings
In this part of the study, each of you will be paired with a different person in this
room. A sum of $10.00 will be provisionally allocated to each pair. You will not
be told who the person you are paired with is either during or after the study, as
all decisions and your earnings are strictly anonymous.
Half of you will be “Proposers,” and the other half will be “Responders.” The
Proposer in each pair will propose how much of the $10.00 the Proposer is to
receive, and how much of the $10.00 the Responder is to receive. The Responder
will then choose to accept or reject the proposal. If the Responder accepts the
proposal, the amount of money will be divided as specified in the proposal. If the
Responder does not accept the proposal, both the Proposer and the Responder
will earn nothing.
[The text below was present only for the equity condition.]
As you can tell, there is a definite advantage to being a Proposer. We have
decided that those of you who scored in the top half on the quiz have earned the
right to be a Proposer. Those of you scoring in the bottom half will be
Responders.
[The text below was present only for the equity condition.]
[The text below was present only for the equality condition.]
Whether you are a Proposer or a Responder will be determined at random.
[The text above was present only for the equality condition.]
26
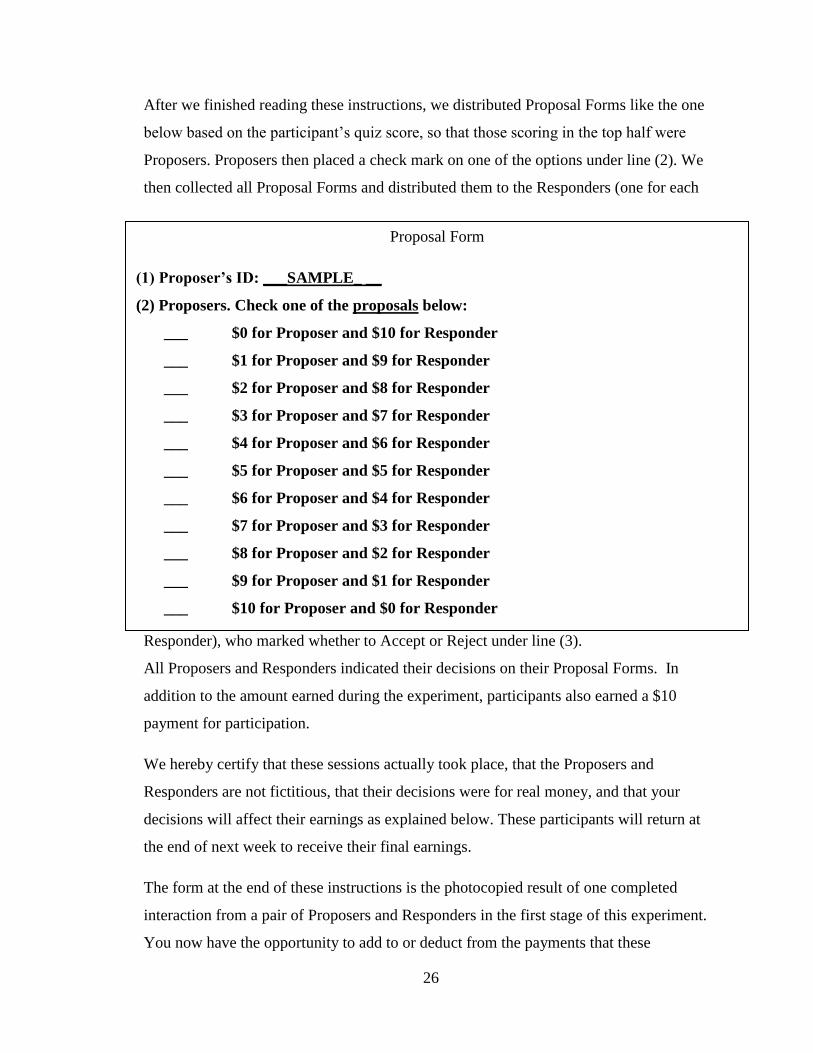
After we finished reading these instructions, we distributed Proposal Forms like the one
below based on the participant‟s quiz score, so that those scoring in the top half were
Proposers. Proposers then placed a check mark on one of the options under line (2). We
then collected all Proposal Forms and distributed them to the Responders (one for each
Responder), who marked whether to Accept or Reject under line (3).
All Proposers and Responders indicated their decisions on their Proposal Forms. In
addition to the amount earned during the experiment, participants also earned a $10
payment for participation.
We hereby certify that these sessions actually took place, that the Proposers and
Responders are not fictitious, that their decisions were for real money, and that your
decisions will affect their earnings as explained below. These participants will return at
the end of next week to receive their final earnings.
The form at the end of these instructions is the photocopied result of one completed
interaction from a pair of Proposers and Responders in the first stage of this experiment.
You now have the opportunity to add to or deduct from the payments that these
Proposal Form
(1) Proposer’s ID: ___SAMPLE_ __
(2) Proposers. Check one of the proposals below:
___ $0 for Proposer and $10 for Responder
___ $1 for Proposer and $9 for Responder
___ $2 for Proposer and $8 for Responder
___ $3 for Proposer and $7 for Responder
___ $4 for Proposer and $6 for Responder
___ $5 for Proposer and $5 for Responder
___ $6 for Proposer and $4 for Responder
___ $7 for Proposer and $3 for Responder
___ $8 for Proposer and $2 for Responder
___ $9 for Proposer and $1 for Responder
___ $10 for Proposer and $0 for Responder
(3) Responders. Choose to either Accept or Reject the proposal under line (2), which was
made by the Proposer with whom you are paired:
___ Accept ___ Reject

27
participants will otherwise receive. At the end of this experiment, the experimenter will
announce your computer station number along with the choices of the Proposer and
Responder corresponding to the Proposal Form you were given. You will then be asked
to clearly state aloud the amounts you spent adjusting the Proposer‟s and/or the
Responder‟s payments. Please note this procedure implies that your decision will be
known to the experimenter and the other participants, and is therefore not anonymous. If
other people participating in this experiment also add to or deduct from the payments of
these participants, these adjustments may be averaged.
You should have a $10 in bills and $5 in quarters (20 quarters) in front of you. The $10 is
yours to keep. Of the 20 quarters, you may place up to 10 quarters ($2.50) into each of
the two labeled envelopes. For each $.25 that you spend in this manner, you will adjust
the Proposer‟s or Responder‟s payment by $1. Circle the option on the envelope which
you are choosing. The remaining quarters are yours to keep.
This means that you can add or deduct any amount between $0 and $10 of the money the
Proposer and/or the Responder will otherwise receive. Because Proposers and
Responders earned $10 for their participation (in addition to their earnings from the
interaction), they have earned at least $10.
Thus, if you circle “Deduct from Proposer‟s Payment" and place 1 quarter into this
envelope, the Proposer‟s payment will be reduced by $1. If you place 5 quarters ($1.25)
into the envelope, their payment will be reduced by $5. If you place 10 quarters ($2.50)
into the envelope, their payment will be reduced by $10.
If you had instead circled “Add to the Proposer‟s Payment,” then the Proposer‟s payment
would have been increased by $1, $5, and $10, respectively.
Similarly, if you circle “Deduct from Responder‟s Payment" and place 1 quarter into this
envelope, the Responder‟s payment will be reduced by $1. If you place 5 quarters ($1.25)
into the envelope, their payment will be reduced by $5. If you place 10 quarters ($2.50)
into the envelope, their payment will be reduced by $10.

28
If you had instead circled “Add to the Responder‟s Payment,” then the Responder‟s
payment would have been increased by $1, $5, and $10, respectively.
Place any remaining quarters back into the plain white envelope. The money in the plain
white envelope is yours to keep. After you have made your decision, close all envelopes
using the black clips so that no quarters fall out. Place all remaining papers, except for
the plain white envelope containing your cash payment, back into the large envelope.
Please do not discuss this study with others, as it is important that future participants do
not have prior knowledge of the content of this study.
29
References
Bicchieri, C. (2006). The grammar of society: The nature and dynamics of social norms.
Cambridge: Cambridge University Press.
Bicchieri, C. (2008). The fragility of fairness: An experimental investigation on the
conditional status of pro-social norms. Philosophical Issues, 18(1), 227–246.
Bicchieri, C. & Chavez, A. (2010) Behaving as Expected: Public information and fairness
norms. Journal of Behavioral Decision Making, 23(2), 161-178.
Camerer, C. (2003). Behavioral game theory: Experiments on strategic interaction.
Princeton, NJ: Princeton University Press.
Cattell, R. B. (1966). The scree test for the number of factors. Multivariate Behavioral
Research, 1, 629-637.
Falk, A., Fehr E., & Fischbacher, U. (2003). On the Nature of Fair Behavior. Economic
Inquiry, 41(1), 20-26.
Fehr, E., & Fischbacher, U. (2004). Third-party punishment and social norms. Evolution
and Human Behavior, 25, 63-87.
Guth, W., Schmittberger, R., & Schwarze, B. (1982). An experimental analysis of
ultimatum bargaining. Journal of Economic Behavior and Organization, 3, 367–
388.
Hoffman, E., McCabe, K. A., Keith, S., & Smith, V. (1994). Preferences, property rights,
and anonymity in bargaining games. Games and Economic Behavior, 7, 346–380.
Hothorn, T., Hornik, K., van de Wiel, M. A., & Zeileis A. (2006). A Lego System for
Conditional Inference. The American Statistician, 60(3), 257-263.
Horn, J. L. (1965). A rationale and test for the number of factors in factor analysis.
Psychometrika, 30, 179-185.
Kahneman, D., Knetsch, J. L., & Thaler, R. (1986). Fairness and the assumptions of
economics. Journal of Business, 59, S285-S300.
Kaiser, H. F. (1960). The application of electronic computers to factor analysis.
Educational and Psychological Measurement, 20, 141-151.
Kurzban, R., DeScioli, P., & O‟Brien, E. (2007). Audience effects on moralistic
punishment. Evolution and Human Behavior, 28(2), 75-84.
Strasser, H., & Weber, C. (1999). On the asymptotic theory of permutation statistics.
30
Mathematical Methods of Statistics, 8, 220-250.
Zwick, W. R., & Velicer, W. F. (1986). Factor influencing five rules for determining the
number of components to retain. Psychological Bulletin, 99, 432‑442.

31
Chapter 3
Behaving as Expected: Public Information and Fairness Norms7
Abstract. What is considered to be fair depends on context-dependent expectations.
Using a modified version of the Ultimatum Game, we demonstrate that both fair behavior
and perceptions of fairness depend upon beliefs about what one ought to do in a situation
– that is, upon normative expectations. We manipulate such expectations by creating
informational asymmetries about the offer choices available to the Proposer, and find that
behavior varies accordingly. Proposers and Responders show a remarkable degree of
agreement in their beliefs about which choices are considered fair. We discuss how these
results fit into a theory of social norms.
Introduction
Social norms are often invoked in explanations of pro-social behavior. The relative dearth
of direct explanations (and predictions) in terms of social norms in behavioral economics
is due to the fact that they are usually only vaguely defined, and thus are difficult to
operationalize and draw predictions from. As a result, social norms are usually
incorporated into research as ex-post interpretations for behavior or outcomes that are
otherwise difficult to explain. However, without an operational definition of a social
norm, it is impossible to design experiments that tease apart the behavioral effects of a
social norm from those of personal values or generic social preferences. Furthermore, the
absence of a clear definition makes it impossible to assess when a norm exists, and to
make testable predictions about when it will be followed. In what follows we adopt a
definition of norms that is grounded upon individuals‟ preferences and expectations
7 This paper was published as: Bicchieri, C. & Chavez, A. (2010) Behaving as Expected: Public
information and fairness norms. Journal of Behavioral Decision Making, 23(2), 161-178.
32
(Bicchieri, 2006, p.11). Such a definition makes claims about norms‟ influence on
behavior easily testable.
For a social norm to exist and be followed by a specific population, three
conditions must be present. First, it is necessary that the individuals involved believe it
exists and know the class of situations to which the norm pertains. This condition implies
that individuals must be aware they are in a situation in which a particular norm applies,
since lack of awareness may lead to non-compliance. We thus hypothesize that making a
norm salient will lead, ceteris paribus, to greater compliance (Cialdini et al., 1990). The
second condition is that individuals must have a conditional preference for following the
norm. Specifically, an individual will prefer to obey a given norm if she (a) expects
others in the population to comply with it (empirical expectations) and (b) believes that
others in the population expect her to obey the norm and may sanction transgressions
(normative expectations). The third condition is the actual presence of the empirical and
normative expectations. It follows that an individual may not obey a norm she knows
applies to a given situation if she fails to have the right kind of expectations.
Transgressions may occur because one observes non-compliance, or alternatively
normative expectations are absent, or they are present but one can violate them without
being observed.
The conditional preference condition distinguishes social norms from personal
values. In the latter case, one usually has an unconditional preference for following a
certain rule, as expectations about others‟ compliance play little or no role in one‟s
decision. Having a conditional preference for conformity also implies that one might
follow a norm in the presence of the relevant expectations, but disregard it in their
absence. We thus hypothesize that manipulation of expectations will produce major
shifts in norm-abiding behavior. To test this hypothesis, we focused on a simple version
of the Ultimatum Game, in which one of the parties proposes a division of a fixed amount
of money to another party who can then accept or reject the offer. If the offer is rejected,
both parties get nothing. Experimental results show that participants‟ modal and mean
offers are 40 to 50% of the total amount, and offers below 20% are rejected about half of
the time (Camerer, 2003). These results are generally interpreted as showing that

33
subjects have a preference for fairness, and have been formalized in inequity aversion
models8 (Fehr & Schmidt, 1999; Bolton & Ockenfels, 2000).
A drawback of the inequity aversion model is that it assumes that what matters to
an agent is the final payoff distribution, not the way the distribution came about. This
consequentialist assumption has been experimentally challenged. Several authors have
shown that, contrary to the consequentialism of the inequity aversion model, intentions
matter (Blount, 1995; Falk, Fehr, and Fischbacher, 2003). Moreover, it has also been
shown that fair procedures can be as acceptable as fair outcomes (Bolton, Brandts, and
Ockenfels, 2005). However, there has been no comprehensive explanation of why
subjects care not only about consequences but also the process through which such
consequences occur. If intentions matter, it must be recognized that they only matter
against a background of expectations. Thus, to judge a Proposer‟s intentions as
normatively acceptable or unacceptable, we must have a relatively clear idea of what
Responders believe a Proposer ought to do in a given situation. What is socially
appropriate, in turn, is defined by our shared social norms. An operational definition of
social norms, it must be added, helps us understand Responders‟ reactions to unfair
offers, but also helps in predicting when, or under which conditions, Proposers will
choose to be fair.
Our hypothesis is that individuals have a conditional preference for following
fairness norms, and that manipulating participants‟ expectations across conditions will
lead to different behavior. These predictions cannot be explained by a fairness preference
hypothesis, since the material consequences are the same across conditions, and the only
difference between conditions is the level of information (and thus the expectations) of
the players. Furthermore, even if we were to modify the fairness preference hypothesis
by making preferences conditional, it would remain to be explained under which
conditions preferences would change. The theory of norms we adopt provides such a
testable explanation.
8 Such models typically specify that an individual suffers disutility from outcomes in which others earn
more or less than they do.
34
To show that “fair” behavior is dictated by norms that are conditionally followed,
we manipulated both salience and expectations. In the salience treatment, we asked
Proposers which of the options they thought Responders believed to be fair, thus focusing
them on Responders‟ normative expectations. We hypothesized that making a fairness
norm more salient would induce greater fairness on the part of Proposers. In both the
salience and non-salience conditions, we asked Responders which of the Proposers‟
choice options they believed to be fair. The goal of this assessment was twofold. First,
we wanted to check whether there was agreement in Responders‟ normative expectations.
Agreement strongly indicates the presence of a shared norm of fairness. Second, we
wanted to assess the agreement of Responders‟ normative expectations with Proposers‟
beliefs about them. It is significant that Proposers‟ answers (in the salience conditions)
agreed overall with the Responders‟ answers, a fact that further indicates the presence of
a shared norm. The direct measurement of first and second-order expectations about
what choices are fair is lacking in most behavioral studies to date. By measuring
expectations, we provide evidence of the actual process that governs choices in situations
involving social norms.
What counts as fair may vary by context, and in a given context more than one
fairness criterion might apply. Equity and equality considerations may coexist, and
randomization is often perceived as a fair allocation mechanism (Bolton et al., 2005), as
when we use a lottery to allocate transplant organs. In our experiment, we added a choice
option that randomized with equal probability between an equal and a very unequal share.
Remarkably, a majority of Responders found this option fair, a finding also reflected in
the Proposers‟ beliefs about Responders‟ assessments.9 Adding this option allowed us to
check for norm manipulation (Bicchieri, 2008). That is, when a norm can have several
interpretations, individuals will tend to adopt the one most favorable to them. This form
of self-serving bias has been studied in the context of equity vs. equality interpretations
of fairness (Frey & Bohnet 1995; Hoffman & Spitzer, 1985), and we show that we can
9 The “easy acceptance of the randomization option may be a relative effect, namely of comparing it with
the direct proposal of (8,2). Another possibility is that determining allocations by random devices is
usually seen as fair and acceptable, as participants focus on the fair procedure and not on the expected
utilities.
35
elicit the same bias with a suitable random option, provided this choice option is common
knowledge among participants.
To manipulate expectations, we changed the information conditions in three
versions of the same division problem. We expected a change in normative expectations
to affect Proposers‟ choices. We also predicted the occurrence of norm evasion
(Bicchieri, 2008): whenever it was possible for Proposers to defy normative expectations
without Responders‟ knowledge, the proportion of unfair offers would be significantly
higher. Other authors have shown that participants tend to skirt offering a fair share
when their actions cannot be detected by the other parties (Kagel, Kim, and Moser, 1996;
Straub and Murnighan 1995), because of asymmetric information about chip values or
ignorance about the amount being divided. A theory of conditional norm compliance
predicts these effects. Due to the conditional nature of norm compliance, the more
ambiguous the choice situation, the higher will be the proportion of individuals that flaunt
the norm, since the outcome of their behavior cannot be clearly interpreted as intentional,
and thus no sanctioning is expected to occur.
Our paper is a contribution to a field that may be labeled behavioral ethics. It
should be seen as a subfield of behavioral decision theory, taking into account social and
psychological considerations in an attempt to understand pro-social, “moral” choices. In
this regard, we explore whether and why a pro-social norm will be followed, trying to
gain insights about decision-making and motivation that are useful for further developing
a behavioral account of moral choices.
Method
Participants. One hundred and six college-age subjects participated in our study across
11 experimental sessions. Advertisements specified that participants would earn 5 USD
in addition to an amount that would depend on decisions made during the experiment.
Game Paradigm. Our experimental design employed a variant of the Ultimatum Game
(Guth et al., 1982), in which one participant, the Proposer, provisionally received a sum
of 10 USD – provided by the experimenter – and then proposed a division of that money
with a Responder. The Responder subsequently decided to accept or reject the proposal.

36
If the Responder accepted, both players received the amounts specified in the proposal.
If the Responder rejected, both players received $0. The Proposer chose from one of the
following options:
(5,5) - to propose $5 for the Proposer, and $5 for the Responder;
(8,2) - to propose $8 for the Proposer, and $2 for the Responder; and
Coin - to let the outcome of a fair coin flip determine the proposal: heads
corresponded to (5,5), and tails to (8,2).
Procedure. Upon their arrival, participants randomly drew ID codes labeled A1, A2, …,
An and B1, B2, …, Bn, where n is twice the number of participants in the session, and
proceeded either to Room A or B based on their codes. We distributed and read aloud a
set of instructions, which explained the following:
Based on random assignment, the participants in Room A were Proposers, and
those in Room B were Responders.
Participants would play three games,10
each with a different person in the other
room.
By means of a public randomization device, we would select two of the three
games at the end of the study to determine participants‟ cash payments.
For each game, we would post on the blackboard the Proposer-Responder pairings
using their ID codes, distribute instructions specific to that game, and then
administer a short quiz to test their understanding of the instructions. By posting
pairings publically, we maximized transparency and the likelihood that each
participant would believe he or she actually was interacting with three different
people in the other room.
Subsequently, Proposers would be given a proposal form on which they would
write their ID codes and choose one of the available proposals.
10
We described the games using the language of Hoffman et al. (1994).

37
After all Proposers completed their proposal forms, an assistant would take them
to Room B, where the Responders would mark their decision to accept or reject
the proposal.
Information. The proposal form that was used for each of the three games was
determined by the information condition which we assigned to that game. Appendix B
contains the proposal forms which differed slightly by information condition, as
described below.
In the full information condition, the proposal form listed all three options: (5,5),
(8,2), and coin. After Proposers completed their proposal forms, the experimenter in
Room B flipped a coin in front of the Responders. On any forms on which the Proposer
chose coin, the experimenter then marked (5,5) or (8,2) based on the coin flip outcome.
The instructions explained this, so that prior to making their decisions, all participants
understood that Responders would know if the Proposers with whom they were paired
chose coin.
In the private information condition, the Responder did not know that coin was
available to Proposers, and Proposers knew this fact. To create this informational
asymmetry, we left coin out of the proposal form. The experimenter in Room A
explained to Proposers that they could indicate a coin choice by leaving both (5,5) and
(8,2) unmarked; subsequently, the experimenter would flip a coin in Room A, and on any
such forms, mark (5,5) if the outcome was heads, and (8,2) if the outcome was tails.
Thus, Proposers understood that Responders were unaware that coin was an available
option.
In the limited information condition, both Proposers and Responders knew that
coin was available, but also that Responders would not be able to infer whether the
Proposer chose coin or marked one of (5,5) and (8,2) directly. Specifically, the
instructions explained that Proposers could indicate a coin choice by leaving both (5,5)
and (8,2) unmarked on their proposal forms. The experimenter in Room B would flip a
coin and mark (5,5) or (8,2) accordingly on any such forms. Crucially, he would flip the
38
coin behind a small screen, so that no participant could see the outcome. Thus, all
participants understood that the Responder would be unable to distinguish forms on
which the Proposer chose (5,5) or (8,2) directly from forms on which the Proposer chose
coin.
Finally, because Proposers did not receive feedback between conditions, and to
minimize participants' confusion that occurred during a pilot study, we fixed the order of
the information conditions as 1) full, 2) private, and 3) limited.11
It might be argued that
the within-subjects design may have led to leakage or learning without feedback (Weber,
2003) between experimental conditions. In general, however, learning takes many trials,
and in the context of different information conditions, leakage would be expected to be
minimal. We only have three trials, and the size of the information effect is very large,
thus suggesting there was no such learning.
Salience. In each information condition, prior to making their choices, Responders
completed a questionnaire that measured their normative expectations (see Appendix C).
The questionnaire asked whether the responder found each of the choice options fair. The
questionnaire was aimed at assessing whether there was an agreement in Responders‟
normative expectations, an indicator of (as well as a necessary condition for) the
existence of a social norm. In addition, roughly half of our experimental sessions
included an incentive-based questionnaire for both Responders and Proposers, which they
completed in each information condition, following the quiz but prior to making their
choices (See Appendices D and E).12
These questionnaires asked participants about their beliefs about the percentage of
Responders who indicated (5,5), (8,2) and coin, respectively, as fair options. The
questionnaires were designed to 1) make fairness norms more salient, and 2) test for an
11
In the pilot sequence, we put the private information condition first, followed by the full and limited
information conditions. We did that since we thought that Responders might not be unaware of the COIN
option after the full information condition. Yet the pilot results were not qualitatively different from the
results we report with the present ordering of conditions.
12
For Responders in the salience condition, the second questionnaire in Appendix D was appended to the
one in Appendix C.
39
agreement between Responders‟ normative expectations and Proposers‟ beliefs about
them. The other half of the sessions included no such questionnaires; they just included
the first Responders‟ questionnaire (Appendix C). We distinguish salient sessions which
included these two extra questionnaires from non-salient sessions which did not.
Design and Analyses. The experiment used a 3 x 2 design, crossing three levels of a
within-participant variable, information (full, private, and limited), with two levels of a
between-participant variable, salience (non-salient and salient). The primary dependent
variable was the Proposer‟s choice: (5,5), (8,2), or Coin.
We used a mixed-effects multinomial logit model to estimate choice probabilities.
To determine the significance of information, salience, their interaction, and participant-
level random effects, we used nested model comparisons based on the likelihood ratio
test statistic (LRT). Because small cell sizes made it inadvisable to base inference about
the LRT on the chi-square distribution, we generated p-values for model comparisons
using the non-parametric bootstrap. Bootstrap p-values lead to more accurate inference
when cell counts are sparse. For the same reason, we generated p-values for the logit
coefficients using the bootstrap. Appendix A contains additional details on the bootstrap
methods we employed.
Hypotheses
We first hypothesized that, if there is a social norm, there must be agreement
between Responders‟ normative expectations and Proposers‟ beliefs about them. We also
hypothesized that choices would depend on information condition and salience. Based on
the theory presented in the Introduction, we made several directional predictions by
considering possible scenarios involving relevant fairness norms.
Firstly, we predicted that the proportion of coin choices would be higher in the
full information condition than in the private or limited conditions. This follows because
in the private information condition, there are no normative expectations for coin (as the
availability of coin is unknown to Responders), and there should therefore be very few
coin choices, since an outcome of (8,2) is likely to be rejected as unfair. In the limited

40
condition, Responders could not determine whether the Proposer chose coin. Therefore
the expected utility of coin is a combination of the probability of getting (5,5) or (8,2),
and the probability that (8,2) will be accepted.13
If the Proposer assesses a probability
greater than 5/8 that (8,2) will be accepted, she will choose (8,2). If the probability is less
than 5/8, the Proposer will choose (5,5). Only if the probability is exactly 5/8, the
Proposer will be indifferent among the three options. Therefore, Proposers who believed
that less than 62.5% of Responders would accept (8,2) would choose (5,5), since the
expected value of choosing (8,2) would be less than 5. Proposers who believed that more
than 62.5% of Responders would accept (8,2) would choose (8,2), since the expected
value of choosing (8,2) would be more than 5. In either case, there will be few or no coin
choices. Finally, in the full information condition, as long as there were Proposers who
thought that choosing coin was perceived to be fair by Responders, the proportion of coin
choices would be positive. This is because these Proposers believe that the expected
utility of choosing coin is 6.5, while the expected utilities of choosing (5,5) or (8,2) are,
respectively, 5 and 0. This is an example of norm manipulation; i.e., participants would
adopt the (allegedly shared) interpretation of fairness that would benefit them the most.
Indeed, coin maximizes expected monetary payoff without violating fairness.
Secondly, we predicted that there would be more (8,2) choices in the limited than
in the full or private information conditions, because some Proposers would take
advantage of the ambiguity of their choice. Specifically, if some Proposers believed that
a large enough fraction of Responders thought that choosing coin was fair and that
Proposers were playing fair by choosing Coin, then these Proposers could evade the norm
and maximize their monetary expected value by choosing (8,2) in the limited information
condition.14
Thus, the proportion of (8,2) choices should be higher in the limited
information condition than in the full information condition. In the private information
condition, we expected the fraction of (8,2) choices to be low for reasons discussed
below.
13
The expected utility of coin is equal to ½(5) + ½ (8)p. p is the probability that the Responder will accept
(8,2) because he believes that the Proposer is „playing fair‟ and thinks coin is a fair choice. The expected
utility of (5,5) is 5, and the expected utility of (8,2) is 8p. The value of p that makes one indifferent
between the three options is 5/8, or .625. 14
That is, p must be greater than .625 for a Proposer to choose (8,2) in the limited condition.
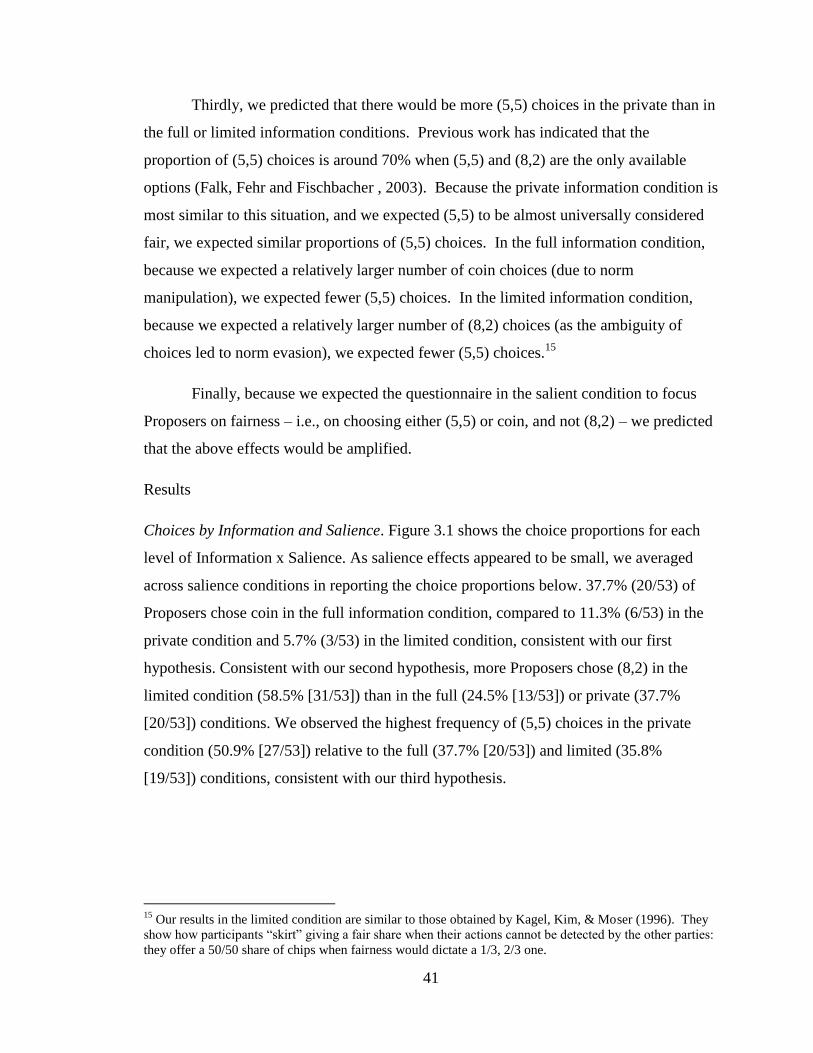
41
Thirdly, we predicted that there would be more (5,5) choices in the private than in
the full or limited information conditions. Previous work has indicated that the
proportion of (5,5) choices is around 70% when (5,5) and (8,2) are the only available
options (Falk, Fehr and Fischbacher , 2003). Because the private information condition is
most similar to this situation, and we expected (5,5) to be almost universally considered
fair, we expected similar proportions of (5,5) choices. In the full information condition,
because we expected a relatively larger number of coin choices (due to norm
manipulation), we expected fewer (5,5) choices. In the limited information condition,
because we expected a relatively larger number of (8,2) choices (as the ambiguity of
choices led to norm evasion), we expected fewer (5,5) choices.15
Finally, because we expected the questionnaire in the salient condition to focus
Proposers on fairness – i.e., on choosing either (5,5) or coin, and not (8,2) – we predicted
that the above effects would be amplified.
Results
Choices by Information and Salience. Figure 3.1 shows the choice proportions for each
level of Information x Salience. As salience effects appeared to be small, we averaged
across salience conditions in reporting the choice proportions below. 37.7% (20/53) of
Proposers chose coin in the full information condition, compared to 11.3% (6/53) in the
private condition and 5.7% (3/53) in the limited condition, consistent with our first
hypothesis. Consistent with our second hypothesis, more Proposers chose (8,2) in the
limited condition (58.5% [31/53]) than in the full (24.5% [13/53]) or private (37.7%
[20/53]) conditions. We observed the highest frequency of (5,5) choices in the private
condition (50.9% [27/53]) relative to the full (37.7% [20/53]) and limited (35.8%
[19/53]) conditions, consistent with our third hypothesis.
15
Our results in the limited condition are similar to those obtained by Kagel, Kim, & Moser (1996). They
show how participants “skirt” giving a fair share when their actions cannot be detected by the other parties:
they offer a 50/50 share of chips when fairness would dictate a 1/3, 2/3 one.
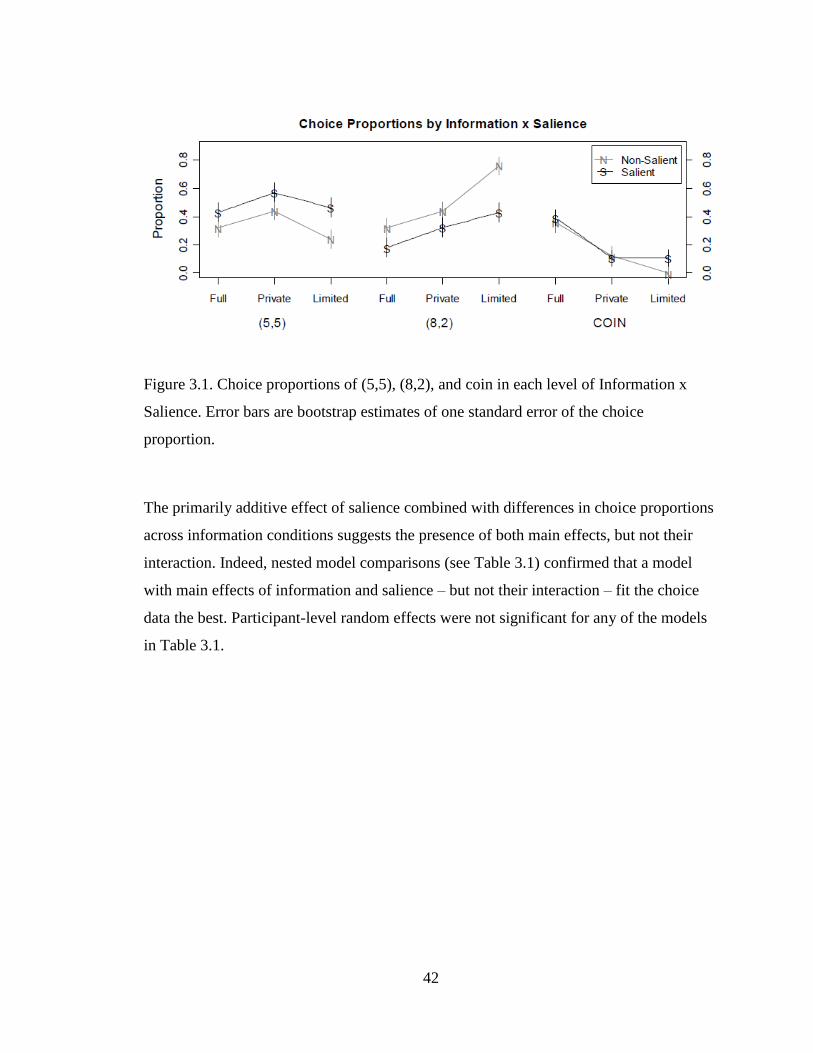
42
Figure 3.1. Choice proportions of (5,5), (8,2), and coin in each level of Information x
Salience. Error bars are bootstrap estimates of one standard error of the choice
proportion.
The primarily additive effect of salience combined with differences in choice proportions
across information conditions suggests the presence of both main effects, but not their
interaction. Indeed, nested model comparisons (see Table 3.1) confirmed that a model
with main effects of information and salience – but not their interaction – fit the choice
data the best. Participant-level random effects were not significant for any of the models
in Table 3.1.

43
Table 3.1
Model comparisons for information and salience. P-values are based on bootstrap
quantiles (see Appendix A for details), and not the χ2 distribution.
16
Null Alternative df LRT P
- Null (N) - - -
N Information (I) 4 25.73 < .0001
N Salience (S) 2 6.54 .05
I I + S 2 7.05 .04
S I + S 4 26.23 < .0001
I + S I x S 4 3.67 .52
Consistent with a norm-based explanation of choices, when normative expectations for
coin were either absent (in the private condition) or could be defied without consequence
(in the limited condition), the predicted probabilities of (5,5) and (8,2), respectively, were
considerably higher than those of coin. This is indicated by the significantly positive
coefficients in Table 3.2, which shows the estimates for the model with main effects of
information and salience. On the other hand, when normative expectations for coin were
present and choices were transparent (in the full information condition), (5,5) was no
more likely than coin (p = .963), whereas (8,2) was in fact less likely (p = .038); see
Table 3.2.17
16
The χ2 would have yielded the following less conservative p-values: respectively from top to bottom (see
Table 2), p < .0001, p = .04, p = .03, p < .0001, and .45. 17
The substantial discrepancy between some of the maximum likelihood (ML) and bootstrap estimates of
the standard error were due to right-skewed coefficients distributions; accordingly, we used percentiles of
the bootstrap distribution to calculate p-values, instead of relying on the asymptotic normality of the
coefficients.
44
Table 3.2
Multinomial logit model of information and salience as predictors of choices. Maximum
likelihood (ML) and bootstrap standard error estimates are included. P-values are based
on bootstrap quantiles (see Appendix A for details). The reference level for choice is
Coin, for information is the full condition, and for salience is the salient condition.18
Log-odds ML SE Bootstrap SE p
(5,5)
Intercept 0.02 0.37 0.39 .963
Limited 1.84 0.69 1.72 .0007
Private 1.50 0.55 0.72 .0009
Non-Salient -0.07 0.48 0.48 .913
(8,2)
Intercept -0.89 0.45 0.47 .0380
Limited 2.83 0.71 1.73 .0001
Private 1.66 0.59 0.76 .0011
Non-Salient 0.86 0.50 0.53 .0777
Using the model with both main effects, we performed formal tests corresponding to our
first three hypotheses, and found support for the first two.19
Firstly, as suggested by
Figure 3.1, the probability of coin was significantly higher in the full information
condition than in the private or limited information conditions (p < .001, for both the
salient and non-salient conditions). Secondly, (8,2) was more likely to be chosen in the
limited condition than in the full or private information conditions (p < .02, for both the
salient and non-salient conditions). Lastly, (5,5) was not more likely to be chosen in the
private condition than in the other two conditions (p = .1 and p = .2 respectively for the
salient and non-salient conditions).
We found mixed support for our final set of hypotheses, that Proposers would be
18
Thus, for example, the predicted probability of choosing (5,5) in the limited condition and salient
treatment is exp(.02+1.84)/(exp(0) + exp(.02+1.84) + exp(-.89+2.83)) = .45. 19
P-values were bootstrapped; see Appendix A.
45
more focused on fairness in the salient condition and would therefore be more likely to
choose (5,5) and coin, and less likely to choose (8,2). Respectively in the salient and non-
salient conditions, there were 41 and 25 (5,5) choices (p = .003); 17 and 12 coin choices
(p = .2); and 26 and 38 (8,2) choices (p = .016), where again we generated bootstrapped
p-values using the model with main effects of salience and information. Because the
interaction between salience and information was not significant (see Table 3.1), the
norm-focusing effects reported above were limited to across information conditions.
Normative Expectations and Beliefs about Them. Table 3.3 reports the normative
expectations of Responders. Clearly, almost all Responders considered (5,5) to be fair in
all information conditions, and a majority of them also thought that Coin was fair. This
may be surprising because the expected utility of Coin is only 3.5 USD for the
Responder, whereas it is 6.5 USD for the Proposer. A possible explanation is that using a
random device is perceived as a fair way to choose between alternatives. Responders
might have compared Coin to the temptation of (8,2) and found the Proposer who refused
to choose between (5,5) and (8,2) as one making a fair choice. Alternatively, some might
have thought the Proposer, as the first mover, had an entitlement to a greater share, and
Coin seemed a fair compromise between $5 and $8.
In order for a norm to be shared, second-order beliefs should be the same across
Responders and Participants. Figures 2-4 show participants‟ beliefs about Responders‟
normative expectations for each information condition. Indeed, there is a remarkable
degree of agreement between Responders‟ and Proposers‟ beliefs about the normative
expectations of Responders. Moreover, a comparison of Table 3.3 with Figures 2-4
shows that participants‟ beliefs about normative expectations are in agreement with the
normative expectations themselves.
Such high degree of agreement is the strongest possible indication that there is a
shared norm of fairness. Not only is (5,5) universally perceived as fair, but also Coin is
thought to be fair by a majority of participants. This agreement explains the tendency to
choose a self-serving interpretation of fairness (norm manipulation) in the full
information condition, as well as the pattern of choices across information conditions, as
we show in the following section.
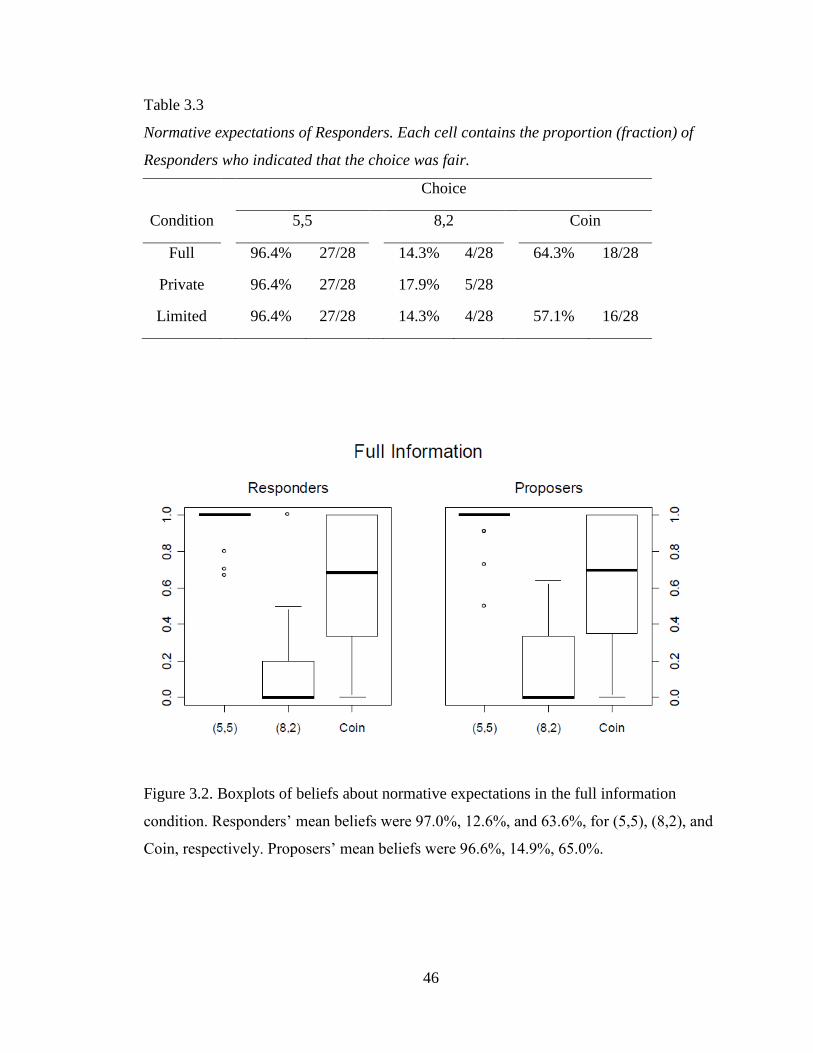
46
Table 3.3
Normative expectations of Responders. Each cell contains the proportion (fraction) of
Responders who indicated that the choice was fair.
Choice
Condition 5,5 8,2 Coin
Full 96.4% 27/28 14.3% 4/28 64.3% 18/28
Private 96.4% 27/28 17.9% 5/28
Limited 96.4% 27/28 14.3% 4/28 57.1% 16/28
Figure 3.2. Boxplots of beliefs about normative expectations in the full information
condition. Responders‟ mean beliefs were 97.0%, 12.6%, and 63.6%, for (5,5), (8,2), and
Coin, respectively. Proposers‟ mean beliefs were 96.6%, 14.9%, 65.0%.

47
Figure 3.3. Boxplots of beliefs about normative expectations in the private information
condition. Responders‟ mean beliefs were 98.1% and 16.0%, for (5,5) and (8,2),
respectively. Proposers‟ mean beliefs were 99.1% and 12.5%.

48
Figure 3.4. Boxplots of beliefs about normative expectations in the limited information
condition. Responders‟ mean beliefs were 96.0%, 10.0%, and 54.4%, for (5,5), (8,2), and
Coin, respectively. Proposers‟ mean beliefs were 98.8%, 17.6%, 49.3%.
Choices as a Function of Beliefs about Normative Expectations. A social norm
explanation presupposes consistency between beliefs and behavior. In particular, it
requires consistency between participants‟ beliefs about normative expectations and their
subsequent choices. As we show below, the data show a high degree of consistency
between beliefs and behavior.
We denote the Proposers‟ belief about the proportion of Responders who consider
(5,5), (8,2), and coin, respectively, as being fair by (5,5), (8,2), and (coin). The
distributions of these variables are summarized by Figures 2-4. To determine whether
these beliefs could explain the variance in Proposer‟s choices, we fit a multinomial logit
model with information condition and the three questionnaire variables as predictors,
based on a stepwise search.20
The signs of the coefficients for the questionnaire variables
20
We used a stepwise search that minimized Akaike‟s information criterion (AIC), a function of the
likelihood which penalizes larger models (AIC = -2(log-likelihood) + 2k, where k is the number of
parameters in the model that are being estimated). The scope of the model search was information,
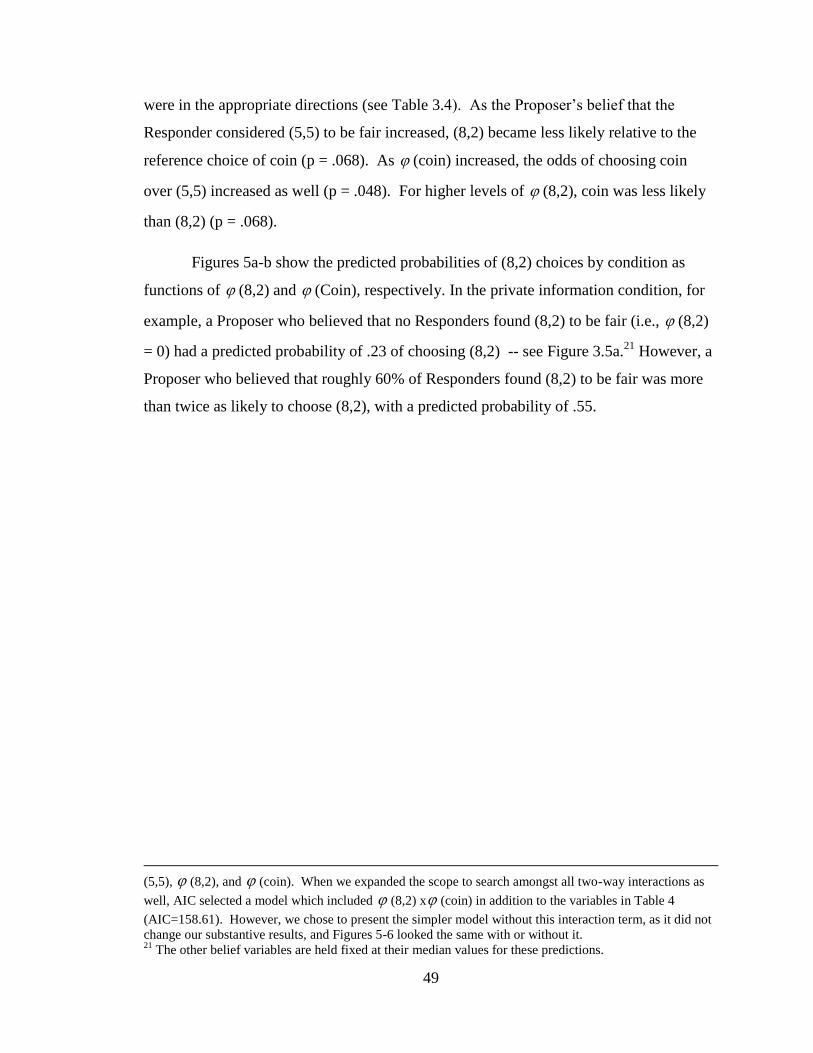
49
were in the appropriate directions (see Table 3.4). As the Proposer‟s belief that the
Responder considered (5,5) to be fair increased, (8,2) became less likely relative to the
reference choice of coin (p = .068). As (coin) increased, the odds of choosing coin
over (5,5) increased as well (p = .048). For higher levels of (8,2), coin was less likely
than (8,2) (p = .068).
Figures 5a-b show the predicted probabilities of (8,2) choices by condition as
functions of (8,2) and (Coin), respectively. In the private information condition, for
example, a Proposer who believed that no Responders found (8,2) to be fair (i.e., (8,2)
= 0) had a predicted probability of .23 of choosing (8,2) -- see Figure 3.5a.21
However, a
Proposer who believed that roughly 60% of Responders found (8,2) to be fair was more
than twice as likely to choose (8,2), with a predicted probability of .55.
(5,5), (8,2), and (coin). When we expanded the scope to search amongst all two-way interactions as
well, AIC selected a model which included (8,2) x (coin) in addition to the variables in Table 4
(AIC=158.61). However, we chose to present the simpler model without this interaction term, as it did not
change our substantive results, and Figures 5-6 looked the same with or without it. 21
The other belief variables are held fixed at their median values for these predictions.

50
Table 3.4
Multinomial logit model of information and beliefs about Responders’ normative
expectations as predictors of choices. The model was selected via a stepwise search (AIC
= 166.83).
Log-odds p
(5,5)
Intercept -13.34 .144
Limited 0.86 .318
Private -0.03 .958
(5,5) 14.99 .131
(coin) -2.33 .048
(8,2) 0.89 .587
(8,2)
Intercept 4.95 .176
limited 2.64 .002
private 2.87 .05
(5,5) -7.21 .068
(coin) 0.55 .663
(8,2) 3.11 .068

51
Figure 3.5. Predicted probability of (8,2) as a function of the Proposer‟s estimate of the
proportion of Responders who considered a) (8,2) fair, and b) Coin fair, by condition. For
each graph, the other beliefs are held fixed at their median values.
The strong dependency of (8,2) choices on the Proposer‟s belief that Coin was considered
to be fair in the limited information condition (see Figure 3.5b) is also noteworthy. A
Proposer who believed that no Responders found Coin to be fair had a predicted
probability of only .10 of choosing (8,2). However, a Proposer who believed that all
Responders found Coin to be fair had a predicted probability of .53 of choosing Coin, a
five-fold increase. This occurs because the Proposer could choose (8,2) with impunity
when the Proposer‟s estimate of the probability that Coin was considered fair by
Responders was high. If the Proposer believed that a) the Responder thought Coin was
fair and b) the Responder believed that the Proposer was playing fair by choosing Coin,
then (8,2) is expected to be accepted with high probability because it would be
interpreted as the unlucky outcome of a coin flip. Moreover, as Figure 3.5b shows, the
predicted probability of (8,2) choices in the limited information condition increased with
the Proposer‟s estimate of the probability that Coin was considered fair by Responders.
Whereas the existence of more than one interpretation of fairness led to norm
manipulation (i.e., the Proposer chose Coin instead of (5,5) in the full information
condition), the presence of ambiguity led to norm evasion (i.e., the Proposer chose (8,2)

52
in the limited information condition because the source of the offer is not identifiable as
being intentional or due to chance). Indeed, 76% of Proposers chose (8,2) in the limited
information condition. And even when Proposers were focused on fairness in the salience
condition, the proportion of (8,2) choices is relatively high.
Finally, Figure 3.6 shows the predicted probability of Coin choices as a function
of (Coin) by condition. Clearly, the probability of choosing Coin increased with the
Proposer‟s estimate of the proportion of Responders who considered Coin to be fair. As
mentioned earlier, the Proposer‟s self-serving bias would lead to a greater frequency of
Coin choices whenever it was clear that Responders knew that Coin had been chosen and
that they considered Coin to be fair. This can also be seen in Figure 3.1, where the
proportion of Coin choices in the full information condition was substantially larger
relative to the other information conditions.
Responder Behavior. Table 3.5 shows that Responders discriminated between
intentional offers and offers that were generated by a chance mechanism. In the full
information condition, no (8,2) offers resulting from a Coin choice were rejected,
whereas intentional (8,2) offers were rejected 23% of the time. Responders‟ rejection
rates of (8,2) were also sensitive to the presence of an intermediate choice. In the private
information condition, in which Responders believed the only choices are (5,5) and (8,2),
the rejection rate was much higher than in the full information condition (40% vs. 23%),
in which Responders knew that the Coin choice is available. When there is ambiguity as
to the source of the choice, as in the limited information condition, the rejection rate of
(8,2) was low (16.1%). This suggests that the large majority of Responders who received
an (8,2) offer in the limited information condition believed both that it is the result of a
Coin choice and that choosing Coin is fair.22
The large number of Proposers who chose
(8,2) in the limited information condition seemed to expect this low rate of rejections.
22
In private conversation, Werner Guth suggested that Responders who, in the Limited condition, accept
the outcome (8,2) display let-down aversion, i.e., they want to believe that COIN was chosen.

53
Figure 3.6. Predicted probability of Coin as a function of the Proposer‟s belief about
Responders‟ normative expectations by condition. The other beliefs are held fixed at their
median values.
Table 3.5
Rejection rates and frequencies by offer source, offer, and condition.
Offer
Source (5,5) (8,2)
Full
Direct 0.0% 0/20 23.1% 3/13
Coin 0.0% 0/16 0.0% 0/4
Private 0.0% 0/28 40.0% 10/25
Limited 0.0% 0/20 18.2% 6/33
54
Conclusion
Having a well-defined, testable theory of social norms allows us to explain what would
prima facie appear to be inconsistencies in individual behavior. Individuals choose to be
fair on occasion, but revert to selfish behavior on others. The theory of social norms we
adopt explains these apparent inconsistencies. Compliance with a norm is conditional
upon having the right kind of empirical and normative expectations. It is also important
that individuals focus on the relevant norm in order for them to comply with it. The
theory we adopt (Bicchieri, 2006) predicts that making a norm salient will tend to
increase compliance and, even more important, that the presence of the appropriate
expectations is crucial for attaining conformity to the norm. We thus expected that
manipulating expectations by changing the information available to individuals would
result in large shifts in behavior.
The data we presented highlight two important phenomena connected to norm
compliance. The first is norm manipulation (Bicchieri, 2008): when a norm can have
several interpretations, individuals will tend to choose the interpretation that best serves
their interests. This effect is evident in the choice of Coin in the full information
condition. In this condition, the participants have common knowledge of the Proposer‟s
access to the three choices of (5,5), (8,2), and Coin, as well as the Responder‟s ability to
differentiate between an intentional unfair offer and an unfair offer resulting from a
chance event. In the full information condition, the proportion of coin choices is the same
as the proportion of (5,5) choices. Moreover, this manipulation of the fairness norm is
made possible by the implicit and strong agreement among the Responder‟s normative
expectations about the fairness of Coin choices, and both Proposers‟ and Responders‟
implicit agreement about such normative expectations. As we mentioned at the outset,
such an agreement is a strong indication of the presence of a shared norm.
The second phenomenon is norm evasion. Norm evasion differs from norm
avoidance, in which an individual avoids a specific situation to which a norm applies. A
vivid example of norm avoidance is the behavior of the Iks described by Turnbull (1972).
The Iks repaired their huts in the middle of the night so as to avoid their neighbors‟ offers
of help, as such offers had to be accepted, and that involved incurring an obligation that
55
the beneficiary wanted to avoid. Norm evasion, on the contrary, is the deliberate, private
flouting of a norm even if one knows the normative expectations of the relevant parties.
For many individuals, the presence of normative expectations without the sanctioning
element weakens the grip of the norm. Such expectations can be violated at no cost, as
the victim will not be able to distinguish an intentional action from a chance event. Norm
evasion explains Proposers‟ behavior in the limited information condition, in which (8,2)
was the most frequent choice.
Our work introduces the field of behavioral ethics and builds on the seminal work
of Guth et al. (1982) and Hoffman et al. (1994), who showed the importance of context in
games requiring the division of resources. We add to that work by showing that the
effect of context is mediated by the role that normative expectations and shared norms
hold in explaining behavior. Secondly, our measurement of first-order (Responders‟
fairness judgments) and second-order (Proposers‟ and Responders‟ beliefs about
Responders‟ fairness judgments) beliefs is a useful but underused method in experiments
on strategic interactions. Thirdly, our results potentially allow us to distinguish between
different types of individuals. Future work will explore how a more fine-grained account
of individuals‟ sensitivity to specific norms explains their choices, and whether there are
correlations between sensitivities to different norms, such as those of cooperation,
fairness, and reciprocity. Strong correlations would indicate the existence of a general
disposition to follow social norms, whereas a low correlation would indicate that norm
compliance is a local, norm-specific phenomenon.
Acknowledgements
We wish to thank the Goldstone Research Unit at the University of Pennsylvania for
financial support, Werner Güth, Jonathon Baron, Robert Sugden, and seminar
participants at the Universities of Michigan, CUNY, Yale, Milano, British Columbia,
Alabama, Duke, Madrid, Texas at Austin, Arizona and the Wharton School for many
useful comments and suggestions. We are grateful to Ryan Muldoon, Doug Paletta, and
Giacomo Sillari for their assistance in data collection. Alex Chavez‟s work was supported
by a National Science Foundation Graduate Research Fellowship.

56
Appendix A: Statistical Methods
Rationale for Statistical Methods
To evaluate our hypotheses and predictions, traditional approaches using the
general linear model or the chi-square test for independence are inadequate for at least
two reasons. Firstly, our data contain multiple responses from each participant. If these
responses were substantially correlated, the standard error estimates produced by
traditional methods would be too small. Secondly, four of the eighteen cells (3 choices x
3 information conditions x 2 salience treatments) in our data had counts of less than five,
making inference based on asymptotic results unadvisable.
The Bootstrap
Asymptotically, logit coefficients and the LRT follow known distributions (under
general regularity conditions). However, this is not true for small samples. The bootstrap
distribution of a statistic can be used to check the validity of basing inference on
asymptotic results. Roughly half of the coefficients in the multinomial logit models we
estimated had right-skew (and hence, non-normal) bootstrap distributions, and the
majority of the bootstrap distributions of the LRTs were not chi-square. Had we relied on
traditional analyses based on the normal and chi-square distributions, our standard error
estimates and p-values would have been too small. We provide details of our bootstrap
methods below.
Let yobs = (y1, y2, …, yn) denote the vector of observed data, let T(yobs) denote the
statistic of interest, and let F denote the underlying distribution that generated the data.
The bootstrap estimates F using yobs, thereby producing an estimate, F^, of the
distribution of T(yobs). The non-parametric bootstrap estimates F^ as the distribution
generated by random sampling with replacement from the set of observed data points,
{y1, y2, …, yn}. The parametric bootstrap estimates F^ by estimating the model‟s free
parameters and then sampling from the assumed distribution conditional on its
parameters being fixed at their estimated values. Using either nonparametric or
parametric bootstrap, one generates a bootstrap data set, y, by taking n draws from F^.
The quantity T(y) is the bootstrap estimate of T(yobs), and the distribution of T(y) is its
57
bootstrap distribution. Letting y1, y2, …, yn be n bootstrap data sets, the standard error
estimate of T(yobs,) is the standard deviation of T(y1), T(y2), …, T(yn).
We produced each parametric bootstrap estimate based on the multinomial logit
model by 1) fitting the multinomial logit model using maximum likelihood, 2) generating
159 draws from the multinomial distribution with its parameters fixed at their maximum
likelihood estimates from step 1, and 3) computing and recording the bootstrap estimates
of the statistic of interest. We then repeated the above steps 9,999 times to determine the
distribution of the statistic. The procedure for generating non-parametric bootstrap
estimates is similar: 1) randomly select 25 Proposers in the control and 28 Proposers in
the salient condition, with replacement, 2) compute the statistic of interest, and 3) repeat
the previous two steps 9,999 times.
To determine the p-value for each multinomial logit coefficient, we computed the
smallest value of alpha for which zero was not contained in the confidence interval
formed by the ( 2/*n )th and ( )2/1(* n )th quantiles (sorted values) of the
parametric bootstrap estimates of the coefficients, T(y1), T(y2), …, T(yn).23
The estimate
of the p-value is the proportion of bootstrap estimates that fell strictly outside this
interval, which estimates the probability of drawing a coefficient more extreme in either
tail of its distribution than the observed value. Although the distribution of the
coefficient divided by its estimated standard error converges in probability to the standard
normal, this is not necessary true for small samples. Thus, computing a p-value based on
quantiles of the bootstrap distribution is preferable. We determined the p-value for the
LRT in the same way, except that we constructed a one-sided confidence interval by
omitting the division of by two, as we expected LRTs to be positive under the null
hypothesis.
We also used the boostrap to generate p-values for our hypothesis tests. For our
first three hypotheses, we formed our test statistics by taking the predicted probability for
the choice and information condition of interest, and subtracting from it the maximum of
the predicted probabilities for the two other information conditions. For example, for the
23
The decimal precision of this value is determined by the number of bootstrap replicates.
58
first hypothesis, that coin choices would be more likely in the full information condition
than in the private or limited conditions, we subtract the maximum of the predicted
probabilities of coin in the private and limited conditions from the predicted probability
of coin in the full information condition. Because we expected this test statistic to be
positive, the p-value was the proportion of bootstrap replicates that were negative. Test
statistics for the last three hypotheses were formed analogously.
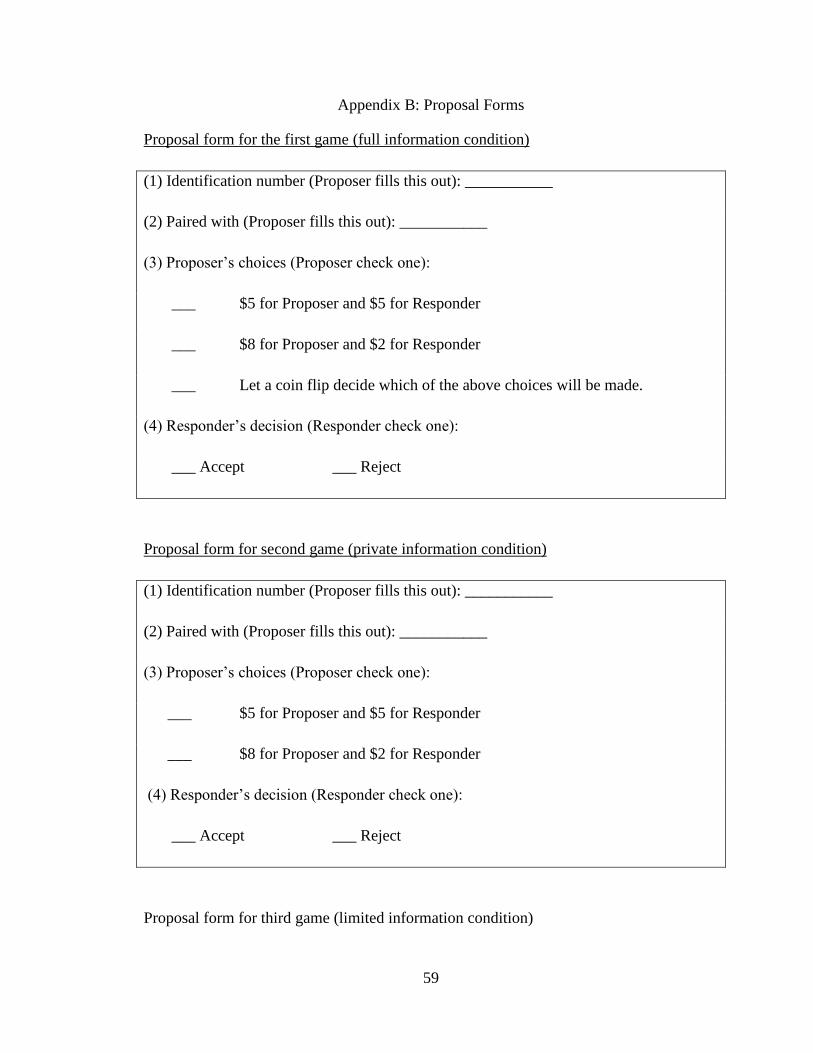
59
Appendix B: Proposal Forms
Proposal form for the first game (full information condition)
(1) Identification number (Proposer fills this out): ___________
(2) Paired with (Proposer fills this out): ___________
(3) Proposer‟s choices (Proposer check one):
___ $5 for Proposer and $5 for Responder
___ $8 for Proposer and $2 for Responder
___ Let a coin flip decide which of the above choices will be made.
(4) Responder‟s decision (Responder check one):
___ Accept ___ Reject
Proposal form for second game (private information condition)
(1) Identification number (Proposer fills this out): ___________
(2) Paired with (Proposer fills this out): ___________
(3) Proposer‟s choices (Proposer check one):
___ $5 for Proposer and $5 for Responder
___ $8 for Proposer and $2 for Responder
(4) Responder‟s decision (Responder check one):
___ Accept ___ Reject
Proposal form for third game (limited information condition)

60
(1) Identification number (Proposer fills this out): ___________
(2) Paired with (Proposer fills this out): ___________
(3) Proposer‟s choices (Proposer check one):
___ $5 for Proposer and $5 for Responder
___ $8 for Proposer and $2 for Responder
Let a coin flip decide which of the above choices will be made.
(4) Responder‟s decision (Responder check one):
___ Accept ___ Reject

61
Appendix C: Questionnaire 1 for Responders
Item (3) of each block of questions was omitted for the private condition, because
Responders did not know that the Coin option was available to Proposers.
Questionnaire
Your identification number: _____________
Please guess how many Proposers will choose:
(1) $5 for Proposer and $5 for Responder: _________
(2) $8 for Proposer and $2 for Responder: _________
(3) Let a coin flip decide: _________
If your guess is correct, you will earn a $1 bonus.
Please mark any options you believe are fair options. You are free to choose none of the
options, one, or more than one option. Your answer will not affect your payment.
(1) $5 for Proposer and $5 for Responder [ ]
(2) $8 for Proposer and $2 for Responder [ ]
(3) Let a coin flip decide [ ]

62
Appendix D: Questionnaire 2 for Responders
Please guess how many Responders (excluding you) will select each of the options in the
above question as fair options. For each line on which your guess is correct, you will
earn a $1 bonus.
(1) $5 for Proposer and $5 for Responder _________
(2) $8 for Proposer and $2 for Responder _________
(3) Let a coin flip decide _________

63
Appendix E: Questionnaire for Proposers
The questionnaire item regarding the Coin option was omitted in the private condition, as
Proposers understood that Responders thought the Coin option was unavailable in that
condition.
Questionnaire
Your identification number: _____________
Each Responder was asked to decide whether the „$5 and $5‟ option is fair.
Please guess how many Responders selected this option as fair: ________
Each Responder was asked to decide whether the „$8 and $2‟ option is fair.
Please guess how many Responders selected this option as fair:_________
Each Responder was asked to decide whether the coin flip option is fair.
Please guess how many Responders selected this option as fair:_________
Note that Responders may answer no to all questions or yes to one or more questions.
For each line on which your guess is correct, you will earn a $1 bonus.

64
References
Bicchieri, C. (2006). The Grammar of Society: The Nature and Dynamics of Social
Norms. Cambridge: Cambridge University Press.
Bicchieri, C. (2008). The fragility of fairness: An experimental investigation on the
conditional status of pro-social norms. Philosophical Issues 18 Interdisciplinary
Core Philosophy: 227-246.
Blount, S. (1995). When social outcomes aren't fair: The effect of causal attributions on
preferences. Organizational Behavior and Human Decision Processes, 63, 131-
144.
Bolton, G. E. and Ockenfels, A. (2000). ERC: a theory of equity reciprocity and
competition. American Economic Review, 90, 166-193.
Bolton, G., J. Brandts and A. Ockenfels (2005). Fair Procedures: Evidence from Games
Involving Lotteries. Economic Journal, 115, 1054-1076.
Camerer, C. (2003). Behavioral Game Theory: Experiments on Strategic Interaction.
Princeton, NJ: Princeton University Press.
Cialdini, R., Kallgren, C., & Reno, R. (1990). A focus theory of normative conduct: A
theoretical refinement and reevaluation of the role of norms in human behavior.
Advances in Experimental Social Psychology, 24, 201-234.
Falk, A. and Fehr, E. (2000). Informal sanctions. IEER Working Paper N. 59.
Falk, A., Fehr, E., & Fischbacher U. (2003). On the nature of fair behavior. Economic
Inquiry, 41(1), 20-26.
Fehr, E. & Schmidt, K. (1999). A theory of fairness, competition, and cooperation. The
Quarterly Journal of Economics, 114(3), 817-868.
Frey, B. & Bohnet, I. (1995). Institutions affect fairness: experimental investigations.
Journal of Institutional and Theoretical Economics, 151(2), 286-303.
Guth, W., Schmittberger R., & Schwarze, B. (1982). An experimental analysis of
ultimatum bargaining. Journal of Economic Behavior and Organization, 3: 367-
88.
Hoffman, E. & Spitzer, M. (1985). Entitlements, rights, and fairness: An experimental
examination of subjects' concept of distributive justice. Journal of Legal Studies,
(2), 259-297.
65
Hoffman, E., McCabe, K. A., Keith, S., & Smith, V. (1994). Preferences, property rights,
and anonymity in bargaining games. Games and Economic Behavior, 7(3): 346-
380.
Kagel, J. H., Kim, C., & Moser, D. (1996). Fairness in ultimatum games with asymmetric
information and asymmetric payoffs. Games and Economic Behavior, 13(1), 100-
110.
Straub, P. G., & Murnighan, J. K. (1995). An experimental investigation of ultimatum
games: Information, fairness, expectations, and lowest acceptable offers. Journal
of Economic Behavior and Organization, 27, 345-364.
Turnbull, C. (1972). The Mountain People. New York: Simon and Schuster.
Weber, R. A. (2003). Learning' with no feedback in a competitive guessing game. Games
Economic Behavior, 44(1), 134-144.

66
Chapter 4
Norm Conformity, Manipulation, and Evasion: Experimental Evidence
Abstract. Using an economic bargaining game, we tested for the existence of two
phenomena related to social norms, namely norm manipulation – the selection of an
interpretation of the norm that best suits an individual – and norm evasion – the
deliberate, private violation of a social norm. We found that the manipulation of a norm
of fairness was characterized by a self-serving bias in beliefs about what constituted
normatively acceptable behavior, so that an individual who made an uneven bargaining
offer genuinely believed it was fair, even though recipients of the offer considered it to be
unfair. In contrast, norm evasion operated as a highly explicit process. When they could
do so without the recipient‟s knowledge, individuals made uneven offers despite knowing
that their behavior was unfair.
Introduction
Multiple interpretations of a social norm often exist. For example, there is a social norm
of leaving 15-20% of the bill in gratuity when dining in the United States, as long as
service was at least adequate. Norm manipulation is the selection of the interpretation of
a norm that best suits an individual (Bicchieri, 2006; Bicchieri, 2008; Bicchieri &
Chavez, 2010) – in this case, leaving 15% instead of 20%. Bicchieri & Chavez (2010)
hypothesized that individuals are prone to a self-serving bias in that they adopt beliefs
that justify their manipulation of a norm. We explored this hypothesis empirically by
measuring the normative beliefs of two parties whose monetary interests in a bargaining
situation were diametrically opposed.
Related to norm manipulation is norm evasion – the deliberate, private violation
of a norm. When information is private to one or more parties, each party may hold
different interpretations about what constitutes norm-abiding behavior. Consider a diner
who receives mediocre service and leaves a gratuity of 10%, whereas the server expects

67
15-20%. Because of the privacy of the diner‟s beliefs about the quality of service, it is
impossible to tell whether the low tip was a putative non-violation of the norm (the diner
believes 10% is commensurate with the poor quality of service) or a violation of the norm
(the diner knows that the server cannot tell whether the former possibility is true or
whether the diner blatantly violated the norm); in this case, the ambiguity created by
private information allows the diner to leave 10% with impunity. We directly tested for
norm evasion by measuring whether individuals chose uneven monetary splits in a
bargaining game, despite believing that it was normatively unacceptable and that others
believed the same.
Background. Tipping in the United States, not cutting in front of others who are waiting
in line, and paying for dinner or splitting the bill are all examples of social norms. They
are not universally followed rules (leaving a gratuity in Japan is not considered
appropriate), nor are they unconditionally followed rules (if everyone else is disregarding
the long queue for the highway exit, you might be inclined to cut to the front as well). A
social norm may be formally defined as a situation-specific behavioral rule that a
sufficient number of individuals in a population have a conditional preference to follow
(Bicchieri, 2006). To prefer to conform to the norm, an individual must believe that
others in the relevant population conform to the norm (empirical expectations) and that
they expect norm conformity (normative expectations), with possible sanctions for norm
non-conformity. Having a conditional preference for norm conformity implies that one
might follow a norm in the presence of the relevant expectations, but disregard it in their
absence. To test this hypothesis, we focused on a version of the Ultimatum Game (Guth,
Schmittberger, & Schwarze, 1982) in which Proposers proposed a division of a sum of
$10.00 to Responders, who accepted or rejected the offer. In the case of a rejection, both
parties got nothing.
On average, Proposers make offers that are 40-50% of the total amount, and
Responders reject offers below 20% about half of the time (Camerer, 2003). This
suggests that there is a shared norm of fairness as (roughly) equal division in the standard
Ultimatum Game. However, subtle manipulations to the Ultimatum Game can create
multiple interpretations of what constitutes fair behavior. Instead of specifying that each

68
party earns nothing if the Responder rejects, Knez & Camerer (1995) assigned payoffs of
$2.00 to the Proposer and $3.00 to the Responder in the case of rejection. Under the
interpretation of fairness as equality in payoffs, offers of $5.00 are fair. However,
because the Responder can earn $3.00 by rejecting, another interpretation of fairness is
that the Proposer should offer $5.50 to equalize the difference between received and
foregone payoffs (the difference is $5.50 - $3.00 = $2.50 for the Responder, and $4.50-
$2.00 = $2.50 for the Proposer). Whereas average rejection rates typically are 5-25%, in
the study of Knez & Camerer (1995), rejection rates were close to 50%. They interpret
their results by suggesting that Proposers and Responders adopted self-serving beliefs
about what constituted a fair offer.
Kagel, Kim, & Moser (1996) asked Proposers and Responders to bargain over
100 chips which were worth three times as much for one player ($0.30 vs. $0.10 per
chip). When chips were worth more for Proposers, and both parties knew that both parties
knew this, both Proposers and Responders adopted self-serving fairness beliefs:
Proposers offered slightly more than half the chips, which was an offer of only 1/4th
of
the money (instead of 75% of the chips, which would be an offer of half the money), and
Responders rejected roughly half the time.
Finally, using a $10.00 Ultimatum Game, Bicchieri & Chavez (2010) found that
Proposers were much more likely to choose to let a fair coin flip randomize between an
offer of $5.00 and an offer of $2.00 when they knew that Responders knew about the
availability of the coin flip.
Although these studies inferred that individual adopted self-serving interpretations
about what constituted fair behavior, they did not directly measure Proposers‟ fairness
beliefs, and instead based their inferences on behavior alone. But at least two
mechanisms could give rise to such behavior. On one hand, Proposers might genuinely
believe that uneven monetary splits are fair. On the other hand, Proposers might believe
that uneven monetary splits are unfair, but believe that Responders believe that such
splits are fair. Uneven offer behavior is consistent with either explanation, but the
psychological mechanisms underlying these two explanations are different. In the first
case, a self-serving bias leads Proposers to consider uneven splits to be fair; given that

69
both even and uneven splits are fair, Proposers choose the one that yields a higher payoff.
In the second case, Proposers suffer no self-serving bias, and knowingly make an unfair
offer because Responders lack full information. To distinguish between these
possibilities, we used the previous design of Bicchieri & Chavez (2010), which employed
a variant of the Ultimatum Game to 1) create multiple interpretations of what constituted
a fair offer and 2) create informational asymmetries between Proposers and Responders.
We built on their study by measuring both Proposers‟ and Responders‟ fairness beliefs,
allowing us to directly assess the presence of norm manipulation and norm evasion, and
also explored the presence of strategic types by analyzing intra-individual choice patterns
and the structure of fairness beliefs across conditions.
Methods
Participants. 64 college-age participants took part in our study across 6 experimental
sessions. Advertisements specified that participants would earn 5 USD in addition to an
amount that would depend on decisions made during the experiment.
Game Paradigm. Our experimental design employed a variant of the Ultimatum Game in
which one participant, the Proposer, provisionally received a sum of 10 USD – provided
by the experimenter – and then proposed a division of that money with a Responder. The
Responder subsequently decided to accept or reject the proposal. If the Responder
accepted, both players received the amounts specified in the proposal. If the Responder
rejected, both players received $0. The Proposer chose from one of the following options:
(5,5) – to propose $5 for the Proposer and $5 for the Responder;
(8,2) – to propose $8 for the Proposer and $2 for the Responder; and
Coin – to let the outcome of a fair coin flip determine the proposal: Heads
corresponded to (5,5) and tails to (8,2).
Procedure. An experimenter randomized participants into one of two rooms, which
determined whether they would be a Proposer or a Responder for the duration of the
study. Participants played three Ultimatum Games under different information conditions
in a within-subjects design. In the full information condition, all participants understood
that the Coin option was available and that Responders would know if the Proposer with

70
whom they were paired chose Coin. In the private information condition, Responders did
not know that Coin was available to Proposers, and Proposers were aware of this fact. In
the limited information condition, participants knew that the Coin option was available,
but that the Responder would not be able to distinguish whether the Proposer chose (5,5)
or (8,2) directly, or chose Coin whose outcome was (5,5) or (8,2). We fixed the order of
conditions to minimize participants‟ misunderstanding of the instructions, based on a
pilot study. Additional details regarding the procedure and the manner in which we
created these information asymmetries is described by Bicchieri & Chavez (2010).
Results
Perfect Rationality / Profit Maximization Hypothesis. We begin by testing a basic and
crude hypothesis that participants only cared about payoffs. Under the assumptions that
participants sought to maximize their individual monetary gains and that this was
common knowledge, the following predictions emerged:
1) No Responder should ever reject any offer, because accepting any offer yielded a
positive payoff and rejecting yielded a payoff of $0.00,
2) Proposers should therefore:
a. Always believe that Responders will accept any offer,
b. Always propose (8,2), because conditional on the Responder accepting,
(8,2) maximized the Proposer‟s payoff.
7/32 Responders rejected at least one offer, falsifying the first prediction. Specifically,
Responders accepted all 45 (5,5) choices and all 20 Coin choices, 3 of which resulted in
an offer of (8,2). However, when Proposers chose (8,2), Responders rejected 1/4 (25%),
4/11 (36%), and 5/14 (36%) times respectively in the full, private, and limited
information conditions.
When we elicited Proposers‟ beliefs by offering monetary rewards (see
Appendix), 19/32 Proposers believed that fewer than half of Responders would accept
(8,2), falsifying prediction 2a. Finally, 29/32 Proposers proposed something other than
(8,2), falsifying prediction 2b. Thus, as expected, there was strong evidence against the
perfect rationality / profit maximization hypothesis.

71
Profit Maximization Hypothesis. It was possible that Proposers sought to maximize their
monetary gains, but did not expect Responders to do the same. According to the profit
maximization hypothesis, Proposers‟ beliefs about the probability of acceptance
determined which proposal the Proposer chose, based on the one that yielded the highest
expected value. Although we did not measure Proposers‟ exact estimates of the
probability that the Responder would accept a particular offer, we recorded whether each
Proposer believed the majority of Responders would accept a particular offer. Table 4.1
tabulates these responses.
Table 4.1
Proposers’ beliefs about whether the majority of Responders would accept (5,5) and (8,2)
by information condition and offer source.
Will the Majority of Responders accept?
(5,5) (8,2)
Information Condition / Source Yes No Yes No
Full
From Coin
From choice
Private
Limited
32 0 15 16
32 0 25 7
32 0 17 12
31 0 22 9
Note. Three rows total 31 instead of 32 because of missing data due to clerical error.
Because Responders almost always accept offers of (5,5) in Ultimatum Games (Camerer,
2003; in our data, the acceptance rate of (5,5) was 100%), we assumed Proposers would
believe all Responders would accept (5,5). Consistent with this assumption, 100% of
Proposers believed the majority of Responders would accept (5,5), regardless of the
information condition or offer source. The expected value of (5,5), therefore, was $5.00.
It follows that a profit-maximizing Proposer who believed half or fewer than half
of Responders would accept (8,2) would never propose (8,2), because the expected value
of choosing (8,2) was at most $4.00, which is less than the $5.00 that the Proposer could
expect from choosing (5,5). In addition, such Proposers would also never choose Coin,
because its expected value was E[Coin] = $2.50 + $4.00q ≤ $4.50, where q ≤ .5 is the
Proposer‟s unmeasured belief about the proportion of Responders who would accept
(8,2). Instead of earning an expected $4.50 or less from Coin, such a Proposer should

72
choose (5,5) to earn $5.00. In summary, we predicted that no Proposer would choose
(8,2) or Coin if they believed half or fewer than half of Responders would accept (8,2).
Given that a Proposer believed half or fewer than half of Responders would
accept (8,2), however, 0/16 proposed (8,2) in the full information condition, 3/15
proposed (8,2) in the private condition, and 3/9 proposed (8,2) in the limited condition.
1/7 proposed Coin in the full condition, 0/15 proposed Coin in the private condition, and
2/9 proposed Coin in the limited condition. The non-zero proportion of such Proposers
who proposed (8,2) or Coin indicates the presence of inconsistent belief-choice pairs
under the profit maximization hypothesis, and therefore provides evidence against the
profit maximization hypothesis.
Finally, we turn to the remaining Proposers – those who believed the majority of
Responders would accept (8,2). According to the profit maximization hypothesis, such
Proposers would choose Coin if the expected value of Coin was greater than both that of
(5,5) and (8,2). It can be shown that this condition is never met.24
For all values of q less
than 5/8, (5,5) is strictly preferred. For all values of q greater than 5/8, (8,2) is strictly
preferred. When and only when q = 5/8, the expected value of Coin is the same as that of
(5,5) and (8,2), in which case it can be argued that the Responder was indifferent between
(5,5), (8,2), and Coin.
Under the profit maximization hypothesis, one might argue that Coin choices
therefore resulted from Proposers for whom q = 5/8 who chose randomly with probability
1/3 amongst the three offer choices. An exact multinomial test rejected the corresponding
null hypothesis that the overall probability of choosing each option was 1/3, however (p =
.0049); 46/96 (48%) of choices were (5,5), 30/96 (31%) were (8,2), and 20/96 (21%)
were Coin. Combined with the fact that there were 9 Responders who chose Coin but
believed q ≤ .5 – a logically inconsistent choice-belief pair – we conclude that there is
substantial evidence against the profit maximization hypothesis.
24
For a profit-maximizer to choose Coin, we require E[Coin] > E[(5,5)] and E[Coin] > E[(8,2)], or $2.5 +
$4q > $5 and $2.5 + $4q > $8q. Solving for q yields q > 5/8 and q < 5/8, a logical impossibility. Replacing
the strict inequality signs with weak inequality signs shows that the expected values of all three options are
equal iff q = 5/8.

73
Social Norms Hypothesis. Theories of maximizing only monetary gains were not
sufficient to explain participants‟ behavior. Moreover, profit maximization theories were
agnostic as to why Proposers‟ beliefs and behavior varied across information conditions,
even when material consequences were held fixed. A theory of social norms predicted
that participants would be focused on different fairness norms when we manipulated their
first- and second-order fairness beliefs defined, respectively, as 1) which offers they
considered fair, and 2) which offers they believed others considered fair. Before
analyzing the belief data, however, we first tested our primary hypotheses concerning
behavior by analyzing the distribution of offers across information condition.
Predictions about Frequencies of Behavior by Condition. In the full information
condition, because information about the coin flip was complete (whether the Proposer
chose to flip a coin and the outcome of the coin flip were both public knowledge) and
normative expectations for coin were present, we expected more coin choices in this
condition relative to the others. In the limited information condition, because Proposers
could take advantage of the ambiguity created by the opacity of the offer source (an offer
of (8,2) could have been generated by a Coin choice, and the Responder could not
determine whether the Proposer chose coin), we expected the highest frequency of (8,2)
choices in this condition. Finally, Proposers essentially faced a choice between (5,5) and
(8,2) in the private condition, as there were no normative expectations to choose Coin; we
therefore expected the highest frequency of (5,5) choices in this condition.
Figure 4.1 shows aggregated offer proportions by condition. Fisher‟s exact test
rejected the null hypothesis of no association between offer and condition (p = .0012).
The hypothesis that (5,5) offers were more likely in the private condition than the other
conditions was not supported by Fisher‟s one-sided exact test (OR = 1.64, p = .1739).
However, (8,2) was more likely in the limited condition than in the other conditions (OR
= 2.85, p = .0187), and Coin was more likely to be selected in the full condition than in
the other conditions (OR = 7.34, p = .0002), as expected. Follow-up permutation tests25
revealed that (8,2) was more likely in the limited condition than the full condition (OR =
25
Directional hypotheses such as πCoin|Full > πCoin|Private (where πi|j = Pr(Choice=i | Condition=j)) can be tested
using permutation tests which are exact up to randomization error and respect the dependence of the
within-participants design.
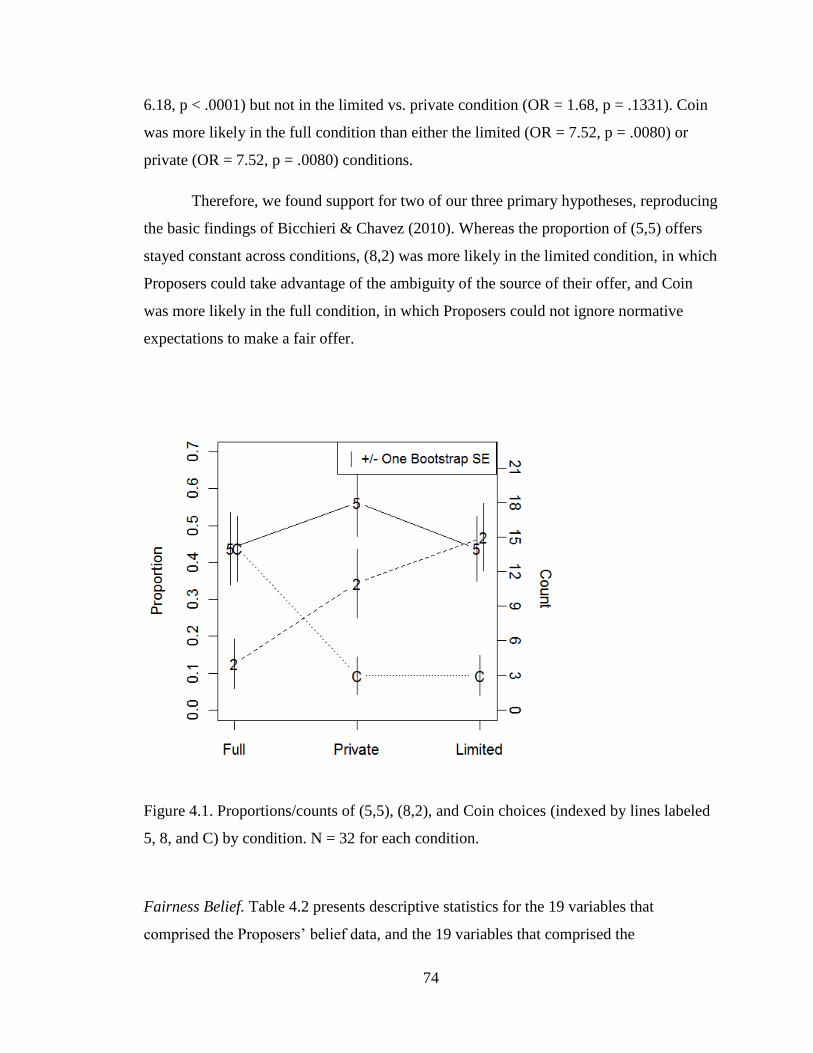
74
6.18, p < .0001) but not in the limited vs. private condition (OR = 1.68, p = .1331). Coin
was more likely in the full condition than either the limited (OR = 7.52, p = .0080) or
private (OR = 7.52, p = .0080) conditions.
Therefore, we found support for two of our three primary hypotheses, reproducing
the basic findings of Bicchieri & Chavez (2010). Whereas the proportion of (5,5) offers
stayed constant across conditions, (8,2) was more likely in the limited condition, in which
Proposers could take advantage of the ambiguity of the source of their offer, and Coin
was more likely in the full condition, in which Proposers could not ignore normative
expectations to make a fair offer.
Figure 4.1. Proportions/counts of (5,5), (8,2), and Coin choices (indexed by lines labeled
5, 8, and C) by condition. N = 32 for each condition.
Fairness Belief. Table 4.2 presents descriptive statistics for the 19 variables that
comprised the Proposers‟ belief data, and the 19 variables that comprised the

75
Responders‟ belief data (see Appendix for the form used for Proposers). We omitted most
belief variables involving (5,5), as participants universally considered (5,5) to be fair and
believed that (5,5) would be accepted by the majority of Responders.
Responders‟ beliefs about the proportions of Proposers who would choose (5,5),
(8,2), and Coin largely were insensitive to experimentally created informational
asymmetries, as indicated by the constancy of expected proportions of (8,2) and Coin
choices across information conditions. Responders believed, however, that there would
be a dramatic increase in the proportion of (5,5) choices in the private condition, although
they expected the proportion of (8,2) choices to stay the same as in the full and limited
information conditions. Thus, they believed that a fraction of Proposers would choose
Coin when it was an available option, but would instead choose (5,5) when it was
unavailable; that is, Responders believed Proposers had a conditional preference for
choosing Coin.

76
Table 4.2
Means (SEMs) for the Belief Data
Proposers Responders
Full Private Limited Full Private Limited
Responders‟ Empirical
Expectations
What % of Proposers will
choose (5,5)?
-
-
-
-
-
-
.44
(.06)
.71
(.05)
.46
(.06)
What % of Proposers will
choose (8,2)?
-
-
-
-
-
-
.28
(.05)
.28
(.05)
.28
(.06)
What % of Proposers will
choose Coin?
-
-
-
-
-
-
.28
(.05)
-
-
.25
(.06)
Fairness Beliefs
Is (8,2) a fair option? .09
(.05)
.19
(.07)
.16
(.07)
.22
(.07)
.19
(.07)
.25
(.08)
What % of Proposers said
(8,2) was a fair option?
.27
(.05)
.29
(.06)
.29
(.06)
-
-
-
-
-
-
What % of Responders
said (8,2) was a fair
option?
.10
(.03)
.10
(.03)
.14
(.04)
.15
(.05)
.13
(.05)
.15
(.05)
Is Coin a fair option? .81
(.07)
-
-
.72
(.08)
.52
(.09)
-
-
.43
(.09)
What % of Proposers said
Coin was a fair option?
.85
(.04)
-
-
.77
(.06)
-
-
-
-
-
-
What % of Responders
said Coin was fair?
.76
(.05)
-
-
.62
(.07)
.46
(.06)
-
-
.39
(.07)
Proposers‟ Profit-
Maximizing Beliefs
Will the majority of
Responders accept (8,2)
not resulting from Coin?
.48
(.09)
.53
(.09)
.71
(.08)
-
-
-
-
-
-
Will the majority of
Responders accept (8,2)
resulting from Coin?
.78
(.07)
-
-
-
-
-
-
-
-
-
-
Note. The yes/no questions (“Is … a fair option?” and “Will the majority…?”) were
dummy coded as 1 (yes) or 0 (no); therefore, the means for these questions were the
proportions of individuals who answered yes.
Norm Manipulation. Both Proposers and Responders generally considered (8,2) to be
unfair, and believed that others considered it to be unfair. The proportion of Proposers
who considered (8,2) to be fair did not differ from the proportion of Responders who
considered it to be fair (χ2(1) = 1.90, p = .17, in the full condition; χ
2(1) = 0.00 in the
77
private condition; and χ2(1) = 0.87, p = .35, in the limited condition). However, more
Proposers than Responders considered Coin to be fair, both in the full information
condition (81% vs. 52%, χ2(1) = 6.93, p = .0085) and in the limited information condition
(72% vs. 43%, χ2(1) = 6.35, p = .0117). Second-order beliefs about the fairness of Coin
exhibited the same pattern; in the full information condition, Proposers believed 76% of
Responders considered Coin fair, whereas Responders believed 46% of Responders
considered Coin fair (t(61) = 3.70, p < .001), and in the limited information condition, the
respective figures were 62% and 39% (t(62) = 2.46, p = .0168).
Thus, when multiple interpretations of a social norm were available (many
Responders believed that Coin, in addition to (5,5), was fair), Proposers exhibited a self-
serving bias in both first- and second-order beliefs about the fairness of Coin. Under an
alternative theory of norm manipulation, individuals who offered Coin could have
believed that Coin was unfair, but that Responders considered it to be fair. However, 11
of the 14 Proposers who chose Coin in the full information condition believed that Coin
was fair. Thus, taken together, these findings provided evidence of particular brand of
norm manipulation, in which individuals adopted an interpretation of a norm that best
suited them, while simultaneously exhibiting self-serving biases in their first- and second-
order beliefs about the normative acceptability of that interpretation. This suggests that
findings in previous studies in which Proposers offered less when multiple focal points
were available were not due to the intentional exploitation of the normative ambiguity,
but rather a true self-serving bias in fairness beliefs (Knez & Camerer, 1995).
Norm Evasion. We hypothesized that Proposers who chose (8,2) in the limited
information condition did so despite believing that (8,2) was unfair, and despite believing
that most Responders and other Proposers considered (8,2) to be unfair. In the limited
condition, because Responders could not distinguish between 1) a choice of (8,2), and 2)
a Coin choice that resulted in an offer of (8,2), Proposers could deliberately ignore
normative expectations. By measuring Proposers‟ fairness beliefs, we were able to
directly test for the presence of norm evasion. 11 of the 15 Proposers who chose (8,2) in
the limited condition believed that (8,2) was not fair. Moreover, Proposers who chose
(8,2) in the limited condition believed on average that only 34% of other Proposers and

78
21% of Responders thought (8,2) was fair. Thus, we found direct evidence that Proposers
intentionally ignored normative expectations in the limited condition in order to evade a
norm of fairness. This pattern of beliefs and behavior is qualitatively distinct from that of
norm manipulation. We emphasize this fact because the results from previous studies that
have been attributed to self-serving biases in what is considered fair could have also
resulted from norm evasion. For example, it is highly plausible that Proposers in the
study of Kagel et al. (1996) intentionally offered half the chips instead of half the money
because of the informational asymmetry of the chip value, while considering such an
offer to be unfair to the Responder.
Structure of Fairness Beliefs. To find patterns of variability and to reduce the
dimensionality of the Proposers‟ belief data, we subjected the 19 variables comprising the
Proposers‟ belief data to an exploratory factor analysis. Successive tests at the alpha = .05
significance level determined that the eigenvalues corresponding to the first four factors
were greater than would have been expected by chance variability.26
We therefore
selected a four-factor solution. Because there was no a priori reason to expect the factors
to be orthogonal, we applied an oblimin rotation to assist with the interpretability of the
pattern of loadings, although other oblique and orthogonal rotations did not affect the
substantive findings.
Table 4.3 shows the resulting factor solution. The pattern of loadings led to four
clearly interpretable factors with a simple structure. Factor 1 loaded on Proposers‟ first-
and second-order beliefs about the fairness of (8,2). Proposers with high scores on Factor
1 believed that (8,2) was fair, and that other Proposers and Responders also believed (8,2)
was fair. Factors 2 and 4 loaded on beliefs about the fairness of Coin in, respectively, the
limited information condition and the full information condition. Proposers with higher
scores on Factor 2 believed that Coin was fair in the limited information condition, and
that other Proposers and Responders believed the same; those with higher scores on
Factor 4 had analogous beliefs about the fairness of Coin in the full information
26
This method of assessing factorial dimensionality, introduced by Horn (1965), has been shown in
simulation studies (Zwick & Velicer, 1986) to correctly identify the number of factors more often than
either the observed root-one rule (Kaiser, 1960) or the scree plot (Cattell, 1966), in some circumstances by
large margins (e.g., 92% accuracy for the present method vs. 22% accuracy for the root-one rule).

79
condition. Finally, Factor 3 loaded on beliefs about whether the majority of Responders
would accept (8,2). Thus, Factors 1, 2, and 4 represented Proposers‟ first- and second-
order normative beliefs about (8,2) and Coin, whereas Factor 3 represented profit-
maximizing considerations.
At first glance, Factors 1 and 3 appeared to measure similar constructs, as Factor
1 loaded on beliefs about the fairness of (8,2) and Factor 3 loaded on beliefs about
whether the majority of Responders would accept (8,2); however, they had an interfactor
correlation of only .11, indicating that fairness beliefs largely were orthogonal to profit-
maximizing considerations. The factorial independence of fairness beliefs and expected
value beliefs was consistent with a theory of social norms, in which beliefs directly affect
outcome utilities above and beyond their effect on the outcome probabilities that would
be used to compute expected values. Other interfactor correlations were also low, ranging
from a minimum of .02 for the Factors 3 and 4, to a maximum of .32 for the Factors 1
and 2.

80
Table 4.3
Factor Loadings for Proposers’ Belief Data from a Four-Factor EFA
Variable Factor 1:
Fairness
of (8,2)
Factor 2:
Fairness of
Coin-Limited
Factor 3: Profit
Maximization
Factor 4: Fairness
of Coin-Full
(8,2) is fair
Full 0.53 -0.28 -0.17
Private 0.96
Limited 0.93 0.14
% of Proposers who
said (8,2) is fair
Full 0.46 0.09 0.32
Private 0.71 0.36 -0.13
Limited 0.77 0.33 -0.12 -0.17
% of Responders
who said (8,2) is fair
Full 0.43 -0.11 0.17
Private 0.46 0.11
Limited 0.61 0.28 -0.19
Coin is fair
Full 0.14 0.76
Limited 0.11 0.79
% of Proposers who
said Coin is fair
Full 0.22 0.91
Limited 0.91 0.16
% of Responders
who said Coin is fair
Full 0.16 0.48
Limited 0.84 0.12 0.11
Majority of
Responders will
accept (8,2)
Full 0.12 0.88 0.22
Full (from coin) -0.24 0.66
Private 0.18 0.72
Limited 0.33 0.66 -0.44
Proportion Var. 0.23 0.16 0.13 0.12
Cumulative Var. 0.23 0.39 0.52 0.64
Corr. Scores 1.00 1.00 0.99 0.99
Note. Only loadings with a magnitude of at least 0.10 are shown. An oblimin rotation was
applied. Loadings used to interpret each factor are bolded.
81
Fairness Beliefs as Predictors of Behavior. To investigate whether beliefs predicted
choices, we entered standardized regression factor scores (Thurstone, 1935) into logit
models of choices, and used AIC-based stepwise variable selection to find a set of
informative factors. Because interfactor correlations were small, we did not enter
interactions between factors into any models. For the full and limited information
conditions, we used multinomial logit models to estimate the log-odds of choosing (8,2)
over (5,5), and the log-odds of choosing Coin over (5,5). For the private condition,
however, we used a binomial model to estimate the log-odds of choosing the (8,2) over
(5,5), as there were only three Coin choices, and the multinomial logit model had
estimation problems. Table 4.4 shows the logit estimates of the resulting models, and
Figures 2-4 plot the corresponding predicted choice probabilities by factor scores.
In the full information condition, the two factors retained had qualitatively similar
effects on choice probabilities. For Proposers with extremely low scores on Factor 1 or
Factor 3 – respectively reflecting the belief that (8,2) was unfair and that others agreed
and the belief that Responders would reject (8,2) – the probability of choosing (8,2) was
very low, and the probability of choosing (5,5) was highest (see Figure 4.2). As scores on
Factors 1 or 3 increased from extremely low to extremely high values, the probability of
(5,5) monotonically declined, whereas the probability of (8,2) monotonically increased,
with the two options being equiprobable at respective factor scores of two standard
deviations above the mean for Factor 1 and one standard deviation above the mean for
Factor 3. The probability of choosing Coin, on the other hand, exhibited an inverted-U
shaped curve as factor scores increased from extremely low to extremely high values,
reaching a maximum probability of roughly .55 - .65 when the factor score was half a
standard deviation above the mean. That Factors 1 and 3 were informative predictors of
choice in a simultaneous regression model strongly supported the social norms
hypothesis, as empirical and normative expectations predicted choice in the expected
directions, even when controlling for the effects of profit-maximizing considerations.
In the private information condition, the predicted probability of the Proposer
choosing (5,5) monotonically decreased as Factor 1 scores or Factor 4 scores increased
(see Figure 4.3). Slightly above the mean score for Factor 1, and one standard deviation

82
above the mean score for Factor 4, (5,5) and (8,2) were equiprobable. To reiterate,
Factors 1 and 4 – which reflected beliefs that (8,2) overall and Coin in the full condition
were fair and considered fair by others – were more informative predictors of choice than
Factor 3, beliefs about the likelihood of (8,2) being accepted. This finding further
supported the social norms hypothesis. Firstly, empirical and normative expectations
were more predictive of choice than profit-maximizing considerations. Secondly, the
effect of Factor 4 suggested that only Proposers who were sensitive to social norms – i.e.,
those who believed Coin was empirically and normatively acceptable in the full
information condition – chose (8,2) over (5,5) in the private condition; those who chose
(5,5) over (8,2) in the private condition held first- and second-order beliefs that Coin was
not fair in the full information condition. We return to this issue of patterns of choices
across conditions in subsequent analyses.
Finally, in the limited information condition, as Factor 3 scores increased, the
predicted probability of the Proposer choosing (5,5) monotonically declined, whereas the
probability of (8,2) monotonically increased (see Figure 4.4). Profit-maximizing motives
therefore appeared to dominate in this condition, as Proposers knew that Responders
could not distinguish between a choice of (8,2) and a choice of Coin which resulted in an
offer of (8,2). In fact, only 48.3% and 53.1% of Proposers believed the majority of
Responders would accept (8,2) in the full and private information conditions respectively,
but 71.0% believed the majority of Responders would accept (8,2) in the limited
condition.

83
Table 4.4
Logit Coefficients of Factor Scores as Predictors of Proposers’ Choice, by Information
Condition
Condition Intercept Factor 1:
Fairness of
(8,2)
Factor 2:
Fairness of
Coin-Limited
Factor 3:
Acceptability
of (8,2)
Factor 4:
Fairness of
Coin-Full
Full
(8,2) vs. (5,5) -2.40 1.37∙ - 3.26
∙ -
Coin vs. (5,5) 0.33 0.20 - 1.38* -
Private
(8,2) vs. (5,5) -0.58 1.54* - - 0.83
Limited
(8,2) vs. (5,5) 0.07 - - 0.97* -
Coin vs. (5,5) -1.78* - - 0.39 -
∙p < .10,
*p < .05.
Note. The factors to retain as predictors were chosen by minimizing AIC through
stepwise regression.
Figure 4.2. Predicted choice probabilities in the full information condition, by Factors 1
and 2, based on the model in Table 4.4. To compute the predicted probability as a
function of Factor 1 (left graph), the value of Factor 3 was held fixed at its mean.
Analogously, the value of Factor 1 was held fixed at its mean in the right graph.

84
Figure 4.3. Predicted choice probabilities in the private information condition by Factors
1 and 4, based on the model in Table 4.4. To compute the predicted probability as a
function of Factor 1 (left graph), the value of Factor 4 was held fixed at its mean.
Analogously, the value of Factor 1 was held fixed at its mean in the right graph.
Figure 4.4. Predicted choice probabilities in the limited information condition by Factor
3.
85
Secondary Analysis: Types. We expected different patterns of correlated choices across
conditions, with some choice patterns corresponding to Proposers who were sensitive to
social norms of fairness, and other patterns corresponding to Proposers who were
primarily concerned with maximizing expected value. Although the design limitation
imposed by a fixed ordering of information conditions and small number of participants
precluded a thorough investigation of such strategic types, we report results from a
preliminary approach employing latent class analysis and factor score regression to
connect choice patterns with beliefs.
According to the social norms hypothesis, in the full information condition, most
norm-followers should choose Coin, as Proposers believed that the majority of others
considered Coin to be fair (see Table 4.2). Some norm-followers might consider only
(5,5) to be fair, and we expected this type to always choose (5,5). Finally, any expected
value maximizers should choose (5,5) or (8,2) based on which choice they expected to
yield a higher payoff.
Because normative expectations for Coin were absent in the private information
condition, we expected all types to choose (5,5) or (8,2) based on their expected values,
with one constraint: expected value maximizers should make the same choice as they
made in the full information condition, as their preferences are, by definition, insensitive
to normative expectations. We note that those who chose Coin in the full information
condition should make a choice of (8,2) in the limited information condition only if they
believed that the presence of Coin lowered the acceptance probability of (8,2) in the full
condition, although our present design cannot verify this choice-belief pattern.
Finally, in the limited information condition, normative expectations for Coin
were present (see Table 4.2), but norm conformity could not be assessed due to the
opacity of the offer source (a direct choice or the result of a coin flip). Thus, either (5,5)
or (8,2) could be expected, with the constraint that any Proposer who chose (8,2) in the
full or private conditions should choose (8,2) in the limited condition as well, as the
probability of (8,2) being rejected in the latter condition is, ceteris paribus, lower than in
the former conditions. To summarize, of the 27 possible patterns of choices across

86
conditions, we expected the following 6: Coin-(5,5)-(8,2), Coin-(8,2)-(8,2), Coin-(5,5)-
(5,5), (5,5)-(5,5)-(5,5), (5,5)-(5,5)-(8,2), and (8,2)-(8,2)-(8,2).
Table 4.5 tabulates observed offer patterns across conditions. 24 of the 32
observed patterns were contained in the list of expected patterns generated by the social
norms hypothesis. The only offer pattern on our list of expected patterns for which there
were no observations was (5,5)-(5,5)-(8,2). For the remaining observed offer patterns, the
Proposer offered Coin in either the private or limited condition, with the exception of the
pattern (8,2)-(8,2)-(5,5). On the whole, the distribution of observed patterns was highly
consistent with predictions based on a theory of social norms.
Table 4.5
Tabulation of Offer Patterns Across Conditions
Note. The patterns we expected to observe are in boldface.
Latent Class Analysis. To explain the dependency of choices across conditions, and to
identify clusters of subjects whose beliefs might differ in meaningful ways, we subjected
the 3 x 3 x 3 table of observed choice patterns to a latent class analysis. A one-class
solution of log-linear independence did not adequately fit the data (G2(20) = 40.52, p =
.004), whereas a two-class solution did (G2(23) = 16.16, p = .241). Moreover, the two-
class model fit significantly better than the one-class model (χ2(7) = 24.36, p < .001),
Condition
Full Private Limited Count
(5,5) (5,5) (5,5) 8
Coin (8,2) (8,2) 5
Coin (5,5) (5,5) 4
Coin (5,5) (8,2) 4
(8,2) (8,2) (8,2) 3
(5,5) (5,5) Coin 2
(5,5) (8,2) (8,2) 1
(5,5) (8,2) Coin 1
(5,5) Coin (5,5) 1
(5,5) Coin (8,2) 1
(8,2) (8,2) (5,5) 1
Coin Coin (8,2) 1
Total 32
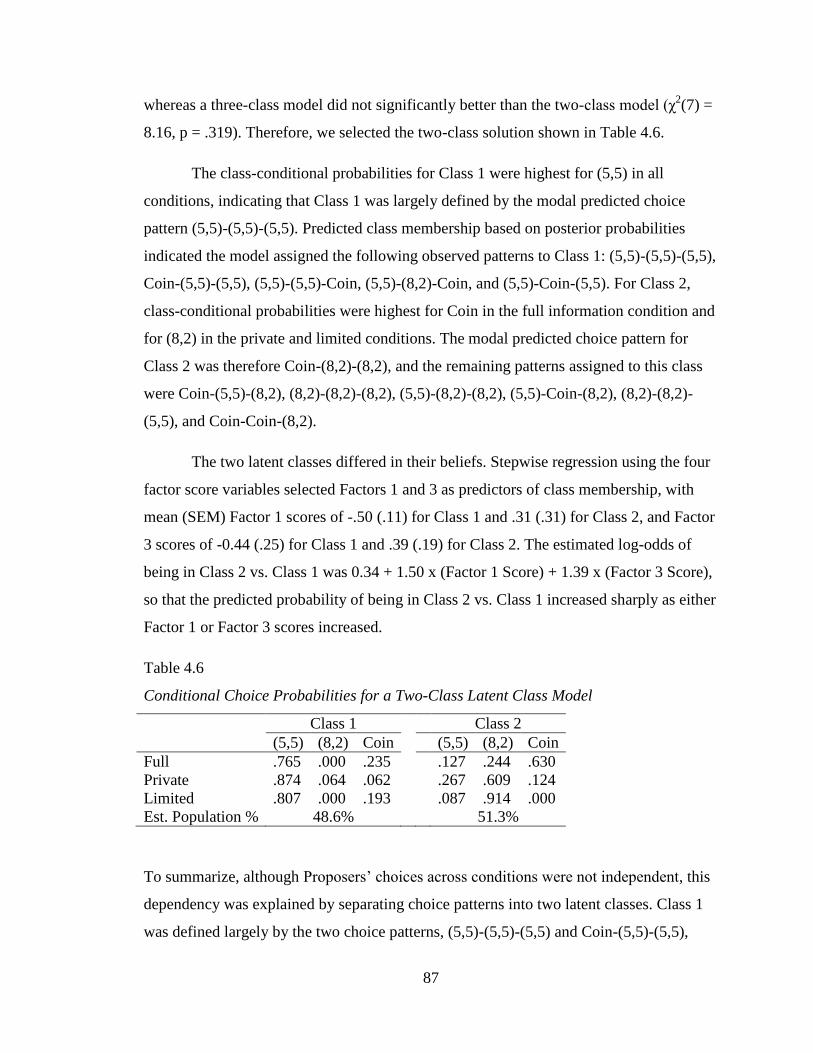
87
whereas a three-class model did not significantly better than the two-class model (χ2(7) =
8.16, p = .319). Therefore, we selected the two-class solution shown in Table 4.6.
The class-conditional probabilities for Class 1 were highest for (5,5) in all
conditions, indicating that Class 1 was largely defined by the modal predicted choice
pattern (5,5)-(5,5)-(5,5). Predicted class membership based on posterior probabilities
indicated the model assigned the following observed patterns to Class 1: (5,5)-(5,5)-(5,5),
Coin-(5,5)-(5,5), (5,5)-(5,5)-Coin, (5,5)-(8,2)-Coin, and (5,5)-Coin-(5,5). For Class 2,
class-conditional probabilities were highest for Coin in the full information condition and
for (8,2) in the private and limited conditions. The modal predicted choice pattern for
Class 2 was therefore Coin-(8,2)-(8,2), and the remaining patterns assigned to this class
were Coin-(5,5)-(8,2), (8,2)-(8,2)-(8,2), (5,5)-(8,2)-(8,2), (5,5)-Coin-(8,2), (8,2)-(8,2)-
(5,5), and Coin-Coin-(8,2).
The two latent classes differed in their beliefs. Stepwise regression using the four
factor score variables selected Factors 1 and 3 as predictors of class membership, with
mean (SEM) Factor 1 scores of -.50 (.11) for Class 1 and .31 (.31) for Class 2, and Factor
3 scores of -0.44 (.25) for Class 1 and .39 (.19) for Class 2. The estimated log-odds of
being in Class 2 vs. Class 1 was 0.34 + 1.50 x (Factor 1 Score) + 1.39 x (Factor 3 Score),
so that the predicted probability of being in Class 2 vs. Class 1 increased sharply as either
Factor 1 or Factor 3 scores increased.
Table 4.6
Conditional Choice Probabilities for a Two-Class Latent Class Model
Class 1 Class 2
(5,5) (8,2) Coin (5,5) (8,2) Coin
Full .765 .000 .235 .127 .244 .630
Private .874 .064 .062 .267 .609 .124
Limited .807 .000 .193 .087 .914 .000
Est. Population % 48.6% 51.3%
To summarize, although Proposers‟ choices across conditions were not independent, this
dependency was explained by separating choice patterns into two latent classes. Class 1
was defined largely by the two choice patterns, (5,5)-(5,5)-(5,5) and Coin-(5,5)-(5,5),

88
which made up 12 of the 16 patterns classified as Class 1. Class 2 was defined largely by
the three choice patterns, Coin-(8,2)-(8,2), Coin-(5,5)-(8,2), and (8,2)-(8,2)-(8,2), which
made up 12 of the 16 patterns classified as Class 2. The odds of being in Class 2 vs. Class
1 became higher as either Factor 1 or Factor 3 increased, indicating that Class 2 could be
characterized by the belief that (8,2) was fair and that others believed the same, and the
belief that (8,2) would be accepted with high enough probability.
Thus, there was a moderate degree of agreement between the purely analytical
and purely data-driven approaches. Both approaches identified a group of individuals
who always chose (5,5), either because they believed it was the only normatively
acceptable choice, or because they assessed the probability of rejection for the other
choices to be unacceptably high. The data-driven approach diverged from the analytical
one in that the former placed most individuals who chose Coin in the full information
condition (norm followers) in the same class as those who chose (8,2) throughout. On the
contrary, the analytical approach would have further separated these two types of
individuals based on their psychological motives, as those who chose (8,2) throughout
were largely insensitive to normative considerations.
Despite the limitations imposed by the small sample size and the fixed ordering of
information conditions, we submit that the data-driven approach is a preliminary but
potentially useful supplement to the usual, analytical approach to analyzing types.
Conclusion
Basic theories of profit maximizing were inadequate in explaining Proposers‟ behavior,
and did not provide an explanation for differences in beliefs or choice frequencies across
information conditions. A theory of social norms predicted, however, that participants
would be focused on different fairness norms when we manipulated their first- and
second-order fairness beliefs and that their behavior would vary accordingly. We
replicated the basic findings of Bicchieri & Chavez (2010) by showing that the frequency
of (8,2) was highest in the limited condition, in which Proposers could take advantage of
the ambiguity of the source of their offer, in which Proposers could take advantage of the
opacity of the source of their offer, and that the frequency of Coin was highest the full
89
condition, in which Proposers could not ignore normative expectations to make a fair
offer. Proposers‟ beliefs varied in informative ways, revealing that the fairness of (8,2)
and Coin and beliefs about whether (8,2) would be accepted were important directions of
variation, and moreover, that they jointly explained choices.
In a secondary analysis, we found that choice patterns across conditions also
followed patterns that were consistent with a theory of social norms, and that individuals
could be separated into two classes: those who chose (5,5) regardless of context and who
believed (8,2) was unfair and unlikely to be accepted, and those who chose Coin or (8,2)
whenever their likelihood of acceptance was high and who believed (8,2) was generally
fair and would be accepted. The existence of such types in our data suggests that fairness
norms can exist as complex entities in which a large proportion of the population might
believe unambiguously that the fairness norm is one of equality, but a sizable proportion
of the population disagrees about the exact rule prescribed by the fairness norm, about
whether the norm exists, and about what behavior constitutes conformity to the fairness
norm.
By measuring Proposers‟ beliefs about the fairness of each option and their beliefs
about whether others considered each option to be fair, we were able to directly assess the
presence and type of norm manipulation. In the full information condition, Proposers
adopted an interpretation of the norm that best suited them by offering Coin. Under one
theory of norm manipulation, Proposers could have considered Coin to be unfair but
believed that Responders considered it to be fair. However, this was not the case;
Proposers both believed it was fair and believed that others considered it fair. Moreover,
Proposers exhibited self-serving biases in their beliefs when compared to Responders.
Thus, in our data, norm manipulation did not operate as an explicit, calculating process in
which individuals assessed whether others viewed each option as normatively acceptable,
and then selected the one that best suited them. Instead, it operated as an implicit process
in which individuals‟ self-serving biases in assessing the normative acceptability of
different options drove behavior, consistent with the interpretations of Knez & Camerer
(1995) of their behavioral data.

90
We also directly demonstrated the presence of norm evasion – the deliberate,
private lack of conformity social norm. Despite their beliefs that (8,2) was unfair and was
considered unfair by others in the limited condition, Proposers chose (8,2). Because
Proposers‟ choices were private, they intentionally ignored normative expectations in
order to evade a norm of fairness with impunity.
Out study builds on the work of Bicchieri & Chavez (2010) by directly measuring
Proposers‟ fairness beliefs, and clarified findings from previous behavioral studies that
hypothesized the existence of a self-serving bias in Ultimatum Game choice but did not
measure beliefs. In the study of Kagel et al. (1996) discussed in the Background, for
example, Proposers made even chip splits (uneven monetary splits) when both Proposers
and Responders knew chip values. But in a separate condition in which only Proposers
knew the chip values, Proposers also offered roughly even chip splits. Based on our
findings, we suggest that Proposers‟ beliefs were very different in these two conditions.
In the first, it is likely that Proposers considered even chip splits to be fair as the result of
a self-serving bias, as the authors infer. In the second, however, Proposers likely suffered
no such self-serving bias, and instead simply believed that they were “getting away” with
unfair behavior due to the informational asymmetry.
To conclude, we directly measured fairness beliefs in bargaining games to
understand norm manipulation and norm evasion. Although norm manipulation and norm
evasion are similar phenomena in their lack of norm conformity, they differ greatly in
their psychological motivations. Norm manipulation is characterized by genuine, self-
serving beliefs, as opposed to deliberate, calculated violations of a norm when multiple
interpretations are available. Norm evasion, on the other hand, is characterized by the
deliberate violation of a norm when information is private.
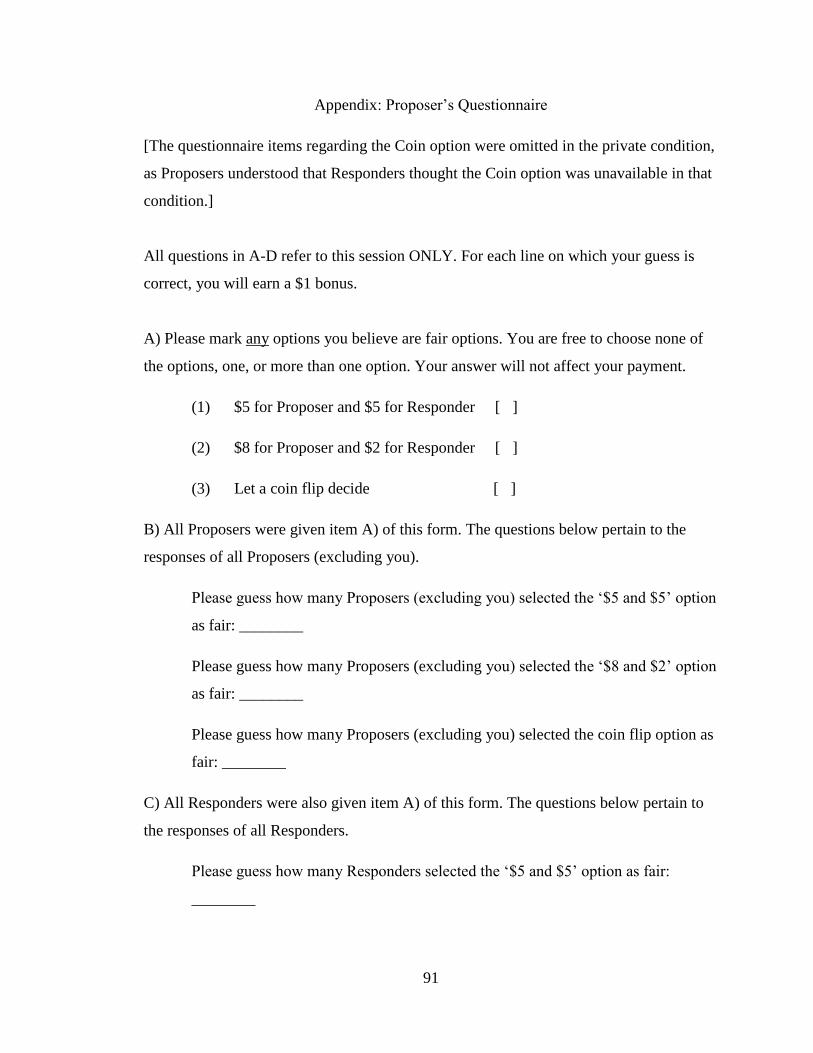
91
Appendix: Proposer‟s Questionnaire
[The questionnaire items regarding the Coin option were omitted in the private condition,
as Proposers understood that Responders thought the Coin option was unavailable in that
condition.]
All questions in A-D refer to this session ONLY. For each line on which your guess is
correct, you will earn a $1 bonus.
A) Please mark any options you believe are fair options. You are free to choose none of
the options, one, or more than one option. Your answer will not affect your payment.
(1) $5 for Proposer and $5 for Responder [ ]
(2) $8 for Proposer and $2 for Responder [ ]
(3) Let a coin flip decide [ ]
B) All Proposers were given item A) of this form. The questions below pertain to the
responses of all Proposers (excluding you).
Please guess how many Proposers (excluding you) selected the „$5 and $5‟ option
as fair: ________
Please guess how many Proposers (excluding you) selected the „$8 and $2‟ option
as fair: ________
Please guess how many Proposers (excluding you) selected the coin flip option as
fair: ________
C) All Responders were also given item A) of this form. The questions below pertain to
the responses of all Responders.
Please guess how many Responders selected the „$5 and $5‟ option as fair:
________

92
Please guess how many Responders selected the „$8 and $2‟ option as fair:
________
Please guess how many Responders selected the coin flip option as fair: ________
D) For each item below which you answer correctly, you will earn a $.5 bonus.
Please indicate whether you think the majority of Responders receiving the proposal, $5
for Proposer and $5 for Responder NOT FROM A COIN FLIP, will accept. (Circle one).
The majority will accept. / The majority will not accept.
Please indicate whether you think the majority of Responders receiving the proposal, $8
for Proposer and $2 for Responder NOT FROM A COIN FLIP, will accept. (Circle one).
The majority will accept. / The majority will not accept.
Please indicate whether you think the majority of Responders receiving the proposal, $5
for Proposer and $5 for Responder FROM A COIN FLIP, in this session will accept.
(Circle one).
The majority will accept. / The majority will not accept.
Please indicate whether you think the majority of Responders receiving the proposal, $8
for Proposer and $2 for Responder FROM A COIN FLIP, in this session will accept.
(Circle one).
The majority will accept. / The majority will not accept.

93
References
Bicchieri, C. (2006). The grammar of society: The nature and dynamics of social norms.
Cambridge: Cambridge University Press.
Bicchieri, C. (2008). The fragility of fairness: An experimental investigation on the
conditional status of pro-social norms. Philosophical Issues, 18(1), 227–246.
Bicchieri, C. & Chavez, A. (2010) Behaving as Expected: Public information and fairness
norms. Journal of Behavioral Decision Making, 23(2), 161-178.
Camerer, C. (2003). Behavioral game theory: Experiments on strategic interaction.
Princeton, NJ: Princeton University Press.
Cattell, R. B. (1966). The scree test for the number of factors. Multivariate Behavioral
Research, 1, 629-637.
Guth, W., Schmittberger, R., & Schwarze, B. (1982). An experimental analysis of
ultimatum bargaining. Journal of Economic Behavior and Organization, 3, 367–
388.
Hoffman, E., McCabe, K. A., Keith, S., & Smith, V. (1994). Preferences, property rights,
and anonymity in bargaining games. Games and Economic Behavior, 7, 346–380.
Horn, J. L. (1965). A rationale and test for the number of factors in factor analysis.
Psychometrika, 30, 179-185.
Kaiser, H. F. (1960). The application of electronic computers to factor analysis.
Educational and Psychological Measurement, 20, 141-151.
Kagel, J. H., Kim, C., & Moser, D. (1996). Fairness in ultimatum games with asymmetric
information and asymmetric payoffs. Games and Economic Behavior, 13(1), 100-
110.
Knez, M. J. & Camerer, C. (1995). Social comparison and outside options in 3-person
ultimatum games. Games and Economic Behavior, 10, 165-194.
Zwick, W. R., & Velicer, W. F. (1986). Factor influencing five rules for determining the
number of components to retain. Psychological Bulletin, 99, 432‑442.
94
Chapter 5
Conclusion
Individuals have a rich psychology that drives their behavior in situations relating to
norms of fairness. Chapters 3 and 4 explored norm conformity as a function of normative
beliefs, and found that different normative contexts could change behavior even when
material consequences were held fixed. Largely responsible for these differences in
behavior were the phenomena of norm manipulation – the selection of an interpretation
of a norm that best suits an individual – and norm evasion, the deliberate, private
violation of a norm. Despite their similarity in that they both led to norm non-conformity,
their psychological mechanisms were starkly different. Norm manipulation involved a
self-serving bias in which individuals felt it was fair to propose unequal monetary
divisions, whereas norm evasion involved no such bias, and individuals knowingly made
unfair offers.
Chapter 1 addressed a different question, namely the willingness of third parties
to incur personal costs to uphold norms of fairness. Third parties preferred to compensate
victims of unfair bargaining outcomes when they had the opportunity to compensate or
sanction, but were willing to punish the perpetrator when sanctioning was the only option
available. Although beliefs about what constituted fair behavior varied based on context,
sanctioning and compensation behavior did not.
Taken together, these findings imply that there might be ample opportunity for
individuals to violate norms of fairness with impunity, as norm transgressions can be
difficult to detect, are prone to self-serving biases, and are not likely to be sanctioned by
third parties in context-sensitive ways. In Chapter 2, a Proposer who offered ($8,$2)
could expect to earn $5.61 after taking into account the adjustments made by third parties
in the punish-only condition, whereas a Proposer who offered ($5,$5) could expect to
earn $5.00. In the punish/reward condition, an offer of ($8,$2) yielded an expected payoff
95
of $7.83, whereas an offer of ($5,$5) had an expected payoff of $7.89. In Chapters 3 and
4, pooling across information conditions, a Proposer who offered ($8,$2) could expect to
earn $5.86 or $5.24 (in Chapters 3 and 4, respectively) after taking into account rejection
rates (19/71 and 10/29, respectively), whereas ($5,$5) was never rejected and therefore
yielded an expected payoff of $5.00. Thus, in our data, Proposers stood to gain slightly
on average by proposing ($8,$2).
That the material cost of violating norms is negligible or non-existent might
explain why violations are routinely observable even for well-established social norms.
When someone stops at a four-way intersection a second after you, but then immediately
speeds into the intersection, did they intentionally violate the norm of waiting one‟s turn
in line? Or did they think they arrived first? Did they violate the norm because they could
do so with little fear of being punished? Such situations are rife with the potential for
norm evasion due to the ambiguity created by anonymity and unaccountability. That
norms such as waiting one‟s turn in line and fairness as equality persist despite the
potential for violations, however, is likely due to the variety of material and social
sanctions that are readily available in the non-laboratory setting.
One potentially important finding regarding norm-governed interactions is that
context affected what uninvolved third-parties considered fair but not their behavior
(Chapter 2). Hoffman, McCabe, Keith, & Smith (1994) found that context affected the
behavior of second-parties – i.e., Responders – in that they were more willing to accept
low offers under a framing of the Ultimatum Game as a market exchange or when the
role of Proposer was earned by quiz performance (see Chapter 1). Why did context affect
the behavior of individuals directly involved in the original game (Proposers and
Responders), but not third parties? Because third parties did punish (and reward) at a cost
to themselves, and punished more for less even offers, it must be the case that they were
sensitive to norm violations even if they were not directly affected by them. One possible
explanation is that third parties were not as emotionally affected by the norm violation as
second parties. Thus, whereas both second and third parties could judge uneven splits as
being unfair in the equality condition and as being fair in the equity condition, only
second parties‟ behavior was affected.

96
Some evidence supporting this interpretation comes from a comparison by Fehr &
Fischbacher (2004) of second- and third-party punishment in a Dictator Game in which
participants who were assigned the role of the Dictator allocated 100 points between the
Dictator and a Receiver (100 points were worth 13.00 CHF, approximately $10.50
according to exchange rate at the time the paper was published). In the second stage of
the experiment, they gave each participant an additional 50 points and then gave each
Receiver the opportunity to deduct from the point total of a Dictator at the rate of 1:3. In
the second party punishment condition, Receivers were paired with the same Dictator
they interacted with in the first stage. In the third party punishment condition, Receivers
were paired with a different Dictator. They found that both second and third parties
punished uneven first stage allocations, but that second parties punished at a higher rate:
For every 10 points the Dictator‟s allocation was below the even allocation of 50 points,
second parties spent 4.5 points to punish, whereas third parties spent 2.1 points. Second
parties punished more likely because they had the opportunity both to sanction a norm
violation and to directly punish someone who harmed them. Because second parties are
likely more emotionally involved during the punishment stage, they are also likely more
sensitive to context when compared to third parties. This could explain the lack of a
difference in third party punishment behavior by context in our data, as well as the
difference in second party punishment behavior (namely rejections) by context in
previous studies such as that of Hoffman et al. (1994).
Despite the fact that third party punishment and sanctioning behavior were
unaffected by equity vs. equality contexts, on the whole, the results of the present studies
were consistent with a theory in which norm-related beliefs enter directly into the utility
function, and were inconsistent with a theory of inequality aversion (Fehr & Schmidt,
1999). Tests of whether third parties attempted to equalize the payoffs of the Proposer
and Responder in Chapter 2, for example, found that although third parties reduced the
inequality levels, they allowed sizable differences to remain. In Chapters 3-4, moreover,
Proposers‟ offer behavior depends strongly on context, and theories that rely only on the
final distribution of payoffs cannot explain our results.

97
Finally, individual differences can play a large role in defining the nature of a
social norm. In Chapter 2, substantial variability existed in whether third parties believed
that splits favoring the Responder were fair and in whether they believed splits favoring
the Proposer were fair. For individuals who scored low on the first variable and high on
the second, uneven proposals such as ($8,$2) were not considered a norm violation even
in the equality condition. Similarly, in Chapter 4, a latent class analysis revealed that
some individuals always chose ($5,$5), regardless of context, and held beliefs that
supported this pattern of behavior. On the other hand, some individuals chose of a mix of
Coin and ($8,$2), depending on the condition, and held beliefs that ($8,$2) was fair and
would be accepted. Thus, fairness norms can exist as complex entities in which a large
proportion of the relevant population might agree unambiguously as to what the norm is
and how it should be followed, but a sizable proportion of the population might disagree
about the exact nature of the norm, whether it exists, and what it requires in terms of
conformity.

98
References
Fehr, E. & Fischbacher, U. (2004). Third-party punishment and social norms. Evolution
and Behavior, 25, 63-87.
Fehr, E. & Schmidt, K. M. (1999). A theory of fairness, competition and cooperation.
Quarterly Journal of Economics, 114, 817-868.
Hoffman, E., McCabe, K. A., Keith, S., & Smith, V. (1994). Preferences, property rights,
and anonymity in bargaining games. Games and Economic Behavior, 7, 346–380.