normalization of airline profitability not yet widespread ... · normalization of airline...
TRANSCRIPT

Normalization of airline
profitability not yet
widespread or secure
February 2016
Brian Pearce
Chief Economist
International Air Transport Association

Airline investors paid a ‘normal’ return for 1st time
Source: McKinsey, IATA 2 www.iata.org/economics
0.0
2.0
4.0
6.0
8.0
10.0
2000 2002 2004 2006 2008 2010 2012 2014 2016
% o
f in
vest
ed c
apit
al
Return on capital invested in airlines
Cost of capital (WACC)
Return on capital (ROIC)

Yes, these are record profits for the industry
Source: ICAO, IATA 3 www.iata.org/economics
-40
-30
-20
-10
0
10
20
30
40
-10.0
-8.0
-6.0
-4.0
-2.0
0.0
2.0
4.0
6.0
8.0
10.0
2000 2002 2004 2006 2008 2010 2012 2014 2016
US$
bill
ion
% r
even
ues
Global commercial airline profitability
Net post-tax
EBIT margin

But the starting point is extremely low
www.iata.org/economics 4
0 20 40 60 80 100
AirlinesUtilitiesTrucking
Automobiles and componentsTransportation & logistics
ShippingRail
Freight forwardingMaterials
Contract logisticsEnergy
Food and staples retailCapital goods
BusConsumer durables and apparel
Consumer servicesRetailing
Postal/CEPTelecom
Semiconductors and equipmentCommunications and professional services
Tech hardware and equipmentFood, beverage, and tobacco
MediaHealthcare equipment and services
Household and personalPharma, biotech, and life sciences
Software and services
Annual return on invested capital, 2004-2013
Source: McKinsey

Relatively few airlines driving industry profitability
Source: The Airline Analyst, IATA 5 www.iata.org/economics
0
1
2
3
4
5
6
7
8
9
10
-20 -16 -12 -8 -4 0 4 8 12 16 20 24 28 32 36 40
% ROIC 2015 Q1-3
Number of airlines in ROIC band
47 airlines: ROIC>WACC
60% of industry capital
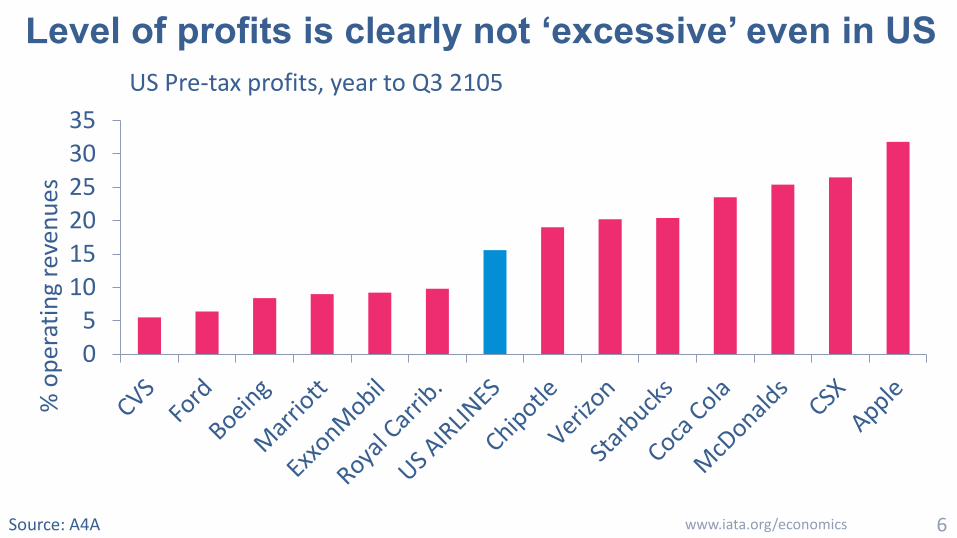
Level of profits is clearly not ‘excessive’ even in US
Source: A4A 6 www.iata.org/economics
0
5
10
15
20
25
30
35
% o
per
atin
g re
ven
ues
US Pre-tax profits, year to Q3 2105

‘Normalization’ is not widespread across regions
Source: ICAO, IATA 7 www.iata.org/economics
-5%
0%
5%
10%
15%
N America Europe Asia Pacific Middle East LatinAmerica
Africa
% r
even
ues
Operating profit margins by region, 2016 vs 2010
2010 2016

Or across business sectors
30
40
50
60
70
80
90
200
300
400
500
600
700
800
1995 2000 2005 2010 2015
Car
go r
even
ues
, US$
bill
ion
Pass
enge
r re
ven
ue,
US$
bill
ion
Airlines revenues from passengers and cargo
Revenue from tickets and ancillaries
Revenue from cargo
Source: ICAO, IATA

Moreover balance sheets take time to strengthen
Source: The Airline Analyst, IATA 9 www.iata.org/economics
0
5
10
15
20
25
30
-50% -40% -30% -20% -10% 0% 10% 20% 30% 40% 50%
Ad
just
ed n
et d
ebt,
US$
bill
ion
Free cash flow as a % of adjusted net debt
2014 free cash flow and adjusted net debt
6 airlines could repay all debt in next 5 years
Median airline$3 billion net debt-3% FCF/net debt

Debt finance markets sceptical
AA+/-
A+/-
BBB+/- ANZ, Qantas, Lufthansa, Ryanair,
Southwest, Alaska, Westjet
BB+/- Delta, American, United, Allegiant,
Spirit, BA, Turkish, LATAM
B+/- Air Canada, Hawaiian, JetBlue, Avianca,
GOL, SAS, Virgin Australia
Investment
grade
Source: S&P, Airfinance Journal

As are equity markets
Source: Datastream 11 www.iata.org/economics
0
2
4
6
8
10
12
14
16
18
20
Legacyairlines
LCCs Trucking Rail Integrators Logistics
2016 f
orw
ard
P/E
rati
o
43%
US transportation sector

The role of low fuel prices is not clear-cut
Source: ICAO, McKinsey, IATA 12 www.iata.org/economics
0
2
4
6
8
10
5
10
15
20
25
30
2000 2002 2004 2006 2008 2010 2012 2014 2016
% r
etu
rn o
n in
vest
ed c
apit
al
US
cen
ts p
er A
TKFuel unit costs and airline return on capital
Airlines return on capital
Fuel unit cost

Airlines are now better utilizing their assets
Source: ICAO, IATA 13 www.iata.org/economics
58
59
60
61
62
63
64
65
66
67
68
2000 2002 2004 2006 2008 2010 2012 2014
% A
TK
s
Breakeven and achieved load factor (LF)
Achieved LF
Breakeven LF

Airlines are improving the productivity of capital
Source: ICAO, McKinsey, IATA 14 www.iata.org/economics
0.0
0.2
0.4
0.6
0.8
1.0
1.2
-6
-4
-2
0
2
4
6
8
10
2000 2002 2004 2006 2008 2010 2012 2014
Ca
pit
al
pro
du
cti
vit
y,
reve
nu
e/i
nve
ste
d c
ap
ita
l, U
S$
Op
era
tin
g m
arg
in, %
reven
ue
Capital productivity
Operating
margin

We still have issues in the supply chain
Source: McKinsey for IATA 15 www.iata.org/economics
0%
5%
10%
15%
20%
25%
30%
% R
OIC
Return on capital across the air transport supply chain
1996-2014 2007-2014

But this is not the main issue for airline earnings
www.iata.org/economics 16
0.8
(2.5) 0.3 0.7 0.4 2.0
TOTAL
(16.7) –
(18.0)
Freight
Forwarders
1.2
Travel
Agents
0-2.0
CRS
GDS
0.5
Airlines
(19.4)
ANSP Airports Catering Ground MRO Lessors
(0.7) - (2.0)
Manufac-
turers
Estimate
Average yearly economic profit, USD billion, 2007-2014
Source: McKinsey for IATA

Consumers have been the major beneficiaries
Source: ICAO, Boeing, OAG, IATA 17 www.iata.org/economics
0.5
1
1.5
2
2.5
3
3.5
-
2,000
4,000
6,000
8,000
10,000
12,000
14,000
16,000
18,000
1994 1996 1998 2000 2002 2004 2006 2008 2010 2012 2014
US$
/RTK
in 2
01
4U
S$
Nu
mb
er o
f u
niq
ue
city
-pai
rs
Unique city-pairs and real transport costs
Unique city pairs
Real cost of air transport

But equity investors have lost their shirts!
Source: McKinsey, IATA 18 www.iata.org/economics
-40
-35
-30
-25
-20
-15
-10
-5
0
5
10
15
1995 1997 1999 2001 2003 2005 2007 2009 2011 2013 2015
US$
bill
ion
Difference between investing in airlines and investing in similar assets elsewhere

This is an opportunity to create resilience
19 www.iata.org/economics
• Progress so far needs to be defended strongly • Normal not excessive airline profits • Narrowly based improvement so far • Investors need to be paid to risk their capital • Balance sheets take longer to repair than P&L • Improvement due to more than low fuel prices • Structural gains in asset utilization and capital productivity • Better asset utilization dependent on network cooperation • Better capital productivity dependent on ancillaries development • FCF opportunity to create more resilient business models and finances • Regulatory environment also key to resilience