normal template 2016 - tceq.texas.gov · web viewthe cleaned gas exits from the top through a...
TRANSCRIPT

Material Handling: Source Types, Controls, Emission Calculations
IntroductionWhen you think of material handling, most people think of dirt or rock on a conveyor such as at a rock crushing plant. However, many industries in Texas handle bulk materials with similar types of sources and controls. Examples of industries, materials, and sources are listed in the following tables. The information in the following tables is not all-inclusive.
Table 1: Construction Examples
Industry Type Industry Materials Sources
ConstructionRock Crusher, Concrete Batch Plant, Hot Mix Asphalt Plant, Lumber Mill
Rock, Aggregate, Sand, Cement, Wood
Hoppers, Conveyors, Stockpiles, Silos, Screens, Loading and Unloading
Figure 1: Rock Crushing Plant

Table 2: Mechanical Examples
Industry Type Industry Materials Sources
MechanicalAlumina Plant, Steel Mill, Aluminum Recycling, Glass Plant
Bauxite, Iron, Aluminum Scrap, Sand, Glass Cullet
Storage Bins, Conveyors, Stockpiles, Loading and Unloading
Figure 2: Glass Cullet Conveyor at a Container Glass Plant

Table 3: Agricultural Examples
Industry Type Industry Materials Sources
AgriculturalGrain Elevator, Cotton Gin, Bulk Fertilizer Handling, Bakery
Grain, Corn, Cotton, Fertilizer, Flour
Conveyors, Silos, Elevators, Loading and Unloading
Figure 3: Grain Elevator
Table 4: Coatings Examples
Industry Type Industry Materials Sources
Coatings
Abrasive Blasting, Paint/Ink/Coating Manufacturing, Chemical Blending, Cabinet Shops
Blast Media, Pigments, Coating Solids, Dry Materials and Powders, Wood Dust
Material Transfer, Spent Media Cleanup, Wood Milling

Figure 4: Abrasive Blast Boot Figure 5: Coating Manufacturing
Table 5: Combustion Examples
Industry Type Industry Materials Sources
CombustionCoal-Fired Power Plant, Cement Plant, Lime Kiln, Carbon Black Plant
Coal, Limestone, Fly Ash, Carbon Black Powder and Pellets, Portland Cement and Additives
Unloading, Conveyors, Stockpiles, Crushers, Ball Mills and Tube Mills, Clinker Coolers, Pneumatic Conveyance of Finished Materials, Silos
Figure 6: Portland Cement Plant Figure 7: Power Plant Coal Handling Conveyors
Table 6: Chemical and Energy Examples
Industry Type Industry Materials Sources
Chemical/Energy Refining, Plastic Resin/ Pellet Manufacturing Petroleum Coke, Plastic
Hoppers, Conveyors, Stockpiles, Loading and Unloading, Pneumatic Conveyors, Mixers and Extruders

Figure 8: Plastic Pellets
Figure 9: Petroleum Coke Handling
Although the materials handled varies by industry type, the sources and controls, and the resulting emissions calculations, are very similar. This document will cover the various sources and equipment used to handle bulk materials, the common controls used to control emissions from these sources, and some example emission calculations for estimating emissions.

Construction Authorizations
Potential Construction AuthorizationsUnder the rules found in Title 30 Texas Administrative Code (30 TAC), Chapter 116, §116.110, any person who plans to construct any new facility that will emit, or to modify any existing facility that emits air contaminants in Texas must obtain an air quality authorization from the Texas Commission on Environmental Quality (TCEQ). The list of potential air quality authorizations are as follows:
De Minimis (30 TAC Chapter 116, §116.119) – Facilities/sources that meet the conditions of 30 TAC §116.119(a) are considered to be de minimis and do not have to obtain any registration or authorization prior to construction. Most material handling operations would require a case-by-case de minimis review since the de minimis list does not contain many material handling operations and the limits in §116.119(a)(3) would be difficult to meet.
Permit by Rules (PBRs) (30 TAC Chapter 106) – Facilities that will not make a significant contribution of air contaminants to the atmosphere if operated or constructed with certain restrictions can be authorized by a PBR. There are 108 individual PBRs that may be claimed. The facility must meet all the established PBR requirements to claim a PBR. Examples of PBRs for material handling sources in the construction type industries can be found in Subchapter E, for powder coating can be found in Subchapter S, for blasting can be found in Subchapter T, and for plastic and resin transfer can be found in Subchapter Q.
Standard Permits (30 TAC Chapter 116, Subchapter F) – Facilities that meet established standard permit criteria may qualify for a standard permit. Examples of standard permits for material handling sources include rock and concrete crushers, concrete batch plants, grain elevators, bulk fertilizer handling, and sawmills. Some standard permits do not require registration but do require recordkeeping to demonstrate compliance.
Construction Permits (30 TAC Chapter 116) – Sources that do not qualify for authorization under one of the above authorization types would be required to obtain a case-by-case construction permit.
Other than a demonstration that specific construction authorization requirements are met, the calculation method is independent of the construction authorization.
Definitions of “Source” and “Facility”A “source” is defined in the Texas Health and Safety Code, also known as the Texas Clean Air Act (TCAA), §382.003(6), as a point of origin of air contaminants, whether privately or publicly owned or operated.
The term “facility” is also defined in §382.003(6) as “a discrete or identifiable structure, device, item, equipment, or enclosure that constitutes or contains a stationary source, including appurtenances other than emission control equipment.” The TCAA goes on to say that “a quarry, mine, well test, or road is not considered to be a facility.” Therefore, a quarry itself does not require air permitting authorization, but facilities commonly found at quarries (such as rock crushers, conveyors, and screens) would require authorization.

Characterization of Particulate Matter and Gas Stream CharacteristicsThe type of conveying system, emission controls, and the estimation of emissions of particulate matter (PM) is dependent on the size of the particle, the nature of the particle and the characteristics of the exhaust stream. The size and size distribution of the particles to be controlled have a large effect on their transport and collection. Large particles are easier to capture and collect while smaller particles are more difficult. This translates into the type of particulate control or control device to be selected and the type of filter media to be used. The two following charts provide size data for a number of common air contaminants.
Source: 'Water Processing: Third Edition', Wes McGowan, Water Quality Association, 2001 Figure 10: Particle Sizes of Well Known Objects

Courtesy Donaldson Torit, Inc.
Figure 11: Particle Sizes of Common Air Contaminants
Particle characteristics such as the following also heavily influence the design of the conveying and control system:
1. Abrasiveness2. Agglomerative (sticky)3. Corrosive 4. Fibrous5. Fire Hazard6. Hygroscopic (retains moisture)7. Toxic8. Explosive
Characteristics such as abrasiveness will influence the type of filter media to be used while sticky materials may preclude the use of reusable media.
Some materials have characteristics that make them difficult to convey in a pneumatic system. Examples are a material with a large particle size and high bulk density, such as gravel or rocks, and an extremely sticky material, such as titanium dioxide, which tends to build a coating on any material-contact surface. In a pneumatic conveying system, such buildup often leads to total pipeline blockage. These difficult materials can be easier to transfer in a mechanical conveying system that’s been carefully chosen to handle them.
A pneumatic conveying system also requires a larger dust collection system than a mechanical conveying system. This is because the pneumatic system has to separate the conveyed material from the conveying air at the system’s end.Mike Weyandt, Corporate Sales Manager for Nol-Tec Systems Inc.

Capture of Emissions In calculating emissions from material handling, capture efficiency must be taken into consideration. If there is less than 100% capture of emissions from a source, the emissions from two sources must be quantified. The first is for the point source (control device in many cases) and the second is for the uncollected (fugitive) emissions. Determining capture of emissions is complex and may be achieved through the use of Environmental Protection Agency (EPA) Test Methods (TM). The TMs are located at:
https://www.epa.gov/emc
and are as follows:
Method 204-Permanent (PTE) or Temporary Total Enclosure (TTE) for Determining Capture Efficiency
Method 204A-Volatile Organic Compounds in Liquid Input Stream
Method 204B-Volatile Organic Compounds in Captured Stream
Method 204C-Volatile Organic Compounds in Captured Stream - Dilution Technique
Method 204D-Fugitive Volatile Organic Compounds from Temporary Total Enclosure (TTE)
Method 204E-Fugitive Volatile Organic Compounds from Building Enclosure
Method 204F-Fugitive Volatile Organic Compounds from Liquid Input Stream - Distillation
The calculations will be less complex and the off-property impacts [National Ambient Air Quality Standards (NAAQS) and individual species] will be much lower if 100% capture of emissions is achieved. Complete capture of emissions begins with a facility design that aims for 100% capture of emissions at the outset. There are two ventilations or capture resources that are commonly used in the design process. The first is EPA TM Method 204.TM 204 is not so much an actual test method as it is a set of design criteria with a qualitative demonstration of capture after the facility is in operation. The second is the use of designs from the American Conference of Governmental and Industrial Hygenists (ACGIH) publication Industrial Ventilation – A Manual of Recommended Practice, which is currently in its 28th edition. The TCEQ Air Permits Division (APD) generally assumes that if the criteria from either of these sources is met, one hundred percent capture of emission is achieved. TM 204 is included in Appendix A of this document, and key excerpts from Industrial Ventilation are included in Appendix B.

Mechanical Conveyance
Definition of Mechanical ConveyanceMechanical conveyance includes the movement of material by mechanical methods such as augers or belt conveyors, rather than pneumatic methods. Mechanical conveyance may be used at several stages in an operation. Examples of mechanical conveying are where material is mechanically conveyed from a hopper to crushers and screens for processing and then to stockpiles. The mechanical conveyance may result in fugitive emissions such as particulate matter emissions or dust. In mechanical conveyance, material transfer points are the usual sources of emissions. A transfer point is where processing equipment transfers material to other processing equipment, such as from conveyor to conveyor. The drop from one conveyor to the next conveyor is a transfer point, which may be open to the atmosphere. Emissions may result from this drop and controls are used to minimize and/or capture those emissions.
Control MethodsTypical control methods for mechanical conveyance sources include the following:
Enclosures – enclosures can be used at all stages of mechanical conveyance. Enclosures can range from windbreaks consisting of fabric walls to fully enclosed buildings. Depending on the amount of enclosure, a typical control efficiency (CE) of 50% to 90%, or even higher, may be applied. The level of control is dependent on the ratio of openings in the enclosure, such as open sides, doors, and windows. For a building operating under negative pressure according to Test Method 204 or ACGIH criteria, one hundred percent control may be applied. Use of high enclosure control efficiencies requires supporting documentation.
Dust collectors – baghouses, cartridge filters, and even cyclones are used to capture and control emissions at transfer points and silos, and some unloading and loading operations. Typical control efficiencies for baghouses and cartridge filters are at least 99%. Cyclones are less efficient and are mostly used as control devices in agricultural facilities. In other facilities, cyclones are used as process equipment to separate materials or as precleaners to reduce the loading on a baghouse.
Water or foam/chemical sprays – water sprays are typically used on transfer points, the inlet and outlet of crushers and screens, and on stockpiles. A control efficiency of 70% may be applied for water sprays depending on the emission factor used. Foam/chemical sprays or surfactants may also be used to minimize emissions. A typical control efficiency for foam/chemicals and surfactants is 85%. For grain elevators, mineral oil may be applied to the grain for a 90% control efficiency.
Material moisture content – the moisture content of the material can have a significant impact on dust emissions. Control efficiencies are dependent on the amount of moisture and can range from 50% for wet material with moisture content as little as 1.5% up to 99% control for saturated material. No emissions are expected for operations operating under submerged conditions.
Choke feeding and drop socks – choke feeding and drop socks are control methods used in agricultural sources. Choke feeding on receiving pits is where the material (grain for example) is allowed to form a cone around the receiving grate. This situation will occur when either the receiving pit or the conveying system serving the pit is undersized in comparison to the rate at which material can be unloaded. In such cases, dust is generated primarily during the initial stage of unloading, prior to establishment of the choked-feed conditions. Choke feeding is expected to reduce emissions by 90%. A drop sock may be used on loading operations to minimize dust. The sock is attached to the end of the loading spout and is allowed to extend below the sides of the truck or railcar being loaded. Dust from ship loading is often minimized by using loading spouts that extend into the storage bays of the ship.
Covers – covers may be used on conveyors to minimize fugitive dust emissions. Control efficiencies for covers are dependent on the design of the cover such as whether the cover fully
encloses the conveyor or is just used to keep rain off the material being conveyed. Enclosed mechanical conveying in grain elevators is expected to result in negligible dust emissions.
Combining Control MethodsControl methods may be combined to obtain higher levels of control. An example could be partial enclosure (85% control efficiency) with water spray (70% control efficiency) on a transfer point. In this case, a higher control efficiency may be applied because the water spray will help to minimize the emissions that escape the partial enclosure. According to the Coal Handling Emissions Evaluation Roundtable (CHEER) Workshop documentation (May 1996), the actual control efficiency would be calculated as follows:
{1 - [(1 - partial enclosure CE) x (1 - water spray CE)]} = {1 - [(1-0.85) x (1-0.70)]} = 95.5%
StockpilesStockpiles are sources of emissions and are categorized as either active or inactive. An active stockpile is a stockpile that has at least eight hours of activity per 24-hour period. Emissions from active stockpiles include loading and unloading of the stockpiles, truck traffic around the stockpiles, and wind erosion. Emissions from inactive stockpiles are assumed to only come from wind erosion. Water sprays and water trucks, depending on the size of the stockpile, are the typical methods of control. These control methods are expected to result in a reduction of 70% in dust emissions. Some stockpiles are small enough such that the dust can be minimized by the use of enclosures. The control efficiency applied to the emissions will depend on the amount of enclosure. Examples of enclosures include 3-sided windbreaks and enclosing the stockpile inside a building.
Best Available Control TechnologyAll new and modified sources require the use of best available control technology (BACT) [see 30 TAC §116.111(a)(2(C)], and this can be established through the use of the TCEQ Three Tier approach that is covered in detail in the APD Guidance Document 6110: Air Pollution Control - How to Conduct a Pollution Control Evaluation.
Tier I BACT is based on the level of control found in recently issued permits. The TCEQ BACT Tables largely represent Tier I of the control technology analysis. Examples (not an all-inclusive list) of typical Tier I BACT for mechanical conveyance sources are as follows:

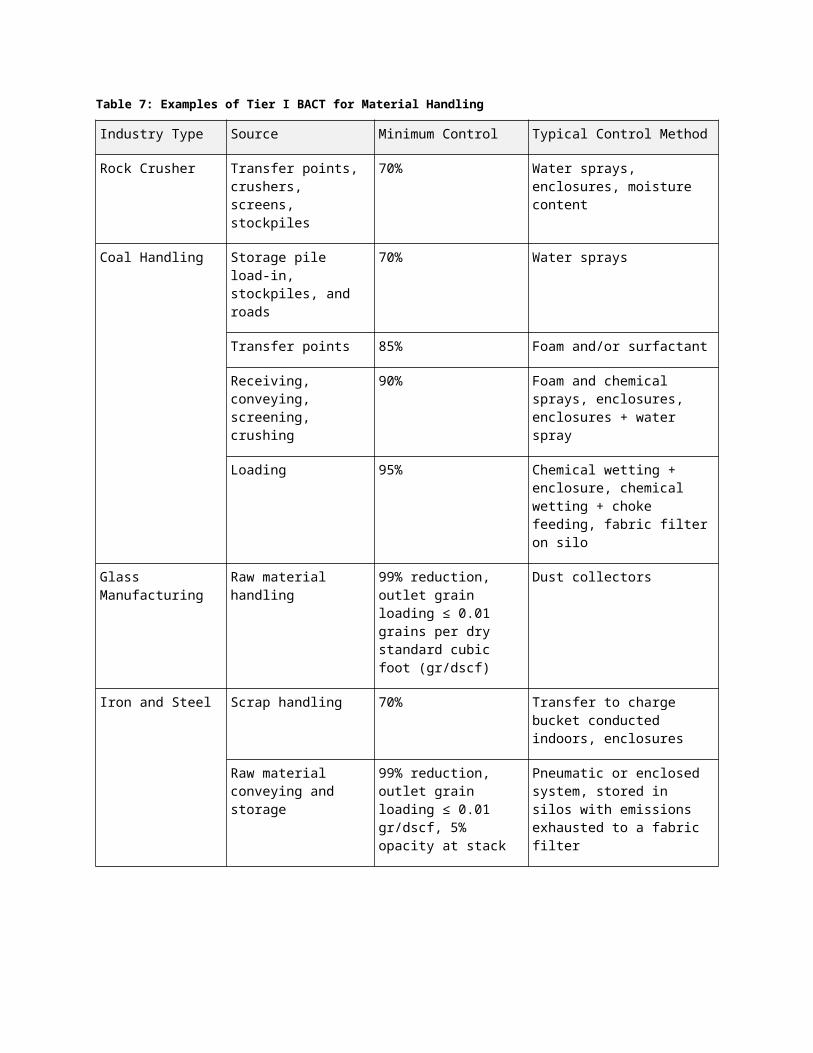
Table 7: Examples of Tier I BACT for Material Handling
Industry Type Source Minimum Control Typical Control Method
Rock Crusher Transfer points, crushers, screens, stockpiles
70% Water sprays, enclosures, moisture content
Coal Handling Storage pile load-in, stockpiles, and roads
70% Water sprays
Transfer points 85% Foam and/or surfactant
Receiving, conveying, screening, crushing
90% Foam and chemical sprays, enclosures, enclosures + water spray
Loading 95% Chemical wetting + enclosure, chemical wetting + choke feeding, fabric filter on silo
Glass Manufacturing Raw material handling 99% reduction, outlet grain loading ≤ 0.01 grains per dry standard cubic foot (gr/dscf)
Dust collectors
Iron and Steel Scrap handling 70% Transfer to charge bucket conducted indoors, enclosures
Raw material conveying and storage
99% reduction, outlet grain loading ≤ 0.01 gr/dscf, 5% opacity at stack
Pneumatic or enclosed system, stored in silos with emissions exhausted to a fabric filter

Mechanical Conveyance Emission CalculationsAP-42 Emission Factors
The emissions from most sources involved in mechanical conveyance can be estimated using emission factors from the EPA’s AP-42: Compilation of Air Emission Factors (Fifth Edition, 1995).
Emission factors are grouped by source and industry types. For example, emission factors for rock crushers can be found in Chapter 11.19.2 – Crushed Stone Processing and Pulverized Mineral Processing. The emission factors are estimations of emissions based on sampling of emissions from sources under given operating conditions. The estimates are based on an operational parameter such as throughput [pound per ton (lb/ton)] or firing rate [pound per million standard cubic foot (lb/MMscf)].
Note regarding crushed stone emission factors : If an emission factor is labeled as “controlled,” the emission factors already include a reduction from a water spray or material moisture content greater than 1.5% (wet material). Therefore, do not use a wet material or water spray control factor with a “controlled” emission factor. This will result in underestimating emissions. However, if a water spray is being used on pre-washed materials, for example, then the controlled emission factors may be used along with an additional 95% control for the washed materials.
Conveyor Transfer Point ExampleThe following example is for calculating emissions from a conveyor transfer point at a rock crushing plant. In particular, this transfer point is where washed material is transferred to a stacker, similar to what is shown in the figure below.
Figure 12: Conveyor Transfer Point
Given:
Hourly Throughput: 400 tons per hour
Annual Throughput: 1,600,000 tons per year
Materials: moisture content >1.5% and washed
Since the material has a moisture content greater than 1.5%, the controlled emission factors will be used. From Table 11.19.2-2 for “Conveyor Transfer Point (controlled)”, the emission factor for Total PM is 0.00014 lb PM/ton. A control efficiency of 95% is used for the washed material.

PM short-term emission rate:
0.00014 lb PM 400 ton 1-0.95 = <0.01 lbton hr hr
PM long-term emission rate:
0.00014 lb PM 1,600,000 ton ton 1-0.95 = <0.01 tonton yr 2,000 lb yr
The short and long-term emission rates for particulate matter equal to or less than ten microns in diameter (PM10) and particulate matter equal to or less than 2.5 microns in diameter (PM2.5) are calculated the same way but with the emission factors from Table 11.19.2-2 of 0.000046 lb/ton and 0.000013 lb/ton, respectively. Note that some of the sources in Table 11.19.2-2 do not have emission factors for PM2.5. In such cases, emissions can be estimated as 15% of PM10 according to the ratio of particle size multipliers in AP-42 Chapter 13.2.4.
Typically, a plant will have multiple conveyor transfer points. Estimated emissions from each transfer point must be calculated. For simplicity in the permit application, emissions from all conveyor transfer points may be summed together and listed as a group emission point number (EPN) such as “MHFUG.”
Grain Elevator Receiving Pit with Baghouse ExampleThe following example is for calculating emissions from a grain elevator receiving pit controlled with a baghouse, as shown in the figure below.
Figure 13: Grain Elevator Receiving Pit Controlled by a Baghouse
The trucks drive into the building that encloses the receiving pit. The building contains the capture system that routes captured PM emissions to the baghouse, located to the left of the receiving building. In this example, we are going to assume that only an estimated 70% capture efficiency is obtained.
Given:
Hourly Throughput: 750 tons per hour
Annual Throughput: 1,800,000 tons per year
Fugitive Control Method: choke feeding
Baghouse Capture Efficiency: 70%
Truck Type: hopper bottom
Baghouse Flow Rate: 15,000 actual cubic feet per minute (ACFM or ft3/min)
Baghouse Outlet Grain Loading: 0.001 grains per dry standard cubic foot (gr/dscf or gr/dsft3)
Operating Hours: 2,400 hours per year (seasonal)
The fugitive emissions and the baghouse stack emissions would be listed with separate EPNs in the permit. The fugitive emissions will be calculated first. These are the emissions that are not captured by the capture system for the baghouse. From Table 9.9.1-1, the emission factor Total PM for grain receiving with a hopper bottom truck is 0.035 lb PM/ton. A control efficiency of 90% is used for choke feeding.
PM short-term emission rate:
0.035 lb PM 750 ton 1-0.90 1-0.70 = 0.79 lbton hr hr
PM long-term emission rate:
0.035 lb PM 1,800,000 ton ton 1-0.90 1-0.70 = 0.95 tonton yr 2,000 lb yr
The short and long-term emission rates for PM10 and PM2.5 are calculated the same way but with the emission factors from Table 9.9.1-1 of 0.0078 lb/ton and 0.0013 lb/ton, respectively.
The emissions from the baghouse stack would now be calculated. These are the captured emissions from the receiving pit, which are then controlled by the baghouse. The emissions are calculated using one of the methods discussed later in this document. The baghouse data is submitted on TCEQ Table 11 (Form - 10179).
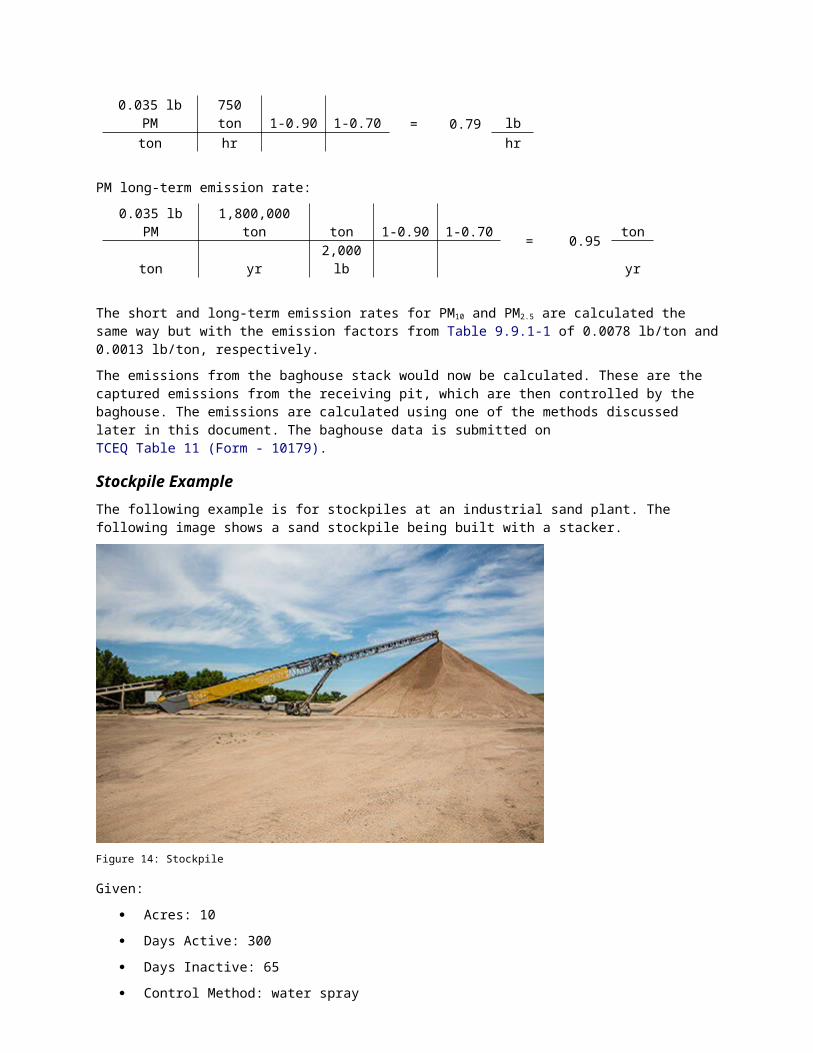
Stockpile ExampleThe following example is for stockpiles at an industrial sand plant. The following image shows a sand stockpile being built with a stacker.
Figure 14: Stockpile
Given:
Acres: 10
Days Active: 300
Days Inactive: 65
Control Method: water spray

Emission factors for estimating stockpile emissions are from the EPA’s Development of Emission Factors for Fugitive Dust Sources (June 1974). The emission factors for stockpiles are 13.2 lb PM/acre-day for active stockpiles and 3.5 lb PM/acre-day for inactive stockpiles. As explained previously, an active stockpile is a stockpile that has at least 8 hours of activity per 24 hour period. Only long-term emission rates are quantified in the NSR permit for stockpiles. However, short-term emission rates should be calculated for use in the modeling demonstration. A control efficiency of 70% is used for the water spray.
PM long-term emission rate (active):
13.2 lb PM 10 acres 300 days ton 1-0.70 = 5.94 tonacre-day yr 2,000 lb yr
PM long-term emission rate (inactive):
3.5 lb PM 10 acres 65 days ton 1-0.70 = 0.34 tonacre-day yr 2,000 lb yr
PM long-term emission rate (total):
Active + Inactive = 5.94 tpy + 0.34 tpy = 6.28 tpy (tons per year)
The long-term emission rates for PM10 and PM2.5 are calculated using the ratios of the particle size multipliers in AP-2 Chapter 13.2.4. Using the multipliers, PM10 is 50% of PM and PM2.5 is 15% of PM10.
As in the first example above, for simplicity in the permit application, the emissions from all stockpiles may be summed together and listed as one EPN.
Drop Point EquationRather than using the emission factors from AP-42 for the conveyor transfers or material drops, an applicant may use the “Drop Point Equation” from AP-42 Chapter 13.2.4 Aggregate Handling and Storage Piles. The drop point equation uses variables such as particle size multipliers, moisture content, and wind speed to derive emission factors in either lb/ton (English) or kg/megagram (Metric). The drop point equation in lb/ton is as follows (Equation 1 from AP-42 Chapter 13.2.4):
E=k (0.0032 )(U5
)1.3
(M2
)1.4
where:
E = emission factor
k = particle size multiplier (dimensionless)
U = mean wind speed [miles per hour (mph)]
M = material moisture content (%)
The drop point equation is only valid for certain ranges of variables such as moisture content between 0.25 and 4.8 percent and wind speeds between 1.3 and 15 mph. The silt content of the material must also be between 0.44 and 19 percent. Silt particles are between 0.002 millimeters (mm) (2.0 microns) and 0.05 mm (50 microns) in diameter. Table 13.2.4-1 in AP-42 Chapter 13.2.4 lists typical silt and moisture contents of materials at various industries. The source of the wind speed used in the calculation should be provided with your calculations.
Conveyor Transfer Point Example Using the Drop Point EquationThe following example is for calculating emissions from a coal conveyor transfer point at a power plant.

Given:
Hourly Throughput: 1,000 tons per hour
Annual Throughput: 5,000,000 tons per year
Material: coal
Control Method: foam spray
Location: Austin
The image below is of a foam dust suppression system used on coal handling.
Figure 15: Foam Dust Suppression
According to the Table 13.2.4-1 in AP-42 Chapter 13.2.4, the silt content of coal varies from 0.6% – 4.8%, which is within the valid range for using the drop point equation. The average wind speed in Austin was obtained from the TCEQ Calculation Guidance for Rock Crushers. The minimum moisture content for the materials from Table 13.2.4-1 in AP-42 Chapter 13.2.4 can be used as a worst case, unless supporting data is provided on the actual moisture content of the materials.
To calculate Total PM, first calculate the emission factor (E) using the following values:
k = 0.74 [aerodynamic particle size multiplier for < 30 micrometers (µm)]
U = 9.2 mph
M = 2.7% (minimum from Table 13.2.4-1 in AP-42 Chapter 13.2.4 for coal)
Plug these values into the drop point equation above to obtain the emission factor (E) = 0.0034 lb PM/ton. Then using the same calculation methodology as in the conveyor transfer point example above, calculate the short and long-term emission rates for total PM. Use an 85% control efficiency for the foam spray.
PM short-term emission rate:
0.0034 lb PM 1,000 ton 1-0.85 = 0.51 lbton hr hr
PM long-term emission rate:
0.0034 lb PM 5,000,000 ton ton 1-0.85 = 1.28 tonton yr 2,000 lb yr
The short and long-term emission rates for PM10 and PM2.5 are calculated the same way but use the particle size multipliers (k) in the drop point equation for PM10 and PM2.5 from AP-2 Chapter 13.2.4. The k-value for PM10 is 0.35 and the k-value for PM2.5 is 0.053.

Pneumatic ConveyancePneumatic Conveyance DefinitionA pneumatic conveying system transfers powders, granules, and other dry bulk materials through an enclosed pipe or duct. The motive force for this transfer comes from a combination of pressure differential and the flow of a gas, such as air or nitrogen. The system’s basic elements include a motive air source, such as a fan or blower, a feeder or similar material-introduction device, a conveying line, a termination vessel (such as an air-material receiver), and a dust collection system.
While some of the most common materials transferred by pneumatic conveying systems are flour, cement, sand, and plastic pellets, any of hundreds of chemicals, food products, and minerals can be pneumatically conveyed. These materials are usually fairly dry; materials in slurry or paste form typically are not suited to pneumatic conveying.
In a pneumatic conveying system, the air pressure in the conveying line is changed by the system’s air mover, which generates pressure or vacuum. Where the air mover is located in the system determines whether it generates one or the other: When located at the system’s start, the air mover pushes air through the system and the system operates under pressure. When located at the system’s end, the air mover pulls air through the system and the system runs under vacuum. By controlling the pressure or vacuum and airflow inside the system, the system can successfully transfer materials.
A pneumatic conveying system also requires a larger dust collection system than a mechanical conveying system. This is because the pneumatic system has to separate the conveyed material from the conveying air at the system’s end.Mike Weyandt, Corporate Sales Manager for Nol-Tec Systems Inc.
Figure 16: Pneumatic Material Conveying System
Pneumatic Conveyance Control MethodsThree types of control devices are commonly used to control PM emissions:
Baghouse;
Cartridge Filter; and
Static filter.
Cyclones are sometimes included in a pneumatic conveyance system, but they are considered to be a piece of process equipment rather than pollution control equipment in many cases. Cyclones by themselves are generally not adequate to meet BACT requirements, but they serve an important purpose. Their low capital cost and nearly maintenance-free operation make them ideal as precleaners for other control devices such as baghouses, cartridge filters, or electrostatic precipitators. Cyclones often serve as process equipment where they are used to separate products such as pellets from the process stream or serve as a recovery device for product recycling.Air Pollution Control – A Design Approach, 4th Edition, Cooper and Alley
CyclonesA cyclone is a mechanical separator using centrifugal force to remove large particles and high-volumes of dust or serve as a product recovery device.A particulate laden gas enters tangentially near the top of the cyclone, and the gas is forced into a downward spiral because of the cyclone’s shape and tangential entry. Centrifugal force and inertia cause the particles to move outward and collide with the outer wall and then slide downward to the bottom of the device. Near the bottom of the cyclone, the gas reverses its downward spiral and moves upwards in a smaller inner spiral. The cleaned gas exits from the top through a “vortex finder” tube, and the collected particles exit the bottom of the cyclone through a flapper or rotary valve into a collection bin.Air Pollution Control – A Design Approach, 4th Edition, Cooper and Alley
Courtesy Donaldson Torit, Inc.
Figure 17: Cyclone Construction and Terminology
BaghousesIn fabric filtration, the dusty gas flows through a number of filter bags placed in parallel leaving the dust retained by the fabric. The fabric itself does some of the filtering of the particles. However, the fabric is more important in its role as a support medium for the layer of dust that quickly accumulates on it. The dust layer is responsible for the highly efficient filtering of small particles.
There are many different types of fabric materials, different ways of weaving them in to various sizes of bags, different ways of configuring the bags in a baghouse, and different ways of routing the air through

the bags. Extended operation of a baghouse requires that the dust be periodically cleaned off the cloth surface and removed from the baghouse.Air Pollution Control – A Design Approach, 4th Edition, Cooper and Alley
There are three types of baghouses, and they are classified by the bag cleaning mechanism, which also dictates the direction of air flow through the bags. The three types are as follows:
Mechanical Shaker – air flow inside of the bag to the outside of the bag; Reverse Air - air flow inside of the bag to the outside of the bag; and Pulse Jet - air flow outside of the bag to the inside of the bag.
The purpose of all of the above self-cleaning methods is to remove excessive dust from the bags. The dust particles are then free to fall toward the bottom of the baghouse into a hopper or drum. Dust buildup in a hopper can be removed by either a rotary valve (airlock) or a screw conveyor.
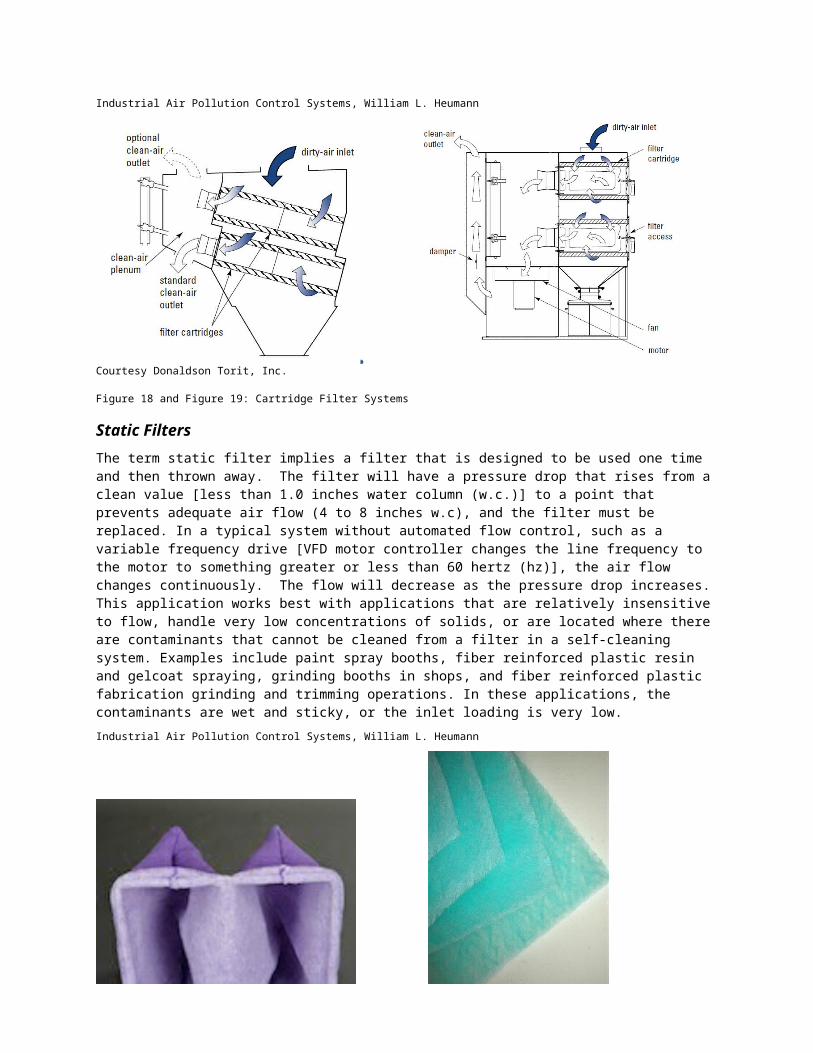
Cartridge FiltersIn a cartridge filter system, the exhaust stream enters through the sides of the cartridges (the bottom is closed), and the clean air is exhausted out the open end of the cartridge. The cartridges consist of pleated filter media attached to end caps with a large central opening in each end. One end butts up against the removable access plate sealing it off while the other end exhausts into the clean air plenum before being exhausted to the atmosphere. The system uses a timer and a series of relays that sequentially energize a series of solenoid valves. The solenoid valves actuate diaphragm valves, which release pulses of compressed air [80 to 120 pounds per square inch gauge (psig)] distributed to a blowpipe that directs the compressed air into the open end of one or more the cartridges. The high velocity air jet introduces additional air into the system, which helps overcome and stop the normal air flow through the filter. The compressed air pulse expands as it traverses the length of the cartridge, inflating it (spreading and flexing the pleats), reversing the air flow through the media, breaking up the dust cake, and allowing it to fall into the hopper. Since individual cartridges or rows of cartridges can be cleaned while the remaining cartridges continue to operate, there is no need to stop process operations. The dust particles are then free to fall toward the bottom of the baghouse into a hopper or drum.Industrial Air Pollution Control Systems, William L. Heumann
Courtesy Donaldson Torit, Inc.
Figure 18 and Figure 19: Cartridge Filter Systems
Static FiltersThe term static filter implies a filter that is designed to be used one time and then thrown away. The filter will have a pressure drop that rises from a clean value [less than 1.0 inches water column (w.c.)] to a point that prevents adequate air flow (4 to 8 inches w.c), and the filter must be replaced. In a typical system without automated flow control, such as a variable frequency drive [VFD motor controller changes the line frequency to the motor to something greater or less than 60 hertz (hz)], the air flow changes continuously. The flow will decrease as the pressure drop increases. This application works best with applications that are relatively insensitive to flow, handle very low concentrations of solids, or are located

where there are contaminants that cannot be cleaned from a filter in a self-cleaning system. Examples include paint spray booths, fiber reinforced plastic resin and gelcoat spraying, grinding booths in shops, and fiber reinforced plastic fabrication grinding and trimming operations. In these applications, the contaminants are wet and sticky, or the inlet loading is very low. Industrial Air Pollution Control Systems, William L. Heumann
Figure 20 and Figure 21: Paint Booth (Static) Filters
Understanding Control Device PerformancePerformance ratings for filter media need to be taken in context of the test method. Filter performance is more than just an efficiency value. The use of the test method results is dependent on the particle size distribution in the air stream to be controlled and in the test method. The two most common test methods were developed by the American Society of Heating, Refrigeration and Air Conditioning Engineers (ASHRAE) that were originally used to evaluate air filters to be used in a Heating, Ventilation, and Air Conditioning (HVAC) system. These test methods were later used to evaluate the performance of industrial filtration systems.
The first test method is ASHRAE Standard 52.1 - 1992. This method consists of dust spot efficiency (not used in emission calculations) arrestance and dust holding capacity, which provides an indicator of filter life. Arrestance is a gravimetric measure of the ability of a tested filter to remove ASHRAE synthetic dust from the test air. The number is expressed as a percentage.
ASHRAE synthetic dust consists of the following: 72% Standardized fine test dust by weight (sometimes referred to as Arizona Road Dust); 23% Molocco Black by weight; 5% #7 Cotton Linters by weight, ground in a Wiley mill with a 4 mm mesh screen.
The arrestance value provides little indication of filter performance under actual operating conditions in an emission control system since the particle size distribution in the test dust and in the emission stream may be very different. It is important to note that ASHRAE no longer supports the standard.
The second test method is ASHRAE Standard 52.2-1999. This method provides efficiencies over twelve different particle size ranges as follows:
Table 8: Particle Size Ranges for ASHRAE 52.2
Range Lower Limit (microns)
Upper Limit (microns)
1 0.30 0.40
2 0.40 0.55

3 0.55 0.70
4 0.70 1.00
5 1.00 1.30
6 1.30 1.60
7 1.60 2.20
8 2.20 3.00
9 3.00 4.00
10 4.00 5.50
11 5.50 7.00
12 7.00 10.00
In this test method, the filter media is challenged five times (to simulate increasing filter loading) with a Potassium Chloride (KCI) aerosol polydispersed for even distribution of challenge through the required particle size ranges, and solid in consistency. The efficiency is determined for each size range, and the results in each of the three size ranges (E1- 0.30 to 1.00, E2 – 1.00 to 3.00 and E3 – 3.00 to 10.00) have the geometric mean (%) determined. The results are then combined to provide a Minimum Efficiency Reporting Value (MERV) in Table 12-1 of ASHRAE 52.2-1999. The table is included in Appendix C. If a MERV is provided for a piece of filter media, Table 12-1 can then be used to determine the particle size specific efficiency to be used in an emission calculation.
Even with the improvements in ASHRAE 52.2 over ASHRAE 52.1, the method is still focused on the performance of the filter media in an HVAC system rather than an industrial dust collector. In order to address this issue, ASHRAE developed ASHRAE 199 – 2016, which specifically evaluates the performance of pulse jet cleaned particulate control devices over a 48-hour period, which simulates actual operating conditions. This test method measures emissions in milligrams per cubic meter (mg/m3), differential pressure average, and cleaning system air consumption. A summary of the test method is included in Appendix D.

Filters in SeriesSome systems will use multi-stage filtration (filters in series) for control of emissions, and this case needs special consideration when it comes to estimating emissions. Consideration needs to be given to the particle size distribution and the efficiency of the filter media at various particle sizes. For example, an efficiency rating based on a test dust with a large fraction of large particles will result in a very high efficiency (ASHRAE 52.1-1992 Arrestance) rating according to the test method but may have a poor efficiency in the smaller size ranges (PM10 and PM2.5) that are of greatest concern from a public health standpoint.
Filter Efficiency is Particle Size Dependent
Golf BallsFilter Efficiency = 100%
MarblesFilter Efficiency = 100%
BBsFilter Efficiency = 100%
Talcum PowderFilter Efficiency = 90%
Figure 19: Comparison of Filter Efficiency by Particle Size
Using the cumulative efficiencies for filter media in series without consideration to the particle sizes or the meaning of the test results will result in an overly conservative reduction in emissions.

Emission Rate Calculation without Consideration for Particle SizeBased on the assumption each filter pad removes more particulate at each stage
Overall Efficiency - Ignores Particle Size - ASHRAE 52.1 90.00% 99.00% 95.00%
Air Flow To Atmosphere
Figure 20: Emission Rate Calculation without Consideration to Particle Size
The correct method is to take into consideration only the filter media with the highest efficiency for each particle size since the performance of any other stage will be lower.
Emission Rate Calculation with Consideration of Particle SizeBased on the amount of PM removed is equal to the highest efficiency stage and the remaining stages provide no additional reduction within a particle size range
Fractional Efficiency - Considers Particle Size - ASHRAE 52.2 90.00% 99.00% 95.00%
Air Flow To Atmosphere
Figure 21: Emission Rate Calculation with Consideration to Particle Size

Best Available Control TechnologyAll new and modified sources require the use of BACT [see (30 TAC §116.111(a)(2(C))], and this can be established through the use of the TCEQ Three-Tier approach that is covered in detail in the APD Guidance Document 6110 - Air Pollution Control - How to Conduct a Pollution Control Evaluation.
Tier I BACT is based on the level of control found in recently issued permits. The TCEQ BACT Tables largely represent Tier I of the control technology analysis. Examples of typical Tier I BACT for pneumatic conveyance sources are as follows:
Table 9: Examples of Tier I BACT for PM for Pneumatic Conveyance
Industry Type Source Minimum Control Typical Control Method
Abrasive Blasting Silo loading and media recycling
An outlet grain loading of less than 0.002 gr/scf or an efficiency of at least 99%
Baghouses or Cartridge Filters
Coating/Ink Manufacturing
Disperser loading An outlet grain loading of less than 0.002 gr/scf or an efficiency of at least 99%
Baghouses or Cartridge Filters
Cabinet Manufacturing
Machining operations An outlet grain loading of less than 0.002 gr/scf or an efficiency of at least 99%
Baghouses or Cartridge Filters
Plastic Pellets Conveying of plastic pellets and additives
An outlet grain loading of less than 0.005 gr/scf or an efficiency of at least 99%
Baghouses or Cartridge Filters

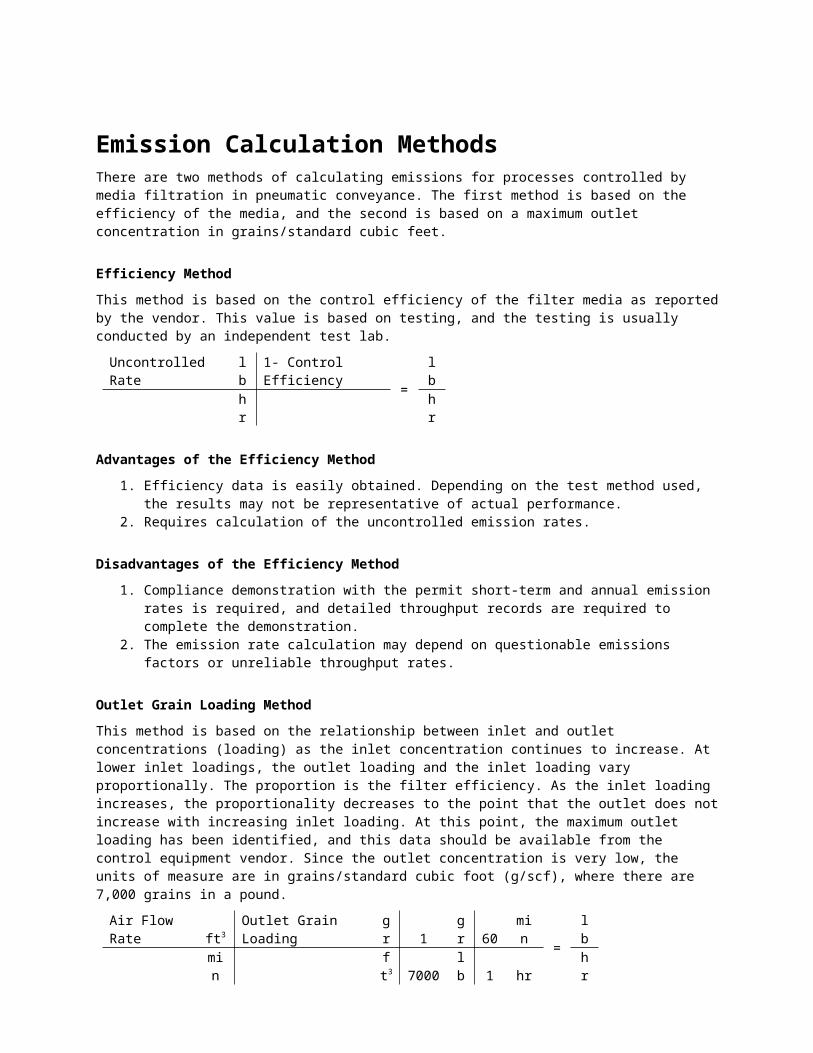
Emission Calculation Methods There are two methods of calculating emissions for processes controlled by media filtration in pneumatic conveyance. The first method is based on the efficiency of the media, and the second is based on a maximum outlet concentration in grains/standard cubic feet.
Efficiency MethodThis method is based on the control efficiency of the filter media as reported by the vendor. This value is based on testing, and the testing is usually conducted by an independent test lab.
Uncontrolled Rate lb 1- Control Efficiency = lbhr hr
Advantages of the Efficiency Method1. Efficiency data is easily obtained. Depending on the test method used, the results may not be
representative of actual performance. 2. Requires calculation of the uncontrolled emission rates.
Disadvantages of the Efficiency Method1. Compliance demonstration with the permit short-term and annual emission rates is required, and
detailed throughput records are required to complete the demonstration. 2. The emission rate calculation may depend on questionable emissions factors or unreliable
throughput rates.
Outlet Grain Loading Method This method is based on the relationship between inlet and outlet concentrations (loading) as the inlet concentration continues to increase. At lower inlet loadings, the outlet loading and the inlet loading vary proportionally. The proportion is the filter efficiency. As the inlet loading increases, the proportionality decreases to the point that the outlet does not increase with increasing inlet loading. At this point, the maximum outlet loading has been identified, and this data should be available from the control equipment vendor. Since the outlet concentration is very low, the units of measure are in grains/standard cubic foot (g/scf), where there are 7,000 grains in a pound.
Air Flow Rate ft3 Outlet Grain Loading gr 1 gr 60 min = lbmin ft3 7000 lb 1 hr hr
Advantages of the Outlet Grain Loading Method1. The emission rate calculation is not dependent on questionable emissions factors or unreliable
throughput rates.2. Compliance demonstration with the permit short-term emission rates is not required since
throughput and emission rates are unrelated. As long as the filter system is operating correctly, and the maximum number of annual operating hours are not exceeded, it is assumed that the emission limits are met.
3. Outlet grain loading is insensitive to inlet particle size distribution - PM=PM10=PM2.5 on outlet.
Disadvantages of the Outlet Grain Loading Method1. The outlet grain loading value is difficult to obtain from some equipment vendors.2. Requires an accurate maximum system air flow rate.
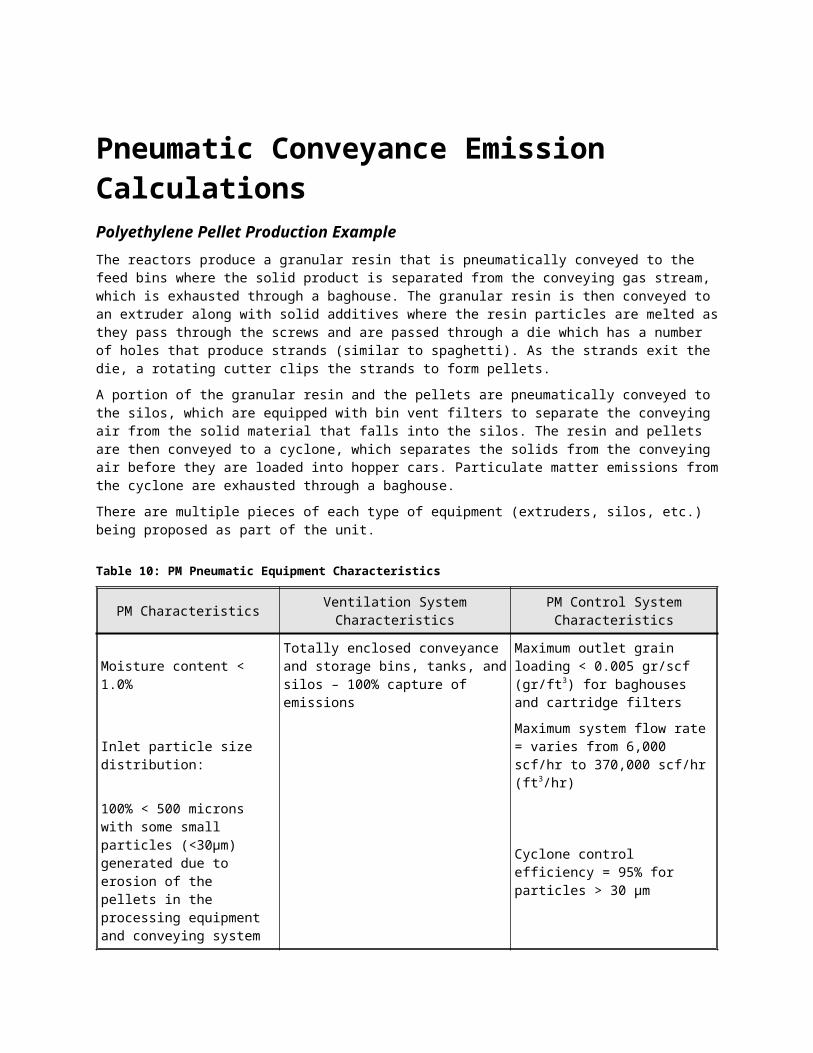
Pneumatic Conveyance Emission Calculations Polyethylene Pellet Production ExampleThe reactors produce a granular resin that is pneumatically conveyed to the feed bins where the solid product is separated from the conveying gas stream, which is exhausted through a baghouse. The granular resin is then conveyed to an extruder along with solid additives where the resin particles are melted as they pass through the screws and are passed through a die which has a number of holes that produce strands (similar to spaghetti). As the strands exit the die, a rotating cutter clips the strands to form pellets.
A portion of the granular resin and the pellets are pneumatically conveyed to the silos, which are equipped with bin vent filters to separate the conveying air from the solid material that falls into the silos. The resin and pellets are then conveyed to a cyclone, which separates the solids from the conveying air before they are loaded into hopper cars. Particulate matter emissions from the cyclone are exhausted through a baghouse.
There are multiple pieces of each type of equipment (extruders, silos, etc.) being proposed as part of the unit.
Table 10: PM Pneumatic Equipment Characteristics
PM Characteristics Ventilation System Characteristics PM Control System Characteristics
Moisture content < 1.0%Totally enclosed conveyance and storage bins, tanks, and silos – 100% capture of emissions
Maximum outlet grain loading < 0.005 gr/scf (gr/ft3) for baghouses and cartridge filters
Inlet particle size distribution:Maximum system flow rate = varies from 6,000 scf/hr to 370,000 scf/hr (ft3/hr)
100% < 500 microns with some small particles (<30µm) generated due to erosion of the pellets in the processing equipment and conveying system
Cyclone control efficiency = 95% for particles > 30 µm
The efficiency method is not applicable since there are no emission factors for this type of operation. Therefore, the outlet grain loading method will be used to estimate emissions for all of the sources since each conveyance system has the same general arrangement and method of operation. The annual operating schedule varies between the process equipment. An individual silo may operate as little as 2000 hr/yr while some of the loading systems may operate as much as 8760 hr/yr. In each case the calculation approach is the same and is as follows:
Short-term emission rate:
370,000 ft3 0.005 gr 1 lb = 0.264 lb
hr ft3 7,000 gr hr
Annual emission rate:

0.264 lb 8,760 hr 1 ton = 1.157 tonhr yr 2,000 lb yr
Since the filter media with a low outlet grain loading will have a very high control efficiency across all particle sizes, it may be assumed that PM = PM10 = PM2.5.
Abrasive Blast Media Transfer Example - ShipyardThe shipyard operations include mechanical repair of the ships, abrasive blasting of the hull, deck, and superstructure prior to painting. The abrasive blast media is delivered in bulk to the site and is pneumatically conveyed from the truck to the media storage silo, which is equipped with a bin vent filter. The blast pots that hold the media for blasting at the work area are gravity filled from the bottom of the silo. As such, both pneumatic conveying and mechanical conveying are present at the site.
Table 11: Silo PM Pneumatic Equipment Characteristics
PM Characteristics Ventilation System Characteristics PM Control System Characteristics
Moisture content < 1.0% Totally enclosed silo with bin vent filter
Maximum outlet grain loading < 0.002 gr/scf (gr/ft3)
Inlet particle size distribution: Truck blower flow rate = 500 scfm (ft3/hr)
2 mm to 2.0 microns
Calculate short-term and annual emissions for the silo filling with an annual operating schedule of 150 hr/yr since the silo is filled about every other day and filling takes approximately one hour. The efficiency method is not applicable since there are no emission factors for this type of operation. Therefore, the outlet grain loading method will be used to estimate emissions.
Short-term emission rate:
500 ft3 0.002 gr 1 lb 60 min = 0.0086 lb
min ft3 7,000 gr hr hr
Annual emission rate:
0.0086 lb 150 hr 1 ton = 0.0006 tonhr yr 2,000 lb yr
Since the filter media with a low outlet grain loading will have a very high control efficiency across all particle sizes, it may be assumed that PM = PM10 = PM2.5.
Table 12: Blast Pot Filling PM Pneumatic Equipment Characteristics
PM Characteristics Ventilation System Characteristics PM Control System Characteristics
Moisture content < 1.0% No ventilation system Drop Sock – 85% Control
Inlet particle size distribution:
2 mm to 2.0 microns

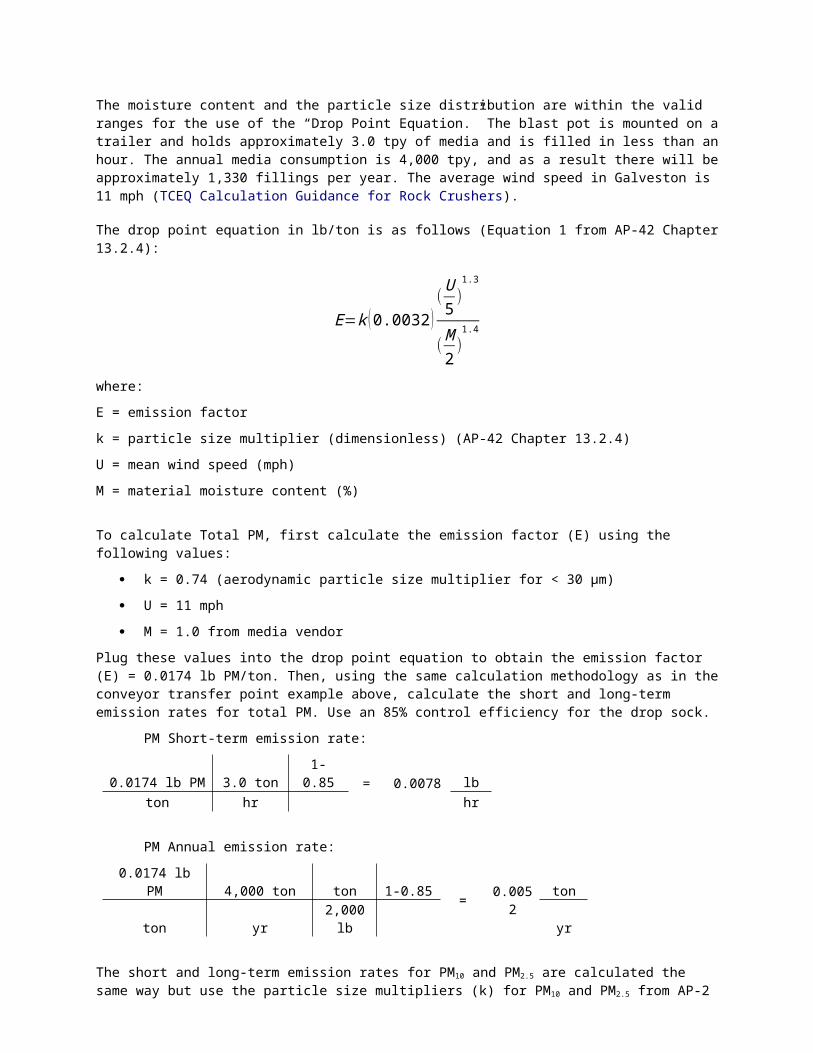
The moisture content and the particle size distribution are within the valid ranges for the use of the “Drop Point Equation.” The blast pot is mounted on a trailer and holds approximately 3.0 tpy of media and is filled in less than an hour. The annual media consumption is 4,000 tpy, and as a result there will be approximately 1,330 fillings per year. The average wind speed in Galveston is 11 mph (TCEQ Calculation Guidance for Rock Crushers).
The drop point equation in lb/ton is as follows (Equation 1 from AP-42 Chapter 13.2.4):
E=k (0.0032 )(U5
)1.3
(M2
)1.4
where:
E = emission factor
k = particle size multiplier (dimensionless) (AP-42 Chapter 13.2.4)
U = mean wind speed (mph)
M = material moisture content (%)
To calculate Total PM, first calculate the emission factor (E) using the following values:
k = 0.74 (aerodynamic particle size multiplier for < 30 µm)
U = 11 mph
M = 1.0 from media vendor
Plug these values into the drop point equation to obtain the emission factor (E) = 0.0174 lb PM/ton. Then, using the same calculation methodology as in the conveyor transfer point example above, calculate the short and long-term emission rates for total PM. Use an 85% control efficiency for the drop sock.
PM Short-term emission rate:
0.0174 lb PM 3.0 ton 1-0.85 = 0.0078 lbton hr hr
PM Annual emission rate:
0.0174 lb PM 4,000 ton ton 1-0.85 = 0.0052
tonton yr 2,000 lb yr
The short and long-term emission rates for PM10 and PM2.5 are calculated the same way but use the particle size multipliers (k) for PM10 and PM2.5 from AP-2 Chapter 13.2.4. The k value for PM10 is 0.35, and the k value for PM2.5 is 0.053.
PM10 short-term emission rate:
0.0174 lb PM 3.0 ton 1-0.85 0.35 = 0.0027 lbton hr hr
PM10 long-term emission rate:
0.0174 lb PM 4,000 ton ton 1-0.85 0.35 = 0.0018 tonton yr 2,000 lb yr

PM2.5 short-term emission rate:
0.0174 lb PM 3.0 ton 1-0.85 0.053 = 0.0004 lbton hr hr
PM2.5 long-term emission rate:
0.0174 lb PM 4,000 ton ton 1-0.850.05
3 = 0.0003
tonton yr 2,000 lb yr
Coating Manufacturing Example A new coating manufacturing facility is to be constructed and the production equipment will consist of 14 disperser tanks, 5 sandmills, and 39 portable mixers and/or let down tanks. All mixers will be equipped with lids that have hatch openings used for material additions in order to minimize release of vapors and particulate matter during filling that are connected to the dust collection system. Portable mixers are moved into position for use of the capture system and are hooked into the system with flexible hoses (an elephant trunk system).
Liquid raw materials are normally added first, and will either be poured manually from small containers or pumped from drums or totes into the mixing tank through the hatch opening, which has a permanent vapor/dust capture hood in place that has a face velocity exceeding 100 ft/min at the material transfer point. Dry powders such as pigments, and pigment extenders such as talc or calcium carbonate, will be added through the use of manually operated equipment. The 50-80 lb bags or super sacks of powders are lifted above the mixing tank with a hoist and lowered into the hatch equipped with a bag breaker, such that the bag of powder is opened after it is lowered into the hatch opening.
Table 13: Coating Manufacturing PM Pneumatic Equipment Characteristics
PM Characteristics Ventilation System Characteristics PM Control System Characteristics
Moisture content < 1.0% Permanent hoods or local exhaust duct using ACGIH design
Maximum outlet grain loading < 0.001 gr/scf (gr/ft3)
Inlet particle size distribution: 100 ft/minute face velocity Filter efficiency > 99.9%
100% < 5 microns Maximum system flow rate = 7,000 scfm (ft3/min)
97% < 2 microns
70% < 1 micron
Calculate short-term and annual emissions for a material transfer rate of 1,100 lb/hr, which is the amount added to each batch. This mixer will produce 200 batches per year.

Three emission calculation methodologies are potentially applicable. The first would be the Drop Point Equation. However, the particle size distribution is outside of the applicable ranges. The second method would be to use the outlet grain loading method and the third would be to use the emission factor of 20 lb PM /ton of material loaded from AP- 42 Section 6.4.
Outlet Grain Loading MethodShort-term emission rate:
7,000 ft3 0.001 gr 1 lb 60 min = 0.06 lb
min ft3 7,000 gr hr hr
Annual emission rate:
0.06 lb 200 batches 1 ton = 0.006 tonbatch yr 2,000 lb yr
Since the filter media with a low outlet grain loading will have a very high control efficiency across all particle sizes and that the majority of the incoming particles are less than 5 microns in diameter, it may be assumed that PM = PM10 = PM2.5.
Efficiency Method
Short-term emission rate:
Annual emission rate:
0.011 lb 200 batches 1 ton = 0.0001 tonbatch yr 2,000 lb yr
Since the majority of the incoming particles are less than 5 microns in diameter, it may be assumed that PM = PM10 = PM2.5. However, it is important to note that the emission rates using the efficiency method are lower than the outlet grain loading method but the rates are based on the AP-42 factor which has a rating of C and as such the outlet grain loading method is preferred.
Kitchen Cabinet Production Example The site receives sheet goods such as veneer plywood, medium density fiberboard, particle board, and rough sawn dimension lumber. The sheet goods are used to produce cabinet sides, bottoms, backs, and drawer box parts. The rough sawn hardwood is used to produce face frames, drawer fronts, and doors.
The sheet goods are pulled from the warehouse and cut to size for the various cabinet parts. The pieces pass to the CNC routers and boring machines where the joints are cut and the holes for shelf pegs and hinges are bored. Rough sawn material is passed through planers to provide a smooth surface and then the pieces are ripped to width. Once the parts are cut to length, face frames are bored for pocket screws to allow for easy assembly. Door and drawer fronts are passed through spindle shapers to create the profile on the edges prior to assembly.
Each of the machines is equipped with a dust collection pickup that provides for 100% capture of emissions from sources such as the planers and something less than 100% pickup on the sanders. Machines such as the planers, which produce high volumes of larger particles, are routed to a cyclone to be used as a precleaner that eventually exhausts to a baghouse. The sanders are routed directly to a baghouse. Makeup air for the wood shop is brought in through doors and vents such that the machine area meets the requirements for a Permanent Total Enclosure (PTE) listed in EPA TM 204. With this ventilation configuration, all of the emissions are ultimately routed to the baghouse.
20.0 lb PM 1100 lb 1-0.999 1 ton= 0.011 lb
ton hr 2000 lb hr

Table 14: Kitchen Cabinet PM Pneumatic Equipment Characteristics
PM Characteristics Ventilation System Characteristics PM Control System Characteristics
Moisture content < 10.0% Permanent hoods and the room serving as a PTE – 100% capture
Maximum outlet grain loading < 0.001 gr/scf (gr/ft3)
Inlet particle size distribution:
100 ft/minute or greater face velocity through all room openings Filter efficiency > 99.99%
100% < 500 microns Maximum system flow rate = 40,000 scfm (ft3/min)
22% < 30 microns Cyclone control efficiency = 95% for particles > 30 µm
15% < 10 micron
Calculate short-term and annual emissions. The shop operates 4,000 hr/yr.
Since all of the emissions are captured and routed to the baghouse due to the ventilation system configuration, the outlet grain loading approach is appropriate.
Short-term emission rate:
40,000 ft3 0.001 gr 1 lb 60 min = 0.34 lb
min ft3 7,000 gr hr hr
Annual emission rate:
0.34 lb 4000 hr 1 ton = 0.68 tonhr yr 2,000 lb yr
Since the filter media with a low outlet grain loading will have a very high control efficiency across all particle sizes, it may be assumed that PM = PM10 = PM2.5. ReferencesIndustrial Air Pollution Control Systems, William L. Heumann, Copyright 1997 by the McGraw - Hill Companies, Inc.Air Pollution Control – A Design Approach, Fourth Edition, C. David Cooper and F. C AlleyCopyright 2011, 2002, 1994,1986 C. David Cooper and F. C Alley
Aircon Corporation, 2873 Chelsea Avenue, Memphis, TN 38108http://www.aircon-corporation.com/
Donaldson Company Inc., Industrial Air FiltrationP.O. Box 1299 1400 West 94th St. Minneapolis, MN 55440https://www.donaldson.com/en-us/industrial-dust-fume-mist/Compilation of Air Pollution Emission Factors – AP-42 5th EditionUnited States Environmental Protection AgencyOffice of Air Quality Planning and StandardsResearch Triangle Park, North Carolina 27711https://www.epa.gov/air-emissions-factors-and-quantification/ap-42-compilation-air-emission-factors
National Air Filtration Association, P.O. Box 68639, Virginia beach, VA 23471http://www.nafahq.org/
Industrial Ventilation – A Manual of Recommended Practice 27th EditionAmerican Conference of Governmental Industrial Hygienists (ACGIH®)1330 Kemper Meadow Drive | Cincinnati, Ohio 45240 http://www.acgih.org/
Nol-Tec Systems Inc, 425 Apollo Drive Lino Lakes, Minnesota 55014 | 651-780-8600http://www.nol-tec.com/http://www.nol-tec.com/answers-to-eight-common-questions.html
IDS Blast, 2717 Tobey Dr.Indianapolis, IN 46219http://www.idsblast.com/
American Society of Heating Air Conditioning and Refrigeration Engineers (ASHRAE)1791 Tullie Circle, N.E. Atlanta, GA 30329 www.ashrae.org
The Camfill Group (Camfill AB)Stockholm, Swedenhttps://www.camfil.com/Global/Documents/Brochure/Standards/ASHRAE52.pdf
Coal Handling Emissions Evaluation Roundtable (CHEER) Workshop, Texas Natural Resource Conservation Commission (TNRCC), May 1996Development of Emission Factors for Fugitive Dust Sources, EPA, June 1974Inman Stone Company, 1121 Hwy 292, Inman, SC 29349www.inmanstone.com
Glass International, 20 Clarendon Road, Redhill, Surrey RH1 1QX, UKwww.glass-international.com

Lockie Farms Grain Elevator, 12799 Concession Rd #4, Zephyr, ON, L0E 1T0www.lockiefarms.com
Coating Canadawww.coating.ca
Duconwww.ducon.com
Ridley Terminals Inc., P.O. Bag 8000, Prince Rupert, BC, Canada V8J 4H3www.rti.ca
Aggregates Manager, 3200 Rice Mine Road NE, Tuscaloosa, AL 35406www.aggman.com
Ericks,1665 North Topping Kansas City, MO 64120www.grain.eriksna.com
Superior Industries, Inc., 315 E Highway 28 Morris, MN 56267www.superior-ind.com
Neo Solutions, 1340 Brighton Road, Beaver, PA 15009www.neosolutionsinc.com
Precast Consulting Services, 2837 Moorings Parkway, Snellville, GA 30039www.precastconsulting.com
IndiaMartwww.indiamart.com
Appendix A – EPA Test Method 204https://www.epa.gov/sites/production/files/2016-06/documents/m-204.pdf
Method 204 - Criteria for and Verification of a Permanent or Temporary Total Enclosure
1. SCOPE AND APPLICATION
This procedure is used to determine whether a permanent or temporary enclosure
meets the criteria for a total enclosure. An existing building may be used as a
temporary or permanent enclosure as long as it meets the appropriate criteria
described in this method.
2. SUMMARY OF METHOD
An enclosure is evaluated against a set of criteria. If the criteria are met and
if all the exhaust gases from the enclosure are ducted to a control device, then the
volatile organic compounds (VOC) capture efficiency (CE) is assumed to be 100 percent,
and CE need not be measured. However, if part of the exhaust gas stream is not ducted
to a control device, CE must be determined.
3. DEFINITIONS
3.1 Natural Draft Opening (NDO). Any permanent opening in the enclosure that
remains open during operation of the facility and is not connected to a duct in which
a fan is installed.
3.2 Permanent Total Enclosure (PE). A permanently installed enclosure that
completely surrounds a source of emissions such that all VOC emissions are captured
and contained for discharge to a control device.
3.3 Temporary Total Enclosure (TTE). A temporarily installed enclosure that
completely surrounds a source of emissions such that all VOC emissions that are not
directed through the control device (i.e. uncaptured) are captured by the enclosure
and contained for discharge through ducts that allow for the accurate measurement of
the uncaptured VOC emissions.
3.4 Building Enclosure (BE). An existing building that is used as a TTE.

4. SAFETY
An evaluation of the proposed building materials and the design for the
enclosure is recommended to minimize any potential hazards.
5. CRITERIA FOR TEMPORARY TOTAL ENCLOSURE
5.1 Any NDO shall be at least four equivalent opening diameters from each VOC
emitting point unless otherwise specified by the Administrator.
5.2 Any exhaust point from the enclosure shall be at least four equivalent duct
or hood diameters from each NDO.
5.3 The total area of all NDO's shall not exceed 5 percent of the surface area
of the enclosure's four walls, floor, and ceiling.
5.4 The average facial velocity (FV) of air through all NDO's shall be at least
3,600 m/hr (200 fpm). The direction of air flow through all NDO's shall be into the
enclosure.
5.5 All access doors and windows whose areas are not included in section 5.3 and
are not included in the calculation in section 5.4 shall be closed during routine
operation of the process.
6 CRITERIA FOR A PERMANENT TOTAL ENCLOSURE
6.1 Same as sections 5.1 and 5.3 through 5.5.
6.2 All VOC emissions must be captured and contained for discharge through a
control device.
7. UALITY CONTROL
7.1 he success of this method lies in designing the TTE to simulate the
conditions that exist without the TTE (i.e., the effect of the TTE on the normal flow
patterns around the affected facility or the amount of uncaptured VOC emissions should
be minimal). The TTE must enclose the application stations, coating reservoirs, and
all areas from the application station to the oven. The oven does not have to be
enclosed if it is under negative pressure. The NDO's of the temporary enclosure and an
exhaust fan must be properly sized and placed.

7.2 Estimate the ventilation rate of the TTE that best simulates the conditions
that exist without the TTE (i.e., the effect of the TTE on the normal flow patterns
around the affected facility or the amount of uncaptured VOC emissions should be
minimal). Figure 204-1 or the following equation may be used as an aid.
Measure the concentration (CG) and flow rate (QG) of the captured gas stream, specify
a safe concentration (CF) for the uncaptured gas stream, estimate the CE, and then use
the plot in Figure 204-1 or Equation 204-1 to determine the volumetric flow rate of
the uncaptured gas stream (QF). An exhaust fan that has a variable flow control is
desirable.
7.3 Monitor the VOC concentration of the captured gas steam in the duct before
the capture device without the TTE. To minimize the effect of temporal variation on
the captured emissions, the baseline measurement should be made over as long a time
period as practical. However, the process conditions must be the same for the
measurement in section 7.5 as they are for this baseline measurement. This may require
short measuring times for this quality control check before and after the construction
of the TTE.
7.4 After the TTE is constructed, monitor the VOC concentration inside the TTE.
This concentration should not continue to increase, and must not exceed the safe level
according to Occupational Safety and Health Administration requirements for
permissible exposure limits. An increase
in VOC concentration indicates poor TTE design.
7.5 Monitor the VOC concentration of the captured gas stream in the duct before
the capture device with the TTE. To limit the effect of the TTE on the process, the
VOC concentration with and without the TTE must be within 10 percent. If the
measurements do not agree, adjust the ventilation rate from the TTE until they agree
within 10 percent.
8. PROCEDURE
8.1 Determine the equivalent diameters of the NDO's and determine the distances
from each VOC emitting point to all NDO's. Determine the equivalent diameter of each
exhaust duct or hood and its distance to all NDO's. Calculate the distances in terms
of equivalent diameters. The number of equivalent diameters shall be at least four.
8.2 Measure the total surface area (AT) of the enclosure and the total area
(AN) of all NDO's in the enclosure. Calculate the NDO to enclosure area ratio (NEAR)
as follows:
The NEAR must be ≤0.05.
8.3 Measure the volumetric flow rate, corrected to standard conditions,
of each gas stream exiting the enclosure through an exhaust duct or hood using EPA
Method 2. In some cases (e.g., when the building is the enclosure), it may be
necessary to measure the volumetric flow rate, corrected to standard conditions, of
each gas stream entering the enclosure through a forced makeup air duct using Method
2. Calculate FV using the following equation:
where:
QO = the sum of the volumetric flow from all gas streams
exiting the enclosure through an exhaust duct or hood.
QI = the sum of the volumetric flow from all gas streams into the enclosure
through a forced makeup air duct; zero, if there is no forced makeup air into the enclosure.
AN = total area of all NDO's in enclosure.

The FV shall be at least 3,600 m/hr (200 fpm). Alternatively, measure the
pressure differential across
the enclosure. A pressure drop of 0.013 mm Hg (0.007 in. H2O) corresponds to an FV of
3,600 m/hr (200 fpm).
8.4 Verify that the direction of air flow through all NDO's is inward. If FV is
less than 9,000 m/hr (500 fpm), the continuous inward flow of air shall be verified
using streamers, smoke tubes, or tracer gases. Monitor the direction of air flow for
at least 1 hour, with checks made no more than 10 minutes apart. If FV is greater
than 9,000 m/hr (500 fpm), the direction of air flow through the NDOs shall be
presumed to be inward at all times without verification.
9. DIAGRAMS


Appendix B – ACGIH Industrial Ventilation Capture Velocities


Appendix C – Comparison Between ASHRAE Test Method 52.1 (1992) and Test Method 52.2 (1999)
Appendix D – ASHRAE Standard 199 SummaryWhy the New Test Standard is ImportantANSI/ASHRAE Standard 199-2016 prescribes the first laboratory test method to measure emissions, differential pressure average, and air consumption in pulse cleaned dust collectors under realistic operating conditions. It is intended to improve on Minimum Efficiency Reporting Values (MERV), a rating system developed for HVAC filters by ASHRAE 52.2 but applied to dust collectors for the last several years in the absence of more relevant test methods.
MERV filter ratings have had these limitations in the dust collection realm:
MERV ratings score the efficiency of a filter under minute, static loads, whereas dust collectors have to handle variable dust loads in high volumes.
MERV ratings pertain only to the filter element, not to the entire pulse-cleaning system.
MERV ratings fail to account for the fact that some dust caking is desirable for better filtration and easier cleaning.
MERV ratings report a percentage of dust capture (e.g. 99% efficiency) but do not quantify actual emissions that escape the system.
MERV ratings favor dense filters, which require more energy to operate and clean and may deliver shorter filter life.
For these reasons, a new dust collection performance standard was overdue.
How the Test Methodology WorksMERV ratings pertain only to filter elements. While the 52.2 standard measured efficiency based on particle size, Standard 199 measures the performance of the entire system, including the air filters and the dust collector. Three major performance factors are measured in the latter stages of 48 hours of pulse cleaning, variable dust loading, and failure and recovery that mimic real-world conditions.
Testing protocol:Conditioning: Starting with a clean set of filters, the tester does an initial dust loading up to the manufacturer’s high differential pressure setting, then initiates the dust collector’s on-demand pulse cleaning system and runs the system for 4 hours. Next, to season the filters, the tester runs the collector for 24 hours, pulse cleaning at 10-second intervals.
Performance Test: Conditioning is followed by a final dust loading and another 24 hours of on-demand cleaning, which mimics how an end-user would normally run the collector. All the performance data is taken from the last four hours of this on-demand cleaning stage, which shows compressed air consumption and average pressure drop across the filters.
Recovery Test: The final step of the test is to move into an upset condition, where the tester turns off the pulse cleaning system and continues to load up the filters to a high pressure drop setpoint of 10 inches water gauge, mimicking a failure in the system. The pulse cleaning is then turned back on to see if the filters can recover to their pre-upset condition.
What Performance Data ANSI/ASHRAE Standard 199 ReportsStandard 199 not only creates a uniform test for dust collectors; it requires a uniform report template as well. Summary data reflect performance factors that truly matter to plant engineers and operators:
Emissions in milligrams per cubic meter (mg/m3) – Particulate matter in the vented emissions is an indication of efficiency, but capture percentage results are just a means to an end. Standard 199 measures absolute emissions performance – how much material passes through the collector during

normal operation, which is more meaningful to plant managers who face regulatory and other reporting requirements.
Differential Pressure Average in Inches of Water Gauge – The energy required to move a given volume flow rate of air through a system with seasoned filters is a significant driver of operational costs – in general, the lower the average differential pressure, the less energy the system consumes. Lower stabilized differential pressure values also generally indicate filters that will last longer.
Air Consumption in cubic feet per thousand cubic feet (ft3/1,000 ft3) – Energy consumption includes fan power to drive air through the filters as well as energy to compress the air for pulse-cleaning. If a system maintains a stable filter pressure drop of 2 inches of water gauge and uses 20 percent less energy than a competitor’s system at that same pressure, it will be a real benefit to operating costs.Andrew Untz, Senior Project Engineer with Donaldson Company, Inc.