Nonstructural Assessment in the Little Apple...US Army Corps of Engineers BUILDING STRONG ® A webinar for the USACE Silver Jackets Program and the Floodplain Management Services Interagency
42
US Army Corps of Engineers BUILDING STRONG ® A webinar for the USACE Silver Jackets Program and the Floodplain Management Services Interagency Projects Nonstructural Assessment in the Little Apple Brian Rast, PE, CFM, PMP Lead Silver Jackets Coordinator, Kansas and Missouri, Institute for Water Resources Randall Behm PE, CFM Chair, National Nonstructural Flood Proofing Committee May 6, 2016
A webinar for the USACE Silver Jackets Program and the Floodplain Management Services Interagency Projects
Nonstructural Assessment in the Little AppleBrian Rast, PE, CFM, PMPLead Silver Jackets Coordinator,Kansas and Missouri, Institute for Water Resources
Randall Behm PE, CFMChair, National Nonstructural Flood Proofing Committee
May 6, 2016
Presenter
Presentation Notes
ABSTRACT: The U.S. Army Corps of Engineers (USACE) assisted Manhattan, KS, the Little Apple with nonstructural and flood proofing measures. The city is enhancing its floodplain management plan by looking beyond the traditional flood risk management measures, like the levee and the dam, to evaluate flood risk adaptive measures. A major element of the FMP includes comprehensive evaluation of flood proofing tools for structures, as well as flood warning, to reduce their flood risk and get closer to resiliency. Key words: Flood risk adaptive measures, flood risk management, floodplain management plan, floodplain management planning, hazard mitigation, Silver Jackets, interagency partnering, public involvement, risk communication, nonstructural measures, flood proofing, National Nonstructural Flood Proofing Committee, flood risk adaptive measures
BUILDING STRONG®
Webinar ObjectivesTools for Nonstructural Assessments
► Structure Attribute Data Table► Nonstructural FRM Matrix► USACE National Nonstructural Flood Proofing
Committee Website
Little Apple Nonstructural Assessment► Study Location and Authority► Study Background► Steps in Conducting the Nonstructural Assessment► Plan Formulation► Study Results► Next Steps
2
BUILDING STRONG®
Develop Hydrology (flow of water) Develop Hydraulics (depth and velocity of water)Conduct Structure Inventory (what gets flooded)
• Structure Attribute Data Table
Identify Potential Nonstructural FRAM Measures• Nonstructural Flood Risk Management Matrix• Field Assessment
Perform Economic Analyses (costs and benefits)• Identify least cost technique• Identify financial assistance (federal / state / private)• Compare mitigation to long-term insurance
Steps for Conducting Nonstructural Assessments
Presenter
Presentation Notes
Planning References: ER 1105-2-100, 22 April 2000, Planning Guidance Notebook EM 1110-2-1419, 31 January 1995, Hydrologic Engineering Requirements for Flood Damage Reduction Studies Civil Works Pocket Preference Guide, IWR, September 1999, in booklet form. Civil Works Programs Brochure, IWR Report 98-R-3, Revised February 2000. EP 1165-2-1, July 1999, Digest of Water Resources Policies and Authorities “Civil Works Environmental Initiatives, Value to the Nation”, January 2000. IWR Report 97-R-15, November 1997, PLANNING PRIMER, IWR. EP 1110-2-10, 31 July 1994, Hydrologic Engineering Analysis Concepts for Cost-Shared Flood Damage Reduction Studies Other Publications: HEC-FDA Flood Damage Reduction Analysis User’s Manual, CPD-72, March 1998 HEC-FIA Flood Impact Analysis User’s Manual, CPD-?, dated ?. Proceedings of a Hydrology & Hydraulics Workshop on Risk-Based Analysis for Flood Damage Reduction Studies, SP-28, 20-22 October 1997
BUILDING STRONG®
Structure Attribute
Data Table
4
Shaded cell information is most important to collect
Data may be available fromexisting databases (Tax Assessor)
BUILDING STRONG®
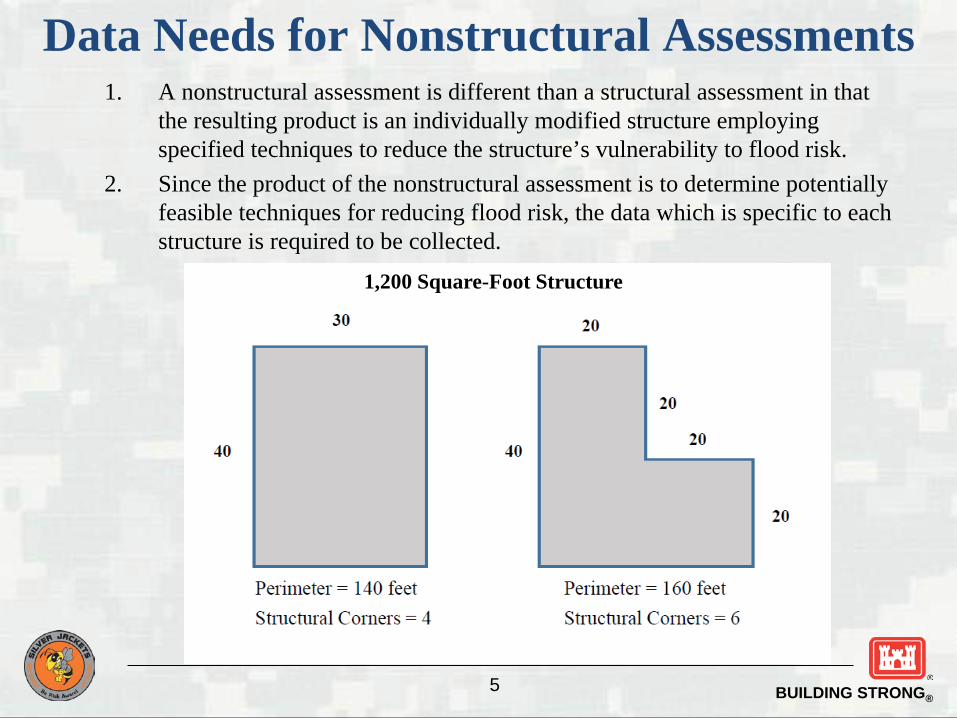
Data Needs for Nonstructural Assessments1. A nonstructural assessment is different than a structural assessment in that
the resulting product is an individually modified structure employing specified techniques to reduce the structure’s vulnerability to flood risk.
2. Since the product of the nonstructural assessment is to determine potentially feasible techniques for reducing flood risk, the data which is specific to each structure is required to be collected.
► Site Characteristics• location (coastal or riverine)• soils (permeable or impermeable)
► Building Characteristics• foundation type• construction type• condition
BUILDING STRONG®
test
7
BUILDING STRONG®
Chartered: 1985
NFPC Members and Advisors• Randall Behm, Chair, Omaha• Kim Gavigan, Secretary, Los Angeles• Steve O’Leary, Huntington• Keven Lovetro, New Orleans • Lea Adams, Davis, CA• Mary Weidel, Detroit• Bob Finch, Hawaii• Brian Rast, Kansas City
web site: http://www.usace.army.mil/Missions/CivilWorks/ProjectPlanning/nfpc.aspx
USACE National Nonstructural Flood Proofing Committee
BUILDING STRONG®
Little Apple Nonstructural Assessment
Project Description Planning and Project Management Analysis Results Next Steps Take-Aways
9
Presenter
Presentation Notes
Thanks Randy… I’m Brian Rast. I was the project manager and senior planner for this project. I’m also the Lead Silver Jackets Coordinator for Kansas. The Kansas Hazard Mitigation Team has done many projects with Silver Jackets, but this was the first one for nonstructural / flood proofing. We proposed the project in October 2014. The project was accepted and began in spring of 2015. The final report on measureable benefits was done by December 2016. Today, I’m going to share a planning product that -present results in a way to quickly compare different measures -displays the feasible measures as applied at each structure -completes any community’s evaluation of the full menu of flood risk management measures
10
Oklahoma flooding, 2015.Photo from Floodlists.com
Severe floods in Texas, 2016.Photo from Houston Chronicle
Winter flood, Missouri, 2016. Photo from Governor’s Office, MO.
Millennium Flood Event, South Carolina, 2015. Photo from Sean Rayford.
Presenter
Presentation Notes
We need tools that can help plan the right solution to flooding. Especially in the last several years. It may be easy to get focused on one structural measure as a solution here. Like a dam, channel, or levee. But… What if you also had access to tools that create the right planning product? You already have these tools available through the National Nonstructural / Flood Proofing Committee and the programs at the Corps of Engineers. The tools Randy mentioned, as well as the NFPC’s nServo, all help to see if flood risk adaptive measures are right for communities near you.
BUILDING STRONG®11
Presenter
Presentation Notes
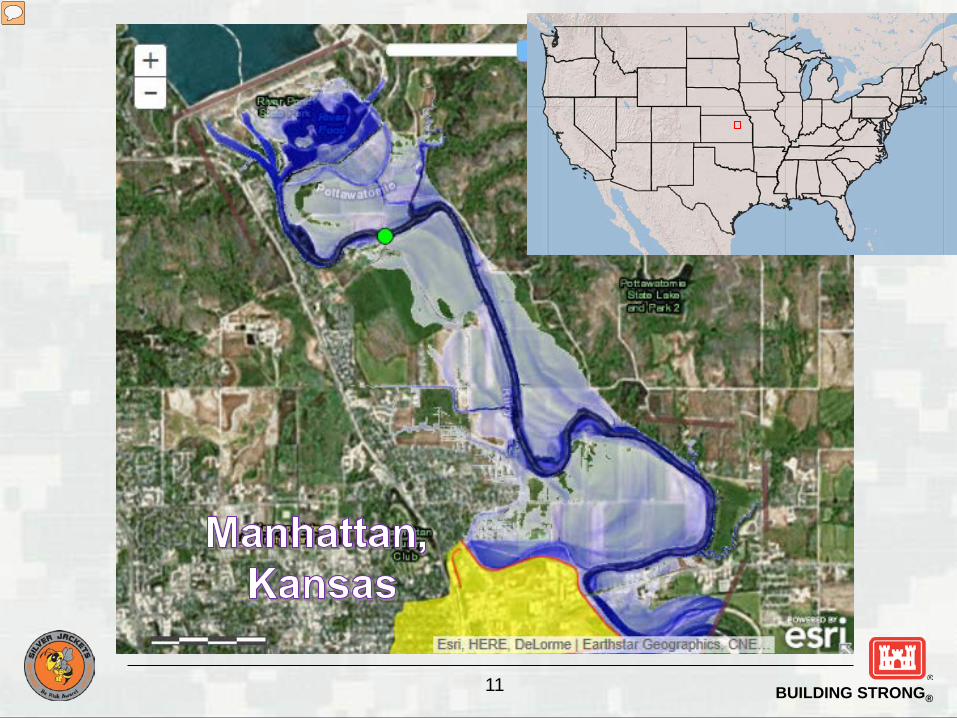
The Little Apple is the nick name for Manhattan, KS. This is a growing town that is home to Kansas State University and many of the soldiers in the Army’s Big Red 1. The Kansas River splits at Manhattan with the Big Blue River. The map here shows the Tuttle Creek Reservoir (upper left) and the Manhattan Levee just down stream (in yellow). Some of the homes I’ll talk about now are between the gage, or the green dot, and the levied area. Previous projects in the area have recently addressed a Flood warning system (part of this inundation map) Floodplain management plans
BUILDING STRONG®
Project DescriptionProject Objectives Evaluate structures needing nonstructural / flood proofing measures Provide plan formulation for a first look at structures at risk Support the state and the city in mitigation grants Address a diversity of issues for a low budget Raise District’s familiarity with conducting a nonstructural
assessment Apply the tools from the USACE Nonstructural / Flood Proofing
Committee
12
Presenter
Presentation Notes
The Project’s Objectives included… *Evaluating structures needing Flood Risk Adaptive Measures -We wanted to evaluate as many FRAM as we could for a $100,000 budget *Providing plan formulation for a first look at structures at risk -We wanted a sizeable sampling approach to fit that budget -We wanted a subset of total structures to guide future planning with the remaining structures -We knew that in the cost estimating, it would have to be a rough, order of magnitude -The plan form had to be quick & efficient to determine structures with benefit-cost ratios over 1.0 -We wanted to document plan form lessons learned for other planners *Supporting the state and the city in the HUD grant *Addressing a diversity of issues for a low budget -Diversity in flood proofing measures that appear to be most effective -Diversity in type of structure getting the analysis -Diverse areas of the city *Applying the tools from the Nonstructural / Flood Proofing Committee New automated matrix spreadsheet Inventory of Structure Data spreadsheet nServo cost estimating tool
BUILDING STRONG®
Project Description
Project Outcomes1. Produced cost engineering estimates. 2. Conducted economic analysis (including a benefit-cost).3. Evaluated four types (eight specific) flood risk adaptive measures
to supplement the city’s floodplain management planning. ► Buyout (with and without Green Space)► Relocation (with and without Green Space)► Elevation (1, 2, and 4-feet above BFE)► Basement Fill
4. Presented results in a way that develops ► property owner buy-in ► Implementation of the flood risk adaptive measures.
13
Presenter
Presentation Notes
The product included both sides of the benefit-cost analysis. Cost estimates for various measures applied to residential and some apartment structures Flood damage calculations for a suite of profiles A total of four types of flood risk adaptive measures were evaluated. Specifically, eight unique measures received benefit-cost ratios, including Buyout (with and without Green Space) Relocation (with and without Green Space) Elevation (1, 2, and 4-feet above BFE) Basement Fill The icing on the cake was the final product: A map of the BC-ratios at each structure in Manhattan. And the map could help create momentum with public engagement.
BUILDING STRONG®
Project Description The project does NOT include
► Costs• A bottom line contingency• Project management needed in design phase or implementation (like
grant management)• 2010 baseline, should be escalated
► Assessment for these flood risk adaptive measures• Dry flood proofing• Wet flood proofing• Hybrids, or combinations of various measures
14
Presenter
Presentation Notes
This project does not include a certified cost estimate from the USACE Cost Center. Project design phase or implementation are not included, either. As a matter of fact, this is just a first look or planning order of magnitude. We did not delve into Dry or Wet Flood Proofing. Hybrid measures can be formulated in future plan iterations. This project only did a first look that guides future plan formulation.
BUILDING STRONG®
Planning and Project Management
Sampling Approach Plan formulation strategy for structures Flood hazard Structure types Demographics Geography Cultural
15
Presenter
Presentation Notes
Planning the project and writing the project management plan was considered a particularly important part of this project, because we wanted to be very clear to the team on what we were doing. The district team was not familiar with nonstructural / flood proofing analysis. With a clear scope and a budget of $100,000, many were uncertain about how many measures could be analyzed. An approach had to be established. The first step in the approach was to size the scope to sample 49 structures. The city chose these as a subset of the total 250 at risk structures.
Planning and Project ManagementStep 1 - Identifying Problems and Opportunities • Develop hydrology for the existing and most-likely future without project conditions • Develop water surface profiles and velocities for an array of discharges • Identify the 1% and 0.2% annual exceedance flood boundaries and floodway • Identify short flood warning time and areas of high depth and/or high velocities • Identify constraints and opportunities for:
o environment o recreation o cultural / societal / historically significant resources
16
Step 1 - Specify Problems and Opportunities
Step 2 - Inventory and Forecast Conditions
Step 3 – Formulate Alternative Plans
Step 4 - Evaluate Alternative Plans
Step 5 - Compare Alternative Plans
Step 6 - Select Recommended Plan
Presenter
Presentation Notes
A good project management plan helps manage team members’ expectations. Ours went into detail to help the team when doing the plan formulation. So here you see the USACE Six Step Planning Process on the right and a description of what is needed. The NFPC has this detailed description so you can get your arms around what’s in the scope and the budget. For Manhattan, the Problem was to find the most feasible solution for reducing flood risk for these 49 structures. Opportunities included counting the beneficial use of floodplains as well as preventing unnecessary flood fighting or most importantly loss of life.
Planning and Project ManagementStep 2 - Inventorying and Forecasting Conditions • Develop inventory of structures for residential, commercial, public, industrial, and critical facility buildings on a structure by structure basis • See Structure Inventory Attachment for pertinent inventory requirements
Step 3 - Formulating Alternative Plans • Determine geographical, political, or cultural subdivisions • Determine all applicable FRAM measures (note inherent constraints for some measures) • Formulate plans utilizing the most appropriate and/or least cost FRAM measures (elevation, flood proofing, relocation, acquisition, basement removal) or combination of FRAM measures Formulate on like levels of risk reduction (i.e. plans based upon frequency of flooding) • Plans must be compliant with existing statutes, regulations, and common law
17
Step 1 - Specify Problems and Opportunities
Step 2 - Inventory and Forecast Conditions
Step 3 – Formulate Alternative Plans
Step 4 - Evaluate Alternative Plans
Step 5 - Compare Alternative Plans
Step 6 - Select Recommended Plan
Presenter
Presentation Notes
The Inventory step is where the NFPC Structure Attribute Data Table was used. Our geospatial analyst also established this in GIS by georeferencing all addresses. The Plan Formulation work developed with application of the NFPC Structure Attribute Data Table. That matrix was applied to each home in the sample. This matrix helped narrow the list of measures.
Planning and Project ManagementStep 4 – Evaluating Alternative Plans • Alternative plans must meet requirements of EO 11988, Flood Plain Management • Federal investment in the regulatory floodway requires relocation or acquisition • For each plan, compare the difference between with- and without-project conditions with respect to benefits and costs • Consider the four national accounts (NED, EQ, RED, and OSE)
18
Step 1 - Specify Problems and Opportunities
Step 2 - Inventory and Forecast Conditions
Step 3 – Formulate Alternative Plans
Step 4 - Evaluate Alternative Plans
Step 5 - Compare Alternative Plans
Step 6 - Select Recommended Plan
Presenter
Presentation Notes
Step 4, for Manhattan, was about Evaluating measures. The highest scores in the matrix determined what measures to do the cost estimating and flood damage analysis on. Those two items provide the basis for Evaluating the most feasible structures. By then end of a planning project, measures are assembled in more grand alternatives. This is really as far in the six steps as we go. The product acts as reconnaissance or a first look that establishes the feasible next steps in more developed Alternatives. Those would get to go to Step 5, or the Comparison of plans.
Ok, so let’s talk about the analyses by the various team members. FEMA had just completed a county-wide physical map revision for the NFIP. While hydraulic models were already finished we still had an engineer sort the data for use by the economist in the USACE risk analysis software.
BUILDING STRONG®
Analysis,Cost Estimating
The parametric unit cost approach for the first look assumed
1) Buyouts► County assessor’s data base,
combing two items = structure appraised values + parcel land value +
► + $5,000 for structure demolition (no foundation removal)
► + $5,000 for moving expenses
2) Relocation► Per diem costs ► Storage, rental► $50 / sq ft► Hotel 60 days (applied to all, not
voluntary vs involuntary)► Moving and storage costs► New lot $30,000► Utilities $2,000► New site’s landscaping $2,000► Other $5,000
20
Presenter
Presentation Notes
So, four types of measures required cost estimating. We were fortunate to have a cost engineer with a degree in architecture. This was still his first time doing flood risk adaptive measures. But the architecture background helped with the critical thinking needed for addressing various residential and commercial structures. He carefully looked at each of tools we used and asked many questions. We were all skeptical at first on what we could do with $100,000, since our district had not exercised the nonstructural measures “muscle” before. The Goal for each type might need a little more clarification. Some of the flood risk adaptive measures are straight forward. For 1) Buyouts was acquiring the land, and we had a feel for the real estate role, since we had access to the County Appraiser’s database. The city planner and city data sets provided additional helpful data. In follow-up plan formulation work, we would definitely need a real estate team member. The Goal for 2) Relocation is also fairly straight forward, however, you must be knowledgeable about some of the requirements. You can see assumptions for the first two FRAMs here.
BUILDING STRONG®
3) Elevating to► Base flood elevation (BFE) plus one foot, or BFE+1
• Unit cost for Elevating $70 per square-foot• Hotel for 60 days $4,005• Moving and storage $1,150
► BFE+2, add $2,000 to BFE+1 assumptions ► BFE+4, add $6,000 to BFE+1 assumptions ► Then plus minus per height (various alternatives)
4) Fill Basement► The concrete floor must be made permeable (break-up concrete)► Move utilities, ie. gaslines, electrical box, sewer, HVAC, appliances► $40,000 per 1,200 sq ft► Plus the reduced value of the home for lost area (small lots had no room
for an addition to offset the lost sq ft)
21
Analysis,Cost Estimating
Presenter
Presentation Notes
The Goal for 3) Elevating requires more thought. Working with the community floodplain manager, we carefully considered three sub-measures. The Goal for BFE+2 was to be prepared for EO 13690 implementation, since the community is seeking federal grants. For BFE+4, we sought to illustrate to homeowners that really the first foot elevation bears much of the cost, and additional feet cost very little by comparison. One misconception is that the cost of each home with the BFE+1 would include the cost to elevate one foot. This is where the NFPC Structure Attribute Data Table helps. The elevations recorded there are important to determine the relative vertical change need at each individual structure to achieve the Goal. The Goal of the FRAM 4) Fill Basement is to provide residential homeowners with a reduction to the NFIP flood insurance. This means protecting the foundation as well as removing living space in the basement.
BUILDING STRONG®
Cost estimator can use a parametric unit cost approach for a first look a basic measures and enhance the cost estimating in future plan iterations.
nServo software► has been improved as a direct result of this project.► is continuing improvements, including efforts to enable
the tool for external partners.
22
Analysis,Cost Estimating
Presenter
Presentation Notes
The parametric unit costs shown in the previous slides are specific to the type of building in the various subdivisions and characteristics unique to this area of the United States. We used the nServo software to help with the home elevations, as that was the single measure nServo addresses.
BUILDING STRONG®
Analysis,Economics
The risk analysis software is a model of the community’s building structures and rivers or streams. Interest rate of 3.125% Period of analysis of 50 years Plan formulation
► Planners and economists can group individual structures► Setting up the model in the software properly from the start can
make a big difference in the team’s ability to evaluate various measures
23
Presenter
Presentation Notes
The economist followed USACE practices in risk analysis. The model used these values in the work. These allow annualization of flood damages, and proper capital budgeting decision to be made. The risk analysis software model is more than these values and needs to be carefully setup at beginning in a way that allows the economist and the planning team to more easily address individual structures and groupings in future plan formulation iterations. Groups of structures may be justified as feasible, similar to past studies for structural plans like levees. If short cuts are taken, or if the model is biased for structural measures, it is likely that returning to the model and expecting an easy nonstructural assessment is not possible.
BUILDING STRONG®
Analysis, EconomicsSensitivity analysis for green space The Corps cannot do ecosystem services currently FEMA's "Hazard Mitigation Assistance Guidance" puts the value of green
space at $7,853. Each structure removed is assumed to be 1/4 of an acre.
24
Presenter
Presentation Notes
While not a standard practice, USACE can still evaluate the impact of ecosystem services for a study. These FEMA values are one approach. USACE would use habitat values and a cost effectiveness / incremental cost analysis for a decision document, however.
BUILDING STRONG®
Analysis, Plan Formulation
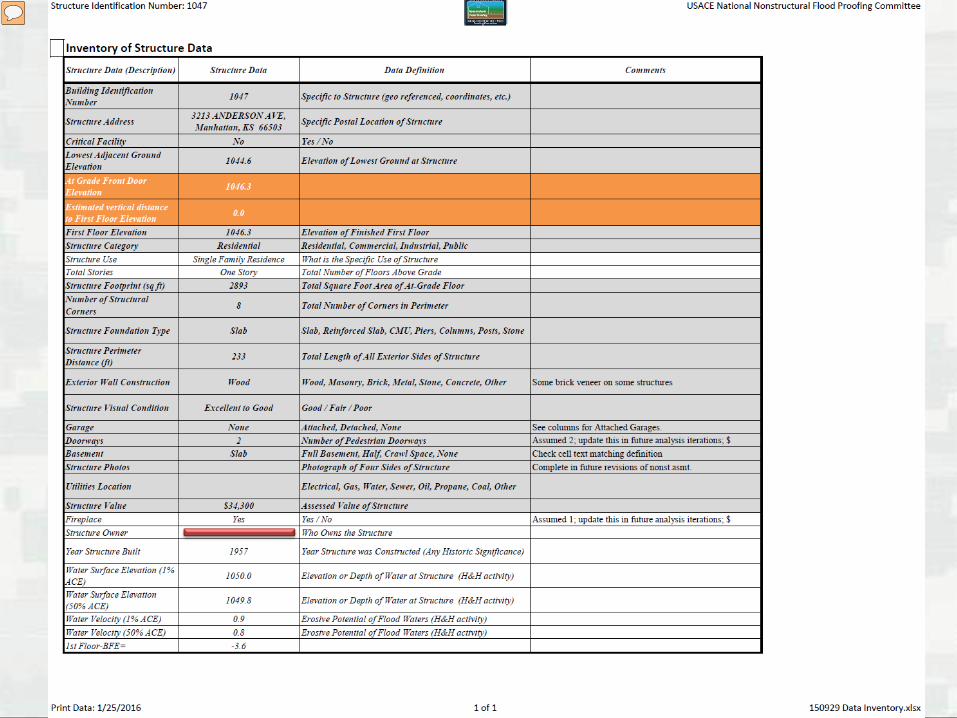
Inventory of Structure Data (table from NFPC)
► Most data collected virtually
• GoogleEarth and GoogleStreetView
• County database• City data• Limited field visits to
some structures by either City or USACE team
► Adjacent grade is from LiDAR near front door
► Water surface elevations come from recent FEMA models
25
Presenter
Presentation Notes
The Plan Formulation depended on using the NFPC Structure Attribute Data Table, where we collected approximate elevation data. This information was accurate to plus or minus 8 inches, or one stair step. This was possible by using GoogleStreetView and counting steps. First floor elevations could then be tied to a LiDAR point just in front of the door. Without LiDAR, it wouldn’t have been possible to analyze these structures.
BUILDING STRONG®
Analysis, Plan Formulation
Evaluate individual structures first Map the benefit-cost ratios, then look at
grouping in later iterations (future project) Plan formulation moves more quickly with a
map describing measures in► Class breaks for benefit-cost ratio (BCR)
► Specific point formats for each flood risk adaptive measure evaluated
• ELEVATION, diamond• BUYOUTS, an “x” (BUYOUT GREEN SPACE, a cross)• RELOCATION, pyramid (similar to up arrow)
26
Presenter
Presentation Notes
Plan Formulation continued with both the cost estimator and economist simultaneously developing their products. Once the economist was finished, point results were assembled in an Excel spreadsheet and passed back to the geospatial analyst. Through GIS software, point files were created. These were pulled in to SimSuite, a webviewer that allows the plan formulator to review the first look and decide where opportunities or problems appear. The point files have attributes, such as the point ID number and the benefit-cost ratios. Those BC-ratios can have class breaks applied to the point file in some webviewers, so the data can be more quickly and easily interpreted.
27
Presenter
Presentation Notes
NFPC Structure Attribute Data Table organizes important characteristics at each structure. These effect cost estimates as well as guiding proper plan formulation of the appropriate flood risk adaptive measures. The cost engineer depends on this information. For instance, knowing the structures perimeter allows a unit cost to be developed for each foot of vertical elevation. Other costs, such as number of doorways and number of corners also can impact the cost.
BUILDING STRONG®
Analysis, Plan FormulationNonstructural Flood Risk Management MatrixThe nonstructural / flood proofing measures appear in the column headers on the next page. Evaluative criteria are in the colorized rows.
28
Presenter
Presentation Notes
Just recalling the matrix described earlier by Randy.
Analysis, Plan Formulation
29
NFPC Matrix
Presenter
Presentation Notes
This is a roll-up of the NFPC’s Structure Attribute Data Table (repeated in thumbnail) result for structures 1000 to 1008. Each row is the sum of the columns in the colorized matrix shown earlier and shown here as a thumbnail image. For 1000, we see a high score for Elevating the structure. Obviously, we’d expect to see that particular measure in the alternatives formulated. Then next number is 8, for Relocation, Buyout, Wet Flood Proofing, and Flood Warning. A flood warning system is already enabled through the NOAA National Weather Service’s Advanced Hydrologic Prediction Service. Recall that this guides Step 3, the Formulation of Alternatives step.
BUILDING STRONG®30
Image from USACE SimSuite webviewer.
Presenter
Presentation Notes
So here are the Results. Structure numbers are shown in orange. As I said before, the points get specific formats corresponding to a particular measure, and they are described in the legend. This slide shows just two measures. The points have class breaks shown using the color. Green being the feasible or the structures with BC-ratio over 1. These geospatially presented results guide the next steps in plan formulation.
Results
31Image from USACE SimSuite webviewer.
Presenter
Presentation Notes
Here’s the same view in the webviewer. The recommendation here is that the buyouts don’t seem to work. Relocation seems to be feasible, since four are green. Since only a sample of the structures in this subdivision was done, relocation may be a better bet in the next plan formulation efforts.
32Image from USACE SimSuite webviewer.
Presenter
Presentation Notes
I did a couple of posters about the project’s results. This is one of them. When we share these slides, you’ll see more examples across Manhattan in the Additional Slides at the back. One thing to emphasize is that the Sampling Approach is a first look and you can see structures in between that still need to get evaluated in a future plan form iteration. That would be necessary prior to establishing a more grand Alternative. New Alternatives might combine two or more FRAMs, as well as catching all structures in a subdivision. And one part of the city has a couple of residential structures in the Big Blue River floodway, so that measure is clearly one federal agencies would have to have.
BUILDING STRONG®
Results
Out of the 49 structures evaluated… 9 structures are feasible for a buyout with green space 4 structures are feasible for a buyout without green space 23 structures are feasible for a relocation with green space 17 structures are feasible for a relocation without green space 35 structures are feasible for basement fill 13 structures are feasible for being elevated four feet (also evaluated
one foot and two feet)
Other measures for future planning iterations Wet flood proofing Dry flood proofing
33
Presenter
Presentation Notes
Results. The nonstructural assessment paid off. Every measure had several feasible structures. Again, these are just the generic results by measure. Planners could work with the stakeholders using these results and form Alternatives that are hybrids based on public engagement and trade-off analyses. Also, planners can do conglomerations and see if when grouped together we get a feasible alternative combining groups. [Read from slide]
BUILDING STRONG®
Next Steps
Public meeting (in this scope) Collect more elevation data (by others) and get
Elevation Certificates wherever possible Enhance plan formulation (not limited to
USACE)
34
Presenter
Presentation Notes
Next Steps. [Read from slide]
BUILDING STRONG®
Take-Aways Several tools from NFPC that simplify the nonstructural /
flood proofing analysis Project management plans (PMP) should be set up to analyze
the full menu of FRM measures, and this can reinforce, for example, that► HEC-FDA is applied correctly at beginning and setup in a way to
address individual structures and groupings► Groups of structures may be justified as feasible, similar to past studies
for structural plans like levees
Success is only possible with proper understanding and budgeting the plan formulation of nonstructural and flood proofing assessments in the beginning with the PMP
The map acts as a guide to the next plan formulation iterations► colorized points for measures ► class breaks for final benefit-cost ratios
35
Presenter
Presentation Notes
Three tools were used from the Nonstructural / Flood Proofing Committee -New automated matrix spreadsheet -Inventory of Structure Data spreadsheet -nServo cost estimating tool In addition, we used the NFPC’s scoping supplement to the Six Step Planning Process. Also, web tools such as webviewers like SimSuite and GoogleStreetView help visualize results. In reflection on the project management for this project, we were able to accomplish much more than I thought we would do at the beginning. The initial estimate for the cost engineering was a quarter of the budget, and that was only for six structures. We had to develop an understanding of what a plan formulation first look was and was not. A major stumbling block is project risk: We have to point out we don’t have all the data, but we need to get comfortable with the project risk so we can get to a feasible project about the flood risk. The project management plan was meant to get us over that.
BUILDING STRONG®
Let’s go mitigate!
36
Questions
BUILDING STRONG®
Useful Links
37
USACE, National Nonstructural/Flood Proofing Committee► http://www.usace.army.mil/Missions/CivilWorks/ProjectPlanning/nfpc.aspx► Nonstructural Flood Risk Reduction Matrix► Inventory of Structure Data spreadsheet