nonprofit organizations in brazil:...
TRANSCRIPT


Nonprofit Organizations in Brazil: A Pilot Satellite Account with International
Comparisons
2002
A Publication of the Johns Hopkins Center for Civil Society Studies
In cooperation with the Brazilian Institute of Geography and Statistics (IBGE) and
United Nations Volunteers (UNV) November 2010

1
Preface
This report presents a pilot effort to implement the United Nations Handbook on Nonprofit Institutions in the System of National Accounts (UN NPI Handbook) in Brazil in order to generate a “satellite account” encompassing all of the country’s nonprofit institutions. Standard national accounts methodology had the effect of obscuring the true size and composition of the nonprofit sector in Brazil and other countries by assigning most nonprofit institutions with substantial economic activity to other sectors of the economy. The methodology and definitions elaborated in the UN NPI Handbook hold the promise of producing a clearer picture of the nonprofit institution sector around the world, and at least twelve countries have successfully applied this Handbook to produce NPI satellite accounts to date. This report represents the first attempt to apply this methodology to Brazil.
Production of this report was achieved through a partnership between Brazil’s Institute of Geography and Statistics (IBGE), the Johns Hopkins University Center for Civil Society Studies (JHU‐CCSS),1 and the United Nations Volunteers2 (UNV) programme of the United Nations Development Program (UNDP). Neide Beres served as a National United Nations Volunteer hosted by IBGE to produce the Brazilian figures and the core text of the document.3 Her findings were then incorporated into an international and longitudinal data set provided by the JHU‐CCSS in order that the Brazilian results could be viewed in an international context and compared with the findings from other satellite accounts produced by national statistics agencies to date, and with comparative studies undertaken in 43 countries worldwide as part of the Johns Hopkins Comparative Nonprofit Sector Project. Assistance in analyzing these results was provided by the Center for State and Society Studies4 (CEDES), Argentina.
The final results in Brazil were then reviewed by the Grupo de Institutos, Fundações e Empresas (Group of Institutes, Foundations and Enterprises‐ GIFE) and the Instituto de Pesquisa Econômica Aplicada (Institute of Applied Economic Research – IPEA), which have provided important information on the nonprofit sector in Brazil. Efforts were made to ensure that the results published in this working paper are related to those provided in IPEA’s publication As Fundações Privadas e Associações sem Fins Lucrativos no Brasil – 20025 as well as an update of that publication covering 2005, and any inconsistencies accounted for.
The results of this study show that the nonprofit sector in Brazil represents a significant economic force, employing a sizable share of the workforce, and contributing to the Brazilian economy on a par with other major industries. In the process, the report demonstrates the feasibility of generating regular, detailed economic data on the nonprofit sector in Brazil at a level of detail not available through other sources. It is our hope that the report will lead to a permanent system for generating satellite accounts in the country to document the role and activity of the country’s important nonprofit institution sector.
The authors are grateful to the United Nations Volunteers (UNV) and the W.K. Kellogg Foundation for their support of this work, to GIFE and IPAEA for their careful review of the findings, and to the Brazilian Institute of Geography and Statistics (IBGE) for its willingness to host this important pilot effort.
1Lester M. Salamon, director, Helen Tice, S. Wojciech Sokolowski, and Megan Haddock contributors; Chelsea Newhouse, design (www.ccss.jhu.edu). 2United Nations Volunteers programme: www.unv.org 3Neide Beres expresses her special gratitude to Dirk Hegmanns, coordinator of the United Nations Volunteers program in Brazil, whose confidence and patience made all the difference. 4Center for State and Society Studies: www.cedes.org/english/areas/sociedad/index.html 5As Fundações Privadas e Associações sem Fins Lucrativos no Brasil – 2002. http://www.ibge.gov.br/home/estatistica/economia/fasfil/default.shtm

2
Table of Contents
1. Introduction 5
2. The Size of the Brazilian Nonprofit Sector………………………………………………………………………..11
3. The Composition of the Brazilian Nonprofit Sector …………………………………………………………14
4. The Revenue Structure of Brazil’s Nonprofit Sector............................................................17
5. Gross Savings and Investment………………………………………………………………………………………….22
6. Conclusion…………………………………………………………………………………………………………………………23
Appendixes 1. Data from the Satellite Account of Non‐Profit Institutions In Brazil 24 2. Coverage and Classification……………………………………………………………………………………….26 3. Sources, files and variables used in constructing the pilot model
of the NPI Satellite Account……………………………………………………………………………………….29 4. Volunteers 38 5. Income and Expenses Transactions 49 6. Summary of non‐financial variables of NPOs 41 7. Legislative Changes that Occurred in the 1996‐2002 Period 42 8. Bibliography 45

3
List of Acronyms
CEMPRE National Registry of OrganizationsCNAE National Classification of Economic ActivitiesCNP Comparative Nonprofit Sector ProjectCNPJ National Registry of Legal Entities for tax‐immune and tax‐exempt organizationsEAP Economically active populationEAP Economically active population FTE Full‐time equivalent GIFE Grupo de Institutos, Fundações e Empresas (Group of Institutes, Foundations and
Enterprises) IBGE Brazilian Institute of Geography and StatisticsICNPO International Classification of Non‐Profit Organizations INEP/MEC Anisio Teixeira Institute for Educational Research of the Ministry of EducationIPEA Instituto de Pesquisa Econômica Aplicada (Institute of Applied Economic Research)JHU‐CCSS Johns Hopkins University Center for Civil Society Studies
MAS Sanitary Medical AssistanceNPI Nonprofit InstitutionsNPISH Nonprofit Institutions Serving Households PNAD National Research on Household SamplingSIAFI Federal Financial Administration SystemSNA System of National AccountsUNDP United Nations Development ProgramUNV United Nations Volunteers

4
Introduction This report presents a pilot Satellite Account on Nonprofit Institutions in Brazil. Completed in cooperation with CONAC, the Organization of National Accounts of the Brazilian Institute of Geography and Statistics (IBGE) Department of Research, this satellite account follows the guidelines outlined in the United Nations Handbook on Non‐Profit Institutions in the System of National Accounts (UN NPI Handbook), developed by the Johns Hopkins University Center for Civil Society Studies in partnership with the United Nations Statistics Division. Like all “satellite accounts,” this one leaves Brazil’s core national accounts structure intact as specified in the 1993 version of the System of National Accounts, but it deviates from normal SNA usage by grouping all nonprofit institutions together rather than dividing them among various other institutional sectors based largely on their major source of revenue, as the 1993 SNA recommended.6 It also covers a much broader array of nonprofit institutions than has been common in the Brazilian national accounts system. 7 Background The idea of treating the non‐profit sector as a distinct group of private organizations whose role is to act in public benefit without a profit motive has grown in recent years. In Brazil, studies in this field began in the 1990s at ISER (Institute for the Study of Religion), then a partner of the international project coordinated by the Johns Hopkins Center for Civil Society Studies. During this period, a first study was carried out to portray the basic contours of this sector and to document its size and revenues drawing on administrative records available at the time.8 This study was widely debated among members of civil society and academia, creating a conceptual framework that defined the institutions and their activities in Brazil. Additional research conducted at ISER produced the study "The Non‐profit organizations in Brazil ‐ Occupations, Expenses and Resources.” The results were incorporated into the JHU‐CCSS Comparative Nonprofit Sector Project data set quantifying nonprofit sector variables in 22 countries, such as the number of employed persons, the estimated number of volunteers, operating expenses, and sources of resources overall and by activity field. 9 Efforts to update the data in Brazil began in 2004 with a partnership between IBGE, JHU‐CCSS, and the UNV. The approach taken this time was to see if these data could be produced by official government sources operating within the confines of the System of National Accounts but compiled in a satellite account. 2002 was selected as the reference year because research and additional surveys, such as the Medical‐Sanitary MA and IPEA’s As Fundações Privadas e Associações sem Fins Lucrativos no Brasil (FASFIL)10 report, became available for the first time. These surveys do not happen annually, and contain relevant information for this pilot study. Besides these surveys, research carried out by Institute for Educational Research of the Ministry of Education and Culture MEC (INEP), and files from the Federal Revenue Secretariat (SRF of the Ministry of Finance ‐ MF), contributed significant databases already consolidated in 2005.
6 For a discussion of the relationship between the NPI satellite account and the existing System of National Accounts structure, see: United Nations (2003). Handbook on Nonprofit Institutions in the System of National Accounts. United Nations publication Sales No. E.03.XVII.9 ST/ESA/STAT/SER.F/91. New York, 2003. (www.jhu.edu/ccss/unhandbook). (NPI Handbook) 7 The current Brazilian System of National Accounts only considers those organizations that provide services to families to be non‐profit institutions. 8 Leilah Landim, Neide Beres, Regina List, and Lester Salamon, “Brazil,” chapter in Salamon, Lester M. et al (1999). 9 Leilah Landim and Neide Beres “Ocupações, despesas e recursos: as organizações sem fins lucrativos no Brasil", Nau Editora, Rio de Janeiro, 1999. 10 IBGE, IPEA, GIFE, ABONG (2004. Estudos e pesquisas Informação econômica, no. 4. As Fundações Privadas e Associações sem Fins Lucrativos no Brasil – 2002. Rio de Janeiro, Brazil. http://www.ibge.gov.br/home/estatistica/economia/fasfil/default.shtm

5
The present report outlines the concepts and data sources used to compile the Brazilian NPI satellite account, details the major findings from this process, and compares these findings to findings from other countries that have implemented the UN Handbook on Nonprofit Institutions in the System of National Accounts and/or have been covered by the Johns Hopkins Comparative Nonprofit Sector Project. Concepts and Approach This report views the nonprofit sector through two different lenses to demonstrate its size and scope. Satellite account data reported by IBGE conceptualize the NPI sector financially by indentifying the monetary flows in and out of the sector. Satellite accounts report on the income and expenditures of the sector, and permit IBGE to account for the sector’s value added to the economy. An alternative approach, used by the Johns Hopkins Comparative Nonprofit Sector Project and the FASFIL report view the nonprofit sector from the perspective of labor inputs. Because the nonprofit sector does not operate with a profit motive, focusing on the levels of employment in the sector offers a more nuanced view of where the sector’s efforts are focused. To compile this satellite account on nonprofit institutions in Brazil, several tasks had to be performed: first, it was necessary to define, and then to identify, the entities to be covered by the satellite account; second, it was necessary to settle on a classification structure for differentiating these entities; and third, it was necessary to locate data that would make it possible to generate reliable empirical data on these entities sufficient to populate regular SNA data tables. This introduction provides a brief overview of how these tasks were addressed, with further detail provided in Appendixes 2, 3, and 4. 1. Defining the nonprofit sector
A first task in carrying out this study was to define, and then to identify, the universe of organizations considered to be part of the nonprofit sector and therefore in‐scope for this satellite account. This task was especially important because although nonprofit institutions are expected to be covered in national accounts, they are rarely identified as NPIs. Rather, the rules for allocating economic units among economic sectors under the 1993 System of National Accounts focused on the source of an economic unit’s revenues rather than its legal status or production function. Since many NPIs receive significant fee income or government support, they were allocated to the corporate or government sectors in national accounts and lost any identity they may have had as NPIs. The UN NPI Handbook was designed to overcome this limitation of the SNA system by identifying organizations according to their characteristics as NPIs rather than their source of revenue, and then grouping all such identified organizations together in a consolidated NPI satellite account. To do so, the Handbook identifies five characteristics by which NPIs can be identified, regardless of their revenue structure. These characteristics are identified in Box 1 below and briefly described in the paragraphs that follow:
Box 1: NPI Handbook definition of the non‐profit sector The non‐profit sector consists of units that are:
(a) Organizations; (b) Not‐for‐profit and non‐profit‐distributing; (c) Institutionally separate from government; (d) Self‐governing; (e) Non‐compulsory.

6
a) Organization. The entity must demonstrate some institutional reality, as evinced by “some degree
of internal organizational structure; persistence of goals, structure, and activities; meaningful organizational boundaries; or a legal charter of incorporation. Excluded are purely ad hoc and temporary gatherings of people with no real structure or organizational identity.”
b) Not‐for‐profit. An NPI is an organization that does not exist primarily to generate profits, either directly or indirectly, and are not primarily guided by commercial goals and considerations. NPIs may accumulate surplus, but any such surplus must be plowed back into the basic mission of the agency, not distributed to the organizations’ owners, members, founders or governing board. In this sense, NPIs may be profit‐making but they are “non‐profit‐distributing,” which differentiates NPIs from for‐profit businesses.
c) Institutionally separate from government. An NPI is not part of the apparatus of government and does not exercise governmental authority in its own right. The organization may receive significant financial support from government, and it may have public officials on its board. However, it has sufficient discretion with regard to the management of both its production and its use of funds that its operating and financing activities cannot be fully integrated with government finances in practice.
d) Self‐governing. An NPI must be able to control its own activities and is not under the effective control of any other entity. To be considered self‐governing, the organization must control its management and operations to a significant extent, have its own internal governance procedures, and enjoy a meaningful degree of autonomy.
e) Non‐compulsory. Membership in and contributions of time and money to an NPI are not required or enforced by law or otherwise made a condition of citizenship.
Generally speaking, it was possible to utilize this definition to demarcate the NPI sector in Brazil. More specifically, the main characteristics of the nonprofit institutions in Brazil that met the NPI Handbook’s definition can be described as follows:
a) Legal status. Legally, NPIs can be constituted as associations or private foundations. In practice they can be grouped into the categories of non‐governmental organizations (NGOs), social organizations (SOs), or civil society organizations with public interest (OSCIPs).
b) Tax exempt status. NPIs are exempted from paying income tax and benefit from privileged status
for other taxes, such as those related to wages and salaries. Organizations designated as SOs or OSCIPs are also exempted from the bidding process for contracts with government agencies.11
c) Non‐profit character. Brazil’s NGOs, SOs, and OSCIPs meet the defining feature of not being
allowed to distribute any profits they may generate among managers or members. Like the NPIs identified in the NPI Handbook, these organizations may accumulate surplus, but any such surplus must be plowed back into the basic mission of the agency.
d) Providing public goods and services. NPIs provide goods and services to the public, and may be
11 Since 2007 the non‐profit organizations that receive public funding have been required to register with the Ministry of Justice.

7
financed by direct sales, personal contributions, government grants, and volunteer labor or in‐kind donations;
e) Personnel. The staff of an NPI is often composed of significant numbers of volunteers, which are
individuals who willingly give their time to organizations without being paid for it. It should be noted that this report includes political parties and unions within the nonprofit sector, though these two types of organizations are not included in the FASFIL report. Though they are not usually considered to be part of the nonprofit sector by those inside Brazil, they have been included to allow for comparison with other international satellite accounts. Further, the results identified in this report may be somewhat atypical with the inclusion of political parties because 2002 was an election year.
On the other hand, some types of activity included within the definition of an NPI recommended in the UN NPI Handbook could not be included in the Brazilian setting:
a) Most significantly, although the NPI Handbook definition includes both formal (i.e., legally
registered) and informal organizations, in practice it was not possible to include the informal organizations in the Brazil data. As a result, the data reported here cover only formally registered organizations that report their financial transactions to the Federal Revenues Secretary, even if they are not subject to systematic oversight. As a result, the data reported here likely understate the true scale of the Brazilian nonprofit sector.
b) Companies’ and individuals’ transactions involving in‐kind donations of goods (food, clothing, medicine) for specific campaigns or on an ongoing basis could also not be included due to data limitations.
2. Classification of NPIs
The UN NPI Handbook recommends that countries use the International Classification of Non‐Profit Organizations (ICNPO) to classify the activity areas of NPIs. The ICNPO structures the classification of NPI activities into 12 groups:
1. Culture and recreation 2. Education and research 3. Health 4. Social services 5. Environment 6. Development and housing 7. Law, advocacy and politics 8. Philanthropic intermediaries and voluntarism promotion 9. International 10. Religion 11. Business and professional associations, unions 12. Not elsewhere classified
The ICNPO was modified for use in this pilot satellite account in order to correspond with the National Classification of Economic Activities (CNAE), which is used by IBGE and all other public organizations of administrative record and supervision in Brazil. The modified classification of NPI activities in Brazil, as

8
outlined below, combines ICNPO groups 5,6,7,8 into one group called Development Defense of Rights, and ICNPO categories 2 and 8 are combined into one Education group. The eight groups comprise the subsectors of the satellite account. Having eight instead of twelve categories may complicate the analysis of individual groups and the sector as a whole, but has the advantage of preserving the original records.
Modified ICNPO Classification ‐ Brazil Culture, Art, & Sports
Theater; museums; music; educational television; art and literature; venue management; botanical and zoological gardens, national parks and reserves; libraries and archives; and other related activities. In addition, this classification includes sports activities, social clubs, and other leisure activities.
Education & Research
Preschool; primary education; general educational media; indigenous education; supplemental education; continuing education and trade school; distance learning; special education; and higher education. In addition, this classification includes research and development in the humanities and in the physical, natural, and social sciences; and community, faith‐based, and philanthropic organizations.
Health Hospital care; urgent and emergency care; outpatient care; diagnostic and therapeutic care; and other healthcare‐related activities.
Social Services Social service activities, with or without accommodation.Development and Defense of Civil Rights
Activities of political organizations and other related, unspecified activities. This second group includes environmental‐defense groups, homeowners and residents associations, community centers and associations, workforce training and income generation, and minority‐ and group‐rights activism.
International Organizations
Activities of international organizations and other foreign activities.
Religious Organizations
Activities of religious organizations.
Trade and Professional Organizations
Activities of business, trade, professional, trade union, and guild organizations.
Appendix 2 provides a more detailed statement of the organizations included in these various categories and their classification in Brazilian official records. As should be clear, this classification structure preserves much of the structure and content of the ICNPO.
3. Data Sources and Coverage Assembling the Satellite Account framework by type of activity required compiling information from various databases and an extensive effort to integrate the data. Data were extracted from micro data files resident in databases at the National Research on Household Sampling (PNAD); the National Registry of Organizations (CEMPRE); the National Registry of Legal Entities (CNPJ) for tax‐immune and tax‐exempt organizations; the Anisio Teixeira Institute for Educational Research of the Ministry of Education (INEP/MEC); the Sanitary Medical Assistance (MAS); the IBGE Healthcare Research; the Federal Financial Administration System (SIAFI); research on municipal and state public finance; and restricted‐circulation manuscripts such as the paper on Federal Social Expenditures (GSF) of the Institute for Applied Economic Research of the Institute of Political and Social Studies (IPEA/IEPES). This study has been carefully designed to complement and build on the results of two other studies of the

9
nonprofit sector in Brazil: the Johns Hopkins Comparative Nonprofit Sector Project (CNP),12 conducted in 1995, and IPEA’s As Fundações Privadas e Associações sem Fins Lucrativos no Brasil (FASFIL)13 report, published in 2002. The scope of the Satellite Account expands on the CNP study using a great deal of additional information that has become available since 1995. In addition, the Satellite Account expands on the scope of IPEA’s FASFIL study by taking into account a larger number of variables to describe the sector, offering time‐series data, and embracing a somewhat larger array of institutions, most notably political parties and trade unions. The Satellite Account also embraces a broader array of types of employment than previous studies, reflecting the peculiar labor market realities of Brazil. In particular, the following types of workers were identified for each activity:
a) Formal remunerated employees (with a formal contract); b) Informal remunerated employees (without a formal contract); c) Volunteer workers
The formal and informal remunerated employees where each subdivided into (a) full‐time, or principal, workers, i.e. those with a work schedule of forty hours per week; and (b) part‐time, or secondary, workers. The latter were translated into the equivalent full‐time workers based on the number of hours they work (e.g. 2 part‐time workers working four hours a day each translate into one full‐time equivalent (FTE) worker. So far as volunteer workers are concerted, only institution‐based volunteering is included. Direct volunteering, or volunteer activities that were provided by individuals directly to other households outside the context of an organization, were excluded. This type of volunteering was excluded because of a lack of available records on these activities. Individuals who distribute food on their own to populations in extreme poverty, or who care for a neighbor’s children are examples of direct volunteer activities for which data are not available.
Structure of this Report
The balance of this report presents the major findings of the NPI satellite account work in Brazil, focusing first on the overall size of the Brazilian NPI sector, and then examining, in turn, its composition and revenue structure. To put these findings into context, the findings are compared to two other sources of data: first, the results generated by other countries that have implemented the UN NPI Handbook; and second, the results of the Johns Hopkins Comparative Nonprofit Sector Project (CNP), which formulated the basic approach incorporated in the UN NPI Handbook. In addition, where appropriate, the results generated here are related to the results of the FASFIL study.
12Leilah Landim, Neide Beres, Regina List, and Lester Salamon, “Brazil,” chapter in Salamon, Lester M. et al (1999). Lester M. Salamon, Helmut K. Anheier, Regina List, Stephan Toepler, S. Wojciech Sokolowski, and Associates. Global Civil Society: Dimensions of the Nonprofit Sector. (Baltimore, MD: The Johns Hopkins Center for Civil Society Studies,1999). http://www.ccss.jhu.edu/pdfs/Books/BOOK_GCS_Ch20_Brasil_SP_1999.pdf 13 IBGE, IPEA, GIFE, ABONG (2004. Estudos e pesquisas Informação econômica, no. 4. As Fundações Privadas e Associações sem Fins Lucrativos no Brasil – 2002. Rio de Janeiro, Brazil. http://www.ibge.gov.br/home/estatistica/economia/fasfil/default.shtm

10
II. The size of the Brazilian Nonprofit Sector
1. Size The NPI satellite account reveals a nonprofit institutions sector that represents a significant economic force in Brazil. The total nonprofit sector value added in Brazil was about 34.2 billion Real (USD$26.4 billion) in 2002. Including the value of volunteers, this translates into a nonprofit sector that accounted for approximately 2.3 percent of the aggregate value of the economy in 2002.14 Figure 1 places the Brazilian nonprofit sector’s economic contribution in context by comparing it with other economic sectors that make a significant contribution to Brazil’s Gross Domestic Product (GDP). As this figure shows, the contribution of NPIs to Brazil’s GDP is substantially greater than that of the textile or automobile manufacturing industry and is on a par with the entire transportation industry. Figure 1: Contribution of selected economic sectors to value added, 2002
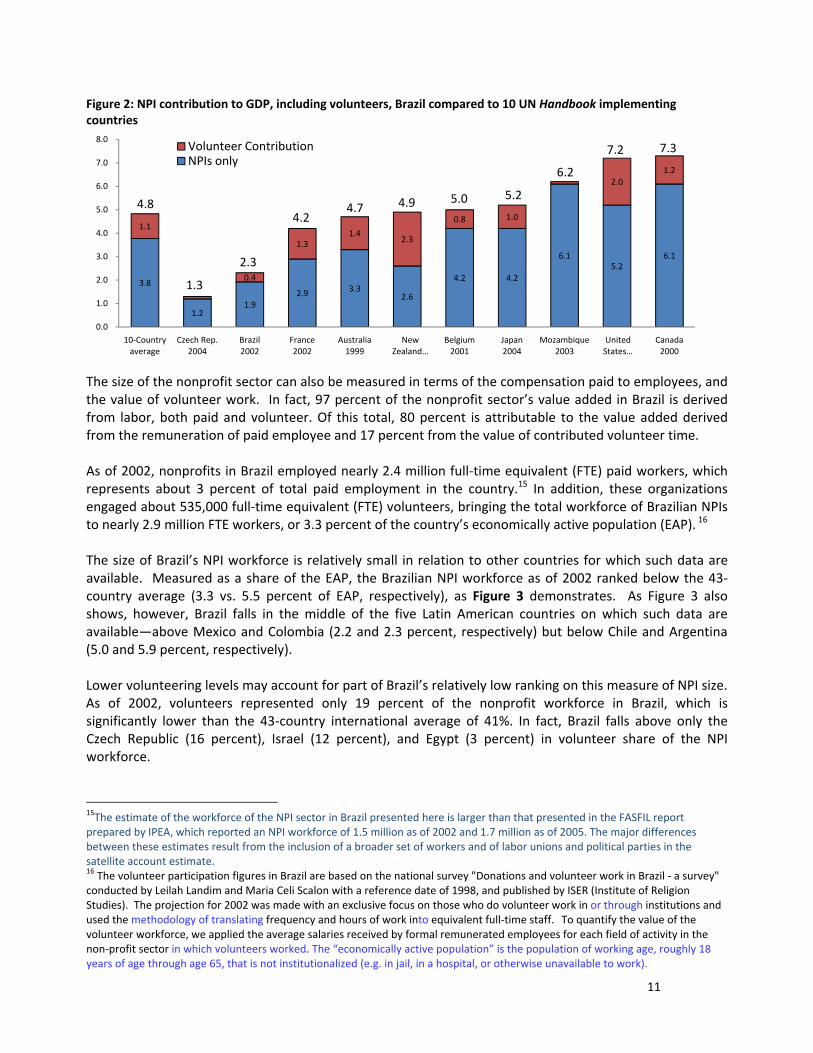
While quite sizable, the GDP contribution of Brazil’s NPI sector falls at the low end of other countries that have so far implemented the UN NPI Handbook. Thus as shown in Figure 2, at 2.3 percent, the Brazilian NPI sector’s contribution to GDP exceeds that of the Czech Republic, but is only half as great as the 4.8 percent average for the 10 other countries for which NPI satellite account data are available. This may reflect in part, however, the lack of coverage of the unregistered, informal organizations in the Brazilian pilot satellite account data.
14 The nonprofit institutions sector that comes into focus through the NPI satellite account is much larger than the Nonprofit Institutions Serving Households (NPISH) sector that has long been the only component of nonprofit institutions visible through the System of National Accounts. The full NPI sector in Brazil is nearly 3 times larger than previously estimated, and for all 10 countries that have completed satellite accounts to date it is anywhere from 2.67 to 7.58 times larger than the portion that is captured in NPISH.
0.0 0.5 1.0 1.5 2.0 2.5 3.0
Manufacture & maintenance‐
machines & engines
Transportation
Nonprofit sector
Manufacture‐cars, trucks, buses
Textiles
Percent of value addedSource: IBGE/National Accounts 2002 (values in basic prices)
11
Figure 2: NPI contribution to GDP, including volunteers, Brazil compared to 10 UN Handbook implementing countries
The size of the nonprofit sector can also be measured in terms of the compensation paid to employees, and the value of volunteer work. In fact, 97 percent of the nonprofit sector’s value added in Brazil is derived from labor, both paid and volunteer. Of this total, 80 percent is attributable to the value added derived from the remuneration of paid employee and 17 percent from the value of contributed volunteer time. As of 2002, nonprofits in Brazil employed nearly 2.4 million full‐time equivalent (FTE) paid workers, which represents about 3 percent of total paid employment in the country.15 In addition, these organizations engaged about 535,000 full‐time equivalent (FTE) volunteers, bringing the total workforce of Brazilian NPIs to nearly 2.9 million FTE workers, or 3.3 percent of the country’s economically active population (EAP). 16 The size of Brazil’s NPI workforce is relatively small in relation to other countries for which such data are available. Measured as a share of the EAP, the Brazilian NPI workforce as of 2002 ranked below the 43‐country average (3.3 vs. 5.5 percent of EAP, respectively), as Figure 3 demonstrates. As Figure 3 also shows, however, Brazil falls in the middle of the five Latin American countries on which such data are available—above Mexico and Colombia (2.2 and 2.3 percent, respectively) but below Chile and Argentina (5.0 and 5.9 percent, respectively). Lower volunteering levels may account for part of Brazil’s relatively low ranking on this measure of NPI size. As of 2002, volunteers represented only 19 percent of the nonprofit workforce in Brazil, which is significantly lower than the 43‐country international average of 41%. In fact, Brazil falls above only the Czech Republic (16 percent), Israel (12 percent), and Egypt (3 percent) in volunteer share of the NPI workforce.
15The estimate of the workforce of the NPI sector in Brazil presented here is larger than that presented in the FASFIL report prepared by IPEA, which reported an NPI workforce of 1.5 million as of 2002 and 1.7 million as of 2005. The major differences between these estimates result from the inclusion of a broader set of workers and of labor unions and political parties in the satellite account estimate. 16 The volunteer participation figures in Brazil are based on the national survey "Donations and volunteer work in Brazil ‐ a survey" conducted by Leilah Landim and Maria Celi Scalon with a reference date of 1998, and published by ISER (Institute of Religion Studies). The projection for 2002 was made with an exclusive focus on those who do volunteer work in or through institutions and used the methodology of translating frequency and hours of work into equivalent full‐time staff. To quantify the value of the volunteer workforce, we applied the average salaries received by formal remunerated employees for each field of activity in the non‐profit sector in which volunteers worked. The “economically active population” is the population of working age, roughly 18 years of age through age 65, that is not institutionalized (e.g. in jail, in a hospital, or otherwise unavailable to work).
3.8
1.21.9
2.9 3.32.6
4.2 4.2
6.15.2
6.1
1.1
0.4
1.31.4
2.3
0.8 1.0
2.01.2
0.0
1.0
2.0
3.0
4.0
5.0
6.0
7.0
8.0
10‐Country average
Czech Rep. 2004
Brazil 2002
France 2002
Australia 1999
New Zealand …
Belgium 2001
Japan 2004
Mozambique 2003
United States…
Canada 2000
Volunteer ContributionNPIs only
4.8
1.3
2.3
4.24.7 4.9 5.0 5.2
6.2
7.2 7.3

12
Figure 3: Size of nonprofit workforce in 43 countries
Source: Global Civil Society, Volume III, Johns Hopkins Center for Civil Society Studies forthcoming 2011
1.4%
1.7%
1.3%
1.3%
1.7%
1.0%
3.1%
2.7%
1.7%
3.0%
2.5%
2.4%
2.8%
2.6%
3.3%
2.6%
3.2%
3.7%
4.3%
2.8%
2.2%
6.4%
4.9%
5.9%
5.9%
6.2%
2.5%
3.2%
8.6%
5.1%
10.3%
9.0%
9.7%
10.1%
1.2%
1.4%
1.5%
1.4%
1.7%
1.3%
1.7%
1.8%
1.5%
2.4%
2.2%
3.1%
2.7%
3.0%
2.6%
4.5%
5.6%
1.5%
3.9%
2.9%
3.1%
3.0%
7.0%
6.4%
2.3%
5.8%
1.5%
3.2%
3.4%
5.8%
0.7%0.9%1.0%1.0%1.2%1.5%1.5%1.7%1.9%1.9%2.0%2.1%2.1%2.2%2.3%2.4%
3.2%3.3%3.4%
4.2%4.2%4.3%4.3%
5.0%5.5%5.7%5.9%
6.8%6.9%7.3%7.8%8.0%
8.8%8.8%9.0%9.2%9.6%9.6%
10.9%11.0%
11.8%12.3%
13.1%15.9%
0% 1% 2% 3% 4% 5% 6% 7% 8% 9% 10% 11% 12% 13% 14% 15% 16% 17% 18% 19% 20%
Romania
Poland
Pakistan
Slovakia
Russia
Morocco
India
Czech Republic
Philippines
Tanzania
Hungary
Peru
Kenya
Mexico
Colombia
Uganda
Egypt
Brazil
South Africa
Portugal
Korea, Rep. of
Italy
Spain
Chile
43 countries
Finland
Argentina
Germany
Switzerland
Norway
Austria
Japan
Denmark
Australia
France
United States
Sweden
New Zealand
Ireland
United Kingdom
Israel
Canada
Belgium
Netherlands
Paid
Volunteer

13
III. The Composition of the Brazilian Nonprofit Sector
Nonprofit institutions in Brazil engage in a wide variety of activities.17 This can be seen in two different ways: first the distribution of the value added attributable to NPIs; and second, in the distribution of full‐time equivalent workers. The major different between these two measures is that the former takes account of the wages paid to workers whereas the second does not. 1. Distribution of NPI Value Added Among Fields The share of the total NPI value added represented by each NPI field is shown in Figure 4.18 Figure 4: NPI value added by field in 2002
As this figure shows, NPIs in the field of education and research account for the largest portion of the NPI contribution to value added in Brazil. This reflects the sizable workforce of these NPIs combined with the relatively high average salaries in higher education. Organizations in the labor‐intensive health field come second, tied with the development and defense of rights field. The latter field includes a wide range of organizations from human rights and environmental organizations to residents’ associations, community development organizations, political parties, and community organizations. With the inclusion of political parties during an election year, the development and defense of rights field may be somewhat higher than in a more typical year. Religious organizations also account for a sizable 17 percent of the NPI contribution to value added in
17 The definitions of the nature of the organizations grouped into each activity area can be found in Appendix 1. 18 As noted in the Introduction, the UN NPI Handbook recommends that countries use the International Classification of Non‐Profit Organizations (ICNPO) to define these activity areas. The ICNPO proposes to structure the classification of NPI activities into 12 categories. However, the ICNPO was modified for use in this pilot satellite account in order to correspond with the National Classification of Economic Activities (CNAE), which is used by IBGE and all other public organizations of administrative record and supervision in Brazil. The subsequent eight categories comprise the subsectors of the satellite account. Having eight instead of twelve categories may complicate the analysis of individual groups and the sector as a whole, but has the advantage of preserving the original records. For more information about the modified ICNPO categories, please see Appendix 1.
Professional associations
6%
Religious organizations
17%
International0%
Development & defense of rights
17%
Social services7%
Health18%
Education & research31%Culture & Arts
4%

14
Brazil, but this is largely attributable to the substantial involvement of volunteers in this field. While social services, culture and recreation, and professional associations employ high numbers of paid staff and volunteers, their contribution is diminished because many positions in these sectors are poorly paid. Table 1 below puts the composition of Brazil’s NPI sector into international perspective by comparing it to that of other countries that have completed satellite accounts.19 Table 1 shows that Brazil’s education and research contribution to GDP, at 30.8 percent, is higher than the 8‐country average of 20.1 percent, while the contribution of social services to GDP in Brazil, at 7.1 percent, is much lower than the 8‐country average of 18.7 percent. Of the countries on which NPI satellite account data are available, Brazil comes closest to the Czech Republic in the composition of its NPI sector, with heaviest concentration in the field of education and quite small shares in social services. Table 1: Distribution of NPI contribution to value added, by field, Brazil vs Other Handbook Countries*
Australia 1999
Belgium 2001
Canada 2000
Czech Republic 2004
France 2002
Japan 2004
New Zealand 2004
Brazil 2002
8‐country average
Culture & recreation 23.1% 16.5% 8.1% 12.2% 29.6% 3.3% 25.9% 4.2% 17.0%
Education & research 24.7% 1.9% 20.3% 50.9% 11.9% 16.5% 14.2% 30.8% 20.1%
Health 12.0% 34.4% 38.4% 1.8% 10.9% 45.4% 10.3% 18.4% 21.9%
Social services 21.6% 24.5% 11.7% 3.5% 35.7% 17.8% 15.8% 7.1% 18.7%
Other 18.5% 22.7% 21.5% 31.6% 11.9% 16.9% 33.7% 39.5% 22.4%
Figure 5 describes the relative composition of each field’s contribution to value added, and illustrates the relative reliance different fields of activity place on volunteer and paid labor. As this figure shows, religious organizations and social service organizations tend to rely most heavily on volunteer contributions of time to conduct their operations, whereas professional associations, international organizations, and development and defense of rights organizations rely almost exclusively on paid labor.
19 The fields have been collapsed to allow for international comparison.

15
Figure 5: Sources of NPI value added by activity area in 2002 (percentage)
2. Distribution of NPI Employment by Field The composition of the Brazilian nonprofit sector can also be analyzed in terms of the distribution of the workforce. This approach provides an alternative picture of the level of effort being put into the various fields because it treats all workers equally rather than taking account of the wages paid in different fields. Viewed this way, as shown in Figure 6 below, education remains the largest component of the Brazilian nonprofit sector, but its relative scale is considerably less prominent. On the other hand, the relative scale of the culture and recreation and social services components of the Brazilian nonprofit sector expand considerably. Put somewhat differently, as shown in Figure 6 below, the predominantly service functions of the nonprofit sector in Brazil—education and research, social services, and health—engage about 52 percent of the total nonprofit workforce while the expressive functions—culture and recreation, religion, labor and business representation, and advocacy —occupy about 48 percent of workers. Figure 6: Workforce distribution by field, Brazil (2002)
80%
90%
34%
97% 95%
70%
89% 91% 89%
17%
64%
27%
9% 6%4%
3%7%
3% 4% 3% 3% 6%
0%
10%
20%
30%
40%
50%
60%
70%
80%
90%
100%
TOTAL Professional associations
Religious organizations
International Development & defense of rights
Social services Health Education & research
Culture & recreation
Production and Import taxes Volunteer “remuneration” Employee remuneration
Source: IBGE/National Accounts 2002
Professional associations,
labor unions, 4%
Advocacy**, 10%
Social services, 13%
Health, 14%
Religion, 14%
Culture & recreation, 20%
Education*, 25%
* Including foundations

16
Viewed in this way, the composition of the NPI sector in Brazil appears much more similar to the average for the 41 countries on which data are available. The one major exception, as Figure 7 shows, is the relatively smaller component of the Brazilian nonprofit workforce engaged in social service activities compared to the international average. What these data suggest is that the Brazilian nonprofit sector may be somewhat more heavily oriented toward what might be considered elite functions (higher education and culture) than service to the poor, a pattern evident in a number of other countries as well Figure 7: Workforce distribution by field, 41 countries
Education*, 21%
Social services, 20%
Culture & recreation, 17%
Advocacy**, 14%
Health, 12%
Religion, 7% Professional associations,
labor unions, 5%
Other, 4%
* Including foundations;** Including community development;

17
IV. The Revenue Structure of Brazil’s Nonprofit Sector
The total nonprofit sector revenue in Brazil was about 76.6 billion Real in 2002, including the imputed value of volunteer time. Nonprofit revenue is derived from fees for services provided (market output), income from government, payment of membership dues, and private donations, or transfers, to the sector. Figure 8 shows the basic composition of the NPI sector’s total revenue, as presented in the CNPJ files and as reflected in the satellite account’s production, primary income and secondary distribution of income accounts. Figure 8: Composition of Brazilian nonprofit institutions' funding sources
Nearly half of NPI funding is self‐generated through the sale of goods and services and property income (44 percent and 5 percent respectively).20 Included here are tuition payments to private schools and fees paid to medical facilities. Philanthropic transfers from households and businesses account for another 27 percent of nonprofit institution revenue, transfers from units of government (federal, state, and municipal) account for another 5 percent, and other transfers (assumed to be membership dues) are 12 percent. 21 The imputed value of volunteer time is valued at 7 percent of nonprofit revenue and can properly be considered another form of private transfer. This picture of the structure of nonprofit organization finance in Brazil is somewhat blurred, however, by the SNA convention of treating government contracts and reimbursement payments as market sales instead of part of government support. Because of the importance of government funding to the revenue base of nonprofit organizations in many countries, the UN NPI Handbook recommends pulling government contracts and reimbursement payments out of market sales and combining them with
20 The fact that fees and charges comprise such a large share of the income of NPIs in Brazil may explain why the size of the NPI sector in this report is so much greater than that provided in the regular SNA reports. Under SNA 1993 rules, those NPIs that receive more than 50 percent of their income from the sale of goods and services are considered to be market NPIs and are classified to the corporate sector of the SNA rather than the Nonprofit Institutions Serving Household (NPISH) sector, which is the only place that NPIs show up in the standard accounts 21 It has not been possible to identify financial transfers from abroad for this study in a consistent manner.
Market output44%
Property income5%
Government transfers
5%
Private philanthropy
27%
Other transfers12%
Value of Volunteering
7%

18
government grants in the NPI satellite account to provide a full picture of financial flows from government to NPIs. Unfortunately, no such overall picture of government support to nonprofit institutions is available for Brazil. However, it is known that Brazil has a sizable government health insurance plan, the Sistema Único de Saúde, that delivers substantial reimbursement to nonprofit health providers. If we assume that one half of the reported market sales of health services by nonprofit health providers in Brazil comes from this government health insurance program, this would boost the government share of nonprofit organization income in Brazil from 5 to 9.8 percent.
Table 2 compares the revenues of Brazilian nonprofit institutions, so adjusted, to those of other countries that have completed a “satellite account” on the NPI sector in accord with the UN NPI Handbook. For this comparison, however, the Brazilian data have been reconfigured to be consistent with the usage in the Handbook. In particular, as mentioned above, one half of the reported market sales of health services by nonprofit health providers in Brazil has been assumed to come from the government health insurance program and has been grouped with government transfers to provide a full picture of government support to the sector, the value of volunteering has been grouped with private philanthropy, and fee income has been correspondingly reduced.22
Reconfigured in this way, several important conclusions emerge from Table 2 regarding the funding
of Brazil’s nonprofit institutions. In the first place, the fee portion of nonprofit income in Brazil is on a par with the 8‐country average (43.9 percent vs. 42.9 percent). Secondly, the government share of nonprofit income in Brazil, even after including the reimbursements paid to health providers, accounts for only 9.8 percent of total income compared to the eight‐country average of 32.3 percent.23 Finally, the private philanthropic share of nonprofit revenue in Brazil is higher than the eight‐country average, though this may be due in important part to the inclusion of the value of volunteer time in the Brazilian private philanthropy data. Table 2: Shares of total NPI revenue, by source, Brazil vs. other “Handbook countries”
Czech New United
Australia Belgium Canada Republic Japan Zealand States Brazil 8‐country
1999 2001 2000 2004 2004 2004 2003 2002 Average
Fees and charges 47.20% 33.40% 36.10% 29.30% 55.90% 45.60% 51.70% 43.90% 42.90% Government payments 23.90% 50.20% 44.80% 49.90% 35.40% 6.40% 38.10% 9.84% 32.30% Private philanthropy 28.90% 15.30% 19.10% 20.70% 8.70% 44.30% 10.20% 33.78% 22.60% Other 0.00% 1.10% 0.00% 0.00% 0.00% 3.60% 0.00% 12.48% 2.10%
A Closer Look at Donations to the Sector As noted in Figure 8, 27 percent of nonprofit income is derived from private philanthropy (i.e. private transfers or donations exclusive of volunteer time), whereas the majority (66.9 percent) is derived from membership fees and the sale of goods and services. 24
22 The estimate of United States nonprofit income presented here makes a similar adjustment to make it consistent with UN NPI Handbook treatment. 23 It appears that the government payments in New Zealand may not have been adjusted to include government contracts and reimbursement of purchases from nonprofits. The 8-country average would likely be higher if this adjustment were made. Also, the value of volunteer time is included in the Brazil data as “private philanthropy,” as recommended in the UN Handbook, but not all countries reported here had volunteer data available. 24 Membership contributions are treated as in the SNA as donations from individuals in all fields, except in the case of professional associations, where they are treated as commercial production, together with the sale of goods and services; most of their income was

19
Used in the production of goods and services, transfers are obligation‐free resources that reflect the level of business and household philanthropy. Figure 9 shows the percentage of private resource transfers received by NPIs in each activity area. Religious organizations and development and defense of rights combined receive over half (53 percent) of all donations made to the nonprofit sector. As noted earlier, the inclusion of political parties in the development and defense of rights field during an election year may have inflated these figures in 2002. Figure 9: Percentage of private resource transfers received in each activity area by Brazilian NPIs in 2002
obtained from these fees. The rationale for treating membership contributions as fees is that most of the services provided by these organizations have economically significant prices, so membership fees should be treated as sales. As noted in Figure 10, this may explain why 79 percent of donations to professional associations come from “other” sources.
Culture & arts, 6.9%
Education & research, 9.0%
Health, 8.4%
Social services, 12.2%
Development & defense of rights,
31.6%
International,0%
Religious organizations
24.4%
Professional associations,
7.4%
Source: IBGE/Pilot NPI Satellite Account, 2002.

20
V. Gross Savings and Investment
Gross savings and capital transfers represent the resources available to NPIs for investment in fixed capital, which account for approximately 19 percent of the NPIs’ contribution to GDP. As shown in Table 3, where the balance is positive, as in the case of social services, development and defense of rights, and professional associations, NPIs are in a position to lend funding, which they may do by building up deposits in banks or other financial institutions. Where the balance is negative, NPIs are in a borrowing position. In the case of Brazil, all capital transfers are made by government, which produces different outcomes in each field. Table 3: Gross savings by NPI activity area in descending order, 2002 (R$1,000)
Activity area
Gross saving
Capital transfers
Gross fixed capital formation
Net lending (+) /borrowing (‐)
Culture & arts 48,865 18,717 556,124 ‐488,542Education & research 1,447,846 155,540 1,739,781 ‐136,396Health ‐247,928 182,189 840,444 ‐906,183Social services 1,168,873 60,801 486,612 743,062Development & defense of rights 2,676,319 202,006 1,139,550 1,738,775International 1,224 0 1,312 ‐88Religious organizations 1,009,331 0 1,539,093 ‐529,763Professional associations 581,291 10,578 372,364 219,505
TOTAL 6,685,818 629,831 6,675,279 640,371
Source: Neide Beres, NUNV. Based on data from the System of National Accounts ‐ Brazil ‐ 2002

21
Conclusion This pilot satellite account provides a glimpse into the true dimensions of the nonprofit sector in Brazil’s economy. The partial and fragmentary view of the nonprofit sector provided by traditional national accounting methods has underestimated the role of the nonprofit sector in Brazil, and therefore restrained the development of a strategic interpretation of the sector’s economic position. Implementation of the guidelines outlined in the UN NPI Handbook has provided a clearer picture of the Brazilian NPI sector, revealing a nonprofit sector that is larger than previously estimated, employs and engages a significant number of paid and volunteer workers, and generates its financial resources from a diverse range of sources and is thus not dependent on donations as a primary source of revenue. Though smaller on average than the nonprofit sectors of other countries, the sector is without doubt an important force in the Brazilian economy. Some key findings include: • In 2002, education and research, and defense of rights organizations were the two largest fields in
the sector, however, it must be noted that the inclusion of political organizations in the latter field during an election year likely had an effect on the apparent size of that field.
• Volunteer workers represent a small but important part of the nonprofit workforce, especially to religious organizations.
• The social service field is significantly smaller in Brazil than in most other countries, suggesting a somewhat limited ability of the nonprofit sector in Brazil to provide aid to the poor and disadvantaged.
• The field of culture, sports, and recreation has been affected by recent policy decisions that created government incentives and financing for organizations in this field (see Annex 6.1). These policy developments, along with Brazil’s hosting of major sporting events in recent years, and the upcoming 2016 Olympic Games, should alter the rank of this field in the future;
• Government plays a considerably smaller role in the financing of nonprofit activity in Brazil than is the case on average in the other countries on which comparative data are available. This may help to explain the limited scale of the social service component of the Brazilian NPI sector.
Taking an internationally comparative, systematic approach to measuring the nonprofit sector in Brazil has allowed us to gain a clearer picture of the role of the country’s associations, foundations, social organizations, public‐interest organizations, non‐governmental organizations, political parties, and more. More importantly, the pilot satellite account presented here demonstrates that production of an official NPI satellite account within IBGE is a feasible endeavor that adds value to Brazil’s understanding of its economy.

22
Appendix 1: Data from the Satellite Account on Non-Profit Institutions In Brazil
This Appendix presents the basic Satellite Account on Nonprofit Institutions in Brazil, embracing the following specific SNA accounts:
a) production accounts; b) generation of income accounts; c) allocation of primary income accounts; d) secondary distribution of income accounts; e) use of income accounts; and f) creation of capital accounts.
Nonprofit production, consolidated in the production and income generation accounts, highlights the effort achieved by NPIs.
• Non‐market production is measured by NPI operating expenditures, primarily labor costs. • Market production is measured by the sale of goods and services.
The Value Added (VA) is the sum of labor expenditures, both paid and volunteer, plus taxes on production. Using this method, NPI operating surplus is zero (not a mandatory rule) that will certainly be revised when more analytical data become available. Donations and resource transfers received by NPIs, reflected in the Secondary Distribution of Income Account, represent almost the total of their gross available income, a balance that makes it possible to support final consumption, as measured by their non‐market production. The available balances in gross savings in each activity area are also shown in Table 1. Data for the satellite account are given in Table A‐1, both in the aggregate and for each of the fields.

23
TOTAL Professional associations
Religious organizations
International Development & defense of rights
Social services Health Education & research
Culture & Arts Accounts Culture & arts Education & research
Health Social services Development & defense of rights
International Religious organizations
Professional associations
TOTAL
1 ‐ Production account Production 3 790 220 19 307 522 13 266 848 6 949 149 16 113 356 17 569 11 154 230 6 032 435 76 631 330 Market production 647 615 14 388 490 8 790 887 1 363 934 4 657 753 3 343 2 397 281 4 849 748 37 099 051 Non‐‐market production 3 142 605 4 919 031 4 475 961 5 585 215 11 455 603 14 227 8 756 949 1 182 687 39 532 279
42 401 825 4 171 972 5 267 970 9 351 10 337 016 4 534 013 6 960 191 8 762 962 2 358 351 Intermediate consumption 0 0 0 0 0 0 0 0 0 34 229 504 1 860 463 5 886 260 8 219 5 776 340 2 415 137 6 306 657 10 544 559 1 431 869 Value Added 0 0 0 0 0 0 0 0 0
2 ‐ Generation of income account 0 0 0 0 0 0 0 0 0Value Added 1 431 869 10 544 559 6 306 657 2 415 137 5 776 340 8 219 5 886 260 1 860 463 34 229 505
27 414 827 1 679 315 2 018 545 7 990 5 508 920 1 689 000 5 609 079 9 623 350 1 278 627 Employee remuneration 0 0 0 0 0 0 0 0 0 5 801 857 42 647 3 762 163 0 29 592 654 836 592 715 655 965 63 939 Volunteer “remuneration” 0 0 0 0 0 0 0 0 0 1 012 821 138 501 105 551 229 237 829 71 300 104 863 265 244 89 303 Production and Import taxes 0 0 0 0 0 0 0 0 0
0 0 0 0 0 0 0 0 0 Gross operating surplus 0 0 0 0 0 0 0 0 03 ‐ Allocation of primary income account 0 0 0 0 0 0 0 0 0Gross operating surplus 0 0 0 0 0 0 0 0 0Property income received 82 940 714 261 323 154 1 278 681 1 016 451 502 269 340 271 313 3 956 641 Interest 82 940 714 261 323 154 1 278 681 1 016 451 502 269 340 271 313 3 956 641
0 0 0 0 0 0 0 0 0 Property income paid 0 0 0 0 0 0 0 0 0 0 0 0 0 0 0 0 0 0 Interest paid 0 0 0 0 0 0 0 0 0
3 956 641 271 313 269 340 502 1 016 451 1 278 681 323 154 714 261 82 940 Gross balance of primary incomes 0 0 0 0 0 0 0 0 04 ‐ Secondary distribution of income account 0 0 0 0 0 0 0 0 0Gross balance of primary incomes 82 940 714 261 323 154 1 278 681 1 016 451 502 269 340 271 313 3 956 641
195 792 38 318 12 111 15 47 741 22 863 38 128 27 756 8 859 Current taxes on income and wealth 0 0 0 0 0 0 0 0 0 195 792 38 318 12 111 15 47 741 22 863 38 128 27 756 8 859 Corporate income tax 0 0 0 0 0 0 0 0 0
0 0 0 0 0 0 0 0 Other current transfers 3 117 389 5 680 372 3 943 007 5 498 270 13 163 212 14 964 9 509 052 1 530 983 42 457 248 0 0 0 0 0 0 0 0 Federal transfers 52 139 467 218 265 767 14 297 467 872 0 0 124 628 1 391 921 0 0 0 0 0 0 0 0 State transfers 74 785 405 587 627 918 234 066 450 428 0 0 20 908 1 813 692 0 0 0 0 0 0 0 0 Municipal transfers 38 093 76 986 234 258 201 581 64 431 0 0 3 787 619 136 0 0 0 0 0 0 0 0 Private Sector transfers 153 524 46 871 583 507 550 481 2 482 473 4 756 3 591 286 124 840 7 537 736 0 0 0 0 0 0 0 0 Household transfers 1 647 753 2 464 318 710 278 2 200 763 6 483 268 8 348 1 358 285 0 14 873 012
Imputed transfers by households 63 938 655 967 592 715 654 835 29 592 0 3 762 163 42 647 5 801 857 0 0 0 0 0 0 0 0 Other transfers 1 087 158 1 563 424 928 565 1 642 247 3 185 148 1 860 797 317 1 214 173 10 419 894
46 218 098 1 763 978 9 766 280 15 450 14 131 922 6 754 088 4 228 033 6 366 877 3 191 470 Gross disposable income 0 0 0 0 0 0 0 0 05 ‐ Use of income account 0 0 0 0 0 0 0 0 0Gross disposable income 3 191 470 6 366 877 4 228 033 6 754 088 14 131 922 15 450 9 766 280 1 763 978 46 218 097
39 532 279 1 182 687 8 756 949 14 227 11 455 603 5 585 215 4 475 961 4 919 031 3 142 605 Final consumption expenditure 0 0 0 0 0 0 0 0 0 6 685 819 581 291 1 009 331 1 224 2 676 319 1 168 873 ‐ 247 928 1 447 846 48 865 Gross saving 0 0 0 0 0 0 0 0 0
6 ‐ Capital accountGross saving 48 865 1 447 846 ‐ 247 928 1 168 873 2 676 319 1 224 1 009 331 581 291 6 685 818
6 675 279 372 364 1 539 093 1 312 1 139 550 486 612 840 444 1 739 781 556 124 Gross fixed capital formation 0 0 0 0 0 0 0 0 0Capital transfers 18 717 155 540 182 189 60 801 202 006 0 0 10 578 629 831 Federal transfers 14 884 65 572 151 950 267 34 138 0 0 2 223 269 034 State transfers 3 085 83 218 28 586 57 031 162 884 0 0 7 831 342 635 Municipal transfers 748 6 750 1 653 3 503 4 984 0 0 524 18 162 Other capital transfers 0 0 0 0 0 0 0 0 0
640 371 219 505 ‐ 529 763 ‐ 88 1 738 775 743 062 ‐ 906 183 ‐ 136 396 ‐ 488 542 Net lending (+)/borrowing (‐) 0 0 0 0 0 0 0 0 0
Table A‐1. Non‐Profit Organizations' Satellite Account, Brazil ‐ 2002 [in R$1,000]

24
Appendix 2: Coverage and Classification
This Appendix provides additional detail on the coverage of entities included in this satellite account report and the classification used to differentiate these entities. 1.1: Background The recommendations adopted in carrying out this pilot satellite account can be found in the United Nations Handbook on Non‐Profit Institutions in the System of National Accounts.25The UN NPI Handbook uses an approach similar to the Comparative Nonprofit Sector Project, and thus the data from both products are often comparable. 1.2: Selecting activities: classification of non‐profit activities adopted in this study; The concepts used in this study appear in the United Nations Handbook on Non‐Profit Institutions in the System of National Accounts. The adjustments that were needed to develop the study are presented below. They are the result of the interpretation of the files of the National Registry of Legal Entities ‐ CNPJ. The first table shows the CNPJ’s selection of activity codes and the second shows the conversion between the classifications proposed for the NPIs and the selection of activities of the CNPJ.
25 United Nations (2003).

25
Activities Selection CNPJ ‐ National Registry of Legal Entities : File of Immune and Exempt
Organizations Order number
Code Name
1 73105 Research and development of physical and natural science 2 73202 Research and development of social and human science 3 80110 Pre‐school education4 80128 Primary education5 80217 Secondary education – General6 80226 Vocational and technical education7 80306 College and university8 80926 Continuing education9 80934 Continued education or professional learning10 80942 Distance education11 80950 Special education12 85111 Hospital care activities13 85120 Emergency care activities14 85138 Ambulatory care15 85146 Complementary diagnosis and therapeutic activities16 85154 Activities of other health professionals17 85162 Other activities related to health care18 85316 Social services with accommodation19 85324 Social services without accommodation20 91111 Business activities21 91120 Professional activities22 91200 Trade Unions 23 91910 Religious activities24 91928 Political activities25 91995 Other activities, not previously specified26 92312 Theater, musical and other artistic activities 27 92320 Concert rooms’ management28 92398 Other concert’s activities, not previously specified29 92517 Library and archival activities30 92525 Museum, preservation of historical sites’ activities31 92533 Botanic garden, zoos and parks activities32 92614 Sports activities33 92622 Other activities related to leisure34 99007 International organizations and other extraterritorial institutions

26
1.3: Classifications and definitions of Non‐profit activities in Brazil The UN NPI Handbook recommends countries use the International Classification of Non‐Profit Organizations (ICNPO) to classify the activity areas of NPIs. The ICNPO proposes to structure the classification of NPI activities into 12 categories:

27
1. Culture and recreation 2. Education and research 3. Health 4. Social services 5. Environment 6. Development and housing 7. Law, advocacy and politics 8. Philanthropic intermediaries and
voluntarism promotion 9. International 10. Religion 11. Business and professional associations,
unions 12. Not elsewhere classified

28
The ICNPO was modified for use in this pilot satellite account in order to correspond with the National Classification of Economic Activities (CNAE), which is used by IBGE and all other public organizations of administrative record and supervision in Brazil. The modified classification of NPI activities in Brazil is outlined below. The eight categories comprise the subsectors of the satellite account. Having eight instead of twelve categories may complicate the analysis of individual groups and the sector as a whole, but has the advantage of preserving the original records.
Modified ICNPO Classification ‐ Brazil Culture, Art, & Sports
theater; museums; music; educational television; art and literature; venue management; botanical and zoological gardens, national parks and reserves; libraries and archives; and other related activities. In addition, this classification includes sports activities, social clubs, and other leisure activities
Education & Research
preschool; primary education; general educational media; indigenous education; supplemental education; continuing education and trade school; distance learning; special education; and higher education. In addition, this classification includes research and development in the humanities and in the physical, natural, and social sciences; and community, faith‐based, and philanthropic organizations
Health hospital care; urgent and emergency care; outpatient care; diagnostic and therapeutic care; and other healthcare‐related activities
Social Services social service activities, with or without accommodation Development and Defense of Civil Rights
activities of political organizations and other related, unspecified activities. This second group includes environmental‐defense groups, homeowners and residents associations, community centers and associations, workforce training and income generation, and minority‐ and group‐rights activism
International Organizations
activities of international organizations and other foreign activities
Religious Organizations
activities of religious organizations
Trade and Professional Organizations
activities of business, trade, professional, trade union, and guild organizations.

29
Appendix 3:
Sources, files and variables used in constructing the pilot model of the NPI Satellite Account
Summary of Data Sources
Variable Source Organization Notes
Social purpose CEMPRE IBGE Non‐profit sector size
Social purpose School census MEC
Employed people CEMPRE IBGE Non‐profit sector size
Employed people PNAD IBGE
National Survey by Household Sampling (does not discriminate for profit or nonprofit organizations)
Employed people School census MEC Ocupation – non‐profit sector
Employed people AMS IBGE e MS Ocupation – non‐profit sector
Employed people CNPJ MF
Intermediate consumption
CNPJ MF Federal
Resource Secretary
Government transfers
SIAFI and State and local balance sheets
MF State Geral Balance
Legal form CEMPRE Education census Disaggregated information
Legal form CNPJ MF Aggregated information
Legal form School census MEC
Legal form AMS IBGE e MS
Volunteers Study ‐ 1998 (Leilah Landim & Scalon) Donations and volunteer work in Brazil
ISER
Area of activity CEMPRE IBGE
Area of activity CNPJ MF
Area of activity PNAD IBGE
Salaries PNAD IBGE
Resource source and use
CNPJ MF
Balance sheets accounts
CNPJ MF

30
2.1 Data Sources 2.1.1 CEMPRE ‐ Central Registry of Enterprises Frequency ‐ annual Source Institution ‐ IBGE ‐ Brazilian Institute of Geography and Statistics. Nature ‐ Institutional registration Description: The contents of CEMPRE comprises registration data from all economic and legal persons formally incorporated in the national territory, regardless of the activity performed or legal nature. The CEMPRE is comprised of about 8.8 billion addresses, corresponding to 8 million organizations formally registered with CNPJ – the National Registry of Legal Entities. Approximately 90 percent of this volume consists of businesses, and the remaining 10 percent of public agencies and nonprofits that have registered with the CNPJ. CEMPRE is updated annually, and its data cross‐checked with information from other registries, such as: RAIS, the Administrative Registry of Social Information, which is administered by the Ministry of Labour; and CNPJ – the National Registry of Legal Entities, administered by the Ministry of Finance’s Secretary of Federal Revenue. The identification of the principal activity accompanies the CNAE ‐ National Classification of Economic Activities. Variables from CEMPRE include:
a) legal entity name; b) legal code; c) classification of the main activity; d) full address; e) brand name/institutional alias; f) employed personnel; and g) salaries and other compensation received.
Use ‐ The CEMPRE data allowed the quantification of only some local units for NPI classification. In the classification structure of CEMPRE, the identification code by legal nature for private non‐profit is 3, which, in 2002, could be further classified into fourteen (14) sub‐groups, broken down as follows: 308‐5 Registration and Notary Services (Archives) 304‐2 Social Organization 305‐0 Civil Society Organization of Public Interest (Oscip) 306‐9 Other Foundations Held with Private Funds 307‐7 Autonomous Social Service 308‐6 Condominium Associations 309‐3 Executing Unit (Direct Funding Program in School) 310‐7 Commission of Prior Conciliation 311‐5 Arbitration and Mediation Organization 312‐3 Political Party 313‐1 Trade Union 320‐4 Brazilian Subsidiary of a Foreign Foundation or Association 321‐2 Foundation or Association Domiciled Abroad 399‐9 Other Types of Associations

31
The breakdown of section 3 into sub‐groups allows us to identify some groups of organizations that do not meet the definitional criteria of nonprofit institutions. The following codes were excluded from the database:
Codes Rationale for exclusion 307‐7 Autonomous Social Service although legally private they were created by
federal law and receive compulsory contributions. Such institutions fall under the purview of public administration
309‐3 Executing Unit (Direct Funding Program in School) they are constituted in administrative units, and do
not manage resources 310‐7 Commission of Prior Conciliation311‐5 Mediation and Arbitration 308‐5 Registration and Notary Services (Archives)
they do not meet the definition of an NPI 308‐6 Condominium Associations The number of units excluded according to their selected legal status 2002 are as follows:
Legal Status Quantity
Condominium associations 120.331 Notaries 8.428 Mediation and Arbitration organizations 91 Prior conciliation commissions 28 Cons. Fdos and Municipal consortia 1.155 Cemeteries 184 Caixas Escolares e Similares26 School Boxes and Similar 62.438 Out. não classificados 22.715 Total 215.370
Source: FASFIL/IBGE
For other codes, the research was mainly used to provide the number of local organizations according to their legal status and, for any consultations on economic activity. 2.1.2 CNPJ – National Registry of Legal Entities Frequency ‐ annual Source Institution ‐ Ministry of Finance’s Secretary of Federal Revenue Nature ‐ institutional taxation enforcement Description ‐ Updated annually by the Ministry of Finance’s Secretary of Federal Revenue. The file is composed of five (5) categories of taxpayers, and in addition to complete cadastral identification and activity, includes the balance sheet information of each entity, with transcription of statement of income and position of assets and liabilities, and the relevant
26 The caixas escolares are legal, private and nonprofit institutions, whose primary goal is to manage the financial resources of the schools, from the Federal, State and Municipal governments, and those collected by the schools themselves.

32
details required for the calculation of legal entity income tax. The reporting categories are the following:
a) those subject to the calculation of real profits: b) those subject to the calculation of presumed profits; c) those subject to the calculation of arbitrated profits; d) those subject to simple calculations; and e) those that are tax immune and tax exempt.
Primarily in the case of those that are tax immune and tax exempt, constituent units of the NPI database are included. Institutions that eventually may be inserted into other categories, as occurs in the case of higher education, where almost half of private institutions choose to declare using the real profits calculation – those subject to the calculation of real profits ‐ will be highlighted and integrated into the NPI database. The CNPJ’s file is essential for quantifying NPIs through two approaches by activity: ‐ Number of units per activity; ‐ Spreadsheet results of the balance sheet exercise by activity. The number of units per activity allows one to compare the CEMPRE database with the units reporting to the Secretary of Federal Revenue. Individual comparisons are not possible, due to the fact that the CNPJ’s file is made available without identification information. The data provided illustrate the results for the following groups, according to the activity of the entity: Immune ‐ Social Services, Educational, Employers’ Associations and Unions
Exempt ‐ Civil Association, Closed Welfare Programs, Cultural, Association of Savings and Loan, Philanthropic, Recreational, Scientific, Unknown, Other
For the year 2002, the micro‐data from each group of informants by activity were calculated and tabulated in a matrix, in which the columns represented the legal classifications and the lines corresponded to the selection of codes extracted from CNAE ‐ National Classification of Economic Activities. The rows in the report still allowed for classification according to balance sheet variables. Thus, it was possible to associate the classification of legal status with the organization’s activities and the balance sheet. In this way, it was possible to break each institution down according to its different activities, when having more than one. The advantage of this approach is that the result provides more homogeneous data for each classification code27. The spreadsheets of the file’s balance sheets of the immune and exempt were used to obtain aggregate production and shipments. The first is comprised of eleven (11) variables (flow) of resources and expenditures, according to activity, with the following structure: 27 Preliminary examination in the files made available by the Federal Revenue Secretary for 2003 showed that this treatment was not implemented for that year. That is, for each year will be necessary to review and reassess the procedures.
33
Sheet 1: Origin and Application of Resources Origin:
Contributions Revenue from Sale of Goods or Delivery of Services Income from Fixed Income Financial Investments Net Earnings from Financial Investments in Equity Markets Donations and Grants Other resources
Application:
Wages, Gratuities and Other Payments, including Charges for Social Insurance IR Withholding on income from Fixed Income Financial Investments IR Withheld or Paid on Net Income Earned on Equity Markets Taxes, Duties and Contributions Maintenance costs Other Expenses
Use ‐ Descriptions of each variable are available in the Ministry of Finance’s Secretary of Federal Revenue’s Manual of Immune or Exempt Completion, and will be consulted to frame the variables in the NPI satellite account. The archive is one of the principal sources for the measurement of VA (value added) and IC (intermediate consumption), and in addition, allows for the quantification of sales revenue of the NPIs, contributions, amount of donations and transfers, and taxes paid to government for every NPI activity. Worksheet 2: Statement of Heritage The key piece of data in this worksheet is that of Fixed Assets, whose accounting process is cumulative and takes into account the purchase price of assets during the year. The annual variance (reference year value minus previous year’s value) allows us to measure the additions, or Formation of Fixed Capital, which occurred during the year, as well as the prices registered in the accounts. The composition of the variables in the account is as follows:
Land Buildings and Construction Equipment, Machinery and Industrial Facilities Vehicles Furniture, Appliances and Commercial Facilities Mineral Resources Planting and Reforestation Legal Rights for Exploitation of Forests Other Fixed Assets Monetary Correction ‐ Difference IPC / BTNF Correction Special Cash (‐) Depreciation, Amortization and Depletion Quotas
2.1.3 PNAD ‐ National Sample Survey of Households Frequency ‐ annual Source Institution ‐ IBGE ‐ Brazilian Institute of Geography and Statistics.

34
Nature ‐ domiciliary Description ‐ The National Household Survey is conducted annually by IBGE and explores housing, income and employment, demographic and educational information, and at variable intervals, through further research, other demographic, social and economic issues28. The PNAD is conducted through a sample of households and has coverage over the entire national territory, except the rural area of six Ufs located in the Amazon region, corresponding to 2.1 percent of the population. In 2002, PNAD surveyed 129,705 households across the country. Variables ‐ including questions about features of work and income, the questionnaire is constructed with the aim of extracting information about those who are 10 years of age or older and claim to work, and his or her income during the reference week. The set of variables selected to achieve that purpose was the following:
a) If he or she worked regularly during the reference period b) What was his or her main occupation c) If he or she had a job, what was his or her secondary job and number of hours
worked d) What was the main activity of the enterprise where he or she worked e) If the activity was a private sector one f) What was his or her position in the primary or secondary occupation g) If the working day was between 8:00 hrs/22:00hrs. h) If he or she had worked with or without a signed work permit i) What was his or her monthly income (of both the primary and secondary
occupation) j) It he or she worked without pay
Use ‐ The determination of these variables represents a first step in the process of understanding the NPI labor database. Although for some activities that figure is practically definitive, for the education and health units, which make available specific sector studies, it represents only a first filter. However it is a piece of information that narrows the possibilities and focuses the complementary research on areas where additional research is needed to build the final product, since the PNAD does not discriminate between NPI and projects. The data distinguish between employees engaged in activities regarded as typical, or those that shelter NPIs, by taking into account the formality of the working relationship with the following factors:
a) If they have a signed work permit; b) If they do not have a signed work permit, but are paid; c) It they are unpaid.
For each position, and each area of activity, it is possible to measure the standards of pay and number of hours worked. The salary is the component of the value added, and the hours worked are indicators of treatment of the secondary occupation.
28 This survey could be used to carry out future research on volunteer work.

35
The classification of activities adopted in the investigation is essential to make the connection between the household survey and cadastral surveys. Regarding this point, the CNAE ‐ National Classification of Economic Activities makes available additional resources ‐ the CNAE‐Domiciliary, an instrument derived from the NACE classification for use in household surveys. The structure adapted for household surveys maintains levels of section and division (4 digits), including codes, that are consistently compatible. At the next level, classes have to be regrouped where the details of the activity were not adequate to be applied to household surveys. The selection of activities and their relation to ICNPO is included at the end of this Annex. The CNAE Domiciliary was first used in the 2000 Census. It represented a significant change from the classifications previously used for the census and other household surveys, and that also were also used on the first attempt to measure the workforce of non‐profit institutions, in 1995. 2.1.4 INEP / MEC ‐ School Census Frequency ‐ annual Source Institution – the Ministry of Education’s Anisio Teixeira National Institute for Educational Research Nature ‐ Statistical institutional sector census Description ‐The School Census seeks to detail the range of educational information needed to identify problems and to help formulate public education policies. The surveys are constructed to capture the two principal areas of education: preschool, primary and secondary; and tertiary. For the identification of private non‐profit units in the first group, the sample focused on the categorization of the units, selecting faith‐based, community and philanthropic schools, or private units that are not fully limited their own resources. For the group of units of higher education, despite equal opportunity, the total number of private units was considered29. For both groups, only schools active at the reference data were considered, and extinct or non‐functioning schools were excluded. Groups contain units with the following activities, namely:
1) Pre‐school, Primary and Secondary Education : Infant, literacy class, elementary (1st through 8th grades), middle and normal, adult and youth education, training, indigenous and special education
2) Tertiary Education: Undergraduate and graduate studies Includes universities, medical centers, integrated schools, colleges, schools and institutes and centers of technological education30.
Variables ‐ other variables in the questionnaire that are used for this study are the number of persons employed and enrollments. According to the level of education, the definitions are:
Personal Employed:
a) Pre‐school, Primary and Secondary Education‐ included professors and administrative staff (administrators, cooks, cleaners, security and transportation
29 The data obtained allow quantification of each group, both those that are and are not recorded in the CNAS ‐ National Council of Social Assistance, and this distinction was not considered for this study. 30 All private universities were included in the universe of nonprofit institutions. All receive tax incentives, and whatever the fiscal framework, are also subject to compliance with policies established by the government.

36
staff);
b) Tertiary Education: included professors and administrative staff (librarians, laboratory staff, security staff, cleaning staff)
Enrollment: Register total enrollment until June 30 for the reference year.
Use ‐ the annual census database maintained by INEP/MEC accredits the investigation as a priority in the classification of NPIs according to level of education and number of employed persons. The educational activity has primacy over other sources31. 2.1.5 MAS ‐ Medical Health Care Frequency ‐ irregular. The last three were developed in the years 1992, 1999 and 2002. Source Institution ‐ IBGE ‐ Brazilian Institute of Geography and Statistics, Ministry of Health Nature ‐ Statistical institutional sector census Description ‐ The research on medical and sanitation assistance provides all information related to the provision of health services in Brazil. It was held for the fifth time in 2002. Its coverage encompasses all health units, public and private. The classification adopted for the researched activities primarily focus on the facilities available according to healthcare needs, and are divided into the following:
a) Sites without hospitalization b) Sites with hospitalization c) Sites for diagnosis and therapy
Variables ‐ The identification of NPIs in all the variables studied is possible in the administrative sphere (public and private) that for the private sector, is divided into two: for profit and non‐profit (code 05). For this segment it can be identified:
a) Health facilities according to rank b) Operating condition c) Administrative sphere d) Regime (with and without hospitalization) e) Types of activities and services f) Employed staff g) Equipment and existing beds
Use – Research with census character, its data have priority over the others on the sector regarding the number of units and employed persons. For the purpose of unifying concepts, considered personnel employed in typical health occupations (doctors, nurses, nutritionists, etc), and those of support activity (administration, transportation, cleaning, security and feeding). Outsourced employees that perform activities in health units were also considered.
31 Note that for the year 2002, the comparison of the universities among the files of INEP and CNPJ was 99% consistent.

37
2.1.6 SIAFI ‐ Federal Government Financial Management System Frequency ‐ continuous Source Institution ‐ Ministry of Finance Nature ‐ federal administration’s accounting records Description ‐ SIAFI contains the record of transactions originating in the Federal Government. Following the rules of public accounting budget, expenses are recorded under the criterion of competence – budget expenditure committed (paid plus the amounts to be paid). In order to reconcile with the criteria of the System of National Accounts, and specifically with regard to the institutional sector "Public Administration", this concept was adopted. The coherence was obtained between the test criteria x competence by a process of balancing accounts.32 The economic variables selected in SIAFI (and in the State/Municipal government levels) represent the transfer of resources without requesting services to be performed by the NPIs – Foundations and Private Associations, specifically. In addition to the philanthropic transfers, the analysis of the government accounts showed the contracts and agreements made by the government specifically in the areas of Health and Education, mainly with the purpose of purchasing health and education services. In the education area, specifically in higher education, it was possible to identify the values applied by the federal government in the FIES ‐ Financing Higher Education, whose operation was done through loans to students for private colleges. In the healthcare area, however, it was not possible to identify if the units providing the services were for‐profit or NPIs. .
32 The State and Municipal government levels received the similar treatment to the Federal government, through annual survey on public administration maintained by CONAC - Coordination of National Accounts. The criterion "caixa" is adopted for the NPIs annual Income Tax declaration..

38

39
Appendix 4: Volunteers
In spite of the absence of current and comprehensive research on the topic, the inclusion of volunteers was based on the existing national quantitative research Donations and volunteering work in Brazil ‐ a survey.33 In this study, voluntary activities were defined as the "activities that people do without receiving payment in order to help institutions or persons other than relatives or friends." Volunteering figures concentrated on organization‐based volunteering, i.e., the portion of volunteering that is conducted for or through an organization. The same parameters noted in the original study were kept: including average hours per month donated to these services and their distribution among areas of activity. To project volunteer growth to 2002, it was assumed that volunteer work grew at the same rate as the growth of the population, i.e., about 1.5 percent. A replacement wage related to the salary of the activity the volunteer performed was used to estimate the value of the volunteer activity.
33 Landim and Scalon, 1998.

40
Appendix 5: Income and Expenses Transactions
1. Contributions from Associates or Syndicated ‐ registers the resources regularly received by
non‐profits from their associate and/or syndicated organizations, conditional to being a member or having some tie to the non‐profit.
2. Income from the Sale of Goods and Services ‐ receipts arising from the capacity to produce and sell products and services. The data comprise billing for goods and services sold, including the sums raised in campaigns and events for specific purposes. In Education and Health, the term includes income resulting from the following transactions:
a. Education ‐ annuities and services, including annuities from the Prouni program, student loans provided by public authorities for the purpose of supporting underprivileged students in private schools of higher education.
b. Health ‐ income resulting from fee‐based health services provided to the general population and receiving private clinic contracts by agreement with public authorities for health care given to users of the Sistema Único de Saúde (national health insurance).
3. Income from Fixed‐Return Investments ‐ interest on investments in investment funds held in the reference period.
4. Net Gain Acquired from Variable‐Return Investments –Net income from financial investments made in the stock market.
5. Donations and Subsidies ‐ philanthropic resources. This account does not separate the source of donations into public and private donors. This separation is obtained from the following files:
a. Private Donations ‐ private resources transferred to NPIs by families and private corporations; and
b. Subsidies ‐ transfers from federal, state, and federal government agencies without the exchange of goods or services.
6. Other Resources ‐ diverse resources received by NPOs, including loans from private international organizations.
7. Wages, Bonus, and Other Payments, including Payroll Taxes ‐ expenses from wage and salary payments, bonus, and payroll burdens. These expenses include vacation, December bonus, contributions to the national workers savings fund (FGTS), and national pension and unemployment insurance plans (PIS/PASEP).
a. PIS/PASEP ‐ contribution for the Social Integration Program. Monthly charge generated by use of paid employment and destined to the creation of workers’ funds (savings fund). For NPOs, the employer’s tax rate is 1 percent calculated on payroll
b. FGTS ‐ Guarantee Fund for years of service. Employers’ contribution to the national workers savings fund.
8. Withholding Tax on Fixed‐Return Investment Income ‐ record from the Income Tax ‐ Income Tax is levied on all types of fixed‐return investments in financial funds. The Income Tax is levied on income of any kind. The value highlighted refers to the amount levied on income from investments in financial investment funds.

41
9. Income Tax Withheld or Paid on Net Income Earned on Equity Market ‐ record of the income tax levied on the income from the stock market.
10. Taxes, Fees, and Contributions ‐ expenses from paying taxes on normal business activities, the production of goods and services, and assets property.
Note: NPIs are exempt from taxes on education, social services, donations of foreign products, and import taxes on machinery and equipment used for research. Likewise, NPOs do not pay the following taxes: the IPI tax on industrial products; COFINS contributions to social security; obligatory contributions to government trade associations; contributions to educational programs; and import and export taxes. The table below provides the exemption status of NPO vis‐à‐vis income, production, real estate, and other taxes.
Tax Levied on Exempt Organizations
CPMF ‐ provisional contribution on transmission of values, rights and credits
Owners of current accounts, loans, savings deposits and consignments, transactions or transmission of sums, credits, and rights of a financial nature
Charitable and social service organizations
IPTU‐ urban real‐estate tax Real property in urban areas Social and recreational clubs
ISS ‐ service tax Services to third parties Public performances, athletic competitions, and physical therapy
ITCD ‐ tax on inheritance and donations
Sale and transfer of estate Religious organizations
Tax on credit operations, money exchange, and insurances
Creditors —
11. Operating Expenses ‐ expenses for maintaining regular business activities, including
expenses for third‐party services, rent, utilities (electricity, water, and telephone), fuel, office supplies, etc.
12. Other Expenses ‐ includes loan payments and all other expenses not specified above.
13. Fixed Assets ‐ recorded accruals, except depreciation, of capital assets for production.
14. Depreciation, Amortization, and Depletion Rates ‐ a fixed asset account with a negative balance. Accounting register of expenses for creating reserves to replenish real property and equipment.
The analysis of the Satellite Account has taken into account Brazil’s context and compared the outcomes with national aggregate data (from the 2002 base year). The outcome of the productive process, consolidated in the production and income generation accounts, reproduces the effort achieved by the non‐profit organizations, in which the non‐market production of these organizations is measured by their operating and labor costs, while the sale of goods and services represents the market production. Consequently, the value‐added (VA) will be the result of labor expenses plus the tax payments on production. With this method, the operating surplus of the non‐profit organizations is zero, a procedure that will certainly be revised when more analytical data are available.

42
Appendix 6: Summary of Non-financial Variables of NPIs
1. Gross production value ‐ total value of goods and services produced by NPOs.
2. Non‐market production ‐ measured by costs, includes the value of intermediate consumption and salaries, and deducts the value of market production. Includes members’ contributions in the activities of Defense of Rights and Professional Associations.
3. Intermediate consumption ‐ operational costs value for utilities, rent, stationery, fuel, equipments and buildings maintenance.
4. Employee remuneration ‐ salaries and wages paid to workers, independently of the work relationship with the organizations. Includes social security contributions, vacation, insurance, 13 salary and FGTS.
5. Volunteer remuneration ‐ estimated value of salaries, wages and social security contributions of volunteers.
6. Production and Import taxes – value related to taxes on production. It also includes figures for property taxes (IPTU, ITCD)34.
7. Revenues from property income and interest received ‐ amount of interest received by investing financial resources to fixed income and variable’s markets.
8. Corporate income tax ‐ value of tax payments made on total income from all sources not simply profits from production.
9. Other transfers:
a. From government agencies (Federal, State and Municipal) – transfers to private institutions with cultural, welfare, scientific and social purposes. The transfers do not require a return of goods and services.
b. From private sector ‐ funds received from private organizations. Includes transfers of businesses and families (it has not yet being possible to highlight the respective amounts).
c. From families – members’ contributions to the following areas: culture and arts, education and research, health, social service, international and religious organizations.
d. Other transfers ‐ transfers from any other source, including from abroad.
34 It was not possible to separate the property taxes from the production and import taxes.

43
Appendix 7:
Legislative Changes That Occurred in the 1996-2002 Period 6.1 ‐ Culture
6.1.1 – 8313 Law ‐ Rouanet Law, 1991. Enabled projects approved by the National Cultural Incentive Commission receive sponsorship and donations from companies and individuals. Donors will have the right to deduct the value from the Income Tax under the title of the benefit granted35; 6.1.2 ‐ Audiovisual Law, 07/20/1993. In line with Rouanet Law, enabled projects approved by the Ministry of Culture related to production of independent films by purchasing shares of its marketing rights, to be deducted from the Income Tax. The deduction was limited to 3 percent of the payable Income Tax36. 6.1.3 ‐ Law No. 9999, 08/30/2000 – established the National Program for Cultural Support – PRONAC, and increased to 3 percent the participation in gross revenues from federal lotteries and contests for the program. 6.1.4 ‐ Decree No. 3617, 10/02/00 ‐ created the record of Intangible Cultural Properties, which constitutes the Brazilian Cultural Heritage and created the National Program of Intangible Heritage; 6.1.5 – Inter‐ministerial Ordinance 303, 08/31/99 ‐ created the Program for Dissemination of Brazilian Culture Abroad, in order to promote Brazil's image and expand foreign markets for goods and services that represent the country's culture, through participation in movies, music, reading, heritage and arts’ events. 6.1.6 ‐ Ordinance No. 111, 08/16/95 – related to the organizations with cultural purposes that may be recognized as relevant to the country's cultural development.
6.2 ‐ Education
6.2.1 ‐ Law No. 9394, 12/20/96 ‐ Law of Directives and Bases of National Education ‐ promotes decentralization and autonomy for schools and universities, in addition to establishing a regular process of education’s evaluation. It also promotes autonomy to educational systems and the enhancement of teaching. 6.2.2 ‐ Law No. 9424, 12/24/96 – creates the FUNDEF ‐ Fund for the Maintenance and Development of Primary Education and Valorization of Teachers. It aims to universalize access to primary education; it is intended for public education and binds percentage of revenue to the primary education. It is planned to end in December 2006. The proposed project that will replace it is the FUNDEB ‐ Fund for the Maintenance and Development of Basic Education and Enhancement of Education’s Professionals. According to data from INEP
35 This law is included because its implementation is not immediate. 36 This law is included because its implementation is not immediate.

44
‐ Institute for Educational Research of the Ministry of Education, the FUNDEF achieved an attendance rate of 96 percent of the population of 7 to 14 years, range served by the program. The pre‐school and high school students were not included in the FUNDEF but will be included in the FUNDEB.
6.3 Rights
6.3.1 ‐ Law No. 9249, 1995 – decreases the limit of deduction of corporate’ donations in the Income Tax from 5 percent to 2 percent of their operating profit. Also it compared the non‐profit organizations to organizations that have public purposes. It introduced the requirement of the Declaration of Federal Public Utility to all non‐profit organizations, so the companies can make the deduction from their Income Tax. The purpose of this law is to improve the mechanisms of incentives to private donations with more efficient ways of deduction and supervision. 6.3.2 ‐ Law No. 9250, 1995 ‐ prevented the deduction of Individual Income Tax. 6.3.3 ‐ Law No. 9608, 1998 ‐ regulated voluntary work. The volunteer service was defined as unpaid work performed by individuals,, that does not generate any type of employment relationship or labor obligations. 6.3.4 ‐ Law No. 9790, 1999 ‐ allowed citizens free access to registration data and other documents of the non‐profit organizations. It also created the standard for granting titles and records, called "institutional recognition" or "qualification", which set out a typology for differentiating associations, granting a special condition in relation to exemptions, immunities, duties, taxes and carrying out projects. In practice, resulted in the concentration of private legal entities as Civil Society Organizations of Public Interest (OSCIP), and created a new legal instrument for cooperation, the Partnership Agreement. 6.3.5 ‐ Decree No. 3298, December 1999 ‐ regulates Law 7853 of 1989. With ten years apart, is intended to guarantee people with disabilities a real chance of inclusion in all spheres of social life. Regarding employment, the law stipulated that enterprises with more than one hundred employees should fill with 2 percent to 5 percent of their positions with the Social Security beneficiaries rehabilitated or disabled people. The difficulties in complying with the decree ‐ because the disabled people are not professionally qualified to perform specific professional tasks or are not attending formal schooling or any professional education program – determined the creation of community and professional education projects, involving the NPOs and the government. 6.3.6 – Provisional Measure No. 2216‐37, 2001 ‐ extended the period of qualification OSCIP and other federal titles until March 2004. 6.3.7 ‐ Provisional Measure No. 2158‐35, 2001 ‐ allows the deduction of donations made to OSCIPs in Corporation Income Tax. 6.3.8 ‐ Provisional Measure No. 2172‐32, 2001 ‐ exempts the OSCIPs from the high interest rates’ microcredit (maximum interest rate of 12 percent per year), allowing market interest rates and sustainability.

45
6.3.9 ‐ Ordinance No. 256, 08/15/00 ‐ Ministry of Finance authorizes donations of goods seized by the Federal Revenue Secretary to OSCIPs.
6.3.0 ‐ Provisional Measure No. 66, 08/29/02 ‐ deals with tax exemption for OSCIPs that choose to pay their executive directors. From this date on, these OSCIPs can have exemption from income tax and receive deductible donations from corporate donors. Until the issue of Provisional Measure the organization that remunerated their executive directors lost such benefits, according to the Laws No. 9532/97 and 9249/95. 6.3.0.1 ‐ Law No. 10194, 2001 ‐ creates the Microentrepreneurs’ Credit Society ‐ SCM, new legal entity for private participation in the microfinance sector. It aims to provide microcredit to small entrepreneurs, allowing alternative investments to generate jobs and income.

46
Appendix 8: Bibliography
IBGE, IPEA, GIFE, ABONG (2004. Estudos e pesquisas Informação econômica, no. 4. As Fundações Privadas e Associações sem Fins Lucrativos no Brasil – 2002. Rio de Janeiro, Brazil. Gastos Sociais do Governo Federal – 1995 a 2004. Fernandes, Maria Alice da Cunha. IEPES – Instituto de Estudos de Políticas Econômicas e Sociais. 2006. Landim, Leilah. Para Além do Mercado e do Estado? Filantropia e Cidadania no Brasil. ISER – Núcleo de Pesquisa, 1993. Landim & Beres. Leilah e Neide. As Organizações sem Fins Lucrativos no Brasil. Ocupações, Despesas e Recursos. ISER. The Johns Hopkins University. Institute for Policy Studies. Nau Editora, 1999. Landim & Scalon. Leilah e Maria C. Doações e Trabalho Voluntário no Brasil. Uma Pesquisa. 7 Letras. 2000 Merege, Prof. Luiz Carlos (2005). Censo do 3º Setor do Pará. CETS/FGV‐EASP . 2005. Salamon, Lester M. et al (1999). Lester M. Salamon, Helmut K. Anheier, Regina List, Stephan Toepler, S. Wojciech Sokolowski, and Associates. Global Civil Society: Dimensions of the Nonprofit Sector. (Baltimore, MD: The Johns Hopkins Center for Civil Society Studies,1999). http://www.ccss.jhu.edu/pdfs/Books/BOOK_GCS_Ch20_Brasil_SP_1999.pdf Salamon, Lester M., Megan A. Haddock, S. Wojciech Sokolowski, and Helen S. Tice, Measuring Civil Society and Volunteering: Initial Findings from Implementation of the UN Handbook on Nonprofit Institutions Working Paper No. 23. (Baltimore: Johns Hopkins Center for Civil Society Studies, 2007). Statistics Canada (2006). Satellite Account of Nonprofit Institutions and Volunteering: 1997 to 2003. Catalog no. 13‐015‐XIE. Ottawa. National accounts data: http://www.statcan.ca/menu‐en.htm. United Nations (2003). Handbook of National Accounting: Handbook on Non‐Profit Institutions
in the System of National Accounts. United Nations Publication, Sales No.E.030XVII.9