nonprofit organizations and the nevada economy · nonprofit organizations and the nevada economy:...
TRANSCRIPT
Page 1
THE LINCY INSTITUTE SPECIAL REPORT NO.3
September 2014
Nonprofit Organizations and the Nevada Economy: An analysis of the employment, economic impact, and scope of the nonprofit sector in the Silver State BY: JESSICA K. A. WORD, PH.D., JAEWON LIM, PH.D., CAROL SERVINO, PH.D., KENNETH LANGE, M. ED.
Abstract
The Nevada nonprofit sector plays an important role in the state’s economy. This research brief examines the role of nonprofit organizations in the economy and details regional differences in terms of employment and economic impact in the state.
Findings This section outlines the economic contributions of nonprofit organizations in Nevada. Details on the methodology and finding of this research are available in the full report.
Scope of the Sector The type and size of nonprofit organizations varies widely across Nevada.
In 2011, Nevada reported 8,144
registered nonprofit organizations. These
organizations included 5,034 public
charities, 2,413 other types of nonprofits,
and 697 private foundations.
Of the registered nonprofit organizations,
only 71.2% reported annually to the Internal Revenue Service (IRS). Reporting nonprofit organizations included 3,186 public charities, 2,056 other nonprofit organizations, and 630 private foundations.
Nonprofit organizations in Nevada
generated $4.4 billion in revenue; paid almost $2 billion in wages and compensation, and held $14.5 billion in assets. In 2011, Nevada ranked 50th among states in assets and revenues per capita.
Public charities held $2.7 billion in
revenues and $5.1 billion in assets in 2011. Public charities paid $1.8 billion in wages and compensation.
Other nonprofit organizations generated
$1.4 billion in revenues and held $4.1 billion in assets in 2011. These organizations paid $165 million in wages and compensation.
The greatest number of registered
nonprofits in Nevada is found in the human service organization subsector, but healthcare nonprofits represented the largest group in terms of revenue, assets, and wages paid.
Page 2
Nevada ranks 50th in number of nonprofit organizations per 10,000 residents in 2011.
Nevadans volunteered 59.8 million hours
of service valued at $1.3 billion in 2011 (VolunteeringinAmerica.gov, 2013). The number of volunteer hours donated was equivalent to the sector having an additional 28,570 fulltime employees.
However, only 22.2% of Nevada residents
volunteer their time annually. Nevada ranked 48th in terms of overall volunteer participation rate (VolunteeringinAmerica.gov, 2013).
Employment Nonprofits are a significant employer in the Nevada economy. Nevada’s nonprofit organizations
employed 43,222 workers in 2011. Nevada’s nonprofit sector was the ninth
largest employment sector in the state, larger than the state’s manufacturing, finance, real estate, and mining industries.
The nonprofit sector represented 3.7% of
the total workforce or 4.5% of the state’s private sector workforce.
The average nonprofit employee in
Nevada earned $45,547 in 2011. This was slightly more than the average for all workers in the state ($43,108) and for-profit workers ($41,652) but less than the average for government employees.
Economic Impact The economic impact of Nevada’s nonprofit sector includes the direct expenditures and employment detailed above, and indirect impacts on the state’s economy. Nonprofit organizations contributed 5.5%
of the Gross Regional Product (GRP) in Nevada in 2010. This was equivalent to
$7.1 billion in economic activity. On average, each nonprofit employee added $56,992 to GRP.
For every 100 nonprofit jobs in Nevada,
an additional 72 jobs are created in the state.
Public charities generated 4.7% of GRP or
$6 billion in economic activity. Regional Differences in Nonprofit Economic Impact
While nonprofit organizations generate substantial economic activity across the state, large regional differences exist. Northern Nevada (Washoe, Storey, and Carson County) experienced a much larger impact from nonprofit organizations than did Southern Nevada (Clark County) or Rural Nevada (Douglas, Lyon, Churchill, Humboldt, Lander, Pershing, Elko, Eureka, White Pine, Nye, Lincoln, Esmeralda and Mineral Counties). Southern Nevada
Southern Nevada contained 72.3% of
the state’s population yet was home to only 51.9% of all filing nonprofit organizations in 2011.
Nonprofits in Southern Nevada receive less funding and possess fewer assets per capita than those in other regions of the state. Southern Nevada nonprofit organizations generated $1,213 in revenue and held $3,527 in assets per capita in 2011. Northern Nevada nonprofits enjoyed more than twice the assets and revenues per capita than Southern Nevada nonprofits. Southern Nevada revenues per capita were only 74.4% of the state average although higher levels of philanthropic support exist in this region.
Southern Nevadans on average donated 4.1% of their annual income to charity, just under the national average of 4.7%.
Page 3
Southern Nevada nonprofits contributed 4.0% of the Gross Regional Product (GRP) in 2010. This is equivalent to $3.6 billion.
The average wage for nonprofit
employees in Southern Nevada was $44,448 in 2011.
Southern Nevada’s average labor income
per employee was 12.7% lower in 2010 and 8.8% lower in 2011 than the labor income per nonprofit employee in Northern Nevada.
Northern Nevada
Northern Nevada with 17.8% of the state’s population contained 33.5% of the state’s filing nonprofit organizations.
Northern Nevada nonprofits had by far
the largest amount of resources per capita compared to other regions in the state. Northern Nevada nonprofits generated $3,234 in revenue and held $14,128 in assets per capita in 2011. The revenues per capita in Northern Nevada were nearly two times the revenues per capita for the state (198%) and assets per capita were more than two and a half times the average in the state (265%).
Northern Nevadans on average donate
3.1% of their income annually to charity. Northern Nevada nonprofits contributed 11.4% of the Gross Regional Product (GRP) in 2010. This is equivalent to $2.9 billion.
Northern Nevada’s employment
multiplier is the highest among all regions of the state. For every 100 nonprofit jobs, an additional 80 jobs are generated.
The average wage for nonprofit
employees in Northern Nevada was $48,695 in 2011.
Rural Nevada
Rural Nevada, with 9.9 % of the state’s population, contained 11.0% of the state’s filing nonprofit organizations.
Rural Nevada nonprofits generated
$1,085 in revenue and held $2,630 in assets per capita in 2011. Rural Nevada revenues were the lowest per capita in the state at only 66.5% of the state average.
Rural Nevadans on average donated 4.8%
of their annual income to charity. Nonprofit employees in the rural areas of
the state earned the least salary, averaging only $37,389 in 2011 or $11,306 less than those in Northern Nevada and $8,158 less than the state average.
INTRODUCTION The State of Nevada changed rapidly in recent decades, enjoying one of the longest and most sustained population growth periods in the nation, followed by a severe period of economic contraction and recession. Unemployment during the Great Recession of 2007 reached a peak of 13.8% for Nevada in August of 2011 (Bureau of Labor Statistics, 2012). Amid the challenges faced by the Nevada’s economy, the nonprofit sector worked to combat the ravages of the economic downturn through the provision of services to communities across the state. This research brief provides an overview of the economic contributions of the nonprofit sector and its role in the diversification of Nevada’s economy using data from the 2010 and 2011 Federal Bureau of Labor Statistics’ Quarterly Census of Employment and Wages program (QCEW) and the National Center for Charitable Statistics (NCCS) Business Master File (BMF) for August 2012. While nonprofits serve a far more important role than simply producers of employment,
Page 4
the scope of this report is focused primarily on their role in the state’s economy and the role these organizations can play in the state’s future growth and recovery. In particular, this brief focuses on the following topics: Overall scale of Nevada’s nonprofit sector
including: the characteristics of the sector in terms of activity, region, and budget size; and sources of revenue including philanthropic and governmental support;
Relative importance of Nevada nonprofits in terms of the overall economy and in comparison to other industries in the public and for-profit sectors;
Comparative compensation for nonprofit employees both across the state and regionally;
Economic impact for all nonprofit activities for Nevada in terms of direct, indirect, and induced economic activity.
THE SCOPE OF NEVADA’S NONPROFIT SECTOR The 2011 Nevada’s nonprofit sector included 8,144 organizations registered with the IRS. These organizations included 5,034 public charities, 2,413 other types of tax exempt organizations, and 697 private foundations. Many of these organizations are quite small and limited in scope and only 72.1% of these organizations filed the necessary paperwork with the IRS to be considered reporting nonprofit organizations. Nevada nonprofits reported assets of more than $14.5 billion in 2011(IRS) and a combined annual revenue of $4.4 billion (NCCS Business Master File, August 2012). By comparison, Nevada’s annual budget for fiscal year 2011-12, stands at $22.9 billion with human services expenditures of $10.6 million per year. In contrast, the Clark County general fund budget totaled $1.2 billion for fiscal year 2012, and the Washoe County budget reached $568 million.
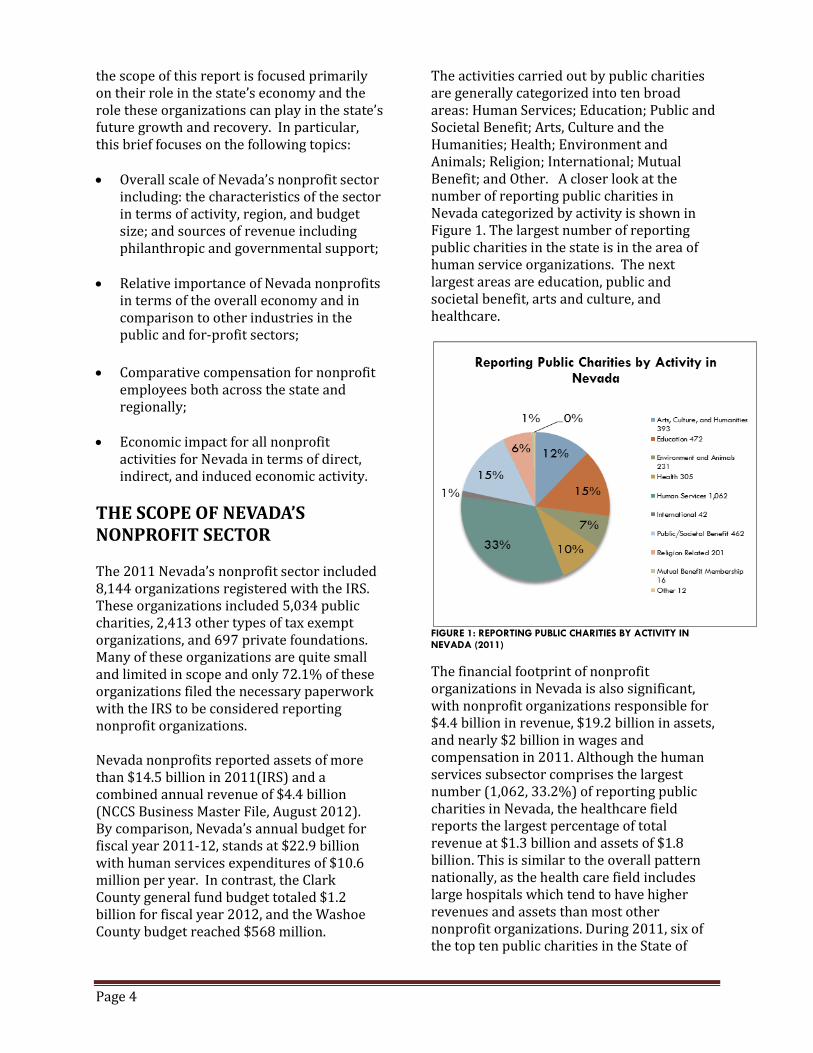
The activities carried out by public charities are generally categorized into ten broad areas: Human Services; Education; Public and Societal Benefit; Arts, Culture and the Humanities; Health; Environment and Animals; Religion; International; Mutual Benefit; and Other. A closer look at the number of reporting public charities in Nevada categorized by activity is shown in Figure 1. The largest number of reporting public charities in the state is in the area of human service organizations. The next largest areas are education, public and societal benefit, arts and culture, and healthcare.
FIGURE 1: REPORTING PUBLIC CHARITIES BY ACTIVITY IN NEVADA (2011)
The financial footprint of nonprofit organizations in Nevada is also significant, with nonprofit organizations responsible for $4.4 billion in revenue, $19.2 billion in assets, and nearly $2 billion in wages and compensation in 2011. Although the human services subsector comprises the largest number (1,062, 33.2%) of reporting public charities in Nevada, the healthcare field reports the largest percentage of total revenue at $1.3 billion and assets of $1.8 billion. This is similar to the overall pattern nationally, as the health care field includes large hospitals which tend to have higher revenues and assets than most other nonprofit organizations. During 2011, six of the top ten public charities in the State of
Page 5
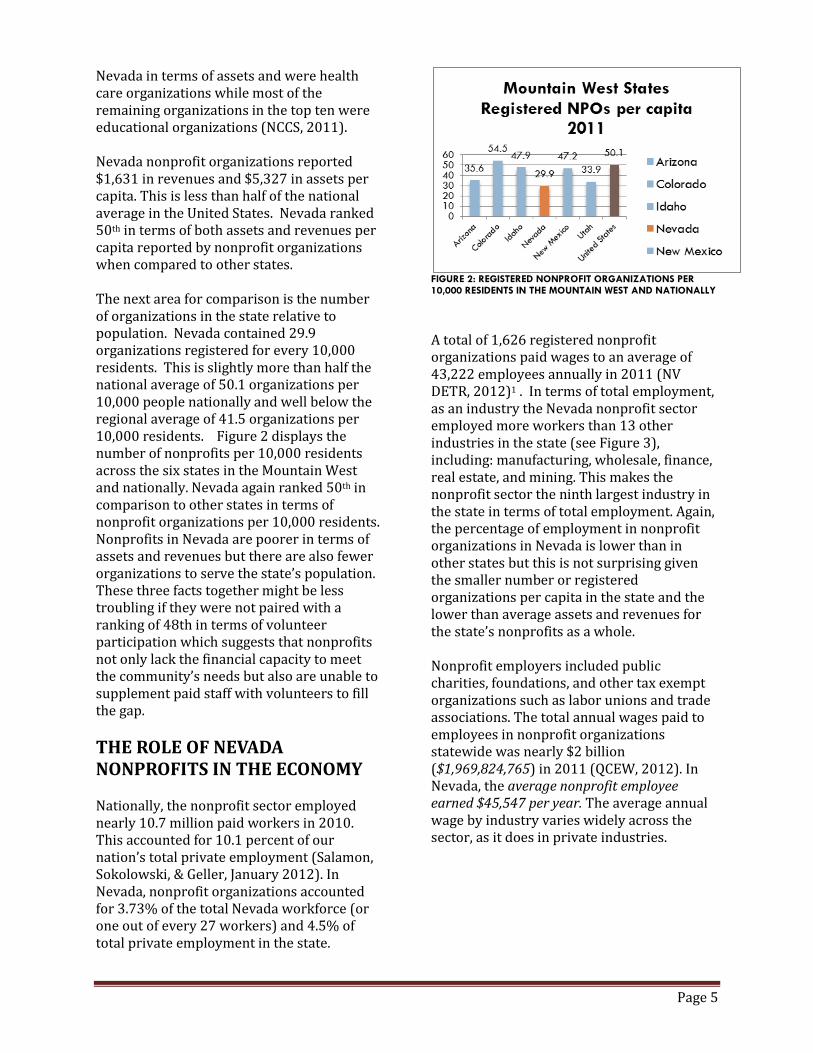
Nevada in terms of assets and were health care organizations while most of the remaining organizations in the top ten were educational organizations (NCCS, 2011). Nevada nonprofit organizations reported $1,631 in revenues and $5,327 in assets per capita. This is less than half of the national average in the United States. Nevada ranked 50th in terms of both assets and revenues per capita reported by nonprofit organizations when compared to other states. The next area for comparison is the number of organizations in the state relative to population. Nevada contained 29.9 organizations registered for every 10,000 residents. This is slightly more than half the national average of 50.1 organizations per 10,000 people nationally and well below the regional average of 41.5 organizations per 10,000 residents. Figure 2 displays the number of nonprofits per 10,000 residents across the six states in the Mountain West and nationally. Nevada again ranked 50th in comparison to other states in terms of nonprofit organizations per 10,000 residents. Nonprofits in Nevada are poorer in terms of assets and revenues but there are also fewer organizations to serve the state’s population. These three facts together might be less troubling if they were not paired with a ranking of 48th in terms of volunteer participation which suggests that nonprofits not only lack the financial capacity to meet the community’s needs but also are unable to supplement paid staff with volunteers to fill the gap.
THE ROLE OF NEVADA NONPROFITS IN THE ECONOMY Nationally, the nonprofit sector employed nearly 10.7 million paid workers in 2010. This accounted for 10.1 percent of our nation’s total private employment (Salamon, Sokolowski, & Geller, January 2012). In Nevada, nonprofit organizations accounted for 3.73% of the total Nevada workforce (or one out of every 27 workers) and 4.5% of total private employment in the state.
FIGURE 2: REGISTERED NONPROFIT ORGANIZATIONS PER 10,000 RESIDENTS IN THE MOUNTAIN WEST AND NATIONALLY A total of 1,626 registered nonprofit organizations paid wages to an average of 43,222 employees annually in 2011 (NV DETR, 2012)1 . In terms of total employment, as an industry the Nevada nonprofit sector employed more workers than 13 other industries in the state (see Figure 3), including: manufacturing, wholesale, finance, real estate, and mining. This makes the nonprofit sector the ninth largest industry in the state in terms of total employment. Again, the percentage of employment in nonprofit organizations in Nevada is lower than in other states but this is not surprising given the smaller number or registered organizations per capita in the state and the lower than average assets and revenues for the state’s nonprofits as a whole. Nonprofit employers included public charities, foundations, and other tax exempt organizations such as labor unions and trade associations. The total annual wages paid to employees in nonprofit organizations statewide was nearly $2 billion ($1,969,824,765) in 2011 (QCEW, 2012). In Nevada, the average nonprofit employee earned $45,547 per year. The average annual wage by industry varies widely across the sector, as it does in private industries.

Page 6
FIGURE 3: AVERAGE NUMBER OF PAID WORKERS IN NEVADA
NONPROFIT SECTOR VS. OTHER INDUSTRIES IN THE STATE
THE ECONOMIC IMPACT OF NONPROFIT ACTIVITIES IN THE STATE Nonprofit organizations contributions to the local, regional, and state economy is greater than direct spending on payroll, goods, services, and capital projects. In 2010, nonprofit organizations contributed 5.5% of the Gross Regional Product (GRP)2 in Nevada. This was equivalent to $7.1 billion, which includes direct, indirect, and induced costs created through the multiplier effect. The share of the nonprofit sector’s economic activity to GRP was approximately half the share of government activities (10.8%). On average, each nonprofit job added $56,992 to GRP. Nonprofit organizations contribute a relatively modest amount of the state’s GRP. The national trend for nonprofit organizations has been one of growth, even during the recent recession and continued growth in the number and size of nonprofit organizations in Nevada could provide additional economic diversity and resiliency during future downturns (Salamon, Sokolowski, and Geller, 2012). Our analysis found that every 100 nonprofit jobs in the
state of Nevada resulted in an additional 72 jobs. Public charities dominate economic metrics, relative to other nonprofit organizations. Public charities generated 4.7% of GRP in the Nevada, or the equivalent of $6.0 billion in economic activity. However, other nonprofit organizations provided greater impact in terms of employment and labor income.
REGIONAL DIFFERENCES IN NEVADA In order to better understand the role of the nonprofit sector across areas of the state, we divided the state into three regions3 (Figure 4): Northern Nevada (Carson City, Storey, and Washoe Counties), Southern Nevada (Clark County) and Rural Nevada (Douglas, Lyon, Churchill, Humboldt, Lander, Pershing, Elko, Eureka, White Pine, Nye, Lincoln, Esmeralda, and Mineral Counties).
FIGURE 4: REGIONS OF THE STATE AS DEFINED IN THIS REPORT While nonprofit employees work in communities throughout the state, the largest number of nonprofit employees is located in Southern Nevada. However, similar to the pattern we observed in terms of financial resources of nonprofit organizations in the State of Nevada, nonprofit employment was unevenly distributed relative to the state’s population. Figure 5 below displays the proportion of population and the proportion of nonprofit employment by region of the
767
2,275
4,190
9,152
12,507
13,901
18,062
21,609
26,607
27,854
30,087
32,756
38,154
43,222
46,197
46,943
52,040
74,478
94,335
128,771
145,084
288,873
Unclassified
Agriculture
Utilities
Educational Services
Information
Mining
Management of Companies
Real Estate
Arts and Recreation
Other Services
Finance
Wholesale
Manufacturing
NonProfits
Transportation & Warehousing
Professional, Scientific
Construction
Administrative and Support
Health Care & Social Assistance
Retail
Government
Accommodation and Food
Page 7
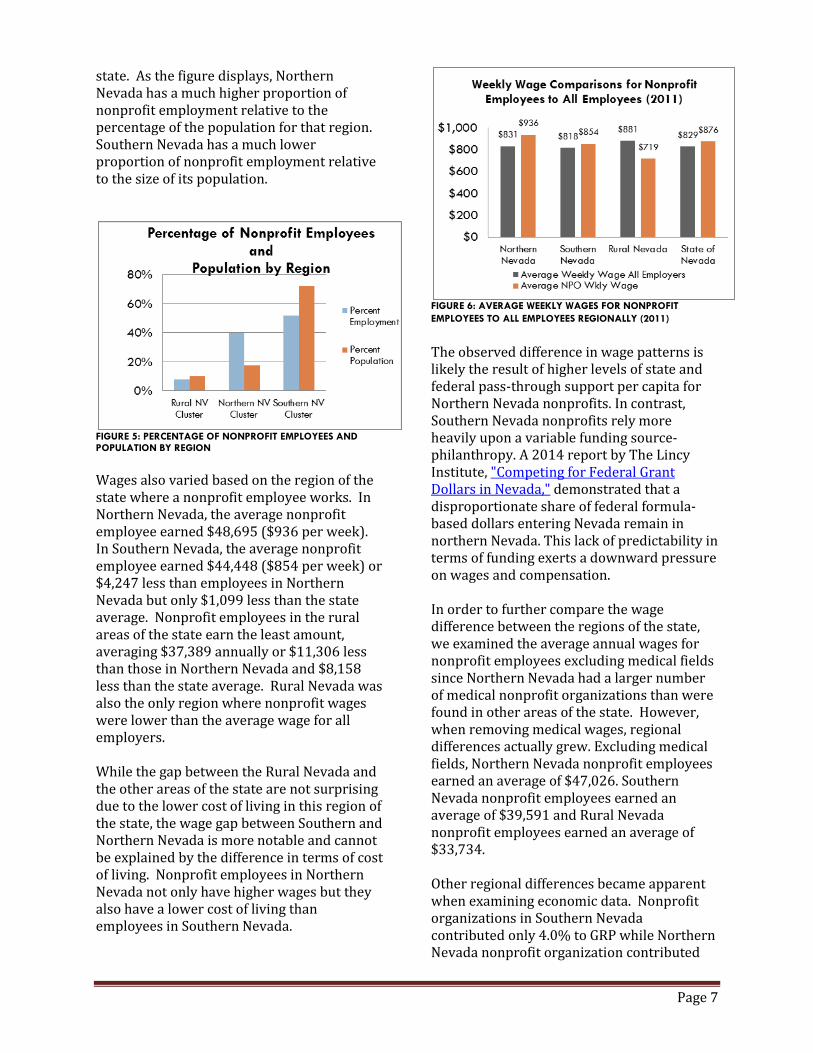
state. As the figure displays, Northern Nevada has a much higher proportion of nonprofit employment relative to the percentage of the population for that region. Southern Nevada has a much lower proportion of nonprofit employment relative to the size of its population.
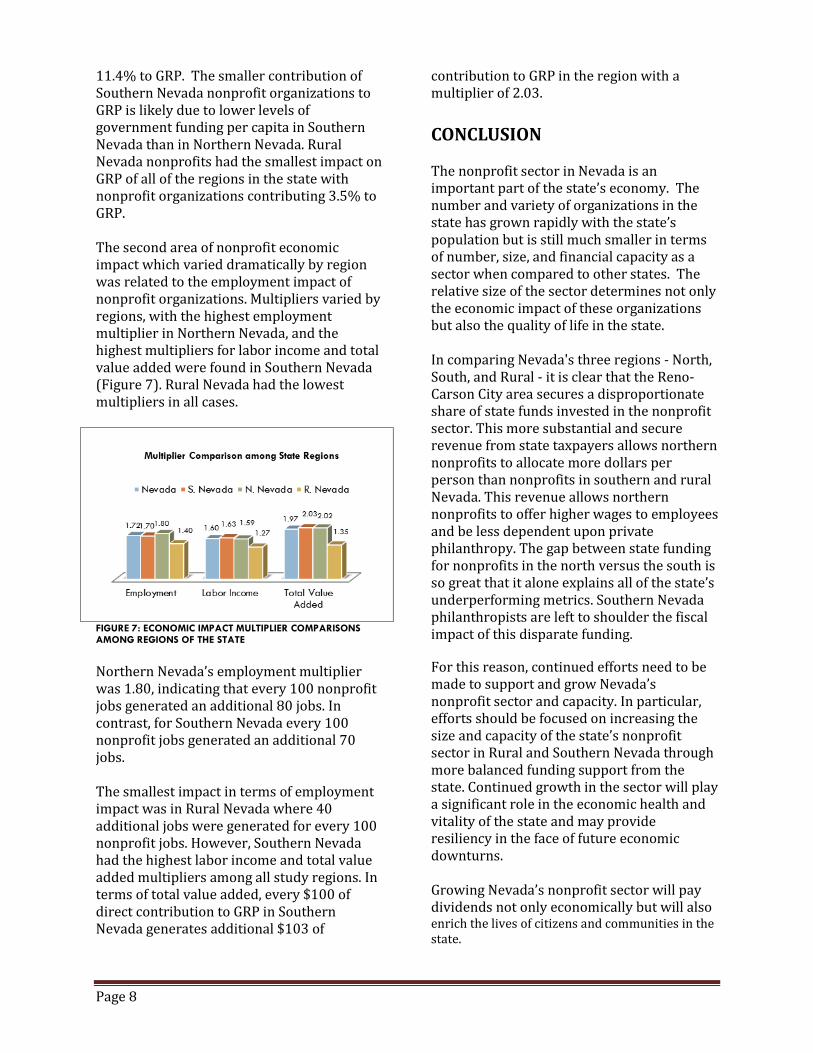
FIGURE 5: PERCENTAGE OF NONPROFIT EMPLOYEES AND POPULATION BY REGION Wages also varied based on the region of the state where a nonprofit employee works. In Northern Nevada, the average nonprofit employee earned $48,695 ($936 per week). In Southern Nevada, the average nonprofit employee earned $44,448 ($854 per week) or $4,247 less than employees in Northern Nevada but only $1,099 less than the state average. Nonprofit employees in the rural areas of the state earn the least amount, averaging $37,389 annually or $11,306 less than those in Northern Nevada and $8,158 less than the state average. Rural Nevada was also the only region where nonprofit wages were lower than the average wage for all employers. While the gap between the Rural Nevada and the other areas of the state are not surprising due to the lower cost of living in this region of the state, the wage gap between Southern and Northern Nevada is more notable and cannot be explained by the difference in terms of cost of living. Nonprofit employees in Northern Nevada not only have higher wages but they also have a lower cost of living than employees in Southern Nevada.
FIGURE 6: AVERAGE WEEKLY WAGES FOR NONPROFIT
EMPLOYEES TO ALL EMPLOYEES REGIONALLY (2011)
The observed difference in wage patterns is likely the result of higher levels of state and federal pass-through support per capita for Northern Nevada nonprofits. In contrast, Southern Nevada nonprofits rely more heavily upon a variable funding source- philanthropy. A 2014 report by The Lincy Institute, "Competing for Federal Grant Dollars in Nevada," demonstrated that a disproportionate share of federal formula-based dollars entering Nevada remain in northern Nevada. This lack of predictability in terms of funding exerts a downward pressure on wages and compensation. In order to further compare the wage difference between the regions of the state, we examined the average annual wages for nonprofit employees excluding medical fields since Northern Nevada had a larger number of medical nonprofit organizations than were found in other areas of the state. However, when removing medical wages, regional differences actually grew. Excluding medical fields, Northern Nevada nonprofit employees earned an average of $47,026. Southern Nevada nonprofit employees earned an average of $39,591 and Rural Nevada nonprofit employees earned an average of $33,734. Other regional differences became apparent when examining economic data. Nonprofit organizations in Southern Nevada contributed only 4.0% to GRP while Northern Nevada nonprofit organization contributed
Page 8
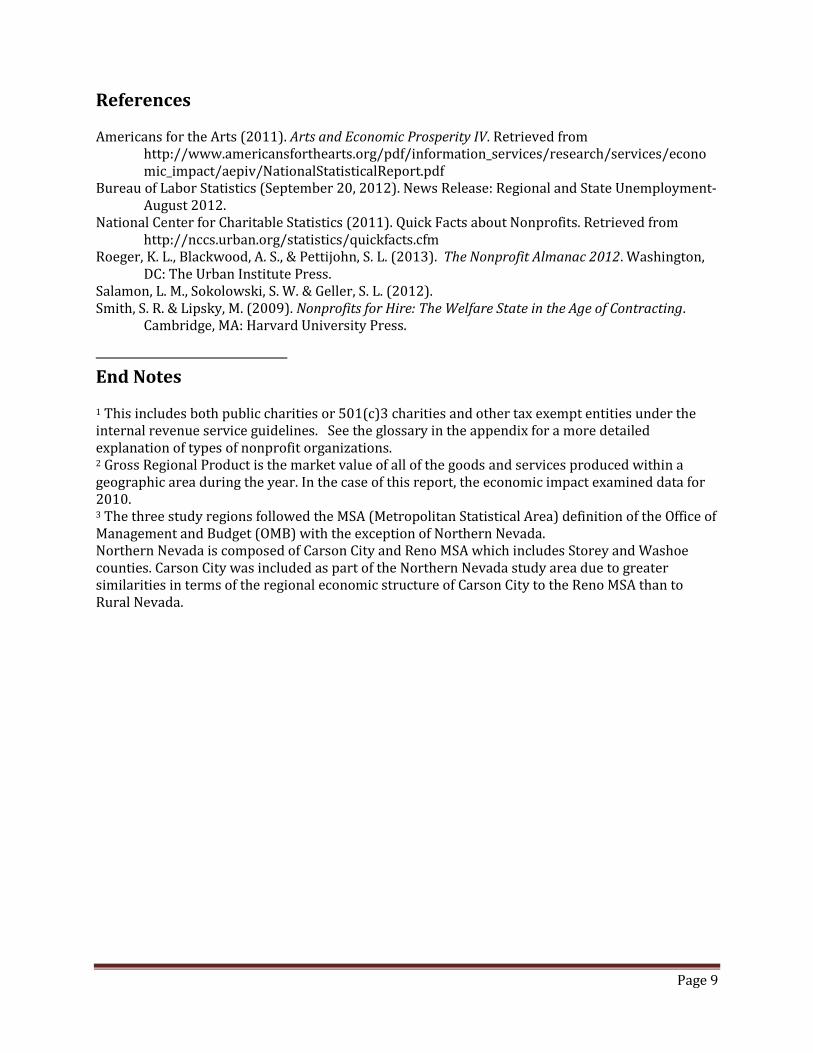
11.4% to GRP. The smaller contribution of Southern Nevada nonprofit organizations to GRP is likely due to lower levels of government funding per capita in Southern Nevada than in Northern Nevada. Rural Nevada nonprofits had the smallest impact on GRP of all of the regions in the state with nonprofit organizations contributing 3.5% to GRP. The second area of nonprofit economic impact which varied dramatically by region was related to the employment impact of nonprofit organizations. Multipliers varied by regions, with the highest employment multiplier in Northern Nevada, and the highest multipliers for labor income and total value added were found in Southern Nevada (Figure 7). Rural Nevada had the lowest multipliers in all cases.
FIGURE 7: ECONOMIC IMPACT MULTIPLIER COMPARISONS AMONG REGIONS OF THE STATE
Northern Nevada’s employment multiplier was 1.80, indicating that every 100 nonprofit jobs generated an additional 80 jobs. In contrast, for Southern Nevada every 100 nonprofit jobs generated an additional 70 jobs. The smallest impact in terms of employment impact was in Rural Nevada where 40 additional jobs were generated for every 100 nonprofit jobs. However, Southern Nevada had the highest labor income and total value added multipliers among all study regions. In terms of total value added, every $100 of direct contribution to GRP in Southern Nevada generates additional $103 of
contribution to GRP in the region with a multiplier of 2.03.
CONCLUSION The nonprofit sector in Nevada is an important part of the state’s economy. The number and variety of organizations in the state has grown rapidly with the state’s population but is still much smaller in terms of number, size, and financial capacity as a sector when compared to other states. The relative size of the sector determines not only the economic impact of these organizations but also the quality of life in the state. In comparing Nevada's three regions - North, South, and Rural - it is clear that the Reno-Carson City area secures a disproportionate share of state funds invested in the nonprofit sector. This more substantial and secure revenue from state taxpayers allows northern nonprofits to allocate more dollars per person than nonprofits in southern and rural Nevada. This revenue allows northern nonprofits to offer higher wages to employees and be less dependent upon private philanthropy. The gap between state funding for nonprofits in the north versus the south is so great that it alone explains all of the state’s underperforming metrics. Southern Nevada philanthropists are left to shoulder the fiscal impact of this disparate funding.
For this reason, continued efforts need to be made to support and grow Nevada’s nonprofit sector and capacity. In particular, efforts should be focused on increasing the size and capacity of the state’s nonprofit sector in Rural and Southern Nevada through more balanced funding support from the state. Continued growth in the sector will play a significant role in the economic health and vitality of the state and may provide resiliency in the face of future economic downturns. Growing Nevada’s nonprofit sector will pay dividends not only economically but will also enrich the lives of citizens and communities in the state.
Page 9
References Americans for the Arts (2011). Arts and Economic Prosperity IV. Retrieved from
http://www.americansforthearts.org/pdf/information_services/research/services/economic_impact/aepiv/NationalStatisticalReport.pdf
Bureau of Labor Statistics (September 20, 2012). News Release: Regional and State Unemployment-August 2012.
National Center for Charitable Statistics (2011). Quick Facts about Nonprofits. Retrieved from http://nccs.urban.org/statistics/quickfacts.cfm
Roeger, K. L., Blackwood, A. S., & Pettijohn, S. L. (2013). The Nonprofit Almanac 2012. Washington, DC: The Urban Institute Press.
Salamon, L. M., Sokolowski, S. W. & Geller, S. L. (2012). Smith, S. R. & Lipsky, M. (2009). Nonprofits for Hire: The Welfare State in the Age of Contracting.
Cambridge, MA: Harvard University Press.
End Notes
1 This includes both public charities or 501(c)3 charities and other tax exempt entities under the internal revenue service guidelines. See the glossary in the appendix for a more detailed explanation of types of nonprofit organizations. 2 Gross Regional Product is the market value of all of the goods and services produced within a geographic area during the year. In the case of this report, the economic impact examined data for 2010. 3 The three study regions followed the MSA (Metropolitan Statistical Area) definition of the Office of Management and Budget (OMB) with the exception of Northern Nevada. Northern Nevada is composed of Carson City and Reno MSA which includes Storey and Washoe counties. Carson City was included as part of the Northern Nevada study area due to greater similarities in terms of the regional economic structure of Carson City to the Reno MSA than to Rural Nevada.
Page 10
About the Authors
Jessica K. A. Word, PhD, is an Associate Professor of Public Administration in the School of Environmental and Public Affairs at the University of Nevada, Las Vegas (UNLV). She currently serves as the director of the Nonprofit, Community, and Leadership Initiative and the Graduate Certificate in Nonprofit Management at UNLV. She received her doctorate from the Reubin Askew School of Public Administration and Policy at Florida State University in 2006. Her research focuses on capacity building in the public and nonprofit sector.
Jaewon Lim, PhD, is an Assistant Professor of School of Environmental and Public Affairs in the Greenspun College of Urban Affairs at the University of Nevada, Las Vegas (UNLV). Dr. Lim earned his PhD from the University of Illinois at Urbana-Champaign in Regional Planning. From 2003 to 2007, he served as a research assistant for REAL (Regional Economics Applications Laboratory) of University of Illinois at Urbana-Champaign, focusing on development and use of analytical models for urban and regional forecasting and economic development. Before joining UNLV, Lim held positions as regional economist and affiliated faculty in Office of Economic Development and School of Geography and Development at the University of Arizona.
Carol Servino, PhD, recently received her doctorate in Public Affairs from the Greenspun College of Urban Affairs at the University of Nevada, Las Vegas (UNLV). Servino also holds a Masters in Professional and Technical Communication from the New Jersey Institute of Technology. While completing her studies she worked as a research assistant at the Nonprofit Community and Leadership Initiative at UNLV. Her research interests are in the areas of public management, policy implementation, public administration, organizational missions and culture, and risk management.
Kenneth Lange, M. Ed, is a PhD student in Public Affairs and worked as a research assistant at the Nonprofit Community and Leadership Initiative at UNLV. Lange is currently the owner of the Lange Development Group, LLC. His previous experience as a leader in the nonprofit sector includes serving as the Executive Director of Olive Crest and the Nevada State Education Association.
Acknowledgments
The authors wish to thank The Lincy Institute at UNLV for providing funding and support for this project. Special thanks to William E. Brown Jr. , Robert Lang, Lucy Klinkhammer, Alexandra Nikolich, and Fatma Nasoz for their support and advice on the development of the project. We would also like to thank Bill Anderson and the Nevada Department of Employment, Training and Rehabilitation for their help in obtaining data for analysis.
About UNLV
UNLV, founded in 1957, is an institution of approximately 27,000 students and nearly 2,900 faculty and staff located on the southern tip of Nevada minutes from the Las Vegas Strip. Classified by the Carnegie Foundation for the Advancement of Teaching as a research university with high research activity, UNLV offers more than 200 undergraduate, graduate and doctoral degree programs including innovative academic degrees in such fields as gaming management, entrepreneurship, entertainment engineering and much more. The entertainment capital of the world, Las Vegas offers students a “living laboratory” for research, internships, and a wide variety of job opportunities. UNLV is dedicated to developing and supporting the human capital, regional infrastructure, and economic diversification that Nevada needs for a sustainable future. For more information, visit: http://www.unlv.edu.
Page 11
About The Lincy Institute Established in 2009, The Lincy Institute conducts and supports research that focuses on improving Nevada’s health, education, and social services. This research will be used to build capacity for service providers and enhance efforts to draw state and federal money to the greater Las Vegas. The Lincy Institute will also highlight key issues that affect public policy and quality-of-life decisions on behalf of children, seniors, and families in Nevada. The Lincy Institute has been made possible by the generous support of The Lincy Foundation. Robert E. Lang, Ph.D. serves as the Institute’s Executive Director. To learn more visit: http://lincyinstitute.unlv.edu/
University of Nevada, Las Vegas
4505 S. Maryland Parkway, Box 453067 Las Vegas, NV 89154 (702) 895-0088
The views expressed in this document, whether in the text, graphics, images or other information, are those of the respective author(s), and do not necessarily reflect the views of, nor represent an official statement by, the University of Nevada, Las Vegas (UNLV).
This information may be used and copies made for non-commercial purposes. Proper attribution is required.
For citation purposes, please use: Word, J., Lim, J., Servino, C., Lange, K. 2014. “Nonprofit Organizations and the Nevada Economy: An analysis of the employment, economic impact, and scope of the nonprofit sector in the Silver State.” University of Nevada, Las Vegas (UNLV), The Lincy Institute. The Lincy Institute Special Report: No. 3.