nonlinear incentive schemes and corruption in … · nonlinear incentive schemes and corruption in...
TRANSCRIPT

EI
483
Charles University Center for Economic Research and Graduate Education Academy of Sciences of the Czech Republic Economics Institute
NONLINEAR INCENTIVE SCHEMES AND CORRUPTION IN PUBLIC PROCUREMENT:
EVIDENCE FROM THE CZECH REPUBLIC
Ján Palguta
CERGE
WORKING PAPER SERIES (ISSN 1211-3298) Electronic Version

Working Paper Series 483
(ISSN 1211-3298)
Nonlinear Incentive Schemes and
Corruption in Public Procurement:
Evidence from the Czech Republic
Ján Palguta
CERGE-EI
Prague, March 2013

ISBN 978-80-7343-287-4 (Univerzita Karlova. Centrum pro ekonomický výzkum
a doktorské studium)
ISBN 978-80-7344-279-8 (Národohospodářský ústav AV ČR, v.v.i.)

1
Nonlinear Incentive Schemes and Corruption
in Public Procurement:
Evidence from the Czech Republic
Ján Palguta*
CERGE-EI†
Abstract:
This article uses data on Czech public procurement contracts from 2005 - 2010 in order to
uncover patterns suggestive of corrupt behavior of procuring officials. Using polynomial
regressions and local linear density estimators, the article provides evidence that procurement
officials manipulate anticipated values of procurements so that contracts can be awarded
through less transparent procedures with restricted entry. Manipulations manifest through
emergence of sharp discontinuities in the anticipated value distribution. Procurements
excessively bunch below statutory thresholds, which determine officials’ scope of discretion,
entry-restrictiveness and transparency of the contract-awarding process. The first appearance
of discontinuities coincides almost exactly with thresholds being introduced into the
procurement legislation. Manipulations occur only in procedures restricted by thresholds and
are prevalent only among a narrow group of procuring bodies. The last finding is consistent
with manipulations being driven by corruption of procurement officials. Manipulations
concern 8.6% of all below-limit procurements.
Keywords: public procurement, corruption, manipulation, incentives, statutory thresholds
JEL classification: D73, H72, K42
* I would like to thank Libor Dušek, Randall Filer, Jan Hanousek, Peter Katuščák, Filip Pertold and Gerald
Roland for their helpful comments and insightful suggestions. I would also like to thank Jakub Tomíšek
and Mário Vozár for excellent assistance in data collection. The support from the grant SVV-2012-
265 801 and the GAUK grant No. 626712 is gratefully acknowledged. All errors remaining in this text are
the responsibility of the author. † CERGE-EI is a joint workplace of Charles University and the Economics Institute of the Academy of
Sciences of the Czech Republic. Address: CERGE-EI, PO Box 882, Politických věznů 7, 111 21 Prague,
Czech Republic. Email: [email protected].

2
Abstrakt:
Článek používá data českých veřejných zakázek z let 2005-2010 a odkrývá vzorce korupčního
jednání veřejných zadavatelů. Užitím polynomických regresí a lokálních lineárních estimátorů
hustoty distribuce prokazuje, že zadavatelé manipulují s očekávanou hodnotou zakázek tak,
aby zakázky mohly být zadávány méně transparentními postupy s omezenou účastí
nabízejících. Manipulace zakázek se projevují vznikem ostrých nespojitostí v distribuci
očekávané hodnoty zakázek. Zakázky se kumulují pod legislativnými limity, které skokovitě
určují volnost jednání zadavatelů, omezenost vstupu dodavatelů do zadávácího soutěže a
celkovou transparentnost zadávacího procesu. Článek prokazuje, že prvotní vznik nespojitostí
časově přesně odpovídá zavedení limitů do legislativy veřejných zakázek. Nespojitosti vznikají
pouze v procedurách omezených legislativními limity a jsou praktikovány pouze úzkou
skupinou zadavatelů. Toto poslední zjištění je konzistentní s tvrzením, že k manipulacím
dochází v důsledku korupčního jednání zadavatelů. Odhadujeme, že manipulace se týkají 8.6%
všech podlimitních zakázek.

3
1. Introduction
Corruption disturbs resource allocation all over the world. The costs are paid in terms
of diversion of public resources away from public causes, which further translates into
impediments to economic development and growth (Mauro 1995 and Bardhan 1997).
Corruption may be detrimental to public sector of countries, because instead of
offering contracts to the firms with best price-quality solutions, the contracts are given
to firms offering greatest incentives to the officials.
While a large body of literature identifies culture as a key cause of corruption (Mauro
2004, Lambsdorff 2006, Fisman and Miguel 2007, Barr and Serra 2010), the growing
field of forensic economics offers a complementary view and empirically documents
that other factors – such as opportunities for corruption, level of accountability and
the scope of officials’ discretion – play an inseparable role in determining the
prevalence of corruption (see Zitzewitz 2012 for a survey in forensic economics). In
order to gain insights into how to effectively reduce corrupt behavior, opportunities
and incentives that lead to corruption need to be clearly identified.
This paper contributes to the agenda of forensic economics by highlighting how a
nonlinear structure of procurement regulation can create opportunities for corruption.
The nonlinearity in procurement regulation emerges due to the presence of several
statutory thresholds in the anticipated value of procurements. The thresholds
discontinuously determine the scope of procuring authorities’ discretion, the
restrictiveness and the overall transparency of the contract-awarding process.
This paper demonstrates that the nonlinearity in the incentive scheme and induced
corruption opportunities stimulate excessive manipulations of the anticipated value of
procurements. Using a database of public procurement contracts from the Czech
Republic from 2005-2010, I document the sudden emergence of several sharp
discontinuities in the anticipated value of procurements. Using polynomial regressions
and local linear estimators, I show that the first emergence of discontinuities followed
shortly after the introduction of new anticipated value thresholds into the
procurement legislation. Discontinuities appeared exactly at the points of procurement
thresholds and only in procedures restricted by procurement thresholds.

4
The Czech Republic proves to be an ideal laboratory for studying incentives for
corruption. Firstly, it provides an excellent example of how, even in the absence of
official datasets, an econometric analysis into corruption can be performed using
micro data gathered by Web crawlers. Secondly, the public procurement in the Czech
Republic is one of the spheres with the highest prevalence of corruption (Transparency
International 2007, Pavel 2006). Thirdly and perhaps most importantly, the Czech
Republic offers an excellent opportunity to exploit different sources of identification
originating from the structure of and changes to procurement legislature.
The first approach to identification is based upon a nonparametric analysis of events
that should be rare, assuming a given statistical model of the honest behavior of
procuring officials. As a rare event, I consider an excess bunching of procurement
contracts at specific points in the distribution of the anticipated value of
procurements. Second, I use a major re-codification of Czech Public Procurement Act
that occurred in July 2006, which allows me to demonstrate that the excess bunching
of contracts emerged exactly at the points of new procurement thresholds and almost
exactly after the new thresholds were established. Third, I use time variation in real
prices of procurement contracts to show that excess contract masses clearly stick to
the thresholds rather than following inflation over time.
Using polynomial regressions I estimate that the anticipated value manipulations
concern 8.6% of all below-limit procurements awarded after the re-codification of the
Public Procurement Act in July 2006. This accounts to 3.7% of all contracts after July
2006. These figures are quantitatively in line with previous estimates of corruption
prevalence in procurement or in public service delivery (see survey by Svensson 2005).
The rest of the paper is organized as follows. Section 2 reviews related literature.
Section 3 discusses the institutional framework of the Czech public procurement.
Section 4 describes the data from procurement contracts. Section 5 presents the
empirical analysis of manipulation of the anticipated values of contracts. Section 6
provides an alternative methodology for testing for manipulations of the anticipated
value. Section 7 discusses the prevalence of manipulations across Czech public bodies.
Section 8 summarizes the main findings and discusses policy implications.

5
2. Literature Review
There has been much policy attention devoted to mechanisms, which incite illicit
behavior in public domains, at least since the seminal contributions by Becker and
Stigler (1974), Banfiled (1975) or Rose-Ackerman (1975). Corruption does not elude
developed countries, although it is especially pronounced in countries with weak
institutions (Shleifer and Vishny 1993). Numerous cross-country studies cite corruption
as a serious impediment to economic development and growth (Mauro 1995 and
Bardhan 1997).
In an effort to reduce corruption, many European countries have in recent years
changed their public procurement regimes to open competitive procedures above
specified financial thresholds. The European Commission advocates the use of more
competitive and transparent procedures above thresholds by antidiscrimination and
fostering European market integration (see Bulow and Klemperer 1996, Europe
Economics 2006). For a comparison, the Federal Acquisition Regulations (FAR) in the
United States also strongly favors the use of auctions in public procurement above
legislative thresholds. FAR supports this preference by arguing for competitiveness,
equal opportunity and corruption prevention (Tadelis 2009).
Generally, procurement thresholds are supposed to align the behavior of procuring
officials with societal interests. At the same time, however, such high-powered
nonlinear incentive schemes can yield rather perverse incentives (Holmstrom and
Milgrom 1991 and Baker 1992). They are likely to induce behavioral distortions as
agents seek to game the rules. The distortions may be particularly pronounced in
systems with bright line rules (Gleaser and Shleifer 2001), as it is the case of this study.
Few studies have documented illicit or manipulative behavior generated by nonlinear
incentives at thresholds. Wolfers (2006) analyzes corruption in NCAA basketball
league, where the incentives for corruption derive from the nonlinear structure of the
betting mechanism. McCrary (2008) analyzes the discontinuous pattern of roll call
votes in the U.S. House of Representatives. Saez (2010) analyzes tax evasion using the
bunching evidence of reported income, where bunching forms at various kinks of the

6
US income tax schedule. Camacho and Conover (2011) document manipulation of a
nonlinear targeting system for social welfare programs in Columbia. None of these
papers, however, analyzes discontinuities in public procurement.
The only study related to thresholds in procurement is Coviello and Mariniello’s (2012)
paper, which exploits procurement thresholds in a regression discontinuity design. The
authors study the impact of increased transparency in procurement above the
procurement thresholds; however, they find no evidence of excess masses of contracts
located at the thresholds. These authors do not focus on the nonlinear incentives for
manipulating the procurement process.
My study is also unique as little previous empirical analysis of procurement corruption
has been also documented from the side of procuring officials. The majority of
empirical studies rather focus on collusion between bidders during the contract-
awarding process (Porter and Zona 1993, 1997, McMillan 1991, Baldwin, Marshall and
Richard 1997 and many other). On the contrary, only two studies provided by DiTella
and Schargrodsky (2003) and Bandiera, Prat and Valletti (2009) analyze corruption in
procurement performed by procuring officials. The former study estimates the extent
of procurement fraud in Argentinean public hospitals and finds a negative and well-
defined effect of procuring officials` efficiency wages on prices paid for basic hospital
inputs. In the latter study, the authors analyze the empirical relevance of passive
versus active waste in Italian public procurement1. They find that some public
procuring bodies pay systematically more than others for equivalent goods. The
authors attribute the majority of waste to passive waste causes. Although both studies
provide valuable insights into the motivations of the contracting officials, the
incentives derived from the nonlinear structure of procurement regulation are largely
neglected in these studies.
1 Active waste entails direct or indirect benefit for the public official, typically due to corruption in form
of a bribe. In contrast, passive waste results from the lack of skill or motivation of procurement officials
to procure efficiently. The presence of passive waste does not benefit the officials.

7
3. Institutional Background
Public procurement in the Czech Republic constitutes one of the largest public
spending processes. Yearly, about 13-16% of GDP (USD 31 billion in 2010) is spent on
procurement of goods, construction works and services – a figure which amounts to
one of the largest procurement markets in OECD countries (Ministry of Regional
Development 2012 and OECD 2010). Of this, approximately 50 - 55% falls under the
regulation of the Czech Public Procurement Act and, therefore, under the scrutiny of
this paper. The remaining 45 - 50% is allocated through small lots or legislative
exemptions.
Four major legislative classifications determine the level of accountability and
autonomy for procuring authorities in Czech public procurement. For this paper, the
most important classification is by the anticipated value of procurements. The other
classifications are by the main object of procurement, type of contract-awarding public
body and type of contract-awarding procedure.
3.1 Anticipated Value Procurement Thresholds
The gist of classification by anticipated value rests in the fact that, although the Public
Procurement Act sets out rules that all procuring bodies must comply, some rules
apply only to procurements valued above relevant procurement thresholds.
The thresholds are legislatively set by the Public Procurement Act, but the procuring
bodies estimate the anticipated value of procurements on their own. The rule is that
the anticipated value must be estimated prior to the start of the contract-awarding
process and the estimates should approximate the public bodies’ anticipated
obligations ensuing from the procurement. However, as it is shown later, public
procuring bodies often set the procurements’ anticipated values quite freely, so that
milder legislative restrictions apply to the targeted procurement processes.
Several types of procurement thresholds are important for procuring authorities:
thresholds for small lots, thresholds for above-limit contracts and thresholds specific to
certain procurement procedures.

8
The thresholds for small lots are of lesser importance in this study, because they only
set out the lower bounds in procurement’s anticipated value, above which the
information about procurements is collected in the official evidence of procurements’
records (see Table 1). Small lots are not regulated by the Public Procurement Act and
only general rules regarding efficiency in procurement pertain to them.
More importantly, procurements other than small lots are split by procurement
thresholds into below-limit procurements and above-limit procurements. The Public
Procurement Act decrees the highest degree of transparency for above-limit
procurements. Longer tendering deadlines apply to them and detailed information
about them must be published in a European-wide database, Tenders Electronic Daily
(TED)2. On the contrary, not all transparency standards are required in below-limit
procurements. They have shorter tendering deadlines and information about them
must be published only nationally-wide. National governments in the European Union
can impose specific exemptions for below-limit procurements into their legislatures.
Some additional thresholds apply only to particular contract-awarding procedures.
Procedures, which use anticipated value thresholds, are usually precluded from use if
the anticipated value exceeds the relevant threshold. These procedures usually
provide greater discretion to procuring officials below the threshold.
3.2 Major Changes to Statutory Thresholds
A large re-codification of the Czech public procurement code occurred in July 2006.3
The re-codification caused movements in a majority of procurement thresholds (see
Tables 2 and 3) and introduced a new type of simplified negotiating procedure into the
procurement legislation.
2 The information about TED contract notices is available from
http://ted.europa.eu/TED/main/HomePage.do 3 Until July 2006 public procurement had been regulated by Public Procurement Act no. 40/2004 Coll.
Since then the public procurement is regulated by act no. 137/2006 Coll., as amended. The standing
version of Public Procurement Act no. 137/2006 Coll. is available in English at:
http://www.portal-vz.cz/CMSPages/GetFile.aspx?guid=02f3f669-0f87-4f0e-913a-9bdfede93d36

9
Simplified negotiations were a procurement procedure restricted by maximum
thresholds of its own (Table 2). The reason for the introduction of a new procurement
procedure was to offer the procuring officials the opportunity to free themselves from
rigid rules, which regulated the open contract-awarding process above procurement
thresholds. In a trade-off, the law demanded that the procuring authorities would
invite at least five potential suppliers into each bidding process so as to guarantee
some degree of competition.
A major controversy was that the decision of which competitors would be invited to
bid was left at the full discretion of procuring authorities. In this way, the regulation
created a strong opportunity and nonlinear incentive for authorities to engage in
manipulations with anticipated values of procurement contracts.
The nonlinear incentive structure can promote manipulations with anticipated value
through several means. The thresholds may tempt officials to solicit bribes in exchange
for inflating the anticipated value of procurement, while holding it below the
threshold, so that the contract can be via restricted entry and selective invitations of
competitors more easily awarded to a contractor who offers a bribe. Alternatively, the
officials can split large contracts into several smaller ones, each smaller contract
procured slightly below the threshold. Thirdly, the procurement thresholds may
provide incentives for officials to underestimate the value of contracts that would
otherwise locate slightly above the thresholds. In this case, after the contract is
procured, amendments are made as soon as the contractor who offers a bribe wins it.
Although the amount of surplus between a contractor offering a bribe and the
authority who accepts it may vary across these manipulation techniques, all of them
share the same theoretical prediction: excess masses of procurement contracts
located just below procurement thresholds.

10
3.3 Other Classifications in Public Procurement
Classification by the main object of procurements is easy, as the Public Procurement
Act simply distinguishes between procurement of goods, construction works and
services. Procurement thresholds differ by the main procurement object.
Next, the procurement code recognizes six contract-awarding procedures, which are
described in greater detail in Appendix 1. The contract-awarding procedures differ in
their degree of openness to potential suppliers and by the amount of external
oversight applied to them. Public authorities can influence the choice of the contract-
awarding procedure through adjustments of the anticipated value of procurement.
Some procedures then allow direct restrictions to the number of evaluated
procurement bids, or they restrict the number of suppliers which are invited into
procurement negotiations.
Lastly, procurement authorities are classified into national bodies, regional public
bodies or state-owned utilities. Different thresholds apply to different types of public
procuring bodies. The national bodies include national procurers and agencies, central
government and its ministries. The regional bodies include regional and local bodies
and their agencies. State-owned utilities are the national monopolies, such as
energetic or gas companies or public transport providers. State-owned utilities are
altogether forbidden to use the simplified negotiating procurement procedure.

11
4. Data from Public Procurement Contracts
The available data on public procurement contracts includes characteristics of all
procurements awarded in the Czech Republic during the period from 2005 to 2010,
conditionally on their procurement process being governed at the relevant time by the
Czech Public Procurement Act. The database therefore contains only information on
contracts with anticipated value above the thresholds for small lots (see Table 1) and
does not contain data on contracts procured through legislative exemptions.
Altogether, this amounts to over 48, 000 procurement contracts, while the total
procurement volume in this investigation accounts to 1, 270 billion CZK (approximately
63.5 billion USD).
The data on procurement contracts were contract-by-contract screen-scraped from
the Official website of Public Procurement (ISVZ). The Czech Ministry of Regional
Development estimates that ISVZ contains information about approximately 50 - 55%
of the overall financial volume of public procurement performed in the Czech Republic.
The size of this share has to do with high financial thresholds for small lots in the Czech
Republic, which determine if information about a contract will be recorded in the
official evidence of records.
The unit of observation in this study is a procurement project, although several
contracts with different contractors may be procured within one project. The focus on
projects rather than on contracts is because the anticipated value of procurements
must be estimated at the level of an entire project, rather than separately for each
contract.
For each project the database includes information on characteristics of the procured
good/ service/ construction work, characteristics of the contract-awarding process,
characteristics of procuring bodies, winning contractors and – most importantly – the
anticipated values of procurements. From the dataset, this study disregards
voluntarily disclosed information below thresholds for small lots, as well as voluntarily
disclosed information about below-limit contracts procured by state-owned utilities.

12
Table 4 provides the summary statistics of all residual contracts in two observation
periods: before the major legislative re-codification of Public Procurement Act in July
2006 and afterwards. A general observation from Table 4 is that many procurement
categories differ in their representation by an absolute count and procurement
volume. For example, construction works are far more important when reweighted by
procurement volume. They account for almost 60% of the total procurement value in
the post-2006 period, while they represent only 36% of data by the count of contracts.
Also, the below-limit contracts are far more frequent in count than above-limit
contracts; however, in volume they constitute just 22-29% of the total procured value.
Dataset composition by contract-awarding procedures evidently changed after the re-
codification of the Public Procurement Act in 2006. More than 20% of procurement
volume moved from open procurement procedure to different kinds of negotiating
procedures: to simplified negotiations, negotiations with prior public notice, or
without it.4
Figure 1 then shows to what extent the procurement thresholds are important for
determining which contract-awarding procedure will be used in procurement within
the post-reform period. Figure 1 presents the relative shares of different contract-
awarding procedures in increasing anticipated value intervals. Simplified negotiations
are predominantly represented only up to the construction works maximum threshold
for simplified negotiations (20 million CZK). Above the threshold, only other types of
procurement procedures may be used.
4 Here, since the public procurements’ evidence of records ISVZ does not clearly distinguish between
simplified negotiations and negotiations with prior public notice, the two procedures are presented in
a single category in this study. The Ministry of Regional Development of the Czech Republic, however,
estimates that approximately 99% of contracts in this joint category (both by absolute count and
procurement value) are procured through simplified negotiations (Ministry of Regional Development
2012).
13
5. Empirical Analysis of Anticipated Value Manipulations
This section presents empirical evidence of manipulations of the anticipated value of
procurement contracts by procurement officials. The subsections are organized by the
three sources of empirical identification used in the paper. The fourth subsection
provides an array of placebo tests which attempt to detect discontinuities in contract-
awarding procedures that are unrestricted by statutory procurement thresholds.
5.1 Estimating the Counterfactual Distribution of Anticipated Value
I start with the identification technique, which is based upon an analysis of events that
should be rare, assuming a given statistical model of honest behavior of procuring
officials. The identification assumption, which underlies causal inferences about the
effect of legislative thresholds on anticipated value manipulations, is that the
anticipated value density distribution would be smooth if more restrictive tendering
procedures were not prohibited above the legislative thresholds.5
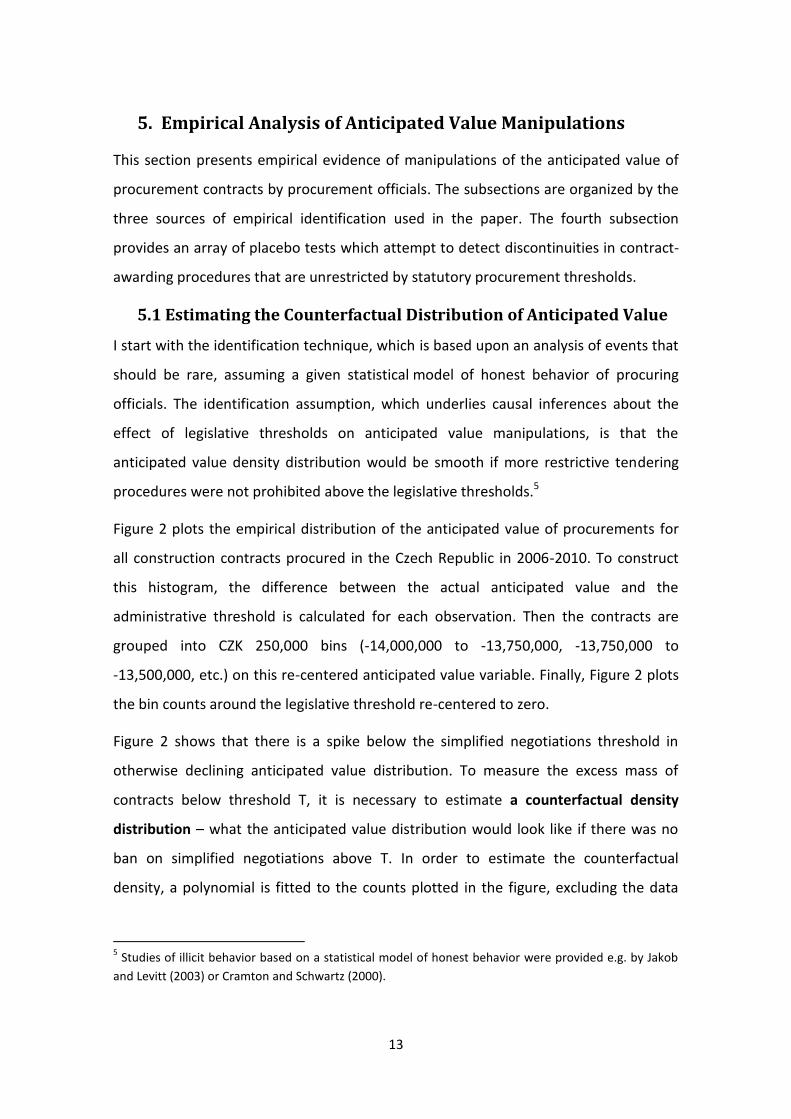
Figure 2 plots the empirical distribution of the anticipated value of procurements for
all construction contracts procured in the Czech Republic in 2006-2010. To construct
this histogram, the difference between the actual anticipated value and the
administrative threshold is calculated for each observation. Then the contracts are
grouped into CZK 250,000 bins (-14,000,000 to -13,750,000, -13,750,000 to
-13,500,000, etc.) on this re-centered anticipated value variable. Finally, Figure 2 plots
the bin counts around the legislative threshold re-centered to zero.
Figure 2 shows that there is a spike below the simplified negotiations threshold in
otherwise declining anticipated value distribution. To measure the excess mass of
contracts below threshold T, it is necessary to estimate a counterfactual density
distribution – what the anticipated value distribution would look like if there was no
ban on simplified negotiations above T. In order to estimate the counterfactual
density, a polynomial is fitted to the counts plotted in the figure, excluding the data
5 Studies of illicit behavior based on a statistical model of honest behavior were provided e.g. by Jakob
and Levitt (2003) or Cramton and Schwartz (2000).

14
below the threshold. This means that a polynomial regression of the following form is
estimated:
(1)
where Cj is the number of contracts in anticipated value bin j, Zj is anticipated value
relative to threshold in 250,000 CZK intervals (Zj = {-55, -54, .., 80}), q is the order of the
polynomial, and R denotes the width of the excluded region below the threshold
(measured in CZK 250,000).
Let BN denote the excess number of contracts that locate below the threshold.
Moreover, let b stand for the excess mass of contracts relative to the average density
at the threshold. The initial estimate of the counterfactual distribution is defined as
the predicted values from (1) omitting the contribution of the dummies below the
threshold:
. The excess number of contracts that locate below
the threshold is
.
This calculation overestimates because it does not account for the fact that the
additional contracts at the threshold come from points to the right of the threshold.
That is, it does not satisfy the constraint that the area under the counterfactual must
equal the area under the empirical distribution. To account for this problem, I shift the
counterfactual distribution to the right of the threshold upward until it satisfies the
integration constraint. Specifically, I define the counterfactual distribution
as the fitted values from the regression:
(2)
where
is the excess number of contracts at the
threshold implied by this counterfactual.6 Finally, I define my empirical estimate of b as
6 It is necessary to estimate (2) iteratively, because the dependent variable here depends upon the
estimates of . The excess mass is iteratively recomputed using the estimated until a fixed point
is reached. The bootstrapped standard errors that are reported below are adjusted for this iterative
estimation procedure. A comparable counterfactual distribution correction is used for the example by
Chetty et al. (2011).

15
the excess mass below the threshold relative to the average density of the
counterfactual anticipated contract value distribution between –R and 0:
(3)
The solid area beneath the empirical distribution in Figure 2 shows the counterfactual
density predicted using this procedure with a seventh-degree polynomial (q=7)
and a window of CZK 750,000 located just below the threshold (R=3). With these
parameters, I estimate b = 9.35 - the excess mass below the threshold is 935 % of the
average height of the counterfactual distribution within CZK 750, 000 below the
threshold. The first column of Table 5 presents these results. The qualitative results are
not sensitive to changes in q or R or to the way in which the counterfactual is corrected
to satisfy the integration constraint.7
I calculate a standard error for using a parametric bootstrap procedure. I draw from
the estimated vector of errors ξ j in (2) with replacement to generate a new set of
counts and apply the technique above to calculate a new estimate . I define the
standard error of as the standard deviation of the distribution of s. The standard
error associated with my estimate of b is 1.80. The null hypothesis that there is no
excess mass at the threshold relative to the counterfactual distribution is rejected with
a t-statistics of 5.207.
Using the same methodology, the study also finds statistically significant evidence of
manipulations with anticipated values of goods and services contracts. Figure 3
presents the visual inspection of these results, while the second and third columns of
Table 5 summarize the results quantitatively. The estimated excess mass at threshold
for goods contracts is 200% of the average height of the counterfactual distribution.
The estimated excess mass at the threshold for services is 303% of the average
counterfactual distribution height.
7 These qualitative results are also not sensitive to specifications accounting for other focal points
located within the anticipated value distribution (for example located at substantial round figures within
the distribution).

16
By a quick back-of-the-envelope calculation the results from Tables 4 and 5 suggest
that the anticipated value manipulations concern 8.6% of all below-limit procurement
contracts awarded after the re-codification of the Public Procurement Act in July
2006.8 This accounts to 3.7% of all contracts past July 2006. These figures are
quantitatively in line with the previous estimates of corruption prevalence in
procurement or service delivery. For a comparison, see Svensson (2005).
5.2 Exploiting the Timing of Introducing New Thresholds
The identification assumption of the smooth counterfactual density distribution can be
relaxed by exploiting the timing of introducing new thresholds into the procurement
law. This approach allows me to overcome an important deficiency of the existing
procurement studies, which were focused either only on specific procurement sectors
or only on selected standardized products.
Figure 4 displays the distribution of procurements’ anticipated value in each year from
2005-2010 for all construction works. In its subfigures, one can observe that the first
appearance of contract bunching in 2007 coincides almost exactly with the
introduction of the simplified negotiating threshold into the new procurement act (July
2006). In later years, the excess mass of contracts clings very closely to the legislative
threshold. The yearly estimates of discontinuities are summarized in Table 6. The re-
codification of the Procurement Act and the first emergence of discontinuities coincide
perfectly in the cases of goods and services contracts. In the case of construction
works, the discontinuity can be statistically detected only after a six month delay.
Explanations for the delay can vary. The new public procurement act constituted a
substantial change in the public procurement system, so the procuring authorities
might have needed several weeks or months to learn all administrative proceedings of
the new legislature. The procuring authorities might have discovered the advantages
of simplified negotiations only gradually through a learning and experience-sharing
process.
8 According to Tables 4 and 5, manipulations have occurred in 1,364 out of 15,865 below-limit
procurements.

17
On the contrary, one may argue here that the potential new opportunities for
corruption were evident very soon and that simplified negotiations were less complex
than other procedures, so there was not much to learn. Even in this case, the procuring
authorities would have needed some time to discern the level of controlling
authorities’ oversight over the new procedure, especially over potential manipulations
of the anticipated value of procurements.
Last, aside from the learning processes, the procurement process itself requires some
amount of time until contracts are finalized and published in the Information system.
Since the new law was passed in July 2006, the authorities may not have procured
enough contracts in the last two quarters of 2006 so that anticipated value
manipulations would become statistically significant sooner than 2007.
5.3 Does Contract Bunching Follow Inflation or Does it Stick to
Procurement Thresholds?
It is still possible that at the time of the legislative re-codification a change in the
governmental needs for construction projects that were worth approximately 20
million CZK occurred, and thus the needs coincided in size with the new procurement
threshold for construction works. Such a change in governmental needs would have
brought about a disproportionate representation of projects beneath the threshold
even in the absence of any manipulation. However, one would then expect that the
spike in the anticipated value density distribution, initially at 20 million, would shift
with inflation over time.
Therefore, this section exploits the variation in real prices of construction works
contracts over time. It uses the fact that procurement of construction works was
restricted by a nominally stable threshold for several years since the re-codification in
2006, while real prices in the construction industry were rising.
In Figure 5, I investigate whether the excess mass of construction contracts clings to
the procurement threshold or tracks inflation over time. I consider the period from
2007 to 2010, during which the simplified negotiations threshold declined in real
terms. Noting that the excess mass is located at the negotiations top threshold in

18
2007, the figure shows two possibilities for its location in 2010: the 2010 threshold and
the 2007 threshold adjusted for inflation in the construction industry.
Figure 5 shows that in the full sample of construction contracts, the excess mass
clearly clings to the 2010 threshold rather than following inflation. If one may have
conjectured that the mass of contracts below the threshold in 2007 was driven by
specific needs for projects, the size of which coincided with the threshold in 2007,
from Figure 5 one can infer that the procurement threshold is more important for
contract bunching than specific governmental needs.
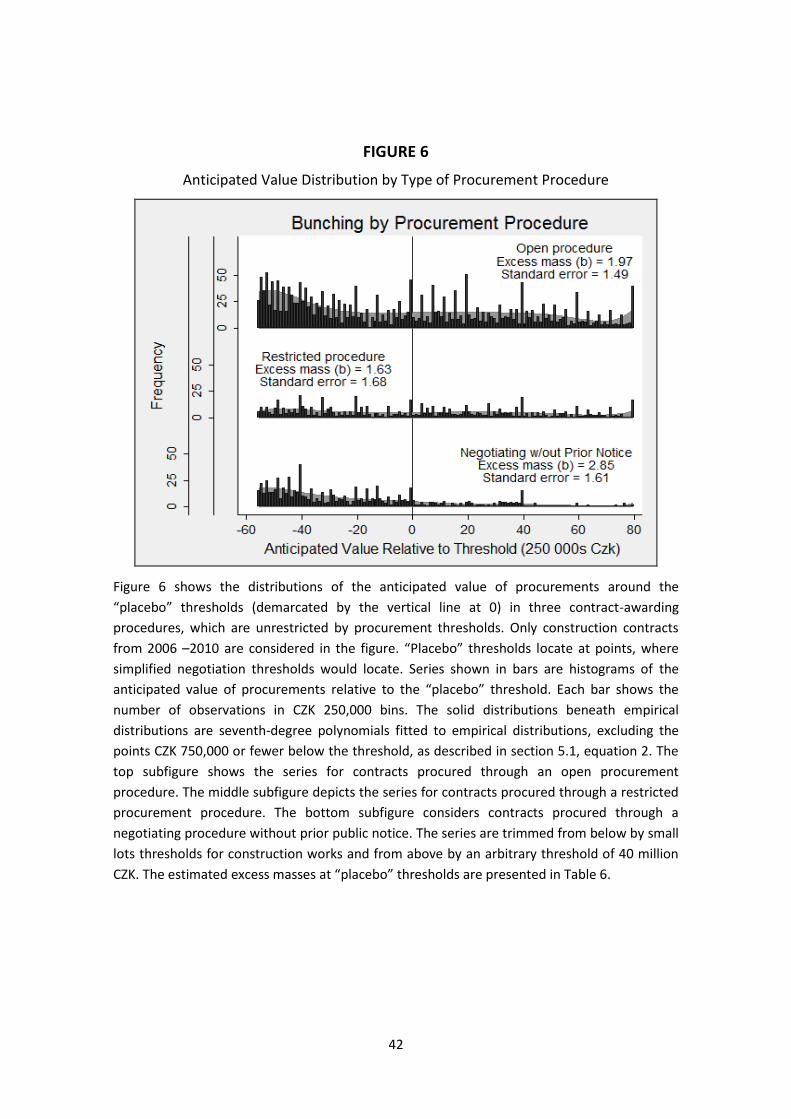
5.4 Heterogeneity in Bunching across Procurement Procedures –
Discontinuities at Placebo Thresholds
There is a substantial heterogeneity in the amount of contract bunching at the
thresholds for simplified negotiations across various types of procurement procedures.
Figure 6 estimates the excess mass of contracts at the simplified negotiations
threshold for three procedures, which are unrestricted by the simplified negotiations
threshold. The investigated procedures include the open procurement procedure, the
restricted procedure and the negotiating procedure without prior public notice.9
Figure 6 shows that in all three procedures a significant mass of contracts bunched
below the procurement threshold cannot be statistically discerned. Table 7
summarizes the quantitative results. These “placebo tests” confirm that the primary
source of excess mass below threshold is constituted by the overuse of the simplified
negotiating procurement procedure.
9 The procurement procedure of competitive dialogue was disregarded from Figure 5 due to a negligible
number of contracts procured through competitive dialogue.
19
6. Robustness Checks
In order to provide an alternative test of procurement contract bunching at the
legislative thresholds, this section applies the McCrary`s (2008) density test on the
available data of anticipated value of procurements. McCrary`s (2008) test is
commonly used for testing for undesirable sorting in the running variable in the
regression discontinuity design. The test can be particularly useful in applications
where a discontinuous density is itself the object of interest. Among such applications,
Saez (2010) measures tax evasion using the density discontinuities in reported income.
McCrary`s test consists of a simple extension of the local linear density estimator from
Cheng, Fan and Marron (1997). In a practical sense, it is implemented as a Wald test of
the null hypothesis that the discontinuity at threshold T is zero. The estimator
proceeds in two steps. In the first step, one obtains a finely-gridded histogram. In the
second step one smoothes the histogram using a local linear regression, separately on
either side of the selected threshold T.
The first-step histogram is based on the frequency table of a discretized version of the
examined variable,
(4)
where is the greatest integer in a.10 The histogram bins are defined carefully, so
that no bin includes points both to the left and to the right of the point of discontinuity
T. An equi-spaced grid X1, X2, …, XL of width w covers the support of g(zj). The
(normalized) cell size for the th bin is
while the first
step histogram is the scatter-plot (Xl, Yl).
The second step smoothes the histogram using a local linear regression. The midpoints
of the histogram bins are treated as a regressor, and the normalized counts of
observations falling into the particular bins are treated as the outcome variable. Local
linear smoothing is conducted separately for the bins to the right and left of the point
of the discontinuity so as to account for potential discontinuity in the density.
10
The greatest integer in a is the unique integer k so that k ≤ a < k+1 (“round to the left”).

20
Formally, the density estimate is given by where
minimize
K(.) is a kernel function, here chosen as the triangle kernel
, h is the bandwidth, or the window width, which defines the
observations that are included in the local regression. This way most weight is given to
the bins nearest the point where one is trying to estimate the density. The entire
density function, f(z), is estimated by looping over the evaluation points z.
The estimate of density discontinuity and main parameter of interest is the log
difference in height
(5)
While one can estimate and using for z just above and below T,
respectively, it is easier and more accurate to estimate two separate local linear
regressions, one on either side of T. The log difference of the coefficients on the
intercepts then estimates θ. Formally
(6)
=
where
and .
McCrary (2008) proves that under standard nonparametric regularity conditions, is
consistent and asymptomatically normal. An approximate implied standard error for
is
(7)
The t-tests, constructed using this standard error, are shown to be very close to
normally distributed under the null hypothesis.
Figure 7 presents the estimate of the density function of the anticipated value of public
construction works’ contracts. The curve was estimated using the local linear estimator
outlined in this section with evaluation points X1, X2, …, XL. The bandwidth and bin size
21
were selected subjectively after using an automatic procedure proposed by McCrary
(2008)11. The figure uses a bin size w=250,000 and a bandwidth h=2,000,000. The
automatic procedure would select a bin size of w=191,313 and a bandwidth h =
4,749,168. The automatic procedure would over-smooth the histogram.12
Figure 7 strongly suggests that the underlying density function is discontinuous at the
threshold for simplified negotiations (in the figure the threshold is re-centered to
zero). Importantly, the first step histogram reveals that this is not the result of under-
smoothing. Both the first step histogram and the local linear smoother indicate that
contracts within hundreds of thousands of CZK of the threshold are much more likely
to be procured below the threshold than above it.
Table 8 presents the parameters estimated using local linear regressions for all types
of the main object of procurements along with their respective simulated standard
errors.13 The estimated log discontinuities are -329.1%, -45.7%, and -80.1% for
construction works, goods, and services contracts, respectively. All estimates are highly
statistically significant with t-ratios of -13.53, -4.4 and -10.09 for construction works,
goods, and services contracts, respectively. These results provide a robustness check
consistent with the prior analysis of excess masses of contracts below the
procurement thresholds for simplified negotiations.
11
Pagan and Ullah (1999) and Deaton (1997) point out the effectiveness of subjective bandwidth choice. 12
McCrary (2008) states that for a fixed bandwidth, the estimator is robust to different choices of bin
size, provided that h/w >10, which is the case in this specification. 13
I follow Horowitz (2001), Hall (1992) and McCrary (2008) and when estimating the standard error I
under-smooth the local linear estimator by choosing a half bandwidth with respect to the reference
bandwidth. The cited authors recommend this procedure in order to reduce the bias associated with a
bandwidth which minimizes the asymptotic mean square error.
22
7. Discussion
The advantage of an economic approach to identifying manipulative behavior is that it
yields a clear understanding of the incentive structure that drives manipulations of
anticipated value. Were there no thresholds in procurement legislature, there would
be little contract bunching. Nonetheless, despite evidence of manipulations, one
weakness of this study is that it is not capable of pinpointing whether manipulations
are driven by active or passive waste. Active waste entails direct or indirect benefit for
the public official, typically due to corruption. In contrast, passive waste can result
from the lack of skill or motivation of procurement officials to apply more demanding
procedures above thresholds.
This section discusses the available evidence regarding the potential of manipulations
being driven by corruption. It evaluates to what extent the practice of contract
bunching is concentrated among procuring authorities. This inspection can be useful
for postulating policy recommendations, as different sources of waste require different
policy changes.
7.1 Concentration of Manipulations among Contracting Authorities
The main conjecture about the concentration of manipulations among contracting
authorities is as follows: if passive waste were driving the manipulations, excessive
contract bunching should be typical across a large majority of authorities. For example,
Bandiera, Prat and Valletti (2009) consistently find that passive waste accounts for a
most of waste in a large majority of their sample procuring authorities. On the other
hand, if manipulation is driven by active waste (and public bodies presumably differ in
the degree of their corruptibility), significant differences in bunching across procuring
authorities could be expected. For example, Olken (2006) finds that illicit behavior, in
his case the theft of subsidized rice in Indonesia, was highly concentrated in only a
small number of villages.
In order to assess the concentration of contract bunching at the level of procuring
authorities, several measures of discontinuities in the anticipated value are created in
this section (for a comparison see Camacho and Conover (2011)). All evaluated
23
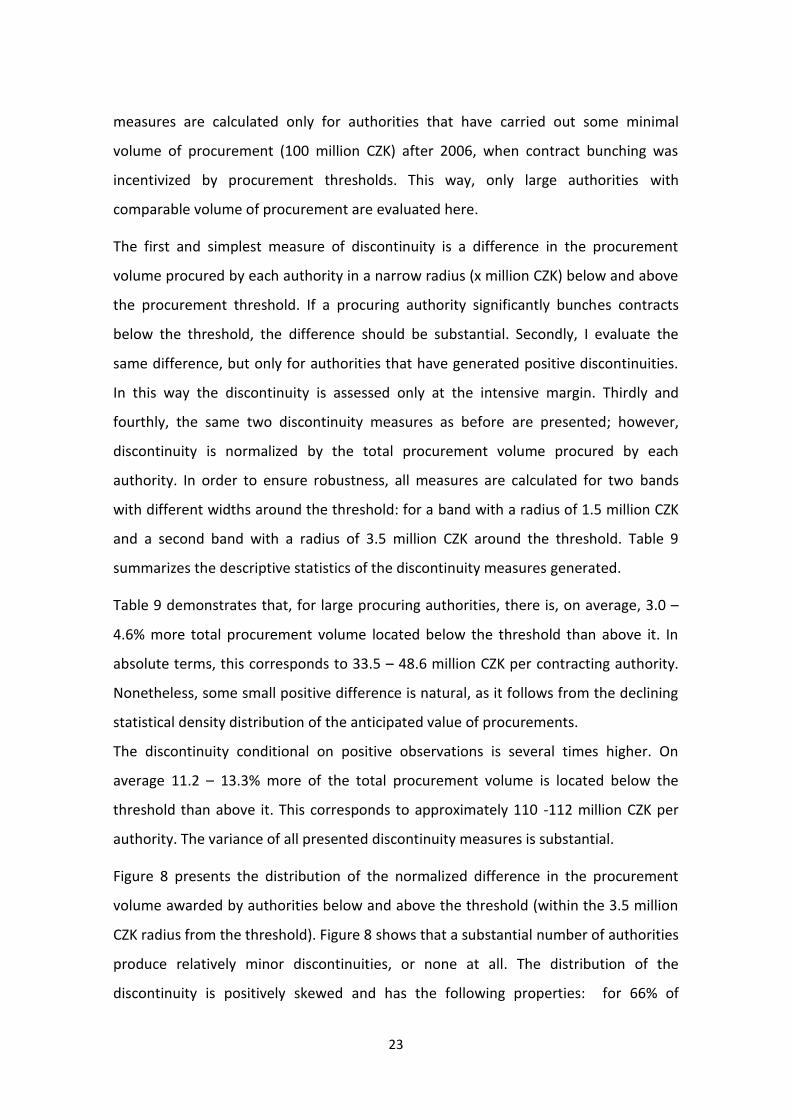
measures are calculated only for authorities that have carried out some minimal
volume of procurement (100 million CZK) after 2006, when contract bunching was
incentivized by procurement thresholds. This way, only large authorities with
comparable volume of procurement are evaluated here.
The first and simplest measure of discontinuity is a difference in the procurement
volume procured by each authority in a narrow radius (x million CZK) below and above
the procurement threshold. If a procuring authority significantly bunches contracts
below the threshold, the difference should be substantial. Secondly, I evaluate the
same difference, but only for authorities that have generated positive discontinuities.
In this way the discontinuity is assessed only at the intensive margin. Thirdly and
fourthly, the same two discontinuity measures as before are presented; however,
discontinuity is normalized by the total procurement volume procured by each
authority. In order to ensure robustness, all measures are calculated for two bands
with different widths around the threshold: for a band with a radius of 1.5 million CZK
and a second band with a radius of 3.5 million CZK around the threshold. Table 9
summarizes the descriptive statistics of the discontinuity measures generated.
Table 9 demonstrates that, for large procuring authorities, there is, on average, 3.0 –
4.6% more total procurement volume located below the threshold than above it. In
absolute terms, this corresponds to 33.5 – 48.6 million CZK per contracting authority.
Nonetheless, some small positive difference is natural, as it follows from the declining
statistical density distribution of the anticipated value of procurements.
The discontinuity conditional on positive observations is several times higher. On
average 11.2 – 13.3% more of the total procurement volume is located below the
threshold than above it. This corresponds to approximately 110 -112 million CZK per
authority. The variance of all presented discontinuity measures is substantial.
Figure 8 presents the distribution of the normalized difference in the procurement
volume awarded by authorities below and above the threshold (within the 3.5 million
CZK radius from the threshold). Figure 8 shows that a substantial number of authorities
produce relatively minor discontinuities, or none at all. The distribution of the
discontinuity is positively skewed and has the following properties: for 66% of

24
considered authorities, the difference in the volume of procurements below and above
the threshold was not larger than 5% of the total volume of procurements. For 75% of
authorities, the difference was lower than 10% of their total procurement volume.
On the other hand, in the upper decile of authorities with largest discontinuities, each
authority has allocated at least 17% of total procurement volume more below the
threshold than above it. The largest discontinuity reached 62.4% more total
procurement volume below the threshold than above it.
Judging from numerous statistics, contract bunching is concentrated among a narrow
group of procuring authorities. These authorities seem to artificially avoid open
procurement procedures and to excessively restrict procurement competition through
AV manipulations. Other procuring authorities apparently generate only minor
discontinuities or none at all.

25
8. Conclusion
This study has used publicly available data on public procurement contracts in order to
uncover patterns suggestive of corrupt behavior. By nonparametric econometric
methods, it has demonstrated that procuring officials in Czech public procurement
apparently manipulate the anticipated values of procurement contracts in order for
these contracts to be awarded through more restricted and less transparent
procurement procedures. The incentive for officials to indulge in anticipated value
manipulation and avoidance of open procurement was created by the nonlinear
structure of procurement regulation. Below certain thresholds decreed by the Public
Procurement Act, the procuring authorities have had, for example, sole discretion to
invite any five contractors of their choice into the procurement process, excluding all
others. Such nonlinearities have created opportunities and nonlinear incentives for
corruption and generally active waste.
Considering all evidence is important when postulating policy recommendations. For
example, should procurement officials be allowed to choose among procurement
procedures more freely? This study has found that excessive contract bunching was
typical only for a small fraction of authorities, while other procuring bodies were
generating only minor discontinuities in the anticipated value. The underlying reason
for excessively massing contracts, therefore, seemed to lie in the misalignment
between the preferences of a minority of procurement bodies and those of society.
The optimal delegation literature advises in such cases to call for stricter rules and
external controls (e.g. Alonso and Matouschek 2008).
However, according to Kelman (1990, 2005) the policy of strict rules and external
oversight can have detrimental effects if the underlying problem is indeed driven by
passive waste and inefficiency. This seems to be the case of other authorities who
generate minor discontinuities. Tadelis (2009) empirically demonstrates in his study
that open procurement procedures, such as auctions, may perform poorly in cases
when projects are complex, contractual design is incomplete or there are few available
bidders. This may have been the case of many construction projects scrutinized in this
26
study. Kelman (1990, 2005) advises in such cases to ease the rigidity of procurement,
which would, in these circumstances, require altering procurement procedures above
thresholds to be less administratively demanding and more flexible to the entry of
additional competitors. The side effects may include increased procurement quality
and reduced transaction costs.
The overall effect of increasing the effectiveness of procurement may be manifold:
both through the direct effect on savings and optimization of contractor choice, and
indirectly through increased competitiveness, transparency and trust in the fairness of
the procurement process. The procurement environment would surely benefit from
identification of its weak points.
Finally, a substantial advantage of this analysis is that it provides the controlling bodies
with a new tool for analyzing fairness and manipulation in procurement competition.
Under their limited resources, this analysis suggests that it may be worthwhile to
investigate first those authorities which perform significant manipulations with the
anticipated value of procurements. Forensic literature, moreover, teaches that even if
anticipated value manipulations were themselves blameless, small-scale manipulations
tend to be well-correlated with larger-scale malfeasance (Fisman and Miguel 2007,
Zitzewitz 2012). Nonetheless, since the economic approach to identifying illicit
behavior relies on recognizing systematic patterns emerging over large samples
(Wolfers 2006), it is often beyond the reach of economists to pinpoint specific culprits.

27
References:
ALONSO, R. and N. MATOUSCHEK (2008): “Optimal Delegation,” Review of Economic
Studies, 75(1), 259-293.
BAKER, G. (1992): “Incentive Contracts and Performance Measurement,” Journal of
Political Economy, 100(3), 598-614.
BALDWIN, L. and R. MARSHALL and J. RICHARD (1997): “Bidder Collusion at Forest
Service Timber Sales,” Journal of Political Economy, 105(4), 657-99.
BANDIERA, O. and A. PRAT and T. VALLETTI (2009): “Active and Passive Waste in
Government Spending: Evidence from a Policy Experiment,” American Economic
Review, 99(4), 1278-1308.
BANFIELD, E. (1975): “Corruption as a Feature of Governmental Organization,” Journal
of Law and Economics, 18(3), 587-605.
BARDHAN, P. (1997): “Corruption and Development: A Review of Issues,” Journal of
Economic Literature, 35(3), 1320-46.
BARR, A. and D. SERRA (2010): “Corruption and Culture: An Experimental Analysis,”
Journal of Public Economics, 94(11-12), 862-69.
BECKER, G. and G. STIGLER (1974): “Law Enforcement, Malfeasance, and
Compensation of Enforcers,” The Journal of Legal Studies, 3(1), 1-18.
BULOW, J. and P. KLEMPERER (1996): “Auctions versus Negotiations,” American
Economic Review, 86(1), 180-94.
CAMACHO, A. and E. CONOVER (2011): “Manipulation of Social Program Eligibility,”
American Economic Journal: Economic Policy, 3(2), 41-65.
CHENG, M. and J. FAN and J. MARRON (1997): “On Automatic Boundary Corrections,”
The Annals of Statistics, 25(4), 1691–1708.
CHETTY, R. and J. FRIEDMAN and T. OLSEN and L. PISTAFERRI (2011): “Adjustment
Costs, Firm Responses, and Micro vs. Macro Labor Supply Elasticities: Evidence from
Danish Tax Records,” The Quarterly Journal of Economics, 126(2), 749-804.
COVIELLO, D. and M. MARINIELLO (2012): “Publicity Requirements in Public
Procurement: Evidence from a Regression Discontinuity Design,”
28
http://www.siecon.org/online/wp-content/uploads/2012/08/Coviello-Mariniello.pdf.
CRAMTON, P. and J. SCHWARTZ (2000): “Collusive Bidding: Lessons from the FCC
Spectrum Auctions,” Journal of Regulatory Economics, 17 (3), 229–52.
DEATON, A. (1997): “The Analysis of Household Surveys: A Microeconomic Approach
to Development Policy,” Washington, D.C.: World Bank.
DI TELLA, R. and E. SCHARGRODSKY (2003): “The Role of Wages and Auditing during a
Crackdown on Corruption in the City of Buenos Aires,” Journal of Law and Economics,
46(1), 269-92.
EUROPE ECONOMICS (2006): “Evaluation of Public Procurement Directives,” European
Commission, DG Internal Market.
FISMAN, R. and E. MIGUEL (2007): “Corruption, Norms, and Legal Enforcement:
Evidence from Diplomatic Parking Tickets,” Journal of Political Economy, 115(6), 1020-
48.
GLEASER, E. and A. SHLEIFER (2001): “A Reason for Quantity Regulation,” American
Economic Review, 91(2), 431-435.
HALL, P. (1992): “Effect of Bias Estimation on Coverage Accuracy of Bootstrap
Confidence Intervals for a Probability Density,” The Annals of Statistics, 20(2), 675–
694.
HOLSTROM, B. and P. MILGROM (1991): “Multitask Principal-Agent Analyses: Incentive
Contracts, Asset Ownership, and Job Design,” Journal of Law, Economics, and
Organization, 7, 24-52.
HOROWITZ, J. (2001): “The Bootstrap,” in The Handbook of Econometrics, eds. James J.
Heckman and Edward Leamer, 5, pages 3463–3568. New York: Elsevier.
JACOB, B. and S. LEVITT (2003): “Rotten Apples: An Investigation of the Prevalence and
Predictors of Teacher Cheating,” The Quarterly Journal of Economics, 118(3), 843-877.
KAMENIK, M. (2011): “Otevřenost zadávacích řizení v ČR,” Prague: Oživení.
KELMAN, S. (1990): “Procurement and Public Management: The Fear of Discretion and
the Quality of Public Performance,” Washington, DC: The AEI Press.

29
KELMAN, S. (2005): “Unleashing Change: A Study of Organizational Renewal in
Government,” Washington, DC: Brookings Institution Press.
LAMBSDORFF, J. G. (2006): “Causes and Consequences of Corruption: What Do We
Know from a Cross-Section of Countries?” in International Handbook on the Economics
of Corruption, ed. Susan Rose-Ackerman, pages 3-51. Cheltenham, UK: Edward Elgar.
MANELLI, A. and D. VINCENT (1995): “Optimal Procurement Mechanisms,”
Econometrica, 63(3), 591-620.
MAURO, P. (1995): “Corruption and Growth,” Quarterly Journal of Economics, 110(3),
681-712.
MAURO, P. (2004): “The Persistence of Corruption and Slow Economic Growth,” IMF
Staff Papers, 51(1), 1-18.
MINISTRY OF THE REGIONAL DEVELOPMENT OF THE CZECH REPUBLIC (2012): “The
Annual Report on the Condition of Public Procurement in the Czech Republic,” Prague:
Ministry of the Regional development of the Czech Republic.
MCCRARY, J. (2008): “Manipulation of the Running Variable in the Regression
Discontinuity Design: A Density Test,” Journal of Econometrics, 142(2), 698-714.
MCMILLAN, J. (1991): “Dango: Japan’s Price-Fixing Conspiracies,” Economics and
Politics, 3(3), 201-218.
OECD (2010): “Government at a Glance 2009.” OECD Publishing.
OLKEN, B. (2006): “Corruption and the costs of redistribution: Micro evidence from
Indonesia,” Journal of Public Economics, 90(4-5), 853-870.
PAGAN, A. and A. ULLAH (1999): “Nonparametric Econometrics,” New York: Cambridge
University Press.
PAVEL, J. (2006): “Ukazatele transparentnosti trhu veřejných zakázek v České
Republice,” Prague: Transparency International – Czech Republic.
PORTER, R. and J. ZONA (1993): “Detection of Bid Rigging in Procurement Auctions,”
Journal of Political Economy, 101(3), 518-38.
PORTER, R. and J. ZONA (1999): “Ohio School Milk Markets: An Analysis of Bidding,”
RAND Journal of Economics, 30(2), 263-288.

30
ROSE-ACKERMAN, S. (1975): “The economics of corruption,” Journal of Public
Economics, 4(2), 187-203.
SAEZ, E. (2010): “Do Taxpayers Bunch at Kink Points?” American Economic Journal:
Economic Policy, 2(3), 180-212.
SHLEIFER, A. and R. VISHNY (1993): “Corruption,” The Quarterly Journal of Economics,
108(3), 599-617.
SVENSSON, J. (2005): “Eight Questions about Corruption,” Journal of Economic
Perspectives, 19(3), 19-42.
TADELIS, S. (2009): “Auctions versus Negotiations in Procurement: An Empirical
Analysis,” Journal of Law, Economics and Organization, 25(2), 372-399.
TRANSPARENCY INTERNATIONAL CZECH REPUBLIC (2007): “Odhad neefektivně
vynaložených veřejných zdrojů ve veřejných zakázkách,” Prague: Transparency
International – Czech Republic.
WOLFERS, J. (2006): “Point Shaving: Corruption in NCAA Basketball,” American
Economic Review, 96(2), 279-283.
ZITZEWITZ, E. (2012): “Forensic Economics,” Journal of Economic Literature, 50(3),
731–69.
31
Tables and Figures
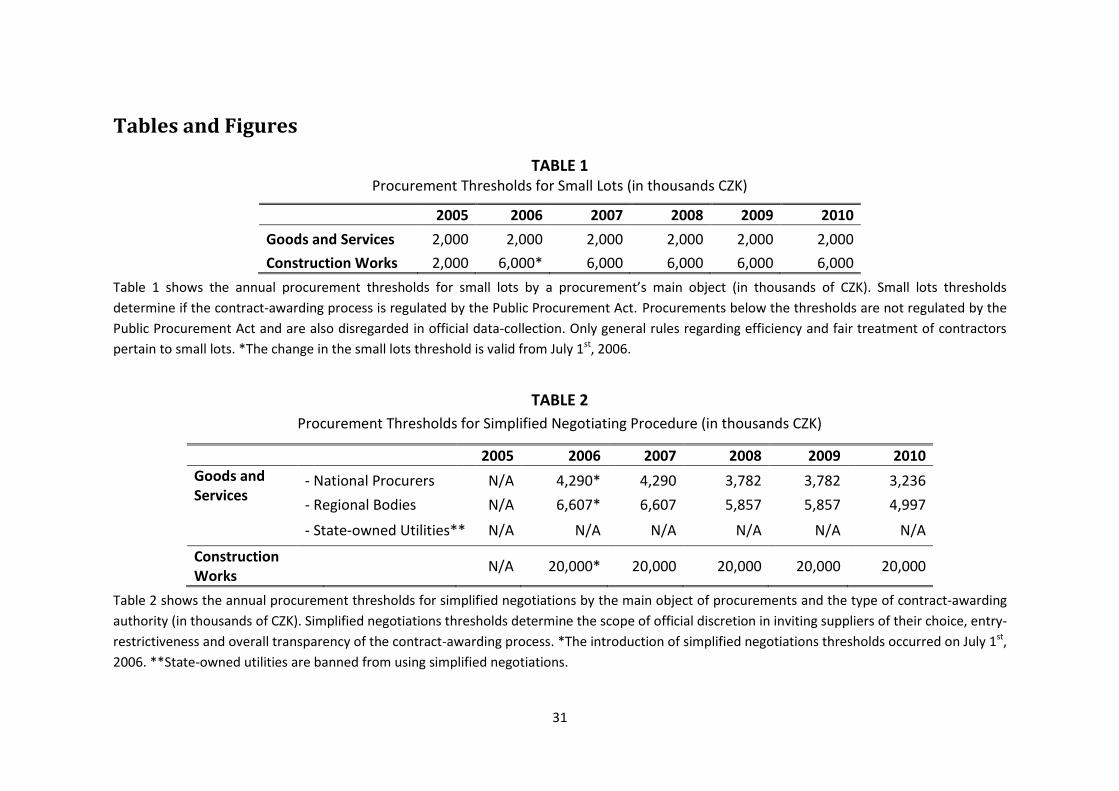
TABLE 1 Procurement Thresholds for Small Lots (in thousands CZK)
2005 2006 2007 2008 2009 2010
Goods and Services 2,000 2,000 2,000 2,000 2,000 2,000
Construction Works 2,000 6,000* 6,000 6,000 6,000 6,000
Table 1 shows the annual procurement thresholds for small lots by a procurement’s main object (in thousands of CZK). Small lots thresholds
determine if the contract-awarding process is regulated by the Public Procurement Act. Procurements below the thresholds are not regulated by the
Public Procurement Act and are also disregarded in official data-collection. Only general rules regarding efficiency and fair treatment of contractors
pertain to small lots. *The change in the small lots threshold is valid from July 1st, 2006.
TABLE 2
Procurement Thresholds for Simplified Negotiating Procedure (in thousands CZK)
2005 2006 2007 2008 2009 2010
Goods and Services
- National Procurers N/A 4,290* 4,290 3,782 3,782 3,236
- Regional Bodies N/A 6,607* 6,607 5,857 5,857 4,997 - State-owned Utilities** N/A N/A N/A N/A N/A N/A
Construction Works
N/A 20,000* 20,000 20,000 20,000 20,000
Table 2 shows the annual procurement thresholds for simplified negotiations by the main object of procurements and the type of contract-awarding
authority (in thousands of CZK). Simplified negotiations thresholds determine the scope of official discretion in inviting suppliers of their choice, entry-
restrictiveness and overall transparency of the contract-awarding process. *The introduction of simplified negotiations thresholds occurred on July 1st,
2006. **State-owned utilities are banned from using simplified negotiations.
32
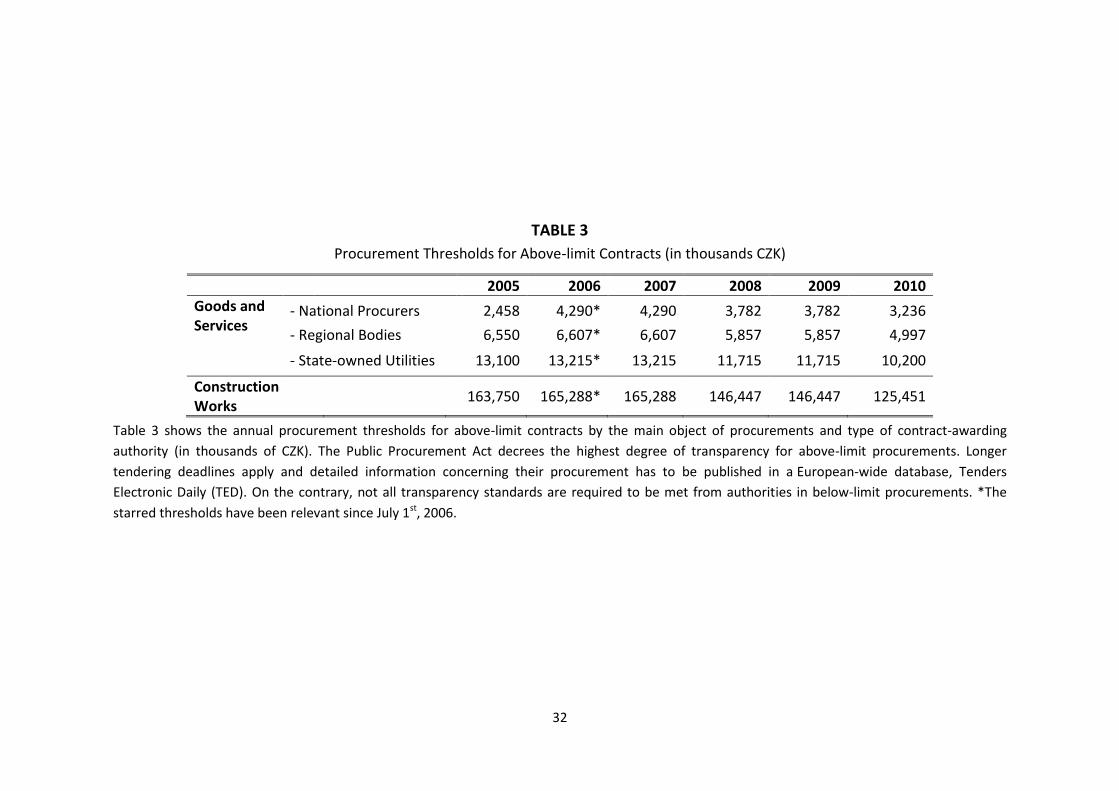
TABLE 3
Procurement Thresholds for Above-limit Contracts (in thousands CZK)
2005 2006 2007 2008 2009 2010
Goods and Services
- National Procurers 2,458 4,290* 4,290 3,782 3,782 3,236
- Regional Bodies 6,550 6,607* 6,607 5,857 5,857 4,997 - State-owned Utilities 13,100 13,215* 13,215 11,715 11,715 10,200
Construction Works
163,750 165,288* 165,288 146,447 146,447 125,451
Table 3 shows the annual procurement thresholds for above-limit contracts by the main object of procurements and type of contract-awarding
authority (in thousands of CZK). The Public Procurement Act decrees the highest degree of transparency for above-limit procurements. Longer
tendering deadlines apply and detailed information concerning their procurement has to be published in a European-wide database, Tenders
Electronic Daily (TED). On the contrary, not all transparency standards are required to be met from authorities in below-limit procurements. *The
starred thresholds have been relevant since July 1st, 2006.

33
TABLE 4 Descriptive statistics
Characterization:
January 2005 - June 2006 July 2006 - December 2010
Contracts (%) Volume
(billion CZK) (%) Contracts (%)
Volume (billion CZK)
(%)
By main object: - Goods 1,666 0.23 56.97 0.25 11,829 0.29 179.96 0.17 - Services 1,221 0.17 48.25 0.21 14,603 0.35 247.87 0.24 - Construction works 4,272 0.60 126.25 0.55 14,758 0.36 610.24 0.59
By contract-awarding procedure: - Open 5,534 0.77 197.03 0.85 20,331 0.49 662.41 0.64 - Restricted 1,565 0.22 31.17 0.13 1,658 0.04 95.18 0.09 - Simplified Negotiations and
60 0.01 3.27 0.01
12,673 0.31 146.62 0.14 Negotiations with Prior Public Notice* - Negotiations w/out Prior Public Notice N/A** N/A** N/A** N/A** 5,779 0.14 126.80 0.12 - Competitive Dialogue N/A** N/A** N/A** N/A** 25 0.00 2.32 0.00
By anticipated value: - Below-limit contracts 5,325 0.74 66.55 0.29 15,865 0.39 232.04 0.22 - Above-limit contracts 1,834 0.26 164.93 0.71 21,292 0.52 806.40 0.78
By procuring authority‘s type: - National Procurers 3,418 51.60 119.85 0.52 22,985 0.56 561.19 0.54 - Regional Bodies 3,462 48.36 58.16 0.25 16,587 0.40 306.33 0.29 - State-owned Utilities 279 0.04 53.47 0.23 1,618 0.04 171.55 0.17
Table 4 includes summary statistics for contracts procured both under the old and the new Public Procurement Act, which has been valid since July 2006. Statistics are provided both by count of procurement projects and by the procurement project volume (in billion CZK; 20 CZK ≈ 1 USD). *Contract-awarding procedures of simplified negotiations and negotiations with prior public notice are merged into one category due to the nature of procurement contracts evidence of records. **N/A mark indicates the non-applicability of statistics for a given observation period.

34
TABLE 5
Polynomial Regressions Estimates of Excess Mass below Threshold
Construction
Works Goods Services
9.352*** 1.996*** 3.027***
[1.850] [0.236] [0.275]
581 282 501
N 8,830 5,228 6,357
Table 5 shows the estimates of excess masses of contracts bunched below thresholds for
simplified negotiations, estimated using the main specification outlined in section 5.1.
Estimates are provided by the main object of the main procurements. A seventh-degree
polynomial and a CZK 750,000 window located just below the threshold were used in order to
predict the counterfactual density of the anticipated value of procurements.
denotes the estimated excess number of contracts below the threshold, and
denotes the excess mass of contracts relative to the average density at the threshold.
Standard errors are presented in parentheses. ***Estimates significant at the 1% level.
**Estimates significant at the 5% level. *Estimates significant at the 10% level.
TABLE 6
Estimated Excess Mass below Threshold by Year and Main Object
Construction Works Goods Services
Year Excess Mass
Estimates SE Excess Mass
Estimates SE Excess Mass
Estimates SE
2005 2.861 [1.902] 0.410 [0.552] - 0.025 [0.577] 2006 2.628 [1.891] 1.635*** [0.257] 0.800*** [0.294] 2007 12.100*** [2.697] 1.389*** [0.427] 3.162*** [0.460] 2008 8.965*** [1.651] 1.799*** [0.494] 2.121*** [0.478] 2009 11.190*** [2.504] 1.901*** [0.522] 2.503*** [0.561] 2010 8.954*** [1.990] 2.362*** [0.360] 2.852*** [0.371]
Table 6 shows the estimates of excess masses of contracts bunched below thresholds for
simplified negotiations estimated using the main specification outlined in section 5.1.
Estimates are provided by the main object of the procurements and observation period. A
legislative re-codification, which established new thresholds into the procurement law,
occurred in midyear 2006. A seventh-degree polynomial and a CZK 750,000 window located
just below the threshold were used in order to predict the counterfactual density of the
anticipated value of procurements. Estimates represent the estimated excess mass of
contracts relative to the average density at thresholds. Standard errors are presented in
parentheses. ***Estimates significant at the 1% level. **Estimates significant at the 5% level.
*Estimates significant at the 10% level.
35
TABLE 7 Estimated Excess Masses in Procedures Unrestricted by Procurement Thresholds
Open Restricted Negotiating
w/out Prior Public Notice
1.972 1.625 2.845
[1.494] [1.683] [1.606] N 2,215 684 767
Table 7 shows the estimates of excess masses of contracts for three procurement procedures,
unrestricted by procurement thresholds. Excess masses are estimated at “placebo” thresholds,
which locate at points in anticipated value distribution where simplified negotiations threshold
would apply. The main specification outlined in section 5.1, equation 2 is employed in the
estimation. Only construction works contracts from 2006 - 2010 are considered in the
estimation. A seventh-degree polynomial and a CZK 750,000 window located just below the
“placebo” thresholds were used in order to predict the counterfactual density of the
anticipated value of procurements. Estimates represent the estimated excess masses of
contracts relative to the average density at threshold. Standard errors are presented in
parentheses. ***Estimates significant at the 1% level. **Estimates significant at the 5% level.
*Estimates significant at the 10% level.
TABLE 8 Log Density Discontinuity Estimates
Construction Works Goods Services
- 3.291*** - 0.457*** - 0.801***
[0.243] [0.104] [0.079]
N 9,067 6,869 8,518
Table 8 presents the log estimates of discontinuity in the density of the anticipated value of
procurements. Discontinuity estimates were obtained using a local linear density estimator
described in section 6. Simulated standard errors are presented in parentheses. ***Estimates
significant at the 1% level. **Estimates significant at the 5% level. *Estimates significant at the
10% level.

36
TABLE 9
Density Discontinuities per Public Authority
Radius around threshold: +/- 1.5 mil. CZK Mean SD Min Max N
AV Discontinuity: - in million CZK 33.5 266 - 42 4,920 391 - in million CZK cond. on positive discontinuity 110 464 1.71 4,920 124
- relative to total volume by authority .030 .081 - .175 .506 391 - relative to total volume by authority cond. on positive discontinuity
.112 .094 .001 .506 124
Radius around threshold: +/- 3.5 mil. CZK Mean SD Min Max N
AV Discontinuity: - in million CZK 48.6 396 -60.3 7,470 385 - in million CZK cond. on positive discontinuity 112 577 1.29 7,470 178
- relative to total volume by authority 0.046 0.119 -0.366 0.624 385 - relative to total volume by authority cond. on positive discontinuity
0.133 0.112 0.001 0.624 178
Table 9 shows various measures of Anticipated Value (AV) Discontinuities calculated at the
level of individual public procuring authorities. Measures of discontinuity are calculated as a
difference in procurement volume procured by an authority in a narrow radius above the
threshold (x million CZK), minus the procurement volume in the same neighborhood below the
threshold. The closer to 0, the smaller the discontinuity at the threshold. Table 9 also shows AV
discontinuities calculated only for authorities that generated positive discontinuities. Thirdly,
Table 9 shows AV discontinuities in relative terms, which are the same discontinuities as
before, only normalized by an overall procurement volume procured by a contracting
authority.

37
FIGURE 1
Procurements in Anticipated Value Intervals by Contract-Awarding Procedure
Figure 1 shows the structure of procurement contracts database by type of contract-awarding procedure in the 2006 – 2010 period (under the new
Public Procurement Act). Contracts are divided into anticipated value intervals, each interval being 1 million CZK wide. Digits below bars denote the
upper limit of anticipated value interval (in million CZK). Competitive dialogue is disregarded from the figure as it accounts for only a negligible
number of contracts. Simplified negotiations and negotiations with prior public notice are presented jointly, due to the nature of the evidence of
records of public procurement contracts. The figure is trimmed from below by a small lots threshold for construction works and from above by an
arbitrary threshold of 40 million CZK. 20 million CZK is the statutory threshold for simplified negotiations of construction works.

38
FIGURE 2
Anticipated Value Density Distribution around Threshold for Simplified Negotiations
Figure 2 shows the distribution of the anticipated value of procurements around the threshold
for simplified negotiations (re-centered to 0) for construction contracts between 2006 –2010.
The series shown in bars is a histogram of the anticipated value of construction works, relative
to the procurement threshold. Each bar shows the number of observations in CZK 250,000
bins. The solid distribution beneath the empirical distribution is a seventh-degree polynomial
fitted to the empirical distribution, excluding the points CZK 750,000 or fewer below the
threshold, as described in section 5.1, equation 2. The series is trimmed from below by a small
lots threshold for construction works and from above by an arbitrary threshold of 40 million
CZK. Otherwise, a full sample of construction contracts is considered. The estimated excess
mass at the threshold is 935% of the average height of the counterfactual distribution
beneath.

39
FIGURE 3
Anticipated Value Density Distributions around Thresholds for Goods and Services
Figures 3 shows the distributions of the anticipated value of procurements around the thresholds for simplified negotiations (re-centered to 0). Panel
(a) shows goods procurements and panel (b) services procurements. The series shown in bars are histograms of the anticipated value of
procurements, relative to the procurement thresholds. Each bar shows the number of observations in CZK 250,000 bins. The solid distributions
beneath empirical distributions are seventh-degree polynomials fitted to empirical distributions excluding the points CZK 750,000 or fewer below the
threshold, as described in section 5.1, equation 2. The series are trimmed from below by small lots thresholds for goods and services and from above
by an arbitrary threshold of 40 million CZK. Otherwise, full samples of goods and services contracts are considered. The estimated excess masses at
the threshold are 200% and 303% of the average height of the counterfactual distributions beneath for goods and services contracts, respectively.

40
FIGURE 4 Anticipated Value Distributions around Threshold for Simplified Negotiations by Years
These figures show the distributions of the anticipated value of procurements around the
thresholds for simplified negotiations for construction works in each year in 2005-2010.
Thresholds are re-centered to 0. Series shown in bars are histograms of the anticipated value
of procurements relative to the thresholds. Each bar shows the number of observations in CZK
250,000 bins. The solid distributions beneath empirical distributions are seventh-degree
polynomials fitted to empirical distributions, excluding the points CZK 750,000 or fewer below
the threshold, as described in section 5.1, equation 2. The series are trimmed from below by
small lots thresholds for construction works, and from above by an arbitrary threshold of 40
million CZK. Otherwise, the full sample of construction works contracts is considered. The
estimated excess masses at the thresholds are presented in the first column of Table 5.

41
FIGURE 5
Distinguishing Thresholds in Public Procurement from Inflation
Figure 5 replicates the distribution of the anticipated value of procurements from Figure 4(f),
zooming in around the simplified negotiations threshold. The location of the negotiations
threshold in 2010 is marked with a solid line. The dashed line shows the level of the 2007
threshold adjusted for inflation in the Czech construction industry.
42
FIGURE 6
Anticipated Value Distribution by Type of Procurement Procedure
Figure 6 shows the distributions of the anticipated value of procurements around the
“placebo” thresholds (demarcated by the vertical line at 0) in three contract-awarding
procedures, which are unrestricted by procurement thresholds. Only construction contracts
from 2006 –2010 are considered in the figure. “Placebo” thresholds locate at points, where
simplified negotiation thresholds would locate. Series shown in bars are histograms of the
anticipated value of procurements relative to the “placebo” threshold. Each bar shows the
number of observations in CZK 250,000 bins. The solid distributions beneath empirical
distributions are seventh-degree polynomials fitted to empirical distributions, excluding the
points CZK 750,000 or fewer below the threshold, as described in section 5.1, equation 2. The
top subfigure shows the series for contracts procured through an open procurement
procedure. The middle subfigure depicts the series for contracts procured through a restricted
procurement procedure. The bottom subfigure considers contracts procured through a
negotiating procedure without prior public notice. The series are trimmed from below by small
lots thresholds for construction works and from above by an arbitrary threshold of 40 million
CZK. The estimated excess masses at “placebo” thresholds are presented in Table 6.

43
FIGURE 7
Density of Anticipated Contract Value Estimated Using Local Linear Estimator
Figure 7 shows the density distribution of the anticipated value of procurements around the
threshold for simplified negotiations (demarcated by a vertical line at 0). Only construction
works contracts from 2006 – 2010 are considered in the figure. The scatter-plot is a histogram
of the anticipated value of procurements, relative to the simplified negotiations threshold.
Each dot shows the density in CZK 250,000 bins. The solid line beneath the empirical
distribution is a local linear smoother fitted to the empirical distribution estimated as
described in section 6. The figure shows the confidence interval of the estimator. For local
linear smoother a bandwidth h=2,000,000 is used. The figure is trimmed from below by the
construction works small lots threshold and from above by an arbitrary threshold of CZK
40 million. The estimated log density discontinuity estimate for construction works at the
simplified negotiations threshold is presented in the first column of Table 7.

44
FIGURE 8
Size of the Anticipated Value Discontinuity per Procuring Authority
Figure 8 presents the heterogeneity in the size of anticipated value discontinuity at the
construction works threshold for simplified negotiations for all public bodies that have
procured at least 100 million CZK after the re-codification of Public Procurement Act in 2006.
The discontinuity per procuring authority is measured as a difference in procurement volume
awarded in a narrow band (3.5 million CZK) below the threshold, minus the procurement
volume awarded in the same band above the threshold. The whole difference is normalized by
the total procurement volume awarded by each public authority. The closer to 0, the smaller
the discontinuity at the threshold. The lower panel of Table 8 describes the summary statistics
of the plotted heterogeneity in anticipated value density discontinuity.
45
Appendix 1 – Contract-Awarding Procedures
Public authorities can control the level of openness of the tendering process through
their choice of contract-awarding procedure. This appendix characterizes five
procurement procedures recognized by the Public Procurement Act after its re-
codification in July 2006: an open procedure, a restricted procedure and 3 types of
negotiating procedures: the negotiating procedure with prior public notice,
without prior public notice and simplified negotiating procedure.14
Open procedure: In an open procedure a contracting authority announces its intention
to procure a contract; it lays out its specifications and schedules a deadline for bid-
submission. An unrestricted number of firms may participate in the competition by
submitting bids. Upon the deadline, the contracting authority reviews the fulfillment of
prequalification criteria and, according to a set of pre-announced evaluation criteria,
selects the most favorable bid. In the public procurement context this is the most
transparent and open type of contracting procedure.
Restricted procedure: The procurement process consists of two phases in the
restricted procedure. First, the contracting authority publishes its intention to procure
a contract; it lays out the specifications and schedules a deadline for applications into
the bidding phase. After the deadline, the second phase begins. The authority
evaluates prequalification criteria and invites qualified firms to bid. The important
distinction between the open and restricted procedures consists of the right of the
authority not to invite all qualified firms to bid. The authority may restrict the number
of bidders to any extent it desires so long as at least five applicants participate. The
restriction should be based on a set of objective criteria, although if this is not feasible
the authority may restrict the competition through a random ballot.
Negotiating procedures: The essence of the negotiating procedures is to allow the
authority to discuss contractual terms with one or several potential suppliers.
14
This appendix builds on a legal summary by Kamenik et al. (2011). The procurement procedure of competitive dialogue was disregarded from the legal summary due to a negligible number of contracts procured through competitive dialogue.
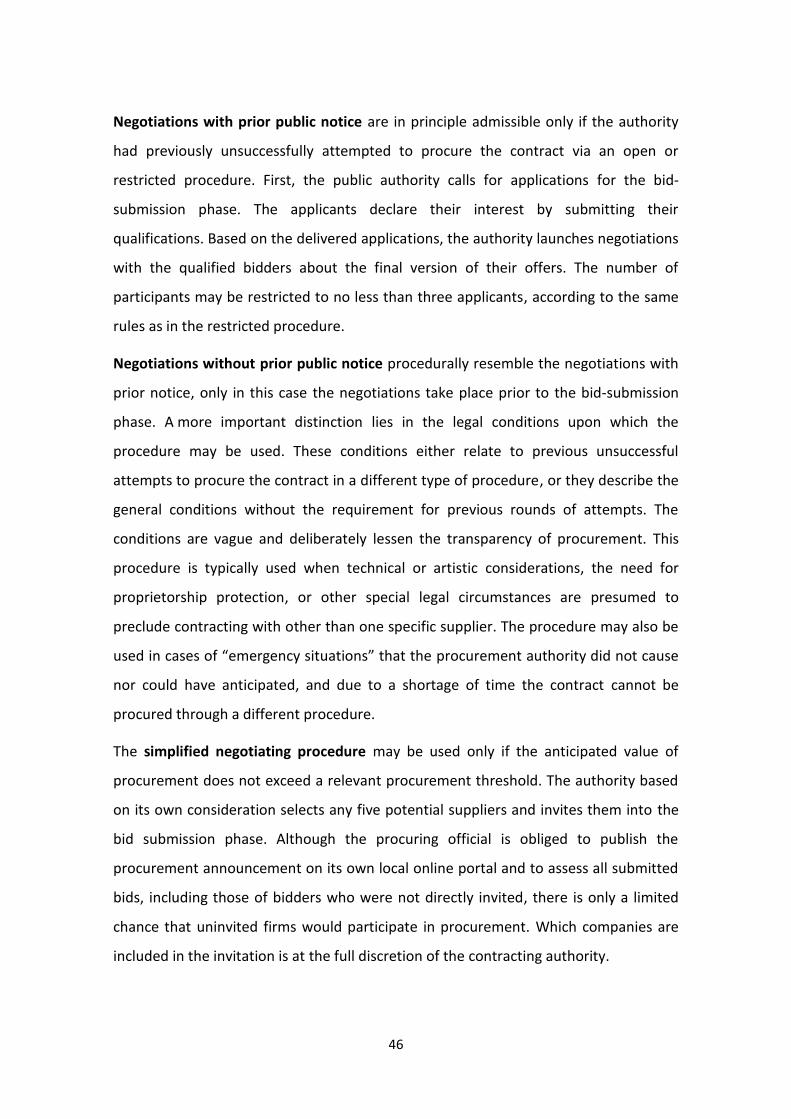
46
Negotiations with prior public notice are in principle admissible only if the authority
had previously unsuccessfully attempted to procure the contract via an open or
restricted procedure. First, the public authority calls for applications for the bid-
submission phase. The applicants declare their interest by submitting their
qualifications. Based on the delivered applications, the authority launches negotiations
with the qualified bidders about the final version of their offers. The number of
participants may be restricted to no less than three applicants, according to the same
rules as in the restricted procedure.
Negotiations without prior public notice procedurally resemble the negotiations with
prior notice, only in this case the negotiations take place prior to the bid-submission
phase. A more important distinction lies in the legal conditions upon which the
procedure may be used. These conditions either relate to previous unsuccessful
attempts to procure the contract in a different type of procedure, or they describe the
general conditions without the requirement for previous rounds of attempts. The
conditions are vague and deliberately lessen the transparency of procurement. This
procedure is typically used when technical or artistic considerations, the need for
proprietorship protection, or other special legal circumstances are presumed to
preclude contracting with other than one specific supplier. The procedure may also be
used in cases of “emergency situations” that the procurement authority did not cause
nor could have anticipated, and due to a shortage of time the contract cannot be
procured through a different procedure.
The simplified negotiating procedure may be used only if the anticipated value of
procurement does not exceed a relevant procurement threshold. The authority based
on its own consideration selects any five potential suppliers and invites them into the
bid submission phase. Although the procuring official is obliged to publish the
procurement announcement on its own local online portal and to assess all submitted
bids, including those of bidders who were not directly invited, there is only a limited
chance that uninvited firms would participate in procurement. Which companies are
included in the invitation is at the full discretion of the contracting authority.

Working Paper Series ISSN 1211-3298 Registration No. (Ministry of Culture): E 19443 Individual researchers, as well as the on-line and printed versions of the CERGE-EI Working Papers (including their dissemination) were supported from institutional support RVO 67985998 from Economics Institute of the ASCR, v. v. i. Specific research support and/or other grants the researchers/publications benefited from are acknowledged at the beginning of the Paper. (c) Ján Palguta, 2013 All rights reserved. No part of this publication may be reproduced, stored in a retrieval system or transmitted in any form or by any means, electronic, mechanical or photocopying, recording, or otherwise without the prior permission of the publisher. Published by Charles University in Prague, Center for Economic Research and Graduate Education (CERGE) and Economics Institute ASCR, v. v. i. (EI) CERGE-EI, Politických vězňů 7, 111 21 Prague 1, tel.: +420 224 005 153, Czech Republic. Printed by CERGE-EI, Prague Subscription: CERGE-EI homepage: http://www.cerge-ei.cz Phone: + 420 224 005 153 Email: [email protected] Web: http://www.cerge-ei.cz Editor: Michal Kejak The paper is available online at http://www.cerge-ei.cz/publications/working_papers/. ISBN 978-80-7343-287-4 (Univerzita Karlova. Centrum pro ekonomický výzkum a doktorské studium) ISBN 978-80-7344-279-8 (Národohospodářský ústav AV ČR, v. v. i.)
