nonlinear and delayed impacts of climate on dengue risk in ... · these indicators—rather than...
TRANSCRIPT

RESEARCH ARTICLE
Nonlinear and delayed impacts of climate on
dengue risk in Barbados: A modelling study
Rachel Lowe1,2,3*, Antonio Gasparrini4,5, Cedric J. Van Meerbeeck6, Catherine A. Lippi7,
Roche Mahon6, Adrian R. Trotman6, Leslie Rollock8, Avery Q. J. Hinds9, Sadie J. Ryan7,10,
Anna M. Stewart-Ibarra11,12
1 Department of Infectious Disease Epidemiology, London School of Hygiene & Tropical Medicine, London,
United Kingdom, 2 Centre for the Mathematical Modelling of Infectious Diseases, London School of Hygiene
& Tropical Medicine, London, United Kingdom, 3 Barcelona Institute for Global Health (ISGLOBAL),
Barcelona, Spain, 4 Department of Public Health, Environments and Society, London School of Hygiene &
Tropical Medicine, London, United Kingdom, 5 Centre for Statistical Methodology, London School of Hygiene
& Tropical Medicine, London, United Kingdom, 6 Caribbean Institute for Meteorology and Hydrology,
St. James, Barbados, 7 Quantitative Disease Ecology and Conservation Lab Group, Department of
Geography and Emerging Pathogens Institute, University of Florida, Gainesville, Florida, United States of
America, 8 Ministry of Health, St. Michael, Barbados, 9 Caribbean Public Health Agency, Port of Spain,
Trinidad and Tobago, 10 School of Life Sciences, University of KwaZulu-Natal, Durban, South Africa,
11 Institute for Global Health and Translational Science, SUNY Upstate Medical University, Syracuse, New
York, United States of America, 12 Department of Medicine and Department of Public Health and
Preventative Medicine, SUNY Upstate Medical University, Syracuse, New York, United States of America
Abstract
Background
Over the last 5 years (2013–2017), the Caribbean region has faced an unprecedented crisis
of co-occurring epidemics of febrile illness due to arboviruses transmitted by the Aedes sp.
mosquito (dengue, chikungunya, and Zika). Since 2013, the Caribbean island of Barbados
has experienced 3 dengue outbreaks, 1 chikungunya outbreak, and 1 Zika fever outbreak.
Prior studies have demonstrated that climate variability influences arbovirus transmission
and vector population dynamics in the region, indicating the potential to develop public
health interventions using climate information. The aim of this study is to quantify the nonlin-
ear and delayed effects of climate indicators, such as drought and extreme rainfall, on den-
gue risk in Barbados from 1999 to 2016.
Methods and findings
Distributed lag nonlinear models (DLNMs) coupled with a hierarchal mixed-model frame-
work were used to understand the exposure–lag–response association between dengue rel-
ative risk and key climate indicators, including the standardised precipitation index (SPI)
and minimum temperature (Tmin). The model parameters were estimated in a Bayesian
framework to produce probabilistic predictions of exceeding an island-specific outbreak
threshold. The ability of the model to successfully detect outbreaks was assessed and com-
pared to a baseline model, representative of standard dengue surveillance practice. Drought
conditions were found to positively influence dengue relative risk at long lead times of up to
PLOS Medicine | https://doi.org/10.1371/journal.pmed.1002613 July 17, 2018 1 / 24
a1111111111
a1111111111
a1111111111
a1111111111
a1111111111
OPENACCESS
Citation: Lowe R, Gasparrini A, Van Meerbeeck CJ,
Lippi CA, Mahon R, Trotman AR, et al. (2018)
Nonlinear and delayed impacts of climate on
dengue risk in Barbados: A modelling study. PLoS
Med 15(7): e1002613. https://doi.org/10.1371/
journal.pmed.1002613
Academic Editor: Madeleine Thomson, Africa
Program, UNITED STATES
Received: February 11, 2018
Accepted: June 15, 2018
Published: July 17, 2018
Copyright: © 2018 Lowe et al. This is an open
access article distributed under the terms of the
Creative Commons Attribution License, which
permits unrestricted use, distribution, and
reproduction in any medium, provided the original
author and source are credited.
Data Availability Statement: All meteorological
data used in this study are available from the
Caribbean Institute for Meteorology and Hydrology
via Mr. Wayne Depradine ([email protected].
bb). Health data can be requested from the
Barbados Ministry of Health ([email protected].
bb).
Funding: This study was solicited by the Caribbean
Institute for Meteorology and Hydrology (CIMH)
through the United States Agency for International
Development’s (USAID, Grant ID: AID-538-10-14-

5 months, while excess rainfall increased the risk at shorter lead times between 1 and 2
months. The SPI averaged over a 6-month period (SPI-6), designed to monitor drought and
extreme rainfall, better explained variations in dengue risk than monthly precipitation data
measured in millimetres. Tmin was found to be a better predictor than mean and maximum
temperature. Furthermore, including bidimensional exposure–lag–response functions of
these indicators—rather than linear effects for individual lags—more appropriately
described the climate–disease associations than traditional modelling approaches. In pre-
diction mode, the model was successfully able to distinguish outbreaks from nonoutbreaks
for most years, with an overall proportion of correct predictions (hits and correct rejections)
of 86% (81%:91%) compared with 64% (58%:71%) for the baseline model. The ability of the
model to predict dengue outbreaks in recent years was complicated by the lack of data on
the emergence of new arboviruses, including chikungunya and Zika.
Conclusion
We present a modelling approach to infer the risk of dengue outbreaks given the cumulative
effect of climate variations in the months leading up to an outbreak. By combining the den-
gue prediction model with climate indicators, which are routinely monitored and forecasted
by the Regional Climate Centre (RCC) at the Caribbean Institute for Meteorology and
Hydrology (CIMH), probabilistic dengue outlooks could be included in the Caribbean Health-
Climatic Bulletin, issued on a quarterly basis to provide climate-smart decision-making guid-
ance for Caribbean health practitioners. This flexible modelling approach could be extended
to model the risk of dengue and other arboviruses in the Caribbean region.
Author summary
Why was this study done?
• Changes in local climate conditions (i.e., rainfall, temperature) can affect the risk of out-
breaks of diseases transmitted by mosquitoes, such as dengue fever, chikungunya, and
Zika.
• Climate information can be used to develop forecasts of disease outbreaks.
What did the researchers do and find?
• In this study, we devised a statistical model to test whether dengue outbreaks in the
Caribbean island of Barbados could be predicted using weather station data for temper-
ature and a precipitation index—used to monitor drought and extreme rainfall—as
model inputs from June 1999 to May 2016.
• The model was able to successfully predict months with dengue outbreaks versus non-
outbreaks in most years.
• The risk of dengue outbreaks increased with increasing minimum temperature (Tmin;
up to 25˚C). Disease outbreaks were more likely to occur 4 to 5 months after periods of
drought and 1 month after periods of excess rainfall.
Climate and dengue risk in Barbados
PLOS Medicine | https://doi.org/10.1371/journal.pmed.1002613 July 17, 2018 2 / 24
00001) Programme for Building Regional Climate
Capacity in the Caribbean (BRCCC Programme:
rcc.cimh.edu.bb/brccc) with funding made
possible by the generous support of the American
people. RL was supported by a Royal Society
Dorothy Hodgkin Fellowship. AG was supported by
a grant from the Medical Research Council UK
(Grant ID: MR/M022625/1). The funders had no
role in study design, data collection and analysis,
decision to publish, or preparation of the
manuscript.
Competing interests: The authors have declared
that no competing interests exist.
Abbreviations: AUC, area under the ROC curve;
CariCOF, Caribbean Climate Outlook Forum;
CARPHA, Caribbean Public Health Agency;
CDPMN, Caribbean Drought and Precipitation
Monitoring Network; CIMH, Caribbean Institute for
Meteorology and Hydrology; CV, cross-validated;
DENV, dengue virus; DIC, deviance information
criterion; DLNM, distributed lag nonlinear model;
ENSO, El Niño Southern Oscillation; EWISACTs,
Early Warning Information Systems Across Climate
Timescales; GAIA, Grantley Adams International
Airport; INLA, Integrated Nested Laplace
Approximation; NS1, nonstructural protein 1; RCC,
Regional Climate Centre; ROC, relative (receiver)
operating characteristic; SIDS, Small Island
Developing States; SPI, Standardised Precipitation
Index; SPI-6, SPI averaged over a 6-month period;
Tmin, minimum temperature.

• The modelling results suggest that a drought period followed by intense rainfall 4 to 5
months later could provide optimum conditions for an imminent dengue outbreak.
What do these findings mean?
• In practice, the Regional Climate Centre (RCC) could use this dengue model to generate
disease forecasts using their seasonal climate forecast products.
• Public health decision-makers can use the dengue forecasts as an early warning tool to
plan interventions to reduce the risk of dengue and other mosquito-borne diseases.
• The ability of the model to predict dengue outbreaks is complicated by the emergence of
new diseases with similar symptoms that are transmitted by the same mosquito vector,
including chikungunya and Zika.
Introduction
Small Island Developing States (SIDS) in the Caribbean are among the most vulnerable coun-
tries to extreme climate events (e.g., droughts and tropical storms), which are becoming more
frequent and severe due to climate change [1]. Climate events have a major impact on human
health in the Caribbean, including impacts on arboviral disease transmission, heat-induced
morbidity, water-borne diseases, injuries, respiratory complications, and mental health [2].
The social and economic cost of these adverse health outcomes is a major burden on SIDS,
and the burden is projected to increase with the changing climate [3].
In recent years, the Caribbean region has experienced an unprecedented crisis of co-
occurring epidemics of febrile illness due to dengue, chikungunya, and Zika viruses. These
diseases are transmitted principally by the female Aedes aegypti, which is a mostly domestic,
urban mosquito that lays its eggs in water-bearing containers in and around the home. Over
a 5-year period (2012 to 2016), Barbados reported a total of 7,298 dengue cases [4], with
most cases reported in children up to 15 years of age [5]. Three outbreaks of dengue fever
were reported during that period (2013, 2014, and 2016). Recent studies reported an upward
trend in dengue transmission in Barbados from 2006 to 2015, with all 4 dengue serotypes
(dengue virus [DENV]-1 through DENV-4) cocirculating in the population [5]. Illness due
to dengue virus is estimated to cost $321.4 million USD per year in the Caribbean (excluding
the costs of vector control and other prevention programmes) [6]. With the recent emer-
gence of chikungunya and Zika in the Caribbean, the cost of Aedes-transmitted diseases has
increased dramatically. In a region with low economic growth and high public debt [7,8], the
burden of arboviruses is unsustainable, and new tools are urgently needed to support the
public health sector.
Prior studies have shown that climate variability influences dengue transmission and A.
aegypti population dynamics in the Caribbean [9–12]. Ambient temperatures impact disease
transmission by affecting mosquito development rates, reproduction, survival, biting rates,
and viral replication in the mosquito [13]. Warmer temperatures increase the risk of disease
transmission up to an optimum temperature range of 26 to 29˚C [13]. The effect of rainfall on
dengue risk is more complex and depends on the local socioecological conditions that
Climate and dengue risk in Barbados
PLOS Medicine | https://doi.org/10.1371/journal.pmed.1002613 July 17, 2018 3 / 24

determine the type and abundance of larval habitat in the environment [14]. Rainfall can
increase mosquito population densities by increasing the availability of larval habitat in aban-
doned rain-filled containers in the patio around the home. Drought conditions that result in
household water scarcity can also potentially increase larval habitat by increasing the number
of water storage containers around the home [15]. However, few studies have examined the
effects of prolonged drought on dengue transmission.
Prior studies in Barbados documented the seasonal linkages between climate and dengue
(from 1980 to 2000), finding that epidemics occurred in the latter part of the year [16]. The
study also found that there was a trend in increasing temperatures and declining rainfall in
recent decades. Other studies found that dengue was significantly associated with lagged cli-
mate variables, including rainfall at a 7-week lag and minimum temperature (Tmin) at a
12-week lag [10]. In a different study, investigators analysed a time series of dengue from 2004
to 2013 using generalised linear models, which were able to predict dengue cases with limited
success using monthly rainfall, monthly number of rain days, and average temperature, after
pre-adjusting for unmeasured cyclical and long-term trends [17]. Most recently, investigators
analysed monthly dengue cases from 2006 to 2015 and found a positive correlation between
rainfall and relative humidity of the same month. However, they did not assess lagged relation-
ships [5].
The El Niño Southern Oscillation (ENSO) is a major driver of regional year-to-year climate
variability in the Caribbean [18,19]. ENSO is associated with a gradient in sea surface tempera-
ture anomalies between the eastern Tropical Pacific Ocean and the Tropical North Atlantic
Ocean and Caribbean Sea. During the early and mature stages of El Niño events, this gradient
is often positive (i.e., the surface waters of the Tropical Pacific are anomalously warmer than
the Tropical North Atlantic and Caribbean Sea). Most periods of regional drought, weaker
hurricane season activity, and warmer temperatures are associated with the El Niño–induced
positive gradient. By contrast, wet episodes and more active hurricane seasons coincide with
La Niña events [19], i.e., when the ocean gradient tends to be negative. Recent examples of El
Niño–associated regional drought occurred in 1997–1998, 2009–2010, and 2014–2016,
whereas La Niña events in 2010–2011 and 2011–2012 coincided with very wet conditions in
large parts of the Caribbean [20]. In Barbados, we hypothesise that the most important
extreme climate events with respect to arbovirus risk are droughts, which extend into the dry
season when water availability is reduced [20], and periods of excessive rainfall during the wet
season.
Before an effective disease forecast can be developed, it is important to identify the key cli-
mate drivers, lag periods, and appropriate model formulation that reflects the local disease
transmission ecology and climatology. It takes time for anomalies in the climate to manifest
and contribute to disease risk. The various components of the time lag include the period for
mosquito larval habitat to increase, the development period of the mosquito, the time before
the first blood meal in which the mosquito transmits the virus to a human host, and the time
before the appearance of clinical manifestations of dengue [10]. Several studies have employed
distributed lag nonlinear models (DLNMs) to explore associations between meteorological
variables and dengue incidence in several countries—primarily in Asia—that experience den-
gue epidemics, including Bangladesh [21], China [22], Indonesia [23], Malaysia [24], Singa-
pore [25], Sri Lanka [26], and Taiwan [27]. A major advantage to using DLNM methodology
is the possibility of describing the lag structure of either linear or nonlinear exposure–response
relationships, through the choice of 2 functions that define the association along the dimen-
sions of the predictor (e.g., climate variables) and lags [28]. The analysis of the temporal evolu-
tion of disease risk associated with protracted time-varying climatic exposures has
implications for the development of climate-based disease early warning systems.
Climate and dengue risk in Barbados
PLOS Medicine | https://doi.org/10.1371/journal.pmed.1002613 July 17, 2018 4 / 24

This study aims to quantify the nonlinear and delayed effects of climate impacts, such as
drought, extreme rainfall, and temperature variations, on dengue risk in the eastern Caribbean
island of Barbados by coupling DLNMs with a Bayesian model estimation framework. The
model is then used to produce out-of-sample predicted probabilities of exceeding island-spe-
cific outbreak thresholds. Barbados is an ideal case study due to high-quality historical climate
and health data, a relatively high burden of disease, and prior experience in building projects
on climate and health, paving the way for a sustainable collaboration to develop integrated
early warning information to predict the risk of dengue and other mosquito-transmitted dis-
eases in the Caribbean.
Materials and methods
Study area
This study was carried out for the Caribbean island of Barbados (13˚ N 59˚ W) in the Lesser
Antilles. Barbados is relatively small in land area (425 km2), with a resident population of over
277,000 people [29]. Due to a thriving tourism-based economy, over 1 million people visit Bar-
bados each year [30]. The island is administratively divided into 11 parishes, the most densely
populated being the urban parish of St. Michael, which contains the capital city of Bridgetown
(see S1 Fig). Dengue is one of the primary febrile illnesses in Barbados, especially during the
wet season, when the mosquito vector is most abundant. A. aegypti is the only known vector
on the island.
Health data
The surveillance unit of the Environmental Health Department in the Ministry of Health of
Barbados is responsible for maintaining records on the incidence of dengue and other arbo-
viral disease cases. As of January 2018, the surveillance unit liaises with the Leptospirosis lab
(national reference lab) to record laboratory-confirmed cases of dengue virus, chikungunya
virus, and Zika virus. Specimens are tested for the dengue virus nonstructural protein 1 (NS1)
antigen, dengue virus IgM/IgG, and chikungunya virus IgM/IgG using commercial ELISA
kits. Since September 2016, the lab has also conducted real-time PCR using the CDC Trioplex
assay for dengue virus, chikungunya virus, and Zika virus, and they conduct serotyping of
positive dengue virus samples. National population estimates, obtained from the Barbados
Population and Housing Census (1990, 2000, and 2010) [29], were used to estimate yearly pop-
ulation during the study period by linear interpolation. Population data were used to calculate
monthly incidence rates of laboratory-confirmed dengue cases in Barbados from June 1999 to
May 2016.
Climate of Barbados
The climatology of Barbados fits well within that of the Lesser Antilles. The wet season lasts
from June until November and coincides with the Atlantic Hurricane Season [31]. The dry sea-
son occurs from December to May. More than 70% of annual rainfall totals are recorded on
average during the wet season [32], which is further characterised by elevated relative humid-
ity, increased rainfall frequency and intensity, and the irregular occurrence of spells of very
heavy rainfall [31]. The wet season typically features 2 to 3˚C higher dry-bulb temperatures
than the relatively cool period of December to February, with heat waves becoming more fre-
quent in recent decades [31,33].
Given its low topography, Barbados records significantly less rainfall, on average, than
neighbouring mountainous islands, from less than 1,200-mm rainfall per annum in some low-
Climate and dengue risk in Barbados
PLOS Medicine | https://doi.org/10.1371/journal.pmed.1002613 July 17, 2018 5 / 24

lying areas to around 2,000-mm per annum above 300-m elevation [31]. S2 Fig shows the
1981–2010 average rainfall seasonality in terms of rainfall chance and rainfall intensity on wet
days for the synoptic station located at the CIMH. The combination of relatively little rainfall,
high population density, and a mostly urban population makes Barbados a particularly water-
scarce country [34].
Meteorological data
Monthly rainfall totals and average minimum, mean, and maximum temperatures were
extracted from the 2 synoptic weather stations on the island—at the Grantley Adams Interna-
tional Airport (GAIA), at an elevation of 56 m in the southern parish of Christ Church, and at
the Caribbean Institute for Meteorology and Hydrology (CIMH), at an elevation of 112 m in
the western parish of St. James (see S1 Fig and S3 Fig). Monthly minimum (maximum) tem-
perature is defined as the arithmetic average of the daily minimum (maximum) dry-bulb tem-
perature, measured under standard Stevenson screen conditions.
Standardised Precipitation Index
The Standardised Precipitation Index (SPI) is a drought index first developed by McKee et al.
[35]. The SPI is a representation of rainfall totals in units of standard deviation following a
gamma-fitted distribution. Positive values indicate greater than average rainfall totals or excess
rainfall, while negative values indicate less than average rainfall or rainfall deficits—otherwise
called meteorological drought. The SPI can best be interpreted as the severity of meteorological
drought or excessive rainfall by the end of the period of interest and is based on monthly pre-
cipitation totals alone—the most commonly available climate variable from rainfall stations
around the world. As such, wet or dry conditions can be monitored by the SPI at a variety of
time horizons, from subseasonal to multi-annual time scales.
SPI at different time scales are representative of different types of drought. Generally, the
longer the meteorological drought persists and the more negative the SPI value, the greater
the societal impact. The 1-month SPI (SPI-1) allows for early detection of meteorological
droughts. Operationally, with the aim to enable drought early warning systems, the Caribbean
Drought and Precipitation Monitoring Network (CDPMN)—coordinated by the CIMH—
tracks drought using SPIs at 1 month, 3 months (SPI-3), 6 months (SPI-6), 12 months (SPI-
12), and 24 months (SPI-24) [31] to cover the range of drought durations experienced in its cli-
mate [20]. For example, rainfall deficits over 1 month may be enough to dry the topsoil, espe-
cially during the latter part of the dry season. However, in the Caribbean, agricultural drought
(related to shortage of surface or soil moisture for optimal crop growth) manifests more signif-
icantly after 3 months [20]. Therefore, SPI-3 and SPI-6 can be used to track agricultural
drought. Soil moisture and surface water reservoir depletion typically take at least 6 months to
substantially impact water availability at the national level. Aquifer depletion and repletion
typically occur at time scales of 9 to 12 months, affecting large groundwater reservoirs. There-
fore, hydrological drought can be tracked with SPI-6 and SPI-12.
With drought being a slow-onset climate hazard, early warning (e.g., based on SPIs) with
ample lead time is a realistic and effective option. This is especially the case when monitoring
is combined with forecasting. Operationally, the Caribbean Climate Outlook Forum (Cari-
COF) provides drought forecasts using predictions of SPI-6 with a lead time of 3 months (i.e.,
3 months in advance) and SPI-12 with lead times up to 6 months [20]. In contrast, while SPIs
are used by the CDPMN to track periods of excess precipitation, flooding potential—the
hydrometeorological hazard component of flood risk—is a compounded factor of both long-
term rainfall accumulations (i.e., soil moisture saturation) and short-term wet spells. The
Climate and dengue risk in Barbados
PLOS Medicine | https://doi.org/10.1371/journal.pmed.1002613 July 17, 2018 6 / 24
original severity classes are shown in S1 Table. Impacts experienced (particularly in agricul-
ture) during the Caribbean drought of 2009–2010 led to a redefinition of the categories (see S2
Table), which has been used for decision-making since 2011.
For this study, all SPI values were calculated based on the records of daily rainfall totals at
the CIMH and the GAIA stations in Barbados, which start in January of 1981 and 1971,
respectively. The historical climatological reference was calculated using the period 1981–2010
to conform with World Meteorological Organization regulations.
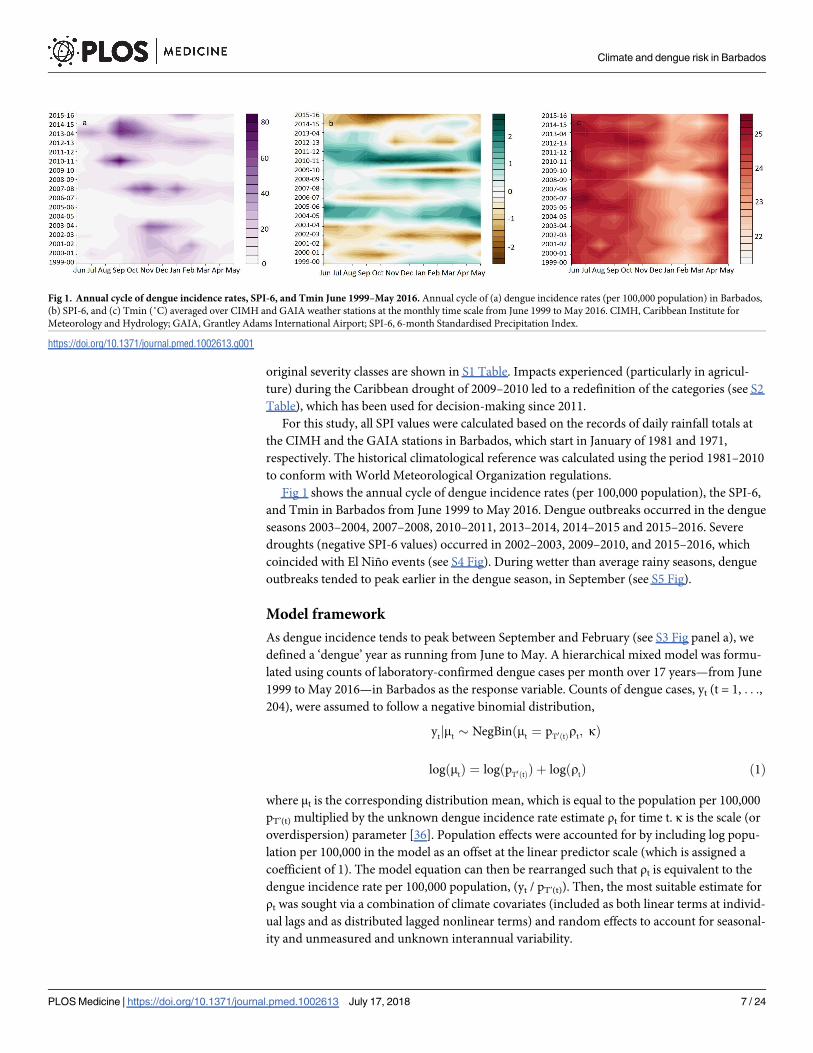
Fig 1 shows the annual cycle of dengue incidence rates (per 100,000 population), the SPI-6,
and Tmin in Barbados from June 1999 to May 2016. Dengue outbreaks occurred in the dengue
seasons 2003–2004, 2007–2008, 2010–2011, 2013–2014, 2014–2015 and 2015–2016. Severe
droughts (negative SPI-6 values) occurred in 2002–2003, 2009–2010, and 2015–2016, which
coincided with El Niño events (see S4 Fig). During wetter than average rainy seasons, dengue
outbreaks tended to peak earlier in the dengue season, in September (see S5 Fig).
Model framework
As dengue incidence tends to peak between September and February (see S3 Fig panel a), we
defined a ‘dengue’ year as running from June to May. A hierarchical mixed model was formu-
lated using counts of laboratory-confirmed dengue cases per month over 17 years—from June
1999 to May 2016—in Barbados as the response variable. Counts of dengue cases, yt (t = 1, . . .,
204), were assumed to follow a negative binomial distribution,
ytjmt � NegBinðmt ¼ pT0ðtÞrt; kÞ
logðmtÞ ¼ logðpT0ðtÞÞ þ logðrtÞ ð1Þ
where μt is the corresponding distribution mean, which is equal to the population per 100,000
pT’(t) multiplied by the unknown dengue incidence rate estimate ρt for time t. κ is the scale (or
overdispersion) parameter [36]. Population effects were accounted for by including log popu-
lation per 100,000 in the model as an offset at the linear predictor scale (which is assigned a
coefficient of 1). The model equation can then be rearranged such that ρt is equivalent to the
dengue incidence rate per 100,000 population, (yt / pT’(t)). Then, the most suitable estimate for
ρt was sought via a combination of climate covariates (included as both linear terms at individ-
ual lags and as distributed lagged nonlinear terms) and random effects to account for seasonal-
ity and unmeasured and unknown interannual variability.
Fig 1. Annual cycle of dengue incidence rates, SPI-6, and Tmin June 1999–May 2016. Annual cycle of (a) dengue incidence rates (per 100,000 population) in Barbados,
(b) SPI-6, and (c) Tmin (˚C) averaged over CIMH and GAIA weather stations at the monthly time scale from June 1999 to May 2016. CIMH, Caribbean Institute for
Meteorology and Hydrology; GAIA, Grantley Adams International Airport; SPI-6, 6-month Standardised Precipitation Index.
https://doi.org/10.1371/journal.pmed.1002613.g001
Climate and dengue risk in Barbados
PLOS Medicine | https://doi.org/10.1371/journal.pmed.1002613 July 17, 2018 7 / 24

First, a baseline model was formulated by including a first-order random walk latent model
for month βt’(t), where t’(t) = 1, . . ., 12 and β1 represents the parameter estimate for the month
of June. This term helps to capture the seasonality in dengue, which is assumed to be stationary
each year (monthly random effect). The first-order random walk prior allows dengue inci-
dence rates in 1 month to depend on the previous month, to reflect both seasonality and the
infectious nature of the disease. Next, exchangeable random effects for each year γT’(t) (where
T’(t) = 1, . . ., 17 and γ1 represents the dengue year June 1999–May 2000) was included in the
model to account for interannual variation in dengue over time (yearly random effect). This
term potentially allows for changes in population immunity between outbreak years, lapses in
vector control, and other slowly changing factors, such as changes in mosquito-control inten-
sity and the introduction of new dengue virus serotypes or other viruses, which could be mis-
taken for dengue. Note that chikungunya and Zika viruses were introduced to Barbados in
2014 and at the end of 2015, respectively [5,37].
Exposure–lag–response model
DLNMs [28] were used to explore and understand possible nonlinear and delayed associations
between dengue incidence rates and a variety of climate impact indicators. This modelling
approach is based on the definition of a cross-basis, obtained by the combination of 2 functions
to flexibly model linear or nonlinear exposure–responses and the lag structure of the relation-
ship [28]. A standard exposure–response function f(x) is defined to express the potentially non-
linear exposure–response curve along the dimension of the climate predictors. An additional
lag–response function w(l) expresses instead the temporal dimension. Their combination in a
bidimensional exposure–lag–response function f.w(x,l) through a cross-basis is defined to flexi-
bly model both intensity and timing of past exposures. Meteorological variables—including
monthly precipitation, minimum, mean, and maximum temperatures as well as the SPI at dif-
ferent time scales (1-, 3-, 6-, and 12-month averages)—were tested in the model, in turn. Note
that an El Niño index was not included in the model because it is highly correlated with the SPI
in Barbados (see S4 Fig), and including both would have resulted in overfitting. Each variable
was included as a linear term at individual lags and as a nonlinear exposure–lag–response func-
tion. The delayed effects of the climate indicators were assessed for up to 5 months, which was
determined on the basis of exploratory analysis and previous studies [27,38]. Natural cubic
splines were selected for both the exposure and the lag dimensions to allow enough flexibility to
capture potentially complex associations between climate indicators and their delayed impact
on dengue risk.
Model selection and estimation
Model parameters were estimated in a Bayesian framework using Integrated Nested Laplace
Approximation (INLA; www.r-inla.org) [39] (see S1 Text for specification of prior and hyper-
prior distributions). The model was estimated in ‘leave one out’ cross-validation mode from
June 1999 to May 2016, i.e., by excluding the month for which the prediction is valid when
estimating model parameters [40]. Exploratory analysis and model selection criteria were used
to select the final model, including the cross-validated (CV) log score [41] and the deviance
information criterion (DIC) [42], for which smaller values indicate better fitting models. An
R2LR statistic for mixed-effects models based on a likelihood ratio test between the candidate
model, and an intercept-only model was also formulated [43], where 0� R2LR� 1, with R2
LR =
1 corresponding to a perfect fit and R2LR� 0 for any reasonable model specification. R2
LR is
useful as a measure of goodness-of-fit and provides an intuitive measure of the ability of the
model to account for the variation in the dependent variable. The final model was selected by
Climate and dengue risk in Barbados
PLOS Medicine | https://doi.org/10.1371/journal.pmed.1002613 July 17, 2018 8 / 24

comparing models of increasing complexity, in terms of input variables and model structure, to
the baseline model (including only the monthly random effect to account for seasonality).
Posterior predictive distributions and out-of-sample predictions
To test the predictive ability of the model, we refitted the model 17 times, removing 1 year at a
time to produce out-of-sample predictions (i.e., 17-fold cross-validation). Note that the annual
random-effect term was included in the model-fitting stage to better quantify the association
between climate factors and variation in dengue incidence rates. However, when producing
out-of-sample predictions, no effect was estimated for the year in which the prediction was
valid, hence the term does not contribute to incidence rate estimates in prediction mode.
Therefore, model predictions are based solely on exposure–lag–response functions of key cli-
mate variables and the seasonality term, meaning the model can be used to predict any year
not included in the model-fitting process.
To evaluate the output from the selected Bayesian hierarchical model, posterior predictive
distributions of the response variable were simulated using samples from the posterior distri-
bution of the parameters and hyperparameters in the model [44]. The posterior predictive dis-
tribution of dengue cases, yt, for each month (June 1999–May 2016) was estimated by drawing
1,000 random values from a negative binomial distribution with mean corresponding to the
elements of μt and scale parameter corresponding to the elements of the overdispersion
parameter κ, estimated from the models, estimated in 17-fold cross-validation mode. This pro-
cedure allows for uncertainty in the response variable, given the model parameters. We there-
fore generated 204 (17 × 12) out-of-sample posterior predictive distributions and use these to
evaluate the ability of the model to produce probabilistic dengue outbreak predictions given
predefined epidemic thresholds.
Model evaluation
Dengue control programmes often monitor new cases against historical case data, which
define a typical dengue transmission season [45]. While various methods for calculating epi-
demic thresholds are available, we chose the monthly moving thresholds of the upper quartile
(75th percentile) of the distribution of observed dengue incidence. This is in line with the epi-
demic threshold methods described by the World Health Organization [45]. Prediction mod-
els that can detect outbreaks are crucial because they provide information to public health
decision-makers who can advocate for increased disease control interventions when necessary
[46]. To assess the performance of the final model against current practice, we considered the
ability of both the final model and the baseline model (a submodel of the final model based
only on the seasonality term) to detect outbreaks in Barbados. An outbreak threshold was cal-
culated as the 75th percentile of the distribution of dengue cases per month between June 1999
and May 2016, excluding the ‘dengue’ year for which the prediction was valid. The probability
of exceeding the moving outbreak threshold was mapped and verified with actual exceedance
data. To determine an optimum decision trigger threshold for issuing outbreak alerts, we cal-
culated a relative (or receiver) operating characteristic (ROC) curve for the binary events of
exceeding the moving outbreak threshold. The ROC is a graph of the hit rate against the false
alarm rate for varying decision trigger thresholds [47]. The hit rate represents the proportion
of events that occurred (i.e., outbreaks) that were correctly predicted (also known as the true
positive rate or sensitivity). The false alarm rate represents the proportion of events that were
predicted to occur but did not occur (also known as the false positive rate or 1-specificity). We
calculated the curve using probabilistic out-of-sample predictions of exceeding the moving
outbreak threshold compared with the observed binary outcome. We defined a trigger alert
Climate and dengue risk in Barbados
PLOS Medicine | https://doi.org/10.1371/journal.pmed.1002613 July 17, 2018 9 / 24

threshold as the point on the curve closest to the point of perfect discrimination (0, 1). Perfor-
mance measures, including the hit rate (probability of detection), false alarm rate, and proportion
of correct predictions, were then calculated for both the final model and the baseline model.
Results
Model selection
As part of the model selection procedure, a range of climate variables were tested, first as linear
terms for individual lags from 0 to 5 months and second as exposure–lag functions for individ-
ual climate indicators (see S3 Table, S4 Table and S5 Table). Key variables were tested with and
without the interannual term to understand the relative contribution of each term to dengue
incidence rate variations. The best estimate of log(ρt) comprised an intercept, α, monthly, βt’(t),
and yearly, γT’(t), random effects (to account for seasonality and unmeasured interannual vari-
ability) and nonlinear exposure–lag functions f.w(xit, l) of the SPI-6, x1t, and Tmin, x2t, with
lags, l, from 0 to 5 months.
logðrtÞ ¼ aþ bt0ðtÞ þ gT0ðtÞ þ f :wðx1t; lÞ þ f :wðx2t; lÞ ð2Þ
Table 1 shows model adequacy statistics for a series of models of increasing complexity. Firstly,
a baseline model was fitted including a monthly random effect (Model 1), which accounted for
23% of the variation in dengue relative risk. Next, a yearly random effect was included (Model
2), which explained an additional 31% of the variation in addition to the annual cycle term.
Exposure–lag–response functions for the selected climate factors, SPI-6, and Tmin were then
added to the baseline model (individually in Model 3 and 4 and together in Model 5). This
showed that 24% of the interannual variation could be explained by the key selected climate vari-
ables. The final selected model included monthly and yearly random effects and exposure–lag–
response functions for both the SPI-6 and Tmin (Model 6), explaining—overall—68% of the var-
iation in dengue incidence rates. Therefore, in addition to climate factors, yearly random effects
accounted for an extra 21% of the variation in dengue incidence rates.
Climate–dengue associations
Associations between the selected climate variables (SPI-6 and Tmin) and dengue relative risk
are presented as three-dimensional graphs and two-dimensional contour plots in Fig 2. Lag–
Table 1. Model adequacy results for models of increasing complexity. The CV mean logarithmic score, the DIC, and the likelihood ratio RLR2 statistic for models of
increasing complexity.
Model log(ρt) CV log score DIC RLR2
1 α + βt’(t)
Baseline (seasonal random effect)
4.46 1,801.36 0.23
2 α + βt’(t) + γT’(t)
Seasonal + interannual random effect
4.23 1,719.46 0.54
3 α + βt’(t) + f.w(x1t, l)
Seasonal + function of SPI-6
4.32 1,759.07 0.41
4 α + βt’(t) + f.w(x2t, l)
Seasonal + function of Tmin
4.34 1,770.52 0.34
5 α + βt’(t) + f.w(x1t, l) + f.w(x2t, l)
Seasonal + functions of SPI-6 + Tmin
4.28 1,742.98 0.47
6 α + βt’(t) + γT’(t) + f.w(x1t, l) + f.w(x2t, l)
Final (seasonal + interannual + climate functions)
4.09 1,664.94 0.68
Abbreviations: CV, cross-validated; DIC, deviance information criterion; SPI-6, 6-month Standardised Precipitation Index; Tmin, minimum temperature.
https://doi.org/10.1371/journal.pmed.1002613.t001
Climate and dengue risk in Barbados
PLOS Medicine | https://doi.org/10.1371/journal.pmed.1002613 July 17, 2018 10 / 24
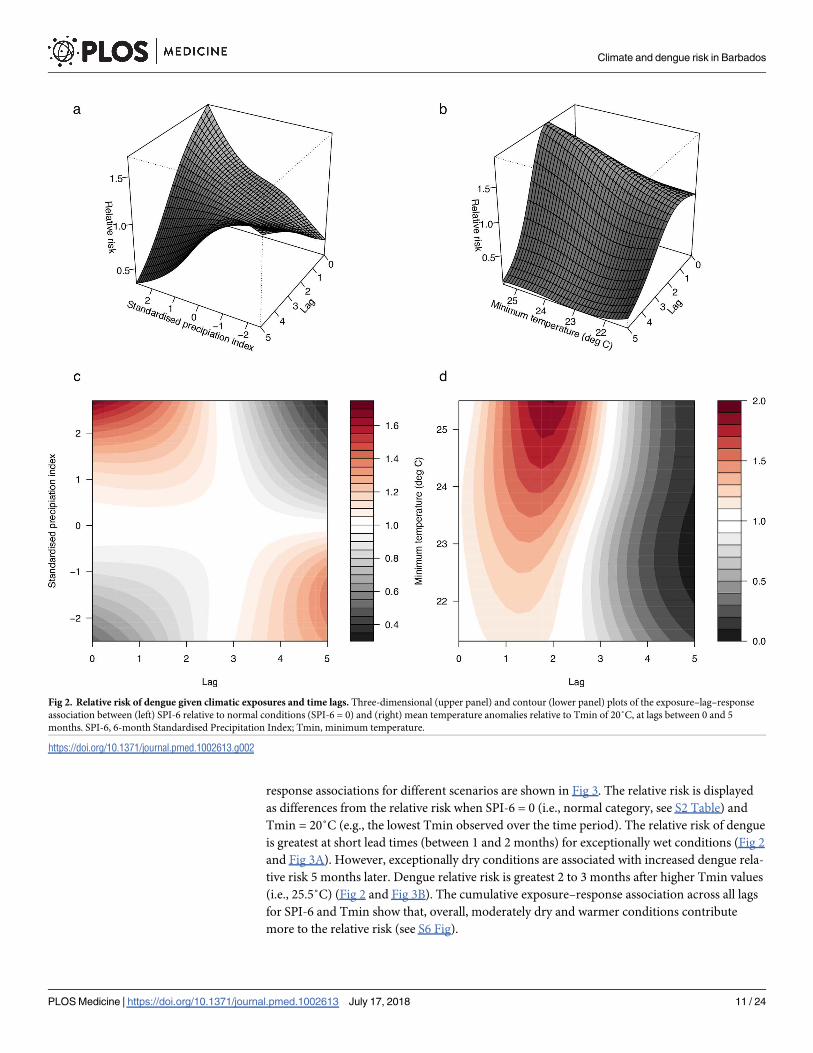
response associations for different scenarios are shown in Fig 3. The relative risk is displayed
as differences from the relative risk when SPI-6 = 0 (i.e., normal category, see S2 Table) and
Tmin = 20˚C (e.g., the lowest Tmin observed over the time period). The relative risk of dengue
is greatest at short lead times (between 1 and 2 months) for exceptionally wet conditions (Fig 2
and Fig 3A). However, exceptionally dry conditions are associated with increased dengue rela-
tive risk 5 months later. Dengue relative risk is greatest 2 to 3 months after higher Tmin values
(i.e., 25.5˚C) (Fig 2 and Fig 3B). The cumulative exposure–response association across all lags
for SPI-6 and Tmin show that, overall, moderately dry and warmer conditions contribute
more to the relative risk (see S6 Fig).
Fig 2. Relative risk of dengue given climatic exposures and time lags. Three-dimensional (upper panel) and contour (lower panel) plots of the exposure–lag–response
association between (left) SPI-6 relative to normal conditions (SPI-6 = 0) and (right) mean temperature anomalies relative to Tmin of 20˚C, at lags between 0 and 5
months. SPI-6, 6-month Standardised Precipitation Index; Tmin, minimum temperature.
https://doi.org/10.1371/journal.pmed.1002613.g002
Climate and dengue risk in Barbados
PLOS Medicine | https://doi.org/10.1371/journal.pmed.1002613 July 17, 2018 11 / 24

Detecting outbreaks
Moving outbreak thresholds were calculated as the 75th percentile of the distribution of den-
gue cases per month between June 1999 and May 2016, excluding the ‘dengue’ year for which
the prediction was valid. We applied this moving threshold to produce out-of-sample probabi-
listic predictions of exceeding the outbreak threshold for all 17 years (June 1999–May 2016) as
a demonstration.
Fig 4 shows time series of observed and out-of-sample predicted dengue incidence rates
(per 100,000 population) from May 1999 to June 2016. Posterior predictive mean and the
upper 95% prediction (credible) interval from the final model (fitted 17 times in cross-valida-
tion mode, excluding 1 dengue year at a time), and the moving outbreak threshold (75th per-
centile of observed dengue incidence rates per month, excluding the year for which the
prediction is valid) are also included (note, a scatter plot of observed versus posterior predic-
tive mean dengue incidence rates from the final model is shown in S7 Fig; for comparison,
posterior predictive mean dengue incidence rates from the baseline model are also shown). Fig
5 shows the probability of exceeding the moving outbreak threshold. For each time step, the
proportion of the 1,000 samples simulated from the final model that exceeded the moving out-
break threshold was calculated. The deeper the colour, the greater the predicted probability of
exceeding the outbreak threshold. Observed exceedance events are marked with a cross. The
model was able to correctly forecast peak months and distinguish between outbreak and non-
outbreak years, except in the last 2 dengue seasons (2014–2015, 2015–2016). The model simu-
lated a high probability (expressed as deeper colours) of exceeding the threshold in 2007–2008
and 2010–2011, and also in 2013 (Fig 5) when peaks occurred either earlier or later than
expected (Fig 4). For nonoutbreak years (e.g., 2004–2005 and 2005–2006), the model correctly
predicted a very low probability of outbreaks (depicted by pale colours).
Fig 3. Lag–response for extreme climatic scenarios. Lag–response association for scenarios of (a) SPI-6: exceptionally dry (SPI-6 = −2.5) and exceptionally wet (SPI-
6 = 2.5) conditions relative to the baseline (SPI-6 = 0) and (b) Tmin: Tmin = 21.5˚C and Tmin = 25.5˚C relative to the baseline (Tmin = 20˚C), at lags between 0 and 5
months. SPI-6, 6-month Standardised Precipitation Index; Tmin, minimum temperature.
https://doi.org/10.1371/journal.pmed.1002613.g003
Climate and dengue risk in Barbados
PLOS Medicine | https://doi.org/10.1371/journal.pmed.1002613 July 17, 2018 12 / 24

The outbreak detection performance of the model is summarised in Table 2, which shows
ROC and contingency table results for observed dengue cases exceeding the moving outbreak
threshold. As an indicator of the quality of the forecasting system, the area under the ROC
curve (AUC) was calculated as 0.90 for the final model. This indicates that the forecasting sys-
tem performs significantly better than randomly guessing (AUC = 0.5). For the baseline
model, AUC = 0.75 (see Table 2 and S8 Fig). The ‘optimal’ cut-off value that maximised sensi-
tivity and specificity for the moving outbreak threshold was 30% for the final model (27% for
the baseline model). Using this trigger alert threshold, we looked at a binary classification of
predicted and observed outbreaks. The final model produced more hits and fewer missed
events than the baseline model, with a hit rate (probability of detection) of 90% (miss rate =
10%) for the final model, compared with 79% (miss rate = 21%) for the baseline model. The
final model also had a lower false alarm rate of 31% compared with 57% for the baseline
model. Overall, the proportion of correctly predicted outbreaks and nonoutbreaks was 86%
(see Table 2).
Discussion
Drought conditions were found to positively influence dengue incidence rates at longer lead
times up to 5 months, while excess rainfall increased the risk at shorter lead times between 1
and 2 months. Therefore, the modelling results suggest that a drought period followed by
intense rainfall 4 to 5 months later could provide optimum conditions for an imminent
Fig 4. Predicted versus observed dengue incidence rates. Posterior predicted mean (dashed purple curve) and 95%
prediction interval (shaded area) for dengue incidence rates (per 100,000 population) in Barbados from June 1999 to
May 2016, simulated from the final model (refitted 17 times, leaving out 1 year at a time). Observed values (solid
orange curve) and moving outbreak threshold (blue dotted curve) are included. Year labels are included at the start of
each calendar year (e.g., in January).
https://doi.org/10.1371/journal.pmed.1002613.g004
Climate and dengue risk in Barbados
PLOS Medicine | https://doi.org/10.1371/journal.pmed.1002613 July 17, 2018 13 / 24

dengue outbreak. The use of the SPI-6, designed to monitor drought and extreme rainfall, bet-
ter explained variations in dengue risk than summary statistics of measured precipitation.
Tmin explained more variation in dengue incidence rates than mean or maximum
Fig 5. Predicted probability of exceeding moving outbreak thresholds. Probability of exceeding the moving outbreak
threshold (75th percentile of observed dengue cases per month, excluding the year for which the prediction is valid) from
June 1999 to May 2016, using out-of-sample predictive distributions simulated from the final model. The graduated colour
bar represents the predicted probability of observing an outbreak (ranging from 0, pale colours, to 1, deep colours). Months
in which the moving outbreak threshold was exceeded are marked with a cross. Note: the ‘dengue season’ year runs from
June to May.
https://doi.org/10.1371/journal.pmed.1002613.g005
Table 2. Sensitivity and specificity results for observed dengue incidence rates exceeding the moving outbreak
threshold. Summary of ROC and contingency table analysis for observed dengue incidence rates exceeding the mov-
ing outbreak threshold (75th percentile of observed dengue cases per month, excluding the year for which the predic-
tion is valid) using out-of-sample probabilistic predictive distributions from the final and baseline models (95% CIs
included in parentheses).
Performance measures Final model Baseline model
AUC 0.9 (0.85–0.94) 0.75 (0.71–0.79)
Probability trigger threshold 0.3 0.27
Hit rate 0.9 (0.82–0.97) 0.79 (0.69–0.9)
False alarm rate 0.31 (0.22–0.39) 0.57 (0.51–0.63)
Proportion correct 0.86 (0.81–0.91) 0.64 (0.58–0.71)
Abbreviations: AUC, area under the ROC curve; ROC, relative (receiver) operating characteristic.
https://doi.org/10.1371/journal.pmed.1002613.t002
Climate and dengue risk in Barbados
PLOS Medicine | https://doi.org/10.1371/journal.pmed.1002613 July 17, 2018 14 / 24

temperature. Furthermore, including bidimensional exposure–lag–response functions of these
indicators—rather than linear effects for individual lags—more appropriately described the cli-
mate–disease associations than traditional modelling approaches. To our knowledge, DLNM
methodology has not previously been combined with a Bayesian hierarchical mixed-modelling
framework to produce probabilistic predictions of exceeding dengue outbreak thresholds. To
demonstrate the added value of our climate-driven dengue model, we formulated a baseline
model to represent current practice (i.e., monitoring dengue cases throughout the year against
historic seasonal averages). A probability trigger threshold was calculated by using the ROC
curve to select an optimal cut-off value that maximised sensitivity and specificity for the mov-
ing outbreak threshold of the upper quartile of the observed dengue distribution per month.
The model successfully distinguished outbreaks from nonoutbreaks, except in the last 2 den-
gue seasons (2014–2015, 2015–2016), with an overall proportion of correct predictions (hits
and correct rejections) of 86% compared with 64% for the baseline model.
The observed effect of Tmin on dengue transmission is consistent with findings from prior
studies in the Americas, which also found that Tmin was a better predictor of dengue trans-
mission than mean or maximum temperature [48–52]. Tmin appears to be a key regulating cli-
mate parameter for dengue. In Barbados, high values of Tmin were 25.5˚C, the lower end of
the optimal temperature range for endemic dengue transmission (26–29˚C) [13].
We hypothesise that the effect of excess rainfall and drought on dengue risk operated at dif-
ferent time scales due to different mechanisms associated with the availability of larval habitat
and water storage in the urban environment. Following a rainfall event, the availability of larval
habitat increases (e.g., rain-filled abandoned containers, rubbish), and within a relatively short
period of time, eggs hatch and adult mosquito densities increase (i.e., approximately 2–3
weeks after rainfall, depending on ambient temperatures). Subsequently, the risk of arbovirus
infections increases several weeks later, a lag associated with the intrinsic and extrinsic viral
incubation periods.
In contrast, we observed that drought conditions, as determined by the SPI-6, were associ-
ated with dengue risk over longer periods of time (5-month lag). Barbados is among the 10
most water-scarce countries in the world [34], and water scarcity is exacerbated during periods
of drought. Drought is a slow-onset climate hazard. The depletion of surface water reservoirs
occurs over 6 or more months, and the depletion of groundwater reservoirs occurs at 9- to
12-month time scales. As households are alerted to water scarcity, they take measures to store
water in containers around the home, increasing the availability of larval habitat for A. aegypti.As a result, we hypothesise that household water storage during drought periods may increase
the risk of dengue transmission. Alternatively, we hypothesise that the increase in containers
in the environment during drought may increase the risk of dengue transmission months
later, when the rainy season begins and water storage is no longer a necessity. Prolonged
drought could result in changes in human behaviour associated with water storage, habits that
could extend beyond the period of water scarcity. In our experience, water storage containers
become a greater hazard for dengue when they are not used and maintained regularly and
instead serve as a ‘backup’ water source [14]. When a drought is followed by heavy rainfall, the
risk of dengue could increase, as observed in 2010–2011, a year of exceptionally high dengue
transmission across the Americas and an El Niño event. That year, DENV serotypes 1 and 4
were re-introduced after no circulation for several years, and an outbreak occurred with all 4
serotypes in cocirculation (2,000 suspected cases, 575 confirmed cases in Barbados) [5].
To our knowledge, there is little known about the effects of prolonged drought on dengue
transmission. Some studies have shown that rainfall shortages can increase dengue risk in
regions where people store water [14,15,53]. However, entomological and epidemiological
field studies are needed to elucidate the mechanisms linking drought to dengue risk in
Climate and dengue risk in Barbados
PLOS Medicine | https://doi.org/10.1371/journal.pmed.1002613 July 17, 2018 15 / 24

Barbados. Ultimately, the effects of rainfall on dengue transmission depend on the local socioe-
cological conditions that determine the types of larval habitat available in the environment, as
well as water access and storage.
In recent decades, the Caribbean has experienced several drought events. Notable events
during our study period include 2002–2003, 2009–2010, and 2015–2016. Drought and water
scarcity are projected to increase in the future due to climate change [54]. To address this situ-
ation, Barbados passed building regulations that mandate the construction of rainwater stor-
age receptacles under large new buildings. These receptacles have become ideal larval habitat
for A. aegypti. Although these measures were intended to increase the capacity of the country
to adapt to climate change, they may have had the unintended consequence of increasing the
overall risk of arboviral diseases during any time when rainfall is collected and stored. In
response, the Ministry of Health has issued recommendations to adequately cover all water
storage receptacles and, if necessary, apply screen mesh material to all entry sites for small and
large cisterns. Presently, the Ministry of Health is working on producing Safe Water Storage
Guidelines as a reference for the public to reduce the risk of mosquito-borne diseases. This
example highlights the need for intersectoral collaboration to address the complexities of cli-
mate and health in Barbados and in other SIDS.
In Barbados, over the last 5 years, there have been 3 outbreaks of dengue fever (2013–2014,
2014–2015, and 2015–2016), 1 outbreak of chikungunya virus (2014–2015), and 1 outbreak of
Zika virus (2015–2016). Better management of arboviruses is a high priority for Caribbean
SIDS given the burden of A. aegypti–transmitted arboviruses in the region, suitable climatic
conditions for vector proliferation, and susceptible human populations, as well as the potential
for transmission via widespread intra- and extraregional travel in the Caribbean [55]. To
address this need, the CIMH—as part of its implementation of a regional multisectoral Early
Warning Information Systems Across Climate Timescales (EWISACTs) programme—has
partnered with the Caribbean Public Health Agency (CARPHA), national Ministries of Health,
National Meteorological and Hydrological Services, and an international research team to sup-
port the development of regional arbovirus forecast models using climate information. This
programme aims to codesign, codevelop, and codeliver sector-driven climate early warning
information. One avenue for communicating warnings of dengue risk is through the Carib-
bean Health-Climatic Bulletin, a new joint quarterly bulletin of the CARPHA, the Pan-Ameri-
can Health Organization, and the CIMH [56]. The bulletin offers consensus-based expert
statements of probable health outcomes extrapolated from a review of the CIMH’s suite of
monitoring and forecast products contextualised to the Caribbean health context up to 3 to 6
months in advance. Integration of quantitative probabilistic forecasts of dengue risk generated
by the modelling framework described in this paper represents a significant emerging
research-to-operations advance that has the potential to respond to the health community’s
need for empirical risk estimates for periods of operational relevance to public health. Quanti-
tative probabilistic forecasts of disease risk will enhance the quality of warning information
and provide improved guidance for decision-making.
Climate anomalies in the Caribbean are associated with tropical Atlantic and Pacific sea
surface temperatures, which are usually well predictable at seasonal time scales [57]. This gives
useful predictive skill to regional and seasonal climate forecast models, especially seasonal tem-
perature and SPI-based outlooks with up to 6 months lead time. Previous studies have shown
that seasonal climate forecasts combined with dengue risk prediction models can extend pre-
dictive lead time from a few months to nearly a year [36,58], thus indicating the potential to
develop public health interventions based on climate information in the Caribbean.
In practice, the CIMH could run this dengue model using their seasonal climate forecast
products. Results could be updated on a monthly basis as the target month is approached. This
Climate and dengue risk in Barbados
PLOS Medicine | https://doi.org/10.1371/journal.pmed.1002613 July 17, 2018 16 / 24

should reduce forecast uncertainty as one more month of climate observations becomes avail-
able and one fewer month of climate forecasts is needed. CariCOF’s SPI-6-based drought out-
looks have a prediction lead time of 3 months. For example, CariCOF’s SPI-6-based drought
outlook issued in July, which estimates the drought situation by the end of October, could be
used to predict the dengue risk in October (target month). Observed SPI-6 data for May (i.e.,
calculated from the observed rainfall totals from December of the previous year to May of the
current year) and June (i.e., 4 and 5 months before the target month, to capture the long-lag
impacts on dengue risk) would be used along with forecast SPI-6 conditions from July to
October (i.e., lags of 0–3 months with respect to the target month). This would produce a
3-month lead dengue forecast (see Fig 6). In August, the dengue forecast for October could be
updated—using the new observed SPI-6 value for July and updated SPI-6 forecasts for August
(i.e., an SPI-6 calculated from the sum of observed rainfall totals from March to July and fore-
cast rainfall totals for August) to October—to produce a 2-month-ahead dengue forecast for
October (Fig 6), and so on. The dengue model parameter estimates could be updated on an
annual basis as new dengue incidence and climate data become available.
Seasonal forecast models can contribute to reducing the risk of disease outbreaks by
increasing preparation time to better allocate scarce resources. To date, there are few localised
studies in this region that quantify the associations between subseasonal to seasonal forecasts
of climate and dengue risk outcomes. In the absence of a robust evidence base, the operational
use of climate information for predicting increased dengue risk remains an untapped opportu-
nity to support climate-driven dengue early warning information systems. This is an area of
further investigation, along with the transferability of this framework to model and predict the
risk of dengue and other arboviruses in other Caribbean countries.
There are several limitations of the study. In Barbados, the absolute number of dengue
cases across the island is relatively small, even in outbreak years (i.e., 1,140 confirmed cases in
2013, 488 confirmed cases in 2014, and 587 confirmed cases in 2016). The time series is rela-
tively long compared with previously studied dengue records in other countries. However, it is
still limited for statistical modelling purposes because our knowledge of outbreak dynamics is
based on the behaviour of only a few outbreaks. Ideally, data on vector control activities and
other interventions or policy changes would be included in the model. In the absence of such
data, monthly and yearly random effects are included in the model to try and ensure that the
Fig 6. The type of climate information required for a dengue forecast in a given target month. Schematic to show the
type (e.g., observed or forecast) of climate information (e.g., SPI-6 and Tmin variables, lags 0 to 5) used to produce a dengue
forecast for the target month of October. The first forecast would be issued 3 months ahead of the target (i.e., 3-month lead
time), in July, using observed climate data (for SPI-6 and Tmin) for May and June and forecast climate data for July, August,
September, and October. The forecast would then be updated in August (i.e., 2-month lead time) using observed climate for
July and updated climate forecasts for August, September, and October. In September, 1 month before the target (i.e.,
1-month lead time), the dengue forecast would be updated again, using observed climate from May to August and updated
climate forecasts for September and October. SPI-6, 6-month Standardised Precipitation Index; Tmin, minimum
temperature.
https://doi.org/10.1371/journal.pmed.1002613.g006
Climate and dengue risk in Barbados
PLOS Medicine | https://doi.org/10.1371/journal.pmed.1002613 July 17, 2018 17 / 24

variance in the predictions includes uncertainty that could be generated by these unknown fea-
tures of the disease system. However, while yearly effects are useful to identify missing infor-
mation and better quantify the contribution of explanatory variables to the relative risk, they
cannot contribute to out-of-sample predictions unless prior assumptions about the year ahead
can be made.
The model failed to predict the peak and magnitude of the last 2 dengue transmission sea-
sons, which coincided with the first epidemics of chikungunya and Zika. The emergence of
these viruses, which are transmitted by the same mosquito vector, likely altered diagnostic,
reporting, and healthcare-seeking practices, and we suspect that this might have affected the
model performance for the last 2 dengue seasons in 2015 and 2016. This may also be true in
other countries and territories across Latin America and the Caribbean during this time
period. Dengue virus, chikungunya virus, and Zika virus have a similar clinical presentation
(e.g., mild febrile illness, rash, joint pain), and differential diagnosis is challenging without
molecular diagnostics (e.g., PCR) due to cross-reactivity of the serological assays. Only after
September 2016 was Barbados able to test suspected arbovirus infections using a triplex PCR;
prior to then, a subset of samples was sent for confirmation to CARPHA’s diagnostic labora-
tory in Trinidad and Tobago. The emergence of Zika virus may have also changed healthcare-
seeking behaviour, with more women seeking diagnostics for mild febrile illness due to con-
cerns about Zika congenital syndrome [37], resulting in an increase in the detection of dengue
and Zika infections in women. The cocirculation of dengue, chikungunya, and Zika in the
region poses a challenge for forecasting future risk, unless high-quality seroprevalence data
can be incorporated in the model [36].
Overall, the final model had a lower false alarm rate and a lower miss rate than the baseline
model. However, the model did result in false alarms 31% of the time. Repeatedly issuing false
alarms can result in a lack of trust from the general public. However, in practice, false alarms
(i.e., issuing a high probability alert of a dengue outbreak) can, in fact, result from effective
interventions in response to the alert. Furthermore, when dealing with detrimental health
events, such as disease outbreaks, false alarms are preferable to missed events.
The objective of this study was to select a model to infer delayed and nonlinear impacts of
climate on dengue risk and predict the probability of exceeding an outbreak threshold relevant
to the Ministry of Health in Barbados and other islands in the Caribbean. Forecasts of the prob-
ability of exceeding outbreak thresholds allow decision-makers to quantify the level of certainty
of the model predictions. However, when using predefined outbreak and alarm trigger thresh-
olds, the translation of probabilities into discrete warnings might not always reflect the predic-
tive power of the model [46]. Outbreak and alarm trigger thresholds need to be carefully chosen
to reflect the capacity of the public health system to respond to imminent outbreaks.
Conclusion
We are working towards implementing a climate-based early warning system for arboviral dis-
eases in all Caribbean islands and territories. Not only does this study contribute to enriching
the knowledge base, it represents a considerable opportunity to translate investment in health–
climate research into practice to improve national and regional health outcomes. The goal is to
enhance the health warnings issued in the quarterly Caribbean Health-Climatic Bulletin with
quantitative probabilistic forecasts of disease risk rather than expert statements on probable
health outcomes. Integration of an early warning information product into national and sec-
toral planning and practice has the potential to reverse the upward trend of new infections of
arboviral diseases, which currently undermines the productivity and sustainable development
of SIDS in the Caribbean.
Climate and dengue risk in Barbados
PLOS Medicine | https://doi.org/10.1371/journal.pmed.1002613 July 17, 2018 18 / 24

Supporting information
S1 Fig. Site map and location of meteorological stations in Barbados. Map of Caribbean
(left) and Barbados showing population (middle) and elevation (right) and the locations of the
2 main meteorological stations (CIMH and GAIA). This figure was created in ArcGIS version
10.3.1 [59] using shapefiles from the GADM database of Global Administrative Areas version
2.8, freely available at gadm.org [60]. CIMH, Caribbean Institute for Meteorology and Hydrol-
ogy; GAIA, Grantley Adams International Airport.
(TIF)
S2 Fig. Smoothed rainfall seasonality at the CIMH synoptic station in Barbados. The
chance of a wet day (i.e., a calendar day with>0.85 mm; left panel) and the average rainfall
intensity on a wet day for each Julian day of the year (right panel). Source: modified from Trot-
man and colleagues [20]. CIMH, Caribbean Institute for Meteorology and Hydrology.
(TIF)
S3 Fig. Annual cycle of dengue incidence rates and meteorological station data. Annual
cycle of (a) dengue incidence rate (per 100,000 population), (b) precipitation (mm/month),
and (c) Tmin (˚C) averaged over CIMH and GAIA weather stations. CIMH, Caribbean Insti-
tute for Meteorology and Hydrology; GAIA, Grantley Adams International Airport; Tmin,
minimum temperature.
(TIF)
S4 Fig. Annual cycle of the SPI-6 and the Oceanic Niño Index. Annual cycle of (a) SPI-6 and
(b) Oceanic Niño Index, defined as the 3-month running-mean sea surface temperature depar-
tures from average in the Niño 3.4 region (120–170˚ W, 5˚ S-5˚ N), from June 1999 to May
2016. SPI-6, 6-month Standardised Precipitation Index.
(TIF)
S5 Fig. Annual cycle of dengue cases in Barbados during drier than normal, near-normal,
and wetter than normal seasons. Annual cycle of dengue cases given tercile categories of the
SPI-6: drier than normal (solid curve), normal (dashed curve), and wetter than normal (dotted
curve). During wetter than average years, dengue cases tended to peak earlier in the season, in
September, whereas dry years coincided with late-season peaks. SPI-6, 6-month Standardised
Precipitation Index.
(TIF)
S6 Fig. Overall cumulative exposure–response. Exposure–response association across all lags
(0 to 5 months) for (a) the SPI-6 relative to the baseline SPI-6 = 0 and (b) Tmin relative to the
baseline Tmin = 20˚C. SPI-6, 6-month standardised precipitation index; Tmin, minimum
temperature.
(TIF)
S7 Fig. Observed versus predicted dengue incidence rates. Observed versus posterior pre-
dicted mean dengue incidence rates (per 100,000 population) from the final model (purple cir-
cles) and the baseline model (red squares). Note: logarithmic scale.
(TIF)
S8 Fig. ROC curves to define alarm trigger threshold. ROC curve for binary event of dengue
incidence rates exceeding the moving outbreak threshold (75th percentile of observed dengue
incidence rates per month, excluding the year for which the prediction is valid) for (a) final
model (without year effect contribution) and (b) baseline model. Numbers indicate values of
probability thresholds along the curve, and the purple circle indicates the position of an
Climate and dengue risk in Barbados
PLOS Medicine | https://doi.org/10.1371/journal.pmed.1002613 July 17, 2018 19 / 24

‘optimal’ ROC cut-off (alarm trigger threshold), defined as the point on the curve closest to the
point of perfect discrimination (0, 1). Note: false alarms are a desired outcome when the pre-
dicted probability of threshold exceedance is very low. ROC, relative (receiver) operating char-
acteristic.
(TIF)
S1 Table. SPI values and precipitation intensities [35]. SPI, Standardised Precipitation
Index.
(DOCX)
S2 Table. SPI classification used in the Caribbean from January 2011. SPI, Standardised
Precipitation Index.
(DOCX)
S3 Table. Model adequacy results for single-lag univariate models. Summary statistics for a
model including monthly and yearly random effects and (a) SPI-6 and (b) Tmin at individual lags
of 0 to 5 months: posterior mean, 95% CIs, the CV mean logarithmic score, the DIC, and the like-
lihood ratio RLR2 statistic. CI, credible interval; CV, cross-validated; DIC, deviance information
criterion; SPI-6, 6-month Standardised Precipitation Index; Tmin, minimum temperature.
(DOCX)
S4 Table. SPI variable at different time scales. The CV mean logarithmic score, the DIC, and
the likelihood ratio RLR2 statistic for models including monthly and yearly random effects and
an exposure–lag–response function with time lags from 0 to 5 months for the SPI averaged
over 1 month, 3 months, 6 months, and 12 months). The best indicator is shaded in grey. CV,
cross-validated; DIC, deviance information criterion; SPI, Standardised Precipitation Index.
(DOCX)
S5 Table. Climate variable selection. The CV mean logarithmic score, the DIC, and the likeli-
hood ratio RLR2 statistic for models including monthly and yearly random effects and an expo-
sure–lag–response function with time lags from 0 to 5 months for individual climate variables:
precipitation, SPI (1-month, 3-month, 6-month, and 12-month), Tmin, mean temperature,
and maximum temperature. CV, cross-validated; DIC, deviance information criterion; SPI,
Standardised Precipitation Index; Tmin, minimum temperature.
(DOCX)
S1 Text. Prior and hyperprior distribution specification.
(DOCX)
Acknowledgments
The authors are grateful to Trevor Bailey, Hårvard Rue, Ben Armstrong, Charmaine Blades,
Shermaine Clauzel, Steve Daniel, Sally Edwards, Lyndon Forbes Robertson, Adrianus Vlug-
man, Marquita Gittens-St. Hilaire, and Karen Polson-Edwards for valuable expert advice dur-
ing this study.
Author Contributions
Conceptualization: Rachel Lowe, Antonio Gasparrini, Cedric J. Van Meerbeeck, Adrian R.
Trotman, Anna M. Stewart-Ibarra.
Data curation: Rachel Lowe, Cedric J. Van Meerbeeck, Catherine A. Lippi, Leslie Rollock,
Sadie J. Ryan, Anna M. Stewart-Ibarra.
Climate and dengue risk in Barbados
PLOS Medicine | https://doi.org/10.1371/journal.pmed.1002613 July 17, 2018 20 / 24

Formal analysis: Rachel Lowe, Antonio Gasparrini, Cedric J. Van Meerbeeck.
Funding acquisition: Adrian R. Trotman, Anna M. Stewart-Ibarra.
Investigation: Rachel Lowe, Cedric J. Van Meerbeeck, Catherine A. Lippi, Roche Mahon,
Sadie J. Ryan, Anna M. Stewart-Ibarra.
Methodology: Rachel Lowe, Antonio Gasparrini, Cedric J. Van Meerbeeck, Roche Mahon.
Project administration: Anna M. Stewart-Ibarra.
Resources: Cedric J. Van Meerbeeck, Roche Mahon, Adrian R. Trotman, Avery Q. J. Hinds,
Sadie J. Ryan.
Software: Antonio Gasparrini.
Supervision: Adrian R. Trotman, Sadie J. Ryan.
Validation: Rachel Lowe, Cedric J. Van Meerbeeck, Roche Mahon, Adrian R. Trotman, Leslie
Rollock, Avery Q. J. Hinds, Sadie J. Ryan.
Visualization: Rachel Lowe, Catherine A. Lippi.
Writing – original draft: Rachel Lowe, Cedric J. Van Meerbeeck, Catherine A. Lippi, Roche
Mahon, Adrian R. Trotman, Anna M. Stewart-Ibarra.
Writing – review & editing: Rachel Lowe, Antonio Gasparrini, Cedric J. Van Meerbeeck,
Catherine A. Lippi, Roche Mahon, Adrian R. Trotman, Leslie Rollock, Avery Q. J. Hinds,
Sadie J. Ryan, Anna M. Stewart-Ibarra.
References1. UNFCCC. Climate change: small island developing states [Internet]. 2005. Available from: http://
unfccc.int/resource/docs/publications/cc_sids.pdf. [cited 11 Jan 2018].
2. Macpherson CC, Akpinar-Elci M. Caribbean heat threatens health, well-being and the future of human-
ity. Public Health Ethics. 2015; 8: 196–208. https://doi.org/10.1093/phe/phv008 PMID: 26180551
3. Ebi KL, Lewis ND, Corvalan C. Climate Variability and Change and Their Potential Health Effects in
Small Island States: Information for Adaptation Planning in the Health Sector. Environ Health Perspect.
2006; 114: 1957–1963. https://doi.org/10.1289/ehp.8429 PMID: 17185291
4. PAHO/WHO. PLISA Health Information Platform for the Americas [Internet]. 2017. Available from:
http://www.paho.org/data/index.php/en/mnu-topics/indicadores-dengue-en/dengue-nacional-en/252-
dengue-pais-ano-en.html. [cited 10 Feb 2018].
5. Kumar A, Gittens-St Hilaire M, Nielsen A. Long-term epidemiological dynamics of dengue in Barbados–
one of the English-speaking Caribbean countries. Epidemiol Infect. 2018; 1–8.
6. Shepard D, Coudeville L, Halasa Y, Zambrano B, Dayan G. Economic impact of dengue illness in the
Americas. Am J Trop Med Hyg. 2011; 84: 200–7. https://doi.org/10.4269/ajtmh.2011.10-0503 PMID:
21292885
7. International Monetary Fund. Caribbean Small States: Challenges of High Debt and Low Growth [Inter-
net]. International Monetary Fund; 2013. Available from: https://www.imf.org/external/np/pp/eng/2013/
022013b.pdf. [cited 5 Feb 2018].
8. Caribbean Development Bank. 2015 Economic Review. 2016 Forecast [Internet]. Caribbean Develop-
ment Bank; 2016. Available from: http://www.caribank.org/wp-content/uploads/2016/02/CDB_
2015EconomicReview_2016Forecast.pdf. [cited 5 Feb 2018].
9. Amarakoon D, Chen A, Rawlins S, Chadee DD, Taylor M, Stennett R. Dengue epidemics in the Carib-
bean-temperature indices to gauge the potential for onset of dengue. Mitig Adapt Strateg Glob Change.
2008; 13: 341–357. https://doi.org/10.1007/s11027-007-9114-5
10. Depradine C, Lovell E. Climatological variables and the incidence of Dengue fever in Barbados. Int J
Environ Health Res. 2004; 14: 429–441. https://doi.org/10.1080/09603120400012868 PMID: 15545038
11. Jury MR. Climate influence on dengue epidemics in Puerto Rico. Int J Environ Health Res. 2008; 18:
323–334. https://doi.org/10.1080/09603120701849836 PMID: 18821372
Climate and dengue risk in Barbados
PLOS Medicine | https://doi.org/10.1371/journal.pmed.1002613 July 17, 2018 21 / 24

12. Paulo Ortiz L, Rivero A, Linares Y, Perez A, Vazquez JR. Spatial models for prediction and early warn-
ing of Aedes aegypti proliferation from data on climate change and variability in Cuba. MEDICC Rev.
2015; 17: 20–28. PMID: 26027583
13. Mordecai EA, Cohen JM, Evans MV, Gudapati P, Johnson LR, Lippi CA, et al. Detecting the impact of
temperature on transmission of Zika, dengue, and chikungunya using mechanistic models. PLoS Negl
Trop Dis. 2017; 11: e0005568. https://doi.org/10.1371/journal.pntd.0005568 PMID: 28448507
14. Stewart Ibarra AM, Ryan SJ, Beltran E, Mejıa R, Silva M, Muñoz A. Dengue Vector Dynamics (Aedes
aegypti) Influenced by Climate and Social Factors in Ecuador: Implications for Targeted Control. PLoS
ONE. 2013; 8: e78263. https://doi.org/10.1371/journal.pone.0078263 PMID: 24324542
15. Pontes RJ, Freeman J, Oliveira-Lima JW, Hodgson JC, Spielman A. Vector densities that potentiate
dengue outbreaks in a Brazilian city. Am J Trop Med Hyg. 2000; 62: 378–383. PMID: 11037781
16. Rawlins SC, Wan JOH. Resistance in some Caribbean populations of Aedes aegypti to several insecti-
cides. J Am Mosq Control Assoc-Mosq News. 1995; 11: 59–65.
17. Hambleton I. Analysis of dengue cases in Barbados: 2004–2013. 2014.
18. Giannini A, Kushnir Y, Cane MA. Interannual Variability of Caribbean Rainfall, ENSO, and the Atlantic
Ocean. J Clim. 2000; 13: 297–311. https://doi.org/10.1175/1520-0442(2000)013<0297:IVOCRE>2.0.
CO;2
19. Taylor MA, Stephenson TS, Owino A, Chen AA, Campbell JD. Tropical gradient influences on Carib-
bean rainfall. J Geophys Res. 2011; 116: D00Q08. https://doi.org/10.1029/2010JD015580
20. Trotman A, Joyette A, Van Meerbeeck C, Mahon R, Cox S-A, Cave N, et al. Drought Risk Management
in the Caribbean Community–Early Warning Information and other Risk Reduction Considerations.
Drought and Water Crises: Integrating Science, Management, and Policy Second Edition. Donald A.
Wilhite and Roger S. Pulwarty. CRC Press; 2017. p. 592.
21. Banu S, Hu W, Guo Y, Hurst C, Tong S. Projecting the impact of climate change on dengue transmis-
sion in Dhaka, Bangladesh. Environ Int. 2014; 63: 137–142. https://doi.org/10.1016/j.envint.2013.11.
002 PMID: 24291765
22. Xiang J, Hansen A, Liu Q, Liu X, Tong MX, Sun Y, et al. Association between dengue fever incidence
and meteorological factors in Guangzhou, China, 2005–2014. Environ Res. 2017; 153: 17–26. https://
doi.org/10.1016/j.envres.2016.11.009 PMID: 27883970
23. Ramadona AL, Lazuardi L, Hii YL, Holmner AAsa, Kusnanto H, Rocklov J. Prediction of dengue out-
breaks based on disease surveillance and meteorological data. PLoS ONE. 2016; 11: e0152688.
https://doi.org/10.1371/journal.pone.0152688 PMID: 27031524
24. Cheong YL, Burkart K, Leitão PJ, Lakes T. Assessing Weather Effects on Dengue Disease in Malaysia.
Int J Environ Res Public Health. 2013; 10: 6319–6334. https://doi.org/10.3390/ijerph10126319 PMID:
24287855
25. Xu H-Y, Fu X, Lee LKH, Ma S, Goh KT, Wong J, et al. Statistical modeling reveals the effect of absolute
humidity on dengue in Singapore. PLoS Negl Trop Dis. 2014; 8: e2805. https://doi.org/10.1371/journal.
pntd.0002805 PMID: 24786517
26. Liyanage P, Tissera H, Sewe M, Quam M, Amarasinghe A, Palihawadana P, et al. A spatial hierarchical
analysis of the temporal influences of the El Nino-southern oscillation and weather on dengue in Kalu-
tara District, Sri Lanka. Int J Environ Res Public Health. 2016; 13: 1087.
27. Chien L-C, Yu H-L. Impact of meteorological factors on the spatiotemporal patterns of dengue fever inci-
dence. Environ Int. 2014; 73: 46–56. https://doi.org/10.1016/j.envint.2014.06.018 PMID: 25084561
28. Gasparrini A. Modeling exposure–lag–response associations with distributed lag non-linear models.
Stat Med. 2014; 33: 881–899. https://doi.org/10.1002/sim.5963 PMID: 24027094
29. Government of Barbados. 2010 Population and Housing Census [Internet]. 2013. Available from: http://
www.barstats.gov.bb/files/documents/PHC_2010_Census_Volume_1.pdf. [cited 6 Feb 2018].
30. BTI. Barbados Tourism Investment Inc [Internet]. 2018. Available from: https://www.
barbadostourisminvestment.com/tourism-profile/. [cited 10 Feb 2018].
31. WMO Caribbean Regional Climate Centre [Internet]. 2017. Available from: http://rcc.cimh.edu.bb/.
[cited 29 Dec 2017].
32. Enfield DB, Alfaro EJ. The Dependence of Caribbean Rainfall on the Interaction of the Tropical Atlantic
and Pacific Oceans. J Clim. 1999; 12: 2093–2103. https://doi.org/10.1175/1520-0442(1999)012<2093:
TDOCRO>2.0.CO;2
33. Stephenson TS, Vincent LA, Allen T, Van Meerbeeck CJ, McLean N, Peterson TC, et al. Changes in
extreme temperature and precipitation in the Caribbean region, 1961–2010. Int J Clim. 2014; 34: 2957–
2971. https://doi.org/10.1002/joc.3889
Climate and dengue risk in Barbados
PLOS Medicine | https://doi.org/10.1371/journal.pmed.1002613 July 17, 2018 22 / 24

34. Reig P, Maddocks A, Gassert F. World’s 36 Most Water-Stressed Countries—World Resources Insti-
tute [Internet]. 2013. Available from: http://www.wri.org/blog/2013/12/world%E2%80%99s-36-most-
water-stressed-countries. [cited 29 Dec 2017].
35. McKee TB, Doesken NJ, Kleist J, others. The relationship of drought frequency and duration to time
scales. Proceedings of the 8th Conference on Applied Climatology. American Meteorological Society
Boston, MA; 1993. pp. 179–183.
36. Lowe R, Stewart-Ibarra AM, Petrova D, Garcıa-Dıez M, Borbor-Cordova MJ, Mejıa R, et al. Climate ser-
vices for health: predicting the evolution of the 2016 dengue season in Machala, Ecuador. Lancet Planet
Health. 2017; 1: e142–e151. https://doi.org/10.1016/S2542-5196(17)30064-5 PMID: 29851600
37. Ryan SJ, Lippi CA, Carlson CJ, Stewart-Ibarra AM, Borbor-Cordova MJ, Romero M, et al. Zika Virus
Outbreak, Barbados, 2015–2016. Am J Trop Med Hyg. 2018; 98: 1587–1589.
38. Lowe R, Cazelles B, Paul R, Rodo X. Quantifying the added value of climate information in a spatio-tem-
poral dengue model. Stoch Environ Res Risk Assess. 2016; 30: 2067–2078.
39. Rue H, Martino S, Chopin N. Approximate Bayesian inference for latent Gaussian models by using inte-
grated nested Laplace approximations. J R Stat Soc Ser B Stat Methodol. 2009; 71: 319–392.
40. Held L, Schrodle B, avard Rue H. Posterior and cross-validatory predictive checks: a comparison of
MCMC and INLA. Statistical modelling and regression structures. Springer; 2010. pp. 91–110.
41. Gneiting T, Raftery AE. Strictly proper scoring rules, prediction, and estimation. J Am Stat Assoc. 2007;
102: 359–378.
42. Spiegelhalter DJ, Best NG, Carlin BP, Van Der Linde A. Bayesian measures of model complexity and
fit. J R Stat Soc Ser B Stat Methodol. 2002; 64: 583–639.
43. Kramer M. R2 statistics for mixed models. Proceedings of the Conference on Applied Statistics in Agri-
culture. 2005. pp. 148–160.
44. Gelman A, Meng X-L, Stern H. Posterior predictive assessment of model fitness via realized discrepan-
cies. Stat Sin. 1996; 733–760.
45. WHO. Field guide for malaria epidemic assessment and reporting [Internet]. World Health Organization;
2004. Available from: http://helid.digicollection.org/en/d/Js13421e/4.1.html. [cited 6 Feb 2018].
46. Lowe R, Coelho CA, Barcellos C, Carvalho MS, Catão RDC, Coelho GE, et al. Evaluating probabilistic
dengue risk forecasts from a prototype early warning system for Brazil. Elife. 2016; 5: e11285. https://
doi.org/10.7554/eLife.11285 PMID: 26910315
47. Jolliffe IT, Stephenson DB. Forecast verification: a practitioner’s guide in atmospheric science. John
Wiley & Sons; 2012.
48. Stewart Ibarra AM, Lowe R. Climate and non-climate drivers of dengue epidemics in southern coastal
Ecuador. Am J Trop Med Hyg. 2013; 88: 971–981. https://doi.org/10.4269/ajtmh.12-0478 PMID:
23478584
49. Chowell G, Torres CA, Munayco-Escate C, Suarez-Ognio L, Lopez-Cruz R, Hyman JM, et al. Spatial
and temporal dynamics of dengue fever in Peru: 1994–2006. Epidemiol Infect. 2008; 136: 1667–1677.
https://doi.org/10.1017/S0950268808000290 PMID: 18394264
50. Colon-Gonzalez FJ, Lake IR, Bentham G. Climate Variability and Dengue Fever in Warm and Humid
Mexico. Am J Trop Med Hyg. 2011; 84: 757–763. https://doi.org/10.4269/ajtmh.2011.10-0609 PMID:
21540386
51. Hurtado-Dıaz M, Riojas-Rodrıguez H, Rothenberg SJ, Gomez-Dantes H, Cifuentes E. Short communi-
cation: Impact of climate variability on the incidence of dengue in Mexico. Trop Med Int Health. 2007;
12: 1327–1337. https://doi.org/10.1111/j.1365-3156.2007.01930.x PMID: 17956543
52. Dıaz-Quijano FA, Waldman EA. Factors Associated with Dengue Mortality in Latin America and the
Caribbean, 1995–2009: An Ecological Study. Am J Trop Med Hyg. 2012; 86: 328–334. https://doi.org/
10.4269/ajtmh.2012.11-0074 PMID: 22302870
53. Hayden MH, Uejio CK, Walker K, Ramberg F, Moreno R, Rosales C, et al. Microclimate and Human
Factors in the Divergent Ecology of Aedes aegypti along the Arizona, US/Sonora, MX Border. Eco-
Health. 2010; 7: 64–77. https://doi.org/10.1007/s10393-010-0288-z PMID: 20232228
54. Cashman A, Nurse L, John C. Climate Change in the Caribbean: The Water Management Implications.
J Environ Dev. 2010; 19: 42–67. https://doi.org/10.1177/1070496509347088
55. CARPHA. State of Public Health in the Caribbean Region [Internet]. Caribbean Public Health Agency;
2013. Available from: http://carpha.org/downloads/CARPHA-State_of_Public_Health_Inaugural_
Report_2013.pdf. [cited 5 Feb 2018].
56. CARPHA, PAHO, CIMH. Caribbean Health-Climatic Bulletin [Internet]. 2017. Available from: http://rcc.
cimh.edu.bb/files/2018/01/Caribbean-Health-Climatic-Bulletin_product-sheet.pdf. [cited 11 Jan 2018].
Climate and dengue risk in Barbados
PLOS Medicine | https://doi.org/10.1371/journal.pmed.1002613 July 17, 2018 23 / 24

57. Krishnamurti TN, Chakraborty A, Krishnamurti R, Dewar WK, Clayson CA. Seasonal Prediction of Sea
Surface Temperature Anomalies Using a Suite of 13 Coupled Atmosphere–Ocean Models. J Clim.
2006; 19: 6069–6088. https://doi.org/10.1175/JCLI3938.1
58. Lowe R, Barcellos C, Coelho CA, Bailey TC, Coelho GE, Graham R, et al. Dengue outlook for the World
Cup in Brazil: an early warning model framework driven by real-time seasonal climate forecasts. Lancet
Infect Dis. 2014; 14: 619–626. https://doi.org/10.1016/S1473-3099(14)70781-9 PMID: 24841859
59. ArcGIS 10.3.1. Redlands, CA: Environmental Systems Research Institute (ESRI); 2016.
60. Global Administrative Areas (2015). GADM Database Glob. Adm. Areas Version 28 [Internet]. 2015.
Available from: https://gadm.org. [cited 27 Jun 2018].
Climate and dengue risk in Barbados
PLOS Medicine | https://doi.org/10.1371/journal.pmed.1002613 July 17, 2018 24 / 24