nonequilibrium structural dynamics of...
TRANSCRIPT
Nonequilibrium Structural Dynamics of Nanoparticles inLiNi1/2Mn3/2O4 Cathode under Operando ConditionsAndrej Singer,*,† Andrew Ulvestad,† Hyung-Man Cho,‡ Jong Woo Kim,† Jorg Maser,§ Ross Harder,§
Ying Shirley Meng,‡ and Oleg G. Shpyrko†
†Department of Physics, University of California-San Diego, La Jolla, California 92093-0319, United States‡Department of NanoEngineering, University of California-San Diego, La Jolla, California 92093-0448, United States§Advanced Photon Source, Argonne National Laboratory, Argonne, Illinois 60439, United States
*S Supporting Information
ABSTRACT: We study nonequilibrium structural dynamics inLiNi1/2Mn3/2O4 spinel cathode material during fast charge/dischargeunder operando conditions using coherent X-rays. Our in situmeasurements reveal a hysteretic behavior of the structure uponcycling and we directly observe the interplay between differenttransformation mechanisms: solid solution and two-phase reactions atthe single nanoparticle level. For high lithium concentrations solidsolution is observed upon both charge and discharge. For low lithiumconcentration, we find concurrent solid solution and two-phasereactions upon charge, while a pure two-phase reaction is found upon discharge. A delithiation model based on an ionic blockadelayer on the particle surface is proposed to explain the distinct structural transformation mechanisms in nonequilibriumconditions. This study addresses the controversy of why two-phase materials show exemplary kinetics and opens new avenues tounderstand fundamental processes underlying charge transfer, which will be invaluable for developing the next generation batterymaterials.
KEYWORDS: Lithium ion batteries, operando, in situ, coherent X-rays, phase transformation, metastable solid solution
Lithium ion batteries are ubiquitous in a wide range oftechnologies, including cell phones, electric vehicles, and
sustainable energy systems,1−4 and battery performance isinherently connected to the capability of lithium ions toreversibly intercalate with the electrodes.5 Spinel materialsshow exemplary kinetics and are extremely appealingcandidates for cathodes in future commercial batteries due totheir specific energy, cost, availability, nontoxicity, and,importantly, high operating voltage.6−9 Ion kinetics aregoverned by various nanoscale processes, including microscopicstructural changes of the electrode.10,11 The particular spinel ofinterest, disordered LiNi1/2Mn3/2O4 (LNMO) is subject tomultiple, fundamentally different sources of structural dynamicsthroughout the battery cycle: a cathode−electrolyte interface(CEI) layer can form due to high operating voltages,12 straindue to inhomogeneous lithiation,13 and the structure is knownto coexist in two structural phases with different latticeparameters at particular lithium concentrations.14−16 Duringbattery cycling two-phase reactions compete with solidsolution, which is beneficial for high rates in battery materials.Phase separation is unwanted for several reasons, such as atypically slow nucleation of a new phase,17 diffusion limitedtransfer of lithium across the phase boundary,18,19 andcoherency strain in case of phase separation in individualparticles, which leads to defect formation and capacity fade.20,21
Two-phase reactions are expected to yield slow kinetics, yetmany high rate materials including LiFePO4 (LFP), Li4Ti5O12
(LTO), and LNMO experience phase separation during slow(dis)charge.14,15,21,22 Several novel lithiation mechanisms werepredicted to resolve this controversy, including dominocascade,23 nonequilibrium kinetics,17 and metastable solidsolution, where concurrent two-phase and solid solutionreactions occur.20,24−26 As such, the interplay between solidsolution and two-phase reactions is crucial for understandingthe performance of the two-phase type battery materials. Herewe report a direct observation of nonequilibrium structuraldynamics, including the existence of a metastable solid solution,in spinel LNMO material using in situ coherent X-raydiffraction under operando conditions. We find that duringcharge the solid solution dominates in the beginning of thedelithiation and even persists in the two-phase reaction regionat low lithium concentrations. Interestingly, during dischargethe cathode transforms via an extended two-phase reaction withno indication of solid solution, which occurs only after the two-phase reaction at very high lithium concentrations. Thedifferent transformation mechanisms indicate a remarkablehysteresis in the structural phase transformations.
Received: June 20, 2014Revised: August 11, 2014
Letter
pubs.acs.org/NanoLett
© XXXX American Chemical Society A dx.doi.org/10.1021/nl502332b | Nano Lett. XXXX, XXX, XXX−XXX
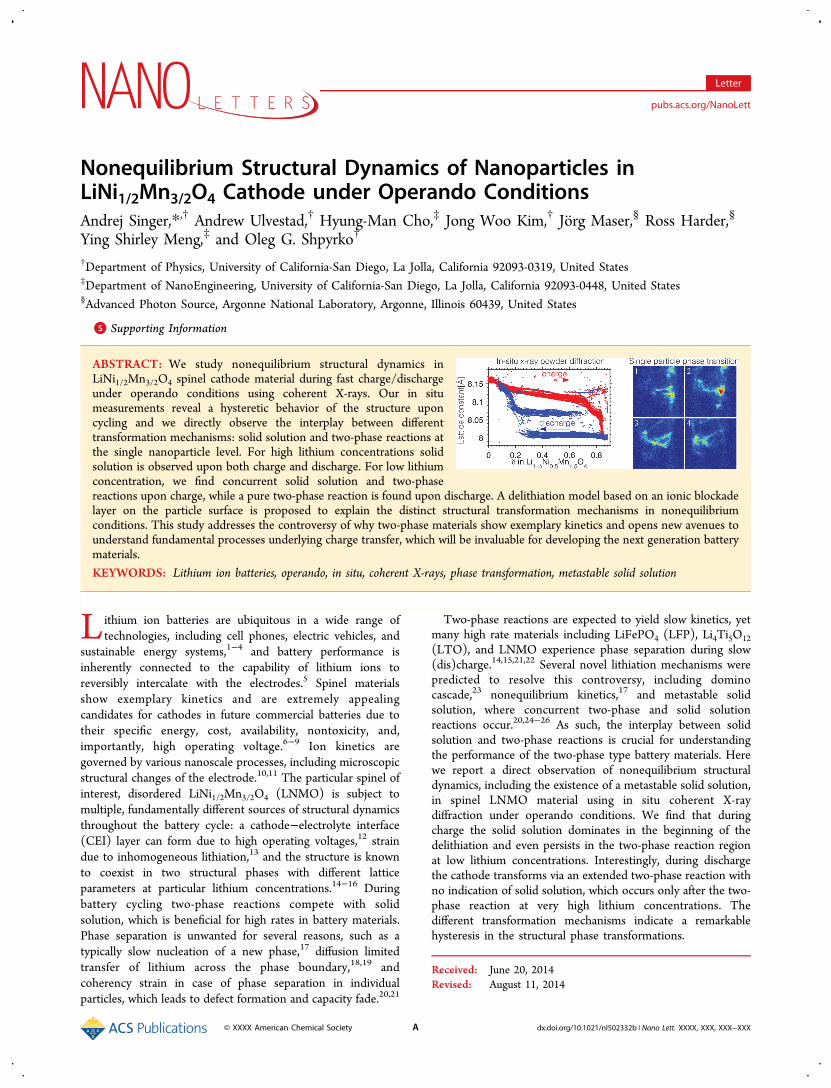
The experimental setup is shown in Figure 1. We acquired X-ray (9.0 keV photon energy) diffraction patterns in situ from anLNMO coin cell battery under operando conditions by acharge-coupled device (CCD) positioned at a distance of 0.5 mdownstream of the sample. To transmit X-rays the coin cellcasting had a 5 mm opening, which was sealed with a kaptonfilm on both sides and did not mitigate the electrochemicalperformance. The sample was prepared with a disorderedstructure using the sol−gel method, similar to ref 8. Thedetector was shifted to a 2θ angle of 16.5° to record the (111)Bragg peak of the cathode, which contains randomly orientedindividual nanoparticles. The incident beam size (200 × 200μm defined by slits) and scattering geometry were chosen toobserve 10−100 Bragg reflections from single nanoparticles onthe detector. The crystallographic structure throughout cyclingremains cubic (see Supporting Information Figure S1) thus theposition of a single Bragg peak is sufficient to track thestructural changes of the material.A typical measured diffraction pattern is shown in Figure 1a,
where several distinct Bragg reflections are observed along theDebye−Scherrer ring.27 In the magnified image (see Figure 1b,center) interference fringes around the brightest spot indicatethat indeed reflection from a single nanoparticle isrecorded.28,29 An analysis of the fringe period (see inset inFigure 1b) yields a particle size of 800 nm and concords wellwith observations from scanning electron microscopy (SEM)(see Supporting Information Figure S2). Some spots on thedetector appear to be scattering from nanoparticles being not inthe perfect Bragg condition (see arrows in Figure 1b).Diffraction patterns (about 600 in total) similar to those
shown in Figure 1a,b were recorded, while the battery wascycled (see Supporting Information movie). Each image wascollected in about 100 s and the maximum intensity betweenthe strongest and weakest peaks in each image varies over morethan 2 orders of magnitude. During charge and dischargevarious intriguing phenomena were observed, includingcontinuous shifts and splitting of the Bragg peak. The formerindicates a solid solution reaction with continuous change ofthe lattice parameter whereas the latter reveals a two-phasereaction, which is often considered as an emergent property ofa many particle electrode.30 Three images of the distinct phasesare presented in Figure 1c.
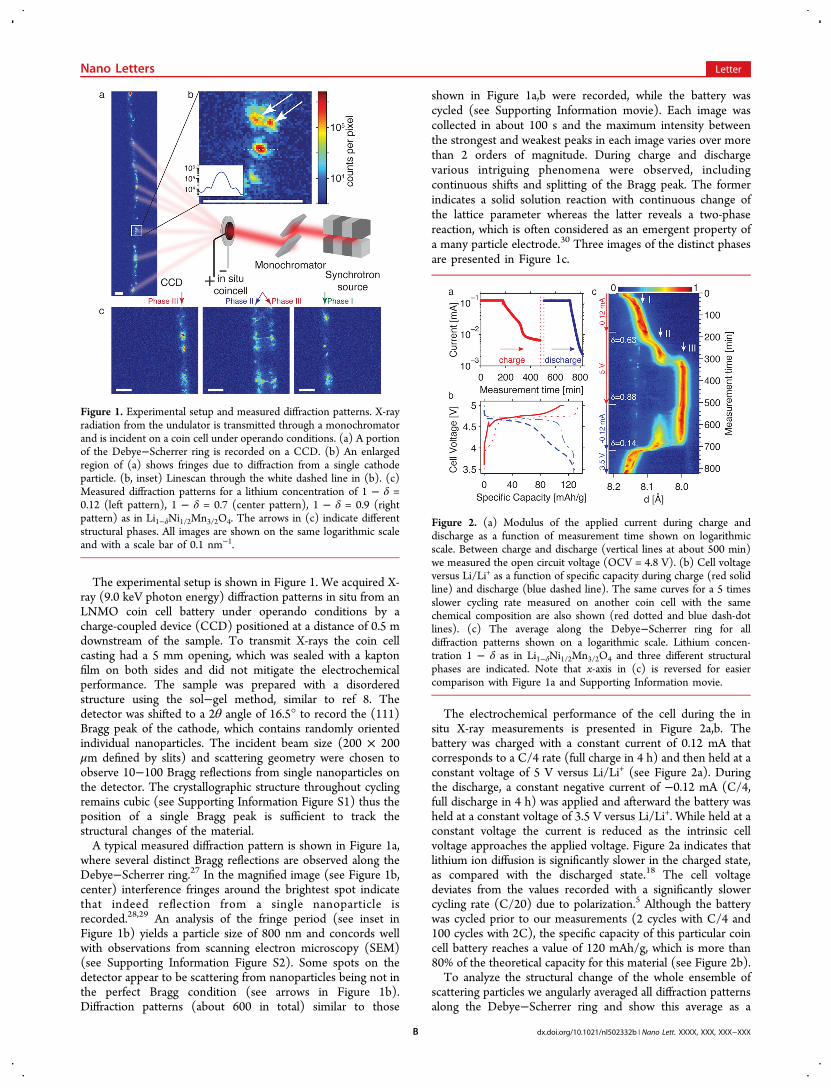
The electrochemical performance of the cell during the insitu X-ray measurements is presented in Figure 2a,b. Thebattery was charged with a constant current of 0.12 mA thatcorresponds to a C/4 rate (full charge in 4 h) and then held at aconstant voltage of 5 V versus Li/Li+ (see Figure 2a). Duringthe discharge, a constant negative current of −0.12 mA (C/4,full discharge in 4 h) was applied and afterward the battery washeld at a constant voltage of 3.5 V versus Li/Li+. While held at aconstant voltage the current is reduced as the intrinsic cellvoltage approaches the applied voltage. Figure 2a indicates thatlithium ion diffusion is significantly slower in the charged state,as compared with the discharged state.18 The cell voltagedeviates from the values recorded with a significantly slowercycling rate (C/20) due to polarization.5 Although the batterywas cycled prior to our measurements (2 cycles with C/4 and100 cycles with 2C), the specific capacity of this particular coincell battery reaches a value of 120 mAh/g, which is more than80% of the theoretical capacity for this material (see Figure 2b).To analyze the structural change of the whole ensemble of
scattering particles we angularly averaged all diffraction patternsalong the Debye−Scherrer ring and show this average as a
Figure 1. Experimental setup and measured diffraction patterns. X-rayradiation from the undulator is transmitted through a monochromatorand is incident on a coin cell under operando conditions. (a) A portionof the Debye−Scherrer ring is recorded on a CCD. (b) An enlargedregion of (a) shows fringes due to diffraction from a single cathodeparticle. (b, inset) Linescan through the white dashed line in (b). (c)Measured diffraction patterns for a lithium concentration of 1 − δ =0.12 (left pattern), 1 − δ = 0.7 (center pattern), 1 − δ = 0.9 (rightpattern) as in Li1−δNi1/2Mn3/2O4. The arrows in (c) indicate differentstructural phases. All images are shown on the same logarithmic scaleand with a scale bar of 0.1 nm−1.
Figure 2. (a) Modulus of the applied current during charge anddischarge as a function of measurement time shown on logarithmicscale. Between charge and discharge (vertical lines at about 500 min)we measured the open circuit voltage (OCV = 4.8 V). (b) Cell voltageversus Li/Li+ as a function of specific capacity during charge (red solidline) and discharge (blue dashed line). The same curves for a 5 timesslower cycling rate measured on another coin cell with the samechemical composition are also shown (red dotted and blue dash-dotlines). (c) The average along the Debye−Scherrer ring for alldiffraction patterns shown on a logarithmic scale. Lithium concen-tration 1 − δ as in Li1−δNi1/2Mn3/2O4 and three different structuralphases are indicated. Note that x-axis in (c) is reversed for easiercomparison with Figure 1a and Supporting Information movie.
Nano Letters Letter
dx.doi.org/10.1021/nl502332b | Nano Lett. XXXX, XXX, XXX−XXXB
function of measurement time in Figure 2c. As expected fromex situ measurements14,15 (see also Supporting InformationFigure S1) and theoretical calculations,16 three structural phasesare observed, which confirms that the spinel structure isdisordered. These phases have a lattice parameter of 8.1 to 8.15,8.08, and 8.0 Å and will be referred to as phase I, phase II, andphase III, respectively (see Figure 2c). Transitions betweenthese phases are usually interpreted as reordering of the crystalstructure due to Mn3+/Mn4+, Ni2+/Ni3+, and Ni3+/Ni4+ redoxreactions.16,19
During charge the lattice starts in phase I and shrinks due toextraction of lithium. It changes linearly with time in the first200 min, indicating a solid solution reaction. The latticeconstant decreases rapidly to phase II after 200 min. The Braggpeak splits after about 300 min, which marks the transition tophase III with simultaneous presence of two structural phases.Note that there is a drop in current and the slope of the curvein Figure 2a changes after 300 min, which indicates an increasein resistance of the material during its transition to phase IIIwith a significantly slower ion diffusion.18
A reverse reaction is observed during discharge. The latticeexpands and an extended two-phase reaction between phase IIIand phase II dominates for most of the discharge. Just after thecompletion of this phase transformation the structure abruptlyjumps to phase I. Finally, a solid solution is observed for highlithiation.Interestingly, the average in Figure 2c is not smooth but
shows bright spots, which represent Bragg scattering fromnanoparticles that perfectly satisfy the Bragg condition. Theslightly different angles of these Bragg spots indicate somediversity in the behavior of nanoparticles, in particular duringthe solid solution transformation that occurs at high lithiumconcentrations. Different nanoparticles appear to have slightlydifferent lattice parameters for the same charge state (0−200and 700−800 min). Fluctuations in the Bragg peak intensitywith time suggest that some particles change orientation during(dis)charge. A typical width of the Bragg reflection is about0.02° and from the intensity fluctuations of these reflections intime we estimate that some nanoparticles can rotate slightlywith a speed of less than 0.02° over a period of 10 min. Notethat the rotation is significantly suppressed close to the fullycharged state between 350 to 450 min, where the appliedcurrent is small (on the order of 0.01 mA). This indicates thatparticle movement is driven by charge transport. For highlycharged states (200−700 min), we also observe a small fractionof reflections that correspond to the discharged state (seeFigure 2c at d = 8.13 A) and appear to be disconnected fromthe charge transport. It is worth mentioning that the structurediversity among different nanoparticles and particle rotationcannot be captured in conventional XRD experiments thataverage over a much larger number of particles and yield asmoother distribution.The most striking observation is the phase transformation
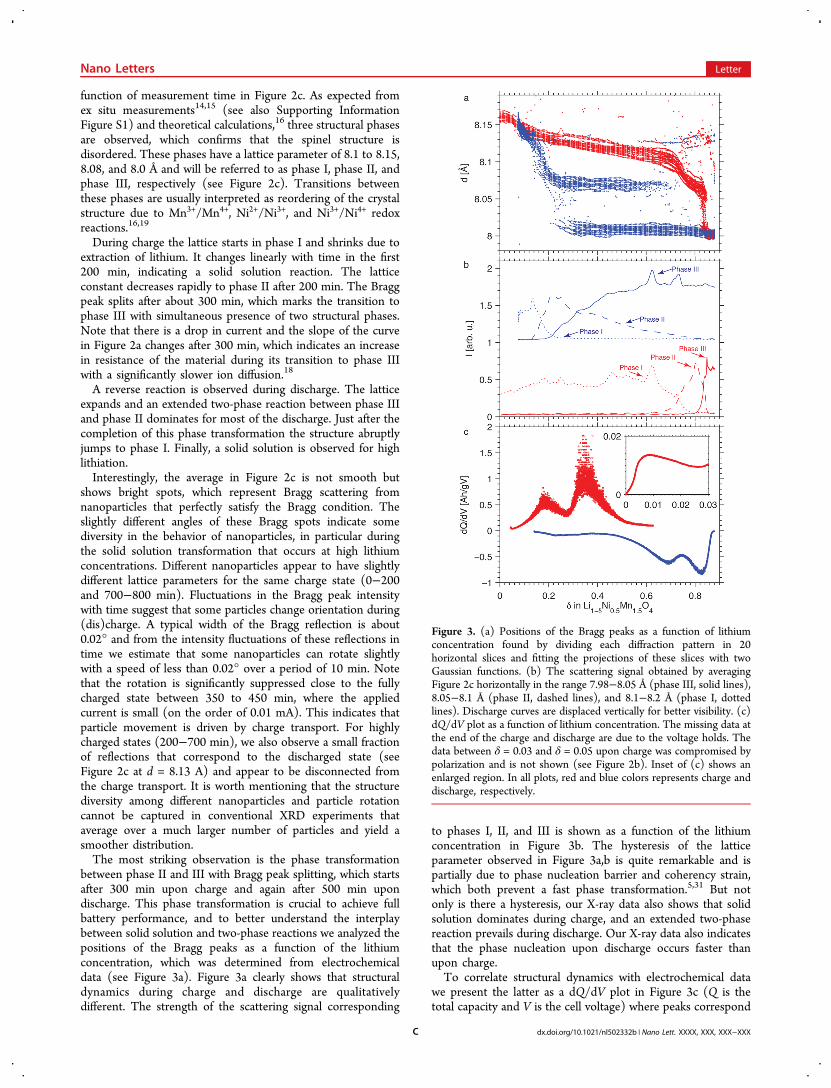
between phase II and III with Bragg peak splitting, which startsafter 300 min upon charge and again after 500 min upondischarge. This phase transformation is crucial to achieve fullbattery performance, and to better understand the interplaybetween solid solution and two-phase reactions we analyzed thepositions of the Bragg peaks as a function of the lithiumconcentration, which was determined from electrochemicaldata (see Figure 3a). Figure 3a clearly shows that structuraldynamics during charge and discharge are qualitativelydifferent. The strength of the scattering signal corresponding
to phases I, II, and III is shown as a function of the lithiumconcentration in Figure 3b. The hysteresis of the latticeparameter observed in Figure 3a,b is quite remarkable and ispartially due to phase nucleation barrier and coherency strain,which both prevent a fast phase transformation.5,31 But notonly is there a hysteresis, our X-ray data also shows that solidsolution dominates during charge, and an extended two-phasereaction prevails during discharge. Our X-ray data also indicatesthat the phase nucleation upon discharge occurs faster thanupon charge.To correlate structural dynamics with electrochemical data
we present the latter as a dQ/dV plot in Figure 3c (Q is thetotal capacity and V is the cell voltage) where peaks correspond
Figure 3. (a) Positions of the Bragg peaks as a function of lithiumconcentration found by dividing each diffraction pattern in 20horizontal slices and fitting the projections of these slices with twoGaussian functions. (b) The scattering signal obtained by averagingFigure 2c horizontally in the range 7.98−8.05 Å (phase III, solid lines),8.05−8.1 Å (phase II, dashed lines), and 8.1−8.2 Å (phase I, dottedlines). Discharge curves are displaced vertically for better visibility. (c)dQ/dV plot as a function of lithium concentration. The missing data atthe end of the charge and discharge are due to the voltage holds. Thedata between δ = 0.03 and δ = 0.05 upon charge was compromised bypolarization and is not shown (see Figure 2b). Inset of (c) shows anenlarged region. In all plots, red and blue colors represents charge anddischarge, respectively.
Nano Letters Letter
dx.doi.org/10.1021/nl502332b | Nano Lett. XXXX, XXX, XXX−XXXC
to plateaus in the coin cell voltage and are indicative of two-phase transformation under equilibrium conditions.5 Acomparison between the X-ray data and the electrochemicaldata during charge is quite surprising (see Figure 3b−d).Although we clearly observe peaks in the dQ/dV plot at δ =0.01, δ = 0.2, and δ = 0.35, our X-ray data does not indicate anytwo-phase regions, which should reveal itself in Bragg peaksplitting. The phase transformation eventually happens, butmuch later during the constant voltage hold at δ = 0.84. Thematerial structurally appears to be in a solid solution regime,but electrochemistry suggests there is a two-phase reaction.Similar behavior has been observed in LFP using in situ X-raydiffraction data32−34 and electron microscopy,35 and weanticipate that this is a general phenomenon that occurs fortwo-phase materials during fast cycling. We also want to notethat similar effects were theoretically predicted in LFP.36
We attribute the discrepancy between X-ray and electro-chemical data to nonequilibrium structural dynamics due to thefast charge rate used in our experiment.17 A possibleexplanation for the observed behavior is the fact thatelectrochemistry is governed by the surface of the nano-particles, whereas X-ray diffraction is sensitive to their volume.Taking into account the smaller diffusion coefficient forcharged (delithiated) material, as concluded from Figure 2aand ref 18, a comparison between electrochemical and X-raydata indicates that during charge (lithium extraction) thesurface of the particle is actually delithiated, has a smaller latticeconstant, and acts as an ionic blockade for ions trapped in thenanoparticles (see Figure 4). This layer forms at a voltage ofabout 4.7 V. No indication of this layer is observed in the X-raydiffraction signal, thus we conclude that this charge transportblockade layer is thin, provided it is as crystalline as bulk. Thelayer could also be blocking the electron transport, however,different ion diffusion coefficients for different structural phasessuggest ionic blockade.During discharge there is a reasonable correspondence
between electrochemistry and X-ray diffraction of the nano-particles (see Figure 3b−d). The dQ/dV plot shows three peaksand a close look at the structural information captured with X-rays reveals that there is indeed an abrupt lattice constantchange, an appearance of an additional structural phase, and atransition to the third phase at δ = 0.83, δ = 0.7, and δ = 0.3,respectively. During discharge, the lattice transforms into amore diffusive material and there is no physical basis for anionic blockade (see Figure 4), thus the electrochemical and X-ray measurements agree. The significant different behaviorduring charge and discharge renders CEI as an unlikely sourceof the dominant charge transport blockade, because CEIequally persists upon charge and discharge and builds up withcycling.12
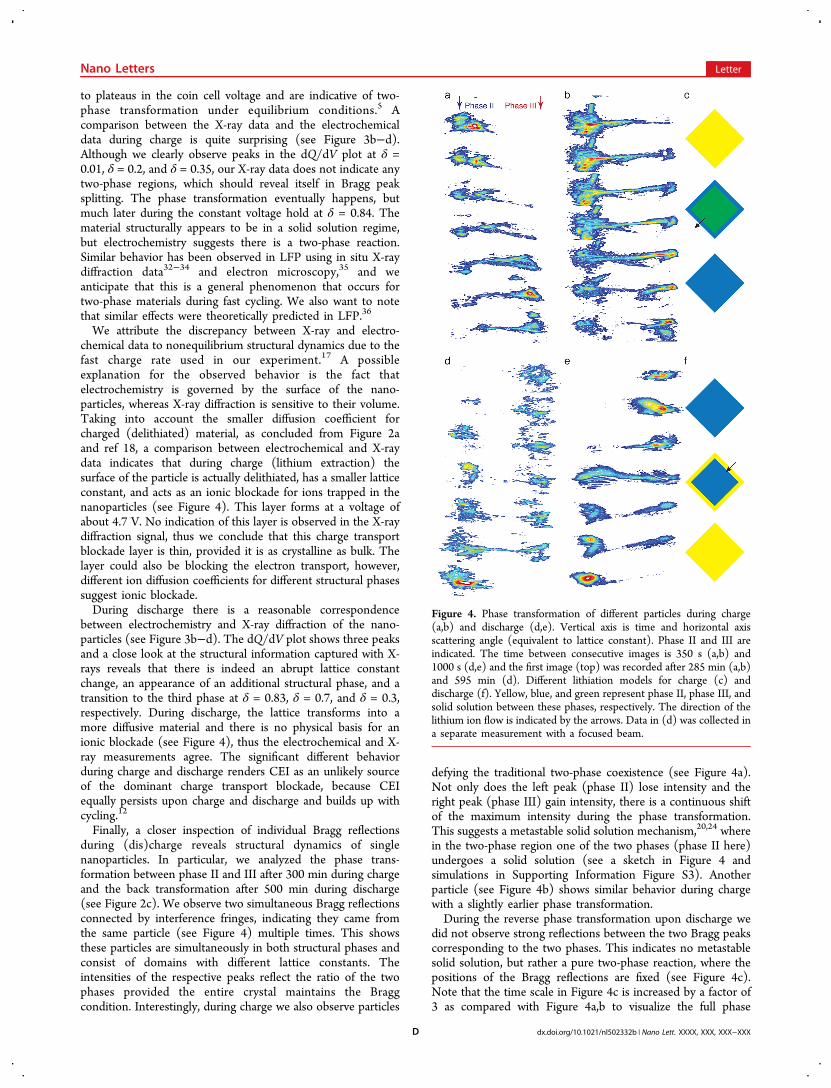
Finally, a closer inspection of individual Bragg reflectionsduring (dis)charge reveals structural dynamics of singlenanoparticles. In particular, we analyzed the phase trans-formation between phase II and III after 300 min during chargeand the back transformation after 500 min during discharge(see Figure 2c). We observe two simultaneous Bragg reflectionsconnected by interference fringes, indicating they came fromthe same particle (see Figure 4) multiple times. This showsthese particles are simultaneously in both structural phases andconsist of domains with different lattice constants. Theintensities of the respective peaks reflect the ratio of the twophases provided the entire crystal maintains the Braggcondition. Interestingly, during charge we also observe particles
defying the traditional two-phase coexistence (see Figure 4a).Not only does the left peak (phase II) lose intensity and theright peak (phase III) gain intensity, there is a continuous shiftof the maximum intensity during the phase transformation.This suggests a metastable solid solution mechanism,20,24 wherein the two-phase region one of the two phases (phase II here)undergoes a solid solution (see a sketch in Figure 4 andsimulations in Supporting Information Figure S3). Anotherparticle (see Figure 4b) shows similar behavior during chargewith a slightly earlier phase transformation.During the reverse phase transformation upon discharge we
did not observe strong reflections between the two Bragg peakscorresponding to the two phases. This indicates no metastablesolid solution, but rather a pure two-phase reaction, where thepositions of the Bragg reflections are fixed (see Figure 4c).Note that the time scale in Figure 4c is increased by a factor of3 as compared with Figure 4a,b to visualize the full phase
Figure 4. Phase transformation of different particles during charge(a,b) and discharge (d,e). Vertical axis is time and horizontal axisscattering angle (equivalent to lattice constant). Phase II and III areindicated. The time between consecutive images is 350 s (a,b) and1000 s (d,e) and the first image (top) was recorded after 285 min (a,b)and 595 min (d). Different lithiation models for charge (c) anddischarge (f). Yellow, blue, and green represent phase II, phase III, andsolid solution between these phases, respectively. The direction of thelithium ion flow is indicated by the arrows. Data in (d) was collected ina separate measurement with a focused beam.
Nano Letters Letter
dx.doi.org/10.1021/nl502332b | Nano Lett. XXXX, XXX, XXX−XXXD
transformation. To prove that we do observe phase trans-formation of single nanoparticles we performed additionalmeasurements. We focused the beam to a size of a singlenanoparticle (1 μm × 1 μm) and by scanning the sampleassured that a single nanoparticle produced diffraction on thedetector. We repeated the (dis)charge and before recordingeach diffraction pattern we carefully aligned the particle angle tomaximum Bragg intensity, trying to compensate for possibleparticle rotations (see Figure 4d). Figure 4d shows two phaseswith fixed positions of the Bragg peak, is similar to Figure 4c,and confirms a pure two-phase reaction during discharge onthis single nanoparticle. The same measurement was notpossible during charge, because the phase transformation isconsiderably faster and the two-phase region is very narrow.In summary, using coherent X-rays we were able to study
nonequilibrium structural dynamics under operando conditionsof a spinel structure lithium half cell. We mapped the structureon a single nanoparticle level and found that upon discharge thematerial shows an extended two-phase reaction, whereas duringcharge the cathode material mostly undergoes a solid solutionreaction. A comparison of the X-ray data with electrochemicaldata measured simultaneously on the same operando batterysuggests that during charge a thin ionic blockade layer isformed on the interface between cathode nanoparticles andelectrolyte. This layer prevents faster charging, and noindication for such a layer is found for discharge. We anticipatethat attempts to reduce the effect of the ionic blockade bydoping the surface of the nanoparticles may lead to improvedperformance of battery material during fast charging. Finally, weforesee that the experimental in situ method developed here isideally suited to study the interplay between solid solution andtwo-phase reactions for a large variety of next generationbattery materials, such as LNMO, LFP, and LTO. Weanticipate that it will ultimately open new avenues tounderstand fundamental processes underlying lithium ionkinetics and develop better battery materials.
■ ASSOCIATED CONTENT*S Supporting InformationA movie of all in situ measured X-ray data, ex situ laboratorysource X-ray diffraction data, scanning electron microscopy(SEM) images of the cathode material, and simulations of theBragg reflection dynamics during a metastable solid solutionreaction. This material is available free of charge via the Internetat http://pubs.acs.org.
■ AUTHOR INFORMATIONCorresponding Author*E-mail: [email protected] ContributionsA.S., A.U., Y.S.M., and O.G.S. conceived of the idea. H.M.C.and Y.S.M. prepared the samples. A.S., A.U., J.W.K., J.M., andR.H. performed the measurements. A.S. analyzed the data andwrote the paper. All authors participated in the interpretation ofthe data and revised the manuscript.NotesThe authors declare no competing financial interest.
■ ACKNOWLEDGMENTSThis work was supported by U.S. Department of Energy, Officeof Science, Office of Basic Energy Sciences, under Contract DE-SC0001805 and by the UCSD Chancellor’s Interdisciplinary
Award. H.M.C. and Y.S.M. acknowledge the financial supportby U.S. Department of Energy, Office of Basic Energy Sciences,under Award Number DE-SC0002357. O.S. and Y.S.M. aregrateful to the UCSD Chancellor’s Interdisciplinary Collabo-ratories Award that made this collaboration possible. The use ofthe Advanced Photon Source, an Office of Science User Facilityoperated for the U.S. Department of Energy (DOE) Office ofScience by Argonne National Laboratory, was supported by theU.S. DOE under Contract No. DE-AC02-06CH11357.
■ ABBREVIATIONS
LNMO: LiNi1/2Mn3/2O4; LFP: LiFePO4; LTO: Li4Ti5O12;CCD: charge coupled device; OCV: open circuit voltage; SEM:scanning electron microscopy
■ REFERENCES(1) Tarascon, J. M.; Armand, M. Nature 2001, 414, 359−367.(2) Arico, A. S.; Bruce, P.; Scrosati, B.; Tarascon, J.-M.; vanSchalkwijk, W. Nat. Mater. 2005, 4, 366−377.(3) Armand, M.; Tarascon, J.-M. Nature 2008, 451, 652−657.(4) Dunn, B.; Kamath, H.; Tarascon, J.-M. Science 2011, 334, 928−935.(5) Huggins, R. A. Advanced Batteries; Springer: New York, 2008; p474.(6) Deng, H.; Belharouak, I.; Cook, R. E.; Wu, H.; Sun, Y.-K.; Amine,K. J. Electrochem. Soc. 2010, 157, A447.(7) Yang, M.-C.; Xu, B.; Cheng, J.-H.; Pan, C.-J.; Hwang, B.-J.; Meng,Y. S. Chem. Mater. 2011, 23, 2832−2841.(8) Cho, H.-M.; Meng, Y. S. J. Electrochem. Soc. 2013, 160, A1482−A1488.(9) Carroll, K. J.; Yang, M.-C.; Veith, G. M.; Dudney, N. J.; Meng, Y.S. Electrochem. Solid-State Lett. 2012, 15, A72.(10) Balke, N.; Jesse, S.; Morozovska, A. N.; Eliseev, E.; Chung, D.W.; Kim, Y.; Adamczyk, L.; García, R. E.; Dudney, N.; Kalinin, S. V.Nat. Nanotechnol. 2010, 5, 749−754.(11) Zhu, J.; Lu, L.; Zeng, K. ACS Nano 2013, 7, 1666−1675.(12) Duncan, H.; Abu-Lebdeh, Y.; Davidson, I. J. J. Electrochem. Soc.2010, 157, A528.(13) Ulvestad, A.; Cho, H. M.; Harder, R.; Kim, J. W.; Dietze, S. H.;Fohtung, E.; Meng, Y. S.; Shpyrko, O. G. Appl. Phys. Lett. 2014, 104,073108.(14) Kim, J.-H.; Yoon, C. S.; Myung, S.-T.; Prakash, J.; Sun, Y.-K.Electrochem. Solid-State Lett. 2004, 7, A216−A220.(15) Kim, J.-H.; Myu, S.; Yoon, C. S.; Ka, S. G.; Su, Y.; Myung, S.-T.;Kang, S. G.; Sun, Y.-K. Chem. Mater. 2004, 16, 906−914.(16) Lee, E.; Persson, K. a. Energy Environ. Sci. 2012, 5, 6047−6051.(17) Malik, R.; Zhou, F.; Ceder, G. Nat. Mater. 2011, 10, 587−590.(18) Kunduraci, M.; Amatucci, G. G. Electrochim. Acta 2008, 53,4193−4199.(19) Yang, M.-C.; Xu, B.; Cheng, J.-H.; Pan, C.-J.; Hwang, B.-J.;Meng, Y. S. Chem. Mater. 2011, 23, 2832−2841.(20) Padhi, A. K. J. Electrochem. Soc. 1997, 144, 1188−1194.(21) Cogswell, D. A.; Bazant, M. Z. ACS Nano 2012, 6, 2215−2225.(22) Chen, G.; Song, X.; Richardson, T. J. Electrochem. Solid-StateLett. 2006, 9, A295.(23) Delmas, C.; Maccario, M.; Croguennec, L.; Le Cras, F.; Weill, F.Nat. Mater. 2008, 7, 665−671.(24) Sharma, N.; Guo, X.; Du, G.; Guo, Z.; Wang, J.; Wang, Z.;Peterson, V. K. J. Am. Chem. Soc. 2012, 134, 7867−7873.(25) Holtz, M. E.; Yu, Y.; Gunceler, D.; Gao, J.; Sundararaman, R.;Schwarz, K. A.; Arias, T. A.; Abruna, H. D.; Muller, D. A. Nano Lett.2014, 14, 1453−1459.(26) Bai, P.; Cogswell, D. A.; Bazant, M. Z. Nano Lett. 2011, 11,4890−4896.(27) Warren, B. E. X-ray Diffraction; Courier Dover Publications:New York, 1969; p 381.
Nano Letters Letter
dx.doi.org/10.1021/nl502332b | Nano Lett. XXXX, XXX, XXX−XXXE
(28) Pfeifer, M. A.; Williams, G. J.; Vartanyants, I. A.; Harder, R.;Robinson, I. K. Nature 2006, 442, 63−66.(29) Vartanyants, I. A.; Robinson, I. K. J. Phys.: Condens. Matter 2001,13, 10593.(30) Dreyer, W.; Jamnik, J.; Guhlke, C.; Huth, R.; Moskon, J.;Gaberscek, M. Nat. Mater. 2010, 9, 448−453.(31) Cahn, J. W. Acta Metall. 1961, 9, 795−801.(32) Chang, H.-H.; Chang, C.-C.; Wu, H.-C.; Yang, M.-H.; Sheu, H.-S.; Wu, N.-L. Electrochem. Commun. 2008, 10, 335−339.(33) Shin, H. C.; Chung, K. Y.; Min, W. S.; Byun, D. J.; Jang, H.;Cho, B. W. Electrochem. Commun. 2008, 10, 536−540.(34) Liu, H.; Strobridge, F. C.; Borkiewicz, O. J.; Wiaderek, K. M.;Chapman, K. W.; Chupas, P. J.; Grey, C. P. Science 2014, 344,1252817.(35) Niu, J.; Kushima, A.; Qian, X.; Qi, L.; Xiang, K.; Chiang, Y.-M.;Li, J. Nano Lett. 2014, 14, 4005−4010.(36) Cogswell, D. A.; Bazant, M. Z. Nano Lett. 2013, 13, 3036−3041.
Nano Letters Letter
dx.doi.org/10.1021/nl502332b | Nano Lett. XXXX, XXX, XXX−XXXF