nonbanks and lending standards in mortgage markets. the ... · pdf filewhalen, paul willen and...
TRANSCRIPT

Nonbanks and Lending Standards in Mortgage Markets.
The Spillovers from Liquidity Regulation.∗
Pedro Gete† and Michael Reher‡
This Draft: July 2017
Abstract
We show that the 2014 U.S. liquidity coverage ratio (LCR), which gave the maximum
liquidity weights to mortgage-backed securities backed by Ginnie Mae (GNMA), has led to
a higher FHA market share for nonbanks. The mechanism is a general equilibrium effect:
the LCR policy created a premium for GNMA-backed MBS relative to GSE-backed MBS.
This premium attracted nonbanks and originate-to-sell lenders towards GNMA MBS. It
also led to increased supply of credit for risky borrowers. LCR explains 26% of nonbanks
rise from 2013-2015.
Keywords: Lending Standards, LCR, Liquidity, Mortgages, Nonbanks, FHA, GSEs,
MBS.
JEL Classification: G12, G18, G21, G23, E32, E44.
∗We appreciate the comments of George Akerlof, Elliot Anenberg, Jennie Bai, Morris Davis, BehzadDiba, David Echeverry, Jesus Fernandez-Villaverde, Lynn Fisher, Douglas Gale, Carlos Garriga, LeiGe, Adam Guren, Samuel Hanson, Stefan Jacewitz, Robert Kurtzman, Mark Kutzbach, Steven Laufer,Sylvain Leduc, Tim McQuade, Kurt Mitman, Charles Nathanson, Wayne Passmore, Jon Pogach,William Reeder, Steve Ross, Lynn Shibut, JeffTraczynski, NancyWallace, SusanWachter, ChristopherWhalen, Paul Willen and the participants at the FDIC, 2017 HULM St. Louis Fed, 2017 AREUEA-National and 2017 Summer Macro-Finance Becker-Friedman Institute.†Georgetown University, GCER and IE Business School. Email: [email protected]‡Harvard University. Email: [email protected]
1

1 Introduction
There is a growing consensus that non-depository institutions ("nonbanks" for short)
played an important role in the last financial crisis.1 For example, Demyanyk and Loutskina
(2016) and Huszar and Yu (2017) show that their activities contributed to a deterioration of
lending standards in mortgage markets. Most of the nonbanks active pre-financial crisis, unable
to access the lending of last resort facilities of the Fed, either defaulted or were restructured
post-2008.
Nonbanks currently play a larger role in U.S. mortgage markets than before the crisis, as we
document in Section 2. For example, they originate around 80% of FHA-insured loans and more
than 50% of all mortgage loans. This fact worries some economists and policymakers (Pinto
and Oliner 2015, Wallace 2016, Wall Street Journal 2017). Moreover, given that nonbanks
usually hold little capital, in the next recession the FHA will likely be unable to recover from
nonbanks any losses on the loans that they are originating.2
The previous facts motivate several important questions: why are nonbanks gaining market
share in U.S. mortgage markets? Why especially among FHA loans? What are the consequences
in terms of lending standards or risk taking? Buchak et al. (2017) show that shadow banks
are significantly more likely to enter markets where traditional banks faced more regulatory
constraints. In this paper, we propose an alternative and complementary explanation for the
raise in nonbanks. The general equilibrium effects triggered by the U.S. Liquidity Coverage
Ratio (LCR) requirements can account for around 26% of the growth in nonbanks in FHA from
2013 to 2015. Moreover, this policy induced higher risk taking in the form of high loan-to-
income loans and lower denial rates for minorities (this variable is very correlated with lower
FICO scores, Bhutta and Ringo 2016).
The Liquidity Coverage Ratio is likely the most important policy response to the runs that
destabilized the financial system during the 2008 financial crisis (Diamond and Kashyap 2016
discuss the rationale for the LCR). The LCR rule requires suffi ciently large financial institutions
to hold enough high quality liquid assets to cover cash outflows over a 30-day stress period
(Basel Committee on Bank Supervision 2013). The rule gave preferential liquidity weights to
mortgage-backed securities backed by Ginnie Mae (GNMA), relative to those backed by Fannie
Mae (FNMA) or Freddie Mac (FHLMC).3 That is, the liquidity weight for GNMA-backed MBS
1To keep the language simple, we refer to depository institutions as "banks" and non-depository institu-tions as "nonbanks", although, strictly speaking, there are lenders, such as credit unions, which are nonbankdepository institutions. However, such cases comprise less than 5% of our data.
2FHA mortgagors usually have higher default rates over the business cycle (Frame, Gerardi and Tracy 2016).3GNMAwere considered Level 1 assets with government guarantee while FNMA and FHLMC were considered
2

is 1, compared to 0.85 for GSE-backed MBS. By law, only loans insured by the U.S. government
(FHA, Veterans Affairs, Rural Development and Public and Indian Housing) can be securitized
into a GNMA-backed product. The LCR requirements were announced in October 2013 and
finalized in September 2014.
The theory that we test is as follows: 1) The LCR rule has increased demand from the
institutions affected by the rule (and from other institutions potentially affected) for GNMA-
MBS. This caused higher prices and market liquidity; 2) Higher prices have increased the
collateral properties of MBS. That is, it is cheaper to borrow in repo markets (or from a
warehouse line of credit) using the MBS as collateral because this collateral is more valuable;
3) Some mortgage lenders are more exposed to MBS than others. For example, nonbanks, which
cannot fund their loans with deposits, rely on repo borrowings and warehouse lines of credit
that are repaid once the loan is securitized and sold as a MBS (Echeverry, Stanton and Wallace
2016). For these lenders, the effective origination costs depend on how cheap is to obtain repo-
funding against the MBS and how easy is to sell the MBS in the secondary market. Thus,
for lenders which heavily rely on securitization, LCR rules have decreased origination costs; 3)
Lower origination costs subsequently attracted lenders more prone to securitize (nonbanks) to
FHA, raised issuance of GNMA-backed MBS, and led to more relaxed lending standards among
FHA loans.
First, we provide evidence that LCR policies increased GNMA-MBS prices relative to GSE-
backed MBS. A variety of price measures, including option-adjusted spread (OAS), suggest that
LCR policies have increased relative prices in favor of GNMA-backed MBS.4 For example, we
find that the announcement of the LCR policy in October 2013 raised the OAS-based premium
by 10% relative to the GSEs.
Second, our main identification strategy exploits pre-LCR cross-sectional differences across
lenders in their funding sources. Nonbanks are more exposed than banks to securitization be-
cause they do not collect deposits. A parallel trends analysis and multiple placebo tests provide
support for our identification. To confirm that securitization is the key mechanism we show
that borrowers applying to a lender which relies heavily on securitization are less likely to be
denied in the post-LCR period.
Using data sources that are publicly available and easy to replicate, we show that, after
the LCR finalization, borrowers who apply to a nonbank are less likely to be denied than
Level 2 assets.4The OAS is equal to a weighted average of future expected returns after hedging for interest rate risk. A
positive OAS compensates investors for additional sources of risk like shifts in prepayments that are not drivenby interest rates alone, and factors such as liquidity (Boyarchenko, Fuster, and Lucca 2015).
3

when applying to a depository institution. This holds conditional on the borrower’s quality,
and multiple fixed effects. The effects are stronger for black and Hispanic borrowers, which
are variables highly correlated with low credit scores, and for borrowers with higher loan-to-
income ratios. Moreover, it appears that LCR contributed to the increase in the share of FHA
mortgages because it encouraged lenders to substitute from conventional loans to FHA-insured
loans.
In terms of market share, nonbanks would have comprised 74.5% of FHA originations in
2015 as opposed to their actual share of 77.1%. Put differently, nonbank market share grew 9.9
percentage points from 2013 to 2015, but their share would have grown 2.6 percentage points
less, or 26% less, in the absence of the LCR policy.
Thus, our paper shows that regulations to prevent runs in secondary mortgage markets
seem to have increased the credit risk borne by U.S. taxpayers. LCR policy has caused general
equilibrium effects in MBS markets that contributed to the expansion of nonbanks in FHA and
to more relaxed lending standards among FHA-insured loans.
To our knowledge, this is the first paper that studies liquidity regulations as a driver of
the composition of mortgage lenders and their lending standards. The paper contributes to a
growing literature that studies the effects of post-2008 regulations in mortgage markets. For
example, Buchak et al. (2017) discussed above. Ambrose, Conklin and Yoshida (2016) suggest
that regulatory changes that have essentially eliminated low-doc loans would result in credit
rationing against self-employed borrowers. Bhutta and Ringo (2016) show that lowering the
FHA mortgage insurance premiums in 2015 increased the number of loans to lower credit score
and high LTV borrowers. Di Maggio, Kermani, and Korgaonkar (2015) show that relaxed state
regulations for OCC regulated banks are associated with lower lending standards for both OCC
and non-OCC regulated banks. Fuster, Lo and Willen (2017) find evidence of higher regulatory
costs and risks over 2008-2014. Gete and Reher (2017) show that a credit contraction associated
with Dodd-Frank caused higher housing rents.
The theory that we test is related to Echeverry, Stanton and Wallace (2016). They develop
a model of mortgage origination funded by warehouse lines of credit and show that securitiza-
tion hazards are priced in MBS. We also confirm Bech and Keister (2015) and Keister (2017)
prediction that LCR will create regulatory premiums. Keister (2017) studies interbank loans
with maturity above 30-days that improve the LCR positon of the borrowing bank and the
implications for the monetary transmission mechanism.
Our focus on LCR policies connects with a growing literature that analyzes the effects of
liquidity in MBS markets on credit supply. For example, Cornett et al. (2011) show that during
4

the financial crisis of 2007—2009 banks that relied more heavily on core deposit and equity capital
financing contracted credit less than other banks. Dagher and Kazimov (2015) find that banks
that were more reliant on wholesale funding curtailed their credit significantly more than retail-
funded banks during the financial crisis. Loutskina (2011) shows that securitization increased
banks’ability to lend. Keys et al. (2010) show that securitization caused less screening effort
by originators of sub-prime mortgages.
This paper also connects with papers that exploit cross-sectional variation to analyze the
effect of the Federal Reserve’s large-scale MBS purchases after the financial crisis. For example,
Di Maggio, Kermani and Palmer (2016), Chakraborty, Goldstein and MacKinlay (2016), Dar-
mouni and Rodnyanski (2016) and Kurtzman, Luck and Zimmermann (2017) find a positive
impact on mortgage lending. Fieldhouse, Mertens and Ravn (2017) uncover a positive effect
on mortgage originations from MBS purchases by the GSEs.
The rest of the paper is organized as follows. Section 2 documents recent dynamics of
nonbanks in mortgage markets. Section 3 discusses the changes in MBS prices induced by the
LCR policies. Section 4 contains our core analysis of the cross-sectional impact of the LCR rule.
We check the robustness of the results in Section 5. Section 6 contains an aggregate analysis.
Section 7 concludes. The online appendix has supplementary results.
2 Nonbanks in Mortgage Markets
Since all depository institutions are subject to a federal supervisor, we use the HMDA codes
and identify nonbanks as lenders without a federal supervisor (that is, lenders not under the
regulatory oversight of OCC, FRS, FDIC, NCUA, or OTS). Demyanyk and Loutskina (2016)
and Huszar and Yu (2017) follow the same criteria. We cross-checked that our sample, which
covers all originators, is consistent with Buchak et al. (2017), which manually define nonbanks
as non-depository institution and focus on the largest lenders (50% of total originations). Table
A1 in the online appendix provides a list of the top 50 nonbanks in our data based on their
FHA originations in 2013 and 2014.
Figure 1 shows that nonbanks’for-purchase mortgage origination share has increased dra-
matically since the financial crisis. In the top panel, we see that nonbanks historically comprised
around 50% of the FHA market. Their share grew during the crisis, fell around 2010, and has
seen sustained rapid growth since then. The bottom panel shows how nonbanks historically
held a smaller share of the overall mortgage market, although their share grew markedly during
the boom period. Since the crisis their share has grown and now they comprise over half of all
5

for-purchase mortgage originations.
Consistent with the theory that we test below, Figure 2 documents that FHA loans saw an
increase in securitization around the date when the LCR rules were proposed (October 24th,
2013), an effect not seen among either conventional or jumbo loans.
To support the rest of the paper, Online Appendix Figure A5 contains a parallel trend
analysis. It shows that pre-LCR the denial rates followed similar trends for banks and nonbanks.
However, after the LCR policy the denial rates decreased faster for nonbanks.
3 Theory and General Equilibrium Effects
Our story is a general equilibrium one, that is, it operates indirectly. First, Online Appen-
dix Figure A1 shows the direct effect of LCR, that is, it plots the portfolio holdings of banks
affected by the LCR rule. Affected banks substantially increased the amount of GNMA MBS
on their balance sheets.
Second, we document the changes in MBS prices that are the key for general equilibrium.
Our analysis relies on multiple data sources, including the option-adjusted spread computed by
Bloomberg and S&P, ETFs that target exposure to GNMA and GSE MBS, and security-level
prices in the TBA market from FINRA’s TRACE database. We use these various data sources
to provide visual evidence that the behavior of GNMA and GSE MBS changed around the LCR
proposal date in October 2014, and, in particular, led to a higher premium for GNMA MBS.
We first consider the option-adjusted spread (OAS) of GNMA and GSE MBS, based on
Bloomberg’s GNMA, FNMA, and FHLMC MBS indices.5 The OAS is the spread between
the yield to maturity on a bond and the risk-free rate after accounting for the probability of
prepayment and default.6 Thus, the OAS strips out any hedgeable prepayment or default risk.7
In the top panel of Figure 3, we see that the LCR proposal saw a fall in the OAS of both GNMA
and GSE MBS, consistent with the preferable regulatory status given to both securities.
The bottom panel shows how the LCR announcement came with a greater relative fall in
GNMA’s OAS compared to the GSEs. This is consistent with the higher liquidity weight the
LCR proposal gave to GNMA MBS (weight = 1) over GSE MBS (weight = 0.85). Since the
5We define the GSE OAS the average of the OAS on the FNMA and FHLMC indices.6Boyarchenko, Fuster, and Lucca (2015), Gabaix, Krishnamurthy and Vigneron (2007) and Diep, Eisfeldt
and Richardson (2017) show that the risk of homeowner prepayment is priced in the MBS market.7While the OAS capture risks which can be hedged using a derivatives strategy (e.g. interest rate risk), it
does not capture risks for which there are no hedging instruments (e.g. government solvency risk).
6

OAS is model-dependent, we cross-check our results against Standard & Poor’s OAS in Figure
A2 of the online appendix, the results are similar.
Moving to a higher frequency, Figure 4 considers average weekly prices for iShares’GNMA
ETF and its MBB ETF, which tracks an index of predominantly GSE MBS (70%), but also
has some GNMA exposure (26%).8
The figure shows how both the GNMA and GSE-based ETFs had similar price dynamics
until the LCR rule was announced. Since then, the ETF tracking GNMA MBS traded at a
premium relative to that which primarily tracks GSE MBS. This is again consistent with the
favorable liquidity weights LCR gave to GNMA MBS.
In Figure A3 in the Online Appendix we provide extra support for the previous patterns.
Following Echeverry, Stanton, and Wallace (2016), we focus on the To-Be-Announced (TBA)
market.9 The TBA market characterizes MBS according to the issuer, maturity, coupon, price,
par amount, and settlement date. We consider the most-commonly traded bond in terms of
settlement date and coupon on a given day among single-family, 30-year fixed-rate mortgages.10
Figure A3 shows that the prices of GNMA, FNMA, and FHLMC MBS all increased following
the LCR proposal, but, in line with the previous evidence, the price of GNMA MBS increased
by more than the GSEs’.
Moreover, Figure A4 of the online appendix looks at the standard deviation of security-level
prices in the TBA market as a measure of market thickness and liquidity. This price volatility
declined especially for GNMA MBS after the LCR proposal, and it remained at this lower level
long after the announcement date.
In the online appendix, we describe a methodology to quantify the GNMA premium implied
by the various exercises of this section. Historically, GNMA MBS have always traded at higher
prices than GSE MBS because GNMA has the explicit government backing. Our analysis
suggests that LCR made both GNMA and GSE MBS more valuable. Moreover, LCR raised
the GNMA premium by 10% more than the GSEs’. In the next section, we estimate how these
secondary market effects of liquidity regulation spilled over to the primary market.
8There is not an iShares ETF which solely tracks FNMA or FHLMC MBS.9Data source is the TRACE database from FINRA. Because securities change from day to day, we smooth
the data by taking the monthly average MBS price in the TBA market.10See Vickery and Wright (2013) and Gao, Schultz and Song (2017) for a thorough discussion of the TBA
market.
7

4 Cross-Sectional Analysis
4.1 Data
For our core analysis, we merge HMDA data, which contain information on the borrower
and outcome of almost all mortgage applications in the U.S., with bank Call Reports. Table 1
contains summary statistics of our data.
Our core data consist of FHA loan applications for the purchase of an owner-occupied,
single-family dwelling. Moreover, we focus on lenders which received at least 10 applications in
each year, and which have a record in HMDA from 2011 through 2015.11 This gives a sample
of 396 lenders, 123 of which are non-depository institutions.
4.2 Nonbanks and LCR
We consider how higher demand for GNMAMBS may have impacted credit supply through
lenders’ incentives to lower denial rates on FHA loans. HMDA results on denial rates are
consistent with survey evidence from banks on lending standards (Driscoll, Kay and Vojtech
2016).
First, we estimate the following specification on the sample of FHA loan applications:
Yi,l,t = β(MGNMAt × Fl
)+ PostLCRt + δZl,m,t + γXi,t + αl + ui,l,t, (1)
where i, l, m and t denote borrowers, lenders, MSA and years, respectively, and PostLCRtindicates whether the LCR policy has been announced (t ≥ 2014). The outcomes Yi,l,t are
whether the application from borrower i to lender l in year t was denied. Below we also check
originations obtaining similar results.
Fl measures lender l’s exposure to securitization and MGNMAt measures the collateral and
liquidity of GNMA MBS. In theory, higher demand for GNMA MBS should have a greater
impact on the behavior of lenders which fund more of their mortgages through securitization.
We employ two measures of Fl. First, we use an indicator of whether lender l is a non-depository
institution (NDI). Second, we use the ratio of securitized loans to total originations in 2011 of
lender l.11We start in 2011 to have a balanced sample around the LCR dates. Moreover, we avoid the "structural
break" associated with Dodd-Frank in 2010 and discussed in Gete and Reher (2017).
8

We measure MGNMAt using: 1) an indicator of whether t ≥ 2014, since the LCR rule was
proposed in October 2013 and finalized in September 2014, with few changes to the proposed
rule; 2) the log OAS spread between GNMA and FNMA MBS studied in Table A2 of the online
appendix; 3) same than 2) but for FHLMC MBS.
The borrower controls in Xi,t are log income, the ratio of requested loan to income, and an
indicator of whether the borrower is black or Hispanic, which we call Minorityi,t. The lender
controls in Zl,m,t are MSA-lender fixed effects and, when considering banks, the lagged log of
total assets and the lagged ratios of net income to total assets, loss provisions to total assets,
and total equity to total assets.
We estimate (1) over the period 2012-2015. This choice of sample window ensures that
we do not confound reliance on securitization with regulatory arbitrage (e.g. Buchak et al
2017), since the major U.S. financial regulations had already been passed in 2010. In the online
appendix we re-perform our analysis on the narrowest possible window, 2013-2014, and find
similar results.
Table 2 contains the results for mortgage denials when Fl is an indicator of whether lender
l is a non-depository institution. Table 3 redoes the exercise when Fl equals the securitization
ratio. The two tables give the same result, which is consistent with our theory, and robust across
measures of MGNMAt . Lenders with more reliance on funding from securitization responded to
the higher value of GNMA MBS by denying fewer loans.
The coeffi cient of PostLCR×NDI from Table 2 suggests that, because of LCR rules, bor-
rowers who apply to a non-depository institution are around 1 percentage point less likely to
be denied. This holds conditional on the borrower’s quality, and joint lender-MSA effects.
It is also economically meaningful, given the average denial rate of 14%. The coeffi cient of
PostLCR× SecRate in Table 3 is -0.029 and it is significant at the 1% level. Given that one
standard deviation in the securitization rates is around 11%, then the estimated coeffi cient
suggests a 2.2% decrease relative to average denial rates (−0.029∗0.1050.136
).
One might wonder whether nonbanks and lenders more exposed to securitization increased
denial rates in conventional loans to compensate for their laxer standards in FHA loans. Table 4
considers this possibility by replicating our baseline analysis on the sample of conventional loans
(non-jumbo, non-FHA loans). The results suggest that, because LCR amplified the GNMA
premium relative to GSEs MBS, this encouraged lenders to substitute from conventional loans
to FHA-insured loans.
9
4.3 Risk Taking
Here we ask whether the post-LCR shift in origination behavior differed by borrower char-
acteristics that proxy for risk-taking. In Tables 5 and 6 we interact our measures of lender
l’s exposure to securitization with, respectively, an indicator of whether the applicant is black
or Hispanic, and with the borrower’s requested loan-to-income ratio. These loans are usually
associated with higher default rates.
The results suggest that LCR policies encouraged nonbanks and lenders more exposed to
securitization to relax their lending standards and increase their risk-taking in FHA loans.
From a welfare perspective this is not necessarily bad, and in Section 6.2 we will evaluate the
consequences for the homeownership rate.
5 Robustness of Identification
Our identification assumptions in Section 4 are those of a standard difference-in-difference
exercise: the LCR proposal, and subsequent increase in the relative value of GNMA MBS, did
not coincide with other shocks that would have affected the treatment group (lenders with less
funding liquidity) differently from the control group. In this section we consider reasons that
could violate that assumption, and we modify our specification accordingly. In all cases, we
are unable to find evidence that contradict the results from the previous section. Moreover, we
conduct several placebo tests.
5.1 Regulatory Arbitrage
First, as documented by Buchak et al. (2017), regulatory arbitrage has been a key driver
of nonbanks’increasing market share. Thus, a potential concern is that in Section 4 we cap-
ture differential costs of regulation across lenders rather than a response to regulation-induced
changes in MBS prices and liquidity. This is unlikely given our results on securitization-reliant
lenders in Table 3. However, Table A5 of the online appendix addresses this concern directly.
We make use of the fact that the major regulatory overhaul occurred in 2010 and 2011,
before the start of our sample.12 Thus, in Table A5 we re-estimate our baseline specification
over the narrow window 2013-2014.12Dodd-Frank was passed in 2010, implemented in 2011, and 2011 was the year when bank stress tests had
the greatest impact on real activity (Calem, Correa, and Lee 2016).
10
Table A5 shows that relative to the baseline counterpart, Table 2, the results for 2013-2014
convey a similar message: the LCR policy reduced nonbanks’propensity to deny a mortgage.
Columns two and three of Table A5, which are based on OAS spreads, confirm that this works
through the channel of secondary market liquidity. In terms of magnitude, the point estimates
are stronger, so that the baseline estimates from Table 2 may be interpreted as conservative.
5.2 Net Stable Funding Ratio
In this subsection we evaluate another potential concern with our identification. The Basel
III accords involved not only a Liquidity Coverage Ratio (LCR), but also a complementary
Net Stable Funding Ratio (NSFR). The NSFR aimed to ensure that banks "maintain suffi cient
levels of stable funding, thereby reducing liquidity risk in the banking system".13 However,
the NFSR was not proposed in the U.S. until May 2016, more than two years after the LCR
proposal. It is thus unlikely that the NSFR is affecting the results. Nonetheless, it is possible
that lenders updated their expectations following the LCR announcement, and that banks with
less funding liquidity subsequently aimed to shrink their balance sheets.
The previous logic contradicts Table A6 in the online appendix which uses banks’securitiza-
tion rates to capture their exposure to LCR. Specifically, Table A6 re-estimates the specification
of Table 3 using only banks and a rich set of bank balance sheet controls.
Consistent with the results from Section 4, Table A6 shows that banks with greater re-
liance on securitization denied fewer FHA applicants after LCR (first column) and when the
corresponding GNMA spread increased (second and third columns).
5.3 Changing Pool of FHA Applicants
Since our core analysis is at the application level, it takes as given the distribution of
borrower quality across different loan types. If FHA loan applicants are becoming less risky,
this alone would not generate our results. One would further need that lenders with more
exposure to GNMA MBS have some cost of adjusting to the new quality of FHA borrowers.
However, Figure A6 in the online appendix shows that our two measures of credit risk (requested
loan-to-income ratio and minority status) have steadily grown at about the same rate for both
FHA and non FHA applicants.
If anything, the top panel of Figure A6 suggests that FHA applicants have become slightly
13See the Federal Reserve’s press release on May 3, 2016.
11
riskier, in terms of LTI, relative to non FHA applicants. Thus, it does not seem that changes
in the pool of borrowers can drive the core results of Section 4.
5.4 Changing Pool of Nonbank Applicants
Similar to the previous concern, one might wonder whether the pool of applicants to
nonbanks is changing over time. If it is, then our estimates may reflect the improving quality
of applicants to nonbanks. However, Figure A7 in the online appendix provides evidence to the
contrary.
The top panel of Figure A7 shows how the gap in the loan-to-income ratio of applicants to
banks versus nonbanks has been remarkably stable over time. Turning to the bottom panel, the
fraction of applications from minorities to banks versus nonbanks have been on parallel trends,
at least through 2014. In 2015, the minority share of bank applicants fell relative to nonbanks.
If anything, this is consistent with a relative increase in the risk pool of nonbank applicants,
making the baseline results from Section 4 conservative.
5.5 Originations, Placebo and the Ratio of Total Deposits to Total
Assets
Table A7 confirms that the result is robust when instead of denials we look at originations.
Lenders that are more sensitive to secondary mortgage markets approve and subsequently
originate more applications when the GNMA premium rises.14
Table A8 contains a placebo test in the 2007-2010 period pre-LCR policies. The results are
insignificant for securitization rate, and the wrong sign for nonbank. Thus, we can say that our
results are not driven by pre trends.
Finally, in Table A9, for banks only, we use the ratio of total deposits to total assets in 2011
to measure Fl. The idea is that such banks rely more on secondary markets to finance their
originations. The results get confirmed when we use the OAS as proxies for the LCR.
14Denial rates are not the complement of origination rates because some borrowers may choose to turn downthe lender’s offer.
12

6 Aggregate Effects
6.1 Dynamics of Nonbanks’Market Share
While the granularity of our data in Section 4 allows us to control for a rich set of factors
at the borrower level, it is diffi cult to map the estimates into an aggregate effect because our
data are at the application level. In this section, we aggregate our data to the level of the
census tract, which is the most granular unit of geography we can identify.15 We then estimate
∆ log(Originationsk,t
)= β
(MGNMAt × Fk,t
)+ PostLCRt + γXk,t + αk + uk,t, (2)
where k indexes census tracts and t indexes years. Originationsk,t denotes the number of
originated loans in census tract k and year t. We measure MGNMAt using an indicator of
whether t ≥ 2014 as in Section (4) . Fk,t is the average of lenders’exposure to securitization
(Fl) weighted by applications from census tract k in year t. We use two proxies: 1) the fraction
of applications to non-depository institutions from census tract k in year t (denoted as NDIk,t);
2) the weighted average of lenders’loan securitization rate in 2011, with weights determined by
application share in tract k and year t. Our controls in Xk,t include the change in the share of
minority applicants in the tract, the average of borrowers’requested loan-to-income ratio, and
the log of average borrower income. We also control for the change in the log of the median
house price, based on the Zillow Home Value Index.
Consistent with the borrower-level results from Section 4, Table 7 shows that census tracts
dominated by lenders more exposed to secondary mortgage markets saw greater credit growth
following the LCR policy. To interpret, the estimates for β suggest that LCR policies raised
loan origination growth by 19 percentage points in census tracts in which nonbanks are the
only lenders relative to tracts where there are no nonbanks, and 28 percentage points higher
in tracts where all lenders tend to finance originations through securitization relative to tracts
where no lenders do so.
Table 7 allows to estimate the dynamics of nonbanks’market share. The estimate β in
Table 7 captures the sum of growth in origination rates and applications.16 Table 7 suggests
that in the absence of the LCR policy, nonbank originations would have been 19 percentage
points less per year in census tracts where the fraction of applications to nonbanks is 100%. The
15Census tracts generally have a population between 1,200 and 8,000 with a target size of 4,000.16The estimates in 2 are at the application level and do not capture application growth, which is important
given the efforts that nonbanks have put into raising applications (see for example Rocket Mortgage advertisingduring the Super Bowls).
13
average application share is 50%, thus the average effect is 9.5 less percentage points. Thus,
given that nonbank FHA originations in 2013 were 358,394, this means that two years later,
that is, in 2015, without LCR the nonbanks would have made 68,094 fewer loans (0.095 * 2
* 358,394). This would have lowered nonbanks market share in 2015 from 77.1% to 74.5% of
FHA originations.17 Put differently, nonbank market share grew 9.9 percentage points from
2013 to 2015, but but their share would have grown 2.6 percentage points, or 26% less, in the
absence of the LCR policy.18
6.2 Homeownership Rates
In this subsection, we study whether the increasing market share of the non-depository
institutions can influence homeownership rates. We estimate
∆ Homeownershipm,t = β(MGNMAt ×NonbankMarket Sharem,t
)+PostLCRt+γXm,t+αm+um,t,
(3)
where m indexes MSAs and t indexes years. ∆Homeownershipm,t denotes the change of home-
ownership rate in MSA m and year t. We measure MGNMAt using an indicator of whether
t ≥ 2014 as in Section (4). NonbankMarket Sharem,t denotes the fraction of originations to
non-depository institutions from MSA m in year t. MSA controls Xm,t are the fraction of ap-
plicants which are minorities, the log of average borrower income, the log of average requested
loan-to-income ratio, and the log of the MSA’s median house price. The sample includes all
originated FHA loans for the purchase of an owner-occupied single-family dwelling from 2012
through 2015.
The results in Table 8 suggest that nonbanks have facilitated access to homeownership in
a period when the U.S. homeownership rate has collapsed to historic lows. Thus, the welfare
evaluation of the role of nonbanks requires to weigh the benefits from homeownership versus
the costs from higher default risks.
17In 2015, among FHA originations, 156,404 were from banks and 525,872 from nonbanks. Thus, the77.1% share for nonbanks. Substracting the 68,094 loans due to LCR we obtain the counterfactual 74.5%
as(
525,872−68,094525,872−68,094+156,404
).
18To arrive at these numbers, nonbanks and banks originated 358,394 and 175,044 FHA loans in 2013, re-spectively. Thus, nonbanks market share was 67.2%. Thus, the 9.9 percentage points change between 2013 and2015, which, absent LCR policy would have been only 7.3 percentage points.
14

7 Conclusions
In this paper we have shown that LCR policies, designed to prevent runs in secondary
mortgage markets, seem to have increased the credit risk borne by the U.S. taxpayers that
insure the FHA loans. LCR policy has created demand for GNMA-backed MBS and increased
their price and liquidity in secondary markets. These general equilibrium channels attracted
to FHA lending those lenders more sensitive to securitization, that is, the nonbanks. Lending
standards loosened among FHA loans and risk-taking (as proxied by loans to minorities and
by loan-to-income) increased.
Our paper shows that liquidity regulations can have important effects on credit risk by
altering the structure of the lenders in the market and their incentives to originate and securitize.
It remains open the question of whether that risk-taking is welfare enhancing or not. For
example, we show that nonbanks and LCR policies have increased homeownership in a period
when the U.S. homeownership rate has been at historic lows.
15

References
Ambrose, B. W., Conklin, J. and Yoshida, J.: 2016, Credit rationing, income exaggeration, and
adverse selection in the mortgage market, The Journal of Finance 71(6), 2637—2686.
Basel Committee on Bank Supervision: 2013, The Liquidity Coverage Ratio and liquidity risk
monitoring tools, Bank for International Settlements .
Bech, M. L. and Keister, T.: 2015, Liquidity regulation and the implementation of monetary
policy.
Bhutta, N. and Keys, B. J.: 2016, Interest rates and equity extraction during the housing boom,
American Economic Review 106(7), 1742—1774.
Bhutta, N. and Ringo, D.: 2016, Changing FHA mortgage insurance premiums and the effects
on lending.
Boyarchenko, N., Fuster, A. and Lucca, D. O.: 2015, Understanding mortgage spreads, Federal
Reserve Bank of New York Staff Report 674 .
Buchak, G., Matvos, G., Piskorski, T. and Seru, A.: 2017, Fintech, regulatory arbitrage, and
the rise of shadow banks.
Calem, P., Correa, R. and Lee, S. J.: 2016, Prudential policies and their impact on credit in
the United States.
Chakraborty, I., Goldstein, I. and MacKinlay, A.: 2016, Monetary stimulus and bank lending.
Cornett, M. M., McNutt, J. J., Strahan, P. E. and Tehranian, H.: 2011, Liquidity risk manage-
ment and credit supply in the financial crisis, Journal of Financial Economics 101(2), 297—312.
Dagher, J. and Kazimov, K.: 2015, Banks liability structure and mortgage lending during the
financial crisis, Journal of Financial Economics 116(3), 565—582.
Demyanyk, Y. and Loutskina, E.: 2016, Mortgage companies and regulatory arbitrage, Journal
of Financial Economics 122(2), 328—351.
Di Maggio, M., Kermani, A. and Korgaonkar, S.: 2015, Deregulation, competition and the race
to the bottom.
Diamond, D. W. and Kashyap, A. K.: 2016, Liquidity requirements, liquidity choice, and
financial stability, Handbook of Macroeconomics 2, 2263—2303.
16

Diep, P., Eisfeldt, A. L. and Richardson, S. A.: 2017, Prepayment risk and expected MBS
returns.
Driscoll, J. C., Kay, B. S. and Vojtech, C. M.: 2017, The real consequences of bank mortgage
lending standards.
Echeverry, D., Stanton, R. and Wallace, N.: 2016, Funding fragility in the residential-mortgage
market.
Fieldhouse, A., Mertens, K. and Ravn, M. O.: 2017, The macroeconomic effects of government
asset purchases: Evidence from postwar U.S. housing credit policy.
Frame, W. S., Gerardi, K. and Tracy, J.: 2016/6/20, Risky business: Government mortgage
insurance programs, Liberty Street Economics .
Fuster, A., Lo, S. H. and Willen, P.: 2017, The time-varying price of financial intermediation
in the mortgage market.
Gabaix, X., Krishnamurthy, A. and Vigneron, O.: 2007, Limits of arbitrage: Theory and
evidence from the mortgage-backed securities market, The Journal of Finance 62(2), 557—595.
Gao, P., Schultz, P. H. and Song, Z.: 2017, Liquidity in a market for unique assets: Specified
pool and To-Be-Announced trading in the mortgage-backed securities market, The Journal
of Finance 72(3).
Gete, P. and Reher, M.: 2017, Systemic banks, mortgage supply and housing rents.
Huszar, Z. R. and Yu, W.: 2017, Mortgage lending regulatory arbitrage: A cross-sectional
analysis of nonbank lenders, Journal of Real Estate Research .
Keister, T.: 2017, The interplay between liquidity regulation, monetary policy implementation,
and financial stability.
Keys, B. J., Mukherjee, T., Seru, A. and Vig, V.: 2010, Did securitization lead to lax screening?
Evidence from subprime loans, The Quarterly Journal of Economics 125(1), 307—362.
Loutskina, E.: 2011, The role of securitization in bank liquidity and funding management,
Journal of Financial Economics 100(3), 663—684.
Maggio, M. D., Kermani, A. and Palmer, C.: 2016, How quantitative easing works: Evidence
on the refinancing channel.
17

Oliner S., P. E.: 2015, Measuring mortgage risk with the National Mortgage Risk Index.
Robert Kurtzman, Stephan Luck, and Tom Zimmermann: 2017, Did QE lead to lax bank
lending standards? Evidence from the Federal Reserve LSAPs.
Rodnyansky, A. and Darmouni, O.: 2016, The effects of quantitative easing on bank lending
behavior, The Review of Financial Studies .
Vickery, James and Wright, Joshua: 2013, TBA trading and liquidity in the agency MBS
market, Federal Reserve Bank of New York Policy Review .
Wall Street Journal: 2017/1/19, The mortgage market 1 trillion pocket of worry.
Wallace, N.: 2016, A security design crisis in the plumbing of U.S. mortgage origination.
18

Figures
Figure 1. Market Share of Non-depositary Institutions Among FHA and AllLoans for Home Purchases. The figure shows the percentage of FHA mortgage dollar volume(top) and all of mortgage dollar volume (bottom) originated by non-depository institutions (nonbanks)
for home purchases. Source: HMDA.
19

Figure 2. Securitization by Loan Type. This figure shows the fraction of mortgage
applications which are originated for FHA loans, conventional loans, and jumbo loans. The vertical
line is when the LCR rules were proposed (October 24th, 2013). Source: HMDA.
20
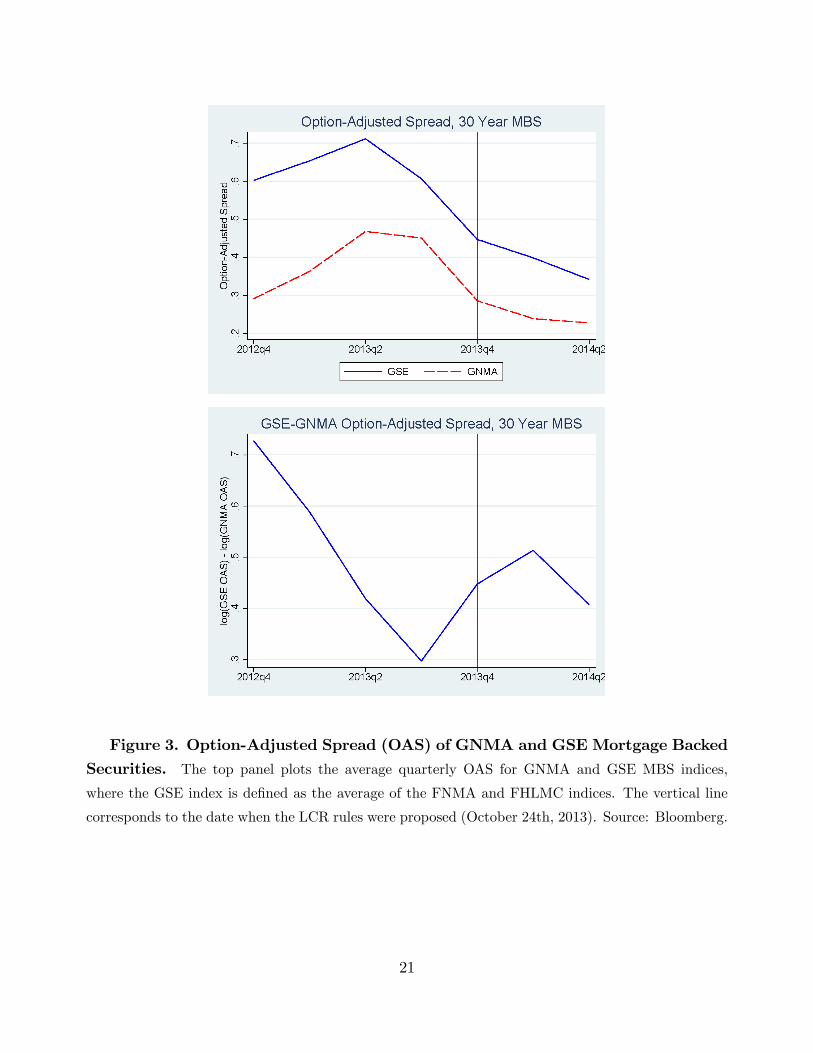
Figure 3. Option-Adjusted Spread (OAS) of GNMA and GSE Mortgage BackedSecurities. The top panel plots the average quarterly OAS for GNMA and GSE MBS indices,
where the GSE index is defined as the average of the FNMA and FHLMC indices. The vertical line
corresponds to the date when the LCR rules were proposed (October 24th, 2013). Source: Bloomberg.
21
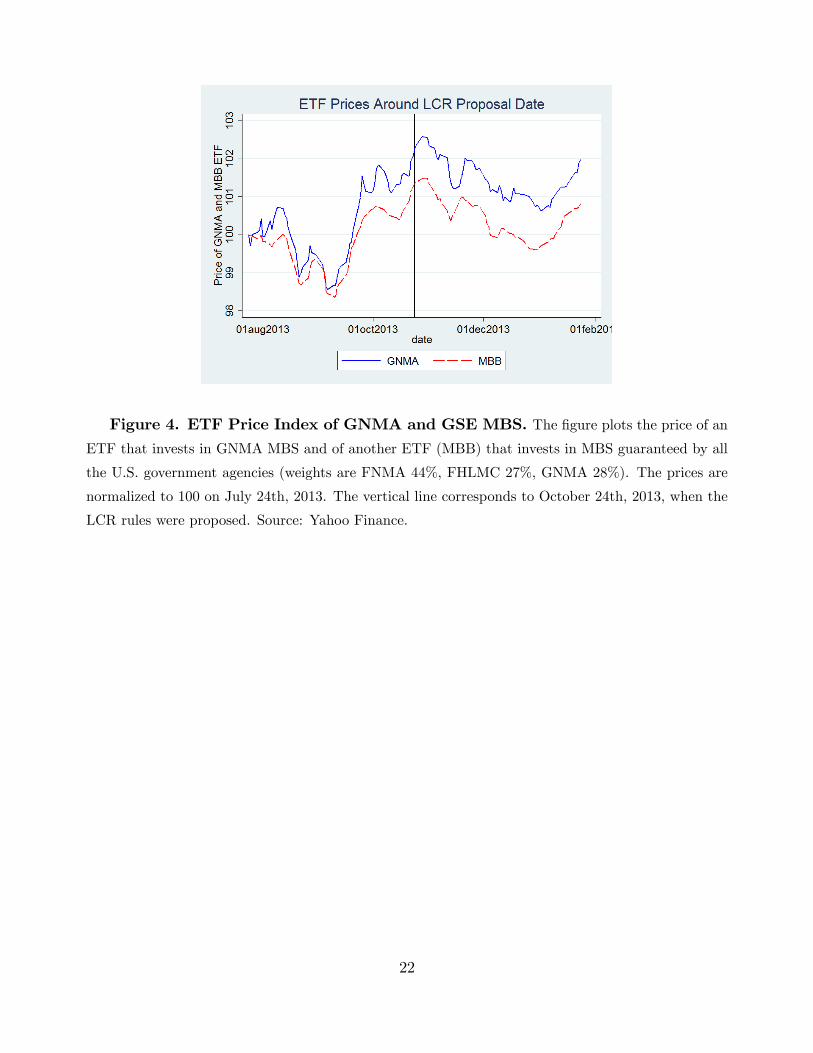
Figure 4. ETF Price Index of GNMA and GSE MBS. The figure plots the price of anETF that invests in GNMA MBS and of another ETF (MBB) that invests in MBS guaranteed by all
the U.S. government agencies (weights are FNMA 44%, FHLMC 27%, GNMA 28%). The prices are
normalized to 100 on July 24th, 2013. The vertical line corresponds to October 24th, 2013, when the
LCR rules were proposed. Source: Yahoo Finance.
22

Tables
Table 1: Summary Statistics
Variable Number of Observations Mean Standard Deviation
HMDA Variables:Denied 2,809,984 0.136 0.343Minority 2,809,984 0.312 0.463Loan-to-Income 2,809,984 3.043 2.188Depository Institution 2,809,984 0.316 0.465Securitization Rate 1,980,562 0.939 0.105GNMA Securitization Rate 1,980,562 0.386 0.391
Call Report Variables:Total Deposit Ratio 639,437 0.763 0.061Liquid Asset Ratio 463,017 0.105 0.071Equity Ratio 639,437 0.113 0.02Loan Provision Ratio 639,437 0.002 0.003Net Income Ratio 639,437 0.012 0.006Rebooked GNMA Ratio 172,805 0.04 0.023log(Assets) 639,437 18.1 3.13
Note: This table contains summary statistics of the variables used in the regressions. Eachobservation corresponds to an FHA loan application for the purchased of an owner-occupiedsingle-family dwelling over the 2012-2015 period. Variables describing lenders (Depository In-sitution, Securitization Rate, GNMA Securitization Rate, and all Call Report variables) areweighted by application share. Denied indicates whether the application was denied. Minorityindicates whether the applicant is black or Hispanic. Loan-to-income is the ratio of the appli-cant’s requested loan to her reported annual income. Depository institution indicates whetherthe lender is a depository institution. Securitization rate is the fraction of originations thatthe lender sold in a given year, and GNMA Securitization Rate is the fraction of originationsthat the lender sold as a GNMA-insured security in a given year. Total Deposit Ratio, EquityRatio, Loan Provision Ratio, Net Income Ratio, and Rebooked GNMA ratios are, respectively,the ratios of total deposits, total equity, loan loss provisions, net income, and rebooked GNMAsecurities to total assets. Liquid Asset Ratio is the ratio of Treasury securities, interest andnon-interest bearing balances, and cash to total assets.
23

Table 2: LCR, FHA Denials and Nonbanks.
Deniedi,l,tMGNMAt = PostLCRt log
(OASFNMA
t
OASGNMAt
)log(OASFHLMC
t
OASGNMAt
)MGNMAt ×NDIl -0.006 -0.044 -0.040
(0.000) (0.000) (0.000)Borrower Controls Yes Yes YesLender-MSA FE Yes Yes YesPost-LCR Indicator Yes Yes YesR-squared 0.108 0.108 0.108Number of Observations 2,809,984 2,809,984 2,809,984
Note: Subscripts i, l, and t denote borrower, lender, and year, respectively. P-values arein parentheses. Denied denotes whether the loan application was denied. PostLCR denoteswhether t ≥ 2014. OAS denotes the option-adjusted spread computed by Bloomberg. NDIindicates whether the lender is a non-depository institution. Borrower controls are requestedloan-to-income ratio, log income, and an indicator of whether the borrower is black or Hispanic.The sample consists of applications for FHA loans for the purchase of an owner-occupied single-family dwelling from 2012 through 2015. Standard errors are heteroskedasticity robust.
24

Table 3: LCR, FHA Denials and Securitization Rate
Deniedi,l,tMGNMAt = PostLCRt log
(OASFNMA
t
OASGNMAt
)log(OASFHLMC
t
OASGNMAt
)MGNMAt ×Sec Rate
l,2011-0.012 -0.057 -0.053(0.002) (0.000) (0.000)
Borrower Controls Yes Yes YesLender-MSA FE Yes Yes YesPost-LCR Indicator Yes Yes YesR-squared 0.107 0.107 0.107Number of Observations 2,777,149 2,777,149 2,777,149
Note: Subscripts i, l, and t denote borrower, lender, and year, respectively. P-values arein parentheses. Sec Rate is the ratio of securitized loans to total originations in 2011. Theremaining notation, controls, sample, and standard errors are the same as in Table 2.
25

Table 4: LCR and Conventional Loan Denials
Outcome: Deniedi,l,t Deniedi,l,tPostLCRt× NDIl 0.011
(0.000)PostLCRt× Sec Ratel,2011 0.007
(0.000)Sample All AllBorrower Controls Yes YesLender-MSA FE Yes YesPost-LCR Indicator Yes YesR-squared 0.095 0.094Number of Observations 6,982,398 6,891,243
Note: Subscripts i, l, and t denote borrower, lender, and year, respectively. P-values are inparentheses. The sample consists of applications for conventional (non-FHA, non-jumbo) loansfor the purchase of an owner-occupied single-family dwelling from 2012 through 2015. Thenotation, controls, and standard errors are the same as in Tables 2 and 3.
26

Table 5: LCR, FHA Denials and Minority Borrowers.
Outcome: Deniedi,l,t Deniedi,l,tlog(OASFNMA
t
OASGNMAt
)× NDIl -0.032
(0.000)
log(OASFNMA
t
OASGNMAt
)× NDIl × Minorityi -0.034
(0.000)
log(OASFNMA
t
OASGNMAt
)× Sec Rate
l,2011-0.054
(0.000)
log(OASFNMA
t
OASGNMAt
)× Sec Rate
l,2011× Minorityi -0.010
(0.003)Sample All AllBorrower Controls Yes YesLender-MSA FE Yes YesPost-LCR Indicator Yes YesR-squared 0.108 0.107Number of Observations 2,809,984 2,777,149
Note: Subscripts i, l, and t denote borrower, lender, and year, respectively. P-values are inparentheses. Minority indicates whether the borrower is black or Hispanic. Sec Rate is theratio of securitized loans to total originations in 2011. The remaining notation, controls, andstandard errors are the same as in Tables 2 and 3.
27

Table 6: LCR, FHA Denials and Borrowers’Loan-to-Income.
Outcome: Deniedi,l,t Deniedi,l,tlog(OASFNMA
t
OASGNMAt
)× NDIl -0.034
(0.000)
log(OASFNMA
t
OASGNMAt
)× NDIl × High LTIi,t -0.020
(0.000)
log(OASFNMA
t
OASGNMAt
)× Sec Rate
l,2011-0.052
(0.000)
log(OASFNMA
t
OASGNMAt
)× Sec Rate
l,2011× High LTIi,t -0.013
(0.000)Sample All AllBorrower Controls Yes YesLender-MSA FE Yes YesPost-LCR Indicator Yes YesR-squared 0.108 0.108Number of Observations 2,809,984 2,777,149
Note: Subscripts i, l, and t denote borrower, lender, and year, respectively. P-values are inparentheses. High LTIi,t denotes whether borrower i had an above-median requested loan-to-income ratio in year t. The remaining notation, controls, and standard errors are the same asin Tables 2 and 3.
28

Table 7: LCR, and FHA Originations at Census Tract Level.
Outcome: ∆ log(Origk,t
)∆ log
(Origk,t
)PostLCRt× NDIk,t 0.190
(0.000)PostLCRt× Sec Rate2011,k,t 0.241
(0.050)Sample All AllTract Controls Yes YesTract FE Yes YesPost-LCR Indicator Yes YesR-squared 0.031 0.028Number of Observations 117,184 114,139
Note: Subscripts k and t denote census tract and year, respectively. P-values are in parentheses.The sample includes all originated FHA loans for the purchase of an owner-occupied single-family dwelling from 2012 through 2015. PostLCR denotes whether t ≥ 2014. Origk,t denotesthe number of originated loans in census tract k and year t. NDIk,t denotes the fractionof applications to non-depository institutions from census tract k in year t. Sec Rate2011,k,tis a weighted average of lenders’ loan securitization rate in 2011, with weights determinedby application share in tract k and year t. Tract controls are the change in: the fraction ofapplicants which are minorities, the log of average borrower income, the log of average requestedloan-to-income ratio, and the log of the MSA’s median house price. Standard errors are doubleclustered by census tract and year.
29

Table 8: LCR, Nonbanks and Homeownership
∆Homeownershipm,tPostLCRt× NDIm,t 0.059
(0.000)MSA FE YesMSA controls YesPost-LCR Indicator YesR-squared 0.050Number of Observations 258
Note: subscripts m and t denote MSA and year, respectively. P-values are in parentheses.PostLCR denotes whether t ≥ 2014. ∆Homeownershipm,t denotes the change of homeownershiprate in MSA m and year t. NDIm,t denotes the fraction of applications to non-depositoryinstitutions from MSA m in year t. MSA controls are the change in: the fraction of applicantswhich are minorities, the log of average borrower income, the log of average requested loan-to-income ratio, and the log of the MSA’s median house price. The sample includes all FHAapplications for the purchase of an owner-occupied single-family dwelling from 2012 through2015. Standard errors are double clustered by MSA and year.
30

ONLINE APPENDIX. NOT FOR PUBLICATION
Quantifying the Liquidity Premium
To assess the quantitative importance of the LCR proposal for MBS spreads, we now turn
to a more formal regression analysis. We take as our baseline outcome the OAS computed by
Bloomberg as well as the difference in log OAS between GNMA and each of the GSE’s MBS.
We focus on the OAS because it is already adjusted for prepayment and default risk. Given
that our ultimate outcome of interest is mortgage origination activity, which moves at a lower
frequency than security prices, we collapse the OAS to the quarterly level. Table A4 confirms
that the results are robust if instead we use a higher frequency and MBS prices from the TBA
market.
We estimate both a panel regression,
log(OASs,t) = αs + β1(PostLCRt ×GNMAs) + γXs,t + τt + us,t, (4)
and a purely time-series regression
log
(OASs,t
OASGNMA,t
)= α + βPostLCRt +Xt + ut, (5)
where s ∈ {GNMA,FNMA,FHLMC} denotes the type of MBS, t denotes the quarter, τt isa quarter fixed effect, PostLCRt indicates whether quarter t equals or follows 2013Q4, and
GNMAs indicates whether is a GNMA MBS (s = GNMA). Although the OAS, already adjusts
for prepayment risk, our controls Xs,t in (4) include the effective duration of security s at
quarter t, as computed by a separate broker-dealer (Standard & Poor’s) than our OAS data
provider. By analogy, Xt in (5) includes GNMA effective duration and the effective duration of
the security in the denominator. Over our sample period (2012Q4-2014Q2) there is effectively
no credit risk premium since the GSEs were already in conservatorship.
The first column of Table A2 contains the estimates from our panel specification (4). Con-
sistent with the graphical evidence discussed in Section 3, the LCR announcement reduced
the spread on GNMA MBS by 12.8% more than for the GSEs’MBS. Taking each of the GSEs
separately, the estimates of (5) in the second and third columns suggest increases in the relative
spread of 8.5% for FNMA and 11.4% for FHLMC. Online appendix Table A3 produces very
similar point estimates using Standard & Poor’s OAS. Given the similarity of results across
31

specifications and the extensive use of controls, we conclude that the LCR policy reduced
spreads on GNMA MBS by around 10% compared to GSE MBS. Collectively, the evidence
from this section points to a significant increase in the value of agency MBS, especially GNMA
MBS, due to their preferential regulatory weights.
32

Additional Figures and Tables
Figure A1. MBS Holdings of Institutions Affected by Liquidity Regulation. Thisfigure plots the holdings of GNMA backed MBS (solid line) and of FNMA and FHLMC backed MBS
by financial institutions subject to the LCR policy. Source: Call Reports (FR Y-9C)
33

Figure A2. Option-Adjusted Spread (OAS) of GNMA and GSE MBS (Alterna-tive Data Source). The vertical line corresponds to the date when the LCR rules were proposed(October 24, 2013). Source: Standard & Poor’s.
34

Figure A3. Prices of GNMA, FNMA and FHLMC MBS. The price corresponds tothe monthly average of the most-commonly traded bond on a given day. The vertical line corresponds
to October 24th, 2013, when the LCR rules were proposed. Source: Trade Reporting and Compliance
Engine (TRACE).
35

Figure A4. Ratio of Intraday Standard Deviation to Price for GNMA, FNMAand FHLMC MBS. The price corresponds to the most-commonly traded bond on a given day.The vertical line corresponds to October 24th, 2013, when the LCR rules were proposed. Source:
FINRA’s TRACE database.
36
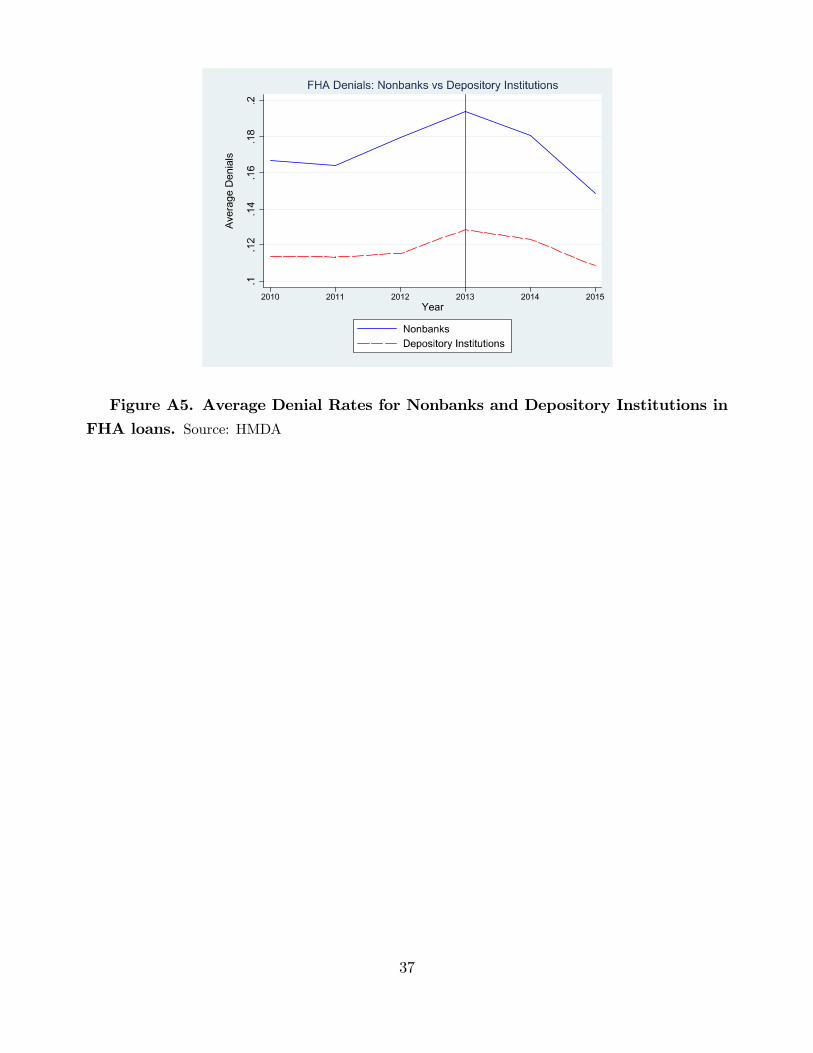
Figure A5. Average Denial Rates for Nonbanks and Depository Institutions inFHA loans. Source: HMDA
37

Figure A6. Credit Quality of FHA Applicants. The top panel plots the average loan-to-income ratio. The bottom panel plots the fraction of minorities among applicants for FHA versus
non FHA loans over our main sample period.
38
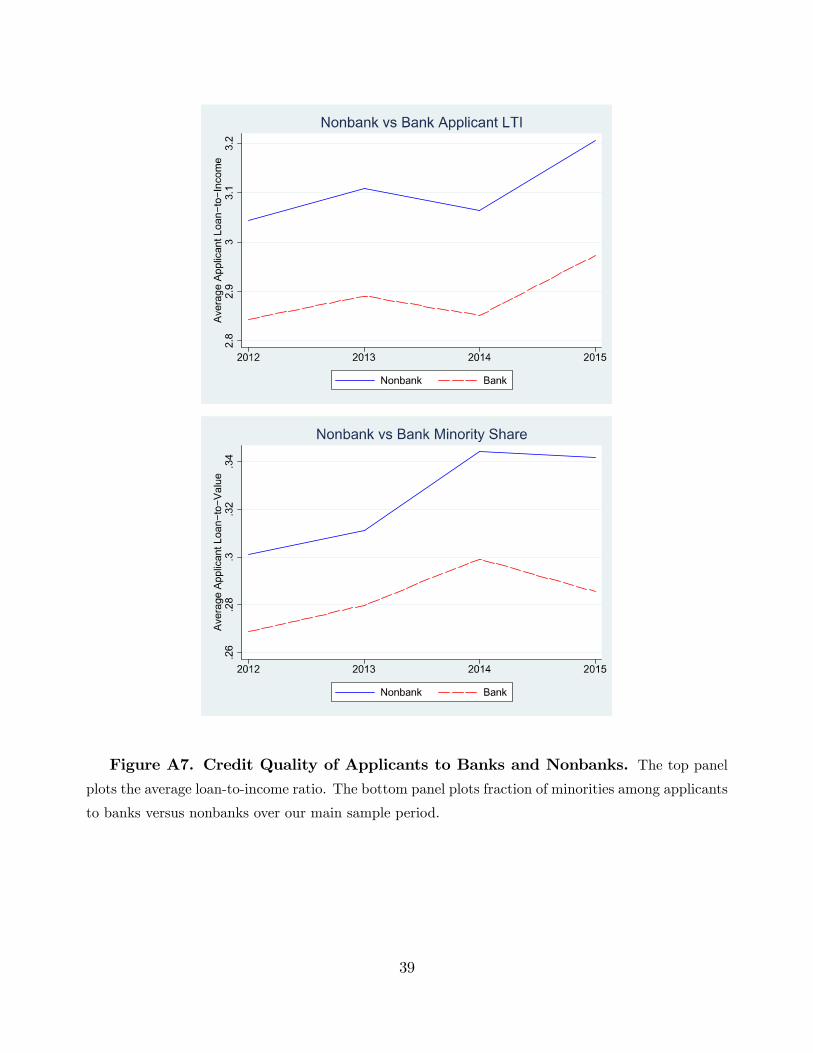
Figure A7. Credit Quality of Applicants to Banks and Nonbanks. The top panelplots the average loan-to-income ratio. The bottom panel plots fraction of minorities among applicants
to banks versus nonbanks over our main sample period.
39

Table A1: Nonbanks in FHA
Name Number of Originations in 2013 and 2014QUICKEN LOANS 20,905GUILD MORTGAGE COMPANY 15,692PRIMARY RESIDENTIAL MORTGAGE 13,321STEARNS LENDING 12,185HOMEBRIDGE FINANCIAL SERVICES, 12,029PROSPECT MORTGAGE LLC 11,477FAIRWAY INDEPENDENT MORT CORP 10,399STONEGATE MORTGAGE CORPORATION 9,352PACIFIC UNION FINANCIAL, LLC 9,327MOVEMENT MORTGAGE, LLC 9,113CORNERSTONE HOME LENDING, INC. 8,946PLAZA HOME MORTGAGE, INC. 8,936EVERETT FINANCIAL INC 8,547FRANLKIN AMERICAN MORTGAGE CO 8,518ACADEMY MORTGAGE CORPORATION 8,187DHI MORTGAGE COMPANY LIMITED 7,984GUARANTEED RATE INC 7726UNIVERSAL AMERICAN MTG. CO.LLC 7,602PINNACLE CAPITAL MORTGAGE 7,397CALIBER HOME LOANS 7,342SECURITYNATIONAL MORTGAGE COMP 7,113UNITED SHORE FINANCIAL SERVICE 7,111PARAMOUNT RESIDENTIAL MORTGAGE 7,087LOANDEPOT.COM, LLC 6,927CARRINGTON MORTGAGE SERVICES 6,457PHH HOME LOANS 6,057NOVA HOME LOANS 5,930FREEDOM MORTGAGE CORPORATION 5,888NTFN, INC. 5,346AMERICAN PACIFIC MORTGAGE CORP 5,294SIERRA PACIFIC MORTGAGE 5,196SUN WEST MORTGAGE COMPANY, INC 4,968AMCAP MORTGAGE LTD 4,706CMG FINANCIAL, INC 4,671SWBC MORTGAGE CORPORATION 4,658W. J. BRADLEY MORTGAGE CAPITAL 4,487IMORTGAGE.COM, INC. 4,395FIRST MORTGAGE CORP 4,118MICHIGAN MUTUAL, INC. 4,053WR STARKEY MORTGAGE, LLP 3,992MORTGAGE 1 INCORPORATED 3,820RESIDENTIAL MORTGAGE SERVICES 3,654NATIONSTAR MORTGAGE LLC 3,641COBALT MORTGAGE INC 3,623NETWORK FUNDING LP 3,573BROKER SOLUTIONS, INC. 3,550CITYWIDE HOME LOANS, A UTAH CO 3,507DAS ACQUISITION COMPANY, LLC 3,360ENVOY MORTGAGE, LTD. 3,357CALIBER FUNDING LLC 3,354
40

Table A2: Liquidity Premium and the LCR Announcement
Outcome: log(OASs,t) log(OASFN ,tOASGN ,t
) log(OASFH ,tOASGN ,t
)
PostLCRt× GNMAs -0.128(0.000)
PostLCRt 0.085 0.114(0.000) (0.007)
Agency FE Yes No NoQuarter FE Yes No NoPrepayment Controls Yes Yes YesR-squared 0.996 0.974 0.894Number of Observations 21 7 7
Note: Subscript s denotes whether the MBS corresponds to GNMA, FNMA, or FHLMC, and tdenotes the quarter. P-values are in parentheses. OASs,t denotes the average quarterly option-adjusted spread for security s, as computed by Bloomberg. PostLCRt denotes whether thequarter coincides with or follows October 24, 2013, when the LCR rules were proposed. GNMAsdenotes whether the security is backed by GNMA. In column 1 our sample includes GNMA,FNMA, and FHLMC securities. Columns 2 and 3 consider relative prices as the outcome. Thesample period is 2012Q4 through 2014Q2. The prepayment controls are the effective durationof security s, as computed by Standard & Poor’s for its corresponding MBS index using amodel to estimate prepayment risk; columns 2 and 3 also control for the duration of FNMAand FHLMC MBS. Standard errors are HAC robust up to 3 quarters.
41

Table A3: Liquidity Premium and the LCR Announcement (Alternative Data Source)
Outcome: log(OASs,t) log(OASFN ,tOASGN ,t
) log(OASFH ,tOASGN ,t
)
PostLCRt× GNMAs -0.119(0.000)
PostLCRt 0.058 0.074(0.020) (0.099)
Agency FE Yes No NoQuarter FE Yes No NoPrepayment Controls Yes Yes YesR-squared 0.991 0.865 0.675Number of Observations 21 7 7
Note: P-values are in parentheses. The notation, sample period, controls and standard errorsare the same as in Table A2. The difference is that the OASs,t and effective duration data nowcome from Standard & Poor’s.
42

Table A4: MBS Prices for TBA Market and Alternative Sample Periods
Outcome: log(Ps,t) log(Ps,t) log(PGN ,tPFN ,t
) log(PGN ,tPFH ,t
)
PostLCRt 0.018 0.013 0.006(0.000) (0.000) (0.001)
PostLCRt× GNMAs 0.007 0.007(0.031) (0.003)
Agency FE Yes Yes No NoMonth FE No Yes No NoSample Oct 12 - Oct 14 Jan 12 - Apr 15 Oct 12 - Oct 14 Oct 12 - Oct 14Prepayment Controls Yes Yes Yes YesR-squared 0.717 0.896 0.556 0.281Number of Observations 75 120 25 25
Note: Subscript s denotes whether the MBS corresponds to GNMA, FNMA, or FHLMC, and tdenotes the month. P-values are in parentheses. Ps,t denotes the price of the monthly averageof the most commonly traded bond on the TBA market, based on TRACE data. PostLCRtdenotes whether the month is or follows October 2013, when the LCR rules were proposed.GNMAs denotes whether the security is backed by GNMA. In columns 1 and 2, our sampleincludes GNMA, FNMA, and FHLMC securities. Columns 3 and 4 consider relative pricesas the outcome. Column 2 is based on a longer sample and so includes month fixed effectsinstead of the PostLCRt indicator. The prepayment controls are the duration of security s, ascomputed by Standard & Poor’s for its corresponding MBS index using a model to estimateprepayment risk; columns 3 and 4 also control for the effective duration of FNMA and FHLMCMBS. Standard errors are HAC robust up to 9 months.
43

Table A5: Robustness: LCR, FHA Denials and Nonbanks 2013 to 2014
Deniedi,l,tMGNMAt = PostLCRt log
(OASFNMA
t
OASGNMAt
)log(OASFHLMC
t
OASGNMAt
)MGNMAt ×NDIl -0.059 -0.208 -0.138
(0.048) (0.000) (0.000)Borrower Controls Yes Yes YesLender-MSA FE Yes Yes YesPost-LCR Indicator Yes Yes YesR-squared 0.024 0.028 0.028Number of Observations 1,387,277 1,387,277 1,387,277
Note: Subscripts i, l, and t denote borrower, lender, and year, respectively. P-values arein parentheses. Denied denotes whether the loan application was denied. PostLCR denoteswhether t = 2014. OAS denotes the option-adjusted spread computed by Bloomberg. NDIindicates whether the lender is a non-depository institution. Borrower controls are requestedloan-to-income ratio, log income, and an indicator of whether the borrower is black or Hispanic.The sample consists of applications for FHA loans for the purchase of an owner-occupied single-family dwelling from 2013 through 2014. Standard errors are heteroskedasticity robust.
44
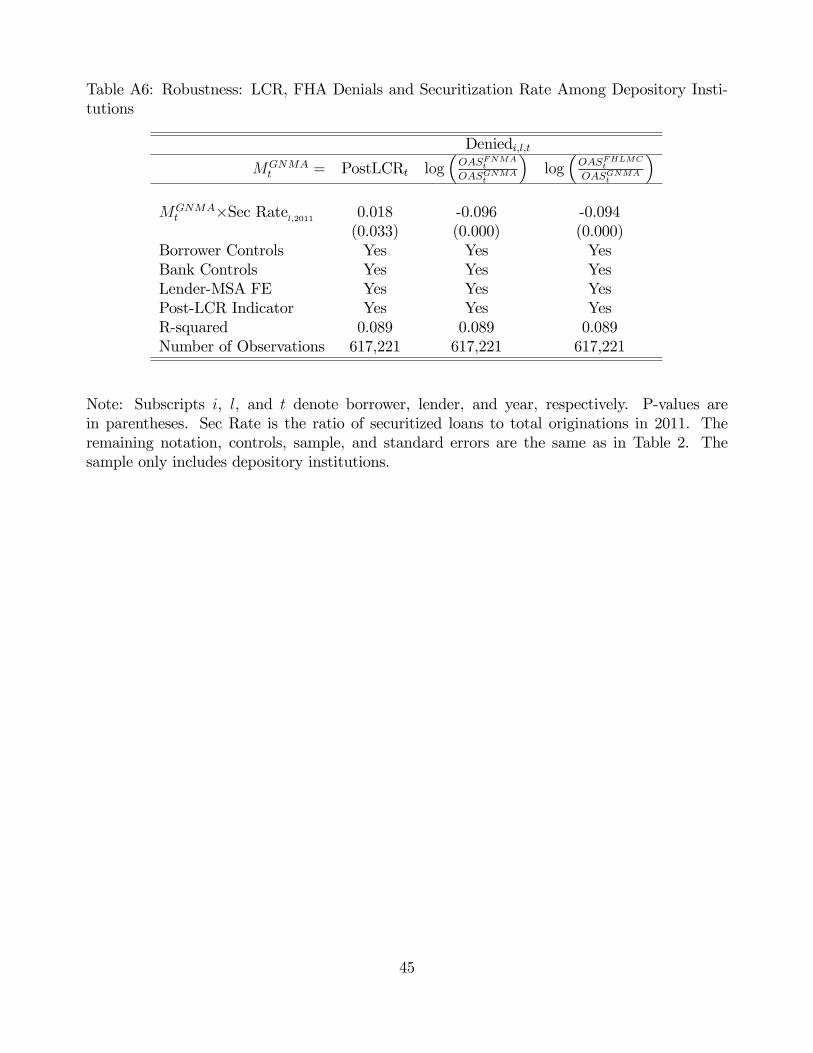
Table A6: Robustness: LCR, FHA Denials and Securitization Rate Among Depository Insti-tutions
Deniedi,l,tMGNMAt = PostLCRt log
(OASFNMA
t
OASGNMAt
)log(OASFHLMC
t
OASGNMAt
)MGNMAt ×Sec Rate
l,20110.018 -0.096 -0.094(0.033) (0.000) (0.000)
Borrower Controls Yes Yes YesBank Controls Yes Yes YesLender-MSA FE Yes Yes YesPost-LCR Indicator Yes Yes YesR-squared 0.089 0.089 0.089Number of Observations 617,221 617,221 617,221
Note: Subscripts i, l, and t denote borrower, lender, and year, respectively. P-values arein parentheses. Sec Rate is the ratio of securitized loans to total originations in 2011. Theremaining notation, controls, sample, and standard errors are the same as in Table 2. Thesample only includes depository institutions.
45

Table A7: Robustness: LCR and FHA Originations
Originationsi,l,tPostLCRt× NDIl 0.017
(0.000)PostLCRt×Sec Ratel,2011 0.031
(0.000)Sample All AllBorrower Controls Yes YesBank Controls No NoLender-MSA FE Yes YesPost-LCR Indicator Yes YesR-squared 0.086 0.084Number of Observations 2,809,984 2,777,149
Note: Subscripts i, l, and t denote borrower, lender, and year, respectively. P-values are inparentheses. The notation, controls, sample, and standard errors are the same as in Tables 2and 3.
46
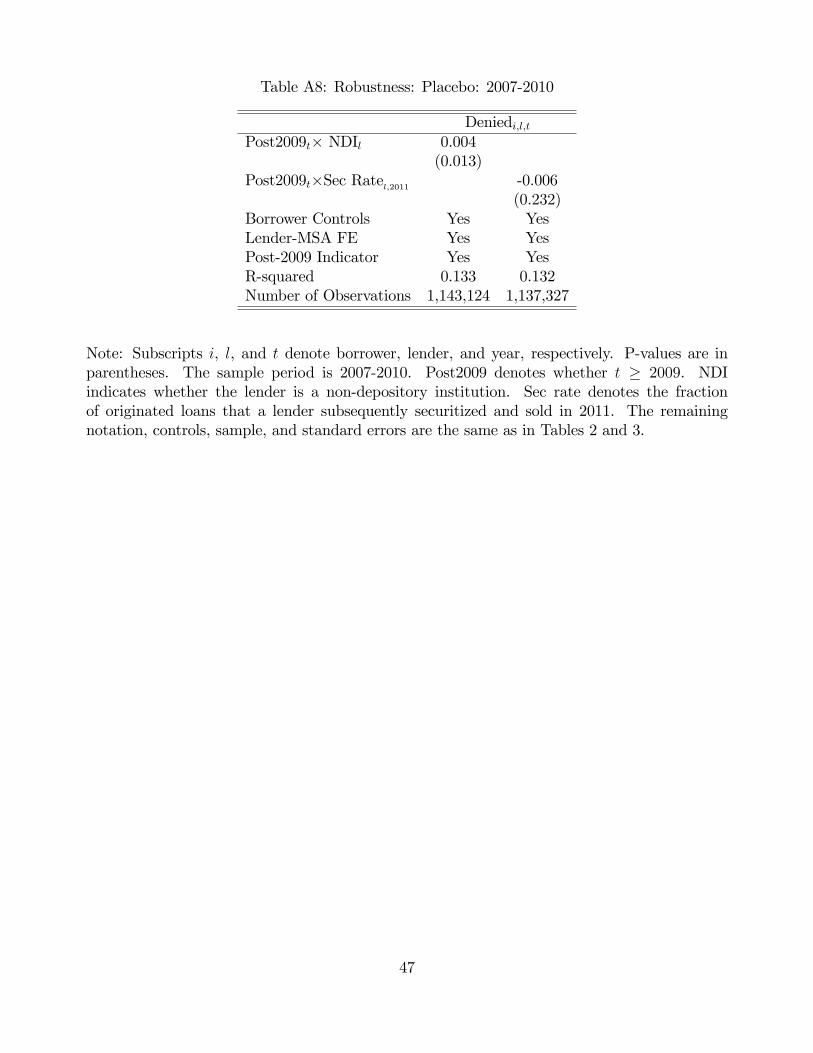
Table A8: Robustness: Placebo: 2007-2010
Deniedi,l,tPost2009t× NDIl 0.004
(0.013)Post2009t×Sec Ratel,2011 -0.006
(0.232)Borrower Controls Yes YesLender-MSA FE Yes YesPost-2009 Indicator Yes YesR-squared 0.133 0.132Number of Observations 1,143,124 1,137,327
Note: Subscripts i, l, and t denote borrower, lender, and year, respectively. P-values are inparentheses. The sample period is 2007-2010. Post2009 denotes whether t ≥ 2009. NDIindicates whether the lender is a non-depository institution. Sec rate denotes the fractionof originated loans that a lender subsequently securitized and sold in 2011. The remainingnotation, controls, sample, and standard errors are the same as in Tables 2 and 3.
47
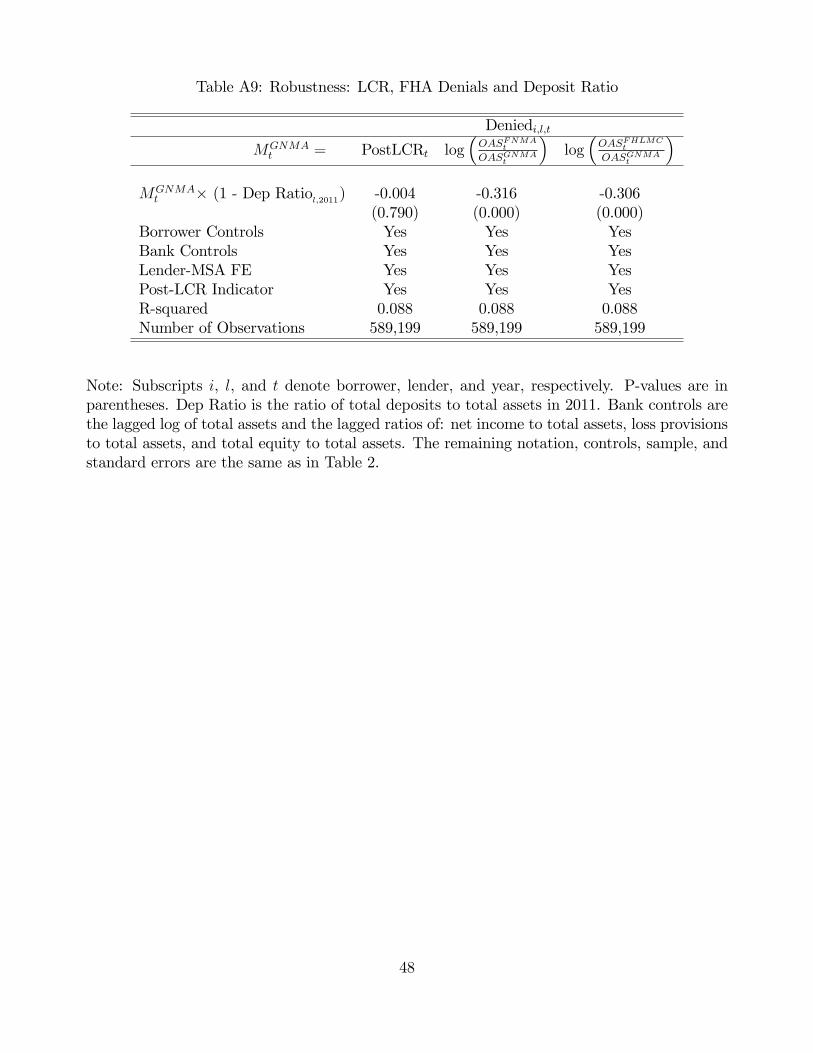
Table A9: Robustness: LCR, FHA Denials and Deposit Ratio
Deniedi,l,tMGNMAt = PostLCRt log
(OASFNMA
t
OASGNMAt
)log(OASFHLMC
t
OASGNMAt
)MGNMAt × (1 - Dep Ratio
l,2011) -0.004 -0.316 -0.306
(0.790) (0.000) (0.000)Borrower Controls Yes Yes YesBank Controls Yes Yes YesLender-MSA FE Yes Yes YesPost-LCR Indicator Yes Yes YesR-squared 0.088 0.088 0.088Number of Observations 589,199 589,199 589,199
Note: Subscripts i, l, and t denote borrower, lender, and year, respectively. P-values are inparentheses. Dep Ratio is the ratio of total deposits to total assets in 2011. Bank controls arethe lagged log of total assets and the lagged ratios of: net income to total assets, loss provisionsto total assets, and total equity to total assets. The remaining notation, controls, sample, andstandard errors are the same as in Table 2.
48