non-real estate consumer lending study - april 2005 · pawn loans made up about 58 percent of the...
TRANSCRIPT

LLLEEEGGGIIISSSLLLAAATTTIIIVVVEEE RRREEEPPPOOORRRTTT ANALYSIS OF NON-REAL ESTATE CONSUMER LENDING REGULATED BY THE OFFICE OF CONSUMER CREDIT COMMISSIONER
REPORT PREPARED FOR THE FINANCE COMMISSION OF TEXAS AND
THE OFFICE OF CONSUMER CREDIT COMMISSIONER BY THE TEXAS LEGISLATIVE COUNCIL
APRIL 15, 2005


April 15, 2005 Texas Legislature Texas State Capitol Austin, Texas 78711 Dear Member: The Finance Commission and the Office of Consumer Credit Commissioner (OCCC) are pleased to present this Analysis of Non-Real Estate Consumer Lending Regulated by the Office of Consumer Credit Commissioner. The study is one of the first of its kind to explore this market in Texas, and the project exists as a direct result of two legislative actions:
SB 272, 77th Regular Session – Section 11.305(a) requires the Finance Commission, through the Office of Consumer Credit Commissioner, to establish a program addressing alternatives to high-cost lending in the state. The program calls for a study and report on the problem of high-cost lending, including the availability, quality, and prices of certain financial services; and House Bill 1, 78th Regular Legislative Session, Article VIII-26 – 4. High-Cost Lending. . . . the Office of Consumer Credit Commissioner shall:
a. compile and provide information regarding high-cost lending in the state, as required by Section 11.305, Finance Code.
The Finance Commission and the OCCC could not have presented this report without valued assistance from the Texas Legislative Council. Staff at Texas Legislative Council devised the sampling plan, analyzed the data, and also produced the report. The report contains valuable information about many of the lending markets the OCCC regulates. The information displayed should help lead to a better understanding of the Non-Real Estate Consumer Lending market in Texas. Should you have any questions about the information contained in this report, please call me or Steven O’Shields at (512) 936-7640. Sincerely, Leslie L. Pettijohn


Analysis of Non-Real Estate Consumer Lending Regulated by the Offi ce of Consumer Credit Commissioner (OCCC)
Table of Contents
Summary of Findings ..............................................................................................................vi
Introduction ..............................................................................................................................1
How Did the Volume of OCCC-Licensed Lending Change Over Time? ..................................5
How did the number of loans change over time? ..........................................................5
How did the total amount loaned change over time? ....................................................6
How did the size of the loans change over time? ..........................................................7
How did the number of companies with licensed locations change over time? ............8
How Were OCCC-Licensed Lending Institutions Geographically DistributedThroughout Texas? .........................................................................................................................9
What county characteristics were related to the proportion of OLLs? ........................ 10
What county characteristics were related to the proportion of each type of OCCC-licensed lender? ............................................................................................... 14
What county characteristics were related to theproportion of consumer installment lenders? ................................................... 18
What county characteristics were related to theproportion of signature lenders? ...................................................................... 18
What county characteristics were related to theproportion of payday export lenders? .............................................................. 18
What county characteristics were related to theproportion of pawn lenders? ............................................................................ 18
What county characteristics were related to the proportionof lenders licensed to make both pawn and payday export loans? .................. 19
Overall, what county characteristics were most closelyrelated to the proportions of lenders? .......................................................................... 19
What Were the Characteristics of Loans That Texas Consumers Received From OCCC Licensees? .................................................................................................................................... 21
What types of loan were most common? .................................................................... 21
What types of documentation were loan applicants required to provide? ................... 21
Did the lenders conduct credit checks? ....................................................................... 23
What percentage of loan applications was denied? ..................................................... 24
ii
What were the terms of the loans? .............................................................................. 24
What was the status of the loans when the study data were collected? ...................... 27
Were many of the loans used to pay back previous loans? ......................................... 28
Were late charges a major cost for most customers? .................................................. 29
Were Unlicensed Businesses Lending Money to Texas Consumers? ...................................... 31
What Are the Alternatives to High-Cost Lending? ................................................................. 33
Appendix A. Annual Report Analysis ..................................................................................... 35
Appendix B. Geographic Analysis ......................................................................................... 39
Appendix C. Survey of OCCC Licensees ............................................................................... 67
Appendix D. Survey of Unlicensed Lenders .......................................................................... 71
Notes ...................................................................................................................................... 75

iii
List of Tables
SummaryTable. Average Loan Characteristics .............................................................................. vii
Table 1. Types of Loans Included in Study ......................................................................... 2
Table 2. Number of Loan Companies by Type ................................................................... 8
Table 3. Number of Pawn Licensees ................................................................................... 8
Table 4. Distribution of Counties, OCCC-Licensed Locations, and Banks by Metropolitan and Border Status ............................................................................ 9
Table 5. Number of Lenders and Proportions by Type of Lender ..................................... 15
Table 6. Percentage of Loans by Loan Type (January 1, 2003 - June 30, 2003) ............... 21
Table 7. Documentation Required of Applicants by Loan Type ....................................... 22
Table 8. Use of Credit Checks by Loan Type ................................................................... 23
Table 9. Denied Loan Applications by Loan Type ............................................................ 24
Table 10. Loan Characteristics by Loan Type ..................................................................... 24
Table 11. Example Finance Charges by Loan Type ............................................................ 26
Table 12. Status of Loans at Data Collection by Loan Type ............................................... 27
Table 13. Loan Renewals by Loan Type ............................................................................. 28
Table 14. Late Charges by Loan Type ................................................................................ 29
Table A-1. Number of Loans by Year and Type of Loan ...................................................... 35
Table A-2. Amount Loaned by Year and Type of Loan (in 2003 Dollars) ............................ 36
Table A-3. Amount Per Loan by Year and Type of Loan (in 2003 Dollars) .......................... 37
Table B-1. Correlations between County Characteristics and Proportions of OLLs and Types of Lenders in the County .................................................................... 39
Table B-2. Standardized Parameter Estimates from Regression Equations ........................... 40
Table B-3. Proportion of Each Type of Financial Institution by County .............................. 41
Table B-4. Number of Each Type of Financial Institution by County .................................. 50
Table B-5. County Demographic Data .................................................................................. 58

iv
Table C-1. Number of Licensees and Loans for the Study by Type of Lender ..................... 68
Table C-2. Number of Licensees and Number of Loans by Stratum .................................... 69
Table C-3. Coeffi cient of Variation by Type of Question ...................................................... 70
Table D-1. Counties Selected for Mail Survey of Potentially Unlicensed Lenders ............... 71
Table D-2. Status of All Potentially Unlicensed Lenders ...................................................... 73
Table D-3. Status of Potentially Unlicensed Lenders Included in Mailing List .................... 74
Table D-4. Response Rate for Mail Survey of Potentially Unlicensed Lenders .................... 74

v
Lists of Graphs and Maps
Graphs
Graph 1. Number of Loans by Type of Loan ......................................................................... 5
Graph 2. Amount Loaned by Type of Loan (Reported in 2003 Dollars) ................................ 6
Graph 3. Amount Per Loan by Type of Loan (Reported in 2003 Dollars) ............................. 7
Graph 4. Distribution of Potentially Unlicensed Lenders ..................................................... 31
Maps
Map 1. Lenders and Minority Percentage by County ........................................................ 12
Map 2. Lenders and Metropolitan and Border Status by County ...................................... 13
Map 3. OCCC-Licensed Lenders and Metropolitan and Border Status by County ........... 16
Map 4. OCCC-Licensed Lenders and Minority Percentage by County ............................. 17

vii
Summary of Findings
As the subprime lending market has grown, many important questions have arisen about it. In some cases, the questions deal with the terms of the loans themselves: what are the real costs of the loans, how long do they last, and how often do consumers renew the loans? In other cases, the questions relate more closely to policy concerns: where are the lenders located, and are there any alternatives to subprime loans?
Unfortunately, little research has been published about the subprime market itself, particularly as it relates to individual states. To address this lack of research, Senate Bill 272, Acts of the 77th Legislature, Regular Session, 2001, requires the Finance Commission of Texas to study high-cost lending in the state. The commission is required to report, among other items, on the availability and prices of fi nancial services and on the locations of high-cost lenders. It also is required to evaluate alternatives to high-cost lending.
The Finance Commission of Texas, Offi ce of Consumer Credit Commissioner (OCCC), and Texas Legislative Council have collected and analyzed current and historical data in an attempt to ascertain the characteristics and types of credit available to Texas consumers in the high-cost, consumer-lending credit market that is not secured by real estate. Specifi cally, this research analyzes fi ve types of loans: consumer installment, signature, payday export, payday state rate, and pawn.1
How did the volume of OCCC-licensed lending change over time?
• In 2000, OCCC-licensed lenders made approximately 13.5 million consumer installment, signature, payday export, payday state rate, and pawn loans. In 2003, that total increased to over 15.3 million loans. Payday loans with exported rates, introduced in 2000, grew rapidly in number from 2001 through 2003.
• The total dollars loaned increased from about $3.9 billion in 2000 to over $4.8 billion in 2003.
• The average loan amount was fairly stable for signature, payday, and pawn loans. The average amount of a consumer installment loan had a large increase in 1999.
• The number of companies reporting consumer installment lending or signature lending decreased from 2000 through 2003, while the number of companies reporting payday lending (using state rates or exported rates) increased. Reports for these types of loans are submitted at the company level, and a change in the number of companies does not necessarily correspond to a change in the number of licensees. Pawn reports are submitted by each licensed location, and the number of pawn licensees decreased from 2000 through 2003.
How were OCCC-licensed lending institutions geographically distributed throughout Texas?
• In the spring of 2004, Texas had 3,823 OCCC-Licensed Locations (OLLs) and 5,246 banks. Overall, 98 percent of Texas counties had a bank and 69 percent had an OLL.

viii
• Counties with higher percentages of minorities tended to have higher proportions of OLLs, higher proportions of signature lenders, and higher proportions of lenders licensed for both pawn and payday export lending than other counties. However, counties with higher percentages of minorities tended to have lower proportions of lenders licensed only for pawn lending.
• Metropolitan counties tended to have higher proportions of OLLs than other counties.
• Border counties tended to have higher proportions of lenders licensed for both pawn and payday export lending than other counties.
What were the characteristics of loans that Texas consumers received from OCCC licensees?
• The study included fi ve types of loans made by OCCC licensees in the fi rst half of 2003. Pawn loans made up about 58 percent of the loans included in the study, followed by signature loans (27 percent), payday export loans (14 percent), and consumer installment loans (one percent). There were so few payday state rate loans (less than one percent) that data were not presented for that group.
• Documentation requirements varied widely depending on the type of loan. Pawn loans typically required only a government-issued picture ID and the item to be pawned, whereas payday export loans required an average of six types of documentation.
• Credit checks were usually used for all types of loans except pawn loans.
• Average loan characteristics are shown below.
Summary TableAverage Loan Characteristics
Consumer Payday Installment Export Loans Loans
Average amount fi nanced $5,352 $314 $338 $115
Average length of loan 42 months 7 months 0.5 months 1 month
Average disclosed APR 25% 93% 511% 227%
• Some loans started as renewals (i.e., they were taken out to pay off a previous loan), and some loans ended as renewals (i.e., they were paid off by taking out another loan). The average percentage of loans that both started and ended as renewals was highest for signature loans (about 48 percent), followed by payday export (nine percent), consumer installment (seven percent), and pawn (three percent).
• Late charges were assessed on roughly 44 percent of consumer installment loans and 41 percent of signature loans. Late charges were not used in pawn loans or payday export loans.
CharacteristicSignature
LoansPawnLoans

ix
Were unlicensed businesses lending money to Texas consumers?
• The study attempted to assess the market of unlicensed lending. Initial reports indicated many businesses were extending cash advances or making loans without a license. A mail survey was conducted that targeted 187 businesses that appeared to be unlicensed and making loans. Twenty businesses returned questionnaires with data describing their lending activities. Because such a small group of businesses provided data, no valid results could be produced.
• The magnitude of the unlicensed market was determined to be smaller than it initially appeared, possibly due to the highly transient nature of the businesses.

1
Introduction
The purpose of this report is to describe non-real estate consumer lending regulated by the Offi ce of Consumer Credit Commissioner (OCCC), the agency within the Finance Commission of Texas that licenses nondepository lenders. The Texas Finance Code requires nondepository lenders making personal loans with effective rates of 10 percent or higher to maintain a license with the OCCC.2,3 Companies with several locations are required to maintain a license for each location. These lenders can be divided into two categories: real estate lenders (such as home equity lenders and mortgage lenders) and non-real estate lenders (such as consumer installment lenders, signature loan companies, payday lenders, and pawnshops).
This research was undertaken by the Finance Commission of Texas, the OCCC, and the Texas Legislative Council (TLC) in response to a legislative requirement that the commission study high-cost lending and report its research fi ndings to the legislature. The legislature required that the study assess the availability and prices of fi nancial services, evaluate alternatives to high-cost lending, and identify the locations of high-cost lenders.4 The commission has provided the legislature with two reports in response to this requirement. In 2003, the commission submitted a report describing the characteristics of home mortgage loans in Texas.5 A report on consumer opinions about loans and the lending process was submitted in 2000.6
This report describes consumer installment loans, signature loans, payday loans, and pawn loans made to consumers by lenders with locations in Texas. It is divided into fi ve sections, with each section describing a different set of characteristics of these loan types. The fi rst section examines reports submitted annually by OCCC-licensed lenders to determine how the volume of OCCC-licensed lending changed from 1987 through 2003. The second section describes the distribution of OCCC-licensed lenders across Texas. It investigates differences by type of lender, presents fi ndings relative to selected county-specifi c characteristics, and contrasts the distribution of OCCC-licensed lenders to that of banks. The third section explores the characteristics of loans made by OCCC licensees. It is based on the results of a statewide survey of consumer installment, signature, payday, and pawn loans made by OCCC-licensed lenders during the fi rst six months of 2003. The fourth section presents results of a survey of businesses not licensed by the OCCC that appeared to be making loans of the type regulated by the OCCC. The report concludes with a discussion of the alternatives to high-cost lending. The body of the report contains the study fi ndings. More detailed information about how the study data were gathered is included in the report appendixes.
The loans included in this study typically serve a group of consumers that is referred to as the “subprime market.”
The subprime market consists of individuals who have less-than-perfect credit records due to past bankruptcies, late payments, or a generally poor record in managing debt. An individual’s impaired credit record may also be attributable to carrying too much credit card debt and having an irregular employment history. Subprime lenders are lenders who loan money to individuals in this market segment. In general, subprime loans carry higher interest rates to compensate lenders for assuming the higher risk of lending to subprime borrowers.7
A borrower’s creditworthiness is an important consideration in the making of many subprime loans. Many lenders assess a borrower’s creditworthiness through a credit score and underwriting standards.8 Analysis of a lender’s credit decision matrix and underwriting standards was beyond the scope of this study. Although those data were not obtained for this study, other data collected during the study may provide insight into the application process for loans.

2
* Maximum allowable loan amounts are periodically adjusted for infl ation. These amounts are from the period between January 2003 and June 2003. The volume statistics are for all of calendar year 2003.
Table 1Types of Loans Included in Study*
Type of Loan Description Characteristics 2003 Loan Volume
• typically greater than $500 (maximum depends on rate charged) • length usually 1-5 yearsConsumer large consumer • paid back in several • 0.39 million loansInstallment loans installments • $2,023 million • typically secured by loaned personal property • APRs range from 18% to 32% (depends on loan amount and whether customer has another loan)
• $500 maximum • length usually 2-12 monthsSignature small consumer • paid back in several • 4.16 million loans loans installments • $1,524 million • typically unsecured, but may loaned be secured by personal property • APRs range from 72% to 240%
• maximum loan amount depends on exporting state • length usually 2-3 weeksPayday With small brokered • paid back in one installment • 1.81 million loansExported loans with • typically secured by personal • $612 million loanedRates out-of-state check for amount loaned plus lender interest and fees • APRs regulated by exporting state
• $500 maximum • length usually 2-3 weeks • paid back in one installmentPayday With small loans with • typically secured by personal • 0.10 million loansState Rates in-state lender check for amount loaned plus • $14 million loaned interest and fees • APRs range from 153% to 570%
• $12,500 maximumPawn loans secured • length one month • 8.89 million loans by property left • paid back in one installment • $669 million loaned with lender • secured by personal property • APRs range from 12% to 240%

3
This study includes fi ve types of consumer loans: consumer installment loans, signature loans, payday loans with exported rates, payday loans with state rates, and pawn loans. The types of loans included in this study are only a portion of the loans serving the subprime market. Other types of loans, such as home mortgages and automobile loans, may also be subprime loans. Additionally, to provide an accurate statewide assessment of OCCC-licensed lending, lenders and loans were included in this study without regard to interest rates. Information about interest rates charged by banks is presented, and the value judgment of what would be “high cost” is left to the reader. Information about these loans is presented in Table 1.
Consumer installment loans are authorized under Subchapter E, Chapter 342, Texas Finance Code. They are sometimes referred to as “Subchapter E” loans. These loans are typically over $500, and most are secured by personal property. The loans are paid back in several installments and are usually one to fi ve years in length. The Texas Finance Code sets maximum allowable rates for these loans, determined by the loan amount and whether the customer has more than one loan. For loans up to $1,500, lenders may charge a maximum effective rate of 32 percent. For loans from $1,500 to $12,500, lenders may charge a maximum rate that is a blended rate of 30 percent, 24 percent, and 18 percent.9,10 For example, under the blended rate structure, a $4,000 loan for 18 months would produce a maximum annual percentage rate (APR) of 29.56 percent.11 A customer may have only one loan at this maximum blended rate. Additional loans of more than $1,500 have a maximum effective rate of 18 percent. In addition, late charges may be assessed, and lenders may offer the borrower credit insurance and property insurance.
Signature loans are authorized under Subchapter F, Chapter 342, Texas Finance Code. They are sometimes referred to as “Subchapter F” loans. At the time of this study, these loans could not exceed $500. They are usually from two to twelve months in length and are paid back in installments. These loans are typically unsecured, but they may be secured by personal property. Under Texas law, the maximum allowable rate for signature loans is determined by the loan amount and term. Lenders may assess fi nance charges resulting in APRs that range from 72 percent to 240 percent. For example, a $200 loan for eight months would produce an APR of 90.96 percent at maximum rates. Late charges may be assessed, but insurance or other similar charges are not allowed.
Payday loans also are authorized under Subchapter F, Chapter 342, Texas Finance Code.12 These loans are typically secured by a personal check for the amount loaned plus interest and fees. They are usually two to three weeks in length and paid back in a single installment. There are two payday loan models being used: the state rate model and the bank model. The state rate model operates under Texas state law, i.e., rates must comply with the Texas Finance Code. Under the bank model, the payday business aligns with an out-of-state bank in an arrangement where the out-of-state bank exports the rates of its home state into Texas. These two models result in two different categories of payday loans: payday loans with state rates and payday loans with exported rates.13 Both categories of payday loans were fi rst introduced in 2000. Under Texas law, the maximum allowable rate for payday loans with state rates is determined by the loan amount and term. Lenders may assess fi nance charges resulting in APRs that range from 152.99 percent to 569.92 percent.14 For example, a $200 loan for 14 days would produce an APR of 178.98 percent at maximum rates. Late charges, insurance, or other similar charges may not be assessed. Most payday loans are made using the bank model with the accompanying exported rates. Many states allow loan rates that are higher than Texas loan rates. Lending institutions locate in those states and export their rates to Texas, so payday loans with exported rates typically have higher rates than payday loans with state rates.

4
Pawn loans are authorized by Chapter 371 of the Texas Finance Code. To obtain a pawn loan, the customer must pledge an item as collateral. The lender bases the loan amount on the value of the item pledged. Pawn loans are one month long and are paid back in a single installment. Although Texas law allows pawn loans up to $12,500, almost all are for under $1,000. The maximum allowable charge for pawn loans up to $150 yields an APR of 240 percent, and the maximum allowable charge for pawn loans from $150.01 to $1,000 yields an APR of 180 percent. Late charges, insurance, or other similar charges may not be assessed.

5
0
1
2
3
4
5
6
7
8
9
10
1987
1988
1989
1990
1991
1992
1993
1994
1995
1996
1997
1998
1999
2000
2001
2002
2003
YearConsumer Installment Signature Payday Export Payday State Rate Pawn
Mil
lio
ns
of
Lo
an
s
* Payday Export and Payday State Rate lenders were authorized to offer loans beginning in 2000. Pawn lenders were not required to submit data prior to 2000.
Graph 1
Number of Loans by Type of Loan*
How Did the Volume of OCCC-Licensed Lending Change Over Time?
OCCC licensees are required to submit annual reports that include the total number of loans they made and the total amount they loaned. Consumer installment loan, signature loan, and payday loan companies submit a single annual report that combines the information for all of their licensed locations. Pawn lenders submit an annual report for each licensed location. A comparison of annual report data from 1987 through 2003 provides an overview of how OCCC-licensed lending changed over that 17-year period.15
How did the number of loans change over time?
In 1987, the number of consumer installment and signature loans combined was about 2.1 million. By 1999, that fi gure had more than doubled, to 4.5 million. In 2000, when payday loans were introduced and pawn lenders were required to submit reports, the combined total was 13.5 million, and it increased to over 15.3 million in 2003.
As shown in Graph 1, the number of payday loans with exported rates has increased dramatically since their introduction in 2000. The number of payday loans with state rates increased much more slowly during the same time period. This is consistent with the small number of licensees currently providing payday state-rate loans. In 2003, payday lenders using state rates made up only about two percent of the licensees offering payday loans.16

6
Graph 2
Amount Loaned by Type of Loan (Reported in 2003 Dollars)*
0
0.5
1
1.5
2
2.5
1987
1988
1989
1990
1991
1992
1993
1994
1995
1996
1997
1998
1999
2000
2001
2002
2003
YearConsumer Installment Signature Payday Export Payday State Rate Pawn
Bil
lio
ns
of
Do
llars
* Payday Export and Payday State Rate lenders were authorized to offer loans beginning in 2000. Pawn lenders were not required to submit data prior to 2000.
Bill
ion
s o
f D
olla
rs
1
The number of pawn loans grew steadily from 2000 through 2003. However, the number of pawn loans as a proportion of all loans in the study dropped from 63 percent in 2000 and 2001 to 58 percent in 2003. This drop coincided with an increase in the proportion of payday loans with exported rates.
The number of signature loans generally increased since 1987, while the number of consumer installment loans remained stable, except for an increase in 1998. After the one-year increase in 1998, the number of consumer installment loans returned to earlier levels.
How did the total amount loaned change over time?
The total amount loaned also increased from 1987 through 2003. In 1987, consumer installment loans and signature loans combined totaled approximately $1.4 billion. By 1999, that amount had grown to $3.4 billion. In 2000, with the addition of payday loans and pawn loans, a combined total of about $3.9 billion was loaned. The combined total amount loaned in 2003 was over $4.8 billion. Graph 2 presents the amount loaned by type of loan.

7
Among the types of loans included in this study, most of the dollars loaned from 1987 through 2003 were either consumer installment loans or signature loans. Consumer installment loans were less common than signature loans, but they tended to be much larger loans. Overall, the total amount borrowed with these two types of loans increased throughout the 17-year period.
For payday loans with exported rates, the amount loaned increased dramatically in 2002 and 2003, refl ecting the increase in the number of these loans. In 2003, the amount loaned with payday export loans approached the total dollar amount loaned with pawn loans, even though there were almost fi ve times as many pawn loans as payday export loans.
How did the size of the loans change over time?
The size of signature and payday loans stayed approximately the same throughout the time period. The relatively low ceiling for these loans limited the extent to which the sizes of these loans could vary. There was much more variation in the size of consumer installment loans. As indicated in Graph 3, the average size of a consumer installment loan has increased dramatically since 1999. The average size of pawn loans did not vary much from 2000 through 2003 and was the smallest of all of the loan types examined. The size of a pawn loan depends on the value of the property the customer has available to pledge as collateral for the loan.
Graph 3
Amount Per Loan by Type of Loan (Reported in 2003 Dollars)*
$0
$1,000
$2,000
$3,000
$4,000
$5,000
$6,000
1987
1988
1989
1990
1991
1992
1993
1994
1995
1996
1997
1998
1999
2000
2001
2002
2003
Year
Consumer Installment Signature Payday Export Payday State Rate Pawn
* Payday Export and Payday State Rate lenders were authorized to offer loans beginning in 2000. Pawn lenders were not required to submit data prior to 2000.
Do
llars

8
Year Signature
How did the number of companies with licensed locations change over time?
The number of companies engaged in consumer installment lending decreased substantially from 1999 to 2003.17 As shown in Table 2, the number of companies engaged in signature lending also decreased during that fi ve-year period. Although the number of companies reporting payday state-rate lending grew from 2000 through 2003, there were still relatively few companies making that type of loan. The number of companies offering payday loans with exported rates was also small, in contrast to the rapidly growing number of loans made. Companies engaged in consumer installment lending, signature lending, or payday lending provide a single annual report detailing combined data for all locations of the company, so it is not possible to determine whether the change in the number of companies resulted in a change in the number of locations offering those loans.
Table 2Number of Loan Companies by Type*
Consumer Payday Payday Installment Export State Rates
1999 78 440 n.a. n.a.
2000 72 450 15 4
2001 67 435 17 6
2002 76 433 20 10
2003 57 410 19 12
n.a. = not applicable*One company may have many licensed locations. Consumer installment lenders, signature lenders, and payday lenders submit one annual report per company regardless of the number of licenses.
Pawn lenders submitted separate annual reports for each licensee. Although the number of pawn loans increased steadily from 2000 through 2003, the number of licensees decreased every year during that four-year period. The number of pawn licensees is presented in Table 3.
Table 3Number of Pawn Licensees*
Year Pawn Licensees
2000 1,277
2001 1,257
2002 1,217
2003 1,204
*Pawn lenders submit one annual report per license.

9
How Were OCCC-Licensed Lending Institutions Geographically Distributed Throughout Texas?
OCCC licensees made over 15.3 million loans in 2003, and the total amount loaned was over $4.8 billion. Where were these businesses located? Are there any distinctions by population area or geographic region of the state? Were OCCC-licensed lenders located in areas not served by traditional banks? Do the locations of OCCC-licensed lenders show any relationship to the percentage of families living in poverty or to the percentage of minorities? These questions were answered by a geographic analysis of the locations of OCCC-licensed lenders. The geographic analysis also examined whether different types of OCCC-licensed lenders were located in different areas. It provides a county-level analysis of the locations of lending institutions, but an explanation of why lending institutions located where they did is outside the scope of the study.18
Different types of lending require different types of OCCC licenses, so a single business location may have more than one license.19 We defi ned “OCCC-licensed locations” (OLLs) as distinct locations with one or more OCCC licenses.20 In the spring of 2004, Texas had 3,823 OLLs and 5,246 banking facilities registered by the Federal Deposit Insurance Corporation (FDIC).21 Sixty-nine percent of Texas counties had at least one OLL, and 98 percent had at least one bank.
The geographic analysis examines differences between metropolitan counties, suburban counties, and rural counties.22 It also examines differences between border counties (the 14 counties that share a border with Mexico) and non-border counties (the other 240 Texas counties). Table 4 presents the distribution of counties, OLLs, and banks in each of these classifi cations.
Table 4Distribution of Counties, OCCC-Licensed Locations, and Banks by
Metropolitan and Border Status
Counties OLLs Banks
Count Percent Count Percent Count Percent
Statewide 254 100.00% 3,823 100.00% 5,246 100.00%
Metropolitan 27 10.63% 2,651 69.34% 3,117 59.42%Counties
Suburban 50 19.69% 480 12.56% 1,062 20.24%Counties
Rural 177 69.69% 692 18.10% 1,067 20.34%Counties
Border 14 5.51% 602 15.75% 314 5.99%Counties
Non-Border 240 94.49% 3,221 84.25% 4,932 94.01%Counties
Area

10
The geographic analysis also examines differences among counties in the location of lending institutions in relation to the percentage of minorities in each county and to the percentage of persons in each county living in poverty.23,24 The minority percentage includes everyone not classifi ed in the 2000 Census as “white, non-Hispanic,” and the percentage living in poverty includes everyone living below the 1999 federal poverty level. Data from the 2000 Census indicate that about 48 percent of Texas residents met this defi nition of minority and that about 15 percent of Texas residents were living below the federal poverty level.25
For the analysis, we fi rst correlated the proportions of different types of lending institutions with each county characteristic. The correlations were infl uenced by interrelationships between county characteristics in several ways. For example, there was a strong relationship between the percentage of the population that was minority and the percentage living in poverty. Also, border counties tended to have higher percentages of minorities and higher percentages of people living in poverty. Therefore, as a second step, we used regression analyses to control the effects of these interrelationships.26
These two types of analysis produce two different types of information. The correlations describe the relationship between each characteristic and the proportion of a type of lender with any effects of the other characteristics included. This type of information identifi es patterns that often can be seen with the naked eye. The regression detects which characteristics underlie the correlations. The results of both types of analyses are used to describe the distribution of OLLs as a whole and different types of OLLs across Texas.
What county characteristics were related to the proportion of OLLs?
To determine the characteristics that were related to the proportion of OLLs, we examined the relationship between each of the county characteristics described above (metropolitan status, border status, percent minority, and percent poverty) and the proportion of lenders that were OLLs.27 Examining the proportion of OLLs relative to the proportion of banks is appropriate because banks are also “brick and mortar” institutions offering loans. The proportion of OLLs in a county shows the density of OLLs relative to the density of banks in the county.
In the 175 counties with OLLs, the proportion of OLLs ranged from a low of about seven percent (Lamb County, with one OLL and 14 banks) to a high of almost 79 percent (Maverick County, with 26 OLLs and seven banks). The 3,823 OLLs and 5,246 banks in Texas make the statewide proportion of OLLs approximately 42 percent.
Using county-level data, we correlated the proportion of OLLs with each of the county characteristics of interest: metropolitan status (whether a county was metropolitan, suburban, or rural), border status, percent minority, and percent poverty. We also examined the combination of percent minority and percent poverty because our early investigations indicated that the combination might be more closely related to the proportion of OLLs than either minority or poverty alone.28 Of these characteristics, the minority percentage of the county was correlated most strongly with the proportion of OLLs: in counties where more of the population were minorities, more of the lenders tended to be OLLs.29 This relationship can be seen in Map 1, which shows the proportion of OLLs and the minority percentage for each county. Counties with higher percentages of both minorities and people living in poverty also tended to have higher proportions of OLLs. Metropolitan counties tended to have higher proportions of OLLs, although the correlation was not as strong as that for the combination of minority and poverty. Map 2 shows the proportion of OLLs and the metropolitan and border status for each county.

11
Counties with higher poverty percentages and border counties tended to have higher proportions of OLLs, but rural counties tended to have lower proportions of OLLs. However, the correlations for these three characteristics were not as strong as the correlations for percent minority, the combination of minority and poverty, and whether the county was metropolitan. The relationship between the proportion of OLLs and whether a county was suburban was too small to provide any useful information.30

12
Roc
kwal
l
PEC
OS
WE
BB
BR
EW
STE
R
HU
DS
PET
H
PRE
SID
IO
RE
EV
ES
CU
LB
ER
SO
N
VA
LV
ER
DE
TE
RR
EL
L
CR
OC
KE
TT
DU
VA
L
FRIO
HA
RR
IS
KE
NE
DY
BE
E
BE
LL
HIL
L
ED
WA
RD
S
POL
K
JEF
FD
AV
IS
KE
RR
CL
AY
GA
INE
S
LE
ON
CA
SS
STA
RR
UV
AL
DE
IRIO
N
WIS
E
HA
LE
UP
TO
N
BE
XA
R
SUT
TO
N
JAC
K
KIN
G
KIN
NE
Y
DA
LL
AM
DIM
MIT
LA
MB
RU
SK
HID
AL
GO
EL
LIS
LE
E
OL
DH
AM
CO
KE
HA
LL
KE
NT
ME
DIN
A
GR
AY
ER
AT
H
KIM
BL
E
LY
NN
LA
SA
LL
E
HU
NT
ZA
VA
LA
HA
RT
LE
Y
BR
AZ
OR
IA
JON
ES
SMIT
H
AN
DR
EW
S
NU
EC
ES
FLO
YD
KN
OX
MIL
AM
TY
LE
R
LL
AN
O
TR
AV
IS
RE
AG
AN
BO
WIE
LIB
ER
TY
JASP
ER
EC
TO
R
WA
RD
TE
RR
Y
ZA
PA
TA
RE
AL
TO
MG
RE
EN
FIS
HE
R
CO
OK
E
NO
LA
N
GA
RZ
A
CO
LE
MA
N
HO
US
TO
N
LA
MA
R
MA
SON
YO
UN
G
CA
ME
RO
N
BR
OW
N
BU
RN
ET
MO
OR
E
FAL
LS
DE
AF
SM
ITH
EL
PA
SO
BO
SQ
UE
MIL
LS
HA
YS
MA
TA
GO
RD
A
POT
TE
R
MA
VE
RIC
K
CO
LL
IN
JIM
HO
GG
FAN
NIN
MO
TL
EY
KL
EB
ER
G
CO
TT
LE
CO
NC
HO
AT
AS
CO
SA
BR
OO
KS
DE
NT
ON
LA
VA
CA
MA
RT
IN
CR
AN
E
SAN
SA
BA
PAR
KE
R
HA
RD
IN
DA
LL
AS
LIV
EO
AK
RU
NN
EL
S
CO
RY
EL
L
CA
RS
ON
CA
ST
RO
AR
CH
ER
DO
NL
EY
SCU
RR
Y
TA
YL
OR
BA
ILE
Y
CR
OS
BY
GO
LIA
D
WO
OD
DE
WIT
T
BO
RD
EN
NA
VA
RR
O
BA
YL
OR
NE
WT
ON
FAY
ET
TE
PAR
ME
R
GIL
LE
SPIE
SHE
LB
Y
WH
AR
TO
N
BR
ISC
OE
SCH
LE
ICH
ER
GR
IME
S
CA
LH
OU
N
FOA
RD
DIC
KE
NS
WIL
SO
N
ME
NA
RD
RO
BE
RT
S
JEF
FE
RSO
N
SWIS
HE
R
DA
WSO
N
GR
AY
SO
N
GO
NZ
AL
ES
PAN
OL
A
RE
DR
IVE
R
HO
WA
RD
MC
MU
LL
EN
HA
SKE
LL
CH
ER
OK
EE
BA
ST
RO
P
AN
DE
RS
ON
RA
ND
AL
L
WH
EE
LE
R
STE
RL
ING
MID
LA
ND
JAC
KS
ON
HO
CK
LE
Y
SHE
RM
AN
TA
RR
AN
T
RE
FUG
IO
LU
BB
OC
K
KA
RN
ES
LIP
SC
OM
B
WA
LK
ER
MC
LE
NN
AN
STE
PHE
NS
VIC
TO
RIA
HO
PKIN
S
WIN
KL
ER
HE
MPH
ILL
MIT
CH
EL
L
HA
RR
ISO
N
AU
STIN
TR
INIT
Y
YO
AK
UM
EA
ST
LA
ND
LO
VIN
G
WIL
LIA
MS
ON
CO
LO
RA
DO
BL
AN
CO
HA
NS
FOR
D
WIL
LA
CY
MC
CU
LL
OC
H
PAL
OP
INT
O JIM
WE
LL
S
AN
GE
LIN
A
OC
HIL
TR
EE
CO
MA
NC
HE
BA
ND
ER
A
WIL
BA
RG
ER
LIM
EST
ON
E
MO
NT
AG
UE
CA
LL
AH
AN
JOH
NSO
N
FOR
TB
EN
D
SAB
INE
KA
UF
MA
N
CO
MA
L
CO
CH
RA
N
CH
AM
BE
RS
FRE
EST
ON
EH
AM
ILT
ON
HE
ND
ER
SON
GL
AS
SCO
CK
HO
OD
STO
NE
WA
LL
TIT
US
UP
SHU
R
BR
AZ
OS
VA
NZ
AN
DT M
ON
TG
OM
ER
Y
WIC
HIT
A
AR
MST
RO
NG
GA
LV
EST
ON
RO
BE
RT
SO
N
KE
ND
AL
L
HU
TC
HIN
SO
N
LA
MPA
SA
S
CH
ILD
RE
SS
NA
CO
GD
OC
HE
S
BU
RL
ES
ON
SHA
CK
EL
FO
RD
WA
LL
ER
HA
RD
EM
AN
GU
AD
AL
UP
E
AR
AN
SA
S
TH
RO
CK
MO
RT
ON
CO
LL
ING
SWO
RT
H
MA
RIO
N
SAN
PA
TR
ICIO
MA
DIS
ON
CA
LD
WE
LL
SAN
JAC
INT
O
WA
SH
ING
TO
NO
RA
NG
E
RA
INSD
EL
TA
GR
EG
G
SAN
AU
GU
STIN
E
CA
MP
MO
RR
ISFR
AN
KL
IN
SOM
ER
VE
LL
Tex
asL
egis
lati
veC
ounc
il,2/
4/20
05,5
r247
Map
1L
end
ers
and
Min
orit
yP
erce
ntag
eby
Cou
nty
Sour
ce:
U.S
.Cen
sus
Bur
eau,
OC
CC
,FD
IC
Pro
port
ion
ofL
ende
rs
Ban
ks
OC
CC
-Lic
ense
dL
ocat
ions
Per
cent
Min
orit
y
51-
75%
76-
100%
26-
50%
0-
25%

13
Roc
kwal
l
PEC
OS
WE
BB
BR
EW
STE
R
HU
DS
PET
H
PRE
SID
IO
RE
EV
ES
CU
LB
ER
SO
N
VA
LV
ER
DE
TE
RR
EL
L
CR
OC
KE
TT
DU
VA
L
FRIO
HA
RR
IS
KE
NE
DY
BE
EBE
LL
HIL
L
ED
WA
RD
S
POL
K
JEF
FD
AV
IS
KE
RR
CL
AY
GA
INE
S
LE
ON
CA
SS
STA
RR
UV
AL
DE
IRIO
N
WIS
E
HA
LE
UP
TO
N
BE
XA
R
SUT
TO
N
JAC
K
KIN
G
KIN
NE
Y
DA
LL
AM
DIM
MIT
LA
MB
RU
SK
HID
AL
GO
EL
LIS
LE
E
OL
DH
AM
CO
KE
HA
LL
KE
NT
ME
DIN
A
GR
AY
ER
AT
H
KIM
BL
E
LY
NN
LA
SA
LL
E
HU
NT
ZA
VA
LA
HA
RT
LE
Y
BR
AZ
OR
IA
JON
ES
SMIT
H
AN
DR
EW
S
NU
EC
ES
FLO
YD
KN
OX
MIL
AM
TY
LE
R
LL
AN
O
TR
AV
IS
RE
AG
AN
BO
WIE
LIB
ER
TY
JASP
ER
EC
TO
R
WA
RD
TE
RR
Y
ZA
PA
TA
RE
AL
TO
MG
RE
EN
FIS
HE
R
CO
OK
E
NO
LA
N
GA
RZ
A
CO
LE
MA
N
HO
US
TO
N
LA
MA
R
MA
SON
YO
UN
G
CA
ME
RO
N
BR
OW
N
BU
RN
ET
MO
OR
E
FAL
LS
DE
AF
SM
ITH
EL
PA
SO
BO
SQ
UE
MIL
LS
HA
YS
MA
TA
GO
RD
A
POT
TE
R
MA
VE
RIC
K
CO
LL
IN
JIM
HO
GG
FAN
NIN
MO
TL
EY
KL
EB
ER
G
CO
TT
LE
CO
NC
HO
AT
AS
CO
SA
BR
OO
KS
DE
NT
ON
LA
VA
CA
MA
RT
IN
CR
AN
E
SAN
SA
BA
PAR
KE
R
HA
RD
IN
DA
LL
AS
LIV
EO
AK
RU
NN
EL
S
CO
RY
EL
L
CA
RS
ON
CA
ST
RO
AR
CH
ER
DO
NL
EY
SCU
RR
Y
TA
YL
OR
BA
ILE
Y
CR
OS
BY
GO
LIA
D
WO
OD
DE
WIT
T
BO
RD
EN
NA
VA
RR
O
BA
YL
OR
NE
WT
ON
FAY
ET
TE
PAR
ME
R
GIL
LE
SPIE
SHE
LB
Y
WH
AR
TO
N
BR
ISC
OE
SCH
LE
ICH
ER
GR
IME
S
CA
LH
OU
N
FOA
RD
DIC
KE
NS
WIL
SO
N
ME
NA
RD
RO
BE
RT
S
JEF
FE
RSO
N
SWIS
HE
R
DA
WSO
N
GR
AY
SO
N
GO
NZ
AL
ES
PAN
OL
A
RE
DR
IVE
R
HO
WA
RD
MC
MU
LL
EN
HA
SKE
LL
CH
ER
OK
EE
BA
ST
RO
P
AN
DE
RS
ON
RA
ND
AL
L
WH
EE
LE
R
STE
RL
ING
MID
LA
ND
JAC
KS
ON
HO
CK
LE
Y
SHE
RM
AN
TA
RR
AN
T
RE
FUG
IO
LU
BB
OC
K
KA
RN
ES
LIP
SC
OM
B
WA
LK
ER
MC
LE
NN
AN
STE
PHE
NS
VIC
TO
RIA
HO
PKIN
S
WIN
KL
ER
HE
MP
HIL
L
MIT
CH
EL
L
HA
RR
ISO
N
AU
STIN
TR
INIT
Y
YO
AK
UM
EA
ST
LA
ND
LO
VIN
G
WIL
LIA
MS
ON
CO
LO
RA
DO
BL
AN
CO
HA
NS
FOR
D
WIL
LA
CY
MC
CU
LL
OC
H
PAL
OP
INT
O JIM
WE
LL
S
AN
GE
LIN
A
OC
HIL
TR
EE
CO
MA
NC
HE
BA
ND
ER
A
WIL
BA
RG
ER
LIM
EST
ON
E
MO
NT
AG
UE
CA
LL
AH
AN
JOH
NSO
N
FOR
TB
EN
D
SAB
INE
KA
UF
MA
N
CO
MA
L
CO
CH
RA
N
CH
AM
BE
RS
FRE
EST
ON
EH
AM
ILT
ON
HE
ND
ER
SON
GL
AS
SCO
CK
HO
OD
STO
NE
WA
LL
TIT
US
UP
SHU
R
BR
AZ
OS
VA
NZ
AN
DT MO
NT
GO
ME
RY
WIC
HIT
A
AR
MST
RO
NG
GA
LV
EST
ON
RO
BE
RT
SO
N
KE
ND
AL
L
HU
TC
HIN
SO
N
LA
MP
AS
AS
CH
ILD
RE
SS
NA
CO
GD
OC
HE
S
BU
RL
ES
ON
SHA
CK
EL
FO
RD
WA
LL
ER
HA
RD
EM
AN
GU
AD
AL
UP
E
AR
AN
SA
S
TH
RO
CK
MO
RT
ON
CO
LL
ING
SWO
RT
H
MA
RIO
N
SAN
PA
TR
ICIO
MA
DIS
ON
CA
LD
WE
LL
SAN
JAC
INT
O
WA
SH
ING
TO
NO
RA
NG
E
RA
INSD
EL
TA
GR
EG
G
SAN
AU
GU
STIN
E
CA
MP
MO
RR
IS
FRA
NK
LIN
SOM
ER
VE
LL
Tex
asL
egis
lati
veC
ounc
il,2/
4/20
05,5
r247
Map
2L
end
ers
wit
hM
etro
polit
anan
dB
orde
rS
tatu
sby
Cou
nty
Sour
ce:
U.S
.Cen
sus
Bur
eau,
Tex
asS
tate
Dem
ogra
pher
,OC
CC
,FD
IC
Pro
port
ion
ofL
ende
rs
OC
CC
-Lic
ense
dL
ocat
ions
Ban
ks
Met
ropo
litan
-Bor
der
Stat
us
Met
ropo
litan
Subu
rban
Rur
al
Bor
der
Reg
ion
Map
2L
ende
rs a
ndM
etro
poli
tan
and
Bor
der
Stat
usby
Cou
nty

14
The regression results were consistent with the correlations that indicated that the percentage of the county population that was minority had the strongest relationship to the proportion of OLLs. Regression results also indicated that metropolitan counties were more likely than other counties to have a higher proportion of OLLs. The other characteristics were not as important when isolated in this manner, indicating that the correlations between those characteristics and the proportion of OLLs were likely due to underlying relationships with the proportion of minorities and whether the county was metropolitan.
What county characteristics were related to the proportion of each type of OCCC-licensed lender?
To determine the characteristics that were related to the proportion of lending institutions in a county that were a specifi c type of OLL, we divided OLLs into mutually-exclusive categories based on their type of lending.31 Separate categories were developed for lenders with more than one type of license. We computed the proportion of each category of lender in each county (e.g., the proportion of lenders that were consumer installment lenders) in the same manner that we computed the proportion of OLLs as a whole.32
As indicated in Table 5, there were more signature lenders than any other type of OLL. Although the statewide proportion of signature lenders was about 17 percent, the proportion in an individual county was as high as 70 percent (Dimmit County). About 13 percent of lenders statewide were pawn lenders, including the “pawn,” “pawn and payday export,” and “pawn and other” categories. The proportion reached 25 percent in three counties.33 The number of payday export lenders was large, considering that this type of lending was not available in Texas until 2000. Nueces County, with about 18 percent, had the highest proportion of payday export lenders. Including the 12 “pawn and payday export” lenders, about 25 percent of lenders in Nueces County were payday export lenders.34

15
Table 5Number of Lenders and Proportions by Type of Lender
Number of Counties with No Lenders of This Type
Consumer 344 3.79% 13.33% 187Installment (Matagorda)
Signature 1,501 16.55% 70.00% 93 (Dimmit)
Payday 759 8.37% 17.88% 178Export (Nueces)
Payday 9 0.10% 1.47% 248State Rate (Taylor)
Pawn 794 8.76% 25.00% 123 (Somervell, Trinity, and Newton)
Pawn and 389 4.29% 193PaydayExport
Pawn and 27** 0.30% 10.00% 234Other (Chambers)
Banks 5,246 57.85% 100.00% 4 (79 counties)
Total 9,069 100.00% n.a. n.a.n.a. = not applicable* Percentages do not add to 100.00% due to rounding error.** Includes one “pawn and consumer installment,” 12 “pawn and signature,” and 14 “pawn and payday state rate.”
Five of the mutually-exclusive categories included enough lenders for analysis: consumer installment, signature, payday export, pawn, and pawn and payday export. Each of the following questions is about the relationship between the county characteristics (whether the county was metropolitan, suburban, or rural; border status; percent minority; percent poverty; and the combination of minority and poverty) and the proportion of one of these fi ve types of lenders. Two maps are provided to illustrate the discussion: Map 3 shows the proportion of each type of lender by the county’s metropolitan and border status. Map 4 shows the proportion of each type of lender by the county’s minority percentage.
Number of Proportion of HighestLenders Lenders ProportionStatewide Statewide* (County)
Type ofLender
12.50%(Brooks)

16
PEC
OS
WE
BB
BR
EW
STE
R
HU
DSP
ETH
PRES
IDIO
RE
EVE
S
CU
LB
ER
SON
VA
LV
ER
DE
TER
REL
L
CR
OC
KET
T
DU
VA
L
FRIO
HA
RR
IS
KEN
ED
Y
BE
EBE
LL
HIL
L
EDW
AR
DS
POLK
JEFF
DA
VIS
KER
R
CL
AY
GA
INES
LEO
N
CA
SS
STA
RR
UV
ALD
E
IRIO
N
WIS
E
HA
LE
UPT
ON
BE
XA
R
SUTT
ON
JAC
K
KIN
G
KIN
NEY
DA
LLA
M
DIM
MIT
LAM
B
RU
SK
HID
ALG
O
ELLI
S
LEE
OLD
HA
M
CO
KE
HA
LL
KEN
T
MED
INA
GR
AY
ERA
TH
KIM
BL
E
LYN
N
LASA
LL
E
HU
NT
ZAV
AL
A
HA
RT
LEY
BR
AZ
OR
IA
JON
ES
SMIT
H
AN
DR
EW
S
NU
ECES
FLO
YD
KN
OX
MIL
AM
TYL
ERLL
AN
O
TRA
VIS
RE
AG
AN
BO
WIE
LIB
ERTY
JASP
ER
ECTO
R
WA
RD
TER
RY
ZAPA
TA
RE
AL
TOM
GR
EEN
FISH
ER
CO
OK
E
NO
LAN
GA
RZ
A
CO
LEM
AN
HO
UST
ON
LAM
AR
MA
SON
YO
UN
G
CA
ME
RO
N
BR
OW
N
BU
RN
ET
MO
OR
E
FALL
S
DEA
FSM
ITH
ELPA
SOB
OSQ
UE
MIL
LS
HA
YS
MA
TAG
OR
DA
POTT
ER
MA
VER
ICK
CO
LLI
N
JIM
HO
GG
FAN
NIN
MO
TLE
Y
KLE
BE
RG
CO
TTL
E
CO
NC
HO
ATA
SCO
SA
BR
OO
KS
DEN
TO
N
LAV
AC
A
MA
RT
IN
CR
AN
E
SAN
SAB
A
PAR
KE
R
HA
RD
IN
DA
LLA
S
LIV
EO
AK
RU
NN
ELS
CO
RY
EL
L
CA
RSO
N
CA
STR
O
AR
CH
ER
DO
NLE
Y
SCU
RR
Y
TAY
LO
R
BA
ILEY
CR
OSB
Y
GO
LIA
D
WO
OD
DE
WIT
T
BO
RD
EN
NA
VA
RR
O
BA
YL
OR
NEW
TO
N
FAY
ETTE
PAR
ME
R
GIL
LE
SPIE
SHEL
BY
WH
AR
TON
BR
ISC
OE
SCH
LEI
CH
ER
GR
IME
S
CA
LH
OU
N
FOA
RD
DIC
KE
NS
WIL
SON
MEN
AR
D
RO
BE
RT
S
JEFF
ER
SON
SWIS
HE
R
DA
WSO
N
GR
AY
SON
GO
NZA
LE
S
PAN
OLA
RE
DR
IVE
R
HO
WA
RD
MC
MU
LLE
N
HA
SKEL
L
CH
ER
OK
EE
BA
STR
OP
AN
DER
SON
RA
ND
AL
L
WH
EE
LER
STE
RL
ING
MID
LAN
D
JAC
KSO
N
HO
CK
LEY
SHER
MA
N
TAR
RA
NT R
EFU
GIO
LUB
BO
CK
KA
RN
ES
LIPS
CO
MB
WA
LK
ER
MC
LEN
NA
N
STE
PHEN
S
VIC
TO
RIA
HO
PKIN
S
WIN
KLE
R
HEM
PHIL
L
MIT
CH
ELL
HA
RR
ISO
N
AU
STIN
TRIN
ITY
YO
AK
UM
EAST
LAN
D
LOV
ING
WIL
LIA
MSO
N
CO
LO
RA
DO
BL
AN
CO
HA
NSF
OR
D
WIL
LA
CY
MC
CU
LL
OC
H
PALO
PIN
TO
JIM
WEL
LS
AN
GEL
INA
OC
HIL
TREE
CO
MA
NC
HE
BA
ND
ER
A
WIL
BA
RG
ER
LIM
EST
ON
E
MO
NTA
GU
E
CA
LLA
HA
N
JOH
NSO
N
FOR
TB
EN
D
SAB
INE
KA
UFM
AN
CO
MA
L
CO
CH
RA
N
CH
AM
BE
RS
FREE
STO
NE
HA
MIL
TON
HEN
DE
RSO
N
GLA
SSC
OC
K
HO
OD
STO
NE
WA
LL
TIT
US
UPS
HU
R
BR
AZ
OS
VA
NZA
ND
T
MO
NTG
OM
ERY
WIC
HIT
A
AR
MST
RO
NG
GA
LVE
STO
N
RO
BE
RT
SON
KEN
DA
LL
HU
TCH
INSO
N
LAM
PASA
S
CH
ILD
RE
SS
NA
CO
GD
OC
HE
S
BU
RL
ESO
N
SHA
CK
ELF
OR
D
WA
LL
ER
HA
RD
EM
AN
GU
AD
ALU
PE
AR
AN
SAS
THR
OC
KM
OR
TO
N
CO
LLI
NG
SWO
RTH
MA
RIO
N
SAN
PATR
ICIO
MA
DIS
ON
CA
LD
WE
LL
SAN
JAC
INT
O
WA
SHIN
GTO
NO
RA
NG
E
RA
INS
DEL
TA
GR
EG
G
SAN
AU
GU
STIN
E
CA
MP
MO
RR
ISFR
AN
KL
IN
SOM
ERV
ELL
RO
CK
WA
LL
Map
3O
CC
C-L
icen
sed
Len
ders
wit
hM
etro
pol
itan
and
Bor
der
Stat
usby
Cou
nty
Tex
asL
egis
lativ
eC
ounc
il,2/
3/20
05,5
r247
Sour
ce:U
.S.C
ensu
sB
urea
u,T
exas
Stat
eD
emog
raph
er,O
CC
C
Pro
por
tion
ofE
ach
Typ
eof
Len
der
Paw
nL
ende
rs
Sign
atur
eL
ende
rs
Con
sum
erIn
stal
lmen
tLen
ders
Payd
ayL
ende
rsw
ithE
xpor
ted
Rat
es
Lic
ense
esw
ithB
oth
Paw
nan
dPa
yday
Exp
ortL
endi
ng
Met
ropo
litan
-Bor
der
Stat
us
Met
ropo
litan
Subu
rban
Rur
al
Bor
der
Reg
ion
Map
3O
CC
C-L
icen
sed
Len
ders
and
Met
ropo
lita
n an
d B
orde
r St
atus
by C
ount
y

17
PEC
OS
WE
BB
BR
EW
STE
R
HU
DS
PET
H
PRE
SID
IO
RE
EV
ES
CU
LB
ER
SO
N
VA
LV
ER
DE
TE
RR
EL
L
CR
OC
KE
TT
DU
VA
L
FRIO
HA
RR
IS
KE
NE
DY
BE
EBE
LL
HIL
L
ED
WA
RD
S
POL
KJE
FF
DA
VIS
KE
RR
CL
AY
GA
INE
S
LE
ON
CA
SS
STA
RR
UV
AL
DE
IRIO
N
WIS
E
HA
LE
UP
TO
N
BE
XA
R
SUT
TO
N
JAC
K
KIN
G
KIN
NE
Y
DA
LL
AM
DIM
MIT
LA
MB
RU
SK
HID
AL
GO
EL
LIS
LE
E
OL
DH
AM
CO
KE
HA
LL
KE
NT
ME
DIN
A
GR
AY
ER
AT
H
KIM
BL
E
LY
NN
LA
SA
LL
E
HU
NT
ZA
VA
LA
HA
RT
LE
Y
BR
AZ
OR
IA
JON
ES
SMIT
H
AN
DR
EW
S
NU
EC
ES
FLO
YD
KN
OX
MIL
AM
TY
LE
R
LL
AN
O
TR
AV
IS
RE
AG
AN
BO
WIE
LIB
ER
TY
JASP
ER
EC
TO
R
WA
RD
TE
RR
Y
ZA
PA
TA
RE
AL
TO
MG
RE
EN
FIS
HE
R
CO
OK
E
NO
LA
N
GA
RZ
A
CO
LE
MA
N
HO
US
TO
N
LA
MA
R
MA
SON
YO
UN
G
CA
ME
RO
N
BR
OW
N
BU
RN
ET
MO
OR
E
FAL
LS
DE
AF
SM
ITH
EL
PA
SO
BO
SQ
UE
MIL
LS
HA
YS
MA
TA
GO
RD
A
POT
TE
R
MA
VE
RIC
K
CO
LL
IN
JIM
HO
GG
FAN
NIN
MO
TL
EY
KL
EB
ER
G
CO
TT
LE
CO
NC
HO
AT
AS
CO
SA
BR
OO
KS
DE
NT
ON
LA
VA
CA
MA
RT
IN
CR
AN
E
SAN
SA
BA
PAR
KE
R
HA
RD
IN
DA
LL
AS
LIV
EO
AK
RU
NN
EL
S
CO
RY
EL
L
CA
RS
ON
CA
ST
RO
AR
CH
ER
DO
NL
EY
SCU
RR
Y
TA
YL
OR
BA
ILE
Y
CR
OS
BY
GO
LIA
D
WO
OD
DE
WIT
T
BO
RD
EN
NA
VA
RR
O
BA
YL
OR
NE
WT
ON
FAY
ET
TE
PAR
ME
R
GIL
LE
SPIE
SHE
LB
Y
WH
AR
TO
N
BR
ISC
OE
SCH
LE
ICH
ER
GR
IME
S
CA
LH
OU
N
FOA
RD
DIC
KE
NS
WIL
SO
N
ME
NA
RD
RO
BE
RT
S
JEF
FE
RSO
N
SWIS
HE
R
DA
WSO
N
GR
AY
SO
N
GO
NZ
AL
ES
PAN
OL
A
RE
DR
IVE
R
HO
WA
RD
MC
MU
LL
EN
HA
SKE
LL
CH
ER
OK
EE
BA
ST
RO
P
AN
DE
RS
ON
RA
ND
AL
L
WH
EE
LE
R
STE
RL
ING
MID
LA
ND
JAC
KS
ON
HO
CK
LE
Y
SHE
RM
AN
TA
RR
AN
T RE
FUG
IO
LU
BB
OC
K
KA
RN
ES
LIP
SC
OM
B
WA
LK
ER
MC
LE
NN
AN
STE
PHE
NS
VIC
TO
RIA
HO
PKIN
S
WIN
KL
ER
HE
MP
HIL
L
MIT
CH
EL
L
HA
RR
ISO
N
AU
STIN
TR
INIT
Y
YO
AK
UM
EA
ST
LA
ND
LO
VIN
G
WIL
LIA
MS
ON
CO
LO
RA
DO
BL
AN
CO
HA
NS
FOR
D
WIL
LA
CY
MC
CU
LL
OC
H
PAL
OP
INT
O
JIM
WE
LL
S
AN
GE
LIN
A
OC
HIL
TR
EE
CO
MA
NC
HE
BA
ND
ER
A
WIL
BA
RG
ER
LIM
EST
ON
E
MO
NT
AG
UE
CA
LL
AH
AN
JOH
NSO
N
FOR
TB
EN
D
SAB
INE
KA
UF
MA
N
CO
MA
L
CO
CH
RA
N
CH
AM
BE
RS
FRE
EST
ON
EH
AM
ILT
ON
HE
ND
ER
SON
GL
AS
SCO
CK
HO
OD
STO
NE
WA
LL
TIT
US
UP
SHU
R
BR
AZ
OS
VA
NZ
AN
DT
MO
NT
GO
ME
RY
WIC
HIT
A
AR
MST
RO
NG
GA
LV
EST
ON
RO
BE
RT
SO
N
KE
ND
AL
L
HU
TC
HIN
SO
N
LA
MP
AS
AS
CH
ILD
RE
SS
NA
CO
GD
OC
HE
S
BU
RL
ES
ON
SHA
CK
EL
FO
RD
WA
LL
ER
HA
RD
EM
AN
GU
AD
AL
UP
E
AR
AN
SA
S
TH
RO
CK
MO
RT
ON
CO
LL
ING
SWO
RT
H
MA
RIO
N
SAN
PA
TR
ICIO
MA
DIS
ON
CA
LD
WE
LL
SAN
JAC
INT
O
WA
SH
ING
TO
NO
RA
NG
E
RA
INS
DE
LT
A
GR
EG
G
SAN
AU
GU
STIN
E
CA
MP
MO
RR
ISFR
AN
KL
IN
SOM
ER
VE
LL
RO
CK
WA
LLM
ap4
OC
CC
-Lic
ense
dL
end
ers
and
Min
orit
yP
erce
ntag
eby
Cou
nty
Tex
asL
egis
lati
veC
ounc
il,2/
3/20
05,5
r247
Sour
ce:U
.S.C
ensu
sB
urea
u,O
CC
C
Pro
port
ion
ofE
ach
Typ
eof
Len
der
Sign
atur
eL
ende
rs
Con
sum
erIn
stal
lmen
tLen
ders
Paw
nL
ende
rs
Payd
ayL
ende
rsw
ithE
xpor
ted
Rat
es
Lic
ense
esw
ithB
oth
Paw
nan
dPa
yday
Exp
ortL
endi
ng
Per
cent
Min
orit
y
51-
75%
76-
100%
26-
50%
0-
25%

18
What county characteristics were related to the proportion of consumer installment lenders?
Only two of the county characteristics included in the geographic analysis showed a relationship to the proportion of consumer installment lenders: whether the county was suburban and whether the county was on the Texas-Mexico border. Suburban counties tended to have lower proportions of consumer installment lenders, while border counties tended to have higher proportions of consumer installment lenders. Regression analyses indicated that while suburban counties tended to have lower proportions of consumer installment lenders than rural counties, it was not an especially strong relationship. However, no other characteristic included in the regression analysis had as strong a relationship to the proportion of consumer installment lenders.
What county characteristics were related to the proportion of signature lenders?
There was a relatively strong correlation between a county’s minority percentage and the proportion of signature lenders: in counties where more of the population were minorities, more of the lenders tended to be signature lenders. The combination of minority population and poverty population showed a relatively strong relationship to the proportion of signature lenders, as did the proportion of the county living in poverty. Also, border counties tended to have a higher proportion of signature lenders than non-border counties. However, the proportion of signature lenders in a county was not related to whether the county was metropolitan, suburban, or rural. In the regression analyses, only the county’s minority percentage showed a relatively strong relationship to the proportion of signature lenders. The correlations with the other characteristics appear to have resulted primarily from relationships between those characteristics and the county’s minority percentage.
What county characteristics were related to the proportion of payday export lenders?
Only one of the county characteristics included in the geographic analysis showed a relationship to the proportion of payday export lenders: metropolitan counties tended to have a higher proportion of payday export lenders, although the relationship was relatively weak. The regression analyses also indicated that the relationship was not very strong, but none of the other county characteristics included in the geographic analysis had a stronger relationship to the proportion of payday export lenders.
What county characteristics were related to the proportion of pawn lenders?
Three of the county characteristics showed a relationship to the proportion of pawn lenders in a county: the county’s percentage of minority population, the county’s percentage of population in poverty, and the combination of minority population and poverty population. In contrast to the fi ndings for the other types of lenders, high levels of these characteristics were associated with smaller proportions of pawn lenders. For example, in counties where more of the population was minority, fewer of the lenders tended to be pawn lenders. Metropolitan status and border status did not have an important relationship to the proportion of pawn lenders. The regression analyses indicated that a county’s minority percentage was relatively strongly related to the proportion of pawn lenders, and none of the other county characteristics included in the geographic analysis was as strongly related.

19
What county characteristics were related to the proportion of lenders licensed to make both pawn and payday export loans?
Locations of lenders licensed to make both pawn and payday export loans showed a relationship to the combination of minority and poverty, the county’s poverty percentage, and the county’s minority percentage: as those characteristics increased in a county, the county tended to have more businesses licensed to make both pawn and payday export loans. This is the opposite of the relationships for lenders licensed to make only pawn loans. Border counties tended to have a higher proportion of lenders that were licensed to provide both pawn and payday export loans, but suburban counties tended to have a smaller proportion of this type of lender. Regression results indicated that the proportion of lenders licensed to provide both pawn and payday loans was higher in counties with higher proportions of minorities and in border counties and lower in suburban counties than in rural counties.
Overall, what county characteristics were most closely related to the proportions of lenders?
The regression fi ndings indicated that as the percentage of minorities in a county increased, the county tended to have a higher proportion of OLLs. Among the fi ve types of OLLs examined for this analysis, the proportion of signature lenders was most closely related to the percentage of minorities. In contrast, the proportion of pawn lenders tended to decrease as the percentage of minorities increased. The geographic analysis also indicated that the proportion of “pawn and payday export” lenders had a very different relationship to the county characteristics than the proportion of pawn lenders or the proportion of payday export lenders.

21
What Were the Characteristics of Loans That Texas Consumers Received From OCCC Licensees?
The OCCC licensees made over 15 million loans in 2003. What types of loan were most common? What documentation were applicants required to provide to obtain a loan? What were the terms of an average loan? What proportion of loans were used to pay off a previous loan? Did many of the loans incur late charges? These questions were answered using data from a sample of loans made by OCCC licensees.
The OCCC examiners collected data from a sample of licensees in accordance with a survey designed by the TLC.35 Survey results represent consumer installment, signature, payday, and pawn loans made by OCCC licensees from January 1, 2003, through June 30, 2003. Payday loans with state rates are included in the data reported for all loans (labeled “all types”), but results for this group are not reported separately because the sample of these loans was too small.
What types of loan were most common?
Survey results indicated that almost 60 percent of all loans made by the sampled OCCC licensees were pawn loans and that over 25 percent were signature loans. As shown in Table 6, over 13 percent of all loans were payday loans with exported rates, which were not introduced until 2000.
Table 6Percentage of Loans by Loan Type (January 1, 2003 - June 30, 2003)
Loan Type Percent
Consumer Installment 1.39%
Signature 27.12%
Payday Export 13.63%
Payday State Rates 0.16%
Pawn 57.70%
All Types 100.00%
What types of documentation were loan applicants required to provide?
As shown in Table 7, a government-issued picture ID was required for most loans. For pawn loans, that was typically the only documentation required. Other types of loan generally required a completed loan application, and most required applicants to submit proof of their income. Applicants obtaining payday export loans were typically required to provide a bank account statement and were often required to leave the lender a completed personal check in the amount of the loan plus interest and fees.36

22
Signature Pawn
Table 7Documentation Required of Applicants by Loan Type
Documentation All Consumer PaydayRequired Types Installment Export
Driver’s license orother government- 99.81% 98.44% 99.39% 100.00% 100.00%issued picture ID
Proof of income 39.25% 65.92% 91.56% 97.92% 0.00%
Completed loanapplication
Rent statement or utility bill withapplicant’s currenthome address
Bank accountstatement
Current telephone bill 12.58% 2.85% 9.29% 72.76% 0.00%
Completedpersonal check
Social securitycard or number
References 7.84% 0.48% 17.69% 21.86% 0.00%
Other document(s) 1.60% 10.79% 1.96% 6.67% 0.00%
Average number ofrequired documents
Percentage of loansthat were from lenderswhere everyone whoqualifi ed for a loanreceived the same rateregardless of theirqualifi cations
* Many consumer installment loan applications already include the consumer’s social security number; therefore, this information would not have been collected separately.
14.67% 8.23% 6.48% 92.77% 0.00%
38.96% 96.36% 90.03% 95.76% 0.00%
28.24% 18.46% 77.67% 49.61% 0.00%
11.28% 0.00% 1.35% 78.93% 0.00%
8.51% 3.02%* 26.97% 8.46% 0.00%
2.63 3.05 4.22 6.25 1.00
99.15% 53.08% 99.91% 100.00% 99.70%

23
On average, an applicant for a payday export loan was required to present six types of documentation to qualify for a loan. Applicants for signature loans were asked to present less documentation, although payday export loans were often secured with a personal check and signature loans typically were unsecured.
The level of documentation required for loans is not necessarily correlated to the level of underwriting associated with the loan. For example, although payday export loans had the highest number of documents required at 6.25, OCCC staff indicated that payday loans typically had one of the shortest underwriting processes.37 For all types of loans except consumer installment, customers who qualifi ed for the loan typically received the same rate regardless of their qualifi cations.
Did the lenders conduct credit checks?
With the exception of pawn loans, credit checks were typically part of the lending process. As indicated in Table 8, the type of credit check used would often depend on the type of loan. For consumer installment loans, at least one of the three primary credit rating companies (Equifax, Experian, and TransUnion) was consulted. For signature loans, one of the three primary credit rating companies was typically consulted and other creditors were more likely to be contacted for verifi cation than for the other types of loans. For payday export loans, Tele-Track was the most common form of credit check. Customers with better credit were likely to receive a better rate for consumer installment loans, but not for other types of loans.
Table 8Use of Credit Checks by Loan Type
Consumer Payday Installment ExportPercentage of loans thatwere from lenders using 40.73% 100.00% 99.44% 90.28% 0.00%credit checks
Of loans from lendersusing credit checks,percentage where lender
Used Tele-Track 26.77% 0.00% 0.00% 88.25% n.a.
Used Equifax, Experian, 72.62% 100.00% 99.32% 11.75% n.a.or TransUnion
Directly contacted 26.66% 6.07% 39.95% 0.00% n.a.other creditors
Used other types 1.30% 0.00% 1.65% 0.00% n.a.of credit check
Offered more favorableloan rates to customers 5.30% 87.52% 3.58% 0.05% n.a.with better credit
n.a. = not applicable
Signature PawnOverallCredit Check Use

24
What percentage of loan applications was denied?
Table 9 shows that the odds of a loan application being denied were different for different types of loan. The percentage of denied loan applications was calculated by dividing the number of denied loan applications by the total number of loans made plus the number of denied loan applications. The total number of loans made includes new loans and renewed loans. Because signature loans have a high renewal rate, the percentage of denied signature loans was reduced by including renewed loans in the denominator, resulting in a lower denial rate than some would expect. For new applications alone, the denial rate would have been higher.
Table 9Denied Loan Applications by Loan Type
Loan Type PercentConsumer Installment 63.75%
Signature 9.18%
Payday Export 8.07%
Pawn n.a.
All Types 10.58%
n.a. = not applicable
Some licensees denied a much larger proportion of applications than other licensees providing the same type of loan. The percentage of denied applications does not correspond to the percentage of customers turned away without loans because a customer may apply for a loan and have his or her application denied, then repeat the process several times before the application is accepted.
What were the terms of the loans?
Many of the differences in loan terms refl ected statutory differences among the types of loan. Consumer installment loans typically were larger loans with longer terms and lower APRs than the other types of loans included in this analysis. Pawn loans tended to be smaller loans. Signature loans had lower APRs and longer lengths than payday export loans, although the amount fi nanced with those two types of loans was very similar. Average loan terms are presented in Table 10.
Table 10Loan Characteristics by Loan Type
Loan All Consumer PaydayCharacteristic Types Installment Export
Average amount $272 $5,352 $314 $338 $115fi nanced
Average length of 3.17 41.81 7.19 0.52 1.00loan in months
Average 226.09% 25.11% 92.69% 510.76% 226.72%disclosed APR
Signature Pawn

25
The Texas Finance Code specifi es maximum allowable rates for consumer installment, signature, payday state rate, and pawn loans. The maximum allowable rate depends on the type of loan, the amount borrowed, and the length of the loan. During the time these loans were made, rates could not exceed 240 percent APR for signature loans and pawn loans, and 570 percent APR for payday loans with state rates.38 Rates typically ranged from 18 percent to 32 percent APR for consumer installment loans. During the same time period, the rate for most bank loans was 18 percent APR or less.39
Study results indicated that almost all pawn and signature loans charged the maximum allowable rate. Most licensees use computer programs to calculate loan terms. These programs, reviewed and approved by the OCCC, are used to ensure that the loan terms do not exceed the maximum allowable rate under the Texas Finance Code.40 Even if the program were not available when a loan was made, the loan would be entered into a computer system for tracking, and any errors should be detected by the automated system and corrected.
There were more differences in the APRs of payday export loans than in the APRs for any other type of loan. Also, the APRs for payday export loans tended to be higher than APRs for other types of loan. The average APR for payday export loans was 511 percent, and the highest rate encountered in the sampled loans was 6,570 percent.41 For payday export loans, the maximum APR is determined by the maximum rate permissible in the out-of-state bank’s home state.

26
Customers obtaining signature, payday, and pawn loans are likely to be more aware of the out-of-pocket charges than the APR. This is especially true for payday and pawn loans, which are structured as single-payment loans. Table 11 presents examples of out-of-pocket charges. For a pawn loan of $100 for one month, the fi nance charge would be $20 (66 cents a day). For a $300 payday export loan of two weeks, the fi nance charge could be approximately $53 (less than $4 a day).42 A signature loan of $300 for six months would have a fi nance charge of $82 (45 cents a day). In these examples, the APRs range from about 88 percent to 460 percent. The examples present fi nance charges for loans paid back on time. Customers who do not pay back their loans on time incur additional fi nance charges, and the fi nance charge becomes a larger proportion of the original loan amount.
Table 11Example Finance Charges by Loan Type
Loan All Consumer PaydayCharacteristics Types Installment Export
Example loan n.a. n.a. $300 $300 $100amount
Example loan n.a. n.a. 6 months 2 weeks 1 monthterm
Finance chargeif loan is paid n.a. n.a. $82.00 $52.92* $20.00back on time
Expressed aspercentage of n.a. n.a. 27% 18% 20%loan amount
Expressed asdaily fi nance n.a. n.a. $0.45 $3.78 $0.66charge
Expressed as n.a. n.a. 88.48% 459.90% 240.00%APR
n.a. = not applicable*Typical fi nance charge for sampled loans with these characteristics.
Signature Pawn

27
What was the status of the loans when the study data were collected?
As mentioned previously, the loans included in this study were made from January through June 2003. The OCCC examiners determined the status of the loans from February through July 2004. Again, the different types of loan have different characteristics. The average length of consumer installment loans is over three years, so most of those loans were still open. However, nine percent of consumer installment loans ended in default within approximately one year. The majority of signature loans had been paid back by taking out a new loan. Most payday export and pawn loans were paid back on time or early, although for almost one-third of pawn loans, the customers did not return to claim the property pledged as collateral. Table 12 shows the status of the loans at data collection.
Table 12Status of Loans at Data Collection by Loan Type*
Loan All Consumer PaydayStatus Types Installment Export
Paid off on timeor early (did not 52.73% 8.65% 21.23% 76.72% 62.57%pay off withanother loan)
Paid off by taking 24.06% 16.84% 69.00% 15.21% 5.56%out a new loan
Loan still open 2.93% 65.37% 4.98% 1.14% 0.96%
Loan in default(if pawn, item 20.28% 9.14% 4.80% 6.93% 30.90%was pulled)
*Data were collected from February through July 2004.
Signature Pawn

28
Were many of the loans used to pay back previous loans?
For this report, a loan was considered to be a “renewal” if part of the loan was used to pay back a previous loan with the same company. As shown in Table 13, over one-fourth of loans made during the study period started as renewals. Signature loans were the most likely to be renewed, with almost 50 percent of loans made during the study period both starting and ending as renewals. Pawn loans were the least likely to be renewed. The proportion of consumer installment loans that ended as renewals could not be accurately assessed because the average term for those loans is greater than three years. However, over 16 percent of consumer installment loans were renewed within the fi rst year. Although payday export loans refl ect a renewal rate of 25.75 percent, the term for these loans is generally two weeks. To accurately compare the renewal ratio for payday loans to the ratio for signature loans, it would be necessary to review the rate of repeat transactions during a period that is similar to the term of a signature loan. Data to make this comparison were not collected.
Table 13Loan Renewals by Loan Type
Renewal All Consumer PaydayStatus Types Installment Export
Loan started asrenewal (at leastpart of the loanwas originally used 27.46% 44.57% 68.71% 25.75% 8.11%to pay back aprevious loan withthe same company)
Loan ended as renewal(at least part of theloan was paid back 24.06% 16.84% 69.00% 15.21% 5.56%by takingout a new loan)
Loan both startedand ended as 16.15% 6.92% 48.01% 9.13% 3.09%a renewal
Signature Pawn

29
Were late charges a major cost for most customers?
Table 14 presents information about late charges. Over 40 percent of consumer installment loans had late charges, similar to the proportion for signature loans. The total amount of late charges on a loan is affected by the length of the loan: as the number of payment periods increases, the risk of making a late payment also increases. Because late charges are based on payment amount, and consumer installment loans are for larger amounts and are paid over a longer period of time than signature loans, it is not surprising that the average total of late charges was higher for consumer installment loans than for signature loans.
Table 14Late Charges by Loan Type
Consumer Payday Installment Export
Percentage of loanswith late charges* 41.61% 43.66% 41.50% n.a. n.a.
Of loans withlate charges**
Average late charges $9.03 $33.22 $7.73 n.a. n.a.
Late charges aspercentage of total 3.59% 1.89% 3.68% n.a. n.a.amount paid on loan***
n.a. = not applicable*Excludes Payday Export, Payday State Rate, and Pawn Loans. Late charges are not used for those types of loans.
**Includes loans that were still open.***Total amount paid on loan includes late charges.
Signature PawnLate Charge Characteristic Overall

31
Were Unlicensed Businesses Lending Money to Texas Consumers?
The OCCC-licensed lenders provided over $4.8 billion in loans in 2003, and these loans tended to be small and short-term. As noted previously, the OCCC regulates the terms of the loans provided by their licensees, and lenders who make loans at greater than a 10 percent effective rate must be licensed by the OCCC. However, the yellow pages and other publications include listings for businesses that advertise as “lenders” or “pawnshops” but do not appear on the list of businesses licensed by the OCCC. To what extent are unlicensed businesses also providing these types of loans? To answer this question, the TLC conducted a mail survey of businesses that appeared to be making these types of loans but were not licensed by the OCCC.
The yellow pages and, where available, the Greensheet advertising weekly were searched to prepare a list of potentially unlicensed lenders located in a sample of 29 Texas counties. A total of 474 businesses were identifi ed through this search. The list of 474 potentially unlicensed lenders was verifi ed using a reverse look-up Internet service that returned a business name and address, given a phone number. If the reverse look-up did not return the same business name and address as in the yellow pages or Greensheet, the number was called to verify the business information.43 It was not possible to verify addresses for 30 percent of the 474 businesses, typically because they had disconnected telephone numbers or repeated phone calls were unanswered. For 27 percent, the phone number was not associated with a business that would be eligible for the mail survey. For example, the phone contact revealed that the new business name and/or address was that of an OCCC licensee, the phone number rang at a residence, or the phone number rang at a business that did not make consumer loans. In many of these cases, the person answering the phone said they had been called by others looking for the business, but that they had no knowledge of its whereabouts. An additional four percent were businesses under investigation by the OCCC or with litigation already in progress. Only 187 (39 percent of the initial group of 474) appeared to be unlicensed lenders not under investigation by the OCCC. Graph 4 presents the distribution of the 474 businesses initially identifi ed from the yellow pages and Greensheet.
A mail survey was sent to the 187 potentially unlicensed lenders. The survey was designed to produce results comparable to those obtained from the survey of OCCC licensees. The questionnaire stated that the study included only consumer/personal loans, payday loans, pawn loans, or other cash transactions with Texas consumers from January 1, 2003, through June 30, 2003. When asked if their business engaged in transactions that met those criteria, 39 percent reported that they did not.44 These businesses were not eligible for the survey. Another 19 percent could not be included because their mail was returned as undeliverable. Excluding the undeliverable group from the survey, the response rate was 62 percent. However, only 20 lenders returned questionnaires with data describing their lending activity. Results based on such a small group of lenders will not be reported because they may be misleading.

32
Gra
ph 4
Dis
trib
utio
n of
Pot
enti
ally
Unl
icen
sed
Len
ders
(N
=47
4)
Incl
uded
in
Mai
l S
urve
y39
%
Not
Eli
gibl
e fo
r S
ampl
e27
%
Cou
ld N
otV
erif
y A
ddre
ss30
%
Non
resp
onde
nt31
%
Und
eliv
erab
le19
%
Und
er I
nves
tiga
tion
or i
n L
itig
atio
nW
ith
OC
CC
4%
Ret
urne
dQ
uest
ionn
aire
Wit
h D
ata
11%
Res
pond
edT
hat
The
yD
o N
otM
eet
the
Cri
teri
a39
%

33
What Are the Alternatives to High-Cost Lending?
Alternatives to high-cost lending include credit cards, overdraft protection, line-of-credit loans, and borrowing from family and friends. However, the increasing demand for high-cost loans indicates that there is a large group of Texas consumers whose needs are not being met by these lower-cost options. One large fi nancial institution recently donated $400,000 to the National Federation of Community Development Credit Unions to research alternative ways to make short-term loans available to lower-income borrowers.45 Some credit unions have started to offer payday loan products for this segment of the loan market.46 However, credit unions and banks require customers to meet eligibility requirements to qualify for these services. Typically, the customer’s paycheck must be deposited into his or her account electronically for a period of time, often a year, before obtaining a loan. These products are not likely to provide viable alternatives to high-cost loans for consumers who do not receive regular paychecks and are unable to maintain a checking or savings account. Research identifi ed few alternative, competitive, market-driven products for this segment of the market.
A consumer’s level of fi nancial literacy critically affects decisions about borrowing. Loan transactions can contain complex pricing structures and terms that can be diffi cult for even the most fi nancially astute borrowers to fully understand. As products become more complex, the asymmetry of information (i.e., imbalance of knowledge) between the well-informed lenders or brokers and the less-informed borrowers widens. There appears to be a broad consensus that continuing fi nancial literacy education is needed to bridge this gap. Lender organizations have advocated improving consumer education.47 The Texas Legislature recently directed the Texas Education Agency to include personal fi nance among the essential knowledge and skills in the required public school curriculum.48 The OCCC also is engaged in fi nancial literacy efforts. The OCCC conducts seminars and publishes credit education brochures in an effort to provide fi nancial literacy information directly to consumers. The OCCC is working directly with licensees to develop “plain language contracts,” replacing legalese with consumer-friendly words and phrases. While the OCCC makes public presentations at events across the state, the agency also has proposed a public/private project to develop a consumer educational program targeted at the needs of specifi c communities. Additionally, consumer credit counseling provided by reputable nonprofi t agencies also may be an effective tool for increasing consumers’ fi nancial skills.
Much discussion has focused on regulations to address potentially abusive practices in the high-cost lending market. Consumer organizations have reported on the ways some lenders have allegedly circumvented existing law, and the organizations have published recommendations for legislation to protect vulnerable consumers.49 An organization representing payday lenders also has published recommendations for legislation.50
High-cost loans have found a place in the economy and will continue as long as consumer demand for high-cost loans exists. Consumer organizations and many lenders agree that a combination of fi nancial education and regulation is needed. The prevailing belief is that consumers should have fi nancial tools and the ability to access the credit market, but the market must be fair and the people should be well-informed.

35
Appendix A: Annual Report Analysis
Each year, OCCC licensees are required to submit annual reports summarizing their lending activity for the previous year.51 Regulated lending companies submit a single report that combines the information for all of their locations, reporting the total number of loans and the total amount they loaned by type of loan. The information is not audited for accuracy, although the OCCC reviews it for reasonableness.52 The OCCC revokes the licenses of companies that do not submit annual reports. Therefore, the annual report data do not include lending activity for former licensees with revoked licenses. Annual report data also are missing for companies that went out of business before submitting their annual report.
The following tables present the data underlying the graphics in the report. Payday lenders were fi rst licensed in 2000, and annual report data for pawn lenders were not available before 2000.
Table A-1Number of Loans by Year and Type of Loan
Consumer Payday Payday Installment Export State Rate
1987 333,254 1,772,926 n.a. n.a. n.a. 2,106,180
1988 277,278 1,969,575 n.a. n.a. n.a. 2,246,853
1989 364,726 2,247,205 n.a. n.a. n.a. 2,611,931
1990 358,083 2,595,210 n.a. n.a. n.a. 2,953,293
1991 314,719 2,607,070 n.a. n.a. n.a. 2,921,789
1992 299,853 2,840,229 n.a. n.a. n.a. 3,140,082
1993 297,195 4,226,361 n.a. n.a. n.a. 4,523,556
1994 307,942 3,744,841 n.a. n.a. n.a. 4,052,783
1995 372,285 3,522,942 n.a. n.a. n.a. 3,895,227
1996 435,009 3,579,800 n.a. n.a. n.a. 4,014,809
1997 354,672 3,930,470 n.a. n.a. n.a. 4,285,142
1998 709,948 3,694,849 n.a. n.a. n.a. 4,404,797
1999 403,043 4,074,377 n.a. n.a. n.a. 4,477,420
2000 388,869 4,225,187 353,903 13,178 8,529,428 13,510,565
2001 286,651 4,277,828 437,398 31,211 8,617,013 13,650,101
2002 366,564 4,223,122 1,125,807 80,122 8,689,385 14,485,000
2003 387,579 4,160,306 1,810,789 96,687 8,889,734 15,345,095
Signature Pawn TOTALYear
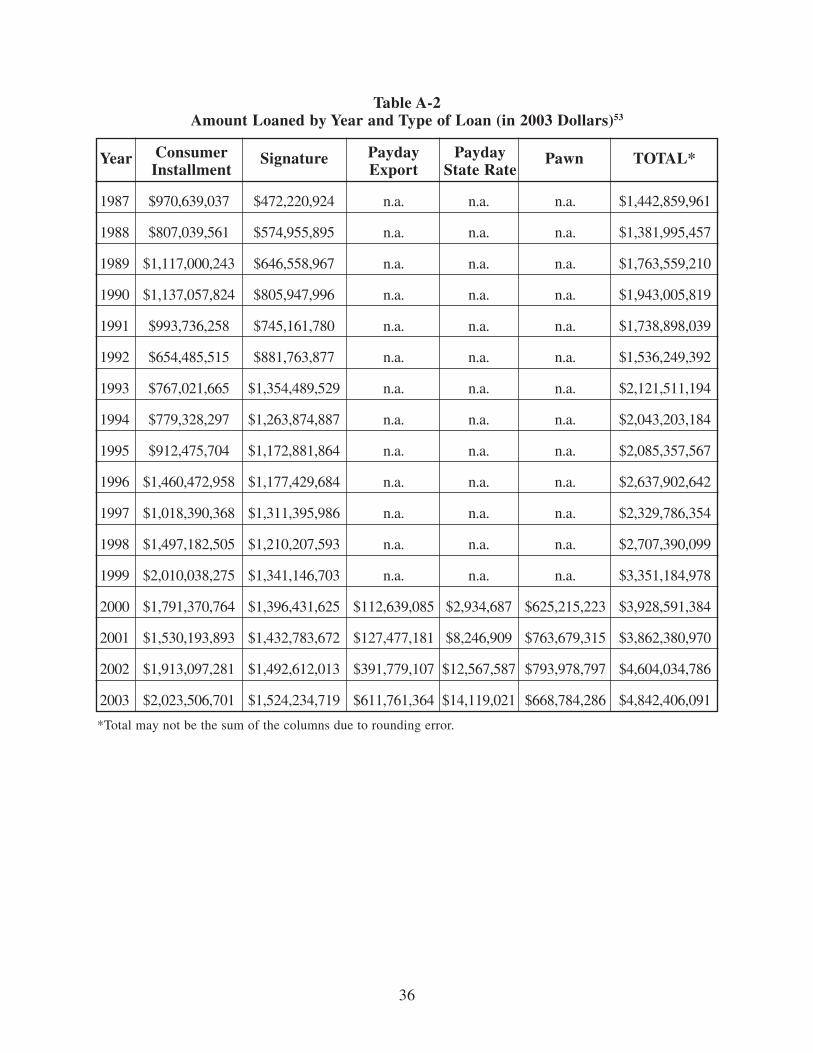
36
Table A-2Amount Loaned by Year and Type of Loan (in 2003 Dollars)53
Consumer Payday Payday Installment Export State Rate
1987 $970,639,037 $472,220,924 n.a. n.a. n.a. $1,442,859,961
1988 $807,039,561 $574,955,895 n.a. n.a. n.a. $1,381,995,457
1989 $1,117,000,243 $646,558,967 n.a. n.a. n.a. $1,763,559,210
1990 $1,137,057,824 $805,947,996 n.a. n.a. n.a. $1,943,005,819
1991 $993,736,258 $745,161,780 n.a. n.a. n.a. $1,738,898,039
1992 $654,485,515 $881,763,877 n.a. n.a. n.a. $1,536,249,392
1993 $767,021,665 $1,354,489,529 n.a. n.a. n.a. $2,121,511,194
1994 $779,328,297 $1,263,874,887 n.a. n.a. n.a. $2,043,203,184
1995 $912,475,704 $1,172,881,864 n.a. n.a. n.a. $2,085,357,567
1996 $1,460,472,958 $1,177,429,684 n.a. n.a. n.a. $2,637,902,642
1997 $1,018,390,368 $1,311,395,986 n.a. n.a. n.a. $2,329,786,354
1998 $1,497,182,505 $1,210,207,593 n.a. n.a. n.a. $2,707,390,099
1999 $2,010,038,275 $1,341,146,703 n.a. n.a. n.a. $3,351,184,978
2000 $1,791,370,764 $1,396,431,625 $112,639,085 $2,934,687 $625,215,223 $3,928,591,384
2001 $1,530,193,893 $1,432,783,672 $127,477,181 $8,246,909 $763,679,315 $3,862,380,970
2002 $1,913,097,281 $1,492,612,013 $391,779,107 $12,567,587 $793,978,797 $4,604,034,786
2003 $2,023,506,701 $1,524,234,719 $611,761,364 $14,119,021 $668,784,286 $4,842,406,091
*Total may not be the sum of the columns due to rounding error.
Signature Pawn TOTAL*Year

37
Table A-3Amount Per Loan by Year and Type of Loan (in 2003 Dollars)54
Consumer Payday Payday Installment Export State Rate
1987 $2,913 $266 n.a. n.a. n.a.
1988 $2,911 $292 n.a. n.a. n.a.
1989 $3,063 $288 n.a. n.a. n.a.
1990 $3,175 $311 n.a. n.a. n.a.
1991 $3,158 $286 n.a. n.a. n.a.
1992 $2,183 $310 n.a. n.a. n.a.
1993 $2,581 $320 n.a. n.a. n.a.
1994 $2,531 $337 n.a. n.a. n.a.
1995 $2,451 $333 n.a. n.a. n.a.
1996 $3,357 $329 n.a. n.a. n.a.
1997 $2,871 $334 n.a. n.a. n.a.
1998 $2,109 $328 n.a. n.a. n.a.
1999 $4,987 $329 n.a. n.a. n.a.
2000 $4,607 $331 $318 $223 $73
2001 $5,338 $335 $291 $264 $89
2002 $5,219 $353 $348 $157 $91
2003 $5,221 $366 $338 $146 $75
Signature PawnYear

39
Appendix B: Geographic Analysis
This technical appendix provides additional information about the geographic analysis section of the report. It presents more detailed information on the correlation and regression analyses and provides the county-level data used for the correlations, regressions, and maps.
Correlation Analyses
We used correlations to measure the relationship between each of the county characteristics of interest (metropolitan status, border status, percent minority, percent poverty, the combination of minority and poverty) and the proportion of OLLs.55,56,57 Additional correlation analyses were performed for each of the fi ve types of OCCC-licensed lenders listed in Table B-1. The four counties with no banks and no OLLs were excluded from the analysis.58 Counties that did not have a particular type of lender were included with a zero proportion.59
We coded metropolitan status using three variables (metropolitan, suburban, and rural) and coded border status using a single variable.60 The “combination of minority and poverty” was computed as the product of the minority percentage and the poverty percentage. Table B-1 presents the correlations described in the geographic analysis.
Table B-1Correlations between County Characteristics and Proportions of
OLLs and Types of Lenders in the County
Proportion Proportion Proportion of of of Consumer Payday Pawn & Installment Export Payday Lenders Lenders Export
PercentMinority
PercentPoverty
Minority andPoverty**
Metropolitan 0.32 * * 0.21 * *
Suburban * -0.24 * * * -0.23
Rural -0.20 * * * * *
Border 0.19 0.17 0.24 * * 0.30
* This correlation was not reported because the probability value was greater than .01.** The combination of minority and poverty was the product of the minority percentage and the poverty percentage.
CountyCharacteristic
Proportionof
OLLs
Proportionof
SignatureLenders
Proportionof
PawnLenders
0.42 * 0.50 * -0.36 0.31
0.23 * 0.39 * -0.24 0.33
0.37 * 0.48 * -0.33 0.34

40
Regression Analyses
Regression analyses were used to distinguish which county characteristics were related to the proportion of OLLs independent of the intercorrelations between the county characteristics.61 We performed an initial regression analysis with fi ve county characteristics (percent minority, percent poverty, whether the county was metropolitan, whether the county was suburban, and whether the county was a border county) and 10 fi rst-order interactions.62 We then conducted additional regression analyses, omitting county characteristics and interactions with probability values greater than .01. The standardized parameter estimates and the adjusted R2 for the fi nal regression equation are reported in Table B-2.63 None of the interactions met our criteria for inclusion in the fi nal regression equation.
Equivalent regression analyses were conducted for each of the fi ve types of OCCC-licensed lenders discussed in the geographic analysis. Table B-2 includes the standardized parameter estimates and the adjusted R2 for the each of the fi nal regression equations.
Table B-2Standardized Parameter Estimates from Regression Equations
Proportion of Pawn & Payday Export Lenders
PercentMinority
PercentPoverty
Metropolitan 0.26 * * 0.21 * *
Suburban * -0.24 * * * -0.17
Border * * * * * 0.20
Adjusted R2 0.23 0.06 0.25 0.04 0.13 0.15
* This county characteristic was omitted from the regression equation because the probability value for the parameter estimate was greater than .01.
County Data
The county-level data used for the geographic analysis are presented in the following three tables. Table B-3 presents the proportion of each type of lender, Table B-4 presents the number of each type of lender, and Table B-5 presents the metropolitan status, border status, percent minority, and percent poverty.
0.38 * 0.50 * -0.36 0.18
* * * * * *
CountyCharacteristic
Proportionof
OLLs
Proportionof
ConsumerInstallment
Lenders
Proportionof
PaydayExport
Lenders
Proportionof
SignatureLenders
Proportionof
PawnLenders

41
Table B-3Proportion of Each Type of Financial Institution by County
Column Headings:
CI – consumer installment lenders
SIG – signature lenders
EXP – payday lenders with exported rates
PSR – payday lenders with state rates
Pawn-EXP– licensees with both pawn and payday export lending
Pawn-Other– licensees with both pawn and another type of lending
OLLs – OCCC-licensed locations
FIPS County Pawn- Pawn- Code Name EXP Other
1 Anderson 8.70% 26.09% 0.00% 0.00% 8.70% 0.00% 4.35% 47.83% 52.17%
3 Andrews 0.00% 44.44% 0.00% 0.00% 0.00% 0.00% 0.00% 44.44% 55.56%
5 Angelina 6.52% 26.09% 4.35% 0.00% 13.04% 0.00% 0.00% 50.00% 50.00%
7 Aransas 0.00% 10.00% 10.00% 0.00% 20.00% 0.00% 0.00% 40.00% 60.00%
9 Archer 0.00% 0.00% 0.00% 0.00% 0.00% 0.00% 0.00% 0.00% 100.00%
11 Armstrong 0.00% 0.00% 0.00% 0.00% 0.00% 0.00% 0.00% 0.00% 100.00%
13 Atascosa 0.00% 40.00% 5.00% 0.00% 10.00% 0.00% 0.00% 55.00% 45.00%
15 Austin 0.00% 28.57% 0.00% 0.00% 7.14% 0.00% 0.00% 35.71% 64.29%
17 Bailey 0.00% 33.33% 0.00% 0.00% 0.00% 0.00% 0.00% 33.33% 66.67%
19 Bandera 0.00% 14.29% 0.00% 0.00% 14.29% 0.00% 0.00% 28.57% 71.43%
21 Bastrop 0.00% 0.00% 0.00% 0.00% 11.11% 5.56% 0.00% 16.67% 83.33%
23 Baylor 0.00% 0.00% 0.00% 0.00% 0.00% 0.00% 0.00% 0.00% 100.00%
25 Bee 0.00% 44.44% 16.67% 0.00% 16.67% 0.00% 0.00% 77.78% 22.22%
27 Bell 5.41% 21.62% 9.01% 0.00% 18.92% 3.60% 0.00% 58.56% 41.44%
29 Bexar 5.37% 18.09% 13.32% 0.00% 10.93% 6.96% 0.00% 54.67% 45.33%
31 Blanco 0.00% 0.00% 0.00% 0.00% 0.00% 0.00% 0.00% 0.00% 100.00%
33 Borden n.a. n.a. n.a. n.a. n.a. n.a. n.a. n.a. n.a.
35 Bosque 0.00% 9.09% 0.00% 0.00% 9.09% 0.00% 0.00% 18.18% 81.82%
37 Bowie 7.69% 30.77% 1.92% 0.00% 7.69% 3.85% 0.00% 51.92% 48.08%
39 Brazoria 3.53% 12.94% 3.53% 0.00% 10.59% 2.35% 1.18% 34.12% 65.88%
41 Brazos 7.46% 17.91% 7.46% 0.00% 10.45% 2.99% 0.00% 46.27% 53.73%
CI SIG EXP PSR Pawn OLLs Banks

42
43 Brewster 0.00% 33.33% 0.00% 0.00% 0.00% 0.00% 0.00% 33.33% 66.67%
45 Briscoe 0.00% 0.00% 0.00% 0.00% 0.00% 0.00% 0.00% 0.00% 100.00%
47 Brooks 0.00% 50.00% 0.00% 0.00% 0.00% 12.50% 0.00% 62.50% 37.50%
49 Brown 4.00% 24.00% 0.00% 0.00% 16.00% 4.00% 0.00% 48.00% 52.00%
51 Burleson 0.00% 0.00% 0.00% 0.00% 0.00% 0.00% 0.00% 0.00% 100.00%
53 Burnet 0.00% 27.27% 0.00% 0.00% 13.64% 0.00% 0.00% 40.91% 59.09%
55 Caldwell 0.00% 38.46% 0.00% 0.00% 7.69% 7.69% 0.00% 53.85% 46.15%
57 Calhoun 0.00% 27.27% 0.00% 0.00% 9.09% 0.00% 0.00% 36.36% 63.64%
59 Callahan 0.00% 0.00% 0.00% 0.00% 20.00% 0.00% 0.00% 20.00% 80.00%
61 Cameron 5.59% 36.87% 7.26% 0.56% 4.47% 9.50% 0.00% 64.25% 35.75%
63 Camp 0.00% 0.00% 0.00% 0.00% 16.67% 0.00% 0.00% 16.67% 83.33%
65 Carson 0.00% 0.00% 0.00% 0.00% 0.00% 0.00% 0.00% 0.00% 100.00%
67 Cass 5.00% 35.00% 0.00% 0.00% 5.00% 0.00% 0.00% 45.00% 55.00%
69 Castro 0.00% 0.00% 0.00% 0.00% 0.00% 0.00% 0.00% 0.00% 100.00%
71 Chambers 0.00% 10.00% 0.00% 0.00% 0.00% 0.00% 10.00% 20.00% 80.00%
73 Cherokee 3.57% 25.00% 7.14% 0.00% 10.71% 0.00% 7.14% 53.57% 46.43%
75 Childress 0.00% 33.33% 0.00% 0.00% 0.00% 0.00% 0.00% 33.33% 66.67%
77 Clay 0.00% 20.00% 0.00% 0.00% 0.00% 0.00% 0.00% 20.00% 80.00%
79 Cochran 0.00% 0.00% 0.00% 0.00% 0.00% 0.00% 0.00% 0.00% 100.00%
81 Coke 0.00% 0.00% 0.00% 0.00% 0.00% 0.00% 0.00% 0.00% 100.00%
83 Coleman 0.00% 12.50% 0.00% 0.00% 12.50% 0.00% 0.00% 25.00% 75.00%
85 Collin 2.70% 3.78% 4.86% 0.00% 4.86% 0.00% 0.00% 16.22% 83.78%
87 Collingsworth 0.00% 0.00% 0.00% 0.00% 0.00% 0.00% 0.00% 0.00% 100.00%
89 Colorado 0.00% 0.00% 0.00% 0.00% 0.00% 0.00% 0.00% 0.00% 100.00%
91 Comal 6.06% 12.12% 3.03% 0.00% 12.12% 0.00% 3.03% 36.36% 63.64%
93 Comanche 0.00% 0.00% 0.00% 0.00% 11.11% 0.00% 0.00% 11.11% 88.89%
95 Concho 0.00% 0.00% 0.00% 0.00% 0.00% 0.00% 0.00% 0.00% 100.00%
97 Cooke 0.00% 6.67% 6.67% 0.00% 6.67% 6.67% 0.00% 26.67% 73.33%
99 Coryell 0.00% 12.90% 9.68% 0.00% 6.45% 6.45% 0.00% 35.48% 64.52%
101 Cottle 0.00% 0.00% 0.00% 0.00% 0.00% 0.00% 0.00% 0.00% 100.00%
Table B-3 (continued)Proportion of Each Type of Financial Institution by County
FIPS County Pawn- Pawn- Code Name EXP Other
CI SIG EXP PSR Pawn OLLs Banks

43
103 Crane 0.00% 33.33% 0.00% 0.00% 0.00% 0.00% 0.00% 33.33% 66.67%
105 Crockett 0.00% 0.00% 0.00% 0.00% 0.00% 0.00% 0.00% 0.00% 100.00%
107 Crosby 0.00% 0.00% 0.00% 0.00% 16.67% 0.00% 0.00% 16.67% 83.33%
109 Culberson 0.00% 0.00% 0.00% 0.00% 0.00% 0.00% 0.00% 0.00% 100.00%
111 Dallam 0.00% 25.00% 0.00% 0.00% 0.00% 0.00% 0.00% 25.00% 75.00%
113 Dallas 3.93% 4.53% 14.06% 0.00% 11.44% 4.17% 0.00% 38.14% 61.86%
115 Dawson 0.00% 57.14% 0.00% 0.00% 0.00% 0.00% 0.00% 57.14% 42.86%
117 Deaf Smith 0.00% 28.57% 0.00% 0.00% 14.29% 0.00% 0.00% 42.86% 57.14%
119 Delta 0.00% 0.00% 0.00% 0.00% 0.00% 0.00% 0.00% 0.00% 100.00%
121 Denton 5.23% 5.88% 9.80% 0.00% 6.54% 1.31% 0.00% 28.76% 71.24%
123 De Witt 0.00% 28.57% 0.00% 0.00% 9.52% 0.00% 0.00% 38.10% 61.90%
125 Dickens 0.00% 0.00% 0.00% 0.00% 0.00% 0.00% 0.00% 0.00% 100.00%
127 Dimmit 0.00% 70.00% 0.00% 0.00% 0.00% 0.00% 0.00% 70.00% 30.00%
129 Donley 0.00% 0.00% 0.00% 0.00% 0.00% 0.00% 0.00% 0.00% 100.00%
131 Duval 0.00% 50.00% 0.00% 0.00% 0.00% 0.00% 0.00% 50.00% 50.00%
133 Eastland 0.00% 0.00% 0.00% 0.00% 10.00% 0.00% 0.00% 10.00% 90.00%
135 Ector 6.78% 23.73% 6.78% 0.00% 10.17% 8.47% 0.00% 55.93% 44.07%
137 Edwards 0.00% 0.00% 0.00% 0.00% 0.00% 0.00% 0.00% 0.00% 100.00%
139 Ellis 0.00% 20.00% 2.22% 0.00% 17.78% 0.00% 0.00% 40.00% 60.00%
141 El Paso 8.20% 40.98% 8.61% 0.00% 5.33% 7.79% 0.41% 71.31% 28.69%
143 Erath 0.00% 18.18% 4.55% 0.00% 13.64% 0.00% 0.00% 36.36% 63.64%
145 Falls 0.00% 16.67% 0.00% 0.00% 0.00% 0.00% 8.33% 25.00% 75.00%
147 Fannin 0.00% 15.79% 10.53% 0.00% 10.53% 0.00% 0.00% 36.84% 63.16%
149 Fayette 0.00% 5.56% 0.00% 0.00% 5.56% 0.00% 0.00% 11.11% 88.89%
151 Fisher 0.00% 0.00% 0.00% 0.00% 0.00% 0.00% 0.00% 0.00% 100.00%
153 Floyd 0.00% 0.00% 0.00% 0.00% 0.00% 0.00% 0.00% 0.00% 100.00%
155 Foard 0.00% 0.00% 0.00% 0.00% 0.00% 0.00% 0.00% 0.00% 100.00%
157 Fort Bend 2.91% 8.74% 5.83% 0.00% 5.83% 2.91% 0.00% 26.21% 73.79%
159 Franklin 0.00% 0.00% 0.00% 0.00% 0.00% 0.00% 0.00% 0.00% 100.00%
161 Freestone 0.00% 21.43% 0.00% 0.00% 7.14% 0.00% 0.00% 28.57% 71.43%
Table B-3 (continued)Proportion of Each Type of Financial Institution by County
FIPS County Pawn- Pawn- Code Name EXP Other
CI SIG EXP PSR Pawn OLLs Banks

44
163 Frio 0.00% 55.56% 0.00% 0.00% 0.00% 0.00% 0.00% 55.56% 44.44%
165 Gaines 0.00% 40.00% 0.00% 0.00% 0.00% 0.00% 0.00% 40.00% 60.00%
167 Galveston 2.61% 9.57% 6.96% 0.00% 12.17% 2.61% 0.00% 33.91% 66.09%
169 Garza 0.00% 0.00% 0.00% 0.00% 0.00% 0.00% 0.00% 0.00% 100.00%
171 Gillespie 0.00% 14.29% 0.00% 0.00% 7.14% 0.00% 0.00% 21.43% 78.57%
173 Glasscock 0.00% 0.00% 0.00% 0.00% 0.00% 0.00% 0.00% 0.00% 100.00%
175 Goliad 0.00% 0.00% 0.00% 0.00% 0.00% 0.00% 0.00% 0.00% 100.00%
177 Gonzales 0.00% 46.67% 0.00% 0.00% 6.67% 0.00% 0.00% 53.33% 46.67%
179 Gray 0.00% 21.43% 7.14% 0.00% 7.14% 7.14% 0.00% 42.86% 57.14%
181 Grayson 4.48% 14.93% 2.99% 0.00% 14.93% 1.49% 0.00% 38.81% 61.19%
183 Gregg 7.78% 22.22% 5.56% 0.00% 14.44% 1.11% 0.00% 51.11% 48.89%
185 Grimes 0.00% 30.00% 0.00% 0.00% 0.00% 0.00% 0.00% 30.00% 70.00%
187 Guadalupe 3.03% 30.30% 6.06% 0.00% 3.03% 6.06% 0.00% 48.48% 51.52%
189 Hale 8.33% 33.33% 4.17% 0.00% 4.17% 4.17% 0.00% 54.17% 45.83%
191 Hall 0.00% 0.00% 0.00% 0.00% 0.00% 0.00% 0.00% 0.00% 100.00%
193 Hamilton 0.00% 0.00% 0.00% 0.00% 16.67% 0.00% 0.00% 16.67% 83.33%
195 Hansford 0.00% 0.00% 0.00% 0.00% 0.00% 0.00% 0.00% 0.00% 100.00%
197 Hardeman 0.00% 0.00% 0.00% 0.00% 0.00% 0.00% 0.00% 0.00% 100.00%
199 Hardin 0.00% 26.32% 5.26% 0.00% 15.79% 0.00% 0.00% 47.37% 52.63%
201 Harris 3.01% 4.68% 15.38% 0.08% 9.04% 6.26% 0.32% 38.78% 61.22%
203 Harrison 2.70% 35.14% 2.70% 0.00% 8.11% 2.70% 0.00% 51.35% 48.65%
205 Hartley 0.00% 0.00% 0.00% 0.00% 0.00% 0.00% 0.00% 0.00% 100.00%
207 Haskell 0.00% 0.00% 0.00% 0.00% 0.00% 0.00% 0.00% 0.00% 100.00%
209 Hays 2.13% 27.66% 2.13% 0.00% 10.64% 2.13% 0.00% 44.68% 55.32%
211 Hemphill 0.00% 0.00% 0.00% 0.00% 0.00% 0.00% 0.00% 0.00% 100.00%
213 Henderson 0.00% 19.35% 3.23% 0.00% 12.90% 0.00% 0.00% 35.48% 64.52%
215 Hidalgo 4.81% 37.78% 6.67% 0.37% 2.59% 8.15% 0.00% 60.37% 39.63%
217 Hill 3.57% 25.00% 0.00% 0.00% 14.29% 0.00% 0.00% 42.86% 57.14%
219 Hockley 0.00% 25.00% 0.00% 0.00% 12.50% 6.25% 0.00% 43.75% 56.25%
221 Hood 0.00% 9.09% 4.55% 0.00% 13.64% 0.00% 0.00% 27.27% 72.73%
Table B-3 (continued)Proportion of Each Type of Financial Institution by County
FIPS County Pawn- Pawn- Code Name EXP Other
CI SIG EXP PSR Pawn OLLs Banks

45
223 Hopkins 0.00% 22.22% 0.00% 0.00% 16.67% 0.00% 0.00% 38.89% 61.11%
225 Houston 0.00% 23.08% 0.00% 0.00% 7.69% 0.00% 0.00% 30.77% 69.23%
227 Howard 5.26% 36.84% 5.26% 0.00% 10.53% 5.26% 0.00% 63.16% 36.84%
229 Hudspeth 0.00% 0.00% 0.00% 0.00% 0.00% 0.00% 0.00% 0.00% 100.00%
231 Hunt 5.88% 23.53% 2.94% 0.00% 14.71% 0.00% 0.00% 47.06% 52.94%
233 Hutchinson 0.00% 33.33% 0.00% 0.00% 11.11% 0.00% 0.00% 44.44% 55.56%
235 Irion 0.00% 0.00% 0.00% 0.00% 0.00% 0.00% 0.00% 0.00% 100.00%
237 Jack 0.00% 0.00% 0.00% 0.00% 0.00% 0.00% 0.00% 0.00% 100.00%
239 Jackson 10.00% 10.00% 0.00% 0.00% 10.00% 0.00% 0.00% 30.00% 70.00%
241 Jasper 0.00% 29.17% 8.33% 0.00% 16.67% 0.00% 0.00% 54.17% 45.83%
243 Jeff Davis 0.00% 0.00% 0.00% 0.00% 0.00% 0.00% 0.00% 0.00% 100.00%
245 Jefferson 6.45% 13.98% 8.60% 0.00% 9.68% 4.30% 0.00% 43.01% 56.99%
247 Jim Hogg 0.00% 40.00% 0.00% 0.00% 0.00% 0.00% 0.00% 40.00% 60.00%
249 Jim Wells 11.11% 44.44% 7.41% 0.00% 0.00% 11.11% 0.00% 74.07% 25.93%
251 Johnson 1.89% 16.98% 5.66% 0.00% 16.98% 0.00% 0.00% 41.51% 58.49%
253 Jones 0.00% 12.50% 0.00% 0.00% 0.00% 0.00% 0.00% 12.50% 87.50%
255 Karnes 0.00% 16.67% 0.00% 0.00% 0.00% 0.00% 0.00% 16.67% 83.33%
257 Kaufman 0.00% 21.88% 6.25% 0.00% 6.25% 3.13% 3.13% 40.63% 59.38%
259 Kendall 0.00% 7.69% 0.00% 0.00% 7.69% 0.00% 0.00% 15.38% 84.62%
261 Kenedy n.a. n.a. n.a. n.a. n.a. n.a. n.a. n.a. n.a.
263 Kent 0.00% 0.00% 0.00% 0.00% 0.00% 0.00% 0.00% 0.00% 100.00%
265 Kerr 0.00% 19.05% 4.76% 0.00% 9.52% 0.00% 0.00% 33.33% 66.67%
267 Kimble 0.00% 0.00% 0.00% 0.00% 0.00% 0.00% 0.00% 0.00% 100.00%
269 King n.a. n.a. n.a. n.a. n.a. n.a. n.a. n.a. n.a.
271 Kinney 0.00% 0.00% 0.00% 0.00% 0.00% 0.00% 0.00% 0.00% 100.00%
273 Kleberg 8.00% 36.00% 8.00% 0.00% 0.00% 12.00% 0.00% 64.00% 36.00%
275 Knox 0.00% 0.00% 0.00% 0.00% 0.00% 0.00% 0.00% 0.00% 100.00%
277 Lamar 6.25% 31.25% 0.00% 0.00% 12.50% 3.13% 0.00% 53.13% 46.88%
279 Lamb 0.00% 6.67% 0.00% 0.00% 0.00% 0.00% 0.00% 6.67% 93.33%
281 Lampasas 0.00% 11.11% 0.00% 0.00% 11.11% 0.00% 0.00% 22.22% 77.78%
Table B-3 (continued)Proportion of Each Type of Financial Institution by County
FIPS County Pawn- Pawn- Code Name EXP OtherCI SIG EXP PSR Pawn OLLs Banks

46
Table B-3 (continued)Proportion of Each Type of Financial Institution by County
FIPS County Pawn- Pawn- Code Name EXP Other
283 La Salle 0.00% 0.00% 0.00% 0.00% 0.00% 0.00% 0.00% 0.00% 100.00%
285 Lavaca 0.00% 0.00% 0.00% 0.00% 0.00% 0.00% 0.00% 0.00% 100.00%
287 Lee 0.00% 16.67% 0.00% 0.00% 8.33% 0.00% 0.00% 25.00% 75.00%
289 Leon 0.00% 0.00% 0.00% 0.00% 0.00% 0.00% 0.00% 0.00% 100.00%
291 Liberty 0.00% 29.17% 4.17% 0.00% 4.17% 0.00% 8.33% 45.83% 54.17%
293 Limestone 0.00% 20.00% 6.67% 0.00% 6.67% 0.00% 0.00% 33.33% 66.67%
295 Lipscomb 0.00% 0.00% 0.00% 0.00% 0.00% 0.00% 0.00% 0.00% 100.00%
297 Live Oak 0.00% 20.00% 0.00% 0.00% 0.00% 0.00% 0.00% 20.00% 80.00%
299 Llano 0.00% 0.00% 0.00% 0.00% 0.00% 0.00% 0.00% 0.00% 100.00%
301 Loving n.a. n.a. n.a. n.a. n.a. n.a. n.a. n.a. n.a.
303 Lubbock 6.14% 12.28% 2.63% 0.00% 7.02% 5.26% 0.00% 33.33% 66.67%
305 Lynn 0.00% 0.00% 0.00% 0.00% 0.00% 0.00% 0.00% 0.00% 100.00%
307 McCulloch 0.00% 33.33% 0.00% 0.00% 16.67% 0.00% 0.00% 50.00% 50.00%
309 McLennan 5.05% 24.24% 7.07% 0.00% 12.12% 6.06% 0.00% 54.55% 45.45%
311 McMullen 0.00% 0.00% 0.00% 0.00% 0.00% 0.00% 0.00% 0.00% 100.00%
313 Madison 0.00% 0.00% 16.67% 0.00% 0.00% 0.00% 0.00% 16.67% 83.33%
315 Marion 0.00% 40.00% 0.00% 0.00% 0.00% 0.00% 0.00% 40.00% 60.00%
317 Martin 0.00% 0.00% 0.00% 0.00% 0.00% 0.00% 0.00% 0.00% 100.00%
319 Mason 0.00% 0.00% 0.00% 0.00% 0.00% 0.00% 0.00% 0.00% 100.00%
321 Matagorda 13.33% 26.67% 0.00% 0.00% 6.67% 6.67% 0.00% 53.33% 46.67%
323 Maverick 6.06% 60.61% 0.00% 0.00% 0.00% 12.12% 0.00% 78.79% 21.21%
325 Medina 0.00% 37.50% 0.00% 0.00% 8.33% 0.00% 0.00% 45.83% 54.17%
327 Menard 0.00% 0.00% 0.00% 0.00% 0.00% 0.00% 0.00% 0.00% 100.00%
329 Midland 4.69% 20.31% 6.25% 0.00% 3.13% 6.25% 0.00% 40.63% 59.38%
331 Milam 0.00% 28.57% 0.00% 0.00% 0.00% 0.00% 0.00% 28.57% 71.43%
333 Mills 0.00% 0.00% 0.00% 0.00% 0.00% 0.00% 0.00% 0.00% 100.00%
335 Mitchell 0.00% 25.00% 0.00% 0.00% 0.00% 0.00% 0.00% 25.00% 75.00%
337 Montague 0.00% 11.11% 0.00% 0.00% 11.11% 0.00% 0.00% 22.22% 77.78%
339 Montgomery 2.42% 8.06% 5.65% 0.00% 9.68% 3.23% 0.00% 29.03% 70.97%
341 Moore 0.00% 22.22% 0.00% 0.00% 0.00% 11.11% 0.00% 33.33% 66.67%
CI SIG EXP PSR Pawn OLLs Banks

47
343 Morris 0.00% 10.00% 0.00% 0.00% 0.00% 0.00% 0.00% 10.00% 90.00%
345 Motley 0.00% 0.00% 0.00% 0.00% 0.00% 0.00% 0.00% 0.00% 100.00%
347 Nacogdoches 2.70% 24.32% 5.41% 0.00% 10.81% 0.00% 0.00% 43.24% 56.76%
349 Navarro 3.57% 32.14% 3.57% 0.00% 7.14% 0.00% 0.00% 46.43% 53.57%
351 Newton 0.00% 25.00% 0.00% 0.00% 25.00% 0.00% 0.00% 50.00% 50.00%
353 Nolan 0.00% 45.45% 0.00% 0.00% 18.18% 0.00% 0.00% 63.64% 36.36%
355 Nueces 3.91% 20.11% 17.88% 0.00% 7.82% 6.70% 0.56% 56.98% 43.02%
357 Ochiltree 0.00% 40.00% 0.00% 0.00% 0.00% 0.00% 0.00% 40.00% 60.00%
359 Oldham 0.00% 0.00% 0.00% 0.00% 0.00% 0.00% 0.00% 0.00% 100.00%
361 Orange 3.33% 13.33% 0.00% 0.00% 16.67% 3.33% 0.00% 36.67% 63.33%
363 Palo Pinto 0.00% 13.04% 0.00% 0.00% 13.04% 0.00% 0.00% 26.09% 73.91%
365 Panola 0.00% 45.45% 0.00% 0.00% 9.09% 0.00% 0.00% 54.55% 45.45%
367 Parker 3.23% 16.13% 6.45% 0.00% 16.13% 0.00% 0.00% 41.94% 58.06%
369 Parmer 0.00% 0.00% 0.00% 0.00% 0.00% 0.00% 0.00% 0.00% 100.00%
371 Pecos 7.69% 53.85% 0.00% 0.00% 0.00% 0.00% 0.00% 61.54% 38.46%
373 Polk 0.00% 23.53% 0.00% 0.00% 11.76% 0.00% 5.88% 41.18% 58.82%
375 Potter 6.90% 20.69% 3.45% 0.00% 10.34% 3.45% 1.72% 46.55% 53.45%
377 Presidio 0.00% 25.00% 0.00% 0.00% 0.00% 0.00% 0.00% 25.00% 75.00%
379 Rains 0.00% 0.00% 0.00% 0.00% 0.00% 0.00% 0.00% 0.00% 100.00%
381 Randall 6.06% 6.06% 6.06% 0.00% 6.06% 3.03% 0.00% 27.27% 72.73%
383 Reagan 0.00% 0.00% 0.00% 0.00% 0.00% 0.00% 0.00% 0.00% 100.00%
385 Real 0.00% 0.00% 0.00% 0.00% 0.00% 0.00% 0.00% 0.00% 100.00%
387 Red River 0.00% 36.36% 0.00% 0.00% 9.09% 0.00% 0.00% 45.45% 54.55%
389 Reeves 0.00% 50.00% 0.00% 0.00% 0.00% 0.00% 0.00% 50.00% 50.00%
391 Refugio 0.00% 0.00% 0.00% 0.00% 0.00% 0.00% 0.00% 0.00% 100.00%
393 Roberts 0.00% 0.00% 0.00% 0.00% 0.00% 0.00% 0.00% 0.00% 100.00%
395 Robertson 0.00% 0.00% 0.00% 0.00% 16.67% 0.00% 0.00% 16.67% 83.33%
397 Rockwall 5.56% 0.00% 5.56% 0.00% 5.56% 0.00% 0.00% 16.67% 83.33%
399 Runnels 0.00% 0.00% 0.00% 0.00% 0.00% 0.00% 0.00% 0.00% 100.00%
401 Rusk 0.00% 34.78% 0.00% 0.00% 8.70% 0.00% 4.35% 47.83% 52.17%
Table B-3 (continued)Proportion of Each Type of Financial Institution by County
FIPS County Pawn- Pawn- Code Name EXP Other
CI SIG EXP PSR Pawn OLLs Banks

48
403 Sabine 0.00% 0.00% 0.00% 0.00% 0.00% 0.00% 0.00% 0.00% 100.00%
San Augustine
407 San Jacinto 0.00% 0.00% 0.00% 0.00% 0.00% 0.00% 0.00% 0.00% 100.00%
409 San Patricio 0.00% 23.08% 15.38% 0.00% 10.26% 2.56% 0.00% 51.28% 48.72%
411 San Saba 0.00% 0.00% 0.00% 0.00% 0.00% 0.00% 0.00% 0.00% 100.00%
413 Schleicher 0.00% 0.00% 0.00% 0.00% 0.00% 0.00% 0.00% 0.00% 100.00%
415 Scurry 0.00% 38.46% 0.00% 0.00% 15.38% 0.00% 0.00% 53.85% 46.15%
417 Shackelford 0.00% 0.00% 0.00% 0.00% 0.00% 0.00% 0.00% 0.00% 100.00%
419 Shelby 0.00% 35.00% 0.00% 0.00% 10.00% 0.00% 0.00% 45.00% 55.00%
421 Sherman 0.00% 0.00% 0.00% 0.00% 0.00% 0.00% 0.00% 0.00% 100.00%
423 Smith 6.42% 17.43% 5.50% 0.00% 10.09% 3.67% 1.83% 44.95% 55.05%
425 Somervell 0.00% 0.00% 0.00% 0.00% 25.00% 0.00% 0.00% 25.00% 75.00%
427 Starr 3.03% 57.58% 0.00% 0.00% 3.03% 9.09% 0.00% 72.73% 27.27%
429 Stephens 0.00% 44.44% 0.00% 0.00% 11.11% 0.00% 0.00% 55.56% 44.44%
431 Sterling 0.00% 0.00% 0.00% 0.00% 0.00% 0.00% 0.00% 0.00% 100.00%
433 Stonewall 0.00% 0.00% 0.00% 0.00% 0.00% 0.00% 0.00% 0.00% 100.00%
435 Sutton 0.00% 0.00% 0.00% 0.00% 0.00% 0.00% 0.00% 0.00% 100.00%
437 Swisher 0.00% 0.00% 0.00% 0.00% 0.00% 0.00% 0.00% 0.00% 100.00%
439 Tarrant 4.56% 4.20% 13.87% 0.73% 9.12% 5.29% 0.36% 38.14% 61.86%
441 Taylor 5.88% 17.65% 2.94% 1.47% 8.82% 4.41% 1.47% 42.65% 57.35%
443 Terrell 0.00% 0.00% 0.00% 0.00% 0.00% 0.00% 0.00% 0.00% 100.00%
445 Terry 0.00% 44.44% 0.00% 0.00% 11.11% 0.00% 0.00% 55.56% 44.44%
447 Throckmorton 0.00% 0.00% 0.00% 0.00% 0.00% 0.00% 0.00% 0.00% 100.00%
449 Titus 3.70% 44.44% 3.70% 0.00% 7.41% 0.00% 0.00% 59.26% 40.74%
451 Tom Green 6.56% 22.95% 6.56% 0.00% 13.11% 3.28% 0.00% 52.46% 47.54%
453 Travis 5.44% 8.50% 7.48% 0.00% 7.82% 7.48% 0.00% 36.73% 63.27%
455 Trinity 0.00% 0.00% 0.00% 0.00% 25.00% 0.00% 0.00% 25.00% 75.00%
457 Tyler 0.00% 20.00% 0.00% 0.00% 10.00% 0.00% 0.00% 30.00% 70.00%
459 Upshur 0.00% 21.43% 0.00% 0.00% 7.14% 0.00% 0.00% 28.57% 71.43%
Table B-3 (continued)Proportion of Each Type of Financial Institution by County
FIPS County Pawn- Pawn- Code Name EXP Other
SIGCI EXP PSR Pawn OLLs Banks
405 0.00% 0.00% 0.00% 0.00% 16.67% 0.00% 0.00% 16.67% 83.33%

49
461 Upton 0.00% 0.00% 0.00% 0.00% 0.00% 0.00% 0.00% 0.00% 100.00%
463 Uvalde 0.00% 44.44% 5.56% 0.00% 0.00% 5.56% 5.56% 61.11% 38.89%
465 Val Verde 6.25% 59.38% 0.00% 0.00% 0.00% 6.25% 3.13% 75.00% 25.00%
467 Van Zandt 0.00% 0.00% 5.26% 0.00% 5.26% 0.00% 0.00% 10.53% 89.47%
469 Victoria 3.92% 35.29% 9.80% 0.00% 7.84% 5.88% 0.00% 62.75% 37.25%
471 Walker 3.70% 29.63% 14.81% 0.00% 7.41% 7.41% 0.00% 62.96% 37.04%
473 Waller 0.00% 25.00% 0.00% 0.00% 0.00% 0.00% 0.00% 25.00% 75.00%
475 Ward 0.00% 42.86% 14.29% 0.00% 0.00% 0.00% 0.00% 57.14% 42.86%
477 Washington 5.56% 38.89% 0.00% 0.00% 5.56% 0.00% 0.00% 50.00% 50.00%
479 Webb 4.90% 33.33% 4.90% 0.00% 9.80% 11.76% 0.00% 64.71% 35.29%
481 Wharton 3.03% 33.33% 0.00% 0.00% 3.03% 0.00% 3.03% 42.42% 57.58%
483 Wheeler 0.00% 0.00% 0.00% 0.00% 0.00% 0.00% 0.00% 0.00% 100.00%
485 Wichita 5.56% 18.06% 9.72% 1.39% 15.28% 1.39% 0.00% 51.39% 48.61%
487 Wilbarger 0.00% 27.27% 9.09% 0.00% 0.00% 0.00% 0.00% 36.36% 63.64%
489 Willacy 0.00% 40.00% 10.00% 0.00% 0.00% 10.00% 0.00% 60.00% 40.00%
491 Williamson 1.92% 12.50% 1.92% 0.00% 8.65% 0.96% 0.00% 25.96% 74.04%
493 Wilson 0.00% 28.57% 0.00% 0.00% 7.14% 0.00% 0.00% 35.71% 64.29%
495 Winkler 0.00% 33.33% 0.00% 0.00% 0.00% 0.00% 0.00% 33.33% 66.67%
497 Wise 0.00% 5.00% 0.00% 0.00% 5.00% 0.00% 0.00% 10.00% 90.00%
499 Wood 0.00% 11.54% 0.00% 0.00% 3.85% 0.00% 0.00% 15.38% 84.62%
501 Yoakum 0.00% 20.00% 0.00% 0.00% 0.00% 0.00% 0.00% 20.00% 80.00%
503 Young 8.33% 16.67% 0.00% 0.00% 8.33% 0.00% 0.00% 33.33% 66.67%
505 Zapata 0.00% 66.67% 0.00% 0.00% 0.00% 11.11% 0.00% 77.78% 22.22%
507 Zavala 0.00% 40.00% 0.00% 0.00% 0.00% 0.00% 0.00% 40.00% 60.00%
Statewide 3.79% 16.55% 8.37% 0.10% 8.76% 4.29% 0.30% 42.15% 57.85%
Table B-3 (continued)Proportion of Each Type of Financial Institution by County
FIPS County Pawn- Pawn- Code Name EXP Other
CI SIG EXP PSR Pawn OLLs Banks

50
Table B-4Number of Each Type of Financial Institution by County
Column Headings:
CI – consumer installment lenders
SIG – signature lenders
EXP – payday lenders with exported rates
PSR – payday lenders with state rates
Pawn-EXP– licensees with both pawn and payday export lending
Pawn-Other– licensees with both pawn and another type of lending
OLLs – OCCC-licensed locations
FIPS County Pawn- Pawn- Code Name EXP Other
1 Anderson 2 6 0 0 2 0 1 11 12
3 Andrews 0 4 0 0 0 0 0 4 5
5 Angelina 3 12 2 0 6 0 0 23 23
7 Aransas 0 1 1 0 2 0 0 4 6
9 Archer 0 0 0 0 0 0 0 0 4
11 Armstrong 0 0 0 0 0 0 0 0 1
13 Atascosa 0 8 1 0 2 0 0 11 9
15 Austin 0 4 0 0 1 0 0 5 9
17 Bailey 0 1 0 0 0 0 0 1 2
19 Bandera 0 1 0 0 1 0 0 2 5
21 Bastrop 0 0 0 0 2 1 0 3 15
23 Baylor 0 0 0 0 0 0 0 0 3
25 Bee 0 8 3 0 3 0 0 14 4
27 Bell 6 24 10 0 21 4 0 65 46
29 Bexar 27 91 67 0 55 35 0 275 228
31 Blanco 0 0 0 0 0 0 0 0 6
33 Borden 0 0 0 0 0 0 0 0 0
35 Bosque 0 1 0 0 1 0 0 2 9
37 Bowie 4 16 1 0 4 2 0 27 25
39 Brazoria 3 11 3 0 9 2 1 29 56
41 Brazos 5 12 5 0 7 2 0 31 36
43 Brewster 0 2 0 0 0 0 0 2 4
45 Briscoe 0 0 0 0 0 0 0 0 2
CI SIG EXP PSR Pawn OLLs Banks

51
47 Brooks 0 4 0 0 0 1 0 5 3
49 Brown 1 6 0 0 4 1 0 12 13
51 Burleson 0 0 0 0 0 0 0 0 8
53 Burnet 0 6 0 0 3 0 0 9 13
55 Caldwell 0 5 0 0 1 1 0 7 6
57 Calhoun 0 3 0 0 1 0 0 4 7
59 Callahan 0 0 0 0 1 0 0 1 4
61 Cameron 10 66 13 1 8 17 0 115 64
63 Camp 0 0 0 0 1 0 0 1 5
65 Carson 0 0 0 0 0 0 0 0 4
67 Cass 1 7 0 0 1 0 0 9 11
69 Castro 0 0 0 0 0 0 0 0 4
71 Chambers 0 1 0 0 0 0 1 2 8
73 Cherokee 1 7 2 0 3 0 2 15 13
75 Childress 0 2 0 0 0 0 0 2 4
77 Clay 0 1 0 0 0 0 0 1 4
79 Cochran 0 0 0 0 0 0 0 0 2
81 Coke 0 0 0 0 0 0 0 0 2
83 Coleman 0 1 0 0 1 0 0 2 6
85 Collin 5 7 9 0 9 0 0 30 155
87 Collingsworth 0 0 0 0 0 0 0 0 2
89 Colorado 0 0 0 0 0 0 0 0 13
91 Comal 2 4 1 0 4 0 1 12 21
93 Comanche 0 0 0 0 1 0 0 1 8
95 Concho 0 0 0 0 0 0 0 0 2
97 Cooke 0 1 1 0 1 1 0 4 11
99 Coryell 0 4 3 0 2 2 0 11 20
101 Cottle 0 0 0 0 0 0 0 0 2
103 Crane 0 1 0 0 0 0 0 1 2
105 Crockett 0 0 0 0 0 0 0 0 3
107 Crosby 0 0 0 0 1 0 0 1 5
109 Culberson 0 0 0 0 0 0 0 0 1
111 Dallam 0 2 0 0 0 0 0 2 6
Table B-4 (continued)Number of Each Type of Financial Institution by County
FIPS County Pawn- Pawn- Code Name EXP Other
CI SIG EXP PSR Pawn OLLs Banks

52
113 Dallas 33 38 118 0 96 35 0 320 519
115 Dawson 0 4 0 0 0 0 0 4 3
117 Deaf Smith 0 2 0 0 1 0 0 3 4
119 Delta 0 0 0 0 0 0 0 0 4
121 Denton 8 9 15 0 10 2 0 44 109
123 De Witt 0 6 0 0 2 0 0 8 13
125 Dickens 0 0 0 0 0 0 0 0 1
127 Dimmit 0 7 0 0 0 0 0 7 3
129 Donley 0 0 0 0 0 0 0 0 3
131 Duval 0 3 0 0 0 0 0 3 3
133 Eastland 0 0 0 0 1 0 0 1 9
135 Ector 4 14 4 0 6 5 0 33 26
137 Edwards 0 0 0 0 0 0 0 0 1
139 Ellis 0 9 1 0 8 0 0 18 27
141 El Paso 20 100 21 0 13 19 1 174 70
143 Erath 0 4 1 0 3 0 0 8 14
145 Falls 0 2 0 0 0 0 1 3 9
147 Fannin 0 3 2 0 2 0 0 7 12
149 Fayette 0 1 0 0 1 0 0 2 16
151 Fisher 0 0 0 0 0 0 0 0 2
153 Floyd 0 0 0 0 0 0 0 0 4
155 Foard 0 0 0 0 0 0 0 0 1
157 Fort Bend 3 9 6 0 6 3 0 27 76
159 Franklin 0 0 0 0 0 0 0 0 5
161 Freestone 0 3 0 0 1 0 0 4 10
163 Frio 0 5 0 0 0 0 0 5 4
165 Gaines 0 2 0 0 0 0 0 2 3
167 Galveston 3 11 8 0 14 3 0 39 76
169 Garza 0 0 0 0 0 0 0 0 2
171 Gillespie 0 2 0 0 1 0 0 3 11
173 Glasscock 0 0 0 0 0 0 0 0 1
175 Goliad 0 0 0 0 0 0 0 0 2
177 Gonzales 0 7 0 0 1 0 0 8 7
Table B-4 (continued)Number of Each Type of Financial Institution by County
FIPS County Pawn- Pawn- Code Name EXP OtherCI SIG EXP PSR Pawn OLLs Banks

53
179 Gray 0 3 1 0 1 1 0 6 8
181 Grayson 3 10 2 0 10 1 0 26 41
183 Gregg 7 20 5 0 13 1 0 46 44
185 Grimes 0 3 0 0 0 0 0 3 7
187 Guadalupe 1 10 2 0 1 2 0 16 17
189 Hale 2 8 1 0 1 1 0 13 11
191 Hall 0 0 0 0 0 0 0 0 4
193 Hamilton 0 0 0 0 1 0 0 1 5
195 Hansford 0 0 0 0 0 0 0 0 4
197 Hardeman 0 0 0 0 0 0 0 0 4
199 Hardin 0 5 1 0 3 0 0 9 10
201 Harris 38 59 194 1 114 79 4 489 772
203 Harrison 1 13 1 0 3 1 0 19 18
205 Hartley 0 0 0 0 0 0 0 0 1
207 Haskell 0 0 0 0 0 0 0 0 5
209 Hays 1 13 1 0 5 1 0 21 26
211 Hemphill 0 0 0 0 0 0 0 0 1
213 Henderson 0 6 1 0 4 0 0 11 20
215 Hidalgo 13 102 18 1 7 22 0 163 107
217 Hill 1 7 0 0 4 0 0 12 16
219 Hockley 0 4 0 0 2 1 0 7 9
221 Hood 0 2 1 0 3 0 0 6 16
223 Hopkins 0 4 0 0 3 0 0 7 11
225 Houston 0 3 0 0 1 0 0 4 9
227 Howard 1 7 1 0 2 1 0 12 7
229 Hudspeth 0 0 0 0 0 0 0 0 1
231 Hunt 2 8 1 0 5 0 0 16 18
233 Hutchinson 0 3 0 0 1 0 0 4 5
235 Irion 0 0 0 0 0 0 0 0 1
237 Jack 0 0 0 0 0 0 0 0 4
239 Jackson 1 1 0 0 1 0 0 3 7
241 Jasper 0 7 2 0 4 0 0 13 11
243 Jeff Davis 0 0 0 0 0 0 0 0 1
Table B-4 (continued)Number of Each Type of Financial Institution by County
FIPS County Pawn- Pawn- Code Name EXP Other
CI SIG EXP PSR Pawn OLLs Banks

54
245 Jefferson 6 13 8 0 9 4 0 40 53
247 Jim Hogg 0 2 0 0 0 0 0 2 3
249 Jim Wells 3 12 2 0 0 3 0 20 7
251 Johnson 1 9 3 0 9 0 0 22 31
253 Jones 0 1 0 0 0 0 0 1 7
255 Karnes 0 1 0 0 0 0 0 1 5
257 Kaufman 0 7 2 0 2 1 1 13 19
259 Kendall 0 1 0 0 1 0 0 2 11
261 Kenedy 0 0 0 0 0 0 0 0 0
263 Kent 0 0 0 0 0 0 0 0 1
265 Kerr 0 4 1 0 2 0 0 7 14
267 Kimble 0 0 0 0 0 0 0 0 2
269 King 0 0 0 0 0 0 0 0 0
271 Kinney 0 0 0 0 0 0 0 0 1
273 Kleberg 2 9 2 0 0 3 0 16 9
275 Knox 0 0 0 0 0 0 0 0 2
277 Lamar 2 10 0 0 4 1 0 17 15
279 Lamb 0 1 0 0 0 0 0 1 14
281 Lampasas 0 1 0 0 1 0 0 2 7
283 La Salle 0 0 0 0 0 0 0 0 1
285 Lavaca 0 0 0 0 0 0 0 0 8
287 Lee 0 2 0 0 1 0 0 3 9
289 Leon 0 0 0 0 0 0 0 0 8
291 Liberty 0 7 1 0 1 0 2 11 13
293 Limestone 0 3 1 0 1 0 0 5 10
295 Lipscomb 0 0 0 0 0 0 0 0 5
297 Live Oak 0 1 0 0 0 0 0 1 4
299 Llano 0 0 0 0 0 0 0 0 11
301 Loving 0 0 0 0 0 0 0 0 0
303 Lubbock 7 14 3 0 8 6 0 38 76
305 Lynn 0 0 0 0 0 0 0 0 4
307 McCulloch 0 2 0 0 1 0 0 3 3
309 McLennan 5 24 7 0 12 6 0 54 45
Table B-4 (continued)Number of Each Type of Financial Institution by County
FIPS County Pawn- Pawn- Code Name EXP OtherCI SIG EXP PSR Pawn OLLs Banks

55
311 McMullen 0 0 0 0 0 0 0 0 1
313 Madison 0 0 1 0 0 0 0 1 5
315 Marion 0 2 0 0 0 0 0 2 3
317 Martin 0 0 0 0 0 0 0 0 2
319 Mason 0 0 0 0 0 0 0 0 3
321 Matagorda 2 4 0 0 1 1 0 8 7
323 Maverick 2 20 0 0 0 4 0 26 7
325 Medina 0 9 0 0 2 0 0 11 13
327 Menard 0 0 0 0 0 0 0 0 2
329 Midland 3 13 4 0 2 4 0 26 38
331 Milam 0 4 0 0 0 0 0 4 10
333 Mills 0 0 0 0 0 0 0 0 2
335 Mitchell 0 1 0 0 0 0 0 1 3
337 Montague 0 1 0 0 1 0 0 2 7
339 Montgomery 3 10 7 0 12 4 0 36 88
341 Moore 0 2 0 0 0 1 0 3 6
343 Morris 0 1 0 0 0 0 0 1 9
345 Motley 0 0 0 0 0 0 0 0 1
347 Nacogdoches 1 9 2 0 4 0 0 16 21
349 Navarro 1 9 1 0 2 0 0 13 15
351 Newton 0 1 0 0 1 0 0 2 2
353 Nolan 0 5 0 0 2 0 0 7 4
355 Nueces 7 36 32 0 14 12 1 102 77
357 Ochiltree 0 2 0 0 0 0 0 2 3
359 Oldham 0 0 0 0 0 0 0 0 1
361 Orange 1 4 0 0 5 1 0 11 19
363 Palo Pinto 0 3 0 0 3 0 0 6 17
365 Panola 0 5 0 0 1 0 0 6 5
367 Parker 1 5 2 0 5 0 0 13 18
369 Parmer 0 0 0 0 0 0 0 0 5
371 Pecos 1 7 0 0 0 0 0 8 5
373 Polk 0 4 0 0 2 0 1 7 10
375 Potter 4 12 2 0 6 2 1 27 31
Table B-4 (continued)Number of Each Type of Financial Institution by County
FIPS County Pawn- Pawn- Code Name EXP Other
CI SIG EXP PSR Pawn OLLs Banks

56
377 Presidio 0 1 0 0 0 0 0 1 3
379 Rains 0 0 0 0 0 0 0 0 4
381 Randall 2 2 2 0 2 1 0 9 24
383 Reagan 0 0 0 0 0 0 0 0 1
385 Real 0 0 0 0 0 0 0 0 2
387 Red River 0 4 0 0 1 0 0 5 6
389 Reeves 0 2 0 0 0 0 0 2 2
391 Refugio 0 0 0 0 0 0 0 0 3
393 Roberts 0 0 0 0 0 0 0 0 1
395 Robertson 0 0 0 0 1 0 0 1 5
397 Rockwall 1 0 1 0 1 0 0 3 15
399 Runnels 0 0 0 0 0 0 0 0 9
401 Rusk 0 8 0 0 2 0 1 11 12
403 Sabine 0 0 0 0 0 0 0 0 5
405 San Augustine 0 0 0 0 1 0 0 1 5
407 San Jacinto 0 0 0 0 0 0 0 0 4
409 San Patricio 0 9 6 0 4 1 0 20 19
411 San Saba 0 0 0 0 0 0 0 0 2
413 Schleicher 0 0 0 0 0 0 0 0 1
415 Scurry 0 5 0 0 2 0 0 7 6
417 Shackelford 0 0 0 0 0 0 0 0 2
419 Shelby 0 7 0 0 2 0 0 9 11
421 Sherman 0 0 0 0 0 0 0 0 2
423 Smith 7 19 6 0 11 4 2 49 60
425 Somervell 0 0 0 0 1 0 0 1 3
427 Starr 1 19 0 0 1 3 0 24 9
429 Stephens 0 4 0 0 1 0 0 5 4
431 Sterling 0 0 0 0 0 0 0 0 1
433 Stonewall 0 0 0 0 0 0 0 0 1
435 Sutton 0 0 0 0 0 0 0 0 2
437 Swisher 0 0 0 0 0 0 0 0 5
439 Tarrant 25 23 76 4 50 29 2 209 339
441 Taylor 4 12 2 1 6 3 1 29 39
Table B-4 (continued)Number of Each Type of Financial Institution by County
FIPS County Pawn- Pawn- Code Name EXP Other
CI SIG EXP PSR Pawn OLLs Banks

57
443 Terrell 0 0 0 0 0 0 0 0 1
445 Terry 0 4 0 0 1 0 0 5 4
447 Throckmorton 0 0 0 0 0 0 0 0 3
449 Titus 1 12 1 0 2 0 0 16 11
451 Tom Green 4 14 4 0 8 2 0 32 29
453 Travis 16 25 22 0 23 22 0 108 186
455 Trinity 0 0 0 0 1 0 0 1 3
457 Tyler 0 2 0 0 1 0 0 3 7
459 Upshur 0 3 0 0 1 0 0 4 10
461 Upton 0 0 0 0 0 0 0 0 2
463 Uvalde 0 8 1 0 0 1 1 11 7
465 Val Verde 2 19 0 0 0 2 1 24 8
467 Van Zandt 0 0 1 0 1 0 0 2 17
469 Victoria 2 18 5 0 4 3 0 32 19
471 Walker 1 8 4 0 2 2 0 17 10
473 Waller 0 2 0 0 0 0 0 2 6
475 Ward 0 3 1 0 0 0 0 4 3
477 Washington 1 7 0 0 1 0 0 9 9
479 Webb 5 34 5 0 10 12 0 66 36
481 Wharton 1 11 0 0 1 0 1 14 19
483 Wheeler 0 0 0 0 0 0 0 0 5
485 Wichita 4 13 7 1 11 1 0 37 35
487 Wilbarger 0 3 1 0 0 0 0 4 7
489 Willacy 0 4 1 0 0 1 0 6 4
491 Williamson 2 13 2 0 9 1 0 27 77
493 Wilson 0 4 0 0 1 0 0 5 9
495 Winkler 0 2 0 0 0 0 0 2 4
497 Wise 0 1 0 0 1 0 0 2 18
499 Wood 0 3 0 0 1 0 0 4 22
501 Yoakum 0 1 0 0 0 0 0 1 4
503 Young 1 2 0 0 1 0 0 4 8
505 Zapata 0 6 0 0 0 1 0 7 2
507 Zavala 0 2 0 0 0 0 0 2 3
State Totals 344 1,501 759 9 794 389 27 3,823 5,246
Table B-4 (continued)Number of Each Type of Financial Institution by County
FIPS County Pawn- Pawn- Code Name EXP Other
CI SIG EXP PSR Pawn OLLs Banks

58
Table B-5County Demographic Data
FIPS County Metropolitan Border Total Percent Percent inCode Name Status Status Population Minority Poverty
1 Anderson Rural Non-Border 55,109 36.92% 16.47%
3 Andrews Rural Non-Border 13,004 43.69% 16.42%
5 Angelina Rural Non-Border 80,130 30.59% 15.78%
7 Aransas Suburban Non-Border 22,497 26.23% 19.91%
9 Archer Suburban Non-Border 8,854 6.67% 8.96%
11 Armstrong Suburban Non-Border 2,148 6.52% 10.61%
13 Atascosa Suburban Non-Border 38,628 60.43% 20.20%
15 Austin Suburban Non-Border 23,590 28.09% 12.05%
17 Bailey Rural Non-Border 6,594 49.70% 16.67%
19 Bandera Suburban Non-Border 17,645 15.94% 10.83%
21 Bastrop Suburban Non-Border 57,733 34.59% 11.62%
23 Baylor Rural Non-Border 4,093 14.22% 16.12%
25 Bee Rural Non-Border 32,359 64.92% 23.96%
27 Bell Metropolitan Non-Border 237,974 42.75% 12.08%
29 Bexar Metropolitan Non-Border 1,392,931 64.37% 15.87%
31 Blanco Rural Non-Border 8,418 17.89% 11.17%
33 Borden Rural Non-Border 729 14.40% 13.99%
35 Bosque Rural Non-Border 17,204 15.68% 12.67%
37 Bowie Metropolitan Non-Border 89,306 29.78% 17.67%
39 Brazoria Suburban Non-Border 241,767 34.63% 10.18%
41 Brazos Metropolitan Non-Border 152,415 33.97% 26.90%
43 Brewster Rural Border 8,866 46.88% 18.18%
45 Briscoe Rural Non-Border 1,790 26.31% 16.00%
47 Brooks Rural Non-Border 7,976 92.06% 40.16%
49 Brown Rural Non-Border 37,674 20.97% 17.22%
51 Burleson Suburban Non-Border 16,470 31.02% 17.21%
53 Burnet Rural Non-Border 34,147 17.95% 10.90%
55 Caldwell Suburban Non-Border 32,194 50.52% 13.07%
57 Calhoun Suburban Non-Border 20,647 47.82% 16.38%
59 Callahan Suburban Non-Border 12,905 8.39% 12.25%
61 Cameron Metropolitan Border 335,227 85.48% 33.05%
63 Camp Rural Non-Border 11,549 35.00% 20.86%
65 Carson Suburban Non-Border 6,516 9.39% 7.29%

59
67 Cass Rural Non-Border 30,438 22.66% 17.69%
69 Castro Rural Non-Border 8,285 54.56% 19.01%
71 Chambers Suburban Non-Border 26,031 22.36% 11.02%
73 Cherokee Rural Non-Border 46,659 30.67% 17.86%
75 Childress Rural Non-Border 7,688 35.97% 17.58%
77 Clay Suburban Non-Border 11,006 6.26% 10.31%
79 Cochran Rural Non-Border 3,730 50.03% 26.99%
81 Coke Rural Non-Border 3,864 20.32% 13.02%
83 Coleman Rural Non-Border 9,235 17.72% 19.86%
85 Collin Suburban Non-Border 491,675 23.91% 4.87%
87 Collingsworth Rural Non-Border 3,206 28.60% 18.71%
89 Colorado Rural Non-Border 20,390 35.43% 16.23%
91 Comal Suburban Non-Border 78,021 25.22% 8.57%
93 Comanche Rural Non-Border 14,026 22.67% 17.34%
95 Concho Rural Non-Border 3,966 42.89% 11.90%
97 Cooke Rural Non-Border 36,363 15.23% 14.15%
99 Coryell Suburban Non-Border 74,978 39.47% 9.47%
101 Cottle Rural Non-Border 1,904 29.20% 18.40%
103 Crane Rural Non-Border 3,996 47.87% 13.45%
105 Crockett Rural Non-Border 4,099 56.28% 19.36%
107 Crosby Suburban Non-Border 7,072 53.32% 28.08%
109 Culberson Rural Non-Border 2,975 75.36% 25.08%
111 Dallam Rural Non-Border 6,222 31.58% 14.10%
113 Dallas Metropolitan Non-Border 2,218,899 55.68% 13.43%
115 Dawson Rural Non-Border 14,985 57.63% 19.70%
117 Deaf Smith Rural Non-Border 18,561 59.64% 20.55%
119 Delta Suburban Non-Border 5,327 13.35% 17.59%
121 Denton Suburban Non-Border 432,976 24.05% 6.62%
123 De Witt Rural Non-Border 20,013 39.20% 19.63%
125 Dickens Rural Non-Border 2,762 32.77% 17.40%
127 Dimmit Rural Non-Border 10,248 86.83% 33.24%
129 Donley Rural Non-Border 3,828 11.91% 15.91%
131 Duval Rural Non-Border 13,120 88.93% 27.17%
Table B-5 (continued)County Demographic Data
FIPS County Metropolitan Border Total Percent Percent inCode Name Status Status Population Minority Poverty

60
133 Eastland Rural Non-Border 18,297 14.27% 16.81%
135 Ector Metropolitan Non-Border 121,123 48.67% 18.71%
137 Edwards Rural Non-Border 2,162 46.30% 31.56%
139 Ellis Suburban Non-Border 111,360 28.70% 8.60%
141 El Paso Metropolitan Border 679,622 83.00% 23.81%
143 Erath Rural Non-Border 33,001 17.37% 16.03%
145 Falls Rural Non-Border 18,576 44.21% 22.62%
147 Fannin Rural Non-Border 31,242 15.82% 13.95%
149 Fayette Rural Non-Border 21,804 20.79% 11.42%
151 Fisher Rural Non-Border 4,344 25.18% 17.49%
153 Floyd Rural Non-Border 7,771 50.14% 21.50%
155 Foard Rural Non-Border 1,622 21.27% 14.27%
157 Fort Bend Suburban Non-Border 354,452 53.79% 7.15%
159 Franklin Rural Non-Border 9,458 14.05% 15.58%
161 Freestone Rural Non-Border 17,867 28.23% 14.24%
163 Frio Rural Non-Border 16,252 79.42% 28.96%
165 Gaines Rural Non-Border 14,467 39.15% 21.72%
167 Galveston Metropolitan Non-Border 250,158 36.90% 13.22%
169 Garza Rural Non-Border 4,872 43.35% 22.34%
171 Gillespie Rural Non-Border 20,814 17.21% 10.19%
173 Glasscock Rural Non-Border 1,406 32.08% 14.74%
175 Goliad Suburban Non-Border 6,928 40.60% 16.44%
177 Gonzales Rural Non-Border 18,628 48.79% 18.55%
179 Gray Rural Non-Border 22,744 21.74% 13.83%
181 Grayson Metropolitan Non-Border 110,595 16.04% 11.27%
183 Gregg Metropolitan Non-Border 111,379 31.00% 15.09%
185 Grimes Rural Non-Border 23,552 37.28% 16.61%
187 Guadalupe Suburban Non-Border 89,023 40.62% 9.82%
189 Hale Rural Non-Border 36,602 54.85% 17.97%
191 Hall Rural Non-Border 3,782 36.62% 26.32%
193 Hamilton Rural Non-Border 8,229 8.88% 14.23%
195 Hansford Rural Non-Border 5,369 32.87% 16.41%
197 Hardeman Rural Non-Border 4,724 21.02% 17.79%
Table B-5 (continued)County Demographic Data
FIPS County Metropolitan Border Total Percent Percent inCode Name Status Status Population Minority Poverty

61
199 Hardin Suburban Non-Border 48,073 10.68% 11.18%
201 Harris Metropolitan Non-Border 3,400,578 57.88% 14.97%
203 Harrison Rural Non-Border 62,110 30.70% 16.67%
205 Hartley Rural Non-Border 5,537 22.88% 6.59%
207 Haskell Rural Non-Border 6,093 24.50% 22.83%
209 Hays Suburban Non-Border 97,589 35.50% 14.26%
211 Hemphill Rural Non-Border 3,351 18.77% 12.57%
213 Henderson Rural Non-Border 73,277 15.22% 15.06%
215 Hidalgo Metropolitan Border 569,463 89.57% 35.87%
217 Hill Rural Non-Border 32,321 22.41% 15.67%
219 Hockley Rural Non-Border 22,716 42.09% 18.90%
221 Hood Rural Non-Border 41,100 9.51% 8.51%
223 Hopkins Rural Non-Border 31,960 18.82% 14.60%
225 Houston Rural Non-Border 23,185 36.27% 20.95%
227 Howard Rural Non-Border 33,627 43.21% 18.58%
229 Hudspeth Rural Border 3,344 76.97% 35.77%
231 Hunt Suburban Non-Border 76,596 20.14% 12.78%
233 Hutchinson Rural Non-Border 23,857 19.92% 11.10%
235 Irion Suburban Non-Border 1,771 25.41% 8.41%
237 Jack Rural Non-Border 8,763 14.78% 12.95%
239 Jackson Rural Non-Border 14,391 33.67% 14.72%
241 Jasper Rural Non-Border 35,604 23.27% 18.06%
243 Jeff Davis Rural Border 2,207 37.65% 15.01%
245 Jefferson Metropolitan Non-Border 252,051 48.18% 17.37%
247 Jim Hogg Rural Non-Border 5,281 91.02% 25.95%
249 Jim Wells Rural Non-Border 39,326 77.11% 24.13%
251 Johnson Suburban Non-Border 126,811 16.84% 8.80%
253 Jones Suburban Non-Border 20,785 33.84% 16.80%
255 Karnes Rural Non-Border 15,446 59.15% 21.89%
257 Kaufman Suburban Non-Border 71,313 23.68% 10.50%
259 Kendall Suburban Non-Border 23,743 19.54% 10.50%
261 Kenedy Rural Non-Border 414 79.71% 15.33%
263 Kent Rural Non-Border 859 9.55% 10.35%
Table B-5 (continued)County Demographic Data
FIPS County Metropolitan Border Total Percent Percent inCode Name Status Status Population Minority Poverty

62
265 Kerr Rural Non-Border 43,653 22.57% 14.47%
267 Kimble Rural Non-Border 4,468 22.09% 18.78%
269 King Rural Non-Border 356 11.52% 20.68%
271 Kinney Rural Border 3,379 53.03% 24.04%
273 Kleberg Rural Non-Border 31,549 71.48% 26.71%
275 Knox Rural Non-Border 4,253 33.48% 22.91%
277 Lamar Rural Non-Border 48,499 19.35% 16.35%
279 Lamb Rural Non-Border 14,709 48.65% 20.94%
281 Lampasas Suburban Non-Border 17,762 20.50% 14.07%
283 La Salle Rural Non-Border 5,866 81.01% 29.77%
285 Lavaca Rural Non-Border 19,210 18.90% 13.23%
287 Lee Rural Non-Border 15,657 31.51% 11.87%
289 Leon Rural Non-Border 15,335 19.36% 15.55%
291 Liberty Suburban Non-Border 70,154 25.47% 14.33%
293 Limestone Rural Non-Border 22,051 33.29% 17.75%
295 Lipscomb Rural Non-Border 3,057 23.32% 16.74%
297 Live Oak Rural Non-Border 12,309 41.51% 16.50%
299 Llano Rural Non-Border 17,044 6.89% 10.32%
301 Loving Rural Non-Border 67 10.45% 0.00%
303 Lubbock Metropolitan Non-Border 242,628 37.47% 17.83%
305 Lynn Rural Non-Border 6,550 48.44% 22.64%
307 McCulloch Rural Non-Border 8,205 29.41% 22.48%
309 McLennan Metropolitan Non-Border 213,517 35.36% 17.61%
311 McMullen Rural Non-Border 851 34.67% 20.68%
313 Madison Rural Non-Border 12,940 39.71% 15.79%
315 Marion Rural Non-Border 10,941 28.54% 22.36%
317 Martin Rural Non-Border 4,746 43.19% 18.73%
319 Mason Rural Non-Border 3,738 22.10% 13.20%
321 Matagorda Rural Non-Border 37,957 47.57% 18.50%
323 Maverick Rural Border 47,297 96.60% 34.85%
325 Medina Suburban Non-Border 39,304 49.32% 15.43%
327 Menard Rural Non-Border 2,360 33.60% 25.79%
329 Midland Metropolitan Non-Border 116,009 37.92% 12.90%
Table B-5 (continued)County Demographic Data
FIPS County Metropolitan Border Total Percent Percent inCode Name Status Status Population Minority Poverty

63
331 Milam Rural Non-Border 24,238 30.84% 15.92%
333 Mills Rural Non-Border 5,151 15.22% 18.35%
335 Mitchell Rural Non-Border 9,698 44.93% 17.67%
337 Montague Rural Non-Border 19,117 7.32% 13.97%
339 Montgomery Suburban Non-Border 293,768 18.59% 9.39%
341 Moore Rural Non-Border 20,121 50.11% 13.49%
343 Morris Rural Non-Border 13,048 29.36% 18.28%
345 Motley Rural Non-Border 1,426 17.81% 19.44%
347 Nacogdoches Rural Non-Border 59,203 29.70% 23.32%
349 Navarro Rural Non-Border 45,124 34.41% 18.15%
351 Newton Rural Non-Border 15,072 25.98% 19.09%
353 Nolan Rural Non-Border 15,802 33.68% 21.68%
355 Nueces Metropolitan Non-Border 313,645 62.32% 18.19%
357 Ochiltree Rural Non-Border 9,006 33.69% 12.96%
359 Oldham Rural Non-Border 2,185 15.24% 19.77%
361 Orange Suburban Non-Border 84,966 14.14% 13.75%
363 Palo Pinto Rural Non-Border 27,026 17.99% 15.88%
365 Panola Rural Non-Border 22,756 22.53% 14.13%
367 Parker Suburban Non-Border 88,495 10.75% 8.29%
369 Parmer Rural Non-Border 10,016 51.32% 16.97%
371 Pecos Rural Non-Border 16,809 66.64% 20.43%
373 Polk Rural Non-Border 41,133 25.31% 17.37%
375 Potter Metropolitan Non-Border 113,546 42.34% 19.20%
377 Presidio Rural Border 7,304 85.23% 36.36%
379 Rains Rural Non-Border 9,139 10.46% 14.85%
381 Randall Suburban Non-Border 104,312 14.27% 8.07%
383 Reagan Rural Non-Border 3,326 53.55% 11.83%
385 Real Rural Non-Border 3,047 24.32% 21.23%
387 Red River Rural Non-Border 14,314 24.07% 17.35%
389 Reeves Rural Non-Border 13,137 76.17% 28.89%
391 Refugio Rural Non-Border 7,828 52.70% 17.78%
393 Roberts Rural Non-Border 887 4.17% 7.16%
395 Robertson Suburban Non-Border 16,000 40.13% 20.64%
Table B-5 (continued)County Demographic Data
FIPS County Metropolitan Border Total Percent Percent inCode Name Status Status Population Minority Poverty

64
397 Rockwall Suburban Non-Border 43,080 16.86% 4.68%
399 Runnels Rural Non-Border 11,495 32.21% 19.17%
401 Rusk Suburban Non-Border 47,372 28.78% 14.64%
403 Sabine Rural Non-Border 10,469 12.93% 15.93%
405 San Augustine Rural Non-Border 8,946 32.19% 21.18%
407 San Jacinto Suburban Non-Border 22,246 19.21% 18.82%
409 San Patricio Suburban Non-Border 67,138 54.20% 18.02%
411 San Saba Rural Non-Border 6,186 25.28% 16.61%
413 Schleicher Rural Non-Border 2,935 45.66% 21.52%
415 Scurry Rural Non-Border 16,361 34.77% 15.98%
417 Shackelford Rural Non-Border 3,302 8.72% 13.58%
419 Shelby Rural Non-Border 25,224 30.37% 19.40%
421 Sherman Rural Non-Border 3,186 28.97% 16.15%
423 Smith Metropolitan Non-Border 174,706 32.12% 13.78%
425 Somervell Rural Non-Border 6,809 15.36% 8.56%
427 Starr Rural Border 53,597 97.98% 50.89%
429 Stephens Rural Non-Border 9,674 18.74% 15.62%
431 Sterling Rural Non-Border 1,393 31.44% 16.83%
433 Stonewall Rural Non-Border 1,693 16.60% 19.32%
435 Sutton Rural Non-Border 4,077 52.56% 17.96%
437 Swisher Rural Non-Border 8,378 42.12% 17.36%
439 Tarrant Metropolitan Non-Border 1,446,219 38.10% 10.59%
441 Taylor Metropolitan Non-Border 126,555 27.31% 14.55%
443 Terrell Rural Border 1,081 51.06% 25.21%
445 Terry Rural Non-Border 12,761 50.23% 23.25%
447 Throckmorton Rural Non-Border 1,850 10.54% 13.47%
449 Titus Rural Non-Border 28,118 40.32% 18.49%
451 Tom Green Metropolitan Non-Border 104,010 37.02% 15.20%
453 Travis Metropolitan Non-Border 812,280 43.64% 12.53%
455 Trinity Rural Non-Border 13,779 18.07% 17.63%
457 Tyler Rural Non-Border 20,871 17.16% 15.79%
459 Upshur Suburban Non-Border 35,291 15.76% 14.90%
461 Upton Rural Non-Border 3,404 45.53% 19.92%
Table B-5 (continued)County Demographic Data
FIPS County Metropolitan Border Total Percent Percent inCode Name Status Status Population Minority Poverty

65
463 Uvalde Rural Non-Border 25,926 67.33% 24.28%
465 Val Verde Rural Border 44,856 78.30% 26.13%
467 Van Zandt Rural Non-Border 48,140 11.47% 13.30%
469 Victoria Metropolitan Non-Border 84,088 47.09% 12.94%
471 Walker Rural Non-Border 61,758 39.94% 18.38%
473 Waller Suburban Non-Border 32,663 50.13% 16.00%
475 Ward Rural Non-Border 10,909 47.80% 17.93%
477 Washington Rural Non-Border 30,373 29.16% 12.90%
479 Webb Metropolitan Border 193,117 95.08% 31.17%
481 Wharton Rural Non-Border 41,188 46.99% 16.54%
483 Wheeler Rural Non-Border 5,284 16.99% 12.99%
485 Wichita Metropolitan Non-Border 131,664 26.71% 13.19%
487 Wilbarger Rural Non-Border 14,676 31.30% 13.06%
489 Willacy Rural Non-Border 20,082 88.30% 33.21%
491 Williamson Suburban Non-Border 249,967 26.45% 4.79%
493 Wilson Suburban Non-Border 32,408 39.13% 11.32%
495 Winkler Rural Non-Border 7,173 46.68% 18.68%
497 Wise Suburban Non-Border 48,793 13.94% 9.85%
499 Wood Rural Non-Border 36,752 13.34% 14.30%
501 Yoakum Rural Non-Border 7,322 48.20% 19.56%
503 Young Rural Non-Border 17,943 13.51% 15.69%
505 Zapata Rural Border 12,182 85.46% 35.81%
507 Zavala Rural Non-Border 11,600 92.03% 41.77%
Statewide 20,851,820 47.57% 15.37%
Table B-5 (continued)County Demographic Data
FIPS County Metropolitan Border Total Percent Percent inCode Name Status Status Population Minority Poverty

67
Appendix C: Survey of OCCC Licensees
The purpose of this appendix is to describe the statistical plan of the licensee sample. Each major aspect of this plan is described in its own section. Because this research took place within the context of the work schedule of OCCC examiners, that context provided the initial framework for planning the fi eldwork and for designing the sampling plan.
Work Schedule of the Examiners
Before each quarter, OCCC staff members prepare a list of licensees to examine during that quarter. Licensees are selected on a risk-based assessment, with priority given to licensees about whom the OCCC has received complaints or the need for more frequent examination was indicated because of previous examination results. Other licensees are scheduled for examination within about two years of their previous examination. Most licensees scheduled for examination during a quarter met at least one of these three criteria.
The OCCC examiners are engaged with these examinations on an ongoing basis. One implication is that there was not an available group of examiners to examine the necessary number of licensees needed for an independent sample. We integrated the sampling plan with the examination process so that the scheduled examinations served both purposes of examining the licensees and collecting the survey data.
Sampling Plan
The overall approach was to use what is popularly known as scientifi c sampling, or probability-based random sampling. This sampling technique meets contemporary public policy sampling standards. The main performance criteria of scientifi c sampling methods are that they simultaneously insure impartiality, produce unbiased estimates, and maximize precision for a fi xed cost.
The main design issue for the sample was the need to integrate the two purposes described above. This was accomplished with stratifi cation. One design stratum contained scheduled licensees that were sampled with certainty, in the manner of a census; that is, the licensees that were scheduled for examination were brought into the sample in their own stratum. Another design stratum contained licensees that were sampled randomly. The remaining design strata were the fi ve lender types: consumer installment, signature, payday export rate, payday state rate, and pawn. These design strata generated 10 (2 by 5) analytic strata.

68
Within strata, clusters were defi ned at the fi rst stage as licensees; that is, a company with fi ve branches was represented for sampling as fi ve separate records. For sampled licensees, the examiners were instructed for the second stage to collect data for fi ve randomly selected loans or all loans, whichever number was smaller. To summarize, the sampling design was stratifi ed two-stage. The two stages are licensees and loans within licensees. Table C-1 describes the population and the sample for the two stages. The 10 rows in Table C-2 describe the 10 strata.
Table C-1Number of Licensees and Loans for the Study by Type of Lender
Licensees in Licensees in OCCC Study Population* Population**
Consumer Installment
Signature 1,513 1,504 280 1,400
Payday Using Exported Rates
Payday Using State Rates
Pawn 1,210 1,204 250 1,250
TOTAL 4,239 4,212 863 4,313
*Includes only lenders that had active licenses during both the study period (January through June 2003) and the data collection period (February through July 2004).**Twenty-seven licensees were excluded from the Study Population because they were on the OCCC schedule (and therefore not available for the random sample) but no usable data were collected. Most of these licensees made no loans during the study period or they were closed before data could be collected. Four of these licensees provide more than one type of loan product and data were collected for the wrong type of loan product.
Type Lender Licenseesin Sample
Loans inSample
1,148 1,138 230 1,150
23 22 5 25
345 344 98 488

69
Signature
Pawn
Table C-2Number of Licensees and Number of Loans by Stratum
Licensees Licensees Loans in OCCC in Study in Population Population Sample
Consumer Scheduled 80 79 79 393
Installment Random 265 265 19 95
Scheduled 239 230 230 1,150
Random 1,274 1,274 50 250
Payday Using Scheduled 195 185 185 925
Exported Rates Random 953 953 45 225
Payday Using Scheduled 1 0 0 0
State Rates Random 22 22 5 25
Scheduled 205 199 199 995
Random 1,005 1,005 51 255
TOTAL 4,239 4,212 863 4,313
Calculation of weights. We chose a sampling design that did not use equal selection probabilities across all strata. We re-proportioned the selection probability of each record by assigning statistical weights. To accomplish this, each record was fi rst assigned an expansion weight equal to the reciprocal of its probability of selection and then assigned an additional relative weight to refl ect the sample size. These two weights were multiplied to produce the analytic weight for each record.
Statistical Performance of the Sampling Plan
Scientifi c samples are known for insuring impartiality and producing estimates that are not biased by the research design. An important additional criterion is statistical precision. Communicating the precision of analytic samples is complicated because they can result in many separate estimates, and each estimate generates a unique measure of precision. To optimize this detail, statistical samplers often summarize the precision obtained by a sample survey through the use of coeffi cients of variation.
A coeffi cient of variation is a number for each estimate that ranges from a low of 0 percent, representing the ideal of absolute precision, to a larger percentage that would indicate less precision than this unrealistic ideal. This coeffi cient of variation indicates the percent of an estimate that is sampling imprecision. A coeffi cient of variation of 10 percent means that 1/10th of the magnitude of an estimate is due to sampling imprecision and 90 percent of its magnitude is not.
Type Lender Stratum Licenseesin Sample

70
Table C-3 summarizes the obtained precision of this sample by reporting coeffi cients of variation (CV), which are calculated to be coding invariant. That is, it is appropriate to directly compare the coeffi cients of variation between two or more different types of information (such as APR and loan status).
Table C-3Coeffi cient of Variation by Type of Question
Questions of Major Importance CV
What types of documentation did you require 6%for the loans made in 2003?
Did everyone who qualifi ed for a loan receive 9%the same rate regardless of qualifi cations?
Did you typically conduct any credit check 8%before you made a loan?
Disclosed APR 4%
Was any part of this loan used to pay off a 7%previous loan with this company?
Loan status 9%
Overall average of these questions 7%
Thus, readers of this report can more easily keep in mind that the estimates they see have an acceptably low amount of sampling variability of less than 10 percent or, if they prefer, the complementary concept of high (90 percent or higher) precision.

71
Appendix D: Survey of Unlicensed Lenders
A mail survey, fi elded as part of the study, was designed to obtain state-level information about consumer loans made by lenders not licensed by the OCCC. To accomplish this, Texas counties were sampled, a list of lenders that did not appear to be licensed was prepared, and a mail survey was conducted.
Sample of Counties
All Texas counties were grouped according to two classifi cations: population density and border status. Counties were designated as Metropolitan, Suburban, or Rural as described in Appendix B. This classifi cation was used to produce groups of counties that could be characterized as having different population densities. To insure that counties along the Texas-Mexico border were suffi ciently represented, counties also were classifi ed as either “Border” (directly adjacent to Mexico) or “Non-border.” No border counties are classifi ed as “Suburban,” so fi ve groups resulted. Preliminary examinations of yellow pages listings indicated that potentially unlicensed lenders were much more common in the largest cities. Therefore, the four counties with the highest populations (Harris, Dallas, Tarrant, and Bexar) and the border county with the highest population (El Paso) were deliberately selected for the sample. Additional counties were randomly sampled from within each of the fi ve groups, and the resulting sample of counties is presented in Table D-1. Although these fi ve groups were used to select the counties, the sample was not designed to produce estimates at the group level.
Table D-1Counties Selected for Mail Survey of Potentially Unlicensed Lenders (N=29)*
Border Non-border
Metropolitan El Paso Bexar Dallas Harris Webb Midland Tarrant Tom Green
Suburban none** Armstrong Coryell Ellis
Bee Bosque Colorado Concho Crane FoardRural Hudspeth Hall Harrison Kenedy King La Salle Montague Oldham Palo Pinto Parmer Stonewall Wharton
*This metropolitan status classifi cation is based on the 2003 MSA defi nition from the Offi ce of Management and Budget.**No border counties are classifi ed as “Suburban.”

72
List of Lenders
Using the most recent local yellow pages for all towns in the sampled counties and the Greensheet, where it was available, TLC prepared a list of lenders and pawn shops that did not appear to be licensed by the OCCC.64 Lenders that met the following criteria were included:
• the business name and either the address or the phone number were not the same as that of an OCCC licensee;
• the business had a local address or a local phone number;
• the business address was in a sampled county;
• the name of the business did not indicate a type of business excluded from the study (e.g., banks, credit unions, mortgage lenders, automobile lenders, cash-for-title); and
• an Internet search did not indicate a type of business excluded from the study.
When more than one location was listed with the same business name, each location was considered to be a separate business. A total of 474 businesses appeared to meet the criteria listed above.
The list of 474 potentially unlicensed lenders was refi ned using AnyWho reverse look-up and phone calls. AnyWho was consulted to verify the business name and address.65 If AnyWho returned a different name or address than was in the yellow pages (or Greensheet), or if AnyWho did not return any information, the business was called to obtain the current name and address. The name and address was updated if the phone number was for a business that provided consumer loans and met the criteria listed above. The business was excluded if the address could not be verifi ed. The resulting list, now with new business names and addresses, was rechecked to eliminate duplicates, OCCC licensees, and businesses under investigation or in litigation with the OCCC.66 Of the 474 businesses on the list of potentially unlicensed lenders, 187 remained after this verifi cation process. Table D-2 summarizes the results of the verifi cation process.

73
Table D-2Status of All Potentially Unlicensed Lenders
Subcategory Number in Number in (explanation) Subcategory Category
Included inMailing List
Phone Disconnected 98
Could Not No AnswerVerify Address (repeated attempts) 140 29.54%
Refused to Provide Address
OCCC Licensee 44
Residence 32
Different Type of Business
Not Eligible Duplicate 12 128 27.00%
for Sample Located Outside of Sampled Area
Corporate Offi ce with No Lending
Closed 3
UnderInvestigationor in Litigationwith OCCC
TOTAL 474 100.00%
Mail Survey
The mail survey was conducted from April through June 2004, and included fi ve separate mailings: a prenotice letter, an initial cover letter and questionnaire, a postcard reminder (and thank you to respondents), a replacement cover letter and questionnaire sent only to nonrespondents, and a fi nal replacement letter and questionnaire sent by certifi ed mail to those that still did not respond.
Category Percent
38
22
9
6
187 39.45%
19 4.01%
4
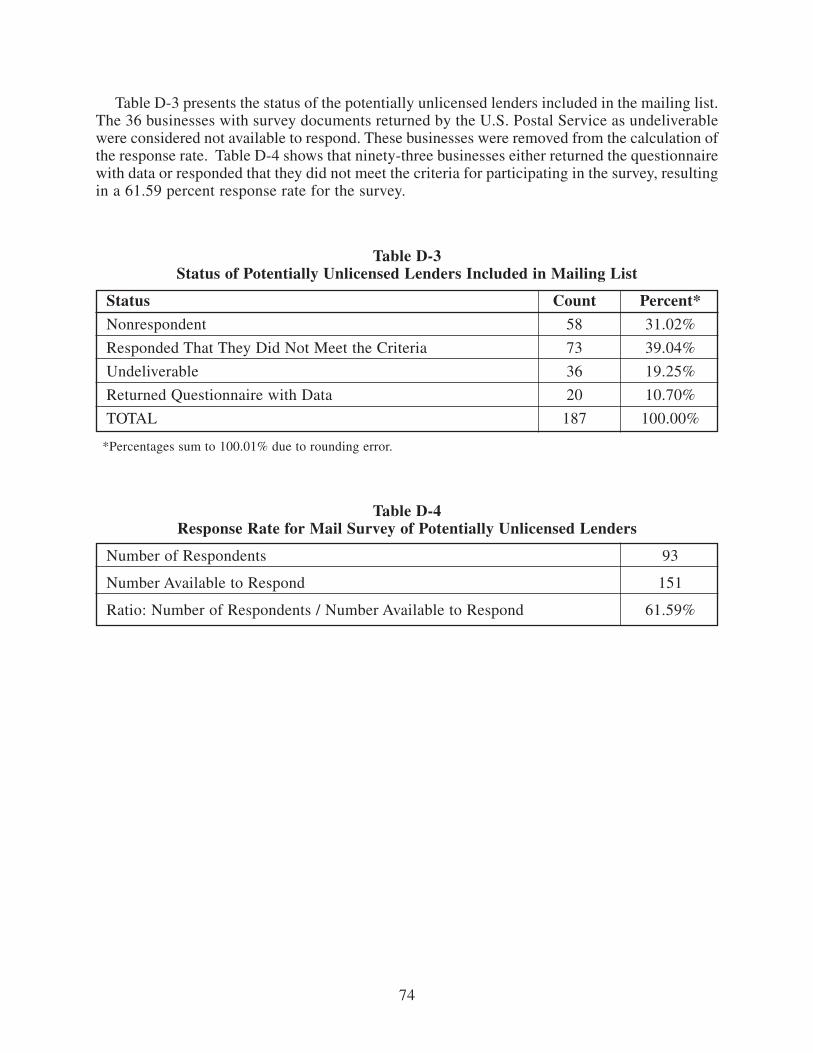
74
Table D-3 presents the status of the potentially unlicensed lenders included in the mailing list. The 36 businesses with survey documents returned by the U.S. Postal Service as undeliverable were considered not available to respond. These businesses were removed from the calculation of the response rate. Table D-4 shows that ninety-three businesses either returned the questionnaire with data or responded that they did not meet the criteria for participating in the survey, resulting in a 61.59 percent response rate for the survey.
Table D-3Status of Potentially Unlicensed Lenders Included in Mailing List
Status Count Percent*
Nonrespondent 58 31.02%
Responded That They Did Not Meet the Criteria 73 39.04%
Undeliverable 36 19.25%
Returned Questionnaire with Data 20 10.70%
TOTAL 187 100.00%
*Percentages sum to 100.01% due to rounding error.
Table D-4Response Rate for Mail Survey of Potentially Unlicensed Lenders
Number of Respondents 93
Number Available to Respond 151
Ratio: Number of Respondents / Number Available to Respond 61.59%

75
Notes
1. For detailed information see pages 1-4.
2. Applicable loans are usually payable in monthly installments and are not secured by a lien on real property. Section 342.005 of the Texas Finance Code describes the types of loans included. Section 342.051 of the Texas Finance Code describes the licensing requirement.
3. The “effective rate” is the total of all charges that can be construed as interest paid by the customer (including actual interest, late charges, and any other charges considered as interest) expressed as a percentage of the amount borrowed.
4. Section 11.305(a), Texas Finance Code.
5. Texas Legislative Council, “Analysis of Home Mortgage Disclosure Act (HMDA) Data for Texas, 1999-2001” (April 11, 2003), http://www.occc.state.tx.us/pages/publications/HMDAdataAprl03Web.pdf.
6. Analytica, Inc., “Research Into Consumer Lending In Texas” (September 2000), http://www.fc.state.tx.us/CLendingStudy.pdf.
7. Texas Legislative Council, “Analysis of Home Mortgage Disclosure Act (HMDA) Data for Texas, 1999-2001” (April 11, 2003), http://www.occc.state.tx.us/pages/publications/HMDAdataAprl03Web.pdf, 13.
8. Underwriting is the process of determining the risk of lending money to a potential bor-rower.
9. The maximum blended rate is authorized by Section 342.201(e), Texas Finance Code.
10. Maximum allowable loan amounts are adjusted periodically for infl ation. The amounts in this study are for the period from January 2003 through June 2003.
11. Annual percentage rate (APR) is a measure of the cost of credit, expressed as a yearly rate.
12. Section 342.253, Texas Finance Code.
13. Some prefer to use the term “imported” rates, because the lender “imports” the loan rates. We use the term “exported” because the out-of-state banks export their rates into Texas.
14. Although an APR of 1,042.86 percent is allowable for very small loans with short terms (e.g., 10 dollars borrowed for seven days), it is used so rarely that it is not considered to be a valid representation of state rates for payday loans.
15. Appendix A provides background information for the analysis in this section of the report.
16. Appendix C presents the number of licensees authorized to offer each type of loan.
17. Pre-1999 data are not available at the company level.

76
18. The FDIC Expanded Guidance for Subprime Lending Programs (PR-9-2001) is one of many factors that may infl uence lender locations.
19. Five types of licenses were included in this study: consumer installment, signature, payday with exported rates, payday with state rates, and pawn.
20. The most common example of a business with two types of OCCC licenses was a business with both a pawn license and a license allowing them to provide payday loans. This business would be counted as a single OLL. No OLL had more than two licenses of the types included in the study.
21. The FDIC listing is updated regularly. Data for this report were downloaded from the FDIC website (http://www2.fdic.gov/idasp/main.asp) on May 20, 2004.
22. The categories for metropolitan status used in this analysis are based on classifi cations available from the Texas State Data Center. Our “metropolitan” counties are equivalent to the State Data Center’s “metro central city” counties; our “suburban” counties are equivalent to their “metro suburban” counties; and our “rural” counties are equivalent to their “non-metro adjacent” counties plus their “non-metro non-adjacent” counties.
23. Research indicates that locations of providers of “alternative fi nancial services” may be related to the minority proportion of the population and the proportion of the population living in poverty. (Kenneth Temkin and Noah Sawyer, Analysis of Alternative Financial Service Provid-ers, Urban Institute (February 19, 2004), http://www.urban.org/UploadedPDF/410935_AltFin-ServProviders.pdf.)
24. The minority percentage and the poverty percentage of each county were based on data from the 2000 U.S. Census Bureau. Details are available in Appendix B.
25. The poverty threshold was defi ned in U.S. Census Bureau, “Poverty 2000,” source: Current Population Survey, http://www.census.gov/hhes/poverty/threshld/thresh00.html.
26. Appendix B describes the regression analyses.
27. The proportion of OLLs was computed for each county by dividing the number of OLLs in the county by the sum of the number of banks in the county plus the number of OLLs. Appendix B presents the county-level data used in the geographic analysis, including the proportion of lenders that were OLLs.
28. The combination of minority and poverty was computed by multiplying the minority percentage by the poverty percentage.
29. Table B-1 in Appendix B presents the correlation coeffi cients.
30. Appendix B describes our criteria for determining which correlations would be reported.
31. The categorization was based on the primary type of lending listed for each license.

77
32. Each proportion was computed by dividing the number of that type of licensee in the county by the sum of the number of OLLs plus the number of banks in the county. The proportions are presented in Appendix B, Table B-3.
33. None of the lenders in these three counties held more than one type of license.
34. Table B-4 in Appendix B includes the number of lenders of each type.
35. Information about the survey is available in Appendix C.
36. Some payday lenders require the customer to authorize an automatic withdrawal from the customer’s bank account instead of leaving a check.
37. Steven O’Shields, OCCC Director of Administration, personal communication with author, January 4, 2005.
38. These APRs represent the maximum allowable rate for each type of loan. The maximum allowable rate was lower for some loans, depending on the amount borrowed and the length of the loan.
39. Informal poll of members of the Independent Bankers Association of Texas (IBAT) conducted by IBAT in June 2004 for this report.
40. Payday export loans are an exception. The terms of these loans are regulated by the exporting states.
41. The majority of the one-day loans in the sample had an APR of 6,570 percent, and most were made by the same company. Loan amounts ranged from $150 to $500, and the cost to customers who paid back the loan on time was 18 percent of the amount borrowed.
42. The survey included several loans of $300 borrowed for two weeks. The majority were made by the same company.
43. Appendix D provides more detailed information about the survey of unlicensed lenders.
44. In an attempt to circumvent the Texas Finance Code, some of these businesses may claim that their transactions are not “loans” or “cash advance transactions.” This issue was discussed in the Senate Committee on Economic Development, Subcommittee on Consumer Credit Laws, “Interim Report to the 77th Texas Legislature” http://www.senate.state.tx.us/75r/senate/commit/archive/c510/pdf/Consumer/Consumer_credit_Laws_report.pdf.
45. Ed Robinson, “JPMorgan, Banks Back Lenders Luring Poor With 780 Percent Rates,” Bloomberg News (November 23, 2004), http://quote.bloomberg.com/apps/news?pid=nifea&&sid=ayYDo5tpjTY8.
46. Kim Nilsen, “SECU to Provide Payday Lending,” Triangle Business Journal (January 1, 2001), http://triangle.bizjournals.com/triangle/stories/2001/01/01/story5.html.

78
47. Financial Service Centers of America, Inc., “Consumer Financial Freedom of Choice in Payday Advance Transactions,” (paper presented at the Conference of State Bank Supervisors Summit, Chicago, Illinois, June 6-9, 2004), 16.
48. House Concurrent Resolution 15, 78th Regular Legislative Session.
49. Jean Ann Fox, “Unsafe and Unsound: Payday Lenders Hide Behind FDIC Bank Charters to Peddle Usury,” Consumer Federation of America (March 30, 2004), http://www.consumerfed.org/pdlrentabankreport.pdf; Tom Feltner and Marva Williams, “New Terms for Payday Loans: High Cost Lenders Change Loan Terms to Evade Illinois Consumer Protections,” Woodstock Institute Reinvestment Alert Number 26 (April 2004), http://woodstockinst.org/document/alert_26.pdf; National Consumer Law Center, “Model Deferred Deposit Loan Act” (October 18, 2004), http://www.consumerlaw.org/initiatives/payday_loans/paydayac.shtml.
50. Financial Service Centers of America, Inc., “Consumer Financial Freedom of Choice in Payday Advance Transactions,” (paper presented at the Conference of State Bank Supervisors Summit, Chicago, Illinois, June 6-9, 2004), 17-20.
51. Annual report forms are available at http://www.occc.state.tx.us/pages/industry/Index.htm.
52. The OCCC completed a review of 2003 annual report data in 2004. The data included in this report were provided by the OCCC in July 2004, after the review was complete.
53. For Tables A-2 and A-3, dollar amounts were adjusted using the United States Bureau of Labor Statistics Consumer Price Index (CPI). Because the CPI is not calculated for state level, the Dallas Metropolitan Area CPI and the Houston Metropolitan Area CPI were averaged to approximate a CPI for Texas.
54. See note 53 above.
55. Correlations measure the strength of the relationship between the characteristic of interest and the proportion of OLLs. Correlations can range from -1 (counties with a high proportion of OLLs always have a low level of the characteristic of interest; counties with a low proportion of OLLs always have a high level of the characteristic of interest) to +1 (counties with a high proportion of OLLs always have a high level of the characteristic of interest; counties with a low proportion of OLLs always have a low level of the characteristic of interest). While the sign of the correlation indicates the direction of the relationship, the absolute value of the correlation indicates the magnitude of the relationship. A correlation of zero indicates that there is no relationship.
56. The categories for metropolitan status are based on classifi cations available from the Texas State Data Center. Our “metropolitan” counties are equivalent to the State Data Center’s “metro central city” counties; our “suburban” counties are equivalent to their “metro suburban” counties; and our “rural” counties are equivalent to their “non-metro adjacent” counties plus their “non-metro non-adjacent” counties. Border counties are the 14 Texas counties that share a border with Mexico.

79
57. The minority percentage and the poverty percentage of each county were based on data from the 2000 U.S. Census Bureau. The poverty data were from Summary File 3 (http://www2.census.gov/census_2000/datasets/Summary_File_3/Texas/), and the minority data were from Summary File 1 (http://www2.census.gov/census_2000/datasets/Summary_File_1/Texas/).
58. Borden, Kenedy, King, and Loving Counties had no banks and no OLLs.
59. The proportions of OLLs in each county were transformed so the mean of the distribution of each of the proportions would be independent of the variance of that distribution. This was done using the formula for unequal sample sizes in Norman Richard Draper and Harry Smith, Applied Regression Analysis, 3rd ed. (New York: John Wiley & Sons, 1998): 293. These transformed data were also used for the regressions.
60. Each county was assigned a value of one or zero for a variable depending on whether the county shared that characteristic. For example, “metropolitan” was coded as one for metropolitan counties and zero for all other counties.
61. The proportion of OLLs in each county was transformed so the mean would be independent of the variance. These transformed data were also used for the correlations. See Note 59 above.
62. The 10 fi rst-order interactions correspond to the 10 unique pairs among the group of fi ve characteristics. The third dummy-coded variable for metropolitan status, whether the county was rural, was not needed for the regression because that group of counties was uniquely identifi ed by a combination of the other two metropolitan status variables (i.e., the counties that were both “not metropolitan” and “not suburban”). Therefore rural counties are the comparison group for the “metropolitan” and “suburban” variables in the regression.
63. Parameter estimates are reported as standardized regression coeffi cients. As with correlation coeffi cients, the sign of the regression coeffi cient indicates the direction of the relationship, and the absolute value indicates the magnitude of the relationship. The adjusted R2 is the proportion of variance accounted for by the regression equation.
64. Most yellow pages were less than one year old.
65. The phone number was entered into an automated form on the AnyWho website (http://www.anywho.com), and the name and address of the business were returned.
66. Businesses under investigation by the OCCC or already in litigation were omitted to insure that the mail survey would not interfere with the investigation or litigation.