non-pessimistic predictions of the distributions and
TRANSCRIPT
Article
Non-Pessimistic Predictions of the Distributions andSuitability of Metasequoia glyptostroboides underClimate Change Using a Random Forest Model
Xiaoyan Zhang 12 Haiyan Wei 2 Xuhui Zhang 12 Jing Liu 12 Quanzhong Zhang 12 andWei Gu 13
1 National Engineering Laboratory for Resource Development of Endangered Crude Drugs in NorthwestChina Shaanxi Normal University Xirsquoan 710119 China zhangxiaoyansnnueducn (XZ)18592030436snnueducn (XZ) lhljsnnueducn (JL) zhangqzsnnueducn (QZ)
2 School of Geography and Tourism Shaanxi Normal University Xirsquoan 710119 China3 College of Life Sciences Shaanxi Normal University Xirsquoan 710119 China Correspondence weihysnnueducn (HW) weigusnnueducn (WG) Tel +86-29-8531-0525 (HW)
+86-29-8531-0266 (WG)
Received 20 November 2019 Accepted 31 December 2019 Published 4 January 2020
Abstract Metasequoia glyptostroboides Hu amp W C Cheng which is a remarkable rare relict planthas gradually been reduced to its current narrow range due to climate change Understanding thecomprehensive distribution of M glyptostroboides under climate change on a large spatio-temporalscale is of great significance for determining its forest adaptation In this study based on 394occurrence data and 10 bioclimatic variables the global potential distribution of M glyptostroboidesunder eight different climate scenarios (ie the past three the current one and the next four) fromthe Quaternary glacial to the future was simulated by a random forest model built with the biomod2package The key bioclimatic variables affecting the distribution of M glyptostroboides are BIO2(mean diurnal range) BIO1 (annual mean temperature) BIO9 (mean temperature of driest quarter)BIO6 (min temperature of coldest month) and BIO18 (precipitation of warmest quarter) The resultindicates that the temperature affects the potential distribution of M glyptostroboides more than theprecipitation A visualization of the results revealed that the current relatively suitable habitatsof M glyptostroboides are mainly distributed in East Asia and Western Europe with a total area ofapproximately 6857 times 106 km2 With the intensification of global warming in the future the potentialdistribution and the suitability of M glyptostroboides have a relatively non-pessimistic trend Whetherunder the mild (RCP45) and higher (RCP85) emission scenarios the total area of suitable habitatswill be wider than it is now by the 2070s and the habitat suitability will increase to varying degreeswithin a wide spatial range After speculating on the potential distribution of M glyptostroboidesin the past the glacial refugia of M glyptostroboides were inferred and projections regarding thefuture conditions of these places are expected to be optimistic In order to better protect the speciesthe locations of its priority protected areas and key protected areas mainly in Western Europe andEast Asia were further identified Our results will provide theoretical reference for the long-termmanagement of M glyptostroboides and can be used as background information for the restoration ofother endangered species in the future
Keywords climate change Metasequoia glyptostroboides Hu amp W C Cheng random forest potentialdistribution glacial refugia protected areas
Forests 2020 11 62 doi103390f11010062 wwwmdpicomjournalforests
Forests 2020 11 62 2 of 19
1 Introduction
Climate is a crucial driver of physiological processes related to the species survival [1] Changesin spatio-temporal climate patterns significantly influence both temperature and precipitation whichin turn affect the growth conditions and geographical distribution of species [2] Many studies haveconfirmed that when hydrothermal conditions exceed the metabolic range of species these species areeither at the risk of extinction or migrate to the poles or upwards to adapt to the change in climate [3]The Intergovernmental Panel on Climate Change (IPCC) estimates that temperatures could increase by15 C or more by 2030ndash2052 if global warming continues to increase at the current rate which willhave an impact on biodiversity and ecosystems [4] If the dynamic nonlinear response between climatechange and species distribution can be visualized it will help mitigate any potential threat that climatechange may bring to the species habitats [5]
The first species distribution models (SDMs) package called BIOCLIM was developed in themid-1980s to study the effects of climate on species distributions [6] SDMs also known as ecologicalniche modeling (ENM) aim to predict species geographic distribution in projected range and threatlevels through a set of statistical methods based on limited species records and correspondingenvironmental variables [7] In recent years with the development of computer geo-information system(GIS) and remote sensing (RS) technology SDMs have been developed rapidly The existing SDMs canbe divided into regression models niche models and machine learning models [8] In past decadesSDMs have been of interest due to their widespread application in the exploration of biodiversity [9]the assessment of biological invasions [10] the research on biological productivity [11] and especiallythe prediction of species potential distributions [12] Following the recent recommendations forpseudo-absent optimal models [13] many scholars believe that the predictive ability and overallperformance of random forest (RF) models are optimal [14ndash16] The RF model is an ensemblemachine learning approach [17] which can build a large number of regression trees for classificationand regression by selecting multiple sub-samples from the total data This algorithm avoids theshortcomings of previous machine learning models that are prone to overfitting and has receivedincreasing attention for the prediction of species potential distribution in recent years [1819]
Metasequoia glyptostroboides Hu amp W C Cheng the dawn redwood is a remarkable rare relictplant heralded as a lsquoliving fossilrsquo [20] and was listed on the International Union for Conservation ofNature (IUCN) Red List of Threatened Species in 2013 [21] It is an endangered deciduous conifer andthe sole living species of the genus Metasequoia which was once thought to have become extinct in theMiocene epoch [22] The rediscovery of a live M glyptostroboides specimen in Lichuan Hubei provinceChina in 1941 was one of the greatest scientific contributions to botany in nearly a century [23] Thenatural occurrence of M glyptostroboides was extremely limited and almost all of the very extensiveoccurrences that are now outside China were introduced and propagated from the seed stock of ChinarsquosSichuan-Hubei border As an important relict plant M glyptostroboides has considerable ornamentalmedicinal and ecological value Because of its beautiful shape and soft material the dawn redwoodcan be used in horticulture construction papermaking and other industries Moreover its leaves andfruits have antipyretic and detoxifying anti-inflammatory and analgesic effects [24] and the volatile oilin its seeds contains various active ingredients with antibacterial effects [25] Hence the considerablemedicinal value of M glyptostroboides is also widely used in medicine chemistry pharmacology andother fields In the last few decades the comprehensive distribution influenced by climate changeof M glyptostroboides has not been investigated although the main research on it has involved thefield of genetic diversity [26] physiological characteristics [27] and cultivation and management [28]Therefore it is important to quantify the impact of irreversible climate change on potential distributionand habitat suitability of M glyptostroboides on a global scale
Objectively although M glyptostroboides luckily survived glacial movement the once prosperousM glyptostroboides gradually degenerated into todayrsquos narrow distribution and would face morecomplex ecological threats under future climate change [29] Approximately 2 million years ago thearrival of glaciation of the Quaternary led to transient and abrupt climate change which considerably
Forests 2020 11 62 3 of 19
forced the growth evolution and distribution of biology changes Fortunately many of the relict plantslike M glyptostroboides are thought to have withstood environmental upheavals and survived in therefugia where the different microclimates can provide suitable conditions for species to survive in bothwarm and cold periods [30] After the rediscovery of M glyptostroboides this kind of relict plant quicklyattracted unprecedented attention and protection for half a century [31] However even if individualtrees are protected many habitats of M glyptostroboides are not which makes natural regenerationdifficult [29] For several years inferring the glacial refugia of relict plants by combining paleobotanypalynology systematic geography and molecular biology has become a research hotspot [32ndash35]Many scholars believe that refugia theory has special value in explaining both the resurrection ofrelict plants and the persistence of biodiversity [36ndash38] Therefore the ecological comprehensive valueof M glyptostroboides can be focused on by determining its historically geographical scope and itsrefugia In the context of climate change whether the suitability of the habitat (especially refugia)of M glyptostroboides will be affected by future global warming is also one of our concerns Thus itis necessary and meaningful to determine the potential geographic distribution of this species andpredict how climate change will affect its geographic scope
Based on species records and high-resolution bioclimatic variables of different climate conditionswe used the RF model to evaluate the global potential distribution and habitat suitability ofM glyptostroboides The objectives of this study are (1) to estimate the potential distribution ofM glyptostroboides under current past and future climatic scenarios (2) to infer the location andspeculate the impact of future climate change on glacial refugia for M glyptostroboides during theQuaternary glaciar and (3) to forecast the change of habitat suitability and identify protected areas ofM glyptostroboides for further research The results will provide theoretical reference and reasonablesuggestion for the protection management and cultivation of M glyptostroboides in the future so as toexplore enlightenment from nature
2 Materials and Methods
21 Species Records
A database of occurrences was constructed using four main sources the Global BiodiversityInformation Facility (GBIF httpwwwgbiforg) the Atlas of Living Australia (ALA httpswwwalaorgau) the Chinese Virtual Herbarium (CVH httpwwwcvhorgcn) and the published literatureIn total 853 records with longitude and latitude information were obtained by filtering the databefore 1950 Finally 394 sampling points (Figure 1) were selected for this study after removing theover-fit records and the records with unclear spatial information We converted species records into a05-degree spatial resolution based on the WGS-84 spatial coordinate system to reduce the error causedby different data sources
According to the visualization the global distributions of M glyptostroboides are mainly distributedin the mid-latitudes of the Northern Hemisphere The occurrences used for analysis included majorcenters in Europe (156 records) and Asia (169 records) and outliers in North America South Africaand Australia (a total of 69 records) Inspections of these sites indicate that there are few records fromthe botanical gardens
Forests 2020 11 62 4 of 19
Forests 2020 11 x FOR PEER REVIEW 3 of 19
of relict plant quickly attracted unprecedented attention and protection for half a century [31] However even if individual trees are protected many habitats of M glyptostroboides are not which makes natural regeneration difficult [29] For several years inferring the glacial refugia of relict plants by combining paleobotany palynology systematic geography and molecular biology has become a research hotspot [32ndash35] Many scholars believe that refugia theory has special value in explaining both the resurrection of relict plants and the persistence of biodiversity [36ndash38] Therefore the ecological comprehensive value of M glyptostroboides can be focused on by determining its historically geographical scope and its refugia In the context of climate change whether the suitability of the habitat (especially refugia) of M glyptostroboides will be affected by future global warming is also one of our concerns Thus it is necessary and meaningful to determine the potential geographic distribution of this species and predict how climate change will affect its geographic scope
Based on species records and high-resolution bioclimatic variables of different climate conditions we used the RF model to evaluate the global potential distribution and habitat suitability of M glyptostroboides The objectives of this study are (1) to estimate the potential distribution of M glyptostroboides under current past and future climatic scenarios (2) to infer the location and speculate the impact of future climate change on glacial refugia for M glyptostroboides during the Quaternary glaciar and (3) to forecast the change of habitat suitability and identify protected areas of M glyptostroboides for further research The results will provide theoretical reference and reasonable suggestion for the protection management and cultivation of M glyptostroboides in the future so as to explore enlightenment from nature
2 Materials and Methods
21 Species Records
A database of occurrences was constructed using four main sources the Global Biodiversity Information Facility (GBIF httpwwwgbiforg) the Atlas of Living Australia (ALA httpswwwalaorgau) the Chinese Virtual Herbarium (CVH httpwwwcvhorgcn) and the published literature In total 853 records with longitude and latitude information were obtained by filtering the data before 1950 Finally 394 sampling points (Figure 1) were selected for this study after removing the over-fit records and the records with unclear spatial information We converted species records into a 05-degree spatial resolution based on the WGS-84 spatial coordinate system to reduce the error caused by different data sources
Figure 1 The global sampling points of M glyptostroboides Figure 1 The global sampling points of M glyptostroboides
22 Bioclimatic Variables
We collected 19 bioclimatic variables with a high spatial resolution of 1 km2 (Table 1) to representannual (eg BIO1 and BIO12) and seasonal (eg BIO4 and BIO15) trends as well as extreme orlimiting environmental factors (eg BIO5 and BIO6 and BIO16 and BIO17 respectively) in thisstudy The data layers which are available from the WorldClim database (WorldClim Version 14httpwwwworldclimorg) were interpolated from the average monthly climate data from weatherstations Eliminating the autocorrelation among predictors helps to avoid the prediction error caused bymulticollinearity of bioclimatic factors Therefore Pearson correlation coefficients (r) of 19 bioclimaticvariables were calculated and only one out of each strongly correlated factor group (r gt 08) wasretained After screening 10 bioclimate variables were selected to participate in the modeling (Table 1)
Table 1 Overview of bioclimatic variables used in this study
Abbreviation Parameter (Unit) Selected
BIO1 Annual Mean Temperature (C)radic
BIO2 Mean Diurnal Range [Mean of monthly (max tempndashmin temp)] (C)radic
BIO3 Isothermality (BIO2BIO7) (100) ()BIO4 Temperature Seasonality (standard deviation 100) (C)BIO5 Max Temperature of Warmest Month (C)BIO6 Min Temperature of Coldest Month (C)
radic
BIO7 Temperature Annual Range (BIO5ndashBIO6) (C)radic
BIO8 Mean Temperature of Wettest Quarter (C)BIO9 Mean Temperature of Driest Quarter (C)
radic
BIO10 Mean Temperature of Warmest Quarter (C)radic
BIO11 Mean Temperature of Coldest Quarter (C)BIO12 Annual Precipitation (mm)
radic
BIO13 Precipitation of Wettest Month (mm)radic
BIO14 Precipitation of Driest Month (mm)BIO15 Precipitation Seasonality (Coefficient of Variation meanSD100) ()BIO16 Precipitation of Wettest Quarter (mm)
radic
BIO17 Precipitation of Driest Quarter (mm)BIO18 Precipitation of Warmest Quarter (mm)
radic
BIO19 Precipitation of Coldest Quarter (mm)
Bioclimate data from different scenarios (current one past three and future four) were applied topredict the potential distribution of M glyptostroboides on a large space-time scale Current climate
Forests 2020 11 62 5 of 19
scenario as a baseline climate scenario was generated by the Kriging interpolation of observed datarepresentative of 1960ndash1990 Future and past climate scenarios were usually generated by GlobalClimate Models (GCMs also known as General Circulation Models) which have been downscaledand calibrated (bias corrected) by WorldClim The paleoclimate data whose original data were madeavailable by Coupled Model Intercomparison Project (CMIP5) of which the Last Interglacial (LIG about130ndash110 ka BP which was similar to the current climate) the Last Glacial Maximum (LGM about 22 kaBP lower than the current temperature) and the Mid-Holocene (MH about 6 ka BP higher than thecurrent temperature) were selected The future bioclimate data come from the climate projections fromthe Community Climate System Model 4 (CCSM4 a most recent GCM climate projection) Scientificassumptions about future climatic scenarios were produced by the Fifth Assessment Report of theIPCC for the new generation of emission scenarios known as lsquorepresentative concentration pathwaysrsquo(RCPs) The RCPs were identified based on the possible trajectories of greenhouse gas emissions fromall sources relative to the pre-industrial period The description of four kinds of RCPs (RCP26 RCP45RCP60 and RCP85) can be found at httpwwwpik-potsdamde--mmaltercps In this study bothmild (RCP45) and severe (RCP85) emission scenarios were selected for the 2050s (average across2041ndash2060) and 2070s (average across 2061ndash2080) respectively With this method two greenhouse gasscenarios in two periods were combined into four combinations to represent future climate conditions
23 RF Model Building and Validation
In this study RF model provided by the biomod2 package developed in R environment (httpswwwr-projectorg) was used for prediction Based on 394 species records of M glyptostroboidesand 10 bioclimate variables RF model was selected to predict the potential distribution maps of Mglyptostroboides in the eight climate scenarios To improve the model capacity the presence data wereformatted using the lsquorandomrsquo algorithm to randomly generate 2000 pseudo-presence points for everymodel and divided the species data into two groups (80 for the training set and 20 for the testingset) The models were cross-validated in four replicate runs of each model to minimize the errors andensure we obtained more realistic predictions
We used the true skill statistic (TSS) Cohenrsquos KAPPA (KAPPA) and receiver operating characteristic(ROC) curves to evaluate each model which are considered to be the most popular dimensionlessindicators for verifying the accuracy of SDM [39] ROC is defined as the testrsquos true-positive rate(sensitivity) plotted against its false-positive rate (1-specificity) and is used to assess the modelrsquosability by distinguishing between distributed and non-distributed clustering [40] Kappa can beused to evaluate the consistency between the sample data and the simulated results [41] TSS is athreshold-dependent evaluator (equal to sensitivity + specificity minus 1) which not only retains theadvantages of kappa but also corrects the disadvantages of kapparsquos susceptibility to species distributionThe thresholds of the three evaluation indexes are from 0 to 1 and the higher value indicates the higherperformance of the models Usually if ROC is greater than 09 TSS is greater than 085 or kappa isgreater than 08 then the model process is considered to perform well [42]
24 Data Analyses of Key Bioclimatic Variables and Habitat Suitability
The weight of bioclimatic variables affecting the growth and the distribution of M glyptostroboidescan be obtained after modeling Moreover corresponding statistical analyses were carried out toidentify the bioclimatic variables with a cumulative contribution rate exceeding 80 (in descendingorder of weight) in each model We then selected the key bioclimatic variables that exist in all climatescenarios based on these bioclimatic variables
The habitat suitability index (HSI) is widely used in species habitat evaluation and can be obtainedfrom the model outputs [43ndash46] For further analyses HSI was classified into four levels of habitatsuitability [47] unsuitable (HSI lt 03) marginally suitable (03 le HSI lt 05) moderately suitable(05 le HSI lt 07) and highly suitable (HSI ge 07)
Forests 2020 11 62 6 of 19
25 Identification of Glacial Refugia and Protected Areas
In combination with previous studies on relict plants glacial refugia can be inferred bysuperimposing the species potential distribution under both the paleoclimate and the currentclimate [48] In this study we hypothesized that the evolution of M glyptostroboides is historicand continuous and inferred glacial refugia by coupling the potential distribution of M glyptostroboidesin the LGM (before the Quaternary) and in the current The area is defined as a lsquorefugiarsquo if the area issuitable for M glyptostroboides under both climate scenarios On the other hand habitat adaptationlevel trends in future climate scenarios were calculated and used to identify protected areas Wedefined lsquopriority protected areasrsquo as the areas where the suitability level of M glyptostroboides is likelyto decline in any future climate scenarios and define lsquokey protected areasrsquo as the areas where thesuitability levels will increase in all future climate scenarios
3 Results
31 Model Reliability and Key Bioclimatic Variables
The eight models in this study are of high reliability with the ROC value of 0984 plusmn 0009 (Figure 2)Additionally the TSS is 0885 plusmn 0033 and the KAPPA is 0839 plusmn 0054 Thus the model results couldbe considered to be satisfactory
Forests 2020 11 x FOR PEER REVIEW 6 of 19
3 Results
31 Model Reliability and Key Bioclimatic Variables
The eight models in this study are of high reliability with the ROC value of 0984 plusmn 0009 (Figure 2) Additionally the TSS is 0885 plusmn 0033 and the KAPPA is 0839 plusmn 0054 Thus the model results could be considered to be satisfactory
Figure 2 Evaluation indexes of our model under eight climate scenarios LIG represents the Last Interglacial LGM represents the Last Glacial Maximum MH represents the Mid-Holocene Current represents the current scenarios 2050s-RCP45 represents the RCP45 in the 2050s 2050s-RCP85 represents the RCP85 in the 2050s 2070s-RCP45 represents the RCP 45 in the 2070s and 2070s-RCP85 represents the RCP 85 in the 2070s respectively
Bioclimatic variables affecting the growth and the distribution of M glyptostroboides can be obtained by the model Five to seven bioclimatic variables accounting for the top 80 of the cumulative contribution rate were obtained in each model (Figure 3a) Based on further statistics five of the bioclimatic variables were singled out as key bioclimatic variables (Figure 3a colored portion) of which four are related to temperature and one is related to precipitation They are BIO2 (mean diurnal range) BIO1 (annual mean temperature) BIO9 (mean temperature of the driest quarter) BIO6 (min temperature of the coldest month) and BIO18 (precipitation of the warmest quarter) The average contribution rate of BIO2 in the eight models is 1917 (Figure 3b) which is the highest of the five key bioclimatic variables so it can be regarded as the most important bioclimatic variable The total contribution rate of temperature-related key bioclimatic variables accounted for 6587 plusmn 458 in each model and the total contribution rate of precipitation-related key bioclimatic variables was 1474 plusmn 451 Obviously M glyptostroboides is more sensitive to temperature than precipitation which is conducive to further explore the response of M glyptostroboides to the climate
Figure 2 Evaluation indexes of our model under eight climate scenarios LIG represents the LastInterglacial LGM represents the Last Glacial Maximum MH represents the Mid-Holocene Currentrepresents the current scenarios 2050s-RCP45 represents the RCP45 in the 2050s 2050s-RCP85represents the RCP85 in the 2050s 2070s-RCP45 represents the RCP 45 in the 2070s and 2070s-RCP85represents the RCP 85 in the 2070s respectively
Bioclimatic variables affecting the growth and the distribution of M glyptostroboides can beobtained by the model Five to seven bioclimatic variables accounting for the top 80 of the cumulativecontribution rate were obtained in each model (Figure 3a) Based on further statistics five of thebioclimatic variables were singled out as key bioclimatic variables (Figure 3a colored portion) ofwhich four are related to temperature and one is related to precipitation They are BIO2 (mean diurnalrange) BIO1 (annual mean temperature) BIO9 (mean temperature of the driest quarter) BIO6 (mintemperature of the coldest month) and BIO18 (precipitation of the warmest quarter) The averagecontribution rate of BIO2 in the eight models is 1917 (Figure 3b) which is the highest of the fivekey bioclimatic variables so it can be regarded as the most important bioclimatic variable The totalcontribution rate of temperature-related key bioclimatic variables accounted for 6587 plusmn 458 in each
Forests 2020 11 62 7 of 19
model and the total contribution rate of precipitation-related key bioclimatic variables was 1474plusmn 451 Obviously M glyptostroboides is more sensitive to temperature than precipitation which isconducive to further explore the response of M glyptostroboides to the climateForests 2020 11 x FOR PEER REVIEW 7 of 19
Figure 3 The key bioclimatic variables affecting the growth and distribution of M glyptostroboides (a) Statistics of the bioclimatic variables with cumulative contribution rates of more than 80 under each climate scenario They are arranged by weight in descending order Variables common to all scenarios are defined as key bioclimatic variables which are shown in the colored (non-textured) portion (b) The average contribution rate of each key bioclimatic variables in our models
32 Potential Distribution of M glyptostroboides from the Past to the Future
321 Potential Distribution of M glyptostroboides in the Current Climate Scenario
Visually relatively highly suitable habitats were concentrated in two areas (Figure 4d) (1) East Asia mainly located in the North China Plain the middle and lower reaches of the Yangtze River Plain the Yunnan-Guizhou Plateaus in China the Japanese archipelago and the Korean Peninsula as well as (2) Western Europe mainly located in the plains and a few mountainous areas Moderately and marginally suitable habitats were scattered around the highly suitable habitats Moreover there are also some suitable habitats in the coastal areas of southeast Australia and some sporadic patches in America Monsoons and circulations control and influence the climate in these areas The current habitats with moderate and marginal suitability are approximately 4698 times 106 km2 and the highly suitable habitats cover approximately 2159 times 106 km2 (Figure 5)
322 Potential Distribution of M glyptostroboides in the Past
In past climate scenarios the potential distributions of M glyptostroboides have undergone significant changes (Figure 4andashc) The total suitable area in the LIG was approximately 7228 times 106 km2 increased significantly to approximately 11758 times 106 km2 in the LGM but decreased dramatically to approximately 7807 times 106 km2 in the MH (Figure 5) As we predicted after a long historical vicissitude the habitats of M glyptostroboides seriously decreased in the MH It is also a matter of concern that the range of the total suitable habitats of M glyptostroboides has been decreasing since the MH period to the present which means the species may be under environmental threat Notably the total number of suitable areas in the LGM showed a wider distribution compared with that of other scenarios (Figure 4b) which should be related to the relative maximum value of the total area of the continental shelf during this period [49]
Figure 3 The key bioclimatic variables affecting the growth and distribution of M glyptostroboides(a) Statistics of the bioclimatic variables with cumulative contribution rates of more than 80 undereach climate scenario They are arranged by weight in descending order Variables common to allscenarios are defined as key bioclimatic variables which are shown in the colored (non-textured)portion (b) The average contribution rate of each key bioclimatic variables in our models
32 Potential Distribution of M glyptostroboides from the Past to the Future
321 Potential Distribution of M glyptostroboides in the Current Climate Scenario
Visually relatively highly suitable habitats were concentrated in two areas (Figure 4d) (1) EastAsia mainly located in the North China Plain the middle and lower reaches of the Yangtze RiverPlain the Yunnan-Guizhou Plateaus in China the Japanese archipelago and the Korean Peninsula aswell as (2) Western Europe mainly located in the plains and a few mountainous areas Moderatelyand marginally suitable habitats were scattered around the highly suitable habitats Moreover thereare also some suitable habitats in the coastal areas of southeast Australia and some sporadic patchesin America Monsoons and circulations control and influence the climate in these areas The currenthabitats with moderate and marginal suitability are approximately 4698 times 106 km2 and the highlysuitable habitats cover approximately 2159 times 106 km2 (Figure 5)
322 Potential Distribution of M glyptostroboides in the Past
In past climate scenarios the potential distributions of M glyptostroboides have undergonesignificant changes (Figure 4andashc) The total suitable area in the LIG was approximately 7228 times 106 km2increased significantly to approximately 11758 times 106 km2 in the LGM but decreased dramaticallyto approximately 7807 times 106 km2 in the MH (Figure 5) As we predicted after a long historicalvicissitude the habitats of M glyptostroboides seriously decreased in the MH It is also a matter ofconcern that the range of the total suitable habitats of M glyptostroboides has been decreasing since theMH period to the present which means the species may be under environmental threat Notably thetotal number of suitable areas in the LGM showed a wider distribution compared with that of otherscenarios (Figure 4b) which should be related to the relative maximum value of the total area of thecontinental shelf during this period [49]
Forests 2020 11 62 8 of 19Forests 2020 11 x FOR PEER REVIEW 8 of 19
Figure 4 Potential distribution of M glyptostroboides under each climate scenario The green yellow and red represent the marginally suitable moderately suitable and highly suitable areas respectively (a) in the LIG (b) in the LGM (c) in the MH (d) in the current period (e) under RCP45 in the 2050s (f) under RCP85 in the 2050s (g) under RCP45 in the 2070s and (h) under RCP85 in the 2070s
In terms of the distribution details we found that the potential distribution of M glyptostroboides was more similar to the current distribution in Europe while the significant change mainly occurred in Asia especially in China Taking the change of highly suitable habitat in China as an example in the LIG the highly suitable habitats of M glyptostroboides were mainly distributed in the plain of the middle and lower reaches of the Yangtze River and the habitat was narrow (Figure 4a) In the LGM the highly suitable habitats of M glyptostroboides expanded significantly and moved southwest even covering most of the Yunnan-Guizhou Plateau (Figure 4b) All habitats of M glyptostroboides shrunk greatly in the MH (Figure 4c) resulting in the distribution area being highly reduced in China
Figure 4 Potential distribution of M glyptostroboides under each climate scenario The green yellowand red represent the marginally suitable moderately suitable and highly suitable areas respectively(a) in the LIG (b) in the LGM (c) in the MH (d) in the current period (e) under RCP45 in the 2050s(f) under RCP85 in the 2050s (g) under RCP45 in the 2070s and (h) under RCP85 in the 2070sForests 2020 11 x FOR PEER REVIEW 9 of 19
Figure 5 The total suitable habitat area and habitats with different levels of suitability under each climatic scenario The details of the abbreviation in this figure are same as Figure 2
323 Potential Distribution of M glyptostroboides in the Future
In future climate scenarios the suitable habitats of M glyptostroboides show an optimistic performance compared with the current scenario which is characterized by a marked increase in suitable habitats as a whole (Figure 4endashh) The overall potential distribution will expand under climate change Although the total suitable area may decrease slightly under RCP45 in the 2050s it may increase significantly under other climate scenarios (Figure 5)
Under the scenario with a mild concentration of greenhouse gas emissions (RCP45) although the total suitable area would decrease by the 2050s it would basically recover by the 2070s and the area in the 2070s will still exceed the current area The marginally suitable area would decrease by approximately 0180 times 106 km2 in the 2050s but it would improve in the 2070s and still increase by 0062 times 106 km2 compared with the current scenario Moreover with the increasing trend in suitable areas over time by the 2070s moderately and highly suitable areas will increase by 0593 times 106 and 0229 times 106 km2 respectively Thus this slight reduction in the 2050s may even be considered unsurprising and not worth worrying about
Under the higher emission scenario (RCP85) the potential distribution of M glyptostroboides has a more optimistic trend with the increasing intensity of global warming From now until the 2050s the total suitable habitat area will increase conspicuously and will show a slight pullback by the 2070s but will still be wider than the current area In 2050 under RCP85 the overall suitable area of M glyptostroboides will present the most optimistic state (7929 times 106 km2) which is higher than under any other future scenarios (Figure 5) The discrepancy exists in the change trend in the suitable area from marginally to highly suitable levels which would increase in the 2050s by 0300 times 106 km2 0568 times 106 km2 and 0206 times 106 km2 respectively From the 2050s to the 2070s the marginally suitable area has a very small reduction while the moderately suitable area decreases significantly by 0569 times 106 km2 in the 2070s However this small partial decline does not mean that the situation is dire The highly suitable area would increase steadily with an area of 0225 times 106 km2 more by the 2070s In the 2070s in addition to a negligible decrease in the moderately suitable area the areas with marginal suitability and high suitability would be 0286 times 106 km2 and 0431 times 106 km2 more than the current area respectively
33 The Change in the Habitat Suitability of M glyptostroboides
We analyzed the change in the habitat suitability of M glyptostroboides in the near future climate scenarios by intersecting the level of HSI Areas where the level of HSI will increasedecrease in the future climate scenario (compared to the current) are considered to be areas where the habitat suitability will definitely increasedecrease (Figure 6) Areas where habitat suitability will unchanged are also defined in the same way In the context of global warming the change in habitat suitability
Figure 5 The total suitable habitat area and habitats with different levels of suitability under eachclimatic scenario The details of the abbreviation in this figure are same as Figure 2
Forests 2020 11 62 9 of 19
In terms of the distribution details we found that the potential distribution of M glyptostroboideswas more similar to the current distribution in Europe while the significant change mainly occurredin Asia especially in China Taking the change of highly suitable habitat in China as an example inthe LIG the highly suitable habitats of M glyptostroboides were mainly distributed in the plain of themiddle and lower reaches of the Yangtze River and the habitat was narrow (Figure 4a) In the LGMthe highly suitable habitats of M glyptostroboides expanded significantly and moved southwest evencovering most of the Yunnan-Guizhou Plateau (Figure 4b) All habitats of M glyptostroboides shrunkgreatly in the MH (Figure 4c) resulting in the distribution area being highly reduced in China
323 Potential Distribution of M glyptostroboides in the Future
In future climate scenarios the suitable habitats of M glyptostroboides show an optimisticperformance compared with the current scenario which is characterized by a marked increasein suitable habitats as a whole (Figure 4endashh) The overall potential distribution will expand underclimate change Although the total suitable area may decrease slightly under RCP45 in the 2050s itmay increase significantly under other climate scenarios (Figure 5)
Under the scenario with a mild concentration of greenhouse gas emissions (RCP45) althoughthe total suitable area would decrease by the 2050s it would basically recover by the 2070s and thearea in the 2070s will still exceed the current area The marginally suitable area would decrease byapproximately 0180 times 106 km2 in the 2050s but it would improve in the 2070s and still increaseby 0062 times 106 km2 compared with the current scenario Moreover with the increasing trend insuitable areas over time by the 2070s moderately and highly suitable areas will increase by 0593 times 106
and 0229 times 106 km2 respectively Thus this slight reduction in the 2050s may even be consideredunsurprising and not worth worrying about
Under the higher emission scenario (RCP85) the potential distribution of M glyptostroboideshas a more optimistic trend with the increasing intensity of global warming From now until the2050s the total suitable habitat area will increase conspicuously and will show a slight pullback by the2070s but will still be wider than the current area In 2050 under RCP85 the overall suitable areaof M glyptostroboides will present the most optimistic state (7929 times 106 km2) which is higher thanunder any other future scenarios (Figure 5) The discrepancy exists in the change trend in the suitablearea from marginally to highly suitable levels which would increase in the 2050s by 0300 times 106 km20568 times 106 km2 and 0206 times 106 km2 respectively From the 2050s to the 2070s the marginallysuitable area has a very small reduction while the moderately suitable area decreases significantly by0569 times 106 km2 in the 2070s However this small partial decline does not mean that the situation isdire The highly suitable area would increase steadily with an area of 0225 times 106 km2 more by the2070s In the 2070s in addition to a negligible decrease in the moderately suitable area the areas withmarginal suitability and high suitability would be 0286 times 106 km2 and 0431 times 106 km2 more than thecurrent area respectively
33 The Change in the Habitat Suitability of M glyptostroboides
We analyzed the change in the habitat suitability of M glyptostroboides in the near future climatescenarios by intersecting the level of HSI Areas where the level of HSI will increasedecrease inthe future climate scenario (compared to the current) are considered to be areas where the habitatsuitability will definitely increasedecrease (Figure 6) Areas where habitat suitability will unchangedare also defined in the same way In the context of global warming the change in habitat suitability ofM glyptostroboides is not very pessimistic for the four future climate scenarios in our results Overallthe suitability of about 40 of the habitats will be unchanged (Table 2) We expected that the suitabilityof M glyptostroboides would be significantly decreased especially in fragmented areas around thesuitable area of the current scenario (Figure 6) However the decrease is not as strong as the increase inall the scenarios In terms of the whole habitat the habitat suitability will increase to varying degreesin a wide range especially in the core areas with high suitability Under RCP45 the habitat suitability
Forests 2020 11 62 10 of 19
will increase by 3091 in the 2050s and by 3749 in the 2070s Under RCP85 the habitat suitabilitywill increase by 3868 in the 2050s and by 3746 in the 2070s
Forests 2020 11 x FOR PEER REVIEW 10 of 19
of M glyptostroboides is not very pessimistic for the four future climate scenarios in our results Overall the suitability of about 40 of the habitats will be unchanged (Table 2) We expected that the suitability of M glyptostroboides would be significantly decreased especially in fragmented areas around the suitable area of the current scenario (Figure 6) However the decrease is not as strong as the increase in all the scenarios In terms of the whole habitat the habitat suitability will increase to varying degrees in a wide range especially in the core areas with high suitability Under RCP45 the habitat suitability will increase by 3091 in the 2050s and by 3749 in the 2070s Under RCP85 the habitat suitability will increase by 3868 in the 2050s and by 3746 in the 2070s
Figure 6 Trends in the habitat suitability of M glyptostroboides under future climate scenarios (compared to the present day) (a) Under RCP45 in the 2050s (b) under RCP85 in the 2050s (c) under RCP45 in the 2070s and (d) under RCP85 in the 2070s The blue red and green represent the habitat suitability remaining unchanged deceasing and increasing respectively
Table 2 Statistics of the habitat suitability change in M glyptostroboides in the future which is expressed as the percentage of the habitat area with different trends in the total suitable area The units are
Climate Scenario Decrease () Increase () Unchanged () under RCP45 in the 2050s 3011 3091 3898 under RCP45 in the 2070s 1898 3749 4353 under RCP85 in the 2050s 2264 3868 3868 under RCP85 in the 2070s 2268 3746 3986
34 Speculation on Glacial Refugia
We found proposed glacial refugia in East Asia and Western Europe on a large spatial scale In addition refugia may also exist in the coastal plains near the Gulf of Mexico and South-Eastern Australia (Figure 7) In East Asia glacial refugia are most likely to exist in the following areas the Tianshan Mountain the Yunnan-Guizhou Plateau the Sichuan Basin the Qinling Mountains the North China Plain the plains in the middle and lower reaches of the Yangtze River and the Nanling and Wuyi Mountains In Western Europe glacial refugia are mainly found in some plains and mountains (eg Western European plains the Central Plateau and the Alps) In order to explore the impact of future climate on these glacial refugia we inferred the different situations of the refugia in the future by intersecting the future changes in habitat suitability of M glyptostroboides Regions of the refugia where the suitability will increasedecrease under future climate change are known as
Figure 6 Trends in the habitat suitability of M glyptostroboides under future climate scenarios (comparedto the present day) (a) Under RCP45 in the 2050s (b) under RCP85 in the 2050s (c) under RCP45 inthe 2070s and (d) under RCP85 in the 2070s The blue red and green represent the habitat suitabilityremaining unchanged deceasing and increasing respectively
Table 2 Statistics of the habitat suitability change in M glyptostroboides in the future which is expressedas the percentage of the habitat area with different trends in the total suitable area The units are
Climate Scenario Decrease () Increase () Unchanged ()
under RCP45 in the 2050s 3011 3091 3898under RCP45 in the 2070s 1898 3749 4353under RCP85 in the 2050s 2264 3868 3868under RCP85 in the 2070s 2268 3746 3986
34 Speculation on Glacial Refugia
We found proposed glacial refugia in East Asia and Western Europe on a large spatial scaleIn addition refugia may also exist in the coastal plains near the Gulf of Mexico and South-EasternAustralia (Figure 7) In East Asia glacial refugia are most likely to exist in the following areas theTianshan Mountain the Yunnan-Guizhou Plateau the Sichuan Basin the Qinling Mountains the NorthChina Plain the plains in the middle and lower reaches of the Yangtze River and the Nanling andWuyi Mountains In Western Europe glacial refugia are mainly found in some plains and mountains(eg Western European plains the Central Plateau and the Alps) In order to explore the impact offuture climate on these glacial refugia we inferred the different situations of the refugia in the futureby intersecting the future changes in habitat suitability of M glyptostroboides Regions of the refugiawhere the suitability will increasedecrease under future climate change are known as lsquoadvantagedrefugiarsquolsquodisadvantaged refugiarsquo and the rest are called lsquosteady refugiarsquo The results showed thatglacial refugia of M glyptostroboides covers approximately 645 times 106 km2 of which nearly 4103 havea positive trend in habitat suitability and 617 need to be treated with caution in the future
Forests 2020 11 62 11 of 19
Forests 2020 11 x FOR PEER REVIEW 11 of 19
lsquoadvantaged refugiarsquolsquodisadvantaged refugiarsquo and the rest are called lsquosteady refugiarsquo The results showed that glacial refugia of M glyptostroboides covers approximately 645 times 106 km2 of which nearly 4103 have a positive trend in habitat suitability and 617 need to be treated with caution in the future
Figure 7 The location of glacial refugia of M glyptostroboides and the changes in the refugia in future climate change
35 Identification of Priority Protected Areas and Key Protected Areas
Based on the identifications of this study the priority protected areas of M glyptostroboides are mainly located in the piedmont of the Alps Apennines Dinara Mountains and the plain of the middle reaches of the Danube River of Western Europe (Figure 8a) the Nanling Mountains the Yunnan-Guizhou Plateau the North China Plain the Northeast China Plain of China the piedmont of Taihang Mountains and the Himalayas (Figure 8b) There are also a small number of other notable areas such as the Japanese archipelago and the southern part of the Korean Peninsula (Figure 8b) The key protected areas are mainly located on the fragmented patches at the edges of potential distribution in the current scenario (Figure 8) such as the Taihang Mountains Qinling Mountains Sichuan Basin in Asia and the northern shores of the Mediterranean and the southern shores of the Baltic Sea in Western Europe
Figure 7 The location of glacial refugia of M glyptostroboides and the changes in the refugia in futureclimate change
35 Identification of Priority Protected Areas and Key Protected Areas
Based on the identifications of this study the priority protected areas of M glyptostroboides aremainly located in the piedmont of the Alps Apennines Dinara Mountains and the plain of themiddle reaches of the Danube River of Western Europe (Figure 8a) the Nanling Mountains theYunnan-Guizhou Plateau the North China Plain the Northeast China Plain of China the piedmont ofTaihang Mountains and the Himalayas (Figure 8b) There are also a small number of other notableareas such as the Japanese archipelago and the southern part of the Korean Peninsula (Figure 8b) Thekey protected areas are mainly located on the fragmented patches at the edges of potential distributionin the current scenario (Figure 8) such as the Taihang Mountains Qinling Mountains Sichuan Basinin Asia and the northern shores of the Mediterranean and the southern shores of the Baltic Sea inWestern EuropeForests 2020 11 x FOR PEER REVIEW 12 of 19
Figure 8 Identification of the priority protected areas and the key protected areas of M glyptostroboides which are mainly in Europe (a) and in East Asia (b)
4 Discussion
41 The Rationality of the Model and the Limitations of the Prediction
Mapping the potential distribution of M glyptostroboides at a large spatial and temporal scale poses a unique challenge SDMs provide a possible solution to this problem and already underpinned many biological conservation studies by providing comprehensive potential distribution maps [50ndash52] Compared with traditional frequentist data models machine learning models can provide obvious advantages to account for non-intuitive relationships and the anisotropy of ecosystems [53] RF models have also shown to play an important role in exploring the effects of climate change [54] In this study the performance of the RF models is not only ensured by the powerful computational ability of the biomod2 package under the R environment but the model accuracy is also improved through virtual distributions cross-validation and iterative algorithms As expected given the output results of the ROC KAPPA and TSS are all greater than 08 our model is considered to be trustworthy Of course the variance in a RF model should not be inflated although it is not subject to over-fitting It would be ideal to apply a combined model with less error to overcome many issues that need to be addressed in a single SDM framework [5556]
The bioclimatic variables we used have substantial biological significance compared with single temperature or rainfall data and are collected from the most widely used dataset in the prediction of species potential distribution [5758] Although local factors (such as geographic location soil and topography) are sometimes also considered as important factors for maintaining botanic growth on a local scale we assumed that bioclimate is the crucial driver of physiological processes related to species survival because other factors are highly inconsistent and unavailable on large time scales [5960] Meanwhile fully quantifying bioclimatic factors is difficult and the obstacles of assessing anthropogenic influence would complicate the study We could work in a more coordinated manner with experts in biogeography ecology and ecological physiology since the dynamics and diversity of the species and biological interactions are not taken into account on the global scale [61] Even so the model framework and the bioclimatic variables used in this paper make the evaluation of the global potential distribution of M glyptostroboides more accessible and acceptable
In addition consideration should be given to whether certain data from the botanical gardens can provide reliable indicators of species climate demand As the species has been widely planted for ornamental purposes it may not be practical to remove these suspect data Thus on the basis of
Figure 8 Identification of the priority protected areas and the key protected areas of M glyptostroboideswhich are mainly in Europe (a) and in East Asia (b)
Forests 2020 11 62 12 of 19
4 Discussion
41 The Rationality of the Model and the Limitations of the Prediction
Mapping the potential distribution of M glyptostroboides at a large spatial and temporal scaleposes a unique challenge SDMs provide a possible solution to this problem and already underpinnedmany biological conservation studies by providing comprehensive potential distribution maps [50ndash52]Compared with traditional frequentist data models machine learning models can provide obviousadvantages to account for non-intuitive relationships and the anisotropy of ecosystems [53] RF modelshave also shown to play an important role in exploring the effects of climate change [54] In this studythe performance of the RF models is not only ensured by the powerful computational ability of thebiomod2 package under the R environment but the model accuracy is also improved through virtualdistributions cross-validation and iterative algorithms As expected given the output results of theROC KAPPA and TSS are all greater than 08 our model is considered to be trustworthy Of coursethe variance in a RF model should not be inflated although it is not subject to over-fitting It would beideal to apply a combined model with less error to overcome many issues that need to be addressed ina single SDM framework [5556]
The bioclimatic variables we used have substantial biological significance compared with singletemperature or rainfall data and are collected from the most widely used dataset in the prediction ofspecies potential distribution [5758] Although local factors (such as geographic location soil andtopography) are sometimes also considered as important factors for maintaining botanic growth on alocal scale we assumed that bioclimate is the crucial driver of physiological processes related to speciessurvival because other factors are highly inconsistent and unavailable on large time scales [5960]Meanwhile fully quantifying bioclimatic factors is difficult and the obstacles of assessing anthropogenicinfluence would complicate the study We could work in a more coordinated manner with expertsin biogeography ecology and ecological physiology since the dynamics and diversity of the speciesand biological interactions are not taken into account on the global scale [61] Even so the modelframework and the bioclimatic variables used in this paper make the evaluation of the global potentialdistribution of M glyptostroboides more accessible and acceptable
In addition consideration should be given to whether certain data from the botanical gardenscan provide reliable indicators of species climate demand As the species has been widely plantedfor ornamental purposes it may not be practical to remove these suspect data Thus on the basisof obtaining a very limited natural distribution the opportunities and limitations that some datafrom botanical gardens bring to climate-change research should also be discussed further After theverification of the species records the original species records from botanic gardens are within theexpected suitable distributions We considered that the distributions of plantation are also withinthe range of species suitable distribution and the success of artificial cultivation of any tree speciesrequires a long time to observe and verify whether the local climate is suitable for survival Of coursethe effects of microclimate and the use of irrigation on climate research that occurs in botanical gardensas well as ornamental conditions cannot be ignored In further research we can use the data fromsufficient commercial forestry trials to evaluate broad scale suitability [62] or we can also play the roleof botanical gardens by linking biodiversity conservation with the benefits derived from ecosystemservices [63] Organismndashenvironment interactions at fine scales are important for assessing whetherthe microclimate is biologically relevant [64]
42 The Significance of the Glacial Refugia Hypothesis
Glacial refugia where the climate is conducive to plant growth are often considered as protectorsof relict plants from extinction during long climatic cycles The hypothesis of glacial refugia is importantfor further exploring the relationship between local species evolution and climate change If weformulate strategies to explore the vitality of relict plants in the future understanding which areas areconducive to the growth of M glyptostroboides in the past is of utmost important We assumed that the
Forests 2020 11 62 13 of 19
climate of the glacial refugia can also provide suitable conditions for the growth of M glyptostroboidesand it is also an essential reference for studying the survival of M glyptostroboides after the Quaternaryglaciar A visual map was provided to help determine the location of refugia that may already existbut have not yet been discovered
Our results showed that glaciation may play an important role in reducing genetic diversity giventhat the distributions of M glyptostroboides were significantly decreased during glaciation We havedetermined that most of the glacial refugia are located in temperate regions with latitudes ranging from20 N to 60 N in the Northern Hemisphere where the climate is very suitable for M glyptostroboides(the temperature and precipitation are almost the same as those in the LGM) Combined with theimportant research hotspot in temperate biodiversity [65] the results are deemed to be understandableOn the other hand we tried to find real evidence that glacial refugia can exist in the mountainsDuring the last glacial period temperate forests generated by sea level decline existed in the junctionbetween eastern China southern Japan and the Korean Peninsula [66] which were conducive to thereproduction and survival of M glyptostroboides at that time After entering the interglacial periodthese areas were gradually isolated and turned into mountains as temperatures rose glaciers meltedand sea levels rose Therefore it is not surprising that the glacial refugia of M glyptostroboides mayexist in some high-altitude mountains
In the past few decades by using a species distribution model and systematic geographicalsurveys some speculations about the location of glacial refugia have been confirmed such as inNorthern Europe [67] the mountains of Southern Europe (ie the Alps Balkans Pyrenees andApennines) [68] and Southeast Asia [69] Phylogenetic analysis has also been used to support suchhypotheses that some refugia were located in the Arctic or beyond during Pleistocene glaciation [70]Previous studies have also shown in detail that the mountains of East Asia not only served as dispersalcorridors but also provided the refugia for some species during dramatic global climate change [71]Three peninsulas (the Iberian Italian and the Balkan Peninsulas) of Europe are also traditionallyconsidered to be glacial refugia Although these places have been isolated for a long time they canshow the minimum systematic geographic structure to support plant growth [72] Our results do notcontradict previous studies and can provide theoretical support for in-depth studies related to glacialrefugia of relict plants
Analyzing the applicability changes in future climate scenarios for glacial refugia will help us toprotect the habitats of M glyptostroboides in the next step The predictions for the refugia will be betterin the future which gives us confidence in restoring M glyptostroboides In future research paleoclimatedata should be supplemented by the developing digital methods based on modern geography toovercome the error of inferring paleoclimate Moreover the delimitation of putative refugia requiresthe use of paleo-data and genetics in the further integration of climate models and biogeographywhich encourages us to make progress in strengthening the collaboration between phytogeographyand paleobiology
43 Non-pessimistic Predictions of M glyptostroboides under Climate Change Help Us Do More
M glyptostroboides is not widely distributed at present and their suitable habitats will decreasepartly under global warming However the good news is that the degradation of the habitats ofM glyptostroboides is not serious We can see that most of the areas where the suitability would changeare marginally suitable areas while the moderately and highly suitable areas are basically unchangedand even increase (Figure 5) Moreover the suitability of more habitats than expected will increaseto varying degrees in future climate scenarios (Table 2) In the coming decades large-scale globalwarming will dramatically influence the growth and the interaction of vegetation Simultaneouslywith the long-term and short-term changes of temperature species will change in terms of populationdensity phenology morphology and genetic frequency so the distribution of species will also changeAlthough rising temperatures have traditionally negative effects on ecosystems such as increasedpopulation disease and the extinction of endangered species climate change can also encourage
Forests 2020 11 62 14 of 19
resilient species to adapt and thrive [73] M glyptostroboides has a strong ability to adapt to climatechange and will grow well in the climate conditions where temperature is relatively high but does notrise immoderately This novel discovery at least suggests to us that M glyptostroboides is almost nolonger extinct or has been resurrected fully
We reviewed the relevant bioclimatic variables and distributions of M glyptostroboides underclimate change which will help to clarify the specific effects of climate change on the species and toestablish cost-effective strategies for conservation As shown in our results the temperature factorshave a greater impact on M glyptostroboides than the precipitations factors which means that wehave a direct motivation to explore the response mechanism between M glyptostroboides and globaltemperature changes By comparing the growth of M glyptostroboides in different botanical gardenssome scholars also found that warm temperatures and temperature changes are necessary for theoptimal growth of M glyptostroboides [74] By studying the general temperature-related physiologicaltraits of species species range was detected to be strongly dependent on temperature [75] Thereforeit is acceptable to attribute predicted changes in the future distribution of plants to climate changeespecially temperature changes Prospective work could assess the trade-offs shown here between thegrowth of M glyptostroboides and climate change to obtain an understanding of the ecosystem servicesof M glyptostroboides and even the contribution of nature to humanity
Although these predictions indicated that the suitable habitats of M glyptostroboides will expandand the suitability will increase the stability and sustainability of its habitat cannot be maintainedwithout prescient conservation Currently M glyptostroboides has been widely grown in many countriesbut the actual benefits of these suitable habitats are not ideal due to ecological destruction and urbandevelopment [76] The native habitat of M glyptostroboides is mostly disturbed by climate change andhuman factors and the frequency of M glyptostroboides is decreasing in all directions from the centerto the outside This species is very sensitive to climate meaning it is an indicator of climate changeBased on this management actions for species conservation can be integrated such as expanding theprotected areas maintaining or improving landscape connectivity protecting the primary mother treesand genetic genes and improving the microclimate by planting trees
Conservation of species is not carried out evenly around the globe but protected areas needto be identified Therefore we strongly recommend international research cooperation to protectM glyptostroboides on a global scale The establishment of the Dinghu Mountain Nature Reserve andthe Xingdou Mountain Nature Reserve in China for example is making great contributions to theprotection of M glyptostroboides However existing nature reserves are in urgent need of improvementdue to a lack of area and connectivity It may be also feasible to combine the protected areas of Mglyptostroboides with nature reserves which can protect the original parent tree and its habitats We hopethat identifying the protected areas in this study can also inspire the protection of M glyptostroboidesThe lsquopriority protected areasrsquo that we have identified require further research in particular becauseof their vulnerability to the threat of climate change Focusing on lsquokey protected areasrsquo will facilitatethe growth of species in future climatic conditions which is considered to be the most cost-effectiveconservation strategy Moreover we can also consider other important impact metrics (eg abundancerange size and species richness) to support conservation actions In fact the prediction of protectedareas for relict plants is still in its infancy and we hope that our studies will help researchers betterassess these impacts thereby making decisions to protect species and provide ecological services
5 Conclusions
Based on the RF model the potential distributions of M glyptostroboides under multiple (the currentone the past three and the next four) climate scenarios were predicted in this study The key bioclimaticfactors affecting the distribution of M glyptostroboides are BIO1 BIO2 BIO9 BIO6 and BIO18 amongwhich the importance of temperature factors is greater than precipitation factors The relatively suitablehabitats of M glyptostroboides currently mainly distributed in East Asia and Western Europe and itstotal area is approximately 6857 times 106 km2 Under past scenarios the potential distributions of M
Forests 2020 11 62 15 of 19
glyptostroboides were not similar against time We not only speculated the detailed locations of therefugia of M glyptostroboides but also predicted that glacial refugia are not pessimistic under climatechange Under future climate scenarios the potential distributions of M glyptostroboides have anoptimistic trend in the context of global warming Under the mild and higher emission scenarios thetotal suitable habitat area in the 2070s would be more widespread than at present and the level ofthe suitability of M glyptostroboides will also show an obvious upward trend For further long-termmanagement and protected planning the location of its priority protected areas and key protected areaswere identified These results can support the ongoing research on the interaction between climatechange and M glyptostroboides on a large space-time scale We hope that our research will stimulategreater interest among policymakers towards protecting M glyptostroboides and similar relict species
Author Contributions XZ (Xiaoyan Zhang) and WG designed and coordinated the research project analyzedthe results and wrote the paper WG and HW conducted formatting and was the advisor and text editor HWand XZ (Xuhui Zhang) participated in designing the models analyzed the data JL and QZ gave commentsand improved the final manuscript All authors have read and agreed to the published version of the manuscript
Funding This research is supported by the National Natural Science Foundation of China (No 31070293) andthe Research and Development Program of Science and Technology of Shaanxi Province (No 2014K14-01-02)
Acknowledgments We are grateful to each of the resource sharing platforms such as GBIF ALA CVH WorldClimand so on which provide us with sampling data and climate data to be used in species distribution model Alsowe appreciate Yunfei Gu a doctoral student at the University of Southampton for assisting us in revising the paper
Conflicts of Interest The authors declare no conflict of interest
References
1 Cammell ME Knight JD Effects of climatic change on the population dynamics of crop pests Adv EcolRes 1992 22 117ndash162
2 Rehnus M Bollmann K Schmatz DR Hacklaumlnder K Braunisch V Alpine glacial relict species losingout to climate change The case of the fragmented mountain hare population (Lepus timidus) in the AlpsGlob Chang Biol 2018 24 3236ndash3253 [CrossRef] [PubMed]
3 Vanderwal J Murphy HT Kutt AS Perkins GC Bateman BL Perry JJ Reside AE Focus onpoleward shifts in speciesrsquo distribution underestimates the fingerprint of climate change Nat Clim Chang2013 3 239ndash243 [CrossRef]
4 Allen SK Plattner GK Nauels A Xia Y Stocker TF Climate change 2013 The physical science basisAn overview of the working group 1 contribution to the fifth assessment report of the IntergovernmentalPanel on Climate Change (IPCC) Comp Geom 2007 18 95ndash123
5 Yun JH Nakao K Tsuyama I Matsui T Park CH Lee BY Tanake N Vulnerability of subalpinefir species to climate change Using species distribution modeling to assess the future efficiency of currentprotected areas in the Korean Peninsula Ecol Res 2018 33 341ndash350 [CrossRef]
6 Booth TH Nix HA Busby JR Hutchinson MF Bioclim The first species distribution modellingpackage its early applications and relevance to most current maxent studies Divers Distrib 2014 20 1ndash9[CrossRef]
7 Austin M Species distribution models and ecological theory A critical assessment and some possible newapproaches Ecol Model 2017 200 1ndash19 [CrossRef]
8 Oppel S Meirinho A Ramirez I Gardner B OrsquoConnell AF Miller PI Louzao M Comparison of fivemodelling techniques to predict the spatial distribution and abundance of seabirds Biol Conserv 2012 15694ndash104 [CrossRef]
9 Lentini PE Wintle BA Spatial conservation priorities are highly sensitive to choice of biodiversitysurrogates and species distribution model type Ecography 2015 38 1101ndash1111 [CrossRef]
10 Chapman DS Scalone R Štefanic E Bullock JM Mechanistic species distribution modeling reveals aniche shift during invasion Ecology 2017 98 1671ndash1680 [CrossRef]
11 Moore JK Fu W Primeau F Britten GL Lindsay K Long M Doney SC Mahowald N Hoffman FRanderson JT Sustained climate warming drives declining marine biological productivity Science 2018 3591139ndash1143 [CrossRef] [PubMed]
Forests 2020 11 62 16 of 19
12 Wang HH Koralewski TE Mcgrew EK Grant WE Byram TD Species distribution model formanagement of an invasive vine in forestlands of eastern Texas Forests 2015 6 4374ndash4390 [CrossRef]
13 Podani J Oacutedor P Fattorini S Strona G Heino J Schmera D Exploring multiple presence-absence datastructures in ecology Ecol Model 2018 383 41ndash51 [CrossRef]
14 Chunrong M Falk H Yumin G Xuesong H Lijia W Why choose Random Forest to predict rare speciesdistribution with few samples in large undersampled areas Three Asian crane species models providesupporting evidence PeerJ 2017 5 e2849
15 Piras P Sheridan R Sherer EC Schafer W Welch CJ Roussel C Modeling and predicting chiralstationary phase enantioselectivity An efficient random forest classifier using an optimally balanced trainingdataset and an aggregation strategy J Sep Sci 2018 41 1365ndash1375 [CrossRef]
16 Dersquoath G Fabricius KE Classification and regression trees A powerful yet simple technique for ecologicaldata analysis Ecology 2000 81 3178ndash3192 [CrossRef]
17 Breiman L Random forests Mach Learn 2001 45 5ndash32 [CrossRef]18 Peters J Baets BD Verhoest NEC Samson R Degroeve S Becker PD Huybrechts W Random
forests as a tool for ecohydrological distribution modelling Ecol Model 2007 207 304ndash318 [CrossRef]19 Bradter U Kunin W Altringham JD Thom TJ Benton TG Identifying appropriate spatial scales of
predictors in species distribution models with the random forest algorithm Methods Ecol Evol 2013 4167ndash174 [CrossRef]
20 Ma J Shao G Rediscovery of the first collection of the lsquoliving fossilrsquo Metasequoia glyptostroboides Taxon2003 52 585ndash588 [CrossRef]
21 Farjon A Metasequoia Glyptostroboides The IUCN Red List of Threatened Species IUCN GlandSwitzerland 2013
22 Equiza MA Day ME Jagels R Physiological responses of three deciduous conifers (Metasequoiaglyptostroboides Taxodium distichum and Larix laricina) to continuous light Adaptive implications for the earlyTertiary polar summer Tree Physiol 2006 26 353ndash364 [CrossRef] [PubMed]
23 Charles Nelson E Metasequoia glyptostroboides the dawn redwood Some Irish glosses on its discovery andintroduction into cultivation Curtisrsquos Bot Mag 2010 15 77ndash80 [CrossRef]
24 Bajpai VK Kang SC Antifungal activity of leaf essential oil and extracts of Metasequoia glyptostroboidesMiki ex Hu J Am Oil Chem Soc 2010 87 327ndash336 [CrossRef]
25 Bajpai VK Rahman A Choi UK Youn SJ Kang SC Inhibitory parameters of the essential oil andvarious extracts of Metasequoia glyptostroboides Miki ex Hu to reduce food spoilage and food-borne pathogensFood Chem 2007 105 1061ndash1066 [CrossRef]
26 Li YY Chen XY Zhang X Wu TY Lu HP Cai YW Genetic differences between wild and artificialpopulations of Metasequoia glyptostroboides Implications for species recovery Conserv Biol 2010 19 224ndash231[CrossRef]
27 Zhang H Guo W Yu M Wang GG Wu T Latitudinal patterns of leaf N P stoichiometry and nutrientresorption of Metasequoia glyptostroboides along the eastern coastline of China Sci Total Environ 2018 6181ndash6 [CrossRef]
28 Payton G Conserving the dawn redwood The ex situ collection at the dawes arboretum Arnoldia 2010 6826ndash33
29 Tang CQ Yang YC Ohsawa M Momohara A Hara M Cheng SL Fan SH Population structure ofrelict Metasequoia glyptostroboides and its habitat fragmentation and degradation in south-central China BiolConserv 2011 144 279ndash289 [CrossRef]
30 Poncet V Munoz F Munzinger J Pillon Y Gomez C Couderc M Tranchant-Dubreuil C Hamon SDe Kochko A Phylogeography and niche modelling of the relict plant Amborella trichopoda (Amborellaceae)reveal multiple Pleistocene refugia in New Caledonia Mol Ecol 2013 22 6163ndash6178 [CrossRef]
31 Wang X Ma L Guo B Fan S Tan J Analysis of the change in the original Metasequoia glyptostroboidespopulation and its environment in Lichuan Hubei from 1948 to 2003 Acta Ecol Sin 2006 1 285ndash291[CrossRef]
32 Puckett EE Etter PD Johnson EA Eggert LS Phylogeographic analyses of American black bears(Ursus americanus) suggest four glacial refugia and complex patterns of post-glacial admixture Mol BiolEvol 2015 32 2338ndash2350 [CrossRef] [PubMed]
Forests 2020 11 62 17 of 19
33 Tremblay NO Schoen DJ Molecular phylogeography of Dryas integrifolia Glacial refugia and postglacialrecolonization Mol Ecol 1999 8 1187ndash1198 [CrossRef] [PubMed]
34 Gavin DG Fitzpatrick MC Gugger PF Heath KD Rodriacuteguez-Saacutenchez F Dobrowski SZ Hampe AHu FS Ashcroft MB Bartlein PJ et al Climate refugia Joint inference from fossil records speciesdistribution models and phylogeography New Phytol 2014 204 37ndash54 [CrossRef] [PubMed]
35 Stewart JR Stringer CB Human evolution out of Africa The role of refugia and climate change Science2012 335 1317ndash1321 [CrossRef] [PubMed]
36 Jeffers ES Whitehouse NJ Lister A Plunkett G Barratt P Smyth E Lamb P Dee MW Brooks SJWillis KJ et al Plant controls on late quaternary whole ecosystem structure and function Ecol Lett 201821 814ndash825 [CrossRef]
37 Francisco JV Chris DP Joachim WK Phylogeography of a Tertiary relict plant Meconopsis cambrica(papaveraceae) implies the existence of northern refugia for a temperate herb Mol Ecol 2012 21 1423ndash1437
38 Millar CI Charlet DA Westfall RD King JC Delany DL Flint AL Flint LE Do low-elevationravines provide climate refugia for subalpine limber pine (Pinus flexilis) in the great basin USA Can J ForRes 2018 48 663ndash671 [CrossRef]
39 Bucklin DN Basille M Benscoter AM Brandt LA Mazzotti FJ Romantildeach SS Speroterra CWatling JI Comparing species distribution models constructed with different subsets of environmentalpredictors Divers Distrib 2015 21 23ndash35 [CrossRef]
40 Wang YS Xie BY Wang FH Xiao QM Dai LY Application of ROC curve analysis in evaluating theperformance of alien speciesrsquo potential distribution models Biodivers Sci 2007 15 365ndash372
41 Allouche O Tsoar A Kadmon R Assessing the accuracy of species distribution models Prevalence kappaand the true skill statistic (TSS) J Appl Ecol 2010 43 1223ndash1232 [CrossRef]
42 Mouton AM Baets BD Goethals PLM Ecological relevance of performance criteria for speciesdistribution models Ecol Model 2010 221 1995ndash2002 [CrossRef]
43 Lu CY Gu W Dai AH Wei HY Assessing habitat suitability based on geographic information system(GIS) and fuzzy A case study of Schisandra sphenanthera Rehd et Wils in Qinling Mountains China EcolModel 2012 242 105ndash115 [CrossRef]
44 Xue SF Sun T Zhang HY Shao DD Suitable habitat mapping in the Yangtze River Estuary influencedby land reclamations Ecol Eng 2016 97 64ndash73 [CrossRef]
45 Guo YL Li X Zhao Z Wei H Gao B Wei G Prediction of the potential geographic distribution of theectomycorrhizal mushroom Tricholoma matsutake under multiple climate change scenarios Sci Rep 2017 7[CrossRef] [PubMed]
46 Zhang QZ Wei HY Zhao ZF Liu J Ran Q Yu JH Gu W Optimization of the fuzzy matter elementmethod for predicting species suitability distribution based on environmental data Sustainability 2018 103444 [CrossRef]
47 Guo YL Wei HY Lu CY Gao B Gu W Predictions of potential geographical distribution and qualityof Schisandra sphenanthera under climate change PeerJ 2016 4 e2554 [CrossRef]
48 Chou YW Thomas PI Ge XJ Lepage BA Wang CN Refugia and phylogeography of Taiwania inEast Asia J Biogeogr 2011 38 1992ndash2005 [CrossRef]
49 Stolldorf T Schenke HW Anderson JB LGM ice sheet extent in the Weddell Sea Evidence for diachronousbehavior of Antarctic Ice Sheets Quat Sci Rev 2012 48 20ndash31 [CrossRef]
50 Gogol-prokurat M Predicting habitat suitability for rare plants at local spatial scales using a speciesdistribution model Ecol Appl 2011 21 33ndash47 [CrossRef]
51 Shitara T Nakamura Y Matsui T Tsuyama I Ohashi H Kamijo T Formation of disjunct plantdistributions in northeast asia A case study of Betula davurica using a species distribution model Plant Ecol2018 219 1105ndash1115 [CrossRef]
52 Susset EC Magro A Hemptinne J Using species distribution models to locate animal aggregations Acase study with Hippodamia undecimnotata (Schneider) overwintering aggregation sites Ecol Entomol 201742 345ndash354 [CrossRef]
53 Rogan J Franklin J Stow D Miller J Woodcock C Roberts D Mapping land-cover modificationsover large areas A comparison of machine learning algorithms Rem Sens Environ 2008 112 2272ndash2283[CrossRef]
Forests 2020 11 62 18 of 19
54 Breiman L Statistical modeling The two cultures (with comments and a rejoinder by the author) Stat Sci2001 16 199ndash215 [CrossRef]
55 Watling JI Brandt LA Bucklin DN Fujisaki I Mazzotti FJ Romantildeach SS Speroterra C Performancemetrics and variance partitioning reveal sources of uncertainty in species distribution models Ecol Model2015 309minus310 48ndash59 [CrossRef]
56 Liu J Yang Y Wei HY Zhang QZ Zhang XH Zhang XY Gu W Assessing habitat suitability ofparasitic plant Cistanche deserticola in northwest China under future climate scenarios Forests 2019 10 823[CrossRef]
57 Soberon J Townsend Peterson A Interpretation of models of fundamental ecological niches and speciesrsquodistributional areas Biodivers Inform 2005 2 1ndash10 [CrossRef]
58 Pliscoff P Luebert F Hilger HH Guisan A Effects of alternative sets of climatic predictors on speciesdistribution models and associated estimates of extinction risk A test with plants in an arid environmentEcol Model 2014 288 166ndash177 [CrossRef]
59 Dyderski MK Paz S Frelich LE Jagodzimski AM How much does climate change threaten Europeanforest tree species distributions Glob Chang Biol 2018 24 1150ndash1163 [CrossRef]
60 Guo YL Li X Zhao ZF Predicting the impacts of climate change soils and vegetation types on thegeographic distribution of Polyporus umbellatus in China Sci Total Environ 2019 648 1ndash11 [CrossRef]
61 Hamilton CM Bateman BL Gorzo JM Reid B Thogmartin WE Peery MZ Heglund PJRadeloff VC Pidgeon AM Slow and steady wins the race Future climate and land use change leaves theimperiled Blandingrsquos turtle (Emydoidea blandingii) behind Biol Conserv 2018 222 75ndash85 [CrossRef]
62 Li G Xu G Guo K Du S Geographical boundary and climatic analysis of pinus tabulaeformis in ChinaInsights on its afforestation Ecol Eng 2016 86 75ndash84 [CrossRef]
63 Donaldson JS Botanic gardens science for conservation and global change Trends Plant Sci 2009 14608ndash613 [CrossRef] [PubMed]
64 Hannah L Flint L Syphard AD Moritz MA Buckley LB Mccullough IM Fine-grain modeling ofspeciesrsquo response to climate change Holdouts stepping-stones and microrefugia Trends Ecol Evol 2014 29390ndash397 [CrossRef] [PubMed]
65 Zeng YF Wang WT Liao WJ Wang HF Zhang DY Multiple glacial refugia for cool-temperatedeciduous trees in northern East Asia The Mongolian oak as a case study Mol Ecol 2016 24 5676ndash5691[CrossRef]
66 Harrison SP Yu G Takahara H Prentice IC Palaeovegetation - diversity of temperate plants in EastAsia Nature 2001 413 129ndash130 [CrossRef]
67 Bennett KD Tzedakis PC Willis KJ Quaternary refugia of north European trees J Biogeogr 1991 18103ndash115 [CrossRef]
68 Martinet B Lecocq T Brasero N Biella P Urbanovaacute K Valterovaacute I Cornalba M Gjershaug JMichez D Rasmont P Following the cold Geographical differentiation between interglacial refugia andspeciation in the arcto-alpine species complex Bombus monticola (Hymenoptera Apidae) Syst Entomol 201843 200ndash217 [CrossRef]
69 Gathorne-Hardy FJ Syaukani RG Davies PE Jones DT Quaternary rainforest refugia in south-eastAsia Using termites (Isoptera) as indicators Biol J Linn Soc 2015 75 453ndash466 [CrossRef]
70 Tian S Kou YX Zhang ZR Yuan L Li D Loacutepez-Pujol J Fan D Zhang ZY Phylogeography ofEomecon chionantha in subtropical China The dual roles of the Nanling Mountains as a glacial refugium anda dispersal corridor BMC Evol Biol 2018 18 20 [CrossRef]
71 Fedorov VB Stenseth NC Multiple glacial refugia in the North American Arctic Inference fromphylogeography of the collared lemming (Dicrostonyx groenlandicus) Proc Biol Sci 2002 269 2071ndash2077[CrossRef]
72 Fernaacutendez-Palacios JM Nascimento LD Ruumldiger O Delgado JD Garciacutea-del-Rey E Areacutevalo JRWhittaker RJ A reconstruction of Palaeo-Macaronesia with particular reference to the long-termbiogeography of the Atlantic island laurel forests J Biogeogr 2011 38 226ndash246 [CrossRef]
73 Michael DM Humphrey QPC Simon JD Nicholas AM Resilience to climate change Translatingprinciples into practice J Appl Ecol 2012 49 547ndash551
Forests 2020 11 62 19 of 19
74 Ihlow F Dambach J Engler JO Flecks M Hartmann T Nekum S Rajaei H Roumldder D On the brinkof extinction How climate change may affect global chelonian species richness and distribution GlobChang Biol 2012 18 1520ndash1530 [CrossRef]
75 He D Lu ZL Li DZ Differentiation characteristics of a 50-year-established Metasequoia glyptostroboidesplantation J Trop Subtrop Bot 2009 33 69ndash73
76 Ma JS A worldwide survey of cultivated Metasequoia glyptostroboides hu amp cheng (Taxodiaceae Cupressaceae)from 1947 to 2007 Bull Peabody Mus Nat Hist 2016 48 235ndash253
copy 2020 by the authors Licensee MDPI Basel Switzerland This article is an open accessarticle distributed under the terms and conditions of the Creative Commons Attribution(CC BY) license (httpcreativecommonsorglicensesby40)
- Introduction
- Materials and Methods
-
- Species Records
- Bioclimatic Variables
- RF Model Building and Validation
- Data Analyses of Key Bioclimatic Variables and Habitat Suitability
- Identification of Glacial Refugia and Protected Areas
-
- Results
-
- Model Reliability and Key Bioclimatic Variables
- Potential Distribution of M glyptostroboides from the Past to the Future
-
- Potential Distribution of M glyptostroboides in the Current Climate Scenario
- Potential Distribution of M glyptostroboides in the Past
- Potential Distribution of M glyptostroboides in the Future
-
- The Change in the Habitat Suitability of M glyptostroboides
- Speculation on Glacial Refugia
- Identification of Priority Protected Areas and Key Protected Areas
-
- Discussion
-
- The Rationality of the Model and the Limitations of the Prediction
- The Significance of the Glacial Refugia Hypothesis
- Non-pessimistic Predictions of M glyptostroboides under Climate Change Help Us Do More
-
- Conclusions
- References
-
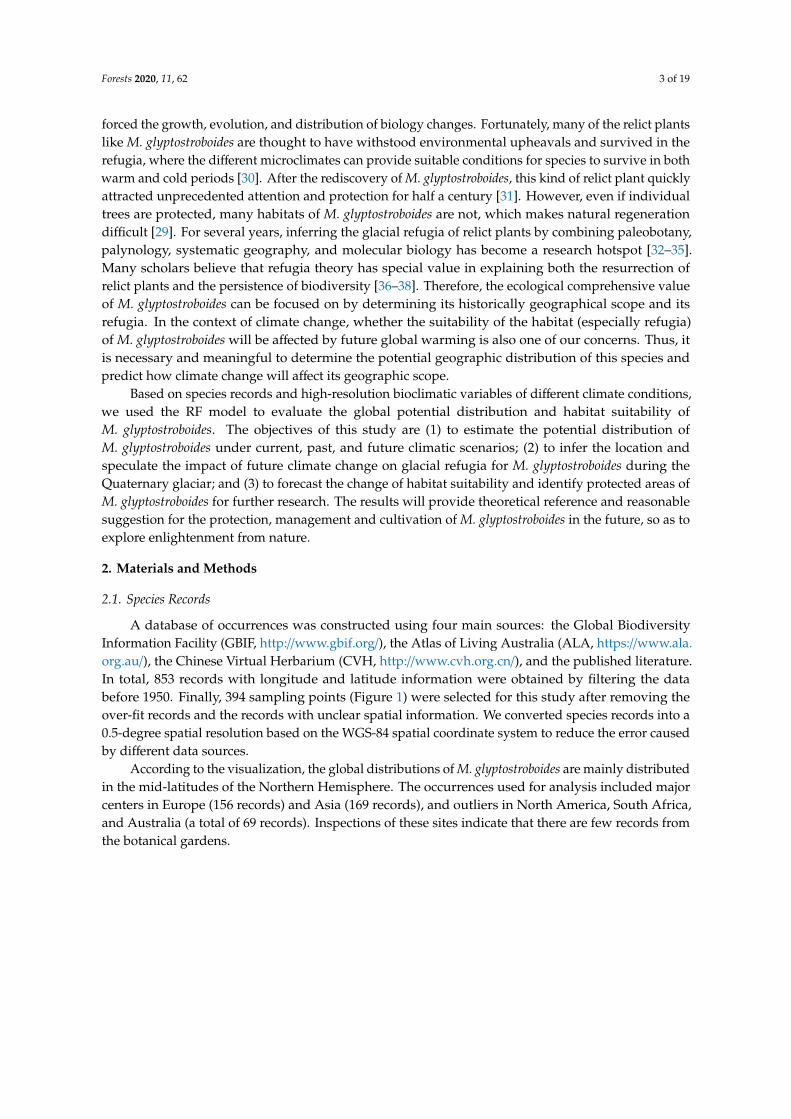
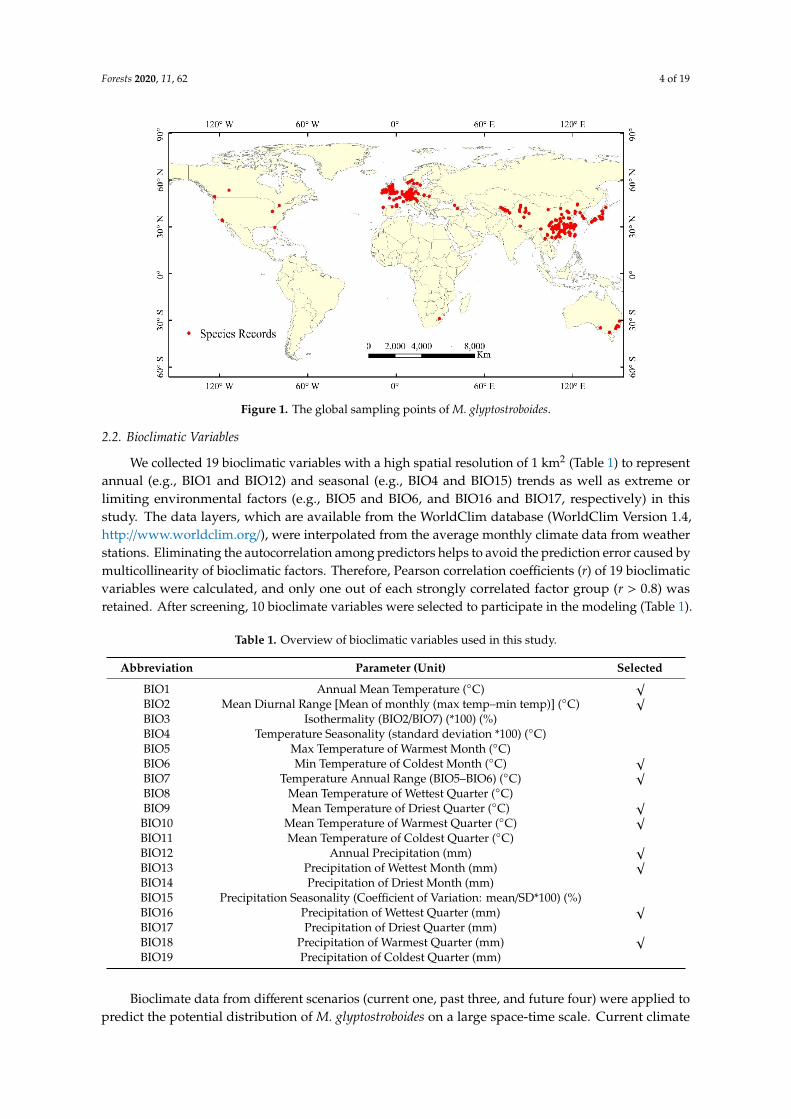
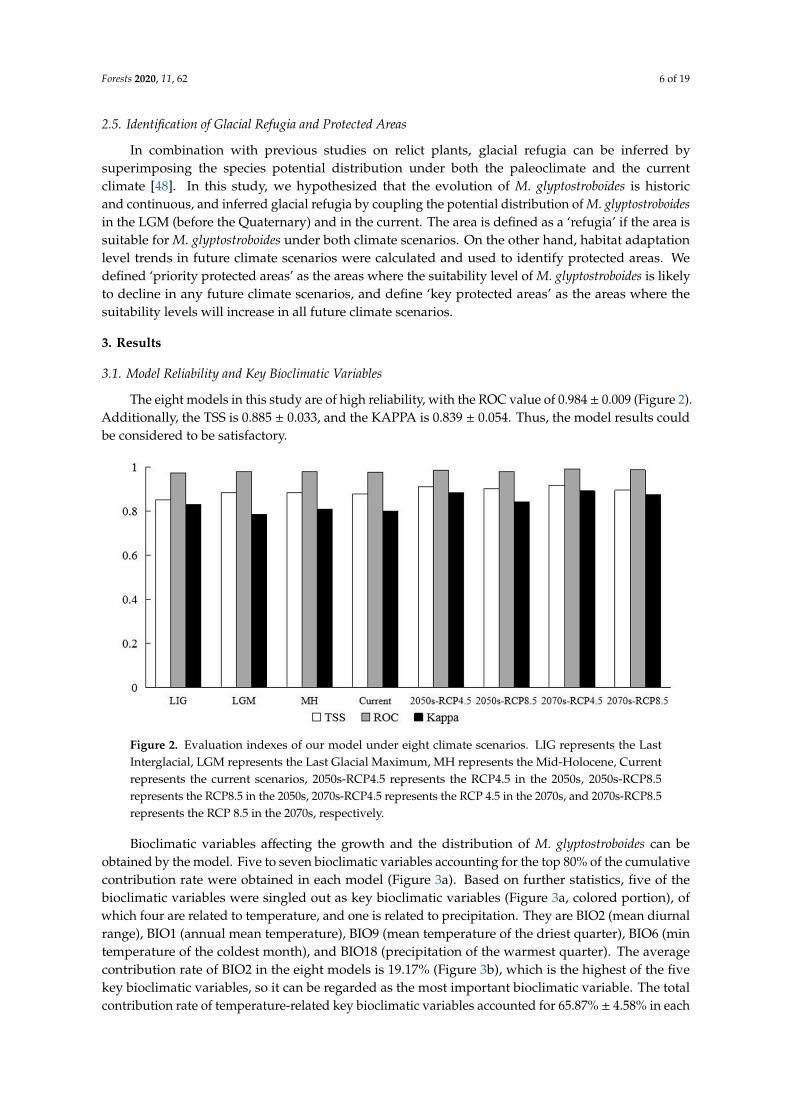
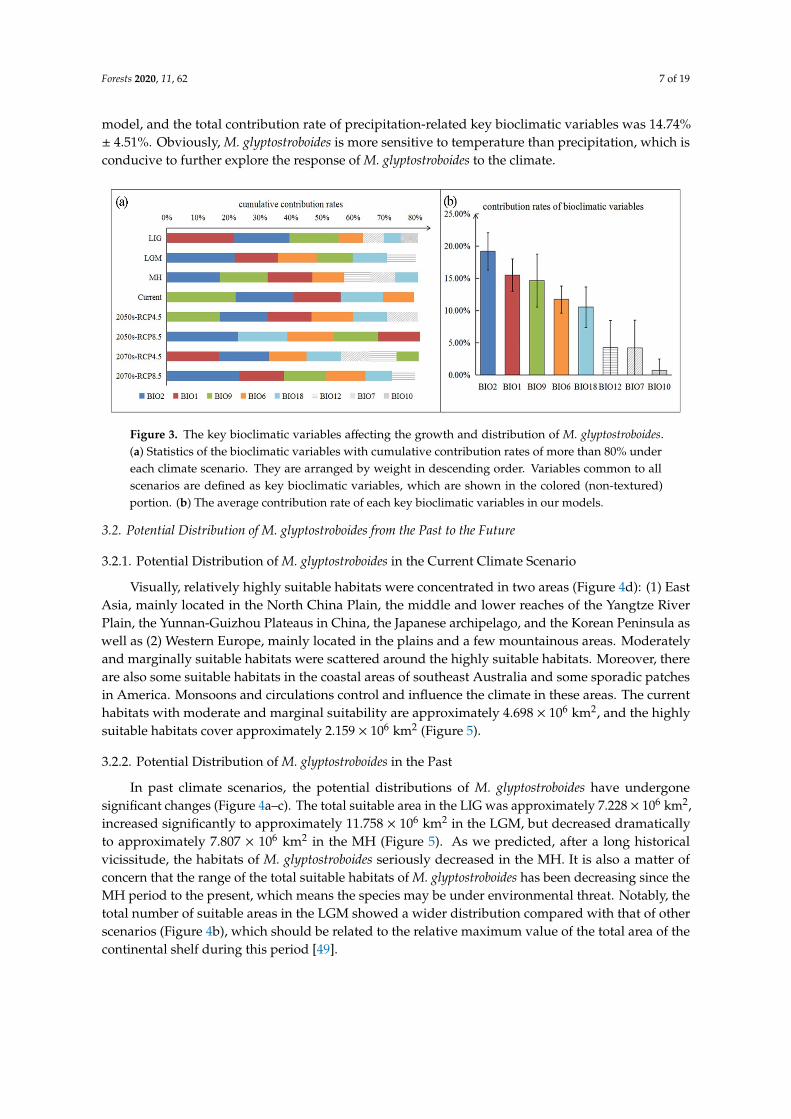
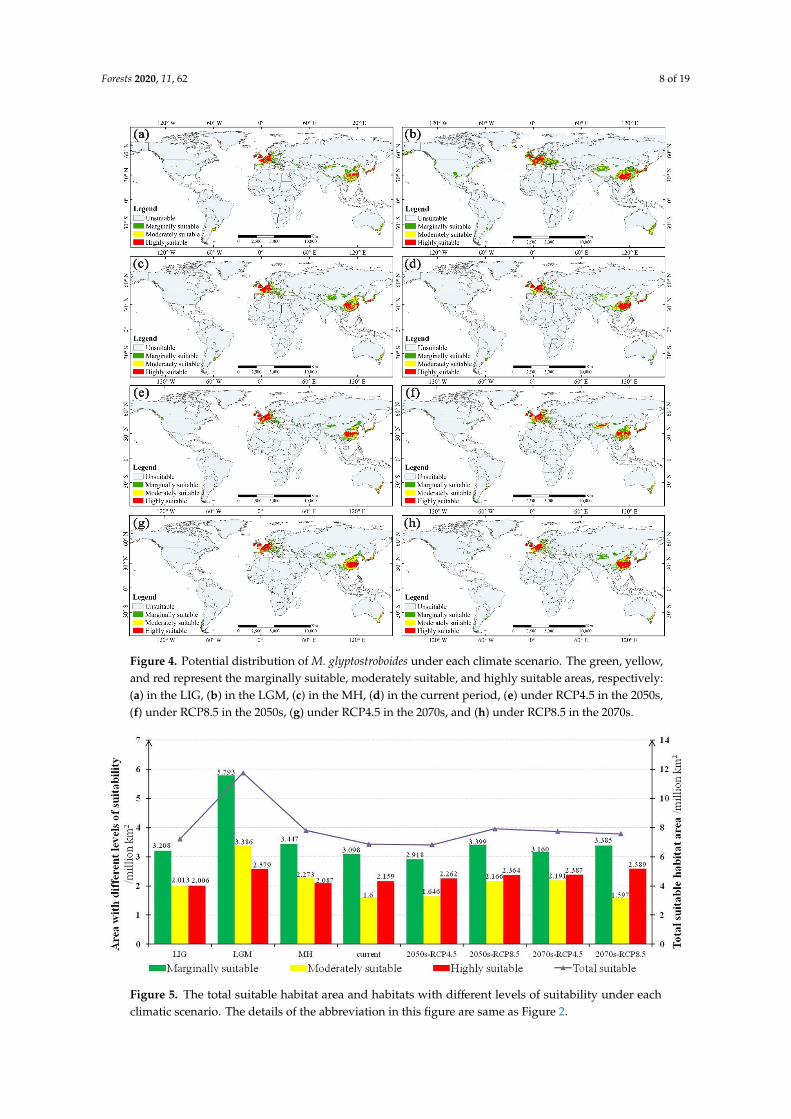
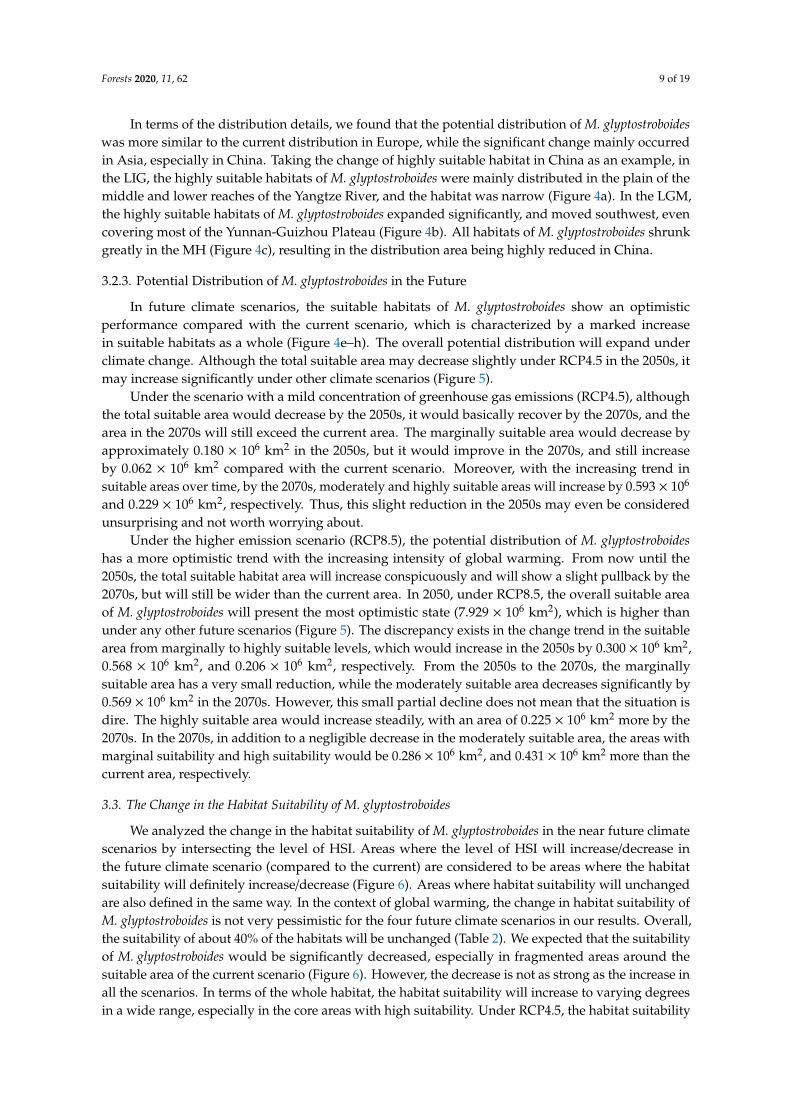
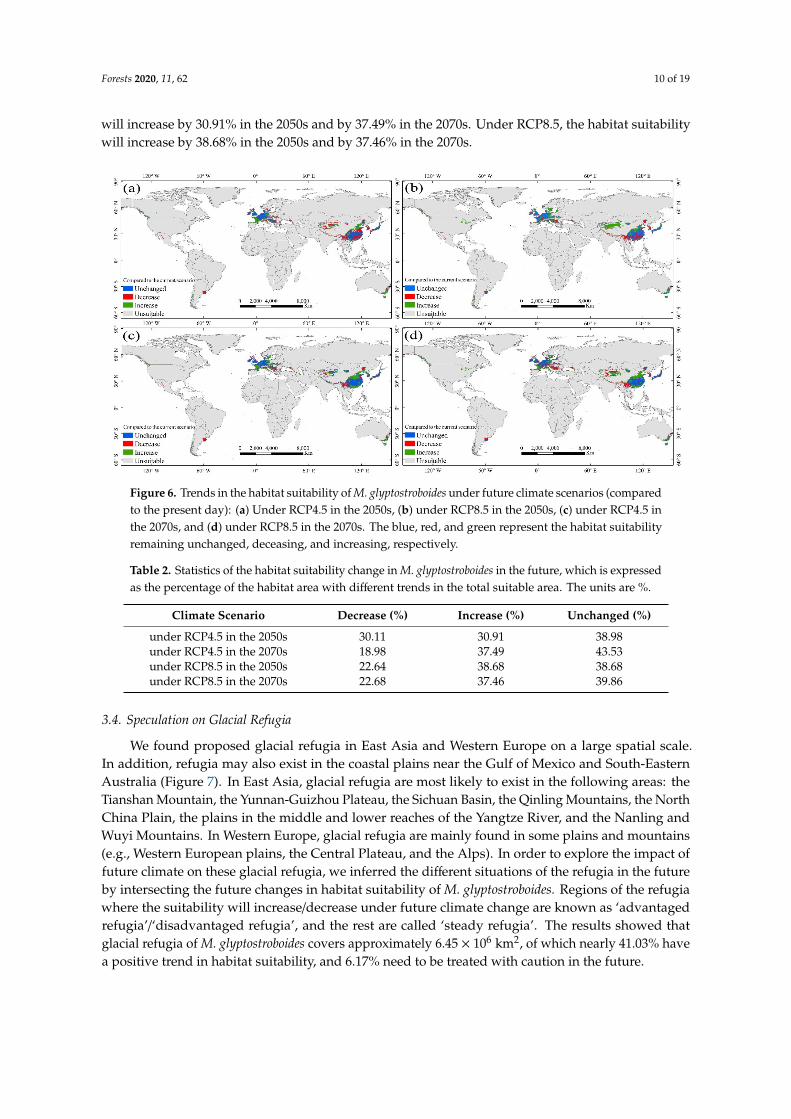
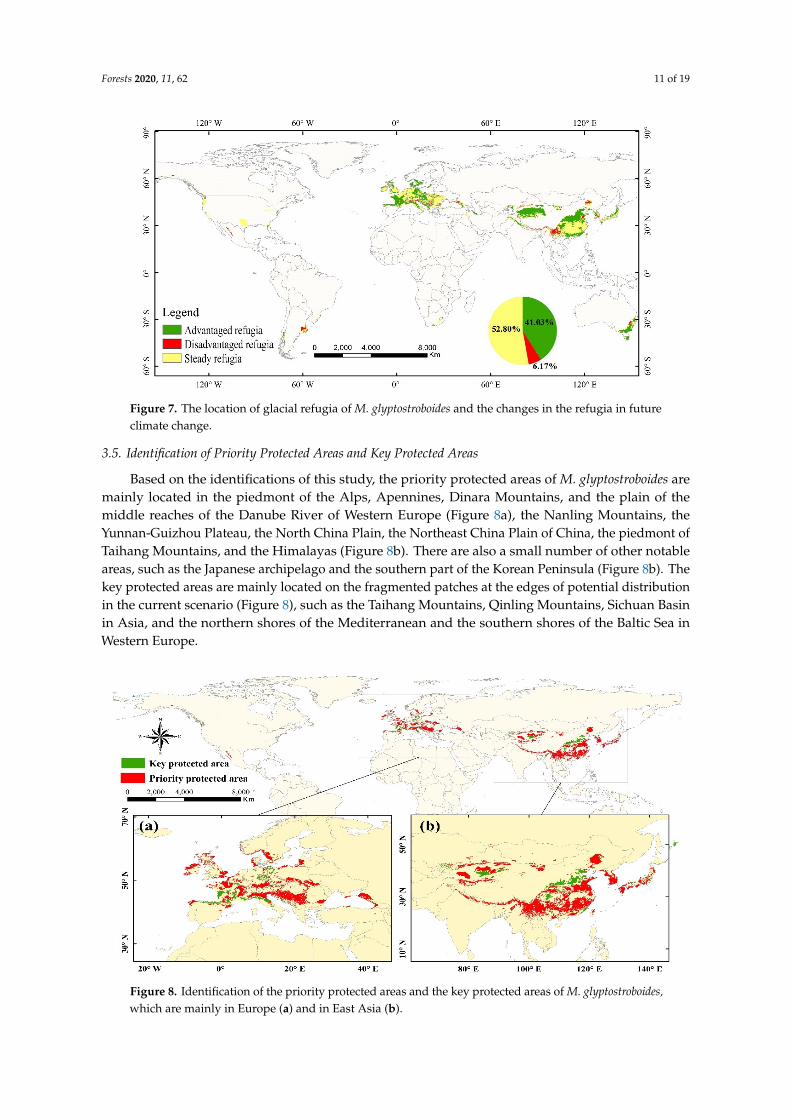
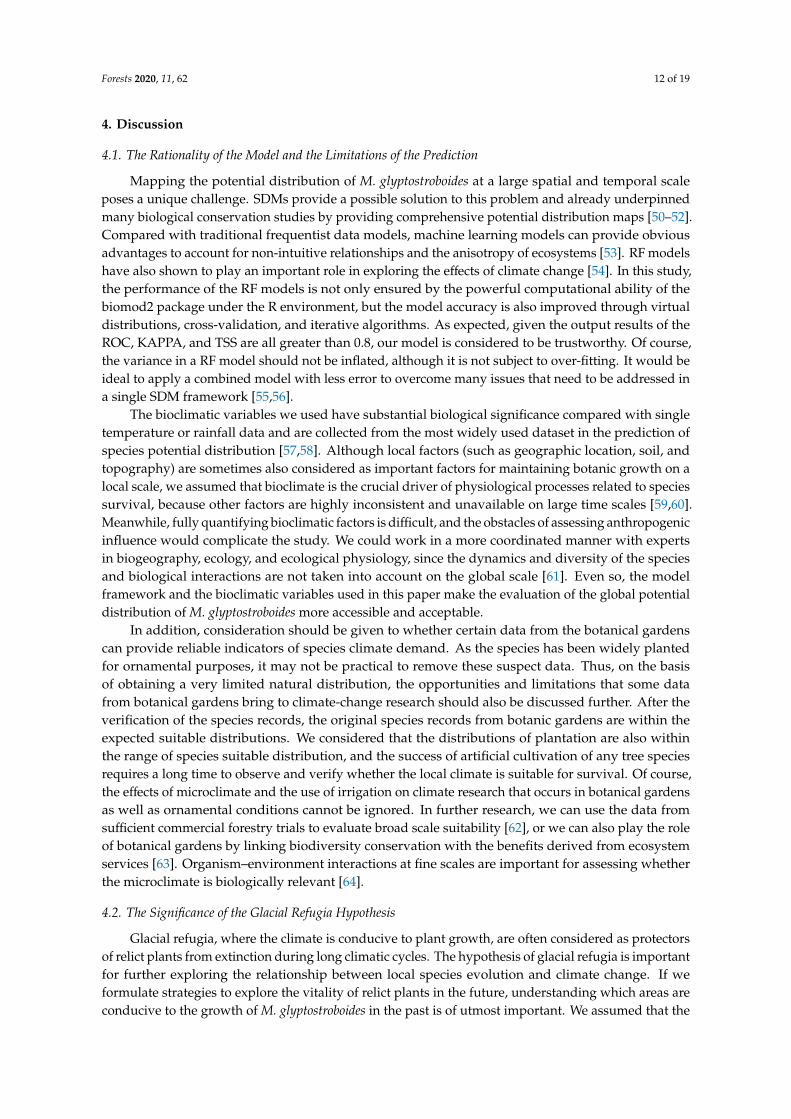